THE IMPACT OF MACROECONOMIC INDICATORS TO STOCK MARKET ...e-journal.uajy.ac.id/10431/1/JURNAL...
15
1 THE IMPACT OF MACROECONOMIC INDICATORS TO STOCK MARKET PERFORMANCE. THE CASE OF INDONESIA AND MALAYSIA STOCK MARKET Marceline Adella Violeta 121219718 International Business Management Program, Economy Faculty Universitas Atma Jaya Yogyakarta Abstract The purpose of this researh is to examine the impact of macroeconomic indicators to stock market performance in case of Indonesia and Malaysia period of January 2006 to December 2015. Macroeconomic indicators that used are gross domestic product growth rate, inflation rate, and interest rate. The proxies of stock market performance are stock market liquidity, market capitalization, and stock market return. Indonesia stock market represented by JKSE and Malaysia represented by KLSE. This research employs Multiple Regression analysis by using backward elimination method. By using classical assumption for least squre, all the data are free from heteroscedasticity, autocorrelation, and multicollinearity. Regression result showed that Gross domestic product growth rate have no impact to all proxy of stock market performance. Inflation rate have negative impact to several proxies of stock market performance, which are market capitalization and market return in Indonesia and market capitalization in Malaysia. While interest rate have no impact to all proxy of stock market performance. Keywords: Macroeconomic indicators, Stock market performance, Multiple regression, Backward elimination. 1. Introduction 1.1 Background of the study Many studies about relation between macroeconomic indicators and the stock market performance have been done found that macroeconomic and fiscal environment is one of the building blocks which determine the success or otherwise of securities market (Paddy, 1992). Coleman and Tetey (2008) examined the effect of macroeconomic variables on Ghana Stock Exchange. Their results suggested that macroeconomic indicators should be considered for investors in developing economies. But there is still limited research on how macroeconomic indicators affectting stock market in developing economies especially emerging markets. This motivates researcher to examine the degree to which those conclusion is applicable to Indonesia and Malaysia as emerging markets. As quoted from next.ft website, as an emerging market, Indonesia and Malaysia are sought by investors for the prospect of high returns, as they often experience faster economic growth. Indonesia often struggles to compete with the likes of India and China for investor interest. But even as sentiment towards emerging markets remains wary, the standout performance of Jakarta’s stock market and a new confidence in the government of Southeast Asia’s largest economy is attracting attention. As stated in factsheet financing Malaysia, in 2013 Malaysia gained recognition as an advanced
Transcript of THE IMPACT OF MACROECONOMIC INDICATORS TO STOCK MARKET ...e-journal.uajy.ac.id/10431/1/JURNAL...

1
THE IMPACT OF MACROECONOMIC INDICATORS TO STOCK MARKET
PERFORMANCE. THE CASE OF INDONESIA AND MALAYSIA STOCK MARKET
Marceline Adella Violeta
121219718
International Business Management Program, Economy Faculty
Universitas Atma Jaya Yogyakarta
Abstract
The purpose of this researh is to examine the impact of macroeconomic indicators to stock
market performance in case of Indonesia and Malaysia period of January 2006 to December
2015. Macroeconomic indicators that used are gross domestic product growth rate, inflation
rate, and interest rate. The proxies of stock market performance are stock market liquidity,
market capitalization, and stock market return. Indonesia stock market represented by JKSE
and Malaysia represented by KLSE. This research employs Multiple Regression analysis by
using backward elimination method. By using classical assumption for least squre, all the data
are free from heteroscedasticity, autocorrelation, and multicollinearity. Regression result
showed that Gross domestic product growth rate have no impact to all proxy of stock market
performance. Inflation rate have negative impact to several proxies of stock market
performance, which are market capitalization and market return in Indonesia and market
capitalization in Malaysia. While interest rate have no impact to all proxy of stock market
performance.
Keywords: Macroeconomic indicators, Stock market performance, Multiple regression,
Backward elimination.
1. Introduction
1.1 Background of the study
Many studies about relation between macroeconomic indicators and the stock
market performance have been done found that macroeconomic and fiscal environment
is one of the building blocks which determine the success or otherwise of securities
market (Paddy, 1992). Coleman and Tetey (2008) examined the effect of
macroeconomic variables on Ghana Stock Exchange. Their results suggested that
macroeconomic indicators should be considered for investors in developing economies.
But there is still limited research on how macroeconomic indicators affectting stock
market in developing economies especially emerging markets. This motivates
researcher to examine the degree to which those conclusion is applicable to Indonesia
and Malaysia as emerging markets.
As quoted from next.ft website, as an emerging market, Indonesia and Malaysia
are sought by investors for the prospect of high returns, as they often experience faster
economic growth. Indonesia often struggles to compete with the likes of India and
China for investor interest. But even as sentiment towards emerging markets remains
wary, the standout performance of Jakarta’s stock market and a new confidence in the
government of Southeast Asia’s largest economy is attracting attention. As stated in
factsheet financing Malaysia, in 2013 Malaysia gained recognition as an advanced

2
emerging market, with leading positions in regional bonds and global islamic capital
market. It has one of the largest unit trust industries in ASEAN, the third largest bond
market in Asia as a percentage of GDP and the largest sukuk market in the world. The
good economic performance of Indonesia and Malaysia as emerging market, makes the
relation between economic condition and stock market condition very interesting to be
discussed.
The direct effect of money on stock prices sometimes referred to as the liquidity
effect. As an increase or decrease in the money supply influences economic activity, it
will eventually impact corporate earnings, dividends, and returns to investors (Hirt and
Block, 2006). When the GDP increase, the demand of money will be increase because
of the power of transaction increase. When the price level is increase, the rate of
inflation will getting higher, this makes interest rate tend to increase. So these three
macroeconomic indicators are relates each other. Based on that understanding,
macroeconomic indicators that used in this research study are gross domestic product
growth rate, inflation rate, and interest rate.
To represent the Indonesia stock market this research study uses Jakarta
composite index (JKSE) and FTSE Bursa Malaysia KLCI index (KLSE) as
representation of Malaysia stock market. According to Bloomberg, JKSE is a modified
capitalization-weighted index of all stocks listed on the regular board of the Indonesia
Stock Exchange, that is why the researcher choose JKSE as the index which can
represent the Indonesia stock market clearly. Besides that the election of KLSE as the
choosen index is based on the reason that FTSE Bursa Malaysia KLCI Index comprises
of the largest 30 companies by full market capitalization on Bursa Malaysia's Main
Board.
1.2 Problem Statement
Based on the explanation of the background of the research study, the main
problem of this study is “What is the impact of macroeconomy indicators to the stock
market performance? The case of Indonesia and Malaysia”
1.3 Objective of the research
The objective of this research is to analyze the impact of the macroeconomic
indicators including gross domestic product growth rate, inflation rate, and interest rate
on the stock market performance. The case of Indonesia and Malaysia stock market.
2. Theoritical Background
2.1 Literature review
Macroeconomic Indicators
As stated by Coleman and Tettey (2008), generally, the barometers for
measuring the performance of the economy include real GDP growth rate, rate of
inflation and interest rate. These three macroeconomic indicators actually related to
each other. Researcher will analyze these relations first before discuss each indicators.
This relations can be understood by theory of money demand.
The quantity theory of money holds as the supply of money increases relative
to the demand of money (Hirt and Block, 2006). The demand of money is the amount

3
of wealth that individuals, households, and businesses choose to hold in the form of
money. Increase in real GDP raise the nominal volume of transactions and thus demand
of money also increase (Frank and Bernanke, 2001). In the long run, the main influence
on aggregate demand is the growth rate of the quantity of money. At times when the
quantity of money increase rapidly, aggregate demand increases quickly and the
inflation rate is high (Parkin, 2008). When the inflation rate is increase the interest rate
tend to increasing as well. This relationship is called as Fisher effect. This is the direct
effect of money on stock prices sometimes referred to as the liquidity effect. As an
increase or decrease in the money supply influences economic activity, it will
eventually impact corporate earnings, dividends, and returns to investors (Hirt and
Block, 2006).
Gross Domestic Product
Gross Domestic Product is the value of all final goods and services produced in
the country within a given period (Frank and Bernanke, 2001). Economic growth is a
sustained expansion of production possiblities measured as the increase in real GDP
over a given period (Parkin, 2008). The growth rate of GDP tells how rapidly the total
economy is expanding. This measure is useful for telling about potential changes in the
balance of economic power among nations.
Inflation
Inflation is a persistent rise in the average of all prices (Parkin, 2008 : 471).
Unpredictable inflation brings serious social and personal problems because it
retributes income and wealth, and diverts resources from production.
Economists have long realized that during periods of high inflation, interest rate
tend to be high as well (Frank and Bernanke, 2001). This relationship can be explained
by Fisher effect which is the tendency for nominal interest rate to be high when inflation
is high and low when inflation is low (Frank and Bernanke, 2001).
This tendency actually hurts stock market performance in two ways. First, it
slows down economic activity, reducing the expected sales and profit companies whose
sahres are traded in stock market. Lower profits, in turn, reduce dividends those firms
are likely to pay their shareholders. Second, higher real interest rate reduce the value of
stocks by increasing the required return for holding stocks, reducing the demand for
stock and reduce the stock price as well.
Interest Rate
The interest rate is the amount of interest paid per unit of time expressed as a
percentage of the amount borrowed (Samuelson and Nordhaus, 2002). Economists refer
to the annual percentage increase in the real purchasing power of a financial asset as
the real interest rate.
Higher interest rates provide incentives to increase the supply of funds, but at
the same time they reduce the demand for those funds. Lower interest rates have the
opposite effects (Rose and Marquis, 2009 : 119). High interest rate reduce the present
value of future cash flows, thereby reducing the attractiveness of investment
opportunities (Bodie et al, 2003).
As explined in their book, Rose and Marquis (2009) stated that as with bonds
and other debt securities, there tends to be an inverse relationship between interest rates

4
and corporate stock prices as well. If interest rates rise, debt instrumets now offering
higher yields become more attractive relative to stocks, resulting in increased stock
slaes and declining equity prices. Conversely, a period of falling interest rates often
leads investors to dump their lower-yielding bonds and switch to equities, driving stock
price upward.
Stock Market Performance
Capital markets are the channels through which firms obtain financial resources
to buy physical capital resources (Parkin, 2008: 400). Stock market is a place where the
shares in publicly owned companies, the titles to business firms, are bought and sold
(Samuelson and Nordhaus, 2002: 531). A market can be classified as primary and
secondary. Primary markets are security markets where new issues of securities are
initially sold. A secondary market is a market where securities are resold. In this
research study, secondary markets are discussed.
Stock market performance can be figured out by indexes. Indexes allow
investors to measure the performance of their portfolios againts an index that
approximates their portfolio compostition. Each index is intended to represent the
performance of stock traded in a particular exchange or market.
Market Liquidity
Liquidity is a measure of the speed with which an asset can be converted into
cash at its fair market value. Liquid market exist when continuous trading occurs, and
as the number of participants in the market becomes larger, price continuity increases
along with liquidity. Because the liquidity feature of financial assets tends to lower
their risk, liquid assets carry lower interest rates than illiquid assets (Rose and Marquis,
2009 : 218).
The liquidity of the market can be measures by trading volume, frequency of
trades, and average trade size. Bongdan et al. (2012) stated that trading volume measure
is trying to capture the quantity of shares per time measure the depth dimension of
liquidity, it is also an increasing function of liquidity. Stock with a higher volume are
ore liquid, they also have lower spreads. In this research study, the market liquidity
measured by volume of transaction on an average monthly basis.
Market Capitalization
According to investopedia website, market capitalization can be a tool
to know the performance of capital market. Market capitalization is the total dollar
market value of all of a company’s outstanding shares. Market capitalization is
calculated by multiplying a company’s shares outstanding by the current market price
of one share. The investment community uses this figure to determine a company’s
size, as opposed to sales or total asset figures.
Market Return
According to investopedia.com, a return is the gain or loss of a security in a
particular period. The return consists of the income and the capital gains relative on an
investment. It is usually quoted as a percentage.
The return on an investor’s portfolio during a given interval is equal to the
change in value of the portfolio plus any distribution received frrom the portfolio,
expressed as a fraction of the initial portfolio value (Fabozzi and Modigliani, 2009).

5
The Relation Between Economic Condition and Capital Market
As writen by Hirt and Block (2006), the direct effect of money on stock price
sometimes referred to as the liquidity effect. The quantity theory of money holds that
as the supply of money increases relative to the demand for money, people will make
adjustment in their portofolio assets. The indirect effect of money on stock prices would
be its impact on gross domestic product and corporate profits. As an increase or
decrease in the money supply influences economic activity, it will eventually impact
corporate earnings, dividends, and returns to investors.
2.2 Hypothesis development
Raza et al. (2015) in their research concluded that economic growth have a
significant positive relationship with the stock market capitalization in long run as well
as in short run. It is also suggested that the economic growth is a better leading indicator
for stock market capitalization in Pakistan. So based that theory and previous research,
the researcher can conclude that real gross domestic product growth rate give positive
impact to stock market performance.
H1 : There is positive impact of real Gross Domestic Product growth rate to stock
market performance.
In their book, Frank and Bernanke (2001), explained that inflation hurts stock
market performance. It slows down economic activity, reducing the expected sales and
profit companies whose sahres are traded in stock market. Lower profits, in turn, reduce
dividends those firms are likely to pay their shareholders. Kyereboach-Coleman and
Agyire-Tettey (2008) examined how macroeconomic indicators affect the performance
of stock markets by using the Ghana Stock Exchange as a case study, their result
concluded that Inflation rate is found to have a negative effect on stock market
performance. Based on thaat theory and previous research, researcher conclude that the
inflation rate have negative impact to the stock market performance.
H2 : There is negative impact of inflation rate to stock market performance.
According to Rose and Marquis (2009), as with bonds and other debt securities,
there tends to be an inverse relationship between interest rates and corporate stock
prices as well. Kyereboach-Coleman and Agyire-Tettey (2008) in their research found
that lending rates from deposit money banks have an adverse effect on stock market
performance and particularly serve as major hidrance to business growth in Ghana.
Based on that reason, the researcher conclude that interest rates have negative impact
to the stock market performance.
H3 : There is negative impact of interest rate to stock market performance.
3. Methodology
3.1 Data and Source
The data which is used in this research is secondary data. The data used for this
research are :

6
a. Monthly data of Indonesia and Malaysia Gross Domestic Product growth rate
period of January 2006 – December 2015. The data taken from Asia Regional
Integration Center website (aric.adb.org).
b. Monthly data of Indonesia and Malaysia Inflation Rate period of January 2006
– December 2015. The data taken from Asia Regional Integration Center
website (aric.adb.org).
c. Monthly data of Indonesia and Malaysia Interest Rate period of January 2006 –
December 2015. The data taken from central bank of each country, which is
Bank Indonesia and Bank Negara Malaysia website (bi.go.id and bnm.gov.my).
d. Monthly data of volume of transactions and adjective closing price from JKSE
and KLSE period of January 2006 – December 2015 taken from Yahoo! Finance
website (finance.yahoo.com)
e. Monthly data of market capitalization taken from statistic annual report of
Indonesia stock exchange (idx.co.id) and Bursa Malaysia (bursamalaysia.com)
3.2 Variable measurement
a. Gross Domestic Product growth rate
In this research, the economic growth rate expressed by the percentage change of
GDP. To calculate this growth rate, according to Parkin (2008) the formula is :
GDP growth rate = GDP current period − GDP previous period
GDP in previous period× 100
b. Inflation Rate
The inflation rate of Indonesia and Malaysia in this research taken directly from
Asia Regional Integration Center’s website. The calculation of inflation rate is based on
consumer price index in each country.
c. Interest Rate
The interest rate in this research taken directly from the website of central bank each
country. Interest rate for Indonesia is the monthly BI Rate from Bank Indonesia’s website.
Interest rate for Malaysia from Bank Negara Malaysia’s website.
d. Market Liquidity
The market liquidity in this research taken directly from volume column in JKSE
and KLSE index. The volume data is from number of shares trading in a month. This
research use the change of market liquidity in the regression process. So the number of
variable ML is the result of shares traded in month n minus shares traded in previous month
(n-1) then divided by the shares traded in previous month (n-1). Below is the formula :
ML = shares traded in this month – shares traded previous month
shares traded in previous month
e. Market Capitalization
The market capitalization of Indonesia stock market data taken directly from
Indonesia stock exchange website. The measurement of market capitalization based on
Indonesia Stock Exchange (IDX) is aggregate number of shares multiplied by regular
market closing price. The market capitalization data of KLSE expressed in RM billion and

7
data of JKSE in IDR billion. This research use the change of market capitalization each
month in the regression process. So the number of variable MC is the result of market
capitalization in month n minus market capitalization in previous month (n-1) then divided
by the market capitalization in previous month (n-1). Below is the formula :
MC = market cap in this month – market cap in previous month
Market cap in previous month
f. Market Return
In this research, the market return is calculated by researcher based on adjective
closing price of each index. Based on Hirt and Block’s book (2006), the rate of return from
an investment can be masured as :
Rate of return =(Ending value − Beginning value)
Beginning value
The ending and beginning value taken from adjusted closing price column in JKSE
and KLSE index. The ending value is adjusted closing price in t month. The begining value
is adjusted closing price in t-1 month.
3.3 Method of Analysis
There are three models approach that use to estimate the hypothesis: First model
is to test the macroeconomic indicators to stock market performance which is market
liquidity by using independent variabels which are gross domestic product growth rate,
inflation rate, and interest rate.
MLi,t = α + β1Gdpi,t + β2Infi,t + β3Inti,t + ε
Second model is to test the macroeconomic indicators to stock performance
which is market capitalization by using independent variables which are gross domestic
product growth rate, inflation rate, and interest rate.
MCi,t = α + β1Gdpi,t + β2Infi,t + β3Inti,t + ε
Third model is to test the macroeconomic indicators to stock performance which
is market return by using gross domestic product growth rate, inflation rate, and interest
rate as the independent variables.
MRi,t = α + β1Gdpi,t + β2Infi,t + β3Inti,t + ε
The method of analysis in this research study divided into three steps. The first
is descriptive statistic of the variables. In this section, the variable of the sample will be
described in detail. The second step is testing the classical assumptions of each model
by using eviews software. The classical assumption testing consists of
heteroscedasticity, multicollinearity, and autocorrelation tests. The third step is anlayze
the impact of macroeconomic indicators to stock market performance that consists of
market liquidity, market capitalization, and market return, by using simple linear
regression in backward elimination method. In this regression, will be used t – test to
investigate the significancy impact of independent variable to dependent variable.
4. Data Analysis
4.1 Descriptive Statistics
8
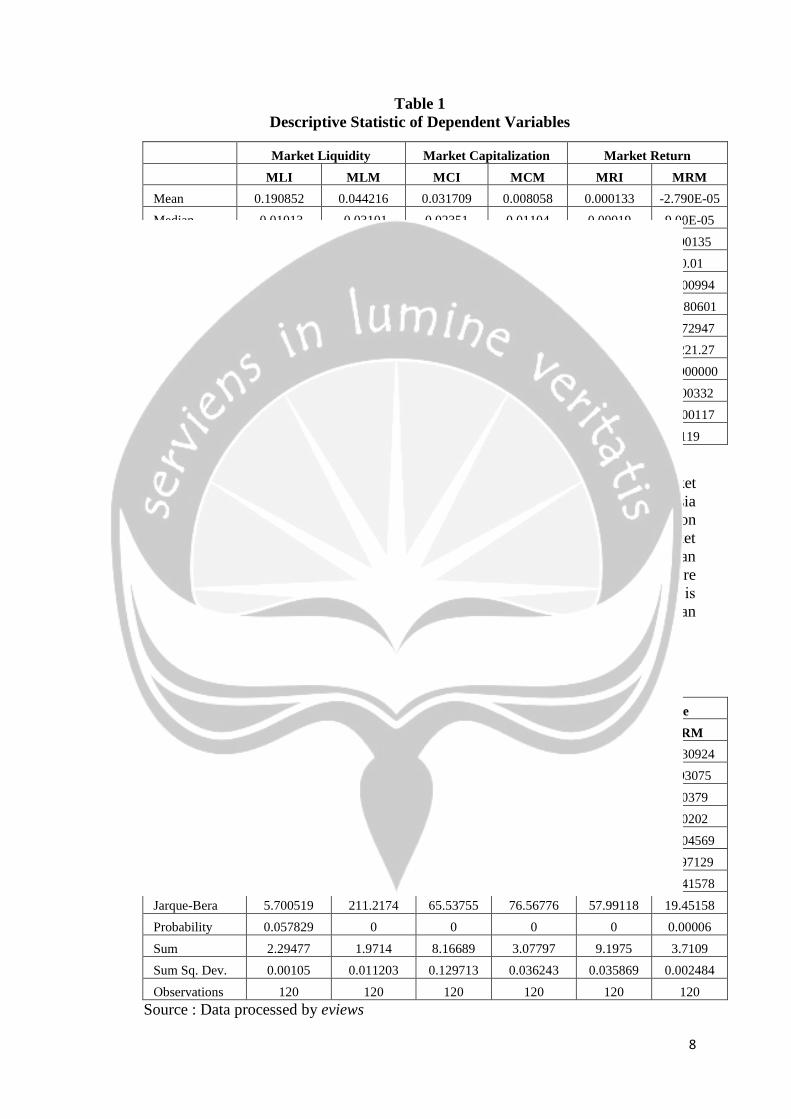
Table 1
Descriptive Statistic of Dependent Variables
Market Liquidity Market Capitalization Market Return
MLI MLM MCI MCM MRI MRM
Mean 0.190852 0.044216 0.031709 0.008058 0.000133 -2.790E-05
Median -0.01013 -0.03101 0.02351 0.01104 0.00019 9.00E-05
Maximum 15.60535 1.3671 1.79228 0.13915 0.00201 0.00135
Minimum -0.56599 -0.63491 -0.3123 -0.14951 -0.00314 -0.01
Std. Dev. 1.485254 0.313707 0.174985 0.038853 0.00064 0.000994
Skewness 9.559935 1.396467 8.573033 -0.506906 -1.039275 -8.580601
Kurtosis 99.23947 6.326582 87.7585 5.572636 8.066788 86.72947
Jarque-Bera 47736.88 93.54703 37078.37 37.91276 148.7138 36221.27
Probability 0.0000000 0.0000000 0.000000 0.000000 0.000000 0.0000000
Sum 22.71138 5.26171 3.77334 0.95886 0.01578 -0.00332
Sum Sq. Dev. 260.3056 11.61263 3.613121 0.178131 4.83E-05 0.000117
Observations 119 119 119 119 119 119
Source : Data processed by eviews
From the table above seen that Indonesia (JKSE) have higher average of market
liquidity than Malaysia (KLSE). For market capitalization and market return, Indonesia
(JKSE) also have higher average rather than Malaysia (KLSE). The standard deviation
means the distribution of the data or in this term, means the volatility. For market
liquidity and market capitalization, standard deviation of Indonesia are higher than
Malaysia. It means that Indonesia market liquidity and market capitalization are more
volatile than Malaysia’s. Only for market return, the standard deviation of Malaysia is
higher than Indonesia. It means that Malaysia market return is more volatile than
Indonesia’s.
Table 2
Descriptive Analysis of Independent Variables
GDP Growth Inflation rate Interest Rate
GDPI GDPM INFI INFM IRI IRM
Mean 0.019123 0.016428 0.068057 0.02565 0.076646 0.030924
Median 0.019345 0.017885 0.0629 0.025975 0.075 0.03075
Maximum 0.0271 0.03642 0.1792 0.08522 0.1275 0.0379
Minimum 0.01349 -0.02095 0.02396 -0.0248 0.0575 0.0202
Std. Dev. 0.00297 0.009703 0.033016 0.017452 0.017361 0.004569
Skewness 0.519019 -2.02109 1.502794 0.614346 1.439573 -0.97129
Kurtosis 3.250159 8.08963 5.018402 6.715356 4.818997 3.341578
Jarque-Bera 5.700519 211.2174 65.53755 76.56776 57.99118 19.45158
Probability 0.057829 0 0 0 0 0.00006
Sum 2.29477 1.9714 8.16689 3.07797 9.1975 3.7109
Sum Sq. Dev. 0.00105 0.011203 0.129713 0.036243 0.035869 0.002484
Observations 120 120 120 120 120 120
Source : Data processed by eviews

9
As seen from the average of GDP growth rate, inflation rate, and interest rate,
macroeconomic indicators of Indonesia have higher number than macroeconomic
indicators of Malaysia. For standard deviation of GDP growth rate, Malaysia have
higher number than Indonesia. But for inflation rate and interest rate, Indonesia have
higher standard deviation than Malaysia. It means that the GDP growth rate of Malaysia
is more volatile than Indonesia’s. While the inflation and interest rate of Indonesia are
more volatile than Malaysia’s.
4.2 Classical Assumption Testimg
This research uses White - test method in to test whether heteroscedasticity
happen or not. The criteria of decision making is if the value of Probability Obs*R-
square > 0.05 then there is no heteroscedasticity, if the value of Probability Obs*R-
square < 0.05 then there is heteroscedasticity. Based on the table below can be
concluded that there is no heteroscedasticity in all equation model of this research.
Table 3
Heteroscedasticity Test Results
Dependent variable Countries Probability Value
of Obs*R-squared Decision
Market Liquidity
Indonesia
0.4618 No Heterescedasticity
Market Capitalization 0.0585 No Heterescedasticity
Market Return 0.2142 No Heterescedasticity
Market Liquidity
Malaysia
0.3707 No Heterescedasticity
Market Capitalization 0.3963 No Heterescedasticity
Market Return 0.8767 No Heterescedasticity
To detect autocorrelation, this research employ 2 method. The first is Breusch-
Godfrey Serial Correlation LM Test that used in Indonesia equation model and the
second is Durbin-Watson value method that used in Malaysia equation model.
In the Breusch-Godfrey Serial Correlation LM Test, he criteria of decision
making is if the value of Probability Obs*R-square > 0.05 then there is no
autocorrelation, if the value of Probability Obs*R-square < 0.05 then there is
autocorrelation. In the Durbin Watson method, the autocorrelation can be seen from the
Durbin Watson scores. A regression model is called as having no autocorrelation if the
result of Durbin Watson value is lay between dU value and 4-dU (dU < d < 4 – dU). In
this research because the number of data (n) is 120 data and the coeficients except
constanta (k) is 3, so the dU value is 1.7536.
Table 4
Autocorrelation Test Results
Dependent variable Countries Probability Value of
Obs*R-squared Decision
Market Liquidity
Indonesia
0.9456 No Autocorrelation
Market Capitalization 0.7041 No Autocorrelation
Market Return 0.0979 No Autocorrelation

10
Durbin Watson Score
Market Liquidity
Malaysia
2.240.463 No Autocorrelation
Market Capitalization 1.892.718 No Autocorrelation
Market Return 2.121.578 No Autocorrelation
Multicollinearity is the undesireable situation where the correlations among the
independent variables are strong. The multicollinearity in this research was detected by
correlation table analysis. Based on the correlation table analysis in all equation model,
there is no correlation value that more than 0.9. It means there is no multicollinearity in
all equation model.
4.3 Hypothesis Testing
Multiple Regression Analysis
Table 5
The Impact of Macroeconomic Indicators to Market Liquidity in Indonesia
Model
Unstandardized
Coefficients
Standardized
Coefficients t Sig.
B Std. Error Beta B Std. Error
1 (Constant) 2,046 1,292 1,583 ,116
GDPI -77,043 46,777 -,155 -1,647 ,102
INFI 3,596 8,036 ,077 ,447 ,655
IRI -8,171 15,355 -,092 -,532 ,596
2 (Constant) 1,823 1,188 1,534 ,128
GDPI -75,805 46,534 -,152 -1,629 ,106
IRI -2,387 8,261 -,027 -,289 ,773
3 (Constant) 1,594 ,882 1,807 ,073
GDPI -73,348 45,571 -,147 -1,610 ,110
4 (Constant) ,191 ,136 1,402 ,164
Based on table 5 above, the final model is model 4 that removed all the
independent variables from the model. So it can be concluded that all variable
independent which are GDP growth rate, inflation rate, and interest rate does not give
impact to dependent variable. In other words, macroeconomic indicators in Indonesia
period of 2006 – 2015 does not give impact to stock market performance in term of
market liquidity of JKSE.
Table 6
The Impact of Macroeconomic Indicators to Market Liquidity in Malaysia
Model
Unstandardized
Coefficients
Standardized
Coefficients t Sig.
B Std. Error Beta B Std. Error
1 (Constant) ,081 ,210 ,386 ,700
GDPM -,868 3,185 -,027 -,272 ,786
INFM 2,918 1,951 ,163 1,495 ,138
IRM -3,153 7,884 -,046 -,400 ,690
2 (Constant) ,089 ,208 ,427 ,670
INFM 3,000 1,920 ,167 1,562 ,121

11
IRM -3,924 7,330 -,057 -,535 ,593
3 (Constant) -,019 ,051 -,374 ,709
INFM 2,470 1,640 ,138 1,506 ,135
4 (Constant) ,044 ,029 1,538 ,127
Based on the table 6 above, the final model is model 4 that removed all the
independent variables from the model. So it can be concluded that all variable
independent which are GDP growth rate, inflation rate, and interest rate does not give
impact to dependent variable. In other words, macroeconomic indicators in Malaysia
period of 2006 - 2015 does not give impact to stock market performance in term of
market liquidity of KLSE.
Table 7
The Impact of Macroeconomic Indicators to Market Capitalization in Indonesia
Model
Unstandardized
Coefficients
Standardized
Coefficients t Sig.
B Std. Error Beta B Std. Error
1 (Constant) -,256 ,148 -1,733 ,086
GDPI 3,504 5,348 ,060 ,655 ,514
INFI -2,784 ,919 -,506 -3,031 ,003
IRI 5,351 1,755 ,513 3,048 ,003
2 (Constant) -,178 ,088 -2,027 ,045
INFI -2,749 ,915 -,499 -3,004 ,003
IRI 5,180 1,732 ,497 2,991 ,003
Based on the table 7 above, the final model is model 2 that removed GDPI as
the independent variables from the model. So it can be concluded that only INFI and
IRI which give impact to the dependent variable. The impact of inflation rate to
Indonesia market capitalization is negative significantly, it can be seen from the
coefficient and significant t value (0,003 < 0,05). The impact of interest rate to
Indonesia market capitalization is positive significantly, it can be seen from the
coefficient and significant t value (0,003 < 0,05).
Table 8
The Impact of Macroeconomic Indicators to Market Cap in Malaysia
Model
Unstandardized
Coefficients
Standardized
Coefficients t Sig.
B Std. Error Beta B Std. Error
1 (Constant) ,054 ,024 2,287 ,024
GDPM -,482 ,360 -,121 -1,339 ,183
INFM -,804 ,221 -,362 -3,643 ,000
IRM -,577 ,891 -,068 -,647 ,519
2 (Constant) ,040 ,008 5,094 ,000
GDPM -,566 ,335 -,142 -1,688 ,094
INFM -,879 ,186 -,396 -4,716 ,000
Based on the table 8 above, the final model is model 2 that removed IRM as the
independent variables from the model. So the GDPM and INFM are remain. Based on
the significant t value, the only independent variable that give impact to dependent
variable is INFM because it has lower significant t value than alpha value (0,000 <
0,05). Then it can be concluded that the only macroeconomic indicators that give impact
to stock market capitalization in Malaysia is inflation rate.

12
Table 9
The Impact of Macroeconomic Indicators to Market Return in Indonesia
Model
Unstandardized
Coefficients
Standardized
Coefficients t Sig.
B Std. Error Beta B Std. Error
1 (Constant) ,000 ,001 -,444 ,658
GDPI -,004 ,020 -,019 -,207 ,836
INFI -,010 ,003 -,475 -2,823 ,006
IRI ,014 ,006 ,377 2,220 ,028
2 (Constant) ,000 ,000 -1,026 ,307
INFI -,010 ,003 -,477 -2,852 ,005
IRI ,015 ,006 ,382 2,285 ,024
Based on the table 9 above, the final model is model 2 that removed GDPI as
the independent variables from the model. So it can be concluded that only INFI and
IRI which give impact to the dependent variable. The impact of inflation rate to JKSE
market return is negative significantly, it can be seen from the coefficient and
significant t value (0,005 < 0,05). The impact of interest rate to JKSE market return is
positive significantly, it can be seen from the coefficient and significant t value (0,024
< 0,05).
Table 10
The Impact of Macroeconomic Indicators to Market Return in Malaysia
Model
Unstandardized
Coefficients
Standardized
Coefficients t Sig.
B Std. Error Beta B Std. Error
1 (Constant) -3,80E-005 ,001 -,057 ,955
GDPM -,008 ,010 -,083 -,835 ,405
INFM -,008 ,006 -,135 -1,237 ,219
IRM ,011 ,025 ,051 ,445 ,657
2 (Constant) ,000 ,000 1,106 ,271
GDPM -,007 ,009 -,067 -,726 ,469
INFM -,006 ,005 -,109 -1,184 ,239
3 (Constant) ,000 ,000 ,836 ,405
INFM -,006 ,005 -,112 -1,221 ,225
4 (Constant) -2,79E-005 ,000 -,306 ,760
Based on table 10 above, the final model is model 4 that removed all the
independent variables from the model. So it can be concluded that all variable
independent which are GDP growth rate, inflation rate, and interest rate does not give
impact to dependent variable. In other words, macroeconomic indicators in Malaysia
period of 2006 – 2015 does not give impact to stock market performance in term of
market return of KLSE.

13
Hypothesis Analysis
H1 : There is positive impact of Gross Domestic Product growth rate to stock market
performance.
Table 11
Summary of Hypothesis 1
Dependent Variables Country Coefficients Sig. Value Decision
Market Liquidity
Indonesia
-73,348 0,110 Not Supported
Market Capitalization 3,504 0,514 Not Supported
Market Return -0,004 0,836 Not Supported
Market Liquidity
Malaysia
-0,868 0,786 Not Supported
Market Capitalization -0,566 0,094 Not Supported
Market Return -0,007 0,469 Not Supported
Table 11 above shows the summary of Hypothesis 1. There are the coefficient
and the significant value of one independent variable which is Gross Domestic product
growth rate. From the table it can be concluded that in all equation model, H1 is not
supported. It is because all the significant values are higher than the alpha value ( >
0,05). So the conclusion for all equation model both Indonesia and Malaysia is there is
no positive impact of Gross Domestic Product growth rate to stock market performance.
H2 : There is negative impact of inflation rate to stock market performance.
Table 12
Summary of Hypothesis 2
Dependent Variables Country Coefficients Sig. Value Decision
Market Liquidity
Indonesia
3,596 0,655 Not Supported
Market Capitalization -2,749 0,003 Supported
Market Return -0,010 0,005 Supported
Market Liquidity
Malaysia
2,47 0,135 Not Supported
Market Capitalization -0,879 0,000 Supported
Market Return -0,006 0,225 Not Supported
Table 12 above shows the summary of Hypothesis 2. There are the coefficient
and the significant value of one independent variable which is inflation rate. From the
table it can be concluded that not in all equation model, H2 is supported. Based on stock
market capitalization of Indonesia, stock market return of Indonesia, and stock market
capitalization of Malaysia, H2 is supported. It is because the coefficient values shows
negative sign that means negative impact and the significant values are lower than alpha
value (< 0,05). Based on stock market liquidity in Indonesia, stock market liquidity in
Malaysia, and stock market return in Malaysia, H2 is not supported. It is because the
significan values are higher than alpha value ( > 0,05).

14
H3 : There is negative impact of interest rate to stock market performance.
Table 13
Summary of Hypothesis 3
Dependent Variables Country Coefficients Sig. Value Decision
Market Liquidity
Indonesia
-2,387 0,773 Not Supported
Market Capitalization 5,18 0,003 Not Supported
Market Return 0,015 0,024 Not Supported
Market Liquidity
Malaysia
-3,924 0,593 Not Supported
Market Capitalization -0,577 0,519 Not Supported
Market Return 0,011 0,657 Not Supported
Table 13 above shows the summary of Hypothesis 3. There are the coefficient
and the significant value of one independent variable which is interest rate. From the
table it can be concluded that in all equation model, H3 is not supported. It is because
several of the significant values are higher than the alpha value ( > 0,05), although there
are two significant values that lower than alpha value , which are market capitalization
and market return in Indonesia, but the coefficient shows positive impact that not fit
with the hypothesis. So the conclusion, for all equation model both Indonesia and
Malaysia is there is no negative impact of interest rate to stock market performance.
5. Conclussion
From the result of this research study on the impact of macroeconomic
indicators to stock market performance in Indonesia and Malaysia, it can be concluded
as follows :
1. Gross domestic product growth rate have no impact to all proxy of stock market
performance which are market liquidity, market capitalization, and market
return in Indonesia and Malaysia in time period of 2006 to 2015.
2. Inflation rate have negative impact to several proxies of stock market
performance, which are market capitalization and market return in Indonesia
and market capitalization in Malaysia. While inflation rate have no impact to
market liquidity in Indonesia and Malaysia and also market return in Malaysia.
These all for macroeconomic indicators and stock market performance period
of 2006 to 2015.
3. Interest rate have no impact to all proxy of stock market performance which are
market liquidity, market capitalization, and market return in Indonesia and
Malaysia in period of 2006 to 2015. From the hypothesis testing result the
interest rate seen to have significant positive impact to market capitalization and
market return in Indonesia.
Refferences
Alam, M.M., Uddin, M.G. (2009). “Relationship between interest rate and stock price:
Empirical evidence from developed and developing countries”. International Journal of
Business and Management. Vol 4, No 3.
Ariefianto, M.D., (2012). Ekonometrika: Esensi dan Aplikasi dengan Menggunakan Eviews,
Penerbit Erlangga

15
Bodie, Kane, and Marcus. (2003). Essentials of Investment. McGraw Hill, International
Edition.
Chiang, T.C., and Doong, SC., (2001), “Empirical Analysis of Stock Returns and Volatility:
Evidence from Seven Asian Stock Markets Based on TARGARCH Model”, Review of
Quantitative Finance and Accounting, 17: 301– 318,
Coleman, A.K., Tetey, K.A. (2008). “Impact of macroeonomic indocators on stock market
performance”. The Journal of Risk Finance. Vol 9. Iss 4 pp.365 - 378
Hirt, Block. (2006). Fundamentals of Investment Management. Eighth edition. McGraw Hill,
International Edition.
Hussainey, Ngoc. (2009). “The impact of macroeconomic indicators on Vietnamese stock
prices”. The Journal of Risk Finance. Vol. 10 Iss 4 pp. 321-332.
Kiymaz, H., and Girard, E., (2009), “Stock Market Volatility and Trading Volume: An
Emerging Market Experience”, the ICFAI Journal of Applied Finance, Vol. 15, p. 5-32
Liaw, K.T., (2004), Capital Market, Thomson-Learning, South-Western, United States of
America
Pal, K., Mittal, M. (2011). “Impact of macroeconomic indicators on Indian capital markets”.
The Journal of Risk Finance. Vol. 12 Iss 2 pp. 84-97.
Parkin. (2008). Economics. 8th edition. Pearson International Edition.
Raza, S.A., Jawaid, S.T., Afshan S, and Karim M.Z.A., (2015). “Is stock market sensitive to
foreign capital inflows and economic growth?’. Journal of Chinese Economic and
Foreign Trade Studies. Vol. 8 Iss 3 pp 142 – 164
Rizvi, Arshad. (2014). “Investigating the efficiency of East Asian stock markets through booms
and busts”. Pacific Science Review. Vol. 16 Iss 4 pp 275 - 279
Rose, Marquis. (2009). Money and Capital Markets. Tenth edition. McGraw Hill, International
Edition.
Samuelson, Nordhaus. (2002). Economics. Seventeenth edition. McGraw Hill, International
Edition.
Van Horne, J.C., and Wachowhicz J.R., (2005), Fundamentals of Financial Management,
twelfth edition, Prentice Hall
www.aric.adb.org
www.bi.go.id
www.bloomberg.com
www.bnm.gov.my
www.idx.co.id
www.indonesia-investment.com
www.investopedia.com
www.yahoo-finance.com