The Impact of Immigration
55
The Impact of Immigration: Looking Beyond the Labor Market 1 Anna Maria Mayda Georgetown, CEPR, IZA June 30, 2021 CEPR Seminar Series on “The Policy Implications of Recent Globalization Research” 1 This talk is based on joint work with various coauthors: Mine Senses (Johns Hopkins University, CEPR, IZA) and Walter Steingress (Bank of Canada, IZA), as well as Giovanni Facchini (University of Nottingham, CEPR), Elie Murard (University of Alicante), Giovanni Peri (UC Davis, CEPR, NBER).
Transcript of The Impact of Immigration
The Impact of Immigration:Looking Beyond the Labor Market1
Anna Maria MaydaGeorgetown, CEPR, IZA
June 30, 2021
CEPR Seminar Series on“The Policy Implications of Recent Globalization Research”
1This talk is based on joint work with various coauthors: Mine Senses (JohnsHopkins University, CEPR, IZA) and Walter Steingress (Bank of Canada, IZA), as wellas Giovanni Facchini (University of Nottingham, CEPR), Elie Murard (University ofAlicante), Giovanni Peri (UC Davis, CEPR, NBER).
Introduction
I To design an optimal migration policy, we need to know the overallimpact of immigrants, through different channels.
I From an economic point of view:
I labour (and other factors) market
I welfare state (fiscal effects)
I markets of goods and services (prices, production patterns, trade,FDI, innovation)
I housing market
I From a non-economic point of view: cultural, security/crime andpolitical effects.
Labor market channel
I The academic migration literature in economics has devoted a greatdeal of attention to the labor market channel.
I According to Lozano and Steinberger (2010), at least 145 studies onthe topics of migration and labour markets were published between1990 and 2010. Many more papers on this topic since 2010.
Welfare state channel (fiscal effects)
I Yet other economic channels are also very important.
I In particular the fiscal effects of immigration are at least asimportant, for various reasons (next slides), especially from a policypoint of view.
I For example, the influential policy report by the U.S. NationalAcademy of Science in 2016 (“The Economic and FiscalConsequences of Immigration”) devotes 2 chapters to thelabor-market channel, 3 chapters to fiscal effects and 1 chapter to allother economic impacts.
I Yet the academic literature on fiscal effects is much smaller.
Welfare state channel (fiscal effects) (cont.)
By “fiscal effects”, we mean the impact of immigration on publicrevenues (mostly tax revenues), provision of public goods and servicesand in general the size of the welfare state.

Outline of the presentation
I Why are fiscal effects important
I Existing literature on fiscal effects (United States)
I New work on fiscal effects
I Policy implications of analysis of fiscal effects

Why are fiscal effects important: Politics
Fiscal effects are crucial from a political point of view.
I Each voter cares about: disposable income, i.e. income net of taxes,as well as the possibility to use public goods/services, that enter theutility function.
I Immigration can affect both tax rates and the quality and quantityof public goods and services provided by the government.
I Several papers on attitudes towards immigrants show that voterstake these effects into account when they form an opinion aboutimmigration.

Why are fiscal effects important: Politics (cont.)
I Voters are concerned that they might pay higher taxes as aconsequence of (low-skilled) immigration (Dustmann and Preston2007, Hanson, Scheve and Slaughter 2007, Facchini and Mayda2009).
I They also worry they may be more constrained in terms of use ofpublic services, due to overcrowding of schools and other publicservices when immigrants arrive (Hainmueller and Hiscox 2010).
I Importantly, public opinion polls show that fiscal effects are “moreimportant for individuals’ assessments of immigration policiesthan concerns about wages or employment” (Dustmann andFrattini 2014).
I The reason might be that fiscal effects impact everybody (whilelabor market effects are more concentrated).
Why are fiscal effects important: Politics (cont.)
I Finally fiscal effects affect the impact of immigration on electionoutcomes.
I In the United States, the arrival of low-skilled immigrants in acounty between 1990 and 2016 increases the Republican vote sharewhile the inflow of high-skilled immigrants reduces it (Mayda, Periand Steingress, 2020).
I The pro-Republican effect of low-skilled immigrants andpro-Democrat impact of high-skilled immigrants are morepronounced when government expenditures are high.
Why are fiscal effects important: Policy
I Immigration plays an important role in contexts characterized bypopulation aging (Mayda 2019; Borsch-Supan, Leite and Rauch2019).
I In particular, immigration can be a tool to offset the fiscal impact ofpopulation aging.
I In “pay-as-you-go” pension programs (such as Social Security in theUnited States), those who work now pay contributions that are usedby the program to pay monthly incomes to today’s retirees.Population aging can threaten the viability of these programs.
I The reason is that immigrants tend to be younger than the nativepopulation and to have higher fertility rates.
I In the United States, the total fertility rate of white non-Hispanicwomen is below 1.9, while the total fertility rate of Hispanic womenis roughly 2.8 (prior to the Great Recession).
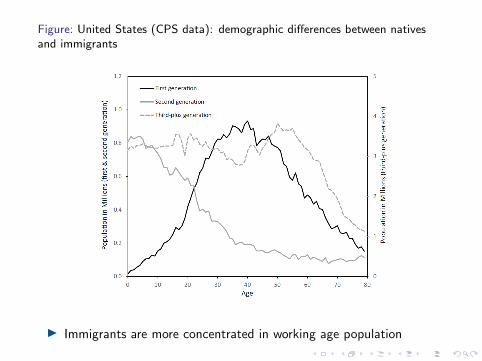
Figure: United States (CPS data): demographic differences between nativesand immigrants
I Immigrants are more concentrated in working age population

Why are fiscal effects important: Embedded liberalism
I The welfare state has made it possible to manage opposition toglobalization by public opinion.
I Some programs of the welfare state provide a “safety net”, i.e. asystem of support for those who experience a negative shockbecause of globalization.
I Since right after WWII, with the beginning of the new wave ofglobalization, several governments have increased publicexpenditures more and more, to provide this safety net (Rodrik1998).
I The welfare state represents a compromise to save globalization,without giving up democracy.
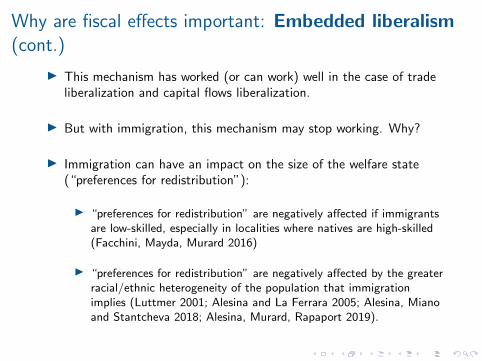
Why are fiscal effects important: Embedded liberalism(cont.)
I This mechanism has worked (or can work) well in the case of tradeliberalization and capital flows liberalization.
I But with immigration, this mechanism may stop working. Why?
I Immigration can have an impact on the size of the welfare state(“preferences for redistribution”):
I “preferences for redistribution” are negatively affected if immigrantsare low-skilled, especially in localities where natives are high-skilled(Facchini, Mayda, Murard 2016)
I “preferences for redistribution” are negatively affected by the greaterracial/ethnic heterogeneity of the population that immigrationimplies (Luttmer 2001; Alesina and La Ferrara 2005; Alesina, Mianoand Stantcheva 2018; Alesina, Murard, Rapaport 2019).

Literature on fiscal effects (United States)
I Only few academic papers empirically analyze the fiscal effects ofimmigration (policy papers are more common), especially in the caseof the United States.
I Some papers follow an accounting methodology (National AcademyReport on “The Economic and Fiscal Consequences of Immigration”2016; Auerbach and Oreopoulos 1999, 2000; Borjas 1994).
I Other papers use macroeconomic models to simulate the effect ofimmigration on governments’ revenues and expenditures(Storesletten 2000).
I These studies are insightful and have contributed a great deal to ourunderstanding of fiscal effects.
I Both approaches require a multitude of assumptions and may notcapture the indirect fiscal effects of immigration (through the labormarket, the house market, etc channels).

Literature on fiscal effects (United States) (cont.)
I No study estimates the (causal) effect of immigration on publicfinances in the U.S.
I From a methodological point of view, it is not clear which variationshould be exploited:
I at the country level – which is the level at which welfare stateprograms in most countries work: not enough variation;
I at the local level: it depends on how much fiscal autonomy localitieswithin a country have.
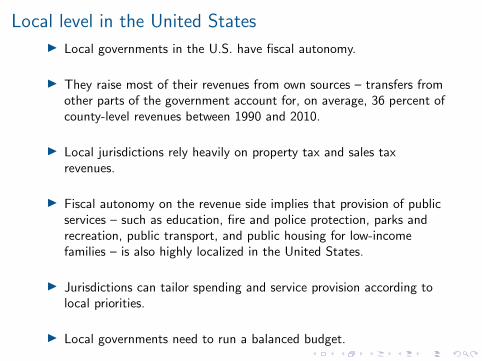
Local level in the United States
I Local governments in the U.S. have fiscal autonomy.
I They raise most of their revenues from own sources – transfers fromother parts of the government account for, on average, 36 percent ofcounty-level revenues between 1990 and 2010.
I Local jurisdictions rely heavily on property tax and sales taxrevenues.
I Fiscal autonomy on the revenue side implies that provision of publicservices – such as education, fire and police protection, parks andrecreation, public transport, and public housing for low-incomefamilies – is also highly localized in the United States.
I Jurisdictions can tailor spending and service provision according tolocal priorities.
I Local governments need to run a balanced budget.
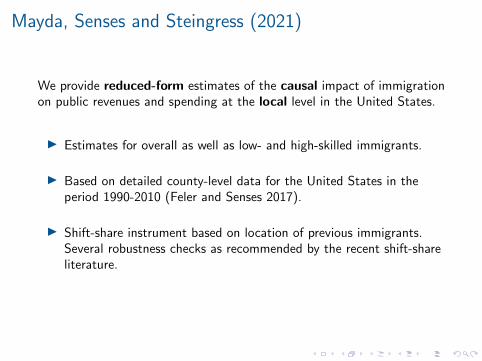
Mayda, Senses and Steingress (2021)
We provide reduced-form estimates of the causal impact of immigrationon public revenues and spending at the local level in the United States.
I Estimates for overall as well as low- and high-skilled immigrants.
I Based on detailed county-level data for the United States in theperiod 1990-2010 (Feler and Senses 2017).
I Shift-share instrument based on location of previous immigrants.Several robustness checks as recommended by the recent shift-shareliterature.
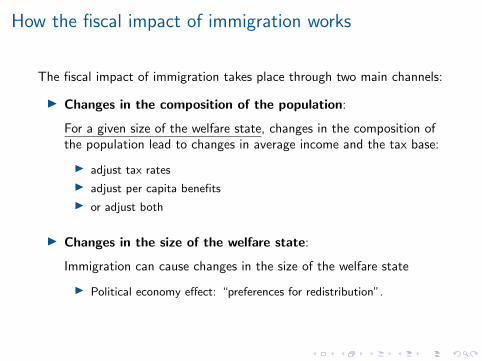
How the fiscal impact of immigration works
The fiscal impact of immigration takes place through two main channels:
I Changes in the composition of the population:
For a given size of the welfare state, changes in the composition ofthe population lead to changes in average income and the tax base:
I adjust tax rates
I adjust per capita benefits
I or adjust both
I Changes in the size of the welfare state:
Immigration can cause changes in the size of the welfare state
I Political economy effect: “preferences for redistribution”.
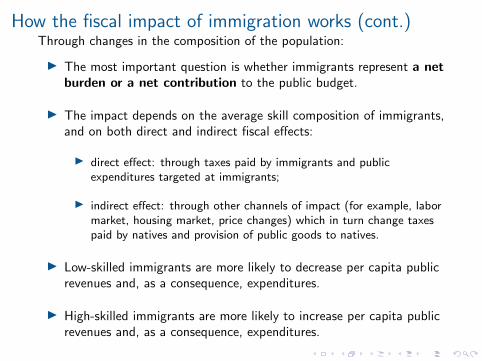
How the fiscal impact of immigration works (cont.)Through changes in the composition of the population:
I The most important question is whether immigrants represent a netburden or a net contribution to the public budget.
I The impact depends on the average skill composition of immigrants,and on both direct and indirect fiscal effects:
I direct effect: through taxes paid by immigrants and publicexpenditures targeted at immigrants;
I indirect effect: through other channels of impact (for example, labormarket, housing market, price changes) which in turn change taxespaid by natives and provision of public goods to natives.
I Low-skilled immigrants are more likely to decrease per capita publicrevenues and, as a consequence, expenditures.
I High-skilled immigrants are more likely to increase per capita publicrevenues and, as a consequence, expenditures.

2SLS: per-capita own revenues, 1990 to 2010
I No significant effect for the overall immigration share.
I 2% high-skilled immigrants: per-capita $195 or total $218Mill.
I 3% low-skilled immigrants: per-capita -$217 or total -$242Mill.
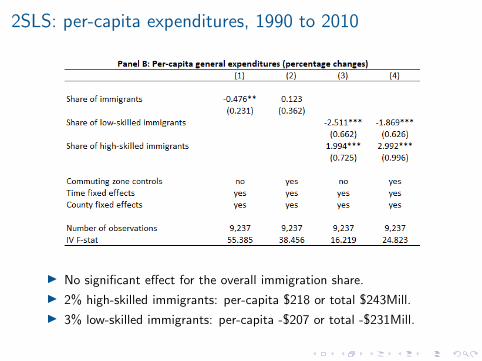
2SLS: per-capita expenditures, 1990 to 2010
I No significant effect for the overall immigration share.
I 2% high-skilled immigrants: per-capita $218 or total $243Mill.
I 3% low-skilled immigrants: per-capita -$207 or total -$231Mill.
Summary of our results
I In the average county, the overall share of immigrants doesnot increase nor decrease public revenues and expenditures atthe local level in the United States.
I The effects are small and not significant.
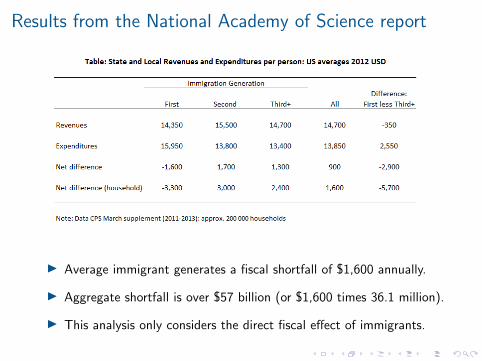
Results from the National Academy of Science report
I Average immigrant generates a fiscal shortfall of $1,600 annually.
I Aggregate shortfall is over $57 billion (or $1,600 times 36.1 million).
I This analysis only considers the direct fiscal effect of immigrants.
Summary of our results (cont.)
I Our estimates take into account both the direct and indirectfiscal effects of immigrants.
I We analyze the impact of immigration on all (local) public revenues– i.e. taxes paid by both immigrants and natives – and on all (local)public expenditures – i.e. those targeted at both immigrants andnatives.
I Our dependent variables are: all public revenues and all publicexpenditures.
Summary of our results
I When we differentiate by skill level of immigrants:
I Per-capita (own) revenues decrease when the share of low-skilledimmigrants increases
I Per-capita (own) revenues increase when the share of high-skilledimmigrants increases
I The magnitude of the effects is small.
I We estimate analogous impacts on the expenditures side.
I Fiscal transfers from the federal government partly offset the impactof immigration on (total) public revenues at the local level.

Summary of our results (cont.)
I Changes in property tax revenues are among the main drivers ofthese findings.
I Property tax revenues increase when high-skilled immigrants arriveand decrease when low-skilled immigrants come in.
I The reason is that house prices increase when high-skilled immigrantsarrive and decrease when low-skilled immigrants come in.
I Immigration does not have an effect on education expenditures;probably thanks to transfers from the federal government.
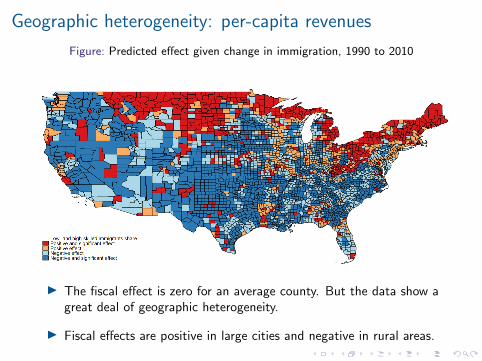
Geographic heterogeneity: per-capita revenues
Figure: Predicted effect given change in immigration, 1990 to 2010
I The fiscal effect is zero for an average county. But the data show agreat deal of geographic heterogeneity.
I Fiscal effects are positive in large cities and negative in rural areas.
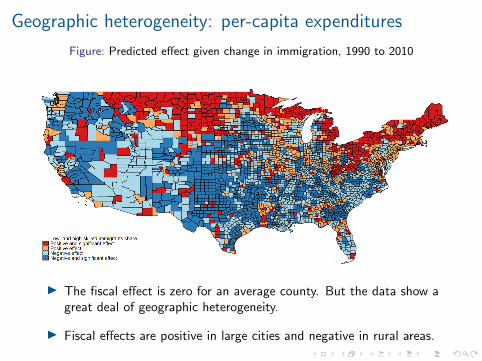
Geographic heterogeneity: per-capita expenditures
Figure: Predicted effect given change in immigration, 1990 to 2010
I The fiscal effect is zero for an average county. But the data show agreat deal of geographic heterogeneity.
I Fiscal effects are positive in large cities and negative in rural areas.
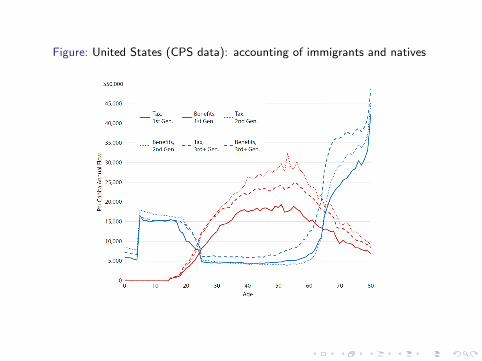
Figure: United States (CPS data): accounting of immigrants and natives
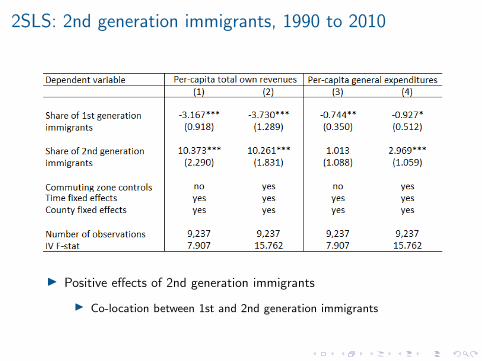
2SLS: 2nd generation immigrants, 1990 to 2010
I Positive effects of 2nd generation immigrants
I Co-location between 1st and 2nd generation immigrants
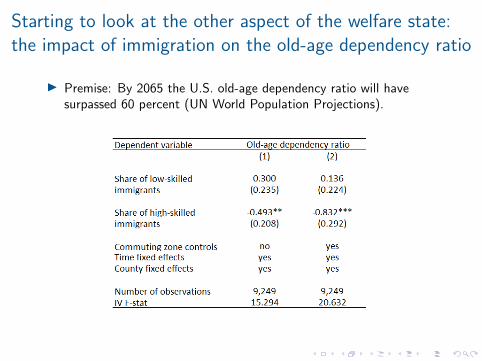
Starting to look at the other aspect of the welfare state:the impact of immigration on the old-age dependency ratio
I Premise: By 2065 the U.S. old-age dependency ratio will havesurpassed 60 percent (UN World Population Projections).
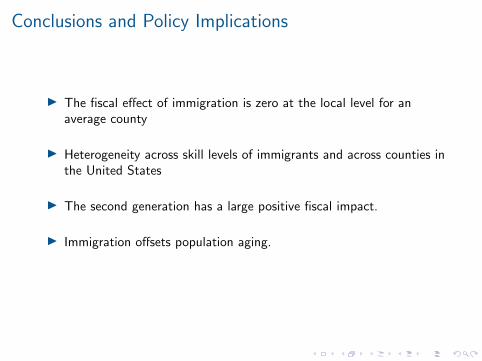
Conclusions and Policy Implications
I The fiscal effect of immigration is zero at the local level for anaverage county
I Heterogeneity across skill levels of immigrants and across counties inthe United States
I The second generation has a large positive fiscal impact.
I Immigration offsets population aging.

Appendix
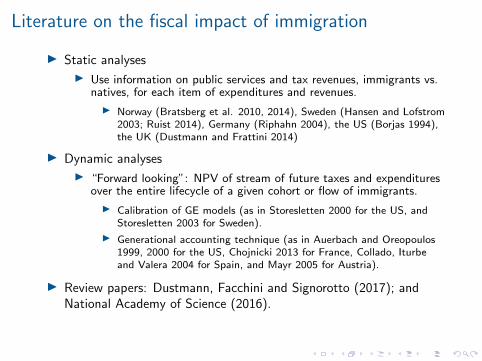
Literature on the fiscal impact of immigration
I Static analyses
I Use information on public services and tax revenues, immigrants vs.natives, for each item of expenditures and revenues.
I Norway (Bratsberg et al. 2010, 2014), Sweden (Hansen and Lofstrom2003; Ruist 2014), Germany (Riphahn 2004), the US (Borjas 1994),the UK (Dustmann and Frattini 2014)
I Dynamic analyses
I “Forward looking”: NPV of stream of future taxes and expendituresover the entire lifecycle of a given cohort or flow of immigrants.
I Calibration of GE models (as in Storesletten 2000 for the US, andStoresletten 2003 for Sweden).
I Generational accounting technique (as in Auerbach and Oreopoulos1999, 2000 for the US, Chojnicki 2013 for France, Collado, Iturbeand Valera 2004 for Spain, and Mayr 2005 for Austria).
I Review papers: Dustmann, Facchini and Signorotto (2017); andNational Academy of Science (2016).
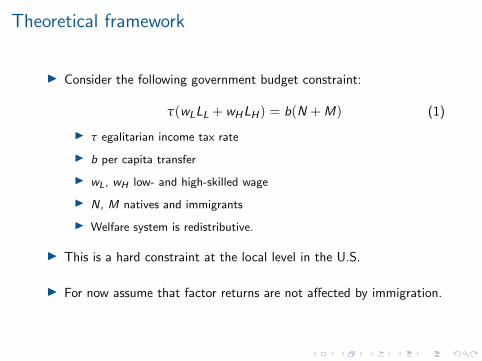
Theoretical framework
I Consider the following government budget constraint:
τ(wLLL + wHLH ) = b(N +M) (1)
I τ egalitarian income tax rate
I b per capita transfer
I wL, wH low- and high-skilled wage
I N, M natives and immigrants
I Welfare system is redistributive.
I This is a hard constraint at the local level in the U.S.
I For now assume that factor returns are not affected by immigration.
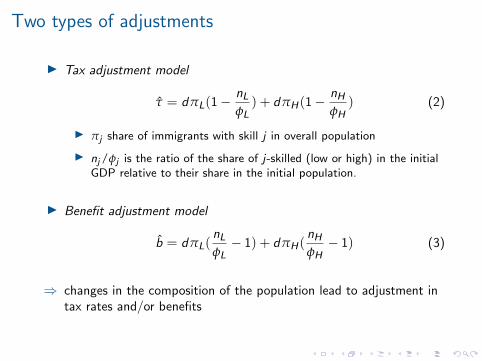
Two types of adjustments
I Tax adjustment model
τ = dπL(1−nLφL
) + dπH (1−nHφH
) (2)
I πj share of immigrants with skill j in overall population
I nj/φj is the ratio of the share of j-skilled (low or high) in the initialGDP relative to their share in the initial population.
I Benefit adjustment model
b = dπL(nLφL− 1) + dπH (
nHφH− 1) (3)
⇒ changes in the composition of the population lead to adjustment intax rates and/or benefits
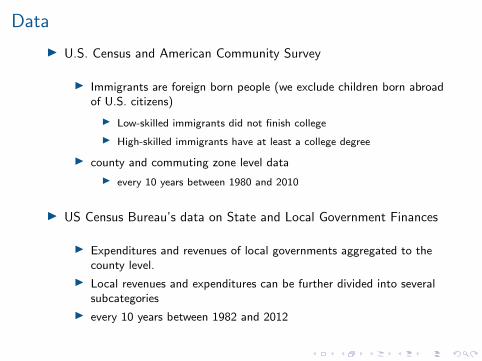
Data
I U.S. Census and American Community Survey
I Immigrants are foreign born people (we exclude children born abroadof U.S. citizens)
I Low-skilled immigrants did not finish college
I High-skilled immigrants have at least a college degree
I county and commuting zone level data
I every 10 years between 1980 and 2010
I US Census Bureau’s data on State and Local Government Finances
I Expenditures and revenues of local governments aggregated to thecounty level.
I Local revenues and expenditures can be further divided into severalsubcategories
I every 10 years between 1982 and 2012
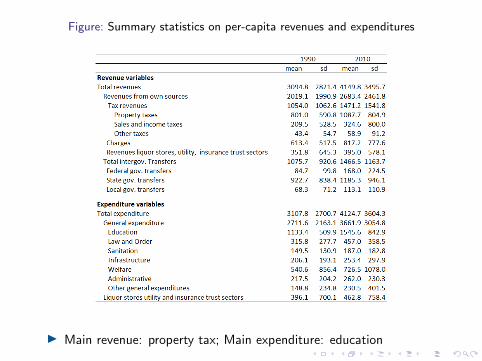
Figure: Summary statistics on per-capita revenues and expenditures
I Main revenue: property tax; Main expenditure: education
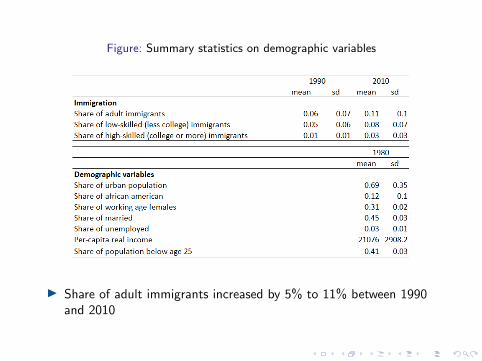
Figure: Summary statistics on demographic variables
I Share of adult immigrants increased by 5% to 11% between 1990and 2010
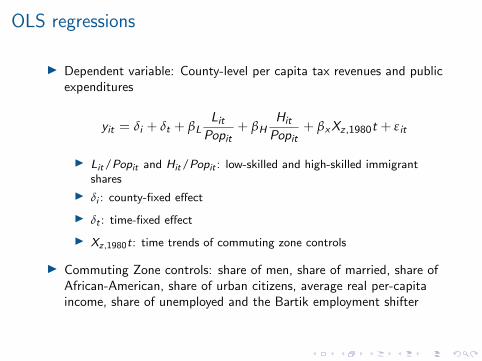
OLS regressions
I Dependent variable: County-level per capita tax revenues and publicexpenditures
yit = δi + δt + βLLit
Popit+ βH
Hit
Popit+ βxXz,1980t + εit
I Lit/Popit and Hit/Popit : low-skilled and high-skilled immigrantshares
I δi : county-fixed effect
I δt : time-fixed effect
I Xz,1980t: time trends of commuting zone controls
I Commuting Zone controls: share of men, share of married, share ofAfrican-American, share of urban citizens, average real per-capitaincome, share of unemployed and the Bartik employment shifter
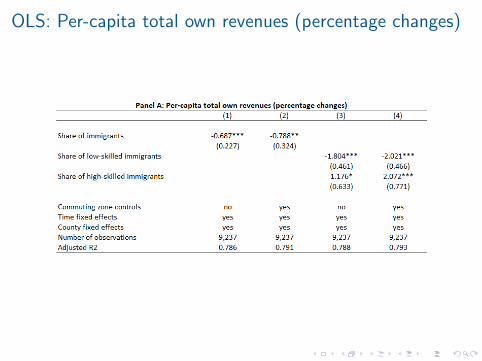
OLS: Per-capita total own revenues (percentage changes)
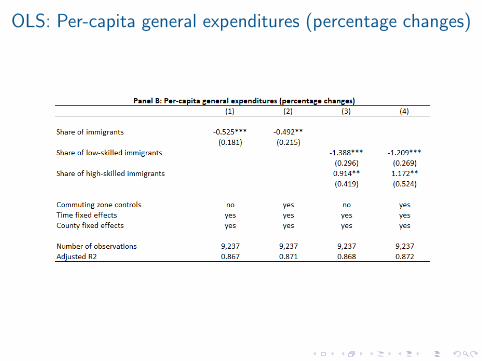
OLS: Per-capita general expenditures (percentage changes)

IV strategy: Card instrument
The IVs for the low-skilled and high-skilled immigrant shares are:
Lit
Mit + Nit
andHit
Mit + Nit
where
Lit = ∑c
(shc,i ,1980Lct) and Hit = ∑c
(shc,i ,1980Hct)
Mit = ∑c
(shc,i ,1980Mct) and Nit = (shUS,i ,1980Nt)
I Lct is the number of low-skilled immigrants from country c in year t
I Hct is the number of high-skilled immigrants from country c in year t
I Mct is the number of immigrants from country c in year t
I Nt is the number of natives in year t
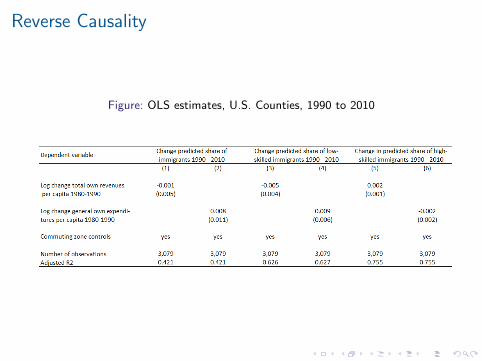
Reverse Causality
Figure: OLS estimates, U.S. Counties, 1990 to 2010
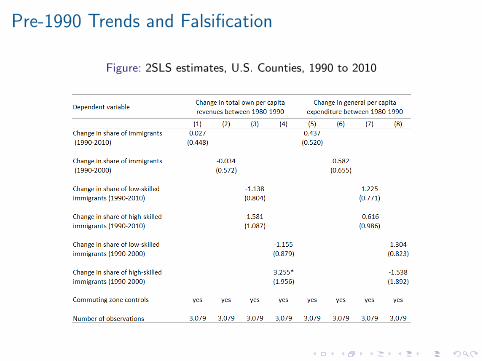
Pre-1990 Trends and Falsification
Figure: 2SLS estimates, U.S. Counties, 1990 to 2010

Further robustness on IV strategy
I Endogeneity of initial shares (Pinkham-Goldberg, Sorkin and Swift2020)
I Countries with highest weights are Mexico for low-skilled and LatinAmericans for high-skilled
I No significant correlation between initial shares and fiscal variables
I Shock representation (Borusyak, Hull and Jaravel 2020)
I Estimate a shock-equivalent representation (country of origin in ourcase)
I Our results are similar and coefficients not significantly different fromcounty level
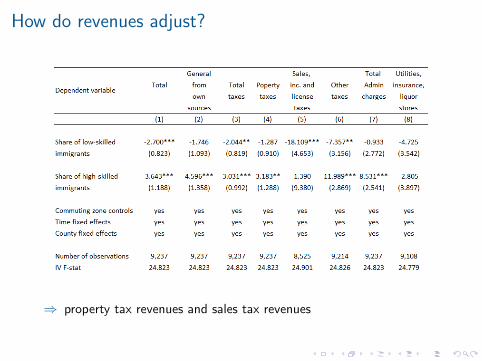
How do revenues adjust?
⇒ property tax revenues and sales tax revenues
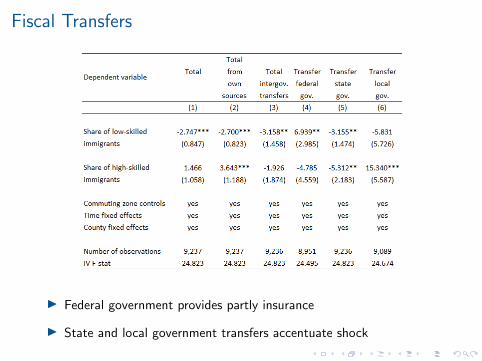
Fiscal Transfers
I Federal government provides partly insurance
I State and local government transfers accentuate shock

Adjustments on benefits by expenditure type
I No change in education expenditures
I Welfare, infrastructure and law and order adjust
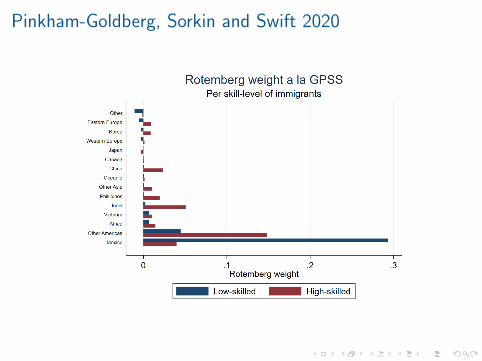
Pinkham-Goldberg, Sorkin and Swift 2020

Initial county shares by country of origin: revenues
Figure: OLS estimates, U.S. Counties, 1990 to 2010
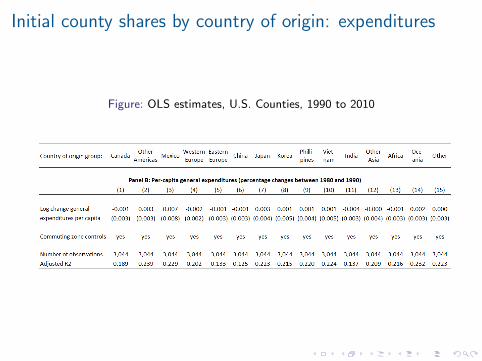
Initial county shares by country of origin: expenditures
Figure: OLS estimates, U.S. Counties, 1990 to 2010
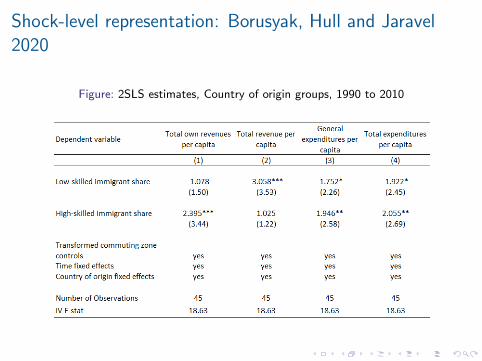
Shock-level representation: Borusyak, Hull and Jaravel2020
Figure: 2SLS estimates, Country of origin groups, 1990 to 2010