
THE IMPACT OF IMMIGRATION ON THE JAPANESE ECONOMY… · The Impact of Immigration on the Japanese...
76
DP RIETI Discussion Paper Series 09-E-020 The Impact of Immigration on the Japanese Economy: A multi-country simulation model SHIMASAWA Manabu Akita University OGURO Kazumasa RIETI The Research Institute of Economy, Trade and Industry http://www.rieti.go.jp/en/
Transcript of THE IMPACT OF IMMIGRATION ON THE JAPANESE ECONOMY… · The Impact of Immigration on the Japanese...

DPRIETI Discussion Paper Series 09-E-020
The Impact of Immigration on the Japanese Economy:A multi-country simulation model
SHIMASAWA ManabuAkita University
OGURO KazumasaRIETI
The Research Institute of Economy, Trade and Industryhttp://www.rieti.go.jp/en/

1
RIETI Discussion Paper Series 09-E-020
THE IMPACT OF IMMIGRATION ON THE JAPANESE ECONOMY:
A MULTI-COUNTRY SIMULATION MODEL1
Abstract To quantify the impacts of immigration on the Japanese economy, we present a large-scale numerical
dynamic equilibrium model with OLG and a total of 16 countries and regions, both those that are
industrialized including Japan, the U.S. and EU, and developing countries China, Brazil, the Philippines
and Peru.
Our simulation results show that immigration will improve the Japanese economy. Specifically,
annual immigrant flows of 150,000 will dramatically improve the welfare of current and future
generations. On the other hand, we can’t expect a significant long-run improvement in welfare solely by
implementing a policy increasing the consumption tax. The results indicate that substantially increased
inflows of working-age immigrants would alleviate the need for future fiscal reform and also help to
dramatically reduce the public pension burden on the working generations.
JEL classification: C68; D9; E62; H5; H6; H55 Keywords: Computable general equilibrium (CGE) model; overlapping generations (OLG); aging; immigration
Manabu Shimasawa Associate Professor, Akita University, Japan
Kazumasa Oguro Consulting Fellow, Research Institute of
Economy, Trade and Industry,
Ministry of Economy, Trade and Industry
and Research Fellow, Institute for International
Policy Studies, Japan [email protected]
1 This paper is a revised version of one that was presented at the Investigative Meeting of RIETI Discussion Papers on April 13, 2009. We are grateful for helpful comments and discussion from Masahisa FUJITA, Keiichiro KOBAYASHI, Daigo NAKATA, Masato YAMADA, and the meeting participants. Finally, the opinions expressed in this paper are those of the authors and do not represent the views of the organizations to which we belong. Any remaining errors are the responsibility of the authors.

2
1. Introduction Industrialized countries are now facing unprecedented demographic changes that require extensive reform in fiscal systems, social security systems, and other related programs. However, due to conflicting interests between younger and older generations, reform may be restricted. As an example, in order to improve the sustainability of a pay-as-you-go pension system,
the government has the option of reducing the benefits to the elderly or increasing the burden on the
working generation. Obtaining agreement on reform by both generations is often too difficult for the
government to achieve.
Most industrialized countries have explicit immigration policies, but Japan is an exception in
that its policy has not been articulated. To address this shortcoming, the ruling Liberal Democratic
Party (LDP) recently proposed the introduction of an explicit immigration policy as swiftly as
possible. The LDP suggested that an increase in immigration would improve the welfare of both the
current and future generations. Moreover, certain economic organizations including Japan's largest -
Nippon Keidanren (Japan Business Federation) - also insist that receiving immigrants will maintain
the sustainability of the social security system and avert the expected decline in economic growth.
To date, however, these proposals have not been fully evaluated.
The aim of this paper, therefore, is to quantify the impacts of immigration on the Japanese
economy. To this end, we use a large-scale numerical dynamic equilibrium model with overlapping
generations (OLG) and multiple countries/regions. The 16 total countries observed include both
industrialized countries and regions such as the U.S. and EU as well as developing countries such as
China, Brazil, the Philippines, and Peru.
The pioneering OLG model was built by Auerbach and Kotlikoff (1987). Since then, OLG
models have been used extensively to study the impact of population aging and to evaluate various
policy changes including tax policy, pension policy, and public debt policy.
To our knowledge, there are only three A-K type OLG simulation models using multiple
countries to evaluate the effects of global aging on international capital flows and the worldwide
economy, namely, Fehr et al. (2004), Börsch-Supan et al. (2006), and Aglietta et al. (2007).
Fehr et al. (2004) and Börsch-Supan et al. (2006) incorporate only industrialized countries in their model. And even though Aglietta et al. (2007) include both industrialized and developing countries, only 19 generations are contained in their model. Moreover, all three of these models have the same values of deep parameters such as utility and production.
This study, however, models a total of 16 industrialized and developing countries covering 65 generations with different values of deep parameters depending on their status.
Storesletten (2000) has calibrated a general equilibrium OLG model of the U.S. economy by
explicitly taking into account the differences between immigrants and natives to estimate the
long-run fiscal impact of immigrants. He found that the fiscal impact of immigration on the host
3
country is positive, even taking into consideration the age and skills of the new immigrants.
Meanwhile, Fehr et al. (2004) have developed a three-region (U.S., Japan and the EU) dynamic
general equilibrium OLG model to analyze whether immigration can alleviate the negative impacts
of demographic transition on an economy. They concluded that immigration will not alter the major
negative impacts regardless of the skill level of immigrants.
However, our result is different from that of Fehr et al. (2004) in that their model is based on
immigrants coming from countries outside of the model. Therefore, they haven’t included the effects
that the demographic changes of the immigrant supply countries have on the three regions (U.S.,
Japan and the EU) through the international capital flows caused by the changes in the capital labor
ratios of the out-migration countries. To illustrate, we consider two cases in which there are only two
countries, A and B. In the first case, part of the working generation emigrates from country A to
country B, and in the second case part of the working generation comes from outside of both
countries to country B. In the first case, the capital labor ratio of A has rising pressure and that of B
has falling pressure (See Figure 1). On the other hand, in the second case the capital labor ratio of A
has no pressure and the capital labor ratio of B has only falling pressure (Figure 2). For this reason,
after capital market equilibrium there exists the possibility that the capital labor ratio of B in the first
case would be higher than that in the second case. As a result, in the first case, there also exists the
possibility that the capital labor ratio of B, after immigration, could be close to that before
immigration.
In addition, it is important to analyze the differences in the effects of the following immigration
policies: 1) the first policy where an increase in immigration is permanent; and 2) the second policy
where an increase in immigration is temporal. It is also important to evaluate the differences in the
timing of the increases in immigration. However, Fehr et al. (2004) have not analyzed the differences
in these effects.
A vast number of studies has also been devoted to the problem of aging in Japan using the OLG
model, such as Homma et al. (1987), Kato (1998, 2002), Sadahiro and Shimasawa (2001, 2003),
Okamoto (2005), and Ihori et al. (2006). They found that as the life-cycle hypothesis of consumption
behavior serves a crucial role in the model in line with the A-K type OLG model, population aging
leads to a sharp reduction in the savings rate, affects capital formation, factor prices, and therefore
the national economy by mirroring the shrinking size of the working-age population. Their
simulations showed that there is no easy way to reduce the burden of the increasing number of older
people relative to those of working age, although policy reforms can alleviate the economic burden
of an aging population.
Even though various policy reforms to cope with aging - reduced pension benefits, increased
taxes, and lower public debt - are considered in those studies, to the best of the authors’ knowledge
no research has yet been carried out to quantify the effects of immigration on the Japanese economy

4
by using a general equilibrium model with an OLG structure. To date, immigration has not been
considered as a policy instrument to cope with aging in Japan.
Therefore, in this paper we use a general equilibrium OLG model calibrated to the Japanese
economy to quantitatively evaluate the effects of immigration policies, which are gaining attention
as a potential instrument for coping with aging of the population. Multiple countries including the
immigrant supply regions of China, South Korea, the Philippines, and Peru are considered in our
analysis. By doing this we attempt to answer whether a fundamental change in immigration policy
results in significant positive effects on the Japanese economy, especially in terms of the government
and public pension fiscal situation.
The results show that a substantial increase in the inflow of working-age immigrants would
alleviate the need for future fiscal reform. Furthermore, our findings indicate that immigration would
also help to dramatically reduce the public pension burden on working generations.
The structure of this paper is as follows. In Section 2, we review the immigration control in
Japan; Section 3 describes the model structure; Section 4 presents the calibration strategy and our
findings; and Section 5 contains concluding remarks and policy implications.
2. Background of Immigration Control In this section, we review the outline and discussion of immigration control in Japan.
At present, Japan does not have an explicit immigration policy, but immigration control in
Japan is conducted in accordance with the Immigration Control and Refugee Recognition Act and
the Alien Registration Law. Under these regulations, the Immigration Bureau in the Ministry of
Justice is responsible for the administration of immigration affairs, which includes the clearing of
foreign nationals entering and leaving Japan and overseeing the residency status of foreigners living
in Japan.
Based on the alien registration system operated by the Immigration Bureau, all foreign residents
are required to register at their local municipal office within 90 days of arrival in Japan. This policy
does not include temporary foreign visitors who leave Japan within three months without registering.
Therefore, the data on foreign nationals registered in Japan contains statistics on those who stay in
excess of three months for such purposes as study, employment, marriage or other family
relationships, and live a “settled life” in the local community.
According to the statistics published by the Ministry of Justice in 2008, the total number of
registered foreign nationals residing in Japan has increased every year and totaled 2,152,973 as of
the end of 2007. The proportion of registered foreign nationals to the total Japanese population has
also increased every year to 1.69% in 2007. According to the statistics, by nationality (place of
origin) the most registered foreigners come from China, who exceeded the number from the Korean

5
peninsula for the first time in 2007. Registered foreigners from the Korean peninsula make up the
second largest percentage, followed by Brazil, the Philippines, and Peru.
The United Nations Population Division (2000) has analyzed several immigration scenarios by
which a country could prevent the decline and aging of population that results from low fertility and
mortality rates. The report deals with low-fertility countries, such as France, Germany, Italy, Japan,
Republic of Korea, the United Kingdom, the United States, etc., and two regions: Europe and the
European Union. The immigration scenarios for the period 1995–2050 focus on the impact that
various levels of immigration have on population size and population aging. The report contains
three main findings: 1) In the next 50 years, the populations of most industrialized countries are
projected to become smaller and older as a result of low fertility and increased longevity; 2) in
contrast, the population of the United States is projected to increase by almost a quarter; and 3)
population decline in Japan is inevitable in the absence of replacement migration, even if fertility
rebounds in the coming decades.
With regard to this issue, the ruling Liberal Democratic Party (LDP) in Japan recently proposed
that Japan introduce an explicit immigration policy as swiftly as possible and receive 10 million
immigrants in the next 50 years (a net inflow of 200,000 annual immigrants per year), a number
significantly greater than the 68,054 net inflow measured in 2007. The proposed policy is expected
to aim for an increase in immigration to improve the welfare of both current and future generations.
3. The Model Structure In this section, we describe the demographic and economic structure of our model. The model used
here is a computable general-equilibrium OLG model with perfect foresight agents, multiple periods
and multiple countries. In our model, there is a representative individual for each generation in the
households sector. Each individual at age 20 maximizes his/her inter-temporal utility function with
consumption and bequest. The representative competitive firm has a standard Cobb-Douglas
production technology and maximizes its profits. In our model, not only the goods market but also
factor markets are perfectly competitive. The model has mainly five building blocks: 1) demographic
projection, 2) household behavior, 3) firm behavior, 4) the government, and 5) the public pension.
Details of each block follow. To limit notation, we suppress regional indices to the extent possible.
Initial values and parameters for these building blocks will be described in Section 4.
(1) Demographic projection In our model, we deal with a demographic projection as exogenous. In each region, the size of
total population of age j in the period t, jtN , is given recursively by:
jtjtjt MNN ,1,1, += −− 0>jfor , jtj jtt NfN ,1
50
16 ,0, −=∑= and ∑= j jtt MMM , (1)
6
where jtM , denotes the migration in j age-cohort at the time t, jtf , the age-specific fertility rate, and
tMM the aggregate net migration in the period t.
In addition, to simplify calculations in our model we don’t distinguish between natives and
immigrants in the model once the immigrants have entered the age specific group of the host
country.
(2) Household behavior There is a representative individual for each generation in the household sector. We assume that
preferences are the same for all agents in all generations. Moreover, each individual lives for a fixed
number of periods. In each period of the model, the oldest generation dies and a new one enters. And
the representative individuals maximize their inter-temporal utility function with consumption and
bequest subject to their lifetime income. They are also assumed to be rational, having perfect foresight. In the mth region, each generation enters the labor market at age 21, retires at age mQ , is
granted a pension at mQ +1, and dies at age mZ . In addition, each supplies labor inelastically. The
within-period utility function exhibits constant relative risk aversion, and preferences are additive
and separable over time. In each region, the utility functions of the ith generation are specified as:
γρς
γρ
γγ
-1q
11
-1c
11U
-1i
21-Z20Z
1j
-1ji,
1-j
i ⎟⎟⎠
⎞⎜⎜⎝
⎛+
+⎟⎟⎠
⎞⎜⎜⎝
⎛+
= ∑−
=
(2)
where j refers to the jth period of life, ρ the pure rate of time preference, γ the reverse of the
elasticity of inter-temporal substitution, and ς the bequest motive. The arguments of the utility
function are the consumption per period ( jic , ) and the bequest at the death period ( iq ). Leisure does
not enter the utility function since the individual’s labor supply is assumed to be exogenous.
Moreover, the technological progress λ is assumed to be exogenous and labor embodied. We
model age-specific labor productivity by assuming a hump-shaped age-earnings profile, i.e., a
quadratic form of its age j, so its age-wage profile ej takes the following form: 0 and 0 , , jje 210
2210j ≤≥++= θθθθθθ (3)
The inter-temporal budget equation of each generation may be described as follows:
∑∑=
−−=
Ω+++20-Z
19-Qj)21(j , ij , ij
tt
20-Q
1jttj , i /pPDVe)1(w)p-w-1(PDV iZiqλττ
i20- Z, i
20-Z
1jtj , ij , i )q1(PDV)c1(cPDV bττ +++=∑
=
(4)
where PDV refers to the factor of the present discounted value, wt is the wage rate at time t≡i+j-1, ej is the wage profile at age j, twτ is the labor income tax rate at time t, tpτ is the public pension
contribution rate at time t, λ measures the rate of technical progress, iΩ is the population ratio of
generation i to generation i-(Z-21), tcτ is the consumption tax rate at time t, bτ is the inheritance tax
rate, and pi,j stands for the pension benefit of generation i at age j.

7
Each generation maximizes its utility function (2) under the budget constraint (4).
With the maximization procedure, i.e. differentiating the household utility function (2) with respect to j , ic and iq , subject to the individual’s life-time budget constraint (4), yields the
following Euler equations concerning consumption per period.
∑=
=⎭⎬⎫
⎩⎨⎧
++
⎭⎬⎫
⎩⎨⎧
++
=20-Z
1jj , ij ,t t1-j , i
1
t
1-t
1
ttj , i cNC , c
c1c1
1)r-1(r1c
γγ
ττ
ρτ (5)
where rt is the interest rate at time t, trτ is the tax rate on interest income at time t, Nt,j measures the
number of people at age j in period t, and Ct is the aggregated consumption at time t. This Euler
equation dictates, as in any life-cycle model, that the trade-off between current and future is
determined by the ratio of the interest rate and the time preference rate, and by the degree of risk
aversion.
We can also derive the following physical wealth accumulation equation:
{ } ∑=
=++++=20-Z
1jji,jt, tji,tj
tttttt1-ji,ji, aNPA , c)c1(-e)1(w)p-w-1()r-1(r1aa τλτττ (6)
where ai,j is the physical wealth asset of generation i at age j and PAt is the aggregated private asset
in period t.
(3) Firm behavior The input/output structure is represented by the Cobb-Douglas production function with
constant return to scale. The firm decides its demand for physical capital and effective labor in order
to maximize its profit with the given factor prices of wage and rent, which are determined in the
perfect competitive markets. LAKY -1
t, ettαα= (7)
1-ttt K)-1(IK δ+= (8)
where Y is output, α stands for capital income share, A is a scale parameter, δ is the depreciation of
physical capital, K is the physical capital stock, and Le is the effective labor.
We can derive two factor prices, the rate of return rt and the wage rate per unit of effective labor
wt, by the first-order conditions for a firm’s maximum profit: αααα αδα -
t, ett-1
t, e1-
tt LAK)-1( w, -LAKr == (9)
(4) The Government The government sector has three types of taxes: wage tax, consumption tax and capital tax. It issues
public debt to supplement its tax revenue and pays the consumption, investment, and interest
payments as expenditures.

8
{ } ∑∑∑===
+++=20-Z
1jjt,ji,t
20-Z
1jjt,ji,t
20-Q
1jjt,j
tttt NarNccNe)1(wwT ττλτ (10)
We keep all tax rates constant.
The role of the government is to endogenously determine the rate of the public debt issue as a
residual of government expenditure and revenue.
t1-tt
ttt
Bond)D1(DT-GBond++=
=
tr (11)
where Bondt is the public debt issue at time t, Gt stands government expenditure at time t, Tt denotes
tax revenue at time t, Dt denotes public debt at time t.
As mentioned above, the public debt issue is set endogenously due to the difference between
expenditure and tax revenue. It should be noted that the public debt issue to GDP ratio will change
over time as a result of possible imbalances between revenues and expenditures. Thus we don’t
know whether the fiscal policy of a country is sustainable and whether the government’s
inter-temporal budget constraint must be satisfied.
(5) The public pension The pension sector grants a pension to the retirement generations while pension contributions
are collected from the working generations.
∑=
+=20-Q
1jj ,t j
tttt Ne)1(wpP λτ (12)
where P stands for the aggregated pension contribution.
The aggregated pension benefits at time t are given by the product of the population of retirement age, replacement rate, and average earnings during their working time jW .
j ,t j
20-Z
19-Qjt NW B ∑
=
= β (13)
where β denotes replacement rate and B is the aggregated pension benefit.
We explicitly model the public pension system as pay-as-you-go. The budget constraint of the
pension sector can be shown as follows:
tt )1(P Bsp−= (14) where sp denotes a public pension subsidy, which is financed by government expenditure Gt.
Moreover, we assume that the public pension sector maintains a fixed replacement rate
exogenously. As a result, in our model, the pension contribution rate is endogenously determined in
order to keep the budget constraint (14).
(6) World equilibrium First, in our model of an open economy, market clearing on the international capital market and

9
the assumption of perfect capital mobility across regions requires that the rate of return on financial
investment is equal across all countries:
~
tmt
mt rr)r-1( =τ (15)
where m denotes the mth region. And the aggregate value of world assets equals the market value of
worldwide capital stocks plus the value of all outstanding regional government bonds:
∑∑∑ ===+=
n
1m
mt
n
1m
mt
n
1m
mt DKPA (16)
where m denotes the mth region, and n the total number of regions, which is 16 in our model.
Next, the sum of the aggregate net migration of the mth region across all world regions equals
zero:
0MM1m
mt =∑ =
n (17)
Finally, in order to close the model structure logically, an equilibrium condition must hold in
the goods market. It requires that the aggregate worldwide supply be equal to total worldwide
demand.
{ }∑∑ = +=++=
nn
1m
mt
mm1t
mt
mt1m
mt K)-1(-KGCY δ (18)
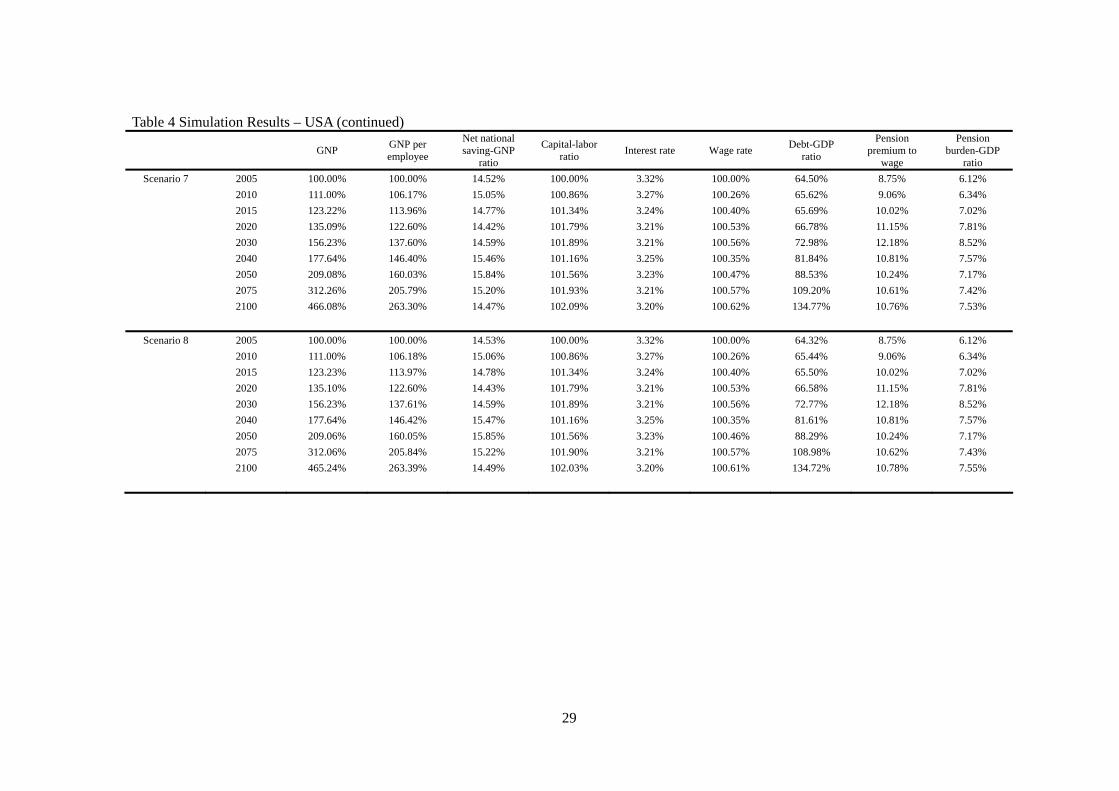
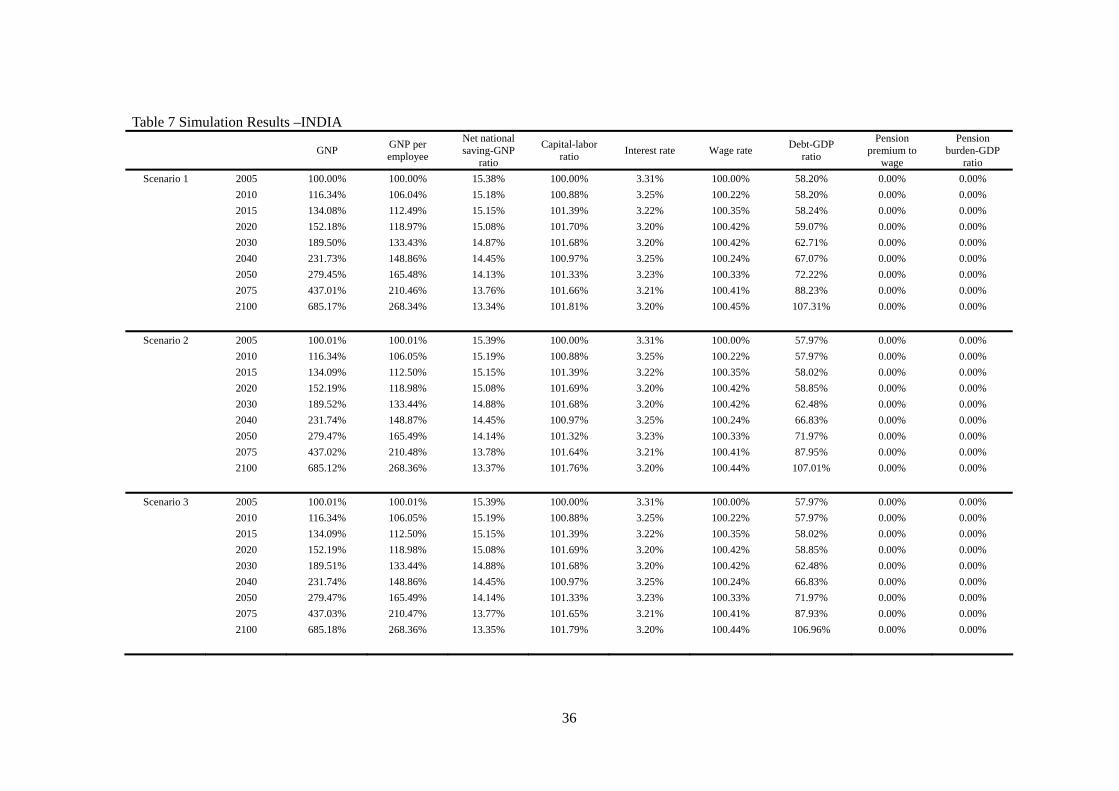
4. The Data, Calibration, and Scenarios 4.1. Data and calibration In order to analyze the differences among the effects of several immigration policies, we distinguish
between 16 world countries/regions: 1) Japan, 2) the U.S., 3) China, 4) South Korea, 5) India, 6)
Indonesia, 7) Bangladesh, 8) Philippines, 9) Thailand, 10) Vietnam, 11) Brazil, 12) Peru, 13)
Australia, 14) Canada, 15) Europe, and 16) Rest of World. With the exception of the United States,
Europe, and Rest of World, the above regions are immigration suppliers to Japan according to the
statistics of registered foreign nationals published by the Ministry of Justice, Japan.
Our demographic projection model for these regions is calibrated to fit the United Nations
(2007) projections. UN population data for 1950–2050 are given at an annual frequency for five-year
age groups. Moreover, data such as age-specific fertility rates is given only at quinquennial
frequency. Therefore, we interpolate between age groups and time intervals and fit our population
model to the UN population data for the time period 1950–2050. To simplify the calculation, we
assume that age-specific fertility rates are constant at the current level.
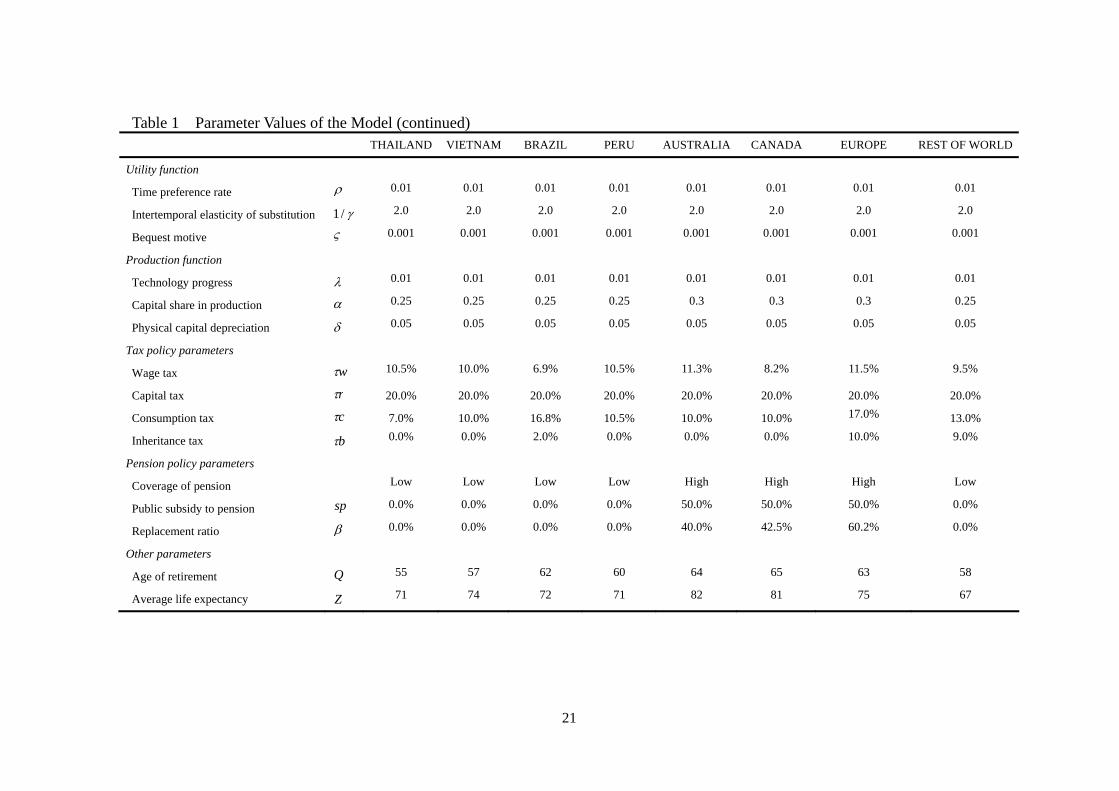
In addition, we present the values of the main parameters and exogenous variables of the model
in Table 1. The parameter values for the behavior of households and firms are derived from

10
Auerbach and Kotlikoff (1987) and various early OLG simulation studies in Japan.2 These
parameters, such as technological and preference parameters, are assumed to be constant and equal
across all regions, except capital share parameters which differ between developed and developing
regions.
The exogenous variables such as the macroeconomic, fiscal and public pension variables are
derived mainly from the OECD (2007) “Tax Database,” ISSA (2006–2008) “Social Security
Programs Throughout the World,” and Whitehouse (2007) “Pensions Panorama.”3
We start our calculations with a phase-in period of about 100 years in order to relax the
unrealistic assumption of a steady state in the 2006 base year of our simulation. Moreover, since the
model is simulated over 500 periods, we ensure a sufficiently long period for a steady state to be
achieved.
Table 2 reports the actual values of some key variables in 2005 and the computed values in the
model. Note that actual and calculated values closely correspond.
4.2. Scenarios Next we present simulation scenarios. The scenarios are classified into four categories. Scenario
1 assumes a no-immigration baseline case, and Scenarios 2-4 assume the arrival of 150,000
immigrants annually after 2015. Scenario 5 assumes the arrival of 750,000 immigrants annually after
2015. Scenarios 6 and 7 assume no immigration but an increase in the consumption tax to 20% and
30%, respectively, from 2015. Finally, Scenario 8 is the policy-mix of Scenario 2 (permanent
immigration) and Scenario 7 (30% consumption tax reform).
Scenarios 1-5 and 8 assume that the demographic structure of new immigrants in each age
group conforms with the current demographic structure of registered foreign nationals as published
by the Ministry of Justice, Japan. To quantify the impacts of the immigration flows, we break down
the cases of Scenarios 2-5 and 8 in more detail.
In Scenarios 2, 5 and 8, the increase of immigration in Japan is permanent from 2015. In
Scenario 3, the increase of immigration in Japan is temporal for 2015–2030. In Scenario 4, the
timing of the increase of immigration in Japan is different from that of Scenarios 2, 3, and 8. It starts
at 2025. We do not distinguish between natives and immigrants in the model once they have joined
the native Japanese population.
5. Simulation results We now turn to describe the simulation results reported in Figures 3-5 and Tables 3-19. For
2 See Homma et al. (1987), Kato (1998, 2002), Sadahiro and Shimasawa (2001, 2003), Uemura (2002), Okamoto (2005), Ihori et al. (2006). 3 In our model, due to the reason that detailed capital tax data were unavailable in some developing regions, capital tax variables are assumed to be equal to 20% across all regions.

11
tractability, we focus on Japan because its case is unique compared to other advanced countries
facing severe aging, such as Germany and Italy. In contrast to other countries, Japan has a very low
immigration rate and has traditionally admitted few immigrants. We present the results of the
immigration scenarios in comparison to the cases of no immigration flows, the case of consumption
tax reform, and the case of policy-mix (immigration and consumption tax reform) in Japan.
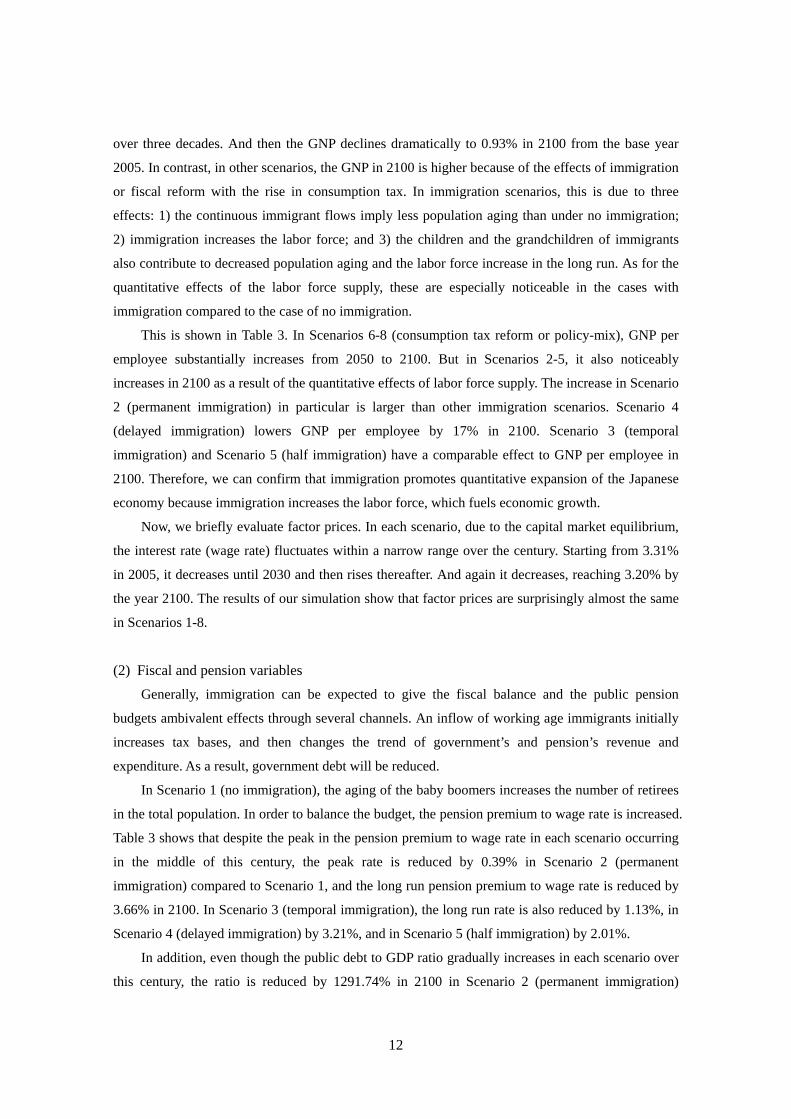
(1) Macroeconomic variables Immigration contributes to the rise in the working age population rate and to the reduction in
the ratio of older people (65 years old and above). In Scenarios 2-4 and 8, we consider an annual
flow of 150,000 immigrants. In 2100, the proportion of immigrants reaches 37% of the total
population of Japan in Scenarios 2 and 8, 16% in Scenario 3, and 29% in Scenario 4 (See Figure 3).
In Scenario 5 with an annual flow of 75,000 immigrants, in 2100 the proportion of immigrants
reaches 21% of the total population of Japan.
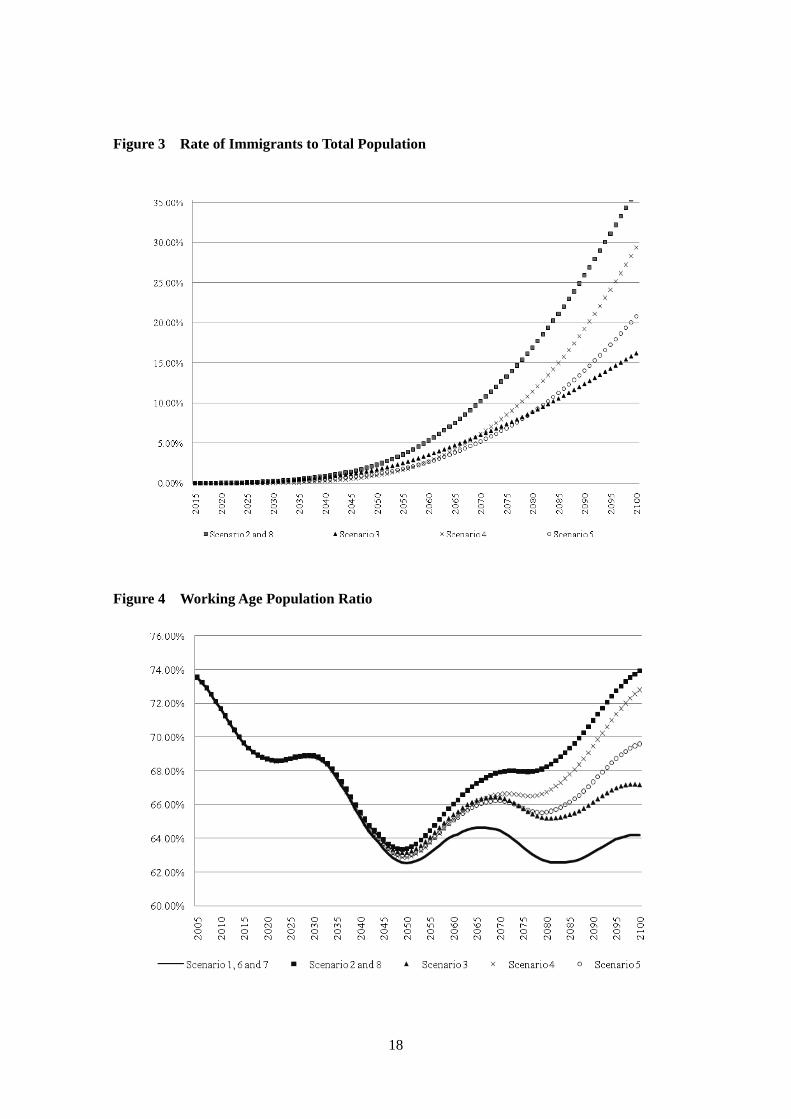
Figure 4 shows the transition of the working age population ratio. In the case of no immigrants,
it declines substantially over the next 100 years. However, in each immigration scenario, the
working age population ratio increases gradually from 2050. Figure 5 shows the retired population
ratio. While the ratio continues to increase to 37% in the long run without immigration, in each
immigration scenario the retired population increases at a lower rate because immigration mitigates
the progress in aging and lowers the elderly population ratio by a few points in 2100, i.e., to 10% in
Scenarios 2 and 8, 3% in Scenario 3, 9% in Scenario 4, and 5% in Scenario 5. Thus it can be seen
that the inflow of immigrants reverses the progress of population aging.
As we adopt the lifecycle hypothesis, the savings rate is severely affected by the rise of the
elderly population rate, which is strongly correlated with the demographic trend. In Scenarios 1-6,
there is no significant change in the savings rate trend during the simulation periods. But its level
differs in each scenario. In Scenario 1 (no immigration), the net national savings-to-GNP ratio shows
a tendency to decrease from 10.23% in 2005 to -2.70% in 2050, and to -45.71% in 2075. Table 3
shows that the rejuvenation of the population structure caused by the inflow of immigration raises
the savings ratio. In addition, Table 3 shows that the savings ratio in Scenario 6 (consumption tax
reform) is substantially higher and, unlike other scenarios, it does not set negative value until 2075.
The ratio of this scenario, however, also goes to a negative value in 2100. This means that in order to
make the savings ratio a positive value, it requires more fundamental fiscal reform such as a drastic
reduction of government debt or immigration. In fact, the savings ratio of Scenario 7 (30%
consumption tax reform) or Scenario 8 (policy-mix) does not go to a negative value in 2100.
Because of the assumed technology and lifecycle hypothesis, the GNP is determined mainly by
working-age population dynamics. In the baseline scenario, the GNP level grows stagnant. It
declines markedly from 2030 to 2100, reflecting the declining labor force, while it continues to rise
12
over three decades. And then the GNP declines dramatically to 0.93% in 2100 from the base year
2005. In contrast, in other scenarios, the GNP in 2100 is higher because of the effects of immigration
or fiscal reform with the rise in consumption tax. In immigration scenarios, this is due to three
effects: 1) the continuous immigrant flows imply less population aging than under no immigration;
2) immigration increases the labor force; and 3) the children and the grandchildren of immigrants
also contribute to decreased population aging and the labor force increase in the long run. As for the
quantitative effects of the labor force supply, these are especially noticeable in the cases with
immigration compared to the case of no immigration.
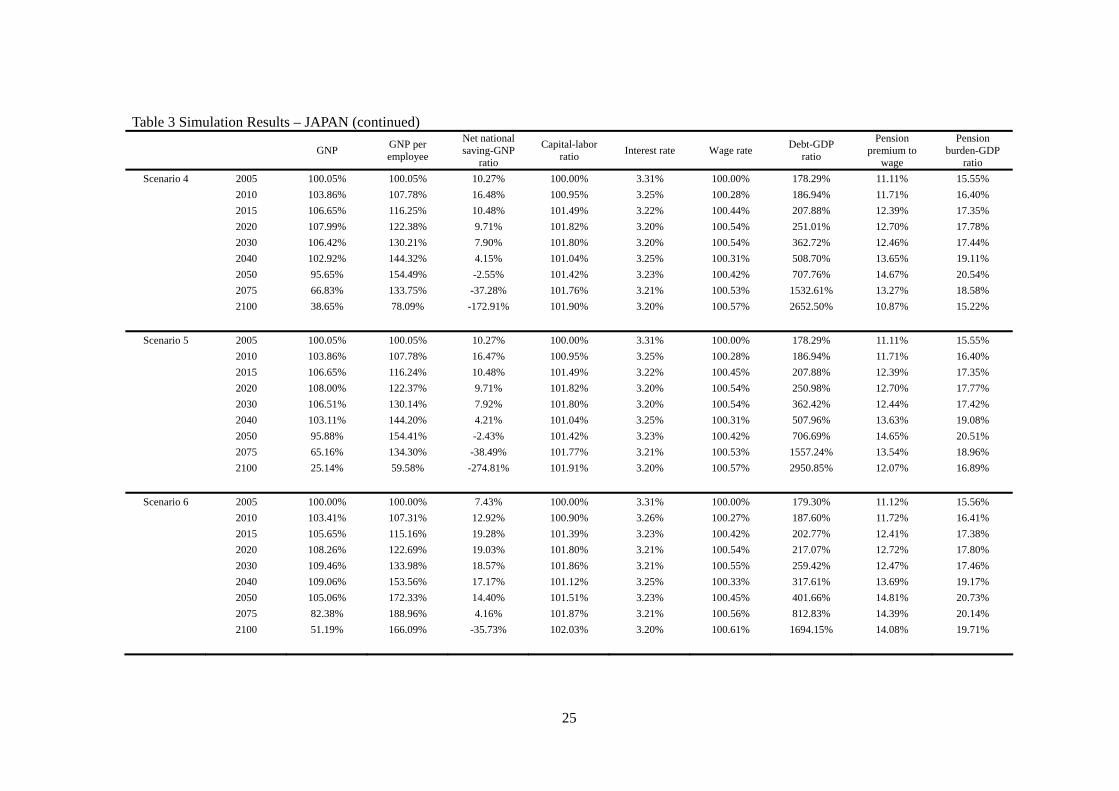
This is shown in Table 3. In Scenarios 6-8 (consumption tax reform or policy-mix), GNP per
employee substantially increases from 2050 to 2100. But in Scenarios 2-5, it also noticeably
increases in 2100 as a result of the quantitative effects of labor force supply. The increase in Scenario
2 (permanent immigration) in particular is larger than other immigration scenarios. Scenario 4
(delayed immigration) lowers GNP per employee by 17% in 2100. Scenario 3 (temporal
immigration) and Scenario 5 (half immigration) have a comparable effect to GNP per employee in
2100. Therefore, we can confirm that immigration promotes quantitative expansion of the Japanese
economy because immigration increases the labor force, which fuels economic growth.
Now, we briefly evaluate factor prices. In each scenario, due to the capital market equilibrium,
the interest rate (wage rate) fluctuates within a narrow range over the century. Starting from 3.31%
in 2005, it decreases until 2030 and then rises thereafter. And again it decreases, reaching 3.20% by
the year 2100. The results of our simulation show that factor prices are surprisingly almost the same
in Scenarios 1-8.
(2) Fiscal and pension variables
Generally, immigration can be expected to give the fiscal balance and the public pension
budgets ambivalent effects through several channels. An inflow of working age immigrants initially
increases tax bases, and then changes the trend of government’s and pension’s revenue and
expenditure. As a result, government debt will be reduced.
In Scenario 1 (no immigration), the aging of the baby boomers increases the number of retirees
in the total population. In order to balance the budget, the pension premium to wage rate is increased.
Table 3 shows that despite the peak in the pension premium to wage rate in each scenario occurring
in the middle of this century, the peak rate is reduced by 0.39% in Scenario 2 (permanent
immigration) compared to Scenario 1, and the long run pension premium to wage rate is reduced by
3.66% in 2100. In Scenario 3 (temporal immigration), the long run rate is also reduced by 1.13%, in
Scenario 4 (delayed immigration) by 3.21%, and in Scenario 5 (half immigration) by 2.01%.
In addition, even though the public debt to GDP ratio gradually increases in each scenario over
this century, the ratio is reduced by 1291.74% in 2100 in Scenario 2 (permanent immigration)

13
compared to Scenario 1. In Scenario 3 (temporal immigration), the ratio is also reduced by 582.29%,
in Scenario 4 (delayed immigration) by 1038.22%, in Scenario 5 (half immigration) by 739.87%, in
Scenario 6 (20% consumption tax reform) by 1996.57%, in Scenario 7 (30% consumption tax
reform) by 2997.55%, and in Scenario 8 (policy-mix) by 3331.28%.
The reason why year 2100 in Scenario 3 shows the smallest reduction in the rate of pension
premium to wage and public debt to GDP is due to temporal immigration and the increase in the
public pension burden caused by aging immigrants in the long run. That is to say, the government
and pension budgets improve the premium because of expansion of the tax base in the short run; but
when immigrants retire, the impacts on tax revenues and pension revenues would be expected to be
reversed. As aging immigrants increase pressure on pension expenditure and decrease tax revenues,
fiscal and pension balance will deteriorate.
(3) Welfare
Table 19 shows the generational welfare of Scenarios 1-8. These are the welfare values of
subsequent cohorts measured in terms of lifetime utility level the cohort born in 1930 gains in the
baseline simulation. The long-run increase in the pension premium to wage rate caused by the
progress of aging makes the amount of resources available within their lifetime decrease. The
long-run increase in the public debt to GDP ratio also reduces private capital stock available and
possibly decreases future growth. Current and future generations suffer a severe welfare loss.
In Scenarios 2-8 in Table 19, compared with Scenario 1, we measure the welfare of each
generation with equivalent variation. The welfare values of Scenario 1 gradually decline and this
scenario doesn’t have a bottom over the century, but Scenarios 2-5 have a bottom at the welfare of
the generation born in 2020, Scenarios 6 and 7 have a bottom, which is the welfare of the generation
born in 2055, and Scenario 8 also has a bottom at the welfare of the generation born in 2075.
In addition, in Scenario 2 the generations of Japanese born after 1970 obtain a welfare gain,
whose burden of pension and public debt is reduced by immigration intake. In particular, the welfare
of the generation born in 2080 dramatically increases by 20.5%. In Scenario 3, the welfare of the
generation born in 2080 increases by 5.1%, in Scenario 4 by 19.8%, in Scenario 5 by 13.3%, and in
Scenario 8 by 3.2%.
On the other hand, in Scenarios 6 and 7, the generations of Japanese born after 1940 suffer a
welfare loss whose burden is covered by an increase in consumption tax.
Therefore, from the comparison between the immigration scenarios, the consumption tax
reform scenario and the policy-mix scenario, we draw the following conclusion. Immigrants are
expected to make large net contributions to the Japanese economy. It is a very good policy for Japan
to receive immigration from the viewpoints of not only macroeconomic, fiscal, and pension
variables but also welfare changes. This policy enlarges lifetime resources that benefit the current

14
and future generations, and reduces the excess burdens on the public pension system. In contrast, the
policy that only increases the consumption tax does not seem to be advantageous because it boosts
excess burdens arising from the extreme increase in taxes. Therefore, we will need a policy such as
Scenario 8 (policy-mix).
6. Concluding remarks In this paper, we presented an OLG simulation model using 16 countries and regions in order to
analyze the impact of immigration in Japan. Our simulation results show that immigration will
improve the Japanese economy. Specifically, annual immigrant flows of 150,000 will dramatically
increase the welfare of current and future generations. On the other hand, we can’t expect a
significant long-run welfare improvement solely from carrying out the policy of increasing the
consumption tax. If both the sustainability of the fiscal budget and the improvement of the welfare of
current and future generations are requirements, we will need to promote a policy such as policy-mix
with immigration and additional fiscal reform, i.e. increasing the consumption tax.
The weakness of our study is that this paper does not analyze three points: 1) the social cost of
immigration, such as the additional public education cost for immigrants’ children, 2) the difference
between the impact of high-skill and low-skill immigrants, and 3) the scenario in which the birthrate
of immigrants does not soon decline to the same level as that of natives when they have joined the
Japanese population. These points remain subjects for future study.
Finally, increasing immigration is not a simple matter. When implementing immigration policy
to support sustained economic growth even at a time of population aging, Japan will face enormous
difficulties. From the receiving perspective, can immigration flows of this order of magnitude be
sustained over an extended duration? From an immigrant perspective, is contemporary Japan
sufficiently attractive for foreigners to take on the challenge of language and cultural barriers? And
finally, would such an immigration policy exacerbate the brain drain that is already harming the
economies of out-migration countries, and therefore be met with strong resistance? Even given the
difficulty of the task, Japan, like other industrialized countries, must confront these and other
obstacles and solve the related issues to chart a productive and viable future for its immigrant and
native-born population.

15
References
Auerbach, A.J. and L.J. Kotlikoff. Dynamic Fiscal Policy. Cambridge University Press: Cambridge,
1987.
Cabinet Office. Kokumin Keizai Keisan Nenpo. Economic and Social Research Institute, Cabinet
Office, Government of Japan, Tokyo, 2008.
Fehr, Hans, Sabine Jokisch, and Laurence J. Kotlikoff (2004). “The Role of Immigration in Dealing
with the Developed World’s Demographic Transition.” FinanzArchiv 60(3): pp. 296–324.
Homma, M., N. Atoda, Y. Iwamoto and F. Otake (1987). Nenkin : KoureikaShakai to Nennkin Seido,
In Hamada, Horiuchi and Kuroda eds., Nihon Keizai no Macro Bunseki, Tokyo Daigaku
Shuppankai, Jun, pp.149–175 [in Japanese]
Ihori, T., Ryuta Ray Kato, M Kawade and Shun-ichiro Bessho (2006). “Public debt and economic
growth in an aging Japan,” K. Kaizuka and Ann O. Krueger, eds., Tackling Japan's Fiscal
Challenges: Strategies to Cope with High Public Debt and Population Aging. [in Japanese]
Kato, Ryuta R. (1998). “Transition to an Aging Japan: Public Pension, Savings, and Capital
Taxation,” Journal of the Japanese and International Economies vol. 12, pp. 204–231
Kato, Ryuta R. (2002). “Government Deficit, Public Investment, and Public Capital in the Transition
to an Aging Japan,” Journal of the Japanese and International Economies vol. 16,
pp.462–491.
Okamoto, A. (2005). “Simulating Progressive Expenditure Taxation in an Aging Japan,” Journal of
Policy Modeling 27 (3), 309–325.
OECD. Tax Database, Paris, 2007.
Sadahiro, A., and M. Shimasawa (2001). “Fiscal Sustainability and the Primary Surplus: A
Simulation Analysis with OLG Model,” JCER Economic Journal. No. 43. pp. 117–132. [in
Japanese]
________ and ________ (2003). “The computable overlapping generations model with an
endogenous growth mechanism,” Economic Modeling vol. 20 No. 1 pp. 1–24.
Storesletten, K. (2000). “Sustaining Fiscal Policy Through Immigration,” Journal of Political
Economy, vol. 108 (2), pp. 300-23.
________, (2003). “Fiscal Implications of Immigration—A Net Present Value Calculation,”
Scandinavian Journal of Economics., vol. 105 (3), pp. 487–506.
The International Social Security Association (ISSA). Social Security Programs Throughout the
World: Asia and the Pacific, 2006.
________. Social Security Programs Throughout the World: The Americas, 2007.
________. Social Security Programs Throughout the World: Europe, 2008.
Uemura, S. (2002). “Lifecycle General Equilibrium Analysis on Social Security,” Keizaironshu vol.
28, No. 1. [in Japanese]

16
United Nations Population Division. Replacement Migration: Is it a Solution to Declining and
Ageing Populations?, New York, 2000.
________. World Population Prospects: The 2006 Revision, New York, 2007.
Whitehouse, Edward. Pensions Panorama: Retirement-Income Systems in 53 Countries, The World
Bank, 2007.

17
Figure 1 Case 1 with Immigration from A to B (our model) Ar Br
2 3 1 Total capital
Figure 2 Case 2 with Immigration from Outside of Both Countries to B (Fehr et al. model) Ar Br
2 1 Total capital
Note: In Figures 1 and 2, jjjjjj
jLKAr δα α −≡ −1)/( represents the interest rate of j country (j=A,B), where
jα stands for capital income share, jA the scale parameter, jδ the depreciation of physical capital, jK the physical
capital stock, and jL the labor force. The dashed line represents the relationship between the interest rate and the
capital stock of each country before immigration, and the solid line their relationship after immigration. This assumes
that total capital )( BA KKK += is fixed and the equilibrium before immigration is Point 1 in Figure 1 and 2. The
equilibrium after immigration changes position as in Point 3 in Figure 1, because AL goes down and BL goes up. But
in Figure 2 this changes position as in Point 2, because BL only goes up. Therefore, the capital labor ratio after
immigration in the first case is higher than that in the second case.
Inte
rest
rate
In
tere
st ra
te
18
Figure 3 Rate of Immigrants to Total Population
Figure 4 Working Age Population Ratio

19
Figure 5 Elderly Population Ratio

20
Table 1 Parameter Values of the Model JAPAN USA CHINA S. KOREA INDIA INDONESIA BANGLADESH PHILIPPINES
Utility function
Time preference rate ρ 0.01 0.01 0.01 0.01 0.01 0.01 0.01 0.01
Intertemporal elasticity of substitution γ/1 2.0 2.0 2.0 2.0 2.0 2.0 2.0 2.0
Bequest motive ς 0.001 0.001 0.001 0.001 0.001 0.001 0.001 0.001
Production function
Technology progress λ 0.01 0.01 0.01 0.01 0.01 0.01 0.01 0.01
Capital share in production α 0.3 0.3 0.25 0.3 0.25 0.25 0.25 0.25
Physical capital depreciation δ 0.05 0.05 0.05 0.05 0.05 0.05 0.05 0.05
Tax policy parameters
Wage tax wτ 11.3% 11.3% 12.5% 12.8% 10.0% 10.0% 6.3% 9.3%
Capital tax rτ 20.0% 20.0% 20.0% 20.0% 20.0% 20.0% 20.0% 20.0%
Consumption tax cτ 5.0% 5.0% 17.0% 10.0% 12.5% 10.0% 9.5% 6.3%
Inheritance tax bτ 25.0% 23.5% 0.0% 25.0% 0.0% 0.0% 0.0% 10.0%
Pension policy parameters
Coverage of pension High High Low High Low Low Low High
National subsidy to pension sp 50.0% 0.0% 0.0% 50.0% 0.0% 0.0% 0.0% 0.0%
Replacement ratio β 50.3% 38.6% 0.0% 58.5% 0.0% 0.0% 0.0% 0.0%
Other parameters
Age of retirement Q 65 66 60 60 58 55 62 60
Average life expectancy Z 82 78 73 79 65 71 64 72
21
Table 1 Parameter Values of the Model (continued) THAILAND VIETNAM BRAZIL PERU AUSTRALIA CANADA EUROPE REST OF WORLD
Utility function
Time preference rate ρ 0.01 0.01 0.01 0.01 0.01 0.01 0.01 0.01
Intertemporal elasticity of substitution γ/1 2.0 2.0 2.0 2.0 2.0 2.0 2.0 2.0
Bequest motive ς 0.001 0.001 0.001 0.001 0.001 0.001 0.001 0.001
Production function
Technology progress λ 0.01 0.01 0.01 0.01 0.01 0.01 0.01 0.01
Capital share in production α 0.25 0.25 0.25 0.25 0.3 0.3 0.3 0.25
Physical capital depreciation δ 0.05 0.05 0.05 0.05 0.05 0.05 0.05 0.05
Tax policy parameters
Wage tax wτ 10.5% 10.0% 6.9% 10.5% 11.3% 8.2% 11.5% 9.5%
Capital tax rτ 20.0% 20.0% 20.0% 20.0% 20.0% 20.0% 20.0% 20.0%
Consumption tax cτ 7.0% 10.0% 16.8% 10.5% 10.0% 10.0% 17.0% 13.0%
Inheritance tax bτ 0.0% 0.0% 2.0% 0.0% 0.0% 0.0% 10.0% 9.0%
Pension policy parameters
Coverage of pension Low Low Low Low High High High Low
Public subsidy to pension sp 0.0% 0.0% 0.0% 0.0% 50.0% 50.0% 50.0% 0.0%
Replacement ratio β 0.0% 0.0% 0.0% 0.0% 40.0% 42.5% 60.2% 0.0%
Other parameters
Age of retirement Q 55 57 62 60 64 65 63 58
Average life expectancy Z 71 74 72 71 82 81 75 67

22
Table 2 Year 2005 of the Baseline Scenario JAPAN USA CHINA S. KOREA INDIA INDONESIA BANGLADESH PHILIPPINES
Model
National Income (% of GNP)
Private consumption 81% 84% 68% 76% 81% 69% 92% 78%
Government purchases of goods and services 16% 13% 18% 16% 16% 13% 13% 12%
Current account 6% 6% 17% 10% 5% 20% -3% 12%
Net national saving 10% 14% 24% 19% 15% 28% 8% 23%
Government Indicators
Pension premium to wage 11% 9% 0% 10% 0% 0% 0% 0%
Gross public debt (% of GDP) 180% 64% 12% 25% 58% 34% 37% 56%
Primary balance (% of GDP) -2.71% 0.00% 0.50% -1.86% 0.09% 0.18% -0.02% -0.10%
Tax revenues (% of GNP) 13% 13% 18% 14% 17% 14% 13% 12%
Wage tax 7% 7% 9% 7% 8% 7% 5% 7%
Consumption tax 3% 3% 8% 5% 7% 4% 6% 3%
Capital tax 4% 3% 2% 3% 2% 2% 2% 2%
Other Indicators
Capital output ratio 254% 381% 543% 377% 357% 540% 258% 499%
Interest rate 3.3% 3.3% 3.3% 3.3% 3.3% 3.3% 3.3% 3.3%
Official
National Income (% of GNP)
Private consumption 74% 87% 50% 68% 70% 75% 78% 83%
Government purchases of goods and services 18% 16% 14% 14% 11% 8% 5% 9%
Current account 3.6% -6.1% 7.1% 1.9% -1.0% 0.1% -0.3% 1.9%
Net national saving 12.4% 0.3% 40.8% 18.6% 24.0% 16.9% 20.7% 19.4%
Government Indicators
Pension premium to wage 14.6%* 12.4%* - 9%* - - - -
Gross public debt (% of GDP) 175.3% 62.4% 22.8%** 24.7% 78.1%** 41.5%** 37.4%** 53.5%**
Primary balance (% of GDP) -5.9% -1.6% N.A 1.7% N.A N.A N.A N.A
Tax revenues (% of GNP) 12% 11% 9% 16% 10% 11% 8% 12% * ISSA (2006-2008) "Social Security Programs Throughout the World" ** S&P (2009) "Sovereign Risk Indicators"

23
Table 2 Year 2005 of the Baseline Scenario (continued) THAILAND VIETNAM BRAZIL PERU AUSTRALIA CANADA EUROPE REST OF WORLD
Model
National Income (% of GNP)
Private consumption 69% 70% 76% 75% 78% 81% 77% 79%
Government purchases of goods and services 12% 14% 15% 15% 14% 11% 18% 16%
Current account 21% 19% 12% 12% 11% 11% 9% 8%
Net national saving 28% 29% 21% 22% 21% 20% 14% 19%
Government Indicators
Pension premium to wage 0% 0% 0% 0% 11% 12% 19% 0%
Gross public debt (% of GDP) 38% 42% 45% 29% 17% 78% 77% 44%
Primary balance (% of GDP) 0.35% 0.03% 0.10% 0.05% 0.41% 2.57% 0.51% -0.09%
Tax revenues (% of GNP) 13% 14% 15% 15% 14% 13% 18% 16%
Wage tax 7% 7% 5% 8% 7% 5% 7% 7%
Consumption tax 3% 4% 8% 5% 5% 5% 8% 7%
Capital tax 2% 2% 2% 2% 2% 3% 3% 2%
Other Indicators
Capital output ratio 567% 572% 494% 473% 414% 426% 180% 403%
Interest rate 3.3% 3.3% 3.3% 3.3% 3.3% 3.3% 3.3% 3.3%
Official
National Income (% of GNP)
Private consumption 72% 70% 84% 81% 78% 76% N.A N.A
Government purchases of goods and services 12% 6% 21% 11% 19% 20% N.A N.A
Current account -4.6% 0.4% 1.7% 1.5% -5.8% 2.1% N.A N.A
Net national saving 19.0% 27.7% 4.6% 8.4% 7.1% 9.5% N.A N.A
Government Indicators
Pension premium to wage - - - - 9%* 9.9%* N.A N.A
Gross public debt (% of GDP) 26.3%** 39%** 56%** 23.3%** 16.7% 70.3% N.A N.A
Primary balance (% of GDP) N.A N.A N.A N.A 2.7% 2.6% N.A N.A
Tax revenues (% of GNP) 18% 17% 13% 14% 25% 15% N.A N.A
* ISSA (2006-2008) "Social Security Programs Throughout the World" ** S&P (2009) "Sovereign Risk Indicators"

24
Table 3 Simulation Results – JAPAN
GNP GNP per employee
Net national saving-GNP
ratio
Capital-labor ratio Interest rate Wage rate Debt-GDP
ratio
Pension premium to
wage
Pension burden-GDP
ratio Scenario 1 2005 100.00% 100.00% 10.23% 100.00% 3.31% 100.00% 180.21% 11.11% 15.55%
2010 103.80% 107.72% 16.43% 100.95% 3.25% 100.28% 189.03% 11.71% 16.40% 2015 106.58% 116.18% 10.43% 101.49% 3.22% 100.45% 210.18% 12.39% 17.35% 2020 107.91% 122.30% 9.67% 101.82% 3.20% 100.54% 253.55% 12.70% 17.78% 2030 106.30% 130.12% 7.88% 101.80% 3.20% 100.54% 366.02% 12.46% 17.44% 2040 102.55% 144.40% 4.13% 101.04% 3.25% 100.31% 514.01% 13.68% 19.15% 2050 94.56% 155.11% -2.70% 101.43% 3.23% 100.43% 719.21% 14.80% 20.72% 2075 57.68% 132.31% -45.71% 101.78% 3.21% 100.53% 1672.21% 14.39% 20.14% 2100 0.93% 3.02% -7833.90% 101.94% 3.20% 100.58% 3690.72% 14.08% 19.71%
Scenario 2 2005 100.05% 100.05% 10.27% 100.00% 3.31% 100.00% 178.29% 11.11% 15.55% 2010 103.86% 107.78% 16.46% 100.95% 3.25% 100.28% 186.94% 11.71% 16.40% 2015 106.64% 116.24% 10.46% 101.49% 3.22% 100.44% 207.87% 12.39% 17.35% 2020 108.00% 122.35% 9.68% 101.82% 3.20% 100.54% 250.94% 12.69% 17.77% 2030 106.63% 130.04% 7.88% 101.80% 3.20% 100.54% 361.99% 12.43% 17.40% 2040 103.54% 143.83% 4.17% 101.04% 3.25% 100.31% 505.95% 13.57% 19.00% 2050 97.07% 153.47% -2.32% 101.42% 3.23% 100.42% 699.42% 14.49% 20.29% 2075 72.95% 135.44% -32.79% 101.75% 3.21% 100.52% 1458.87% 12.73% 17.82% 2100 53.40% 95.42% -121.27% 101.88% 3.20% 100.56% 2398.98% 10.42% 14.59%
Scenario 3 2005 100.05% 100.05% 10.27% 100.00% 3.31% 100.00% 178.29% 11.11% 15.55% 2010 103.86% 107.78% 16.47% 100.95% 3.25% 100.28% 186.94% 11.71% 16.40% 2015 106.65% 116.24% 10.46% 101.49% 3.22% 100.45% 207.88% 12.39% 17.35% 2020 108.01% 122.35% 9.69% 101.82% 3.20% 100.54% 250.95% 12.69% 17.77% 2030 106.63% 130.05% 7.92% 101.80% 3.20% 100.54% 362.01% 12.43% 17.40% 2040 103.45% 143.94% 4.25% 101.04% 3.25% 100.31% 506.49% 13.59% 19.02% 2050 96.51% 154.01% -2.27% 101.42% 3.23% 100.42% 703.14% 14.57% 20.40% 2075 65.97% 135.29% -37.62% 101.77% 3.21% 100.53% 1549.31% 13.54% 18.95% 2100 19.29% 50.12% -363.29% 101.92% 3.20% 100.57% 3108.43% 12.95% 18.13%
25
Table 3 Simulation Results – JAPAN (continued)
GNP GNP per employee
Net national saving-GNP
ratio
Capital-labor ratio Interest rate Wage rate Debt-GDP
ratio
Pension premium to
wage
Pension burden-GDP
ratio Scenario 4 2005 100.05% 100.05% 10.27% 100.00% 3.31% 100.00% 178.29% 11.11% 15.55%
2010 103.86% 107.78% 16.48% 100.95% 3.25% 100.28% 186.94% 11.71% 16.40% 2015 106.65% 116.25% 10.48% 101.49% 3.22% 100.44% 207.88% 12.39% 17.35% 2020 107.99% 122.38% 9.71% 101.82% 3.20% 100.54% 251.01% 12.70% 17.78% 2030 106.42% 130.21% 7.90% 101.80% 3.20% 100.54% 362.72% 12.46% 17.44% 2040 102.92% 144.32% 4.15% 101.04% 3.25% 100.31% 508.70% 13.65% 19.11% 2050 95.65% 154.49% -2.55% 101.42% 3.23% 100.42% 707.76% 14.67% 20.54% 2075 66.83% 133.75% -37.28% 101.76% 3.21% 100.53% 1532.61% 13.27% 18.58% 2100 38.65% 78.09% -172.91% 101.90% 3.20% 100.57% 2652.50% 10.87% 15.22%
Scenario 5 2005 100.05% 100.05% 10.27% 100.00% 3.31% 100.00% 178.29% 11.11% 15.55% 2010 103.86% 107.78% 16.47% 100.95% 3.25% 100.28% 186.94% 11.71% 16.40% 2015 106.65% 116.24% 10.48% 101.49% 3.22% 100.45% 207.88% 12.39% 17.35% 2020 108.00% 122.37% 9.71% 101.82% 3.20% 100.54% 250.98% 12.70% 17.77% 2030 106.51% 130.14% 7.92% 101.80% 3.20% 100.54% 362.42% 12.44% 17.42% 2040 103.11% 144.20% 4.21% 101.04% 3.25% 100.31% 507.96% 13.63% 19.08% 2050 95.88% 154.41% -2.43% 101.42% 3.23% 100.42% 706.69% 14.65% 20.51% 2075 65.16% 134.30% -38.49% 101.77% 3.21% 100.53% 1557.24% 13.54% 18.96% 2100 25.14% 59.58% -274.81% 101.91% 3.20% 100.57% 2950.85% 12.07% 16.89%
Scenario 6 2005 100.00% 100.00% 7.43% 100.00% 3.31% 100.00% 179.30% 11.12% 15.56% 2010 103.41% 107.31% 12.92% 100.90% 3.26% 100.27% 187.60% 11.72% 16.41% 2015 105.65% 115.16% 19.28% 101.39% 3.23% 100.42% 202.77% 12.41% 17.38% 2020 108.26% 122.69% 19.03% 101.80% 3.21% 100.54% 217.07% 12.72% 17.80% 2030 109.46% 133.98% 18.57% 101.86% 3.21% 100.55% 259.42% 12.47% 17.46% 2040 109.06% 153.56% 17.17% 101.12% 3.25% 100.33% 317.61% 13.69% 19.17% 2050 105.06% 172.33% 14.40% 101.51% 3.23% 100.45% 401.66% 14.81% 20.73% 2075 82.38% 188.96% 4.16% 101.87% 3.21% 100.56% 812.83% 14.39% 20.14% 2100 51.19% 166.09% -35.73% 102.03% 3.20% 100.61% 1694.15% 14.08% 19.71%

26
Table 3 Simulation Results – JAPAN (continued)
GNP GNP per employee
Net national saving-GNP
ratio
Capital-labor ratio Interest rate Wage rate Debt-GDP
ratio
Pension premium to
wage
Pension burden-GDP
ratio Scenario 7 2005 100.00% 100.00% 5.74% 100.00% 3.32% 100.00% 178.75% 11.12% 15.57%
2010 103.17% 107.06% 10.77% 100.86% 3.27% 100.26% 186.74% 11.73% 16.42% 2015 105.07% 114.53% 23.77% 101.34% 3.24% 100.40% 199.07% 12.42% 17.39% 2020 108.33% 122.77% 23.76% 101.79% 3.21% 100.53% 199.80% 12.73% 17.82% 2030 110.96% 135.82% 23.83% 101.89% 3.21% 100.56% 208.59% 12.48% 17.48% 2040 112.28% 158.09% 23.32% 101.16% 3.25% 100.35% 222.79% 13.70% 19.18% 2050 110.33% 180.98% 21.98% 101.56% 3.23% 100.47% 246.63% 14.82% 20.74% 2075 94.93% 217.74% 19.73% 101.93% 3.21% 100.57% 385.34% 14.39% 20.14% 2100 76.84% 249.30% 12.65% 102.09% 3.20% 100.62% 693.17% 14.08% 19.71%
Scenario 8 2005 100.05% 100.05% 5.78% 100.00% 3.32% 100.00% 176.84% 11.12% 15.57% 2010 103.22% 107.12% 10.80% 100.86% 3.27% 100.26% 184.65% 11.73% 16.42% 2015 105.13% 114.59% 23.79% 101.34% 3.24% 100.40% 196.76% 12.42% 17.39% 2020 108.42% 122.83% 23.77% 101.79% 3.21% 100.53% 197.16% 12.72% 17.81% 2030 111.29% 135.73% 23.83% 101.89% 3.21% 100.56% 204.65% 12.46% 17.44% 2040 113.31% 157.40% 23.32% 101.16% 3.25% 100.35% 216.07% 13.59% 19.03% 2050 112.97% 178.60% 22.05% 101.56% 3.23% 100.46% 233.86% 14.51% 20.31% 2075 111.21% 206.47% 21.09% 101.90% 3.21% 100.57% 308.95% 12.73% 17.83% 2100 134.10% 239.62% 20.20% 102.03% 3.20% 100.61% 359.44% 10.42% 14.59%

27
Table 4 Simulation Results – USA
GNP GNP per employee
Net national saving-GNP
ratio
Capital-labor ratio Interest rate Wage rate Debt-GDP
ratio
Pension premium to
wage
Pension burden-GDP
ratio Scenario 1 2005 100.00% 100.00% 14.45% 100.00% 3.31% 100.00% 64.40% 8.74% 6.12%
2010 111.01% 106.19% 15.00% 100.95% 3.25% 100.28% 65.50% 9.04% 6.33% 2015 123.26% 114.00% 14.77% 101.49% 3.22% 100.45% 65.55% 10.00% 7.00% 2020 135.11% 122.61% 14.46% 101.82% 3.20% 100.54% 66.67% 11.13% 7.79% 2030 156.23% 137.60% 14.64% 101.80% 3.20% 100.54% 72.91% 12.15% 8.51% 2040 177.65% 146.41% 15.50% 101.04% 3.25% 100.31% 81.78% 10.79% 7.56% 2050 209.09% 160.04% 15.86% 101.43% 3.23% 100.43% 88.48% 10.23% 7.16% 2075 312.29% 205.80% 15.20% 101.78% 3.21% 100.53% 109.13% 10.61% 7.42% 2100 466.12% 263.32% 14.47% 101.94% 3.20% 100.58% 134.68% 10.76% 7.53%
Scenario 2 2005 100.00% 100.00% 14.46% 100.00% 3.31% 100.00% 64.22% 8.74% 6.12% 2010 111.02% 106.19% 15.01% 100.95% 3.25% 100.28% 65.32% 9.04% 6.33% 2015 123.27% 114.01% 14.78% 101.49% 3.22% 100.44% 65.36% 10.00% 7.00% 2020 135.11% 122.62% 14.46% 101.82% 3.20% 100.54% 66.48% 11.13% 7.79% 2030 156.23% 137.61% 14.65% 101.80% 3.20% 100.54% 72.69% 12.15% 8.51% 2040 177.65% 146.42% 15.51% 101.04% 3.25% 100.31% 81.55% 10.79% 7.56% 2050 209.07% 160.06% 15.87% 101.42% 3.23% 100.42% 88.23% 10.24% 7.17% 2075 312.08% 205.85% 15.22% 101.75% 3.21% 100.52% 108.91% 10.61% 7.43% 2100 465.28% 263.41% 14.49% 101.88% 3.20% 100.56% 134.63% 10.78% 7.55%
Scenario 3 2005 100.00% 100.00% 14.46% 100.00% 3.31% 100.00% 64.22% 8.74% 6.12% 2010 111.02% 106.19% 15.01% 100.95% 3.25% 100.28% 65.32% 9.04% 6.33% 2015 123.27% 114.01% 14.78% 101.49% 3.22% 100.45% 65.36% 10.00% 7.00% 2020 135.11% 122.62% 14.46% 101.82% 3.20% 100.54% 66.48% 11.13% 7.79% 2030 156.23% 137.61% 14.64% 101.80% 3.20% 100.54% 72.69% 12.15% 8.51% 2040 177.65% 146.42% 15.50% 101.04% 3.25% 100.31% 81.54% 10.79% 7.56% 2050 209.08% 160.06% 15.87% 101.42% 3.23% 100.42% 88.23% 10.24% 7.17% 2075 312.18% 205.84% 15.21% 101.77% 3.21% 100.53% 108.86% 10.61% 7.43% 2100 465.76% 263.36% 14.48% 101.92% 3.20% 100.57% 134.43% 10.77% 7.54%

28
Table 4 Simulation Results – USA (continued)
GNP GNP per employee
Net national saving-GNP
ratio
Capital-labor ratio Interest rate Wage rate Debt-GDP
ratio
Pension premium to
wage
Pension burden-GDP
ratio Scenario 4 2005 100.00% 100.00% 14.46% 100.00% 3.31% 100.00% 64.22% 8.74% 6.12%
2010 111.02% 106.19% 15.01% 100.95% 3.25% 100.28% 65.31% 9.04% 6.33% 2015 123.27% 114.01% 14.78% 101.49% 3.22% 100.44% 65.36% 10.00% 7.00% 2020 135.11% 122.62% 14.46% 101.82% 3.20% 100.54% 66.48% 11.13% 7.79% 2030 156.24% 137.61% 14.64% 101.80% 3.20% 100.54% 72.69% 12.15% 8.51% 2040 177.66% 146.42% 15.50% 101.04% 3.25% 100.31% 81.54% 10.79% 7.56% 2050 209.09% 160.06% 15.87% 101.42% 3.23% 100.42% 88.22% 10.24% 7.16% 2075 312.19% 205.84% 15.21% 101.76% 3.21% 100.53% 108.86% 10.61% 7.43% 2100 465.57% 263.40% 14.49% 101.90% 3.20% 100.57% 134.51% 10.78% 7.54%
Scenario 5 2005 100.00% 100.00% 14.46% 100.00% 3.31% 100.00% 64.22% 8.74% 6.12% 2010 111.02% 106.19% 15.01% 100.95% 3.25% 100.28% 65.32% 9.04% 6.33% 2015 123.27% 114.01% 14.78% 101.49% 3.22% 100.45% 65.36% 10.00% 7.00% 2020 135.11% 122.62% 14.46% 101.82% 3.20% 100.54% 66.48% 11.13% 7.79% 2030 156.24% 137.61% 14.64% 101.80% 3.20% 100.54% 72.69% 12.15% 8.51% 2040 177.66% 146.42% 15.50% 101.04% 3.25% 100.31% 81.54% 10.79% 7.56% 2050 209.09% 160.06% 15.87% 101.42% 3.23% 100.42% 88.22% 10.24% 7.16% 2075 312.20% 205.84% 15.21% 101.77% 3.21% 100.53% 108.86% 10.61% 7.43% 2100 465.72% 263.38% 14.49% 101.91% 3.20% 100.57% 134.45% 10.77% 7.54%
Scenario 6 2005 100.00% 100.00% 14.50% 100.00% 3.31% 100.00% 64.46% 8.74% 6.12% 2010 111.00% 106.18% 15.03% 100.84% 3.26% 100.27% 65.58% 9.05% 6.34% 2015 123.24% 113.98% 14.77% 101.30% 3.23% 100.42% 65.64% 10.02% 7.01% 2020 135.10% 122.60% 14.43% 101.68% 3.21% 100.54% 66.74% 11.14% 7.80% 2030 156.23% 137.60% 14.61% 101.73% 3.21% 100.55% 72.95% 12.17% 8.52% 2040 177.64% 146.41% 15.47% 101.04% 3.25% 100.33% 81.82% 10.80% 7.56% 2050 209.08% 160.04% 15.85% 101.41% 3.23% 100.45% 88.51% 10.24% 7.17% 2075 312.27% 205.79% 15.20% 101.75% 3.21% 100.56% 109.17% 10.61% 7.42% 2100 466.10% 263.31% 14.47% 101.90% 3.20% 100.61% 134.74% 10.76% 7.53%
29
Table 4 Simulation Results – USA (continued)
GNP GNP per employee
Net national saving-GNP
ratio
Capital-labor ratio Interest rate Wage rate Debt-GDP
ratio
Pension premium to
wage
Pension burden-GDP
ratio Scenario 7 2005 100.00% 100.00% 14.52% 100.00% 3.32% 100.00% 64.50% 8.75% 6.12%
2010 111.00% 106.17% 15.05% 100.86% 3.27% 100.26% 65.62% 9.06% 6.34% 2015 123.22% 113.96% 14.77% 101.34% 3.24% 100.40% 65.69% 10.02% 7.02% 2020 135.09% 122.60% 14.42% 101.79% 3.21% 100.53% 66.78% 11.15% 7.81% 2030 156.23% 137.60% 14.59% 101.89% 3.21% 100.56% 72.98% 12.18% 8.52% 2040 177.64% 146.40% 15.46% 101.16% 3.25% 100.35% 81.84% 10.81% 7.57% 2050 209.08% 160.03% 15.84% 101.56% 3.23% 100.47% 88.53% 10.24% 7.17% 2075 312.26% 205.79% 15.20% 101.93% 3.21% 100.57% 109.20% 10.61% 7.42% 2100 466.08% 263.30% 14.47% 102.09% 3.20% 100.62% 134.77% 10.76% 7.53%
Scenario 8 2005 100.00% 100.00% 14.53% 100.00% 3.32% 100.00% 64.32% 8.75% 6.12% 2010 111.00% 106.18% 15.06% 100.86% 3.27% 100.26% 65.44% 9.06% 6.34% 2015 123.23% 113.97% 14.78% 101.34% 3.24% 100.40% 65.50% 10.02% 7.02% 2020 135.10% 122.60% 14.43% 101.79% 3.21% 100.53% 66.58% 11.15% 7.81% 2030 156.23% 137.61% 14.59% 101.89% 3.21% 100.56% 72.77% 12.18% 8.52% 2040 177.64% 146.42% 15.47% 101.16% 3.25% 100.35% 81.61% 10.81% 7.57% 2050 209.06% 160.05% 15.85% 101.56% 3.23% 100.46% 88.29% 10.24% 7.17% 2075 312.06% 205.84% 15.22% 101.90% 3.21% 100.57% 108.98% 10.62% 7.43% 2100 465.24% 263.39% 14.49% 102.03% 3.20% 100.61% 134.72% 10.78% 7.55%

30
Table 5 Simulation Results – CHINA
GNP GNP per employee
Net national saving-GNP
ratio
Capital-labor ratio Interest rate Wage rate Debt-GDP
ratio
Pension premium to
wage
Pension burden-GDP
ratio Scenario 1 2005 100.00% 100.00% 23.59% 100.00% 3.31% 100.00% 12.47% 0.00% 0.00%
2010 112.08% 107.21% 22.73% 100.88% 3.25% 100.22% 18.40% 0.00% 0.00% 2015 124.25% 116.34% 22.10% 101.39% 3.22% 100.35% 18.39% 0.00% 0.00% 2020 135.05% 126.55% 21.46% 101.70% 3.20% 100.42% 18.23% 0.00% 0.00% 2030 150.21% 152.44% 20.58% 101.68% 3.20% 100.42% 17.73% 0.00% 0.00% 2040 158.15% 169.53% 20.17% 100.97% 3.25% 100.24% 16.65% 0.00% 0.00% 2050 162.84% 188.45% 20.40% 101.33% 3.23% 100.33% 16.05% 0.00% 0.00% 2075 171.66% 241.32% 20.25% 101.66% 3.21% 100.41% 11.71% 0.00% 0.00% 2100 179.66% 310.34% 20.29% 101.81% 3.20% 100.45% 4.63% 0.00% 0.00%
Scenario 2 2005 100.00% 100.00% 23.59% 100.00% 3.31% 100.00% 12.32% 0.00% 0.00% 2010 112.09% 107.22% 22.74% 100.88% 3.25% 100.22% 18.25% 0.00% 0.00% 2015 124.25% 116.34% 22.10% 101.39% 3.22% 100.35% 18.24% 0.00% 0.00% 2020 135.06% 126.55% 21.47% 101.69% 3.20% 100.42% 18.07% 0.00% 0.00% 2030 150.21% 152.45% 20.58% 101.68% 3.20% 100.42% 17.55% 0.00% 0.00% 2040 158.13% 169.55% 20.18% 100.97% 3.25% 100.24% 16.43% 0.00% 0.00% 2050 162.78% 188.52% 20.41% 101.32% 3.23% 100.33% 15.76% 0.00% 0.00% 2075 171.22% 241.66% 20.25% 101.64% 3.21% 100.41% 11.13% 0.00% 0.00% 2100 178.14% 311.32% 20.28% 101.76% 3.20% 100.44% 3.31% 0.00% 0.00%
Scenario 3 2005 100.00% 100.00% 23.59% 100.00% 3.31% 100.00% 12.32% 0.00% 0.00% 2010 112.09% 107.22% 22.74% 100.88% 3.25% 100.22% 18.25% 0.00% 0.00% 2015 124.25% 116.34% 22.10% 101.39% 3.22% 100.35% 18.24% 0.00% 0.00% 2020 135.06% 126.55% 21.47% 101.69% 3.20% 100.42% 18.07% 0.00% 0.00% 2030 150.21% 152.45% 20.58% 101.68% 3.20% 100.42% 17.55% 0.00% 0.00% 2040 158.14% 169.55% 20.18% 100.97% 3.25% 100.24% 16.43% 0.00% 0.00% 2050 162.80% 188.51% 20.41% 101.33% 3.23% 100.33% 15.76% 0.00% 0.00% 2075 171.41% 241.50% 20.25% 101.65% 3.21% 100.41% 11.15% 0.00% 0.00% 2100 179.06% 310.63% 20.30% 101.79% 3.20% 100.44% 3.53% 0.00% 0.00%

31
Table 5 Simulation Results – CHINA (continued)
GNP GNP per employee
Net national saving-GNP
ratio
Capital-labor ratio Interest rate Wage rate Debt-GDP
ratio
Pension premium to
wage
Pension burden-GDP
ratio Scenario 4 2005 100.00% 100.00% 23.59% 100.00% 3.31% 100.00% 12.32% 0.00% 0.00%
2010 112.09% 107.22% 22.74% 100.88% 3.25% 100.22% 18.25% 0.00% 0.00% 2015 124.25% 116.34% 22.10% 101.39% 3.22% 100.35% 18.24% 0.00% 0.00% 2020 135.06% 126.55% 21.47% 101.70% 3.20% 100.42% 18.07% 0.00% 0.00% 2030 150.21% 152.45% 20.58% 101.68% 3.20% 100.42% 17.55% 0.00% 0.00% 2040 158.15% 169.54% 20.18% 100.97% 3.25% 100.24% 16.42% 0.00% 0.00% 2050 162.83% 188.49% 20.41% 101.33% 3.23% 100.33% 15.76% 0.00% 0.00% 2075 171.41% 241.56% 20.25% 101.64% 3.21% 100.41% 11.15% 0.00% 0.00% 2100 178.58% 311.17% 20.28% 101.77% 3.20% 100.44% 3.43% 0.00% 0.00%
Scenario 5 2005 100.00% 100.00% 23.59% 100.00% 3.31% 100.00% 12.32% 0.00% 0.00% 2010 112.09% 107.22% 22.74% 100.88% 3.25% 100.22% 18.25% 0.00% 0.00% 2015 124.25% 116.34% 22.10% 101.39% 3.22% 100.35% 18.24% 0.00% 0.00% 2020 135.06% 126.55% 21.47% 101.69% 3.20% 100.42% 18.07% 0.00% 0.00% 2030 150.21% 152.45% 20.58% 101.68% 3.20% 100.42% 17.55% 0.00% 0.00% 2040 158.15% 169.55% 20.18% 100.97% 3.25% 100.24% 16.43% 0.00% 0.00% 2050 162.82% 188.49% 20.41% 101.33% 3.23% 100.33% 15.76% 0.00% 0.00% 2075 171.45% 241.51% 20.25% 101.65% 3.21% 100.41% 11.17% 0.00% 0.00% 2100 178.92% 310.86% 20.29% 101.78% 3.20% 100.44% 3.53% 0.00% 0.00%
Scenario 6 2005 100.00% 100.00% 23.63% 100.00% 3.31% 100.00% 12.55% 0.00% 0.00% 2010 112.08% 107.21% 22.77% 100.90% 3.26% 100.21% 18.47% 0.00% 0.00% 2015 124.25% 116.34% 22.12% 101.39% 3.23% 100.32% 18.43% 0.00% 0.00% 2020 135.06% 126.56% 21.46% 101.80% 3.21% 100.42% 18.21% 0.00% 0.00% 2030 150.21% 152.44% 20.55% 101.86% 3.21% 100.43% 17.60% 0.00% 0.00% 2040 158.15% 169.53% 20.16% 101.12% 3.25% 100.26% 16.40% 0.00% 0.00% 2050 162.84% 188.45% 20.40% 101.51% 3.23% 100.35% 15.68% 0.00% 0.00% 2075 171.66% 241.33% 20.26% 101.87% 3.21% 100.43% 11.01% 0.00% 0.00% 2100 179.69% 310.39% 20.31% 102.03% 3.20% 100.47% 3.37% 0.00% 0.00%

32
Table 5 Simulation Results – CHINA (continued)
GNP GNP per employee
Net national saving-GNP
ratio
Capital-labor ratio Interest rate Wage rate Debt-GDP
ratio
Pension premium to
wage
Pension burden-GDP
ratio Scenario 7 2005 100.00% 100.00% 23.66% 100.00% 3.32% 100.00% 12.59% 0.00% 15.57%
2010 112.09% 107.21% 22.80% 100.81% 3.27% 100.20% 18.51% 0.00% 16.42% 2015 124.25% 116.34% 22.13% 101.25% 3.24% 100.31% 18.44% 0.00% 17.39% 2020 135.06% 126.56% 21.45% 101.67% 3.21% 100.42% 18.20% 0.00% 17.82% 2030 150.22% 152.45% 20.54% 101.76% 3.21% 100.44% 17.52% 0.00% 17.48% 2040 158.15% 169.53% 20.15% 101.08% 3.25% 100.27% 16.25% 0.00% 19.18% 2050 162.84% 188.45% 20.39% 101.46% 3.23% 100.36% 15.46% 0.00% 20.74% 2075 171.67% 241.33% 20.27% 101.80% 3.21% 100.45% 10.57% 0.00% 20.14% 2100 179.71% 310.42% 20.33% 101.95% 3.20% 100.48% 2.58% 0.00% 19.71%
Scenario 8 2005 100.00% 100.00% 23.66% 100.00% 3.32% 100.00% 12.45% 0.00% 15.57% 2010 112.09% 107.22% 22.80% 100.81% 3.27% 100.20% 18.37% 0.00% 16.42% 2015 124.25% 116.35% 22.14% 101.25% 3.24% 100.31% 18.29% 0.00% 17.39% 2020 135.07% 126.57% 21.46% 101.67% 3.21% 100.42% 18.04% 0.00% 17.82% 2030 150.22% 152.46% 20.54% 101.76% 3.21% 100.44% 17.34% 0.00% 17.48% 2040 158.14% 169.56% 20.15% 101.08% 3.25% 100.27% 16.03% 0.00% 19.18% 2050 162.78% 188.51% 20.40% 101.45% 3.23% 100.36% 15.18% 0.00% 20.74% 2075 171.22% 241.67% 20.27% 101.77% 3.21% 100.44% 10.01% 0.00% 20.14% 2100 178.19% 311.40% 20.32% 101.89% 3.20% 100.47% 1.29% 0.00% 19.71%

33
Table 6 Simulation Results – SOUTH KOREA
GNP GNP per employee
Net national saving-GNP
ratio
Capital-labor ratio Interest rate Wage rate Debt-GDP
ratio
Pension premium to
wage
Pension burden-GDP
ratio Scenario 1 2005 100.00% 100.00% 18.69% 100.00% 3.31% 100.00% 24.69% 10.03% 14.05%
2010 109.77% 107.94% 21.46% 100.95% 3.25% 100.28% 28.93% 10.65% 14.90% 2015 119.24% 118.29% 22.18% 101.49% 3.22% 100.45% 28.90% 8.82% 12.35% 2020 128.06% 132.03% 22.85% 101.82% 3.20% 100.54% 28.14% 6.80% 9.52% 2030 140.30% 165.98% 22.90% 101.80% 3.20% 100.54% 28.75% 8.60% 12.04% 2040 139.83% 195.33% 23.03% 101.04% 3.25% 100.31% 35.77% 9.54% 13.35% 2050 132.82% 220.14% 23.07% 101.43% 3.23% 100.43% 49.12% 9.90% 13.86% 2075 104.78% 278.19% 23.08% 101.78% 3.21% 100.53% 125.56% 10.17% 14.24% 2100 80.61% 342.57% 20.45% 101.94% 3.20% 100.58% 313.52% 10.29% 14.40%
Scenario 2 2005 100.00% 100.00% 18.69% 100.00% 3.31% 100.00% 24.55% 10.03% 14.05% 2010 109.77% 107.94% 21.47% 100.95% 3.25% 100.28% 28.80% 10.65% 14.90% 2015 119.24% 118.30% 22.19% 101.49% 3.22% 100.44% 28.76% 8.82% 12.35% 2020 128.05% 132.05% 22.87% 101.82% 3.20% 100.54% 28.00% 6.80% 9.52% 2030 140.14% 166.19% 22.92% 101.80% 3.20% 100.54% 28.65% 8.61% 12.05% 2040 139.25% 196.21% 23.06% 101.04% 3.25% 100.31% 35.82% 9.58% 13.41% 2050 131.32% 222.69% 23.09% 101.42% 3.23% 100.42% 49.69% 10.02% 14.02% 2075 97.54% 292.89% 22.98% 101.75% 3.21% 100.52% 136.10% 10.76% 15.07% 2100 61.63% 386.34% 19.33% 101.88% 3.20% 100.56% 407.55% 11.86% 16.61%
Scenario 3 2005 100.00% 100.00% 18.69% 100.00% 3.31% 100.00% 24.55% 10.03% 14.05% 2010 109.77% 107.94% 21.46% 100.95% 3.25% 100.28% 28.80% 10.65% 14.90% 2015 119.24% 118.30% 22.19% 101.49% 3.22% 100.45% 28.77% 8.82% 12.35% 2020 128.05% 132.05% 22.87% 101.82% 3.20% 100.54% 28.00% 6.80% 9.52% 2030 140.14% 166.18% 22.91% 101.80% 3.20% 100.54% 28.64% 8.61% 12.05% 2040 139.32% 196.08% 23.03% 101.04% 3.25% 100.31% 35.77% 9.57% 13.40% 2050 131.72% 221.92% 23.06% 101.42% 3.23% 100.42% 49.43% 9.98% 13.98% 2075 100.96% 283.48% 22.99% 101.77% 3.21% 100.53% 130.61% 10.41% 14.58% 2100 73.82% 347.43% 20.11% 101.92% 3.20% 100.57% 341.87% 10.57% 14.80%

34
Table 6 Simulation Results –SOUTH KOREA (continued)
GNP GNP per employee
Net national saving-GNP
ratio
Capital-labor ratio Interest rate Wage rate Debt-GDP
ratio
Pension premium to
wage
Pension burden-GDP
ratio Scenario 4 2005 100.00% 100.00% 18.69% 100.00% 3.31% 100.00% 24.55% 10.03% 14.05%
2010 109.77% 107.94% 21.46% 100.95% 3.25% 100.28% 28.79% 10.65% 14.90% 2015 119.24% 118.30% 22.19% 101.49% 3.22% 100.44% 28.76% 8.82% 12.35% 2020 128.07% 132.04% 22.86% 101.82% 3.20% 100.54% 27.98% 6.80% 9.52% 2030 140.29% 166.02% 22.92% 101.80% 3.20% 100.54% 28.58% 8.60% 12.04% 2040 139.66% 195.64% 23.06% 101.04% 3.25% 100.31% 35.64% 9.55% 13.37% 2050 132.16% 221.36% 23.11% 101.42% 3.23% 100.42% 49.20% 9.95% 13.93% 2075 100.17% 289.11% 23.04% 101.76% 3.21% 100.53% 131.76% 10.60% 14.84% 2100 65.77% 381.38% 19.63% 101.90% 3.20% 100.57% 381.71% 11.64% 16.29%
Scenario 5 2005 100.00% 100.00% 18.69% 100.00% 3.31% 100.00% 24.55% 10.03% 14.05% 2010 109.77% 107.94% 21.46% 100.95% 3.25% 100.28% 28.80% 10.65% 14.90% 2015 119.24% 118.30% 22.19% 101.49% 3.22% 100.45% 28.76% 8.82% 12.35% 2020 128.06% 132.05% 22.86% 101.82% 3.20% 100.54% 27.99% 6.80% 9.52% 2030 140.22% 166.09% 22.91% 101.80% 3.20% 100.54% 28.61% 8.60% 12.04% 2040 139.54% 195.78% 23.05% 101.04% 3.25% 100.31% 35.68% 9.56% 13.38% 2050 132.08% 221.41% 23.08% 101.42% 3.23% 100.42% 49.25% 9.96% 13.94% 2075 101.10% 285.29% 23.03% 101.77% 3.21% 100.53% 130.38% 10.46% 14.65% 2100 70.67% 362.07% 19.91% 101.91% 3.20% 100.57% 356.23% 11.04% 15.46%
Scenario 6 2005 100.00% 100.00% 18.72% 100.00% 3.31% 100.00% 24.74% 10.04% 14.06% 2010 109.76% 107.93% 21.48% 100.84% 3.26% 100.27% 28.99% 10.66% 14.92% 2015 119.21% 118.27% 22.18% 101.30% 3.23% 100.42% 28.94% 8.84% 12.37% 2020 128.06% 132.03% 22.83% 101.68% 3.21% 100.54% 28.14% 6.81% 9.53% 2030 140.30% 165.99% 22.87% 101.73% 3.21% 100.55% 28.70% 8.61% 12.05% 2040 139.84% 195.34% 23.01% 101.04% 3.25% 100.33% 35.68% 9.55% 13.36% 2050 132.82% 220.14% 23.06% 101.41% 3.23% 100.45% 48.98% 9.90% 13.86% 2075 104.78% 278.20% 23.09% 101.75% 3.21% 100.56% 125.26% 10.17% 14.24% 2100 80.63% 342.64% 20.47% 101.90% 3.20% 100.61% 312.85% 10.29% 14.40%

35
Table 6 Simulation Results –SOUTH KOREA (continued)
GNP GNP per employee
Net national saving-GNP
ratio
Capital-labor ratio Interest rate Wage rate Debt-GDP
ratio
Pension premium to
wage
Pension burden-GDP
ratio Scenario 7 2005 100.00% 100.00% 18.74% 100.00% 3.32% 100.00% 24.76% 10.04% 14.06%
2010 109.75% 107.92% 21.50% 100.86% 3.27% 100.26% 29.01% 10.66% 14.93% 2015 119.20% 118.26% 22.18% 101.34% 3.24% 100.40% 28.96% 8.85% 12.38% 2020 128.05% 132.03% 22.82% 101.79% 3.21% 100.53% 28.14% 6.81% 9.54% 2030 140.31% 165.99% 22.85% 101.89% 3.21% 100.56% 28.67% 8.61% 12.06% 2040 139.84% 195.34% 22.99% 101.16% 3.25% 100.35% 35.62% 9.55% 13.37% 2050 132.82% 220.14% 23.05% 101.56% 3.23% 100.47% 48.89% 9.91% 13.87% 2075 104.78% 278.21% 23.10% 101.93% 3.21% 100.57% 125.05% 10.17% 14.24% 2100 80.64% 342.67% 20.48% 102.09% 3.20% 100.62% 312.35% 10.29% 14.40%
Scenario 8 2005 100.00% 100.00% 18.75% 100.00% 3.32% 100.00% 24.63% 10.04% 14.06% 2010 109.75% 107.93% 21.50% 100.86% 3.27% 100.26% 28.88% 10.66% 14.93% 2015 119.21% 118.26% 22.20% 101.34% 3.24% 100.40% 28.83% 8.85% 12.38% 2020 128.04% 132.05% 22.84% 101.79% 3.21% 100.53% 28.01% 6.81% 9.54% 2030 140.15% 166.20% 22.87% 101.89% 3.21% 100.56% 28.58% 8.62% 12.07% 2040 139.25% 196.22% 23.02% 101.16% 3.25% 100.35% 35.68% 9.59% 13.43% 2050 131.33% 222.69% 23.07% 101.56% 3.23% 100.46% 49.47% 10.02% 14.03% 2075 97.55% 292.92% 23.00% 101.90% 3.21% 100.57% 135.60% 10.76% 15.07% 2100 61.65% 386.49% 19.37% 102.03% 3.20% 100.61% 406.22% 11.86% 16.61%
36
Table 7 Simulation Results –INDIA
GNP GNP per employee
Net national saving-GNP
ratio
Capital-labor ratio Interest rate Wage rate Debt-GDP
ratio
Pension premium to
wage
Pension burden-GDP
ratio Scenario 1 2005 100.00% 100.00% 15.38% 100.00% 3.31% 100.00% 58.20% 0.00% 0.00%
2010 116.34% 106.04% 15.18% 100.88% 3.25% 100.22% 58.20% 0.00% 0.00% 2015 134.08% 112.49% 15.15% 101.39% 3.22% 100.35% 58.24% 0.00% 0.00% 2020 152.18% 118.97% 15.08% 101.70% 3.20% 100.42% 59.07% 0.00% 0.00% 2030 189.50% 133.43% 14.87% 101.68% 3.20% 100.42% 62.71% 0.00% 0.00% 2040 231.73% 148.86% 14.45% 100.97% 3.25% 100.24% 67.07% 0.00% 0.00% 2050 279.45% 165.48% 14.13% 101.33% 3.23% 100.33% 72.22% 0.00% 0.00% 2075 437.01% 210.46% 13.76% 101.66% 3.21% 100.41% 88.23% 0.00% 0.00% 2100 685.17% 268.34% 13.34% 101.81% 3.20% 100.45% 107.31% 0.00% 0.00%
Scenario 2 2005 100.01% 100.01% 15.39% 100.00% 3.31% 100.00% 57.97% 0.00% 0.00% 2010 116.34% 106.05% 15.19% 100.88% 3.25% 100.22% 57.97% 0.00% 0.00% 2015 134.09% 112.50% 15.15% 101.39% 3.22% 100.35% 58.02% 0.00% 0.00% 2020 152.19% 118.98% 15.08% 101.69% 3.20% 100.42% 58.85% 0.00% 0.00% 2030 189.52% 133.44% 14.88% 101.68% 3.20% 100.42% 62.48% 0.00% 0.00% 2040 231.74% 148.87% 14.45% 100.97% 3.25% 100.24% 66.83% 0.00% 0.00% 2050 279.47% 165.49% 14.14% 101.32% 3.23% 100.33% 71.97% 0.00% 0.00% 2075 437.02% 210.48% 13.78% 101.64% 3.21% 100.41% 87.95% 0.00% 0.00% 2100 685.12% 268.36% 13.37% 101.76% 3.20% 100.44% 107.01% 0.00% 0.00%
Scenario 3 2005 100.01% 100.01% 15.39% 100.00% 3.31% 100.00% 57.97% 0.00% 0.00% 2010 116.34% 106.05% 15.19% 100.88% 3.25% 100.22% 57.97% 0.00% 0.00% 2015 134.09% 112.50% 15.15% 101.39% 3.22% 100.35% 58.02% 0.00% 0.00% 2020 152.19% 118.98% 15.08% 101.69% 3.20% 100.42% 58.85% 0.00% 0.00% 2030 189.51% 133.44% 14.88% 101.68% 3.20% 100.42% 62.48% 0.00% 0.00% 2040 231.74% 148.86% 14.45% 100.97% 3.25% 100.24% 66.83% 0.00% 0.00% 2050 279.47% 165.49% 14.14% 101.33% 3.23% 100.33% 71.97% 0.00% 0.00% 2075 437.03% 210.47% 13.77% 101.65% 3.21% 100.41% 87.93% 0.00% 0.00% 2100 685.18% 268.36% 13.35% 101.79% 3.20% 100.44% 106.96% 0.00% 0.00%

37
Table 7 Simulation Results – INDIA (continued)
GNP GNP per employee
Net national saving-GNP
ratio
Capital-labor ratio Interest rate Wage rate Debt-GDP
ratio
Pension premium to
wage
Pension burden-GDP
ratio Scenario 4 2005 100.01% 100.01% 15.39% 100.00% 3.31% 100.00% 57.97% 0.00% 0.00%
2010 116.34% 106.05% 15.19% 100.88% 3.25% 100.22% 57.97% 0.00% 0.00% 2015 134.09% 112.50% 15.15% 101.39% 3.22% 100.35% 58.02% 0.00% 0.00% 2020 152.19% 118.98% 15.08% 101.70% 3.20% 100.42% 58.85% 0.00% 0.00% 2030 189.52% 133.44% 14.88% 101.68% 3.20% 100.42% 62.47% 0.00% 0.00% 2040 231.74% 148.86% 14.45% 100.97% 3.25% 100.24% 66.83% 0.00% 0.00% 2050 279.47% 165.49% 14.14% 101.33% 3.23% 100.33% 71.97% 0.00% 0.00% 2075 437.03% 210.48% 13.78% 101.64% 3.21% 100.41% 87.94% 0.00% 0.00% 2100 685.15% 268.36% 13.36% 101.77% 3.20% 100.44% 106.99% 0.00% 0.00%
Scenario 5 2005 100.01% 100.01% 15.39% 100.00% 3.31% 100.00% 57.97% 0.00% 0.00% 2010 116.34% 106.05% 15.19% 100.88% 3.25% 100.22% 57.97% 0.00% 0.00% 2015 134.09% 112.50% 15.15% 101.39% 3.22% 100.35% 58.02% 0.00% 0.00% 2020 152.19% 118.98% 15.08% 101.69% 3.20% 100.42% 58.85% 0.00% 0.00% 2030 189.52% 133.44% 14.88% 101.68% 3.20% 100.42% 62.47% 0.00% 0.00% 2040 231.74% 148.86% 14.45% 100.97% 3.25% 100.24% 66.83% 0.00% 0.00% 2050 279.47% 165.49% 14.14% 101.33% 3.23% 100.33% 71.96% 0.00% 0.00% 2075 437.04% 210.47% 13.77% 101.65% 3.21% 100.41% 87.93% 0.00% 0.00% 2100 685.18% 268.36% 13.36% 101.78% 3.20% 100.44% 106.97% 0.00% 0.00%
Scenario 6 2005 100.00% 100.00% 15.43% 100.00% 3.31% 100.00% 58.28% 0.00% 0.00% 2010 116.33% 106.04% 15.22% 100.84% 3.26% 100.21% 58.29% 0.00% 0.00% 2015 134.07% 112.48% 15.16% 101.30% 3.23% 100.32% 58.33% 0.00% 0.00% 2020 152.18% 118.97% 15.07% 101.68% 3.21% 100.42% 59.13% 0.00% 0.00% 2030 189.51% 133.43% 14.85% 101.73% 3.21% 100.43% 62.71% 0.00% 0.00% 2040 231.73% 148.86% 14.43% 101.04% 3.25% 100.26% 67.04% 0.00% 0.00% 2050 279.45% 165.48% 14.12% 101.41% 3.23% 100.35% 72.17% 0.00% 0.00% 2075 437.01% 210.46% 13.76% 101.75% 3.21% 100.43% 88.16% 0.00% 0.00% 2100 685.17% 268.34% 13.34% 101.90% 3.20% 100.47% 107.22% 0.00% 0.00%

38
Table 7 Simulation Results – INDIA (continued)
GNP GNP per employee
Net national saving-GNP
ratio
Capital-labor ratio Interest rate Wage rate Debt-GDP
ratio
Pension premium to
wage
Pension burden-GDP
ratio Scenario 7 2005 100.00% 100.00% 15.45% 100.00% 3.32% 100.00% 58.33% 0.00% 0.00%
2010 116.32% 106.03% 15.24% 100.81% 3.27% 100.20% 58.35% 0.00% 0.00% 2015 134.05% 112.47% 15.16% 101.25% 3.24% 100.31% 58.39% 0.00% 0.00% 2020 152.18% 118.97% 15.06% 101.67% 3.21% 100.42% 59.16% 0.00% 0.00% 2030 189.51% 133.44% 14.84% 101.76% 3.21% 100.44% 62.71% 0.00% 0.00% 2040 231.73% 148.86% 14.43% 101.08% 3.25% 100.27% 67.03% 0.00% 0.00% 2050 279.45% 165.48% 14.12% 101.46% 3.23% 100.36% 72.14% 0.00% 0.00% 2075 437.01% 210.46% 13.76% 101.80% 3.21% 100.45% 88.12% 0.00% 0.00% 2100 685.17% 268.34% 13.35% 101.95% 3.20% 100.48% 107.17% 0.00% 0.00%
Scenario 8 2005 100.01% 100.01% 15.46% 100.00% 3.32% 100.00% 58.10% 0.00% 0.00% 2010 116.33% 106.04% 15.25% 100.81% 3.27% 100.20% 58.12% 0.00% 0.00% 2015 134.06% 112.47% 15.17% 101.25% 3.24% 100.31% 58.16% 0.00% 0.00% 2020 152.19% 118.97% 15.07% 101.67% 3.21% 100.42% 58.94% 0.00% 0.00% 2030 189.52% 133.44% 14.85% 101.76% 3.21% 100.44% 62.48% 0.00% 0.00% 2040 231.74% 148.87% 14.44% 101.08% 3.25% 100.27% 66.78% 0.00% 0.00% 2050 279.47% 165.50% 14.13% 101.45% 3.23% 100.36% 71.89% 0.00% 0.00% 2075 437.02% 210.48% 13.78% 101.77% 3.21% 100.44% 87.83% 0.00% 0.00% 2100 685.12% 268.36% 13.37% 101.89% 3.20% 100.47% 106.87% 0.00% 0.00%
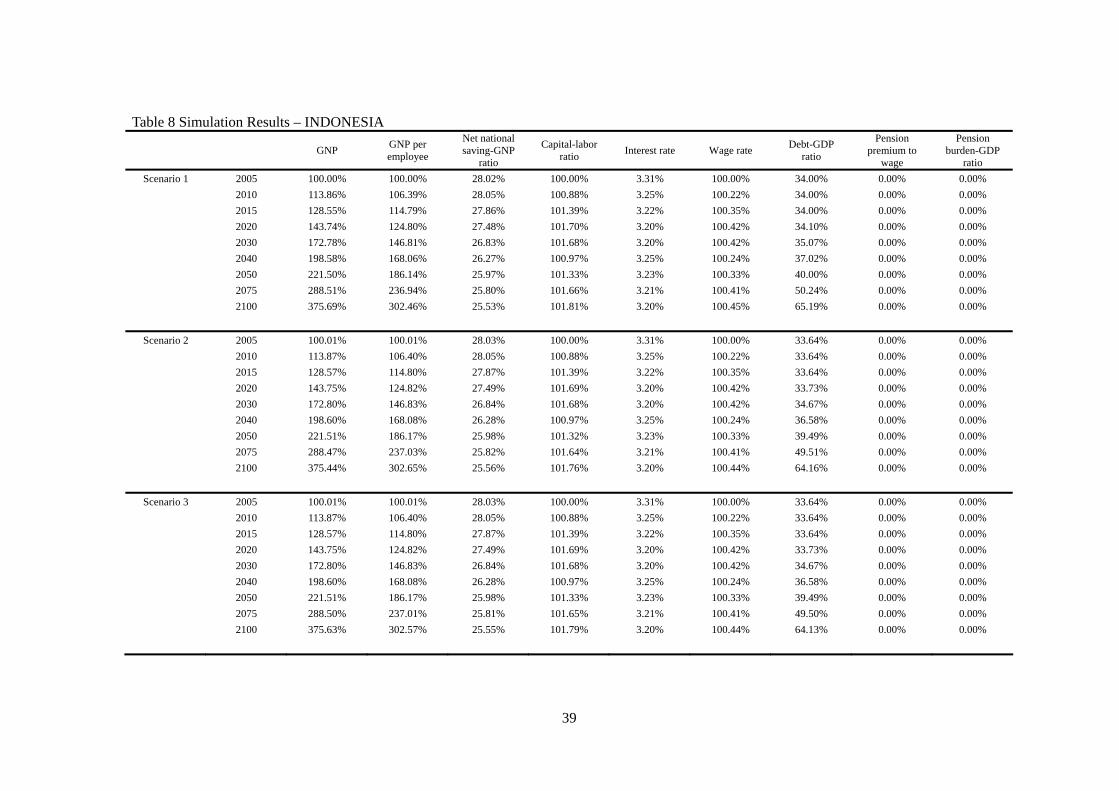
39
Table 8 Simulation Results – INDONESIA
GNP GNP per employee
Net national saving-GNP
ratio
Capital-labor ratio Interest rate Wage rate Debt-GDP
ratio
Pension premium to
wage
Pension burden-GDP
ratio Scenario 1 2005 100.00% 100.00% 28.02% 100.00% 3.31% 100.00% 34.00% 0.00% 0.00%
2010 113.86% 106.39% 28.05% 100.88% 3.25% 100.22% 34.00% 0.00% 0.00% 2015 128.55% 114.79% 27.86% 101.39% 3.22% 100.35% 34.00% 0.00% 0.00% 2020 143.74% 124.80% 27.48% 101.70% 3.20% 100.42% 34.10% 0.00% 0.00% 2030 172.78% 146.81% 26.83% 101.68% 3.20% 100.42% 35.07% 0.00% 0.00% 2040 198.58% 168.06% 26.27% 100.97% 3.25% 100.24% 37.02% 0.00% 0.00% 2050 221.50% 186.14% 25.97% 101.33% 3.23% 100.33% 40.00% 0.00% 0.00% 2075 288.51% 236.94% 25.80% 101.66% 3.21% 100.41% 50.24% 0.00% 0.00% 2100 375.69% 302.46% 25.53% 101.81% 3.20% 100.45% 65.19% 0.00% 0.00%
Scenario 2 2005 100.01% 100.01% 28.03% 100.00% 3.31% 100.00% 33.64% 0.00% 0.00% 2010 113.87% 106.40% 28.05% 100.88% 3.25% 100.22% 33.64% 0.00% 0.00% 2015 128.57% 114.80% 27.87% 101.39% 3.22% 100.35% 33.64% 0.00% 0.00% 2020 143.75% 124.82% 27.49% 101.69% 3.20% 100.42% 33.73% 0.00% 0.00% 2030 172.80% 146.83% 26.84% 101.68% 3.20% 100.42% 34.67% 0.00% 0.00% 2040 198.60% 168.08% 26.28% 100.97% 3.25% 100.24% 36.58% 0.00% 0.00% 2050 221.51% 186.17% 25.98% 101.32% 3.23% 100.33% 39.49% 0.00% 0.00% 2075 288.47% 237.03% 25.82% 101.64% 3.21% 100.41% 49.51% 0.00% 0.00% 2100 375.44% 302.65% 25.56% 101.76% 3.20% 100.44% 64.16% 0.00% 0.00%
Scenario 3 2005 100.01% 100.01% 28.03% 100.00% 3.31% 100.00% 33.64% 0.00% 0.00% 2010 113.87% 106.40% 28.05% 100.88% 3.25% 100.22% 33.64% 0.00% 0.00% 2015 128.57% 114.80% 27.87% 101.39% 3.22% 100.35% 33.64% 0.00% 0.00% 2020 143.75% 124.82% 27.49% 101.69% 3.20% 100.42% 33.73% 0.00% 0.00% 2030 172.80% 146.83% 26.84% 101.68% 3.20% 100.42% 34.67% 0.00% 0.00% 2040 198.60% 168.08% 26.28% 100.97% 3.25% 100.24% 36.58% 0.00% 0.00% 2050 221.51% 186.17% 25.98% 101.33% 3.23% 100.33% 39.49% 0.00% 0.00% 2075 288.50% 237.01% 25.81% 101.65% 3.21% 100.41% 49.50% 0.00% 0.00% 2100 375.63% 302.57% 25.55% 101.79% 3.20% 100.44% 64.13% 0.00% 0.00%

40
Table 8 Simulation Results – INDONESIA (continued)
GNP GNP per employee
Net national saving-GNP
ratio
Capital-labor ratio Interest rate Wage rate Debt-GDP
ratio
Pension premium to
wage
Pension burden-GDP
ratio Scenario 4 2005 100.01% 100.01% 28.03% 100.00% 3.31% 100.00% 33.64% 0.00% 0.00%
2010 113.87% 106.40% 28.05% 100.88% 3.25% 100.22% 33.64% 0.00% 0.00% 2015 128.57% 114.80% 27.87% 101.39% 3.22% 100.35% 33.64% 0.00% 0.00% 2020 143.75% 124.82% 27.49% 101.70% 3.20% 100.42% 33.73% 0.00% 0.00% 2030 172.80% 146.82% 26.84% 101.68% 3.20% 100.42% 34.67% 0.00% 0.00% 2040 198.60% 168.08% 26.28% 100.97% 3.25% 100.24% 36.58% 0.00% 0.00% 2050 221.52% 186.17% 25.98% 101.33% 3.23% 100.33% 39.48% 0.00% 0.00% 2075 288.51% 237.01% 25.82% 101.64% 3.21% 100.41% 49.50% 0.00% 0.00% 2100 375.54% 302.63% 25.56% 101.77% 3.20% 100.44% 64.15% 0.00% 0.00%
Scenario 5 2005 100.01% 100.01% 28.03% 100.00% 3.31% 100.00% 33.64% 0.00% 0.00% 2010 113.87% 106.40% 28.05% 100.88% 3.25% 100.22% 33.64% 0.00% 0.00% 2015 128.57% 114.80% 27.87% 101.39% 3.22% 100.35% 33.64% 0.00% 0.00% 2020 143.75% 124.82% 27.49% 101.69% 3.20% 100.42% 33.73% 0.00% 0.00% 2030 172.80% 146.82% 26.84% 101.68% 3.20% 100.42% 34.67% 0.00% 0.00% 2040 198.60% 168.08% 26.28% 100.97% 3.25% 100.24% 36.58% 0.00% 0.00% 2050 221.52% 186.17% 25.98% 101.33% 3.23% 100.33% 39.49% 0.00% 0.00% 2075 288.51% 237.01% 25.82% 101.65% 3.21% 100.41% 49.50% 0.00% 0.00% 2100 375.61% 302.59% 25.56% 101.78% 3.20% 100.44% 64.15% 0.00% 0.00%
Scenario 6 2005 100.00% 100.00% 28.06% 100.00% 3.31% 100.00% 34.05% 0.00% 0.00% 2010 113.86% 106.39% 28.08% 100.84% 3.26% 100.21% 34.05% 0.00% 0.00% 2015 128.56% 114.79% 27.88% 101.30% 3.23% 100.32% 34.03% 0.00% 0.00% 2020 143.75% 124.81% 27.48% 101.68% 3.21% 100.42% 34.10% 0.00% 0.00% 2030 172.79% 146.82% 26.81% 101.73% 3.21% 100.43% 35.01% 0.00% 0.00% 2040 198.58% 168.06% 26.25% 101.04% 3.25% 100.26% 36.91% 0.00% 0.00% 2050 221.49% 186.13% 25.96% 101.41% 3.23% 100.35% 39.84% 0.00% 0.00% 2075 288.50% 236.93% 25.80% 101.75% 3.21% 100.43% 50.00% 0.00% 0.00% 2100 375.68% 302.46% 25.54% 101.90% 3.20% 100.47% 64.84% 0.00% 0.00%
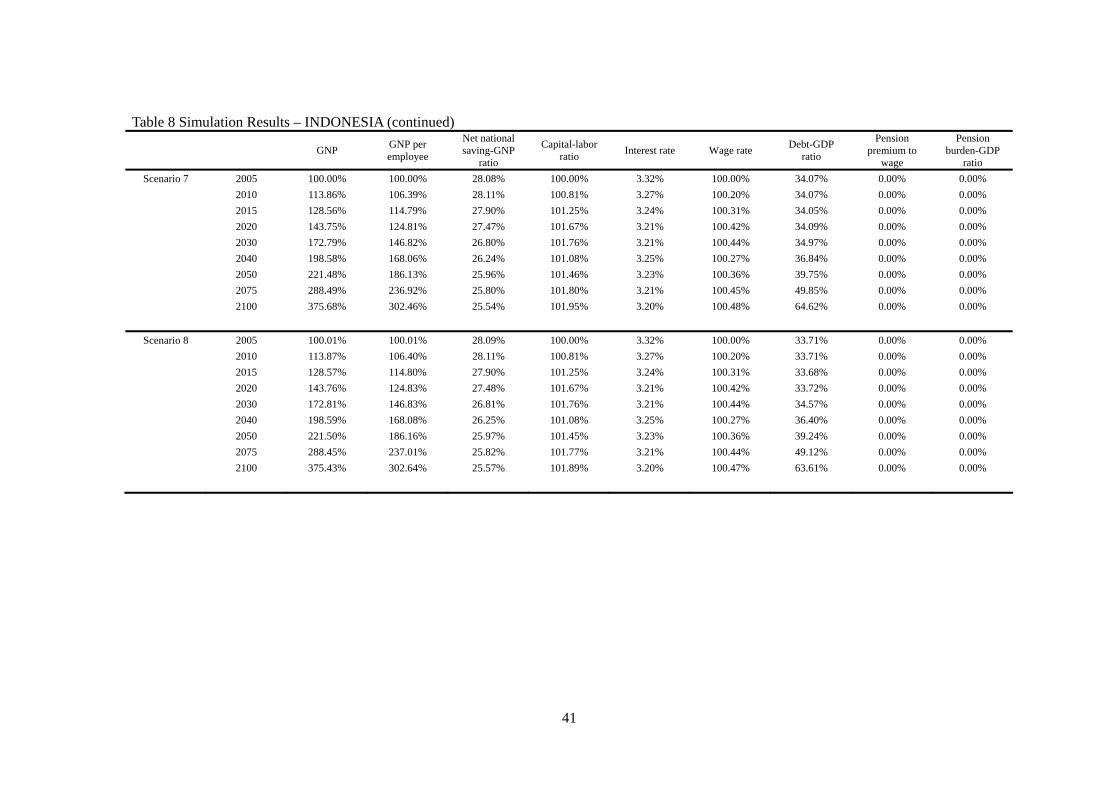
41
Table 8 Simulation Results – INDONESIA (continued)
GNP GNP per employee
Net national saving-GNP
ratio
Capital-labor ratio Interest rate Wage rate Debt-GDP
ratio
Pension premium to
wage
Pension burden-GDP
ratio Scenario 7 2005 100.00% 100.00% 28.08% 100.00% 3.32% 100.00% 34.07% 0.00% 0.00%
2010 113.86% 106.39% 28.11% 100.81% 3.27% 100.20% 34.07% 0.00% 0.00% 2015 128.56% 114.79% 27.90% 101.25% 3.24% 100.31% 34.05% 0.00% 0.00% 2020 143.75% 124.81% 27.47% 101.67% 3.21% 100.42% 34.09% 0.00% 0.00% 2030 172.79% 146.82% 26.80% 101.76% 3.21% 100.44% 34.97% 0.00% 0.00% 2040 198.58% 168.06% 26.24% 101.08% 3.25% 100.27% 36.84% 0.00% 0.00% 2050 221.48% 186.13% 25.96% 101.46% 3.23% 100.36% 39.75% 0.00% 0.00% 2075 288.49% 236.92% 25.80% 101.80% 3.21% 100.45% 49.85% 0.00% 0.00% 2100 375.68% 302.46% 25.54% 101.95% 3.20% 100.48% 64.62% 0.00% 0.00%
Scenario 8 2005 100.01% 100.01% 28.09% 100.00% 3.32% 100.00% 33.71% 0.00% 0.00% 2010 113.87% 106.40% 28.11% 100.81% 3.27% 100.20% 33.71% 0.00% 0.00% 2015 128.57% 114.80% 27.90% 101.25% 3.24% 100.31% 33.68% 0.00% 0.00% 2020 143.76% 124.83% 27.48% 101.67% 3.21% 100.42% 33.72% 0.00% 0.00% 2030 172.81% 146.83% 26.81% 101.76% 3.21% 100.44% 34.57% 0.00% 0.00% 2040 198.59% 168.08% 26.25% 101.08% 3.25% 100.27% 36.40% 0.00% 0.00% 2050 221.50% 186.16% 25.97% 101.45% 3.23% 100.36% 39.24% 0.00% 0.00% 2075 288.45% 237.01% 25.82% 101.77% 3.21% 100.44% 49.12% 0.00% 0.00% 2100 375.43% 302.64% 25.57% 101.89% 3.20% 100.47% 63.61% 0.00% 0.00%

42
Table 9 Simulation Results – BANGLADESH
GNP GNP per employee
Net national saving-GNP
ratio
Capital-labor ratio Interest rate Wage rate Debt-GDP
ratio
Pension premium to
wage
Pension burden-GDP
ratio Scenario 1 2005 100.00% 100.00% 8.14% 100.00% 3.31% 100.00% 37.40% 0.00% 0.00%
2010 117.26% 105.41% 7.89% 100.88% 3.25% 100.22% 37.40% 0.00% 0.00% 2015 136.12% 111.21% 7.71% 101.39% 3.22% 100.35% 37.43% 0.00% 0.00% 2020 155.37% 117.35% 7.49% 101.70% 3.20% 100.42% 37.96% 0.00% 0.00% 2030 196.17% 130.48% 7.24% 101.68% 3.20% 100.42% 40.12% 0.00% 0.00% 2040 243.12% 144.40% 6.81% 100.97% 3.25% 100.24% 42.68% 0.00% 0.00% 2050 297.80% 159.74% 6.56% 101.33% 3.23% 100.33% 45.57% 0.00% 0.00% 2075 489.25% 204.16% 6.31% 101.66% 3.21% 100.41% 53.92% 0.00% 0.00% 2100 804.78% 261.13% 6.06% 101.81% 3.20% 100.45% 63.58% 0.00% 0.00%
Scenario 2 2005 100.00% 100.00% 8.14% 100.00% 3.31% 100.00% 37.32% 0.00% 0.00% 2010 117.27% 105.42% 7.89% 100.88% 3.25% 100.22% 37.32% 0.00% 0.00% 2015 136.12% 111.21% 7.71% 101.39% 3.22% 100.35% 37.35% 0.00% 0.00% 2020 155.38% 117.36% 7.49% 101.69% 3.20% 100.42% 37.89% 0.00% 0.00% 2030 196.17% 130.48% 7.24% 101.68% 3.20% 100.42% 40.04% 0.00% 0.00% 2040 243.12% 144.41% 6.82% 100.97% 3.25% 100.24% 42.60% 0.00% 0.00% 2050 297.79% 159.74% 6.57% 101.32% 3.23% 100.33% 45.49% 0.00% 0.00% 2075 489.15% 204.16% 6.32% 101.64% 3.21% 100.41% 53.86% 0.00% 0.00% 2100 804.38% 261.14% 6.08% 101.76% 3.20% 100.44% 63.53% 0.00% 0.00%
Scenario 3 2005 100.00% 100.00% 8.14% 100.00% 3.31% 100.00% 37.32% 0.00% 0.00% 2010 117.27% 105.42% 7.89% 100.88% 3.25% 100.22% 37.32% 0.00% 0.00% 2015 136.12% 111.21% 7.71% 101.39% 3.22% 100.35% 37.35% 0.00% 0.00% 2020 155.38% 117.36% 7.49% 101.69% 3.20% 100.42% 37.89% 0.00% 0.00% 2030 196.17% 130.48% 7.24% 101.68% 3.20% 100.42% 40.04% 0.00% 0.00% 2040 243.12% 144.41% 6.82% 100.97% 3.25% 100.24% 42.60% 0.00% 0.00% 2050 297.80% 159.74% 6.57% 101.33% 3.23% 100.33% 45.49% 0.00% 0.00% 2075 489.19% 204.16% 6.32% 101.65% 3.21% 100.41% 53.84% 0.00% 0.00% 2100 804.61% 261.14% 6.07% 101.79% 3.20% 100.44% 63.49% 0.00% 0.00%

43
Table 9 Simulation Results – BANGLADESH (continued)
GNP GNP per employee
Net national saving-GNP
ratio
Capital-labor ratio Interest rate Wage rate Debt-GDP
ratio
Pension premium to
wage
Pension burden-GDP
ratio Scenario 4 2005 100.00% 100.00% 8.14% 100.00% 3.31% 100.00% 37.32% 0.00% 0.00%
2010 117.27% 105.42% 7.89% 100.88% 3.25% 100.22% 37.32% 0.00% 0.00% 2015 136.12% 111.21% 7.71% 101.39% 3.22% 100.35% 37.35% 0.00% 0.00% 2020 155.38% 117.36% 7.49% 101.70% 3.20% 100.42% 37.89% 0.00% 0.00% 2030 196.17% 130.48% 7.24% 101.68% 3.20% 100.42% 40.04% 0.00% 0.00% 2040 243.12% 144.41% 6.81% 100.97% 3.25% 100.24% 42.60% 0.00% 0.00% 2050 297.80% 159.74% 6.57% 101.33% 3.23% 100.33% 45.49% 0.00% 0.00% 2075 489.20% 204.16% 6.32% 101.64% 3.21% 100.41% 53.85% 0.00% 0.00% 2100 804.52% 261.14% 6.08% 101.77% 3.20% 100.44% 63.52% 0.00% 0.00%
Scenario 5 2005 100.00% 100.00% 8.14% 100.00% 3.31% 100.00% 37.32% 0.00% 0.00% 2010 117.27% 105.42% 7.89% 100.88% 3.25% 100.22% 37.32% 0.00% 0.00% 2015 136.12% 111.21% 7.71% 101.39% 3.22% 100.35% 37.35% 0.00% 0.00% 2020 155.38% 117.36% 7.49% 101.69% 3.20% 100.42% 37.89% 0.00% 0.00% 2030 196.17% 130.48% 7.24% 101.68% 3.20% 100.42% 40.04% 0.00% 0.00% 2040 243.12% 144.41% 6.81% 100.97% 3.25% 100.24% 42.60% 0.00% 0.00% 2050 297.80% 159.74% 6.57% 101.33% 3.23% 100.33% 45.49% 0.00% 0.00% 2075 489.20% 204.16% 6.32% 101.65% 3.21% 100.41% 53.84% 0.00% 0.00% 2100 804.59% 261.14% 6.07% 101.78% 3.20% 100.44% 63.50% 0.00% 0.00%
Scenario 6 2005 100.00% 100.00% 8.19% 100.00% 3.31% 100.00% 37.47% 0.00% 0.00% 2010 117.25% 105.41% 7.93% 100.84% 3.26% 100.21% 37.48% 0.00% 0.00% 2015 136.10% 111.19% 7.72% 101.30% 3.23% 100.32% 37.49% 0.00% 0.00% 2020 155.37% 117.35% 7.47% 101.68% 3.21% 100.42% 38.00% 0.00% 0.00% 2030 196.17% 130.48% 7.22% 101.73% 3.21% 100.43% 40.11% 0.00% 0.00% 2040 243.12% 144.40% 6.80% 101.04% 3.25% 100.26% 42.64% 0.00% 0.00% 2050 297.80% 159.74% 6.56% 101.41% 3.23% 100.35% 45.51% 0.00% 0.00% 2075 489.24% 204.15% 6.31% 101.75% 3.21% 100.43% 53.85% 0.00% 0.00% 2100 804.77% 261.13% 6.06% 101.90% 3.20% 100.47% 63.49% 0.00% 0.00%
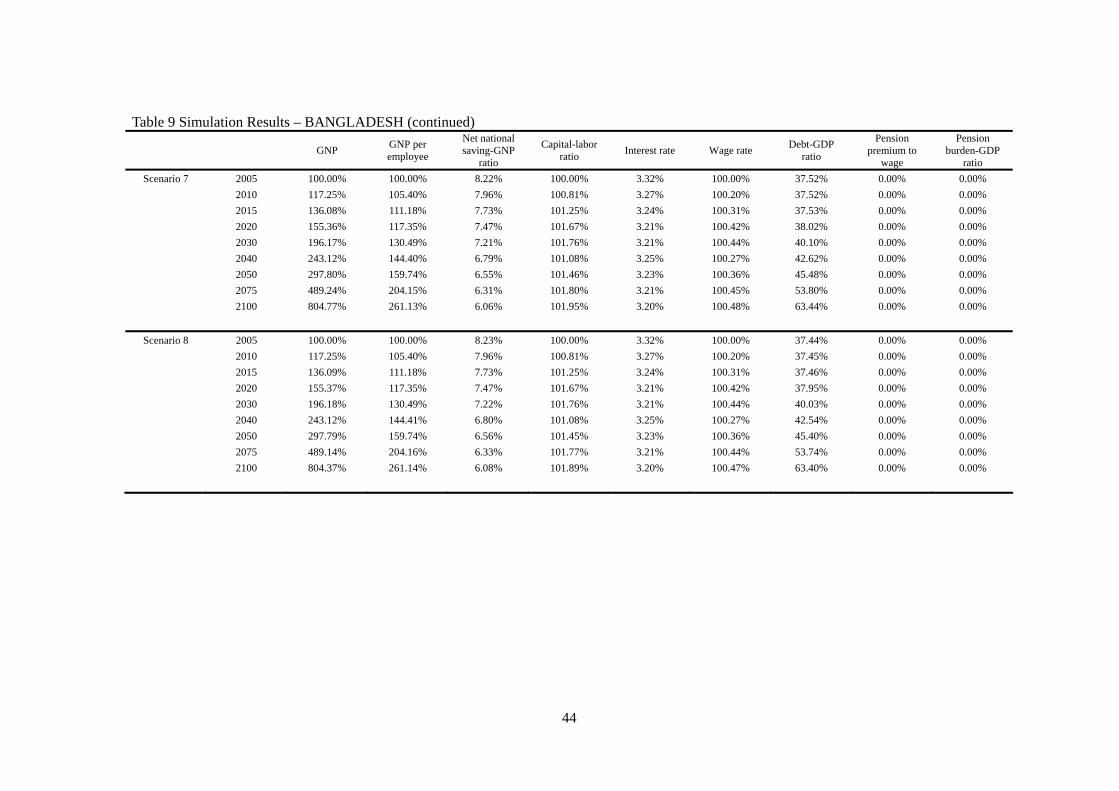
44
Table 9 Simulation Results – BANGLADESH (continued)
GNP GNP per employee
Net national saving-GNP
ratio
Capital-labor ratio Interest rate Wage rate Debt-GDP
ratio
Pension premium to
wage
Pension burden-GDP
ratio Scenario 7 2005 100.00% 100.00% 8.22% 100.00% 3.32% 100.00% 37.52% 0.00% 0.00%
2010 117.25% 105.40% 7.96% 100.81% 3.27% 100.20% 37.52% 0.00% 0.00% 2015 136.08% 111.18% 7.73% 101.25% 3.24% 100.31% 37.53% 0.00% 0.00% 2020 155.36% 117.35% 7.47% 101.67% 3.21% 100.42% 38.02% 0.00% 0.00% 2030 196.17% 130.49% 7.21% 101.76% 3.21% 100.44% 40.10% 0.00% 0.00% 2040 243.12% 144.40% 6.79% 101.08% 3.25% 100.27% 42.62% 0.00% 0.00% 2050 297.80% 159.74% 6.55% 101.46% 3.23% 100.36% 45.48% 0.00% 0.00% 2075 489.24% 204.15% 6.31% 101.80% 3.21% 100.45% 53.80% 0.00% 0.00% 2100 804.77% 261.13% 6.06% 101.95% 3.20% 100.48% 63.44% 0.00% 0.00%
Scenario 8 2005 100.00% 100.00% 8.23% 100.00% 3.32% 100.00% 37.44% 0.00% 0.00% 2010 117.25% 105.40% 7.96% 100.81% 3.27% 100.20% 37.45% 0.00% 0.00% 2015 136.09% 111.18% 7.73% 101.25% 3.24% 100.31% 37.46% 0.00% 0.00% 2020 155.37% 117.35% 7.47% 101.67% 3.21% 100.42% 37.95% 0.00% 0.00% 2030 196.18% 130.49% 7.22% 101.76% 3.21% 100.44% 40.03% 0.00% 0.00% 2040 243.12% 144.41% 6.80% 101.08% 3.25% 100.27% 42.54% 0.00% 0.00% 2050 297.79% 159.74% 6.56% 101.45% 3.23% 100.36% 45.40% 0.00% 0.00% 2075 489.14% 204.16% 6.33% 101.77% 3.21% 100.44% 53.74% 0.00% 0.00% 2100 804.37% 261.14% 6.08% 101.89% 3.20% 100.47% 63.40% 0.00% 0.00%

45
Table 10 Simulation Results – PHILIPPINES
GNP GNP per employee
Net national saving-GNP
ratio
Capital-labor ratio Interest rate Wage rate Debt-GDP
ratio
Pension premium to
wage
Pension burden-GDP
ratio Scenario 1 2005 100.00% 100.00% 23.01% 100.00% 3.31% 100.00% 55.80% 0.00% 0.00%
2010 118.06% 106.35% 22.73% 100.88% 3.25% 100.22% 55.80% 0.00% 0.00% 2015 138.25% 113.42% 22.54% 101.39% 3.22% 100.35% 55.83% 0.00% 0.00% 2020 159.94% 120.95% 22.29% 101.70% 3.20% 100.42% 56.37% 0.00% 0.00% 2030 207.59% 136.63% 22.08% 101.68% 3.20% 100.42% 59.11% 0.00% 0.00% 2040 263.30% 153.39% 21.72% 100.97% 3.25% 100.24% 62.97% 0.00% 0.00% 2050 330.40% 169.76% 21.47% 101.33% 3.23% 100.33% 67.28% 0.00% 0.00% 2075 569.61% 216.28% 21.12% 101.66% 3.21% 100.41% 80.08% 0.00% 0.00% 2100 986.58% 277.39% 20.77% 101.81% 3.20% 100.45% 93.68% 0.00% 0.00%
Scenario 2 2005 100.00% 100.00% 23.01% 100.00% 3.31% 100.00% 55.78% 0.00% 0.00% 2010 118.06% 106.35% 22.73% 100.88% 3.25% 100.22% 55.78% 0.00% 0.00% 2015 138.25% 113.42% 22.54% 101.39% 3.22% 100.35% 55.80% 0.00% 0.00% 2020 159.94% 120.95% 22.29% 101.69% 3.20% 100.42% 56.35% 0.00% 0.00% 2030 207.55% 136.64% 22.09% 101.68% 3.20% 100.42% 59.10% 0.00% 0.00% 2040 263.11% 153.44% 21.72% 100.97% 3.25% 100.24% 62.99% 0.00% 0.00% 2050 329.79% 169.87% 21.46% 101.32% 3.23% 100.33% 67.37% 0.00% 0.00% 2075 564.10% 216.82% 21.06% 101.64% 3.21% 100.41% 80.71% 0.00% 0.00% 2100 961.54% 278.57% 20.64% 101.76% 3.20% 100.44% 95.63% 0.00% 0.00%
Scenario 3 2005 100.00% 100.00% 23.01% 100.00% 3.31% 100.00% 55.78% 0.00% 0.00% 2010 118.06% 106.35% 22.73% 100.88% 3.25% 100.22% 55.78% 0.00% 0.00% 2015 138.25% 113.42% 22.54% 101.39% 3.22% 100.35% 55.80% 0.00% 0.00% 2020 159.94% 120.95% 22.29% 101.69% 3.20% 100.42% 56.35% 0.00% 0.00% 2030 207.55% 136.64% 22.08% 101.68% 3.20% 100.42% 59.10% 0.00% 0.00% 2040 263.13% 153.43% 21.72% 100.97% 3.25% 100.24% 62.99% 0.00% 0.00% 2050 329.91% 169.85% 21.46% 101.33% 3.23% 100.33% 67.34% 0.00% 0.00% 2075 566.04% 216.58% 21.08% 101.65% 3.21% 100.41% 80.46% 0.00% 0.00% 2100 973.86% 277.77% 20.72% 101.79% 3.20% 100.44% 94.61% 0.00% 0.00%

46
Table 10 Simulation Results – PHILIPPINES (continued)
GNP GNP per employee
Net national saving-GNP
ratio
Capital-labor ratio Interest rate Wage rate Debt-GDP
ratio
Pension premium to
wage
Pension burden-GDP
ratio Scenario 4 2005 100.00% 100.00% 23.01% 100.00% 3.31% 100.00% 55.78% 0.00% 0.00%
2010 118.06% 106.35% 22.73% 100.88% 3.25% 100.22% 55.78% 0.00% 0.00% 2015 138.25% 113.42% 22.54% 101.39% 3.22% 100.35% 55.80% 0.00% 0.00% 2020 159.94% 120.95% 22.29% 101.70% 3.20% 100.42% 56.35% 0.00% 0.00% 2030 207.59% 136.63% 22.09% 101.68% 3.20% 100.42% 59.09% 0.00% 0.00% 2040 263.25% 153.41% 21.72% 100.97% 3.25% 100.24% 62.97% 0.00% 0.00% 2050 330.20% 169.80% 21.47% 101.33% 3.23% 100.33% 67.29% 0.00% 0.00% 2075 566.76% 216.60% 21.08% 101.64% 3.21% 100.41% 80.41% 0.00% 0.00% 2100 970.61% 278.32% 20.68% 101.77% 3.20% 100.44% 94.94% 0.00% 0.00%
Scenario 5 2005 100.00% 100.00% 23.01% 100.00% 3.31% 100.00% 55.78% 0.00% 0.00% 2010 118.06% 106.35% 22.73% 100.88% 3.25% 100.22% 55.78% 0.00% 0.00% 2015 138.25% 113.42% 22.54% 101.39% 3.22% 100.35% 55.80% 0.00% 0.00% 2020 159.94% 120.95% 22.29% 101.69% 3.20% 100.42% 56.35% 0.00% 0.00% 2030 207.57% 136.64% 22.09% 101.68% 3.20% 100.42% 59.09% 0.00% 0.00% 2040 263.21% 153.42% 21.72% 100.97% 3.25% 100.24% 62.97% 0.00% 0.00% 2050 330.10% 169.82% 21.47% 101.33% 3.23% 100.33% 67.31% 0.00% 0.00% 2075 566.85% 216.55% 21.09% 101.65% 3.21% 100.41% 80.38% 0.00% 0.00% 2100 974.00% 277.98% 20.71% 101.78% 3.20% 100.44% 94.63% 0.00% 0.00%
Scenario 6 2005 100.00% 100.00% 23.05% 100.00% 3.31% 100.00% 55.85% 0.00% 0.00% 2010 118.06% 106.35% 22.77% 100.84% 3.26% 100.21% 55.86% 0.00% 0.00% 2015 138.24% 113.42% 22.56% 101.30% 3.23% 100.32% 55.89% 0.00% 0.00% 2020 159.94% 120.95% 22.28% 101.68% 3.21% 100.42% 56.41% 0.00% 0.00% 2030 207.59% 136.63% 22.07% 101.73% 3.21% 100.43% 59.11% 0.00% 0.00% 2040 263.29% 153.39% 21.70% 101.04% 3.25% 100.26% 62.96% 0.00% 0.00% 2050 330.38% 169.75% 21.46% 101.41% 3.23% 100.35% 67.24% 0.00% 0.00% 2075 569.55% 216.26% 21.12% 101.75% 3.21% 100.43% 80.04% 0.00% 0.00% 2100 986.49% 277.37% 20.77% 101.90% 3.20% 100.47% 93.63% 0.00% 0.00%

47
Table 10 Simulation Results – PHILIPPINES (continued)
GNP GNP per employee
Net national saving-GNP
ratio
Capital-labor ratio Interest rate Wage rate Debt-GDP
ratio
Pension premium to
wage
Pension burden-GDP
ratio Scenario 7 2005 100.00% 100.00% 23.08% 100.00% 3.32% 100.00% 55.89% 0.00% 0.00%
2010 118.06% 106.35% 22.80% 100.81% 3.27% 100.20% 55.90% 0.00% 0.00% 2015 138.24% 113.41% 22.57% 101.25% 3.24% 100.31% 55.92% 0.00% 0.00% 2020 159.94% 120.95% 22.28% 101.67% 3.21% 100.42% 56.43% 0.00% 0.00% 2030 207.59% 136.63% 22.06% 101.76% 3.21% 100.44% 59.11% 0.00% 0.00% 2040 263.28% 153.38% 21.69% 101.08% 3.25% 100.27% 62.95% 0.00% 0.00% 2050 330.37% 169.74% 21.46% 101.46% 3.23% 100.36% 67.23% 0.00% 0.00% 2075 569.52% 216.24% 21.12% 101.80% 3.21% 100.45% 80.01% 0.00% 0.00% 2100 986.43% 277.35% 20.77% 101.95% 3.20% 100.48% 93.60% 0.00% 0.00%
Scenario 8 2005 100.00% 100.00% 23.08% 100.00% 3.32% 100.00% 55.86% 0.00% 0.00% 2010 118.06% 106.35% 22.80% 100.81% 3.27% 100.20% 55.88% 0.00% 0.00% 2015 138.24% 113.41% 22.57% 101.25% 3.24% 100.31% 55.90% 0.00% 0.00% 2020 159.94% 120.95% 22.28% 101.67% 3.21% 100.42% 56.41% 0.00% 0.00% 2030 207.55% 136.64% 22.06% 101.76% 3.21% 100.44% 59.11% 0.00% 0.00% 2040 263.10% 153.43% 21.69% 101.08% 3.25% 100.27% 62.97% 0.00% 0.00% 2050 329.75% 169.85% 21.45% 101.45% 3.23% 100.36% 67.32% 0.00% 0.00% 2075 564.01% 216.79% 21.06% 101.77% 3.21% 100.44% 80.64% 0.00% 0.00% 2100 961.39% 278.53% 20.64% 101.89% 3.20% 100.47% 95.56% 0.00% 0.00%

48
Table 11 Simulation Results – THAILAND
GNP GNP per employee
Net national saving-GNP
ratio
Capital-labor ratio Interest rate Wage rate Debt-GDP
ratio
Pension premium to
wage
Pension burden-GDP
ratio Scenario 1 2005 100.00% 100.00% 27.91% 100.00% 3.31% 100.00% 37.90% 0.00% 0.00%
2010 111.78% 109.07% 27.45% 100.88% 3.25% 100.22% 37.90% 0.00% 0.00% 2015 123.18% 120.78% 26.83% 101.39% 3.22% 100.35% 37.91% 0.00% 0.00% 2020 133.44% 134.25% 26.08% 101.70% 3.20% 100.42% 38.18% 0.00% 0.00% 2030 148.07% 160.49% 25.05% 101.68% 3.20% 100.42% 40.40% 0.00% 0.00% 2040 154.90% 179.05% 24.71% 100.97% 3.25% 100.24% 45.44% 0.00% 0.00% 2050 158.85% 195.63% 24.64% 101.33% 3.23% 100.33% 52.75% 0.00% 0.00% 2075 174.71% 250.29% 24.08% 101.66% 3.21% 100.41% 77.64% 0.00% 0.00% 2100 189.49% 315.44% 23.43% 101.81% 3.20% 100.45% 121.31% 0.00% 0.00%
Scenario 2 2005 100.00% 100.00% 27.91% 100.00% 3.31% 100.00% 37.81% 0.00% 0.00% 2010 111.78% 109.07% 27.45% 100.88% 3.25% 100.22% 37.81% 0.00% 0.00% 2015 123.18% 120.79% 26.83% 101.39% 3.22% 100.35% 37.81% 0.00% 0.00% 2020 133.45% 134.26% 26.08% 101.69% 3.20% 100.42% 38.08% 0.00% 0.00% 2030 148.07% 160.50% 25.05% 101.68% 3.20% 100.42% 40.29% 0.00% 0.00% 2040 154.88% 179.08% 24.71% 100.97% 3.25% 100.24% 45.31% 0.00% 0.00% 2050 158.77% 195.72% 24.64% 101.32% 3.23% 100.33% 52.60% 0.00% 0.00% 2075 174.19% 250.70% 24.07% 101.64% 3.21% 100.41% 77.56% 0.00% 0.00% 2100 187.76% 316.42% 23.38% 101.76% 3.20% 100.44% 121.86% 0.00% 0.00%
Scenario 3 2005 100.00% 100.00% 27.91% 100.00% 3.31% 100.00% 37.81% 0.00% 0.00% 2010 111.78% 109.07% 27.45% 100.88% 3.25% 100.22% 37.81% 0.00% 0.00% 2015 123.18% 120.79% 26.83% 101.39% 3.22% 100.35% 37.81% 0.00% 0.00% 2020 133.45% 134.26% 26.08% 101.69% 3.20% 100.42% 38.08% 0.00% 0.00% 2030 148.06% 160.50% 25.05% 101.68% 3.20% 100.42% 40.29% 0.00% 0.00% 2040 154.88% 179.08% 24.71% 100.97% 3.25% 100.24% 45.30% 0.00% 0.00% 2050 158.79% 195.70% 24.64% 101.33% 3.23% 100.33% 52.60% 0.00% 0.00% 2075 174.42% 250.49% 24.08% 101.65% 3.21% 100.41% 77.46% 0.00% 0.00% 2100 188.81% 315.69% 23.42% 101.79% 3.20% 100.44% 121.21% 0.00% 0.00%

49
Table 11 Simulation Results – THAILAND (continued)
GNP GNP per employee
Net national saving-GNP
ratio
Capital-labor ratio Interest rate Wage rate Debt-GDP
ratio
Pension premium to
wage
Pension burden-GDP
ratio Scenario 4 2005 100.00% 100.00% 27.91% 100.00% 3.31% 100.00% 37.81% 0.00% 0.00%
2010 111.78% 109.07% 27.45% 100.88% 3.25% 100.22% 37.81% 0.00% 0.00% 2015 123.18% 120.79% 26.83% 101.39% 3.22% 100.35% 37.81% 0.00% 0.00% 2020 133.45% 134.26% 26.08% 101.70% 3.20% 100.42% 38.08% 0.00% 0.00% 2030 148.07% 160.49% 25.05% 101.68% 3.20% 100.42% 40.28% 0.00% 0.00% 2040 154.90% 179.06% 24.71% 100.97% 3.25% 100.24% 45.30% 0.00% 0.00% 2050 158.82% 195.67% 24.64% 101.33% 3.23% 100.33% 52.58% 0.00% 0.00% 2075 174.41% 250.58% 24.08% 101.64% 3.21% 100.41% 77.47% 0.00% 0.00% 2100 188.25% 316.28% 23.40% 101.77% 3.20% 100.44% 121.55% 0.00% 0.00%
Scenario 5 2005 100.00% 100.00% 27.91% 100.00% 3.31% 100.00% 37.81% 0.00% 0.00% 2010 111.78% 109.07% 27.45% 100.88% 3.25% 100.22% 37.81% 0.00% 0.00% 2015 123.18% 120.79% 26.83% 101.39% 3.22% 100.35% 37.81% 0.00% 0.00% 2020 133.45% 134.26% 26.08% 101.69% 3.20% 100.42% 38.08% 0.00% 0.00% 2030 148.07% 160.50% 25.05% 101.68% 3.20% 100.42% 40.28% 0.00% 0.00% 2040 154.89% 179.07% 24.71% 100.97% 3.25% 100.24% 45.30% 0.00% 0.00% 2050 158.81% 195.68% 24.64% 101.33% 3.23% 100.33% 52.59% 0.00% 0.00% 2075 174.46% 250.51% 24.08% 101.65% 3.21% 100.41% 77.45% 0.00% 0.00% 2100 188.63% 315.95% 23.41% 101.78% 3.20% 100.44% 121.32% 0.00% 0.00%
Scenario 6 2005 100.00% 100.00% 27.94% 100.00% 3.31% 100.00% 37.94% 0.00% 0.00% 2010 111.78% 109.07% 27.48% 100.84% 3.26% 100.21% 37.94% 0.00% 0.00% 2015 123.18% 120.78% 26.85% 101.30% 3.23% 100.32% 37.93% 0.00% 0.00% 2020 133.45% 134.26% 26.07% 101.68% 3.21% 100.42% 38.18% 0.00% 0.00% 2030 148.07% 160.49% 25.02% 101.73% 3.21% 100.43% 40.34% 0.00% 0.00% 2040 154.90% 179.04% 24.69% 101.04% 3.25% 100.26% 45.34% 0.00% 0.00% 2050 158.84% 195.62% 24.63% 101.41% 3.23% 100.35% 52.60% 0.00% 0.00% 2075 174.70% 250.28% 24.09% 101.75% 3.21% 100.43% 77.37% 0.00% 0.00% 2100 189.49% 315.44% 23.44% 101.90% 3.20% 100.47% 120.84% 0.00% 0.00%

50
Table 11 Simulation Results – THAILAND (continued)
GNP GNP per employee
Net national saving-GNP
ratio
Capital-labor ratio Interest rate Wage rate Debt-GDP
ratio
Pension premium to
wage
Pension burden-GDP
ratio Scenario 7 2005 100.00% 100.00% 27.97% 100.00% 3.32% 100.00% 37.96% 0.00% 0.00%
2010 111.78% 109.07% 27.51% 100.81% 3.27% 100.20% 37.96% 0.00% 0.00% 2015 123.18% 120.79% 26.85% 101.25% 3.24% 100.31% 37.95% 0.00% 0.00% 2020 133.46% 134.27% 26.06% 101.67% 3.21% 100.42% 38.18% 0.00% 0.00% 2030 148.07% 160.49% 25.00% 101.76% 3.21% 100.44% 40.31% 0.00% 0.00% 2040 154.90% 179.04% 24.68% 101.08% 3.25% 100.27% 45.27% 0.00% 0.00% 2050 158.84% 195.61% 24.62% 101.46% 3.23% 100.36% 52.51% 0.00% 0.00% 2075 174.69% 250.27% 24.09% 101.80% 3.21% 100.45% 77.20% 0.00% 0.00% 2100 189.49% 315.44% 23.45% 101.95% 3.20% 100.48% 120.55% 0.00% 0.00%
Scenario 8 2005 100.00% 100.00% 27.97% 100.00% 3.32% 100.00% 37.87% 0.00% 0.00% 2010 111.79% 109.07% 27.51% 100.81% 3.27% 100.20% 37.87% 0.00% 0.00% 2015 123.18% 120.79% 26.86% 101.25% 3.24% 100.31% 37.85% 0.00% 0.00% 2020 133.46% 134.27% 26.06% 101.67% 3.21% 100.42% 38.08% 0.00% 0.00% 2030 148.07% 160.51% 25.00% 101.76% 3.21% 100.44% 40.20% 0.00% 0.00% 2040 154.87% 179.07% 24.68% 101.08% 3.25% 100.27% 45.14% 0.00% 0.00% 2050 158.76% 195.70% 24.62% 101.45% 3.23% 100.36% 52.36% 0.00% 0.00% 2075 174.18% 250.68% 24.07% 101.77% 3.21% 100.44% 77.12% 0.00% 0.00% 2100 187.76% 316.42% 23.40% 101.89% 3.20% 100.47% 121.10% 0.00% 0.00%

51
Table 12 Simulation Results – VIETNAM
GNP GNP per employee
Net national saving-GNP
ratio
Capital-labor ratio Interest rate Wage rate Debt-GDP
ratio
Pension premium to
wage
Pension burden-GDP
ratio Scenario 1 2005 100.00% 100.00% 29.25% 100.00% 3.31% 100.00% 42.00% 0.00% 0.00%
2010 117.61% 106.22% 29.31% 100.88% 3.25% 100.22% 42.00% 0.00% 0.00% 2015 137.37% 114.92% 29.07% 101.39% 3.22% 100.35% 42.04% 0.00% 0.00% 2020 156.65% 125.92% 28.44% 101.70% 3.20% 100.42% 42.76% 0.00% 0.00% 2030 192.80% 149.28% 27.49% 101.68% 3.20% 100.42% 45.50% 0.00% 0.00% 2040 227.67% 171.91% 26.81% 100.97% 3.25% 100.24% 49.24% 0.00% 0.00% 2050 260.53% 198.30% 26.03% 101.33% 3.23% 100.33% 54.12% 0.00% 0.00% 2075 332.84% 247.74% 25.73% 101.66% 3.21% 100.41% 74.95% 0.00% 0.00% 2100 428.27% 316.07% 25.03% 101.81% 3.20% 100.45% 104.74% 0.00% 0.00%
Scenario 2 2005 100.01% 100.01% 29.26% 100.00% 3.31% 100.00% 41.75% 0.00% 0.00% 2010 117.61% 106.23% 29.31% 100.88% 3.25% 100.22% 41.76% 0.00% 0.00% 2015 137.38% 114.92% 29.08% 101.39% 3.22% 100.35% 41.81% 0.00% 0.00% 2020 156.66% 125.92% 28.44% 101.69% 3.20% 100.42% 42.52% 0.00% 0.00% 2030 192.81% 149.29% 27.49% 101.68% 3.20% 100.42% 45.25% 0.00% 0.00% 2040 227.66% 171.94% 26.82% 100.97% 3.25% 100.24% 48.99% 0.00% 0.00% 2050 260.44% 198.37% 26.03% 101.32% 3.23% 100.33% 53.84% 0.00% 0.00% 2075 332.12% 248.04% 25.72% 101.64% 3.21% 100.41% 74.65% 0.00% 0.00% 2100 425.49% 316.78% 25.01% 101.76% 3.20% 100.44% 104.68% 0.00% 0.00%
Scenario 3 2005 100.01% 100.01% 29.26% 100.00% 3.31% 100.00% 41.75% 0.00% 0.00% 2010 117.61% 106.23% 29.31% 100.88% 3.25% 100.22% 41.76% 0.00% 0.00% 2015 137.38% 114.92% 29.08% 101.39% 3.22% 100.35% 41.81% 0.00% 0.00% 2020 156.66% 125.92% 28.44% 101.69% 3.20% 100.42% 42.52% 0.00% 0.00% 2030 192.81% 149.29% 27.49% 101.68% 3.20% 100.42% 45.26% 0.00% 0.00% 2040 227.66% 171.93% 26.82% 100.97% 3.25% 100.24% 48.98% 0.00% 0.00% 2050 260.46% 198.36% 26.03% 101.33% 3.23% 100.33% 53.84% 0.00% 0.00% 2075 332.42% 247.91% 25.73% 101.65% 3.21% 100.41% 74.58% 0.00% 0.00% 2100 427.06% 316.30% 25.03% 101.79% 3.20% 100.44% 104.34% 0.00% 0.00%
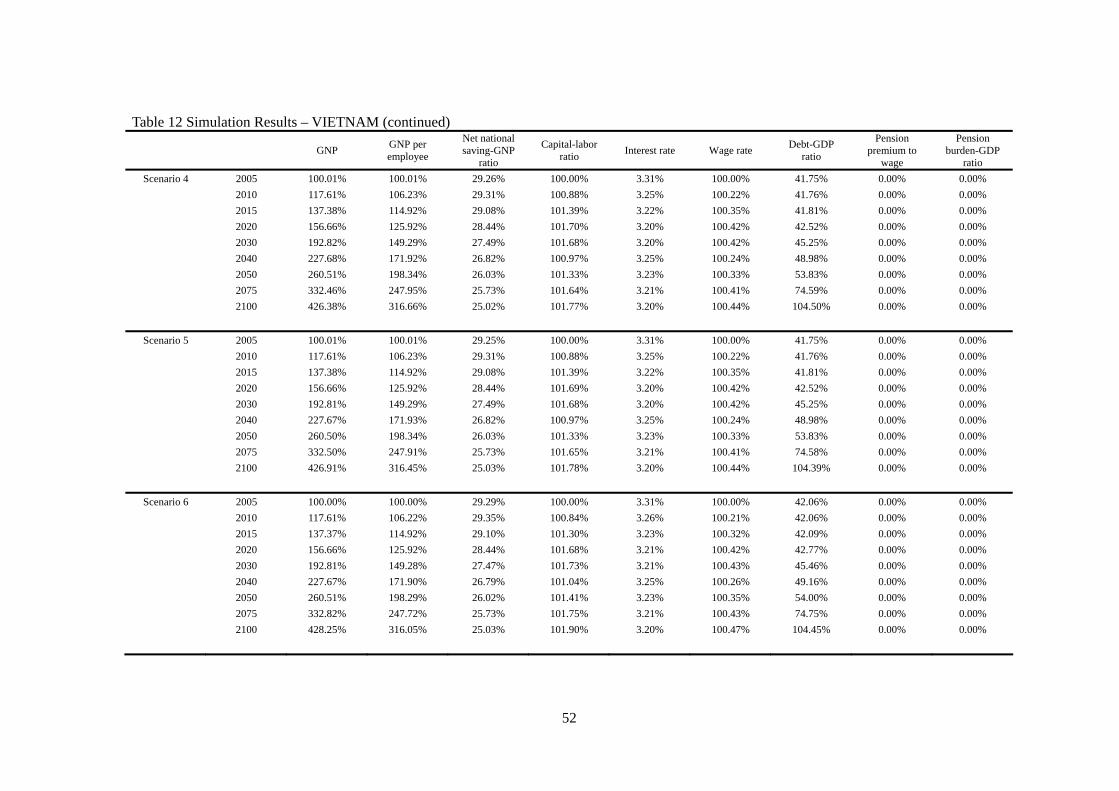
52
Table 12 Simulation Results – VIETNAM (continued)
GNP GNP per employee
Net national saving-GNP
ratio
Capital-labor ratio Interest rate Wage rate Debt-GDP
ratio
Pension premium to
wage
Pension burden-GDP
ratio Scenario 4 2005 100.01% 100.01% 29.26% 100.00% 3.31% 100.00% 41.75% 0.00% 0.00%
2010 117.61% 106.23% 29.31% 100.88% 3.25% 100.22% 41.76% 0.00% 0.00% 2015 137.38% 114.92% 29.08% 101.39% 3.22% 100.35% 41.81% 0.00% 0.00% 2020 156.66% 125.92% 28.44% 101.70% 3.20% 100.42% 42.52% 0.00% 0.00% 2030 192.82% 149.29% 27.49% 101.68% 3.20% 100.42% 45.25% 0.00% 0.00% 2040 227.68% 171.92% 26.82% 100.97% 3.25% 100.24% 48.98% 0.00% 0.00% 2050 260.51% 198.34% 26.03% 101.33% 3.23% 100.33% 53.83% 0.00% 0.00% 2075 332.46% 247.95% 25.73% 101.64% 3.21% 100.41% 74.59% 0.00% 0.00% 2100 426.38% 316.66% 25.02% 101.77% 3.20% 100.44% 104.50% 0.00% 0.00%
Scenario 5 2005 100.01% 100.01% 29.25% 100.00% 3.31% 100.00% 41.75% 0.00% 0.00% 2010 117.61% 106.23% 29.31% 100.88% 3.25% 100.22% 41.76% 0.00% 0.00% 2015 137.38% 114.92% 29.08% 101.39% 3.22% 100.35% 41.81% 0.00% 0.00% 2020 156.66% 125.92% 28.44% 101.69% 3.20% 100.42% 42.52% 0.00% 0.00% 2030 192.81% 149.29% 27.49% 101.68% 3.20% 100.42% 45.25% 0.00% 0.00% 2040 227.67% 171.93% 26.82% 100.97% 3.25% 100.24% 48.98% 0.00% 0.00% 2050 260.50% 198.34% 26.03% 101.33% 3.23% 100.33% 53.83% 0.00% 0.00% 2075 332.50% 247.91% 25.73% 101.65% 3.21% 100.41% 74.58% 0.00% 0.00% 2100 426.91% 316.45% 25.03% 101.78% 3.20% 100.44% 104.39% 0.00% 0.00%
Scenario 6 2005 100.00% 100.00% 29.29% 100.00% 3.31% 100.00% 42.06% 0.00% 0.00% 2010 117.61% 106.22% 29.35% 100.84% 3.26% 100.21% 42.06% 0.00% 0.00% 2015 137.37% 114.92% 29.10% 101.30% 3.23% 100.32% 42.09% 0.00% 0.00% 2020 156.66% 125.92% 28.44% 101.68% 3.21% 100.42% 42.77% 0.00% 0.00% 2030 192.81% 149.28% 27.47% 101.73% 3.21% 100.43% 45.46% 0.00% 0.00% 2040 227.67% 171.90% 26.79% 101.04% 3.25% 100.26% 49.16% 0.00% 0.00% 2050 260.51% 198.29% 26.02% 101.41% 3.23% 100.35% 54.00% 0.00% 0.00% 2075 332.82% 247.72% 25.73% 101.75% 3.21% 100.43% 74.75% 0.00% 0.00% 2100 428.25% 316.05% 25.03% 101.90% 3.20% 100.47% 104.45% 0.00% 0.00%

53
Table 12 Simulation Results – VIETNAM (continued)
GNP GNP per employee
Net national saving-GNP
ratio
Capital-labor ratio Interest rate Wage rate Debt-GDP
ratio
Pension premium to
wage
Pension burden-GDP
ratio Scenario 7 2005 100.00% 100.00% 29.32% 100.00% 3.32% 100.00% 42.09% 0.00% 0.00%
2010 117.61% 106.22% 29.38% 100.81% 3.27% 100.20% 42.10% 0.00% 0.00% 2015 137.37% 114.92% 29.11% 101.25% 3.24% 100.31% 42.12% 0.00% 0.00% 2020 156.66% 125.93% 28.44% 101.67% 3.21% 100.42% 42.78% 0.00% 0.00% 2030 192.81% 149.29% 27.46% 101.76% 3.21% 100.44% 45.44% 0.00% 0.00% 2040 227.67% 171.90% 26.78% 101.08% 3.25% 100.27% 49.11% 0.00% 0.00% 2050 260.50% 198.28% 26.01% 101.46% 3.23% 100.36% 53.93% 0.00% 0.00% 2075 332.80% 247.71% 25.73% 101.80% 3.21% 100.45% 74.62% 0.00% 0.00% 2100 428.23% 316.04% 25.04% 101.95% 3.20% 100.48% 104.27% 0.00% 0.00%
Scenario 8 2005 100.01% 100.01% 29.33% 100.00% 3.32% 100.00% 41.84% 0.00% 0.00% 2010 117.61% 106.23% 29.38% 100.81% 3.27% 100.20% 41.86% 0.00% 0.00% 2015 137.38% 114.92% 29.12% 101.25% 3.24% 100.31% 41.89% 0.00% 0.00% 2020 156.67% 125.93% 28.44% 101.67% 3.21% 100.42% 42.55% 0.00% 0.00% 2030 192.82% 149.30% 27.46% 101.76% 3.21% 100.44% 45.20% 0.00% 0.00% 2040 227.65% 171.93% 26.79% 101.08% 3.25% 100.27% 48.85% 0.00% 0.00% 2050 260.42% 198.36% 26.02% 101.45% 3.23% 100.36% 53.65% 0.00% 0.00% 2075 332.09% 248.02% 25.73% 101.77% 3.21% 100.44% 74.33% 0.00% 0.00% 2100 425.46% 316.75% 25.02% 101.89% 3.20% 100.47% 104.21% 0.00% 0.00%

54
Table 13 Simulation Results – BRAZIL
GNP GNP per employee
Net national saving-GNP
ratio
Capital-labor ratio Interest rate Wage rate Debt-GDP
ratio
Pension premium to
wage
Pension burden-GDP
ratio Scenario 1 2005 100.00% 100.00% 20.68% 100.00% 3.31% 100.00% 45.10% 0.00% 0.00%
2010 114.96% 106.41% 20.34% 100.88% 3.25% 100.22% 45.10% 0.00% 0.00% 2015 129.97% 114.13% 19.91% 101.39% 3.22% 100.35% 45.10% 0.00% 0.00% 2020 145.22% 122.60% 19.50% 101.70% 3.20% 100.42% 45.10% 0.00% 0.00% 2030 175.25% 139.60% 19.09% 101.68% 3.20% 100.42% 45.53% 0.00% 0.00% 2040 204.25% 157.14% 18.74% 100.97% 3.25% 100.24% 46.84% 0.00% 0.00% 2050 232.63% 176.54% 18.27% 101.33% 3.23% 100.33% 48.41% 0.00% 0.00% 2075 315.73% 224.22% 18.14% 101.66% 3.21% 100.41% 54.71% 0.00% 0.00% 2100 428.54% 286.47% 17.98% 101.81% 3.20% 100.45% 63.75% 0.00% 0.00%
Scenario 2 2005 100.00% 100.00% 20.68% 100.00% 3.31% 100.00% 45.05% 0.00% 0.00% 2010 114.96% 106.41% 20.34% 100.88% 3.25% 100.22% 45.05% 0.00% 0.00% 2015 129.97% 114.13% 19.91% 101.39% 3.22% 100.35% 45.05% 0.00% 0.00% 2020 145.22% 122.60% 19.50% 101.69% 3.20% 100.42% 45.05% 0.00% 0.00% 2030 175.20% 139.62% 19.09% 101.68% 3.20% 100.42% 45.48% 0.00% 0.00% 2040 204.08% 157.20% 18.73% 100.97% 3.25% 100.24% 46.80% 0.00% 0.00% 2050 232.14% 176.69% 18.26% 101.32% 3.23% 100.33% 48.40% 0.00% 0.00% 2075 312.67% 224.81% 18.08% 101.64% 3.21% 100.41% 54.87% 0.00% 0.00% 2100 417.97% 287.74% 17.87% 101.76% 3.20% 100.44% 64.42% 0.00% 0.00%
Scenario 3 2005 100.00% 100.00% 20.68% 100.00% 3.31% 100.00% 45.05% 0.00% 0.00% 2010 114.96% 106.41% 20.34% 100.88% 3.25% 100.22% 45.05% 0.00% 0.00% 2015 129.97% 114.13% 19.91% 101.39% 3.22% 100.35% 45.05% 0.00% 0.00% 2020 145.22% 122.60% 19.50% 101.69% 3.20% 100.42% 45.05% 0.00% 0.00% 2030 175.20% 139.62% 19.09% 101.68% 3.20% 100.42% 45.48% 0.00% 0.00% 2040 204.10% 157.19% 18.73% 100.97% 3.25% 100.24% 46.80% 0.00% 0.00% 2050 232.25% 176.65% 18.26% 101.33% 3.23% 100.33% 48.38% 0.00% 0.00% 2075 313.98% 224.49% 18.11% 101.65% 3.21% 100.41% 54.74% 0.00% 0.00% 2100 424.07% 286.82% 17.95% 101.79% 3.20% 100.44% 63.92% 0.00% 0.00%

55
Table 13 Simulation Results – BRAZIL (continued)
GNP GNP per employee
Net national saving-GNP
ratio
Capital-labor ratio Interest rate Wage rate Debt-GDP
ratio
Pension premium to
wage
Pension burden-GDP
ratio Scenario 4 2005 100.00% 100.00% 20.68% 100.00% 3.31% 100.00% 45.05% 0.00% 0.00%
2010 114.96% 106.41% 20.34% 100.88% 3.25% 100.22% 45.05% 0.00% 0.00% 2015 129.97% 114.13% 19.91% 101.39% 3.22% 100.35% 45.05% 0.00% 0.00% 2020 145.23% 122.60% 19.50% 101.70% 3.20% 100.42% 45.05% 0.00% 0.00% 2030 175.24% 139.61% 19.10% 101.68% 3.20% 100.42% 45.47% 0.00% 0.00% 2040 204.21% 157.16% 18.74% 100.97% 3.25% 100.24% 46.78% 0.00% 0.00% 2050 232.44% 176.61% 18.27% 101.33% 3.23% 100.33% 48.37% 0.00% 0.00% 2075 313.95% 224.63% 18.10% 101.64% 3.21% 100.41% 54.77% 0.00% 0.00% 2100 421.10% 287.51% 17.89% 101.77% 3.20% 100.44% 64.20% 0.00% 0.00%
Scenario 5 2005 100.00% 100.00% 20.68% 100.00% 3.31% 100.00% 45.05% 0.00% 0.00% 2010 114.96% 106.41% 20.34% 100.88% 3.25% 100.22% 45.05% 0.00% 0.00% 2015 129.97% 114.13% 19.91% 101.39% 3.22% 100.35% 45.05% 0.00% 0.00% 2020 145.22% 122.60% 19.50% 101.69% 3.20% 100.42% 45.05% 0.00% 0.00% 2030 175.23% 139.61% 19.10% 101.68% 3.20% 100.42% 45.48% 0.00% 0.00% 2040 204.17% 157.17% 18.73% 100.97% 3.25% 100.24% 46.79% 0.00% 0.00% 2050 232.39% 176.62% 18.27% 101.33% 3.23% 100.33% 48.37% 0.00% 0.00% 2075 314.20% 224.52% 18.11% 101.65% 3.21% 100.41% 54.74% 0.00% 0.00% 2100 423.24% 287.11% 17.93% 101.78% 3.20% 100.44% 64.01% 0.00% 0.00%
Scenario 6 2005 100.00% 100.00% 20.73% 100.00% 3.31% 100.00% 45.22% 0.00% 0.00% 2010 114.96% 106.41% 20.39% 100.84% 3.26% 100.21% 45.22% 0.00% 0.00% 2015 129.96% 114.13% 19.93% 101.30% 3.23% 100.32% 45.20% 0.00% 0.00% 2020 145.23% 122.60% 19.49% 101.68% 3.21% 100.42% 45.15% 0.00% 0.00% 2030 175.25% 139.61% 19.08% 101.73% 3.21% 100.43% 45.49% 0.00% 0.00% 2040 204.25% 157.14% 18.72% 101.04% 3.25% 100.26% 46.73% 0.00% 0.00% 2050 232.62% 176.53% 18.26% 101.41% 3.23% 100.35% 48.25% 0.00% 0.00% 2075 315.71% 224.21% 18.14% 101.75% 3.21% 100.43% 54.45% 0.00% 0.00% 2100 428.53% 286.46% 17.99% 101.90% 3.20% 100.47% 63.39% 0.00% 0.00%

56
Table 13 Simulation Results – BRAZIL (continued)
GNP GNP per employee
Net national saving-GNP
ratio
Capital-labor ratio Interest rate Wage rate Debt-GDP
ratio
Pension premium to
wage
Pension burden-GDP
ratio Scenario 7 2005 100.00% 100.00% 20.76% 100.00% 3.32% 100.00% 45.28% 0.00% 0.00%
2010 114.96% 106.41% 20.41% 100.81% 3.27% 100.20% 45.29% 0.00% 0.00% 2015 129.96% 114.12% 19.94% 101.25% 3.24% 100.31% 45.26% 0.00% 0.00% 2020 145.23% 122.61% 19.49% 101.67% 3.21% 100.42% 45.19% 0.00% 0.00% 2030 175.25% 139.61% 19.06% 101.76% 3.21% 100.44% 45.47% 0.00% 0.00% 2040 204.25% 157.14% 18.71% 101.08% 3.25% 100.27% 46.67% 0.00% 0.00% 2050 232.62% 176.53% 18.26% 101.46% 3.23% 100.36% 48.15% 0.00% 0.00% 2075 315.70% 224.20% 18.14% 101.80% 3.21% 100.45% 54.29% 0.00% 0.00% 2100 428.52% 286.46% 17.99% 101.95% 3.20% 100.48% 63.17% 0.00% 0.00%
Scenario 8 2005 100.00% 100.00% 20.76% 100.00% 3.32% 100.00% 45.23% 0.00% 0.00% 2010 114.96% 106.41% 20.41% 100.81% 3.27% 100.20% 45.24% 0.00% 0.00% 2015 129.96% 114.13% 19.95% 101.25% 3.24% 100.31% 45.21% 0.00% 0.00% 2020 145.23% 122.61% 19.49% 101.67% 3.21% 100.42% 45.13% 0.00% 0.00% 2030 175.21% 139.63% 19.06% 101.76% 3.21% 100.44% 45.43% 0.00% 0.00% 2040 204.07% 157.20% 18.71% 101.08% 3.25% 100.27% 46.63% 0.00% 0.00% 2050 232.13% 176.68% 18.24% 101.45% 3.23% 100.36% 48.14% 0.00% 0.00% 2075 312.64% 224.79% 18.09% 101.77% 3.21% 100.44% 54.45% 0.00% 0.00% 2100 417.95% 287.73% 17.88% 101.89% 3.20% 100.47% 63.83% 0.00% 0.00%
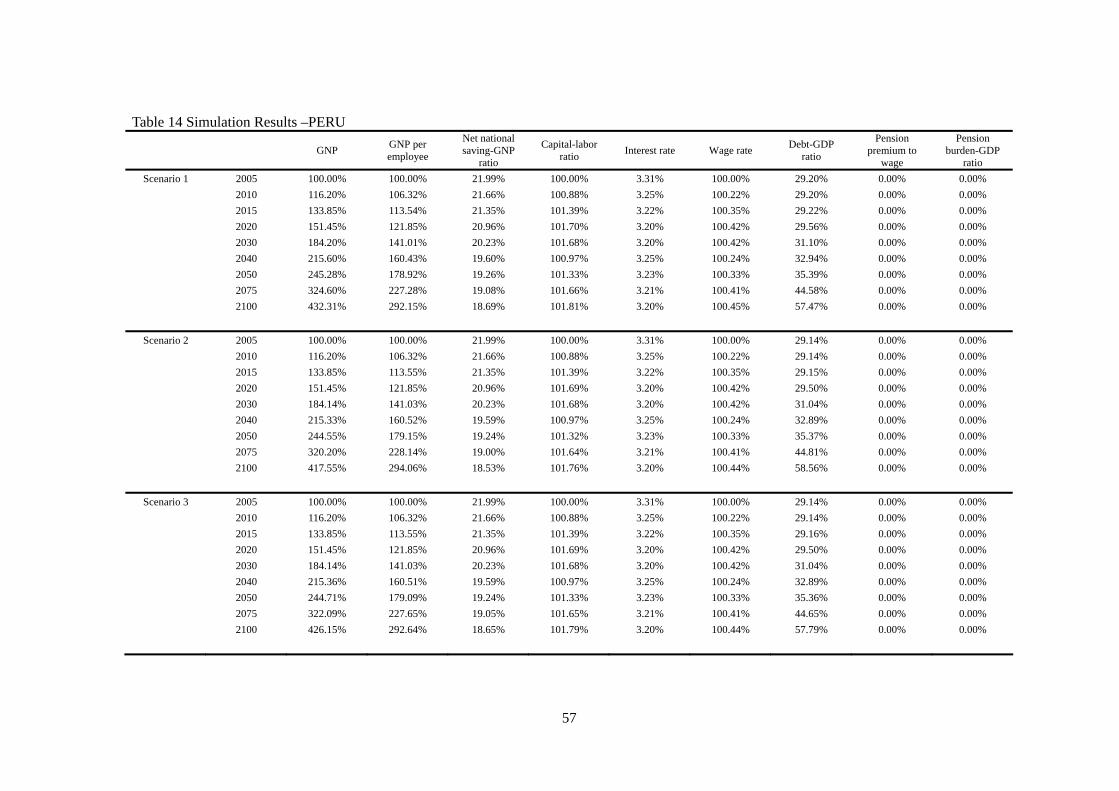
57
Table 14 Simulation Results –PERU
GNP GNP per employee
Net national saving-GNP
ratio
Capital-labor ratio Interest rate Wage rate Debt-GDP
ratio
Pension premium to
wage
Pension burden-GDP
ratio Scenario 1 2005 100.00% 100.00% 21.99% 100.00% 3.31% 100.00% 29.20% 0.00% 0.00%
2010 116.20% 106.32% 21.66% 100.88% 3.25% 100.22% 29.20% 0.00% 0.00% 2015 133.85% 113.54% 21.35% 101.39% 3.22% 100.35% 29.22% 0.00% 0.00% 2020 151.45% 121.85% 20.96% 101.70% 3.20% 100.42% 29.56% 0.00% 0.00% 2030 184.20% 141.01% 20.23% 101.68% 3.20% 100.42% 31.10% 0.00% 0.00% 2040 215.60% 160.43% 19.60% 100.97% 3.25% 100.24% 32.94% 0.00% 0.00% 2050 245.28% 178.92% 19.26% 101.33% 3.23% 100.33% 35.39% 0.00% 0.00% 2075 324.60% 227.28% 19.08% 101.66% 3.21% 100.41% 44.58% 0.00% 0.00% 2100 432.31% 292.15% 18.69% 101.81% 3.20% 100.45% 57.47% 0.00% 0.00%
Scenario 2 2005 100.00% 100.00% 21.99% 100.00% 3.31% 100.00% 29.14% 0.00% 0.00% 2010 116.20% 106.32% 21.66% 100.88% 3.25% 100.22% 29.14% 0.00% 0.00% 2015 133.85% 113.55% 21.35% 101.39% 3.22% 100.35% 29.15% 0.00% 0.00% 2020 151.45% 121.85% 20.96% 101.69% 3.20% 100.42% 29.50% 0.00% 0.00% 2030 184.14% 141.03% 20.23% 101.68% 3.20% 100.42% 31.04% 0.00% 0.00% 2040 215.33% 160.52% 19.59% 100.97% 3.25% 100.24% 32.89% 0.00% 0.00% 2050 244.55% 179.15% 19.24% 101.32% 3.23% 100.33% 35.37% 0.00% 0.00% 2075 320.20% 228.14% 19.00% 101.64% 3.21% 100.41% 44.81% 0.00% 0.00% 2100 417.55% 294.06% 18.53% 101.76% 3.20% 100.44% 58.56% 0.00% 0.00%
Scenario 3 2005 100.00% 100.00% 21.99% 100.00% 3.31% 100.00% 29.14% 0.00% 0.00% 2010 116.20% 106.32% 21.66% 100.88% 3.25% 100.22% 29.14% 0.00% 0.00% 2015 133.85% 113.55% 21.35% 101.39% 3.22% 100.35% 29.16% 0.00% 0.00% 2020 151.45% 121.85% 20.96% 101.69% 3.20% 100.42% 29.50% 0.00% 0.00% 2030 184.14% 141.03% 20.23% 101.68% 3.20% 100.42% 31.04% 0.00% 0.00% 2040 215.36% 160.51% 19.59% 100.97% 3.25% 100.24% 32.89% 0.00% 0.00% 2050 244.71% 179.09% 19.24% 101.33% 3.23% 100.33% 35.36% 0.00% 0.00% 2075 322.09% 227.65% 19.05% 101.65% 3.21% 100.41% 44.65% 0.00% 0.00% 2100 426.15% 292.64% 18.65% 101.79% 3.20% 100.44% 57.79% 0.00% 0.00%
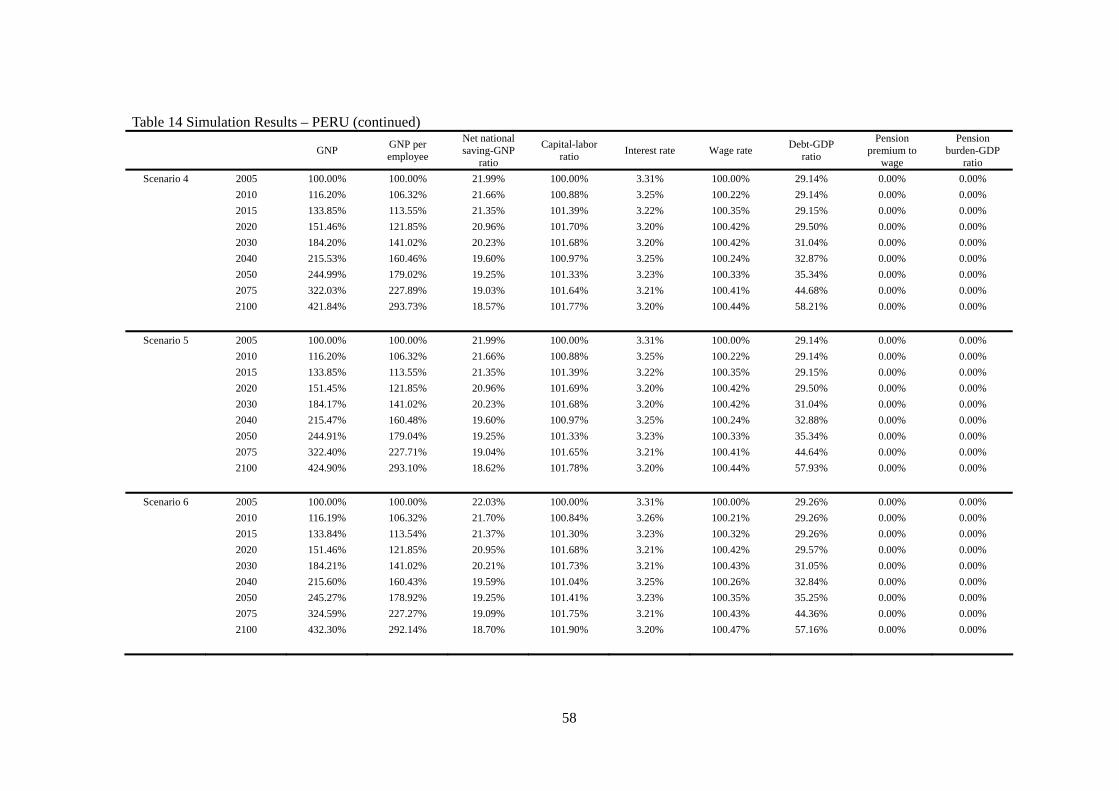
58
Table 14 Simulation Results – PERU (continued)
GNP GNP per employee
Net national saving-GNP
ratio
Capital-labor ratio Interest rate Wage rate Debt-GDP
ratio
Pension premium to
wage
Pension burden-GDP
ratio Scenario 4 2005 100.00% 100.00% 21.99% 100.00% 3.31% 100.00% 29.14% 0.00% 0.00%
2010 116.20% 106.32% 21.66% 100.88% 3.25% 100.22% 29.14% 0.00% 0.00% 2015 133.85% 113.55% 21.35% 101.39% 3.22% 100.35% 29.15% 0.00% 0.00% 2020 151.46% 121.85% 20.96% 101.70% 3.20% 100.42% 29.50% 0.00% 0.00% 2030 184.20% 141.02% 20.23% 101.68% 3.20% 100.42% 31.04% 0.00% 0.00% 2040 215.53% 160.46% 19.60% 100.97% 3.25% 100.24% 32.87% 0.00% 0.00% 2050 244.99% 179.02% 19.25% 101.33% 3.23% 100.33% 35.34% 0.00% 0.00% 2075 322.03% 227.89% 19.03% 101.64% 3.21% 100.41% 44.68% 0.00% 0.00% 2100 421.84% 293.73% 18.57% 101.77% 3.20% 100.44% 58.21% 0.00% 0.00%
Scenario 5 2005 100.00% 100.00% 21.99% 100.00% 3.31% 100.00% 29.14% 0.00% 0.00% 2010 116.20% 106.32% 21.66% 100.88% 3.25% 100.22% 29.14% 0.00% 0.00% 2015 133.85% 113.55% 21.35% 101.39% 3.22% 100.35% 29.15% 0.00% 0.00% 2020 151.45% 121.85% 20.96% 101.69% 3.20% 100.42% 29.50% 0.00% 0.00% 2030 184.17% 141.02% 20.23% 101.68% 3.20% 100.42% 31.04% 0.00% 0.00% 2040 215.47% 160.48% 19.60% 100.97% 3.25% 100.24% 32.88% 0.00% 0.00% 2050 244.91% 179.04% 19.25% 101.33% 3.23% 100.33% 35.34% 0.00% 0.00% 2075 322.40% 227.71% 19.04% 101.65% 3.21% 100.41% 44.64% 0.00% 0.00% 2100 424.90% 293.10% 18.62% 101.78% 3.20% 100.44% 57.93% 0.00% 0.00%
Scenario 6 2005 100.00% 100.00% 22.03% 100.00% 3.31% 100.00% 29.26% 0.00% 0.00% 2010 116.19% 106.32% 21.70% 100.84% 3.26% 100.21% 29.26% 0.00% 0.00% 2015 133.84% 113.54% 21.37% 101.30% 3.23% 100.32% 29.26% 0.00% 0.00% 2020 151.46% 121.85% 20.95% 101.68% 3.21% 100.42% 29.57% 0.00% 0.00% 2030 184.21% 141.02% 20.21% 101.73% 3.21% 100.43% 31.05% 0.00% 0.00% 2040 215.60% 160.43% 19.59% 101.04% 3.25% 100.26% 32.84% 0.00% 0.00% 2050 245.27% 178.92% 19.25% 101.41% 3.23% 100.35% 35.25% 0.00% 0.00% 2075 324.59% 227.27% 19.09% 101.75% 3.21% 100.43% 44.36% 0.00% 0.00% 2100 432.30% 292.14% 18.70% 101.90% 3.20% 100.47% 57.16% 0.00% 0.00%

59
Table 14 Simulation Results – PERU (continued)
GNP GNP per employee
Net national saving-GNP
ratio
Capital-labor ratio Interest rate Wage rate Debt-GDP
ratio
Pension premium to
wage
Pension burden-GDP
ratio Scenario 7 2005 100.00% 100.00% 22.06% 100.00% 3.32% 100.00% 29.30% 0.00% 0.00%
2010 116.19% 106.32% 21.73% 100.81% 3.27% 100.20% 29.30% 0.00% 0.00% 2015 133.84% 113.54% 21.38% 101.25% 3.24% 100.31% 29.28% 0.00% 0.00% 2020 151.46% 121.85% 20.95% 101.67% 3.21% 100.42% 29.57% 0.00% 0.00% 2030 184.21% 141.02% 20.20% 101.76% 3.21% 100.44% 31.02% 0.00% 0.00% 2040 215.59% 160.43% 19.58% 101.08% 3.25% 100.27% 32.77% 0.00% 0.00% 2050 245.26% 178.91% 19.25% 101.46% 3.23% 100.36% 35.17% 0.00% 0.00% 2075 324.58% 227.26% 19.09% 101.80% 3.21% 100.45% 44.23% 0.00% 0.00% 2100 432.29% 292.13% 18.70% 101.95% 3.20% 100.48% 56.97% 0.00% 0.00%
Scenario 8 2005 100.00% 100.00% 22.06% 100.00% 3.32% 100.00% 29.23% 0.00% 0.00% 2010 116.19% 106.32% 21.73% 100.81% 3.27% 100.20% 29.23% 0.00% 0.00% 2015 133.84% 113.54% 21.39% 101.25% 3.24% 100.31% 29.22% 0.00% 0.00% 2020 151.46% 121.86% 20.95% 101.67% 3.21% 100.42% 29.51% 0.00% 0.00% 2030 184.15% 141.04% 20.20% 101.76% 3.21% 100.44% 30.96% 0.00% 0.00% 2040 215.33% 160.52% 19.57% 101.08% 3.25% 100.27% 32.73% 0.00% 0.00% 2050 244.53% 179.14% 19.22% 101.45% 3.23% 100.36% 35.15% 0.00% 0.00% 2075 320.18% 228.12% 19.01% 101.77% 3.21% 100.44% 44.46% 0.00% 0.00% 2100 417.54% 294.05% 18.55% 101.89% 3.20% 100.47% 58.05% 0.00% 0.00%

60
Table 15 Simulation Results – AUSTRALIA
GNP GNP per employee
Net national saving-GNP
ratio
Capital-labor ratio Interest rate Wage rate Debt-GDP
ratio
Pension premium to
wage
Pension burden-GDP
ratio Scenario 1 2005 100.00% 100.00% 20.92% 100.00% 3.31% 100.00% 16.74% 11.42% 8.00%
2010 113.03% 107.72% 20.46% 100.95% 3.25% 100.28% 15.41% 12.32% 8.62% 2015 126.84% 116.51% 20.31% 101.49% 3.22% 100.45% 15.44% 13.54% 9.48% 2020 140.98% 126.09% 19.87% 101.82% 3.20% 100.54% 15.99% 14.88% 10.42% 2030 166.75% 144.42% 19.57% 101.80% 3.20% 100.54% 19.31% 16.66% 11.66% 2040 190.69% 159.96% 19.74% 101.04% 3.25% 100.31% 25.03% 17.16% 12.01% 2050 217.08% 174.48% 20.22% 101.43% 3.23% 100.43% 32.44% 16.78% 11.75% 2075 298.31% 223.52% 20.26% 101.78% 3.21% 100.53% 59.39% 17.24% 12.07% 2100 409.49% 284.71% 19.66% 101.94% 3.20% 100.58% 98.17% 17.31% 12.11%
Scenario 2 2005 100.00% 100.00% 20.92% 100.00% 3.31% 100.00% 16.68% 11.42% 8.00% 2010 113.03% 107.72% 20.46% 100.95% 3.25% 100.28% 15.35% 12.32% 8.62% 2015 126.84% 116.52% 20.32% 101.49% 3.22% 100.44% 15.38% 13.54% 9.48% 2020 140.98% 126.09% 19.87% 101.82% 3.20% 100.54% 15.92% 14.88% 10.42% 2030 166.75% 144.43% 19.57% 101.80% 3.20% 100.54% 19.25% 16.66% 11.66% 2040 190.67% 159.98% 19.74% 101.04% 3.25% 100.31% 24.96% 17.16% 12.01% 2050 217.01% 174.52% 20.23% 101.42% 3.23% 100.42% 32.38% 16.79% 11.75% 2075 297.69% 223.71% 20.26% 101.75% 3.21% 100.52% 59.44% 17.28% 12.09% 2100 407.01% 285.17% 19.66% 101.88% 3.20% 100.56% 98.71% 17.39% 12.17%
Scenario 3 2005 100.00% 100.00% 20.92% 100.00% 3.31% 100.00% 16.68% 11.42% 8.00% 2010 113.03% 107.72% 20.46% 100.95% 3.25% 100.28% 15.35% 12.32% 8.62% 2015 126.84% 116.52% 20.32% 101.49% 3.22% 100.45% 15.38% 13.54% 9.48% 2020 140.98% 126.09% 19.87% 101.82% 3.20% 100.54% 15.93% 14.88% 10.42% 2030 166.75% 144.43% 19.57% 101.80% 3.20% 100.54% 19.25% 16.66% 11.66% 2040 190.67% 159.98% 19.74% 101.04% 3.25% 100.31% 24.96% 17.16% 12.01% 2050 217.02% 174.51% 20.23% 101.42% 3.23% 100.42% 32.37% 16.79% 11.75% 2075 297.93% 223.62% 20.26% 101.77% 3.21% 100.53% 59.37% 17.26% 12.08% 2100 408.34% 284.85% 19.66% 101.92% 3.20% 100.57% 98.34% 17.33% 12.13%

61
Table 15 Simulation Results – AUSTRALIA (continued)
GNP GNP per employee
Net national saving-GNP
ratio
Capital-labor ratio Interest rate Wage rate Debt-GDP
ratio
Pension premium to
wage
Pension burden-GDP
ratio Scenario 4 2005 100.00% 100.00% 20.92% 100.00% 3.31% 100.00% 16.68% 11.42% 8.00%
2010 113.03% 107.72% 20.46% 100.95% 3.25% 100.28% 15.35% 12.32% 8.62% 2015 126.84% 116.52% 20.32% 101.49% 3.22% 100.44% 15.38% 13.54% 9.48% 2020 140.98% 126.09% 19.87% 101.82% 3.20% 100.54% 15.92% 14.88% 10.42% 2030 166.75% 144.43% 19.57% 101.80% 3.20% 100.54% 19.24% 16.66% 11.66% 2040 190.69% 159.97% 19.74% 101.04% 3.25% 100.31% 24.95% 17.16% 12.01% 2050 217.06% 174.50% 20.23% 101.42% 3.23% 100.42% 32.36% 16.79% 11.75% 2075 297.97% 223.64% 20.27% 101.76% 3.21% 100.53% 59.37% 17.26% 12.08% 2100 407.83% 285.08% 19.66% 101.90% 3.20% 100.57% 98.48% 17.37% 12.16%
Scenario 5 2005 100.00% 100.00% 20.92% 100.00% 3.31% 100.00% 16.68% 11.42% 8.00% 2010 113.03% 107.72% 20.46% 100.95% 3.25% 100.28% 15.35% 12.32% 8.62% 2015 126.84% 116.52% 20.32% 101.49% 3.22% 100.45% 15.38% 13.54% 9.48% 2020 140.98% 126.09% 19.87% 101.82% 3.20% 100.54% 15.93% 14.88% 10.42% 2030 166.75% 144.43% 19.57% 101.80% 3.20% 100.54% 19.25% 16.66% 11.66% 2040 190.68% 159.97% 19.74% 101.04% 3.25% 100.31% 24.96% 17.16% 12.01% 2050 217.05% 174.50% 20.23% 101.42% 3.23% 100.42% 32.37% 16.79% 11.75% 2075 298.01% 223.62% 20.26% 101.77% 3.21% 100.53% 59.36% 17.26% 12.08% 2100 408.26% 284.94% 19.66% 101.91% 3.20% 100.57% 98.37% 17.35% 12.14%
Scenario 6 2005 100.00% 100.00% 20.96% 100.00% 3.31% 100.00% 16.81% 11.43% 8.00% 2010 113.02% 107.71% 20.49% 100.90% 3.26% 100.27% 15.48% 12.33% 8.63% 2015 126.82% 116.49% 20.32% 101.39% 3.23% 100.42% 15.48% 13.56% 9.49% 2020 140.98% 126.08% 19.86% 101.80% 3.21% 100.54% 15.99% 14.91% 10.43% 2030 166.75% 144.43% 19.54% 101.86% 3.21% 100.55% 19.26% 16.68% 11.68% 2040 190.69% 159.96% 19.71% 101.12% 3.25% 100.33% 24.94% 17.17% 12.02% 2050 217.08% 174.47% 20.21% 101.51% 3.23% 100.45% 32.33% 16.79% 11.76% 2075 298.30% 223.51% 20.26% 101.87% 3.21% 100.56% 59.24% 17.24% 12.07% 2100 409.48% 284.71% 19.67% 102.03% 3.20% 100.61% 97.98% 17.31% 12.11%

62
Table 15 Simulation Results – AUSTRALIA (continued)
GNP GNP per employee
Net national saving-GNP
ratio
Capital-labor ratio Interest rate Wage rate Debt-GDP
ratio
Pension premium to
wage
Pension burden-GDP
ratio Scenario 7 2005 100.00% 100.00% 20.99% 100.00% 3.32% 100.00% 16.85% 11.44% 8.00%
2010 113.02% 107.71% 20.51% 100.86% 3.27% 100.26% 15.51% 12.34% 8.64% 2015 126.81% 116.48% 20.33% 101.34% 3.24% 100.40% 15.50% 13.57% 9.50% 2020 140.97% 126.08% 19.85% 101.79% 3.21% 100.53% 15.99% 14.92% 10.44% 2030 166.76% 144.43% 19.52% 101.89% 3.21% 100.56% 19.23% 16.69% 11.68% 2040 190.68% 159.96% 19.70% 101.16% 3.25% 100.35% 24.89% 17.18% 12.03% 2050 217.07% 174.47% 20.20% 101.56% 3.23% 100.47% 32.25% 16.80% 11.76% 2075 298.29% 223.50% 20.27% 101.93% 3.21% 100.57% 59.14% 17.24% 12.07% 2100 409.48% 284.70% 19.67% 102.09% 3.20% 100.62% 97.84% 17.31% 12.11%
Scenario 8 2005 100.00% 100.00% 20.99% 100.00% 3.32% 100.00% 16.79% 11.44% 8.00% 2010 113.02% 107.71% 20.52% 100.86% 3.27% 100.26% 15.46% 12.34% 8.64% 2015 126.81% 116.48% 20.33% 101.34% 3.24% 100.40% 15.44% 13.57% 9.50% 2020 140.98% 126.08% 19.85% 101.79% 3.21% 100.53% 15.93% 14.92% 10.44% 2030 166.75% 144.43% 19.53% 101.89% 3.21% 100.56% 19.17% 16.69% 11.68% 2040 190.66% 159.97% 19.71% 101.16% 3.25% 100.35% 24.83% 17.19% 12.03% 2050 216.99% 174.51% 20.21% 101.56% 3.23% 100.46% 32.20% 16.81% 11.77% 2075 297.68% 223.70% 20.27% 101.90% 3.21% 100.57% 59.20% 17.28% 12.09% 2100 407.01% 285.17% 19.67% 102.03% 3.20% 100.61% 98.39% 17.39% 12.17%

63
Table 16 Simulation Results – CANADA
GNP GNP per employee
Net national saving-GNP
ratio
Capital-labor ratio Interest rate Wage rate Debt-GDP
ratio
Pension premium to
wage
Pension burden-GDP
ratio Scenario 1 2005 100.00% 100.00% 20.01% 100.00% 3.31% 100.00% 78.41% 11.58% 8.10%
2010 111.77% 107.56% 18.19% 100.95% 3.25% 100.28% 68.45% 12.34% 8.64% 2015 123.75% 116.62% 18.02% 101.49% 3.22% 100.45% 68.50% 13.78% 9.64% 2020 135.08% 127.47% 17.51% 101.82% 3.20% 100.54% 69.80% 15.70% 10.99% 2030 152.78% 148.08% 16.74% 101.80% 3.20% 100.54% 77.71% 18.51% 12.96% 2040 164.62% 158.03% 17.32% 101.04% 3.25% 100.31% 92.57% 17.61% 12.33% 2050 180.53% 171.28% 18.23% 101.43% 3.23% 100.43% 109.81% 16.88% 11.82% 2075 225.61% 217.66% 17.38% 101.78% 3.21% 100.53% 171.31% 17.49% 12.24% 2100 282.37% 276.00% 15.29% 101.94% 3.20% 100.58% 262.30% 17.97% 12.58%
Scenario 2 2005 100.00% 100.00% 20.01% 100.00% 3.31% 100.00% 78.35% 11.58% 8.10% 2010 111.77% 107.56% 18.20% 100.95% 3.25% 100.28% 68.39% 12.34% 8.64% 2015 123.75% 116.62% 18.02% 101.49% 3.22% 100.44% 68.44% 13.78% 9.64% 2020 135.08% 127.47% 17.51% 101.82% 3.20% 100.54% 69.74% 15.70% 10.99% 2030 152.78% 148.09% 16.75% 101.80% 3.20% 100.54% 77.64% 18.51% 12.96% 2040 164.61% 158.04% 17.33% 101.04% 3.25% 100.31% 92.50% 17.62% 12.33% 2050 180.50% 171.31% 18.24% 101.42% 3.23% 100.42% 109.75% 16.88% 11.82% 2075 225.33% 217.77% 17.39% 101.75% 3.21% 100.52% 171.43% 17.51% 12.26% 2100 281.26% 276.22% 15.27% 101.88% 3.20% 100.56% 263.26% 18.03% 12.62%
Scenario 3 2005 100.00% 100.00% 20.01% 100.00% 3.31% 100.00% 78.35% 11.58% 8.10% 2010 111.77% 107.56% 18.20% 100.95% 3.25% 100.28% 68.39% 12.34% 8.64% 2015 123.75% 116.62% 18.02% 101.49% 3.22% 100.45% 68.44% 13.78% 9.64% 2020 135.08% 127.47% 17.51% 101.82% 3.20% 100.54% 69.74% 15.70% 10.99% 2030 152.78% 148.09% 16.75% 101.80% 3.20% 100.54% 77.64% 18.51% 12.96% 2040 164.61% 158.04% 17.33% 101.04% 3.25% 100.31% 92.49% 17.62% 12.33% 2050 180.51% 171.30% 18.23% 101.42% 3.23% 100.42% 109.74% 16.88% 11.82% 2075 225.44% 217.72% 17.38% 101.77% 3.21% 100.53% 171.32% 17.50% 12.25% 2100 281.87% 276.06% 15.28% 101.92% 3.20% 100.57% 262.61% 17.99% 12.60%

64
Table 16 Simulation Results – CANADA (continued)
GNP GNP per employee
Net national saving-GNP
ratio
Capital-labor ratio Interest rate Wage rate Debt-GDP
ratio
Pension premium to
wage
Pension burden-GDP
ratio Scenario 4 2005 100.00% 100.00% 20.01% 100.00% 3.31% 100.00% 78.35% 11.58% 8.10%
2010 111.77% 107.56% 18.20% 100.95% 3.25% 100.28% 68.39% 12.34% 8.64% 2015 123.75% 116.62% 18.02% 101.49% 3.22% 100.44% 68.44% 13.78% 9.64% 2020 135.08% 127.47% 17.51% 101.82% 3.20% 100.54% 69.74% 15.70% 10.99% 2030 152.78% 148.09% 16.74% 101.80% 3.20% 100.54% 77.64% 18.51% 12.96% 2040 164.62% 158.03% 17.33% 101.04% 3.25% 100.31% 92.49% 17.62% 12.33% 2050 180.52% 171.30% 18.23% 101.42% 3.23% 100.42% 109.72% 16.88% 11.82% 2075 225.46% 217.73% 17.39% 101.76% 3.21% 100.53% 171.31% 17.50% 12.25% 2100 281.62% 276.19% 15.28% 101.90% 3.20% 100.57% 262.88% 18.02% 12.61%
Scenario 5 2005 100.00% 100.00% 20.01% 100.00% 3.31% 100.00% 78.35% 11.58% 8.10% 2010 111.77% 107.56% 18.20% 100.95% 3.25% 100.28% 68.39% 12.34% 8.64% 2015 123.75% 116.62% 18.02% 101.49% 3.22% 100.45% 68.44% 13.78% 9.64% 2020 135.08% 127.47% 17.51% 101.82% 3.20% 100.54% 69.74% 15.70% 10.99% 2030 152.78% 148.09% 16.74% 101.80% 3.20% 100.54% 77.64% 18.51% 12.96% 2040 164.62% 158.03% 17.33% 101.04% 3.25% 100.31% 92.49% 17.62% 12.33% 2050 180.52% 171.30% 18.23% 101.42% 3.23% 100.42% 109.73% 16.88% 11.82% 2075 225.48% 217.72% 17.39% 101.77% 3.21% 100.53% 171.30% 17.50% 12.25% 2100 281.82% 276.11% 15.28% 101.91% 3.20% 100.57% 262.67% 18.00% 12.60%
Scenario 6 2005 100.00% 100.00% 20.06% 100.00% 3.31% 100.00% 78.53% 11.58% 8.11% 2010 111.76% 107.55% 18.23% 100.90% 3.26% 100.27% 68.59% 12.36% 8.65% 2015 123.72% 116.60% 18.02% 101.39% 3.23% 100.42% 68.65% 13.80% 9.66% 2020 135.07% 127.46% 17.48% 101.80% 3.21% 100.54% 69.91% 15.73% 11.01% 2030 152.78% 148.08% 16.70% 101.86% 3.21% 100.55% 77.77% 18.54% 12.97% 2040 164.61% 158.02% 17.29% 101.12% 3.25% 100.33% 92.61% 17.63% 12.34% 2050 180.52% 171.27% 18.21% 101.51% 3.23% 100.45% 109.84% 16.89% 11.82% 2075 225.59% 217.65% 17.38% 101.87% 3.21% 100.56% 171.35% 17.49% 12.24% 2100 282.35% 275.98% 15.29% 102.03% 3.20% 100.61% 262.37% 17.97% 12.58%

65
Table 16 Simulation Results – CANADA (continued)
GNP GNP per employee
Net national saving-GNP
ratio
Capital-labor ratio Interest rate Wage rate Debt-GDP
ratio
Pension premium to
wage
Pension burden-GDP
ratio Scenario 7 2005 100.00% 100.00% 20.08% 100.00% 3.32% 100.00% 78.61% 11.59% 8.11%
2010 111.76% 107.54% 18.24% 100.86% 3.27% 100.26% 68.67% 12.36% 8.65% 2015 123.71% 116.59% 18.02% 101.34% 3.24% 100.40% 68.73% 13.81% 9.67% 2020 135.07% 127.46% 17.47% 101.79% 3.21% 100.53% 69.98% 15.74% 11.02% 2030 152.77% 148.08% 16.68% 101.89% 3.21% 100.56% 77.81% 18.55% 12.98% 2040 164.61% 158.02% 17.28% 101.16% 3.25% 100.35% 92.63% 17.64% 12.35% 2050 180.51% 171.27% 18.20% 101.56% 3.23% 100.47% 109.86% 16.89% 11.83% 2075 225.58% 217.64% 17.39% 101.93% 3.21% 100.57% 171.37% 17.49% 12.24% 2100 282.34% 275.97% 15.29% 102.09% 3.20% 100.62% 262.41% 17.97% 12.58%
Scenario 8 2005 100.00% 100.00% 20.08% 100.00% 3.32% 100.00% 78.55% 11.59% 8.11% 2010 111.76% 107.55% 18.25% 100.86% 3.27% 100.26% 68.61% 12.36% 8.65% 2015 123.71% 116.59% 18.03% 101.34% 3.24% 100.40% 68.67% 13.81% 9.67% 2020 135.07% 127.46% 17.47% 101.79% 3.21% 100.53% 69.91% 15.74% 11.02% 2030 152.78% 148.09% 16.69% 101.89% 3.21% 100.56% 77.74% 18.55% 12.99% 2040 164.60% 158.03% 17.28% 101.16% 3.25% 100.35% 92.56% 17.64% 12.35% 2050 180.48% 171.29% 18.21% 101.56% 3.23% 100.46% 109.79% 16.90% 11.83% 2075 225.31% 217.74% 17.39% 101.90% 3.21% 100.57% 171.50% 17.51% 12.26% 2100 281.23% 276.19% 15.27% 102.03% 3.20% 100.61% 263.37% 18.03% 12.62%

66
Table 17 Simulation Results –EUROPE
GNP GNP per employee
Net national saving-GNP
ratio
Capital-labor ratio Interest rate Wage rate Debt-GDP
ratio
Pension premium to
wage
Pension burden-GDP
ratio Scenario 1 2005 100.00% 100.00% 13.91% 100.00% 3.31% 100.00% 76.99% 19.13% 13.39%
2010 106.17% 105.39% 15.50% 100.95% 3.25% 100.28% 71.36% 18.72% 13.10% 2015 111.72% 112.73% 15.78% 101.49% 3.22% 100.45% 71.40% 19.47% 13.63% 2020 116.47% 121.77% 15.61% 101.82% 3.20% 100.54% 72.30% 20.98% 14.69% 2030 122.23% 138.04% 15.59% 101.80% 3.20% 100.54% 78.63% 22.63% 15.84% 2040 125.20% 151.35% 15.69% 101.04% 3.25% 100.31% 90.15% 22.71% 15.90% 2050 127.52% 169.81% 15.49% 101.43% 3.23% 100.43% 106.60% 24.05% 16.84% 2075 128.08% 208.80% 14.82% 101.78% 3.21% 100.53% 181.31% 22.91% 16.04% 2100 127.06% 257.29% 11.45% 101.94% 3.20% 100.58% 320.09% 22.91% 16.04%
Scenario 2 2005 100.08% 100.08% 13.98% 100.00% 3.31% 100.00% 74.24% 19.13% 13.39% 2010 106.26% 105.47% 15.57% 100.95% 3.25% 100.28% 68.41% 18.72% 13.10% 2015 111.82% 112.83% 15.85% 101.49% 3.22% 100.44% 68.22% 19.47% 13.63% 2020 116.57% 121.88% 15.68% 101.82% 3.20% 100.54% 68.84% 20.98% 14.69% 2030 122.37% 138.19% 15.69% 101.80% 3.20% 100.54% 74.42% 22.63% 15.84% 2040 125.37% 151.57% 15.81% 101.04% 3.25% 100.31% 84.88% 22.71% 15.90% 2050 127.74% 170.12% 15.64% 101.42% 3.23% 100.42% 99.98% 24.05% 16.84% 2075 128.44% 209.52% 15.12% 101.75% 3.21% 100.52% 169.29% 22.93% 16.05% 2100 127.63% 258.95% 12.00% 101.88% 3.20% 100.56% 298.69% 22.95% 16.06%
Scenario 3 2005 100.08% 100.08% 13.98% 100.00% 3.31% 100.00% 74.25% 19.13% 13.39% 2010 106.26% 105.47% 15.57% 100.95% 3.25% 100.28% 68.42% 18.72% 13.10% 2015 111.82% 112.83% 15.85% 101.49% 3.22% 100.45% 68.22% 19.47% 13.63% 2020 116.57% 121.88% 15.68% 101.82% 3.20% 100.54% 68.85% 20.98% 14.69% 2030 122.37% 138.19% 15.69% 101.80% 3.20% 100.54% 74.42% 22.63% 15.84% 2040 125.37% 151.57% 15.81% 101.04% 3.25% 100.31% 84.88% 22.71% 15.90% 2050 127.75% 170.12% 15.64% 101.42% 3.23% 100.42% 99.98% 24.05% 16.84% 2075 128.48% 209.52% 15.11% 101.77% 3.21% 100.53% 169.24% 22.92% 16.05% 2100 127.78% 258.94% 12.01% 101.92% 3.20% 100.57% 298.27% 22.92% 16.05%

67
Table 17 Simulation Results – EUROPE (continued)
GNP GNP per employee
Net national saving-GNP
ratio
Capital-labor ratio Interest rate Wage rate Debt-GDP
ratio
Pension premium to
wage
Pension burden-GDP
ratio Scenario 4 2005 100.08% 100.08% 13.98% 100.00% 3.31% 100.00% 74.24% 19.13% 13.39%
2010 106.26% 105.47% 15.57% 100.95% 3.25% 100.28% 68.41% 18.72% 13.10% 2015 111.81% 112.83% 15.85% 101.49% 3.22% 100.44% 68.21% 19.47% 13.63% 2020 116.57% 121.88% 15.68% 101.82% 3.20% 100.54% 68.84% 20.98% 14.69% 2030 122.37% 138.19% 15.69% 101.80% 3.20% 100.54% 74.41% 22.63% 15.84% 2040 125.38% 151.57% 15.81% 101.04% 3.25% 100.31% 84.86% 22.71% 15.90% 2050 127.75% 170.12% 15.64% 101.42% 3.23% 100.42% 99.96% 24.05% 16.84% 2075 128.47% 209.52% 15.12% 101.76% 3.21% 100.53% 169.20% 22.92% 16.05% 2100 127.70% 258.96% 12.01% 101.90% 3.20% 100.57% 298.39% 22.94% 16.06%
Scenario 5 2005 100.08% 100.08% 13.98% 100.00% 3.31% 100.00% 74.25% 19.13% 13.39% 2010 106.26% 105.47% 15.57% 100.95% 3.25% 100.28% 68.42% 18.72% 13.10% 2015 111.82% 112.83% 15.85% 101.49% 3.22% 100.45% 68.22% 19.47% 13.63% 2020 116.57% 121.88% 15.68% 101.82% 3.20% 100.54% 68.85% 20.98% 14.69% 2030 122.37% 138.19% 15.69% 101.80% 3.20% 100.54% 74.42% 22.63% 15.84% 2040 125.38% 151.57% 15.81% 101.04% 3.25% 100.31% 84.88% 22.71% 15.90% 2050 127.75% 170.12% 15.64% 101.42% 3.23% 100.42% 99.98% 24.05% 16.84% 2075 128.48% 209.52% 15.11% 101.77% 3.21% 100.53% 169.23% 22.92% 16.05% 2100 127.76% 258.95% 12.01% 101.91% 3.20% 100.57% 298.33% 22.93% 16.05%
Scenario 6 2005 100.00% 100.00% 13.94% 100.00% 3.31% 100.00% 77.12% 19.14% 13.40% 2010 106.15% 105.37% 15.51% 100.90% 3.26% 100.27% 71.52% 18.74% 13.12% 2015 111.68% 112.69% 15.76% 101.39% 3.23% 100.42% 71.57% 19.50% 13.65% 2020 116.46% 121.76% 15.58% 101.80% 3.21% 100.54% 72.45% 21.01% 14.71% 2030 122.24% 138.05% 15.56% 101.86% 3.21% 100.55% 78.74% 22.66% 15.86% 2040 125.20% 151.36% 15.67% 101.12% 3.25% 100.33% 90.25% 22.73% 15.91% 2050 127.53% 169.82% 15.47% 101.51% 3.23% 100.45% 106.71% 24.06% 16.84% 2075 128.09% 208.81% 14.82% 101.87% 3.21% 100.56% 181.54% 22.92% 16.04% 2100 127.07% 257.30% 11.44% 102.03% 3.20% 100.61% 320.52% 22.91% 16.04%

68
Table 17 Simulation Results – EUROPE (continued)
GNP GNP per employee
Net national saving-GNP
ratio
Capital-labor ratio Interest rate Wage rate Debt-GDP
ratio
Pension premium to
wage
Pension burden-GDP
ratio Scenario 7 2005 100.00% 100.00% 13.95% 100.00% 3.32% 100.00% 77.20% 19.15% 13.40%
2010 106.14% 105.36% 15.52% 100.86% 3.27% 100.26% 71.61% 18.75% 13.13% 2015 111.66% 112.67% 15.75% 101.34% 3.24% 100.40% 71.67% 19.52% 13.66% 2020 116.45% 121.75% 15.56% 101.79% 3.21% 100.53% 72.53% 21.03% 14.72% 2030 122.24% 138.05% 15.54% 101.89% 3.21% 100.56% 78.80% 22.67% 15.87% 2040 125.21% 151.36% 15.65% 101.16% 3.25% 100.35% 90.29% 22.74% 15.92% 2050 127.54% 169.82% 15.47% 101.56% 3.23% 100.47% 106.76% 24.07% 16.85% 2075 128.09% 208.82% 14.82% 101.93% 3.21% 100.57% 181.63% 22.92% 16.04% 2100 127.07% 257.30% 11.43% 102.09% 3.20% 100.62% 320.66% 22.91% 16.04%
Scenario 8 2005 100.08% 100.08% 14.02% 100.00% 3.32% 100.00% 74.46% 19.15% 13.40% 2010 106.23% 105.45% 15.59% 100.86% 3.27% 100.26% 68.67% 18.75% 13.13% 2015 111.76% 112.77% 15.83% 101.34% 3.24% 100.40% 68.49% 19.52% 13.66% 2020 116.56% 121.86% 15.64% 101.79% 3.21% 100.53% 69.07% 21.03% 14.72% 2030 122.38% 138.21% 15.64% 101.89% 3.21% 100.56% 74.58% 22.67% 15.87% 2040 125.39% 151.58% 15.78% 101.16% 3.25% 100.35% 85.02% 22.74% 15.92% 2050 127.76% 170.14% 15.63% 101.56% 3.23% 100.46% 100.14% 24.07% 16.85% 2075 128.46% 209.55% 15.11% 101.90% 3.21% 100.57% 169.63% 22.93% 16.05% 2100 127.64% 258.96% 11.99% 102.03% 3.20% 100.61% 299.33% 22.95% 16.06%

69
Table 18 Simulation Results – REST OF WORLD
GNP GNP per employee
Net national saving-GNP
ratio
Capital-labor ratio Interest rate Wage rate Debt-GDP
ratio
Pension premium to
wage
Pension burden-GDP
ratio Scenario 1 2005 100.00% 100.00% 19.26% 100.00% 3.31% 100.00% 43.51% 0.00% 0.00%
2010 118.39% 105.82% 19.12% 100.88% 3.25% 100.22% 43.51% 0.00% 0.00% 2015 138.87% 112.31% 19.04% 101.39% 3.22% 100.35% 43.53% 0.00% 0.00% 2020 160.67% 119.19% 18.90% 101.70% 3.20% 100.42% 44.01% 0.00% 0.00% 2030 210.37% 133.74% 18.83% 101.68% 3.20% 100.42% 45.76% 0.00% 0.00% 2040 270.82% 149.16% 18.55% 100.97% 3.25% 100.24% 47.96% 0.00% 0.00% 2050 340.56% 166.32% 18.24% 101.33% 3.23% 100.33% 50.86% 0.00% 0.00% 2075 575.27% 215.97% 17.52% 101.66% 3.21% 100.41% 59.72% 0.00% 0.00% 2100 908.79% 278.08% 17.03% 101.81% 3.20% 100.45% 72.93% 0.00% 0.00%
Scenario 2 2005 100.00% 100.00% 19.26% 100.00% 3.31% 100.00% 43.41% 0.00% 0.00% 2010 118.39% 105.82% 19.12% 100.88% 3.25% 100.22% 43.41% 0.00% 0.00% 2015 138.88% 112.31% 19.04% 101.39% 3.22% 100.35% 43.44% 0.00% 0.00% 2020 160.68% 119.19% 18.90% 101.69% 3.20% 100.42% 43.92% 0.00% 0.00% 2030 210.38% 133.74% 18.83% 101.68% 3.20% 100.42% 45.67% 0.00% 0.00% 2040 270.83% 149.16% 18.55% 100.97% 3.25% 100.24% 47.88% 0.00% 0.00% 2050 340.58% 166.32% 18.25% 101.32% 3.23% 100.33% 50.77% 0.00% 0.00% 2075 575.38% 215.97% 17.53% 101.64% 3.21% 100.41% 59.63% 0.00% 0.00% 2100 909.33% 278.06% 17.05% 101.76% 3.20% 100.44% 72.82% 0.00% 0.00%
Scenario 3 2005 100.00% 100.00% 19.26% 100.00% 3.31% 100.00% 43.41% 0.00% 0.00% 2010 118.39% 105.82% 19.12% 100.88% 3.25% 100.22% 43.41% 0.00% 0.00% 2015 138.88% 112.31% 19.04% 101.39% 3.22% 100.35% 43.44% 0.00% 0.00% 2020 160.68% 119.19% 18.90% 101.69% 3.20% 100.42% 43.92% 0.00% 0.00% 2030 210.38% 133.74% 18.83% 101.68% 3.20% 100.42% 45.67% 0.00% 0.00% 2040 270.83% 149.16% 18.55% 100.97% 3.25% 100.24% 47.87% 0.00% 0.00% 2050 340.58% 166.32% 18.25% 101.33% 3.23% 100.33% 50.77% 0.00% 0.00% 2075 575.42% 215.97% 17.53% 101.65% 3.21% 100.41% 59.61% 0.00% 0.00% 2100 909.51% 278.05% 17.04% 101.79% 3.20% 100.44% 72.78% 0.00% 0.00%

70
Table 18 Simulation Results – REST OF WORLD (continued)
GNP GNP per employee
Net national saving-GNP
ratio
Capital-labor ratio Interest rate Wage rate Debt-GDP
ratio
Pension premium to
wage
Pension burden-GDP
ratio Scenario 4 2005 100.00% 100.00% 19.26% 100.00% 3.31% 100.00% 43.41% 0.00% 0.00%
2010 118.39% 105.82% 19.12% 100.88% 3.25% 100.22% 43.41% 0.00% 0.00% 2015 138.88% 112.31% 19.04% 101.39% 3.22% 100.35% 43.44% 0.00% 0.00% 2020 160.68% 119.19% 18.90% 101.70% 3.20% 100.42% 43.91% 0.00% 0.00% 2030 210.38% 133.74% 18.83% 101.68% 3.20% 100.42% 45.67% 0.00% 0.00% 2040 270.83% 149.16% 18.55% 100.97% 3.25% 100.24% 47.87% 0.00% 0.00% 2050 340.57% 166.32% 18.25% 101.33% 3.23% 100.33% 50.77% 0.00% 0.00% 2075 575.32% 215.97% 17.53% 101.64% 3.21% 100.41% 59.62% 0.00% 0.00% 2100 909.08% 278.07% 17.05% 101.77% 3.20% 100.44% 72.82% 0.00% 0.00%
Scenario 5 2005 100.00% 100.00% 19.26% 100.00% 3.31% 100.00% 43.41% 0.00% 0.00% 2010 118.39% 105.82% 19.12% 100.88% 3.25% 100.22% 43.41% 0.00% 0.00% 2015 138.88% 112.31% 19.04% 101.39% 3.22% 100.35% 43.44% 0.00% 0.00% 2020 160.68% 119.19% 18.90% 101.69% 3.20% 100.42% 43.92% 0.00% 0.00% 2030 210.38% 133.74% 18.83% 101.68% 3.20% 100.42% 45.67% 0.00% 0.00% 2040 270.83% 149.16% 18.55% 100.97% 3.25% 100.24% 47.87% 0.00% 0.00% 2050 340.58% 166.32% 18.25% 101.33% 3.23% 100.33% 50.77% 0.00% 0.00% 2075 575.37% 215.97% 17.53% 101.65% 3.21% 100.41% 59.62% 0.00% 0.00% 2100 909.31% 278.06% 17.04% 101.78% 3.20% 100.44% 72.80% 0.00% 0.00%
Scenario 6 2005 100.00% 100.00% 19.30% 100.00% 3.31% 100.00% 43.59% 0.00% 0.00% 2010 118.38% 105.81% 19.16% 100.84% 3.26% 100.21% 43.59% 0.00% 0.00% 2015 138.86% 112.30% 19.05% 101.30% 3.23% 100.32% 43.60% 0.00% 0.00% 2020 160.67% 119.19% 18.90% 101.68% 3.21% 100.42% 44.04% 0.00% 0.00% 2030 210.38% 133.74% 18.81% 101.73% 3.21% 100.43% 45.74% 0.00% 0.00% 2040 270.82% 149.16% 18.54% 101.04% 3.25% 100.26% 47.90% 0.00% 0.00% 2050 340.56% 166.32% 18.24% 101.41% 3.23% 100.35% 50.78% 0.00% 0.00% 2075 575.26% 215.97% 17.52% 101.75% 3.21% 100.43% 59.61% 0.00% 0.00% 2100 908.78% 278.07% 17.03% 101.90% 3.20% 100.47% 72.81% 0.00% 0.00%
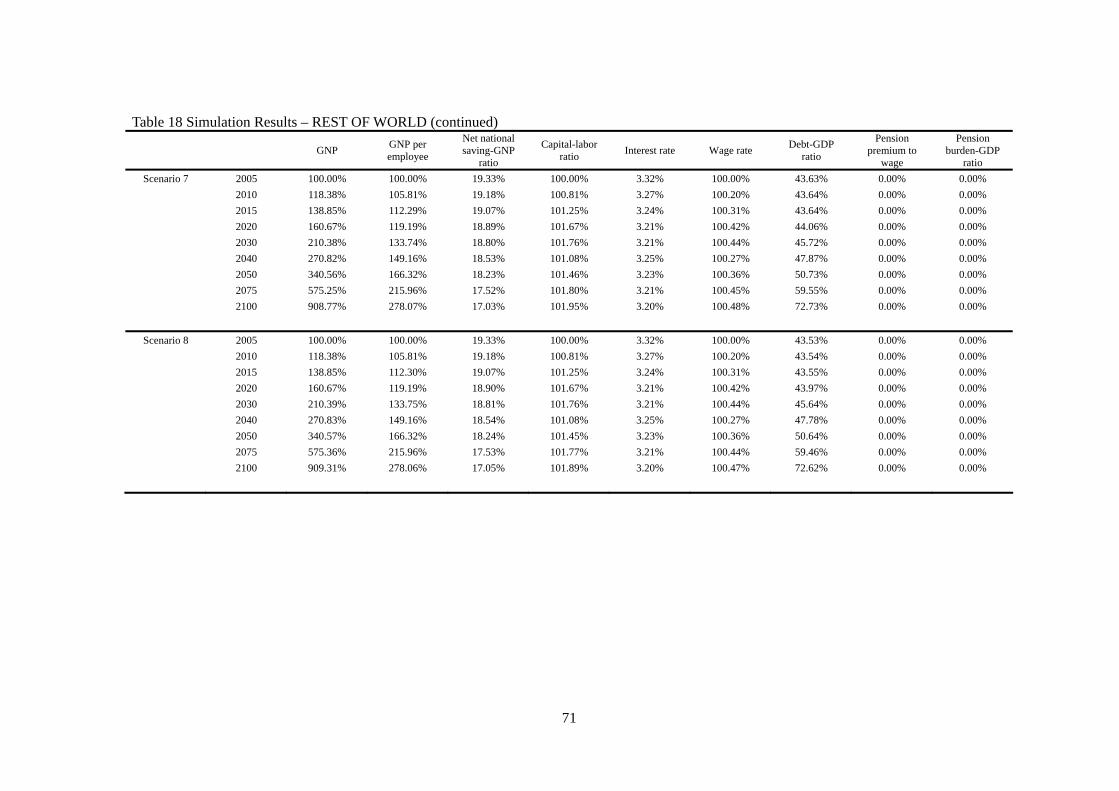
71
Table 18 Simulation Results – REST OF WORLD (continued)
GNP GNP per employee
Net national saving-GNP
ratio
Capital-labor ratio Interest rate Wage rate Debt-GDP
ratio
Pension premium to
wage
Pension burden-GDP
ratio Scenario 7 2005 100.00% 100.00% 19.33% 100.00% 3.32% 100.00% 43.63% 0.00% 0.00%
2010 118.38% 105.81% 19.18% 100.81% 3.27% 100.20% 43.64% 0.00% 0.00% 2015 138.85% 112.29% 19.07% 101.25% 3.24% 100.31% 43.64% 0.00% 0.00% 2020 160.67% 119.19% 18.89% 101.67% 3.21% 100.42% 44.06% 0.00% 0.00% 2030 210.38% 133.74% 18.80% 101.76% 3.21% 100.44% 45.72% 0.00% 0.00% 2040 270.82% 149.16% 18.53% 101.08% 3.25% 100.27% 47.87% 0.00% 0.00% 2050 340.56% 166.32% 18.23% 101.46% 3.23% 100.36% 50.73% 0.00% 0.00% 2075 575.25% 215.96% 17.52% 101.80% 3.21% 100.45% 59.55% 0.00% 0.00% 2100 908.77% 278.07% 17.03% 101.95% 3.20% 100.48% 72.73% 0.00% 0.00%
Scenario 8 2005 100.00% 100.00% 19.33% 100.00% 3.32% 100.00% 43.53% 0.00% 0.00% 2010 118.38% 105.81% 19.18% 100.81% 3.27% 100.20% 43.54% 0.00% 0.00% 2015 138.85% 112.30% 19.07% 101.25% 3.24% 100.31% 43.55% 0.00% 0.00% 2020 160.67% 119.19% 18.90% 101.67% 3.21% 100.42% 43.97% 0.00% 0.00% 2030 210.39% 133.75% 18.81% 101.76% 3.21% 100.44% 45.64% 0.00% 0.00% 2040 270.83% 149.16% 18.54% 101.08% 3.25% 100.27% 47.78% 0.00% 0.00% 2050 340.57% 166.32% 18.24% 101.45% 3.23% 100.36% 50.64% 0.00% 0.00% 2075 575.36% 215.96% 17.53% 101.77% 3.21% 100.44% 59.46% 0.00% 0.00% 2100 909.31% 278.06% 17.05% 101.89% 3.20% 100.47% 72.62% 0.00% 0.00%

72
Table 19 Simulation Results – WELFARE WITH EQUIVALENT VARIATION
Birth year JAPAN USA CHINA S.
KOREA INDIA INDONESIA
BANGLADESH
PHILIPPINES
THAILAND
VIETNAM
BRAZIL PERU AUSTR
ALIA CANA
DA EUROPEREST
OF WORLD
Scenario 1 1930 1.000 1.000 1.000 1.000 1.000 1.000 1.000 1.000 1.000 1.000 1.000 1.000 1.000 1.000 1.000 1.000
1940 0.912 0.994 0.998 0.938 1.000 0.998 1.001 0.998 0.998 0.997 0.998 0.998 0.991 0.990 0.997 0.999
1950 0.880 0.986 0.993 0.825 0.998 0.993 1.000 0.994 0.993 0.991 0.995 0.995 0.978 0.975 0.994 0.997
1960 0.848 0.974 0.990 0.738 0.996 0.988 1.000 0.991 0.988 0.986 0.992 0.992 0.958 0.952 0.989 0.994
1970 0.821 0.961 0.989 0.692 0.996 0.986 1.001 0.990 0.986 0.985 0.992 0.991 0.935 0.922 0.977 0.993
1980 0.792 0.954 0.990 0.679 0.997 0.987 1.002 0.991 0.987 0.986 0.993 0.992 0.912 0.896 0.966 0.995
1990 0.758 0.948 0.991 0.664 0.998 0.988 1.003 0.992 0.988 0.987 0.994 0.993 0.891 0.875 0.947 0.996
2000 0.735 0.943 0.991 0.641 0.998 0.989 1.003 0.992 0.989 0.987 0.994 0.993 0.875 0.856 0.923 0.996
2010 0.717 0.947 0.990 0.608 0.998 0.988 1.003 0.992 0.988 0.987 0.993 0.993 0.867 0.852 0.917 0.996
2020 0.695 0.951 0.990 0.593 0.998 0.988 1.003 0.991 0.988 0.986 0.993 0.992 0.866 0.856 0.913 0.995
2030 0.692 0.949 0.990 0.587 0.998 0.987 1.003 0.991 0.987 0.986 0.993 0.992 0.864 0.853 0.908 0.995
2055 0.689 0.950 0.990 0.587 0.998 0.987 1.003 0.991 0.987 0.985 0.993 0.992 0.864 0.855 0.912 0.995
2080 0.695 0.950 0.991 0.587 0.998 0.988 1.003 0.992 0.988 0.987 0.994 0.994 0.864 0.854 0.917 0.996
Scenario 2 1930 1.000 1.000 1.000 1.000 1.000 1.000 1.000 1.000 1.000 1.000 1.000 1.000 1.000 1.000 1.000 1.000
1940 0.912 0.994 0.998 0.938 1.000 0.998 1.001 0.998 0.998 0.997 0.998 0.998 0.991 0.990 0.997 0.999
1950 0.880 0.986 0.993 0.825 0.998 0.993 1.000 0.994 0.993 0.991 0.995 0.995 0.978 0.975 0.994 0.997
1960 0.848 0.974 0.990 0.738 0.996 0.988 1.000 0.991 0.988 0.986 0.992 0.992 0.958 0.952 0.989 0.994
1970 0.822 0.961 0.989 0.692 0.996 0.986 1.001 0.990 0.986 0.985 0.992 0.991 0.935 0.922 0.977 0.993
1980 0.793 0.954 0.990 0.678 0.997 0.987 1.002 0.991 0.987 0.986 0.993 0.992 0.912 0.896 0.966 0.995
1990 0.762 0.948 0.991 0.663 0.998 0.988 1.003 0.992 0.988 0.987 0.994 0.993 0.891 0.875 0.947 0.996
2000 0.746 0.943 0.991 0.638 0.998 0.989 1.003 0.992 0.989 0.987 0.994 0.993 0.875 0.856 0.923 0.996
2010 0.739 0.947 0.990 0.601 0.998 0.988 1.003 0.992 0.988 0.987 0.993 0.993 0.867 0.852 0.917 0.996
2020 0.736 0.951 0.990 0.578 0.998 0.988 1.003 0.991 0.988 0.986 0.993 0.992 0.865 0.856 0.912 0.995
2030 0.758 0.949 0.990 0.561 0.998 0.987 1.003 0.991 0.987 0.986 0.993 0.992 0.864 0.853 0.908 0.995
2055 0.832 0.949 0.990 0.508 0.998 0.987 1.003 0.991 0.987 0.985 0.993 0.992 0.863 0.855 0.911 0.995
2080 0.900 0.950 0.992 0.351 0.998 0.989 1.003 0.993 0.989 0.988 0.995 0.994 0.862 0.853 0.916 0.996

73
Table 19 Simulation Results – WELFARE WITH EQUIVALENT VARIATION (continued)
Birth year JAPAN USA CHINA S.
KOREA INDIA INDONESIA
BANGLADESH
PHILIPPINES
THAILAND
VIETNAM
BRAZIL PERU AUSTR
ALIA CANA
DA EUROPEREST
OF WORLD
Scenario 3 1930 1.000 1.000 1.000 1.000 1.000 1.000 1.000 1.000 1.000 1.000 1.000 1.000 1.000 1.000 1.000 1.000
1940 0.912 0.994 0.998 0.938 1.000 0.998 1.001 0.998 0.998 0.997 0.998 0.998 0.991 0.990 0.997 0.999
1950 0.880 0.986 0.993 0.825 0.998 0.993 1.000 0.994 0.993 0.991 0.995 0.995 0.978 0.975 0.994 0.997
1960 0.848 0.974 0.990 0.738 0.996 0.988 1.000 0.991 0.988 0.986 0.992 0.992 0.958 0.952 0.989 0.994
1970 0.822 0.961 0.989 0.692 0.996 0.986 1.001 0.990 0.986 0.985 0.992 0.991 0.935 0.922 0.977 0.993
1980 0.793 0.954 0.990 0.678 0.997 0.987 1.002 0.991 0.987 0.986 0.993 0.992 0.912 0.896 0.966 0.995
1990 0.761 0.948 0.991 0.663 0.998 0.988 1.003 0.992 0.988 0.987 0.994 0.993 0.891 0.875 0.947 0.996
2000 0.743 0.943 0.991 0.639 0.998 0.989 1.003 0.992 0.989 0.987 0.994 0.993 0.875 0.856 0.923 0.996
2010 0.731 0.947 0.990 0.603 0.998 0.988 1.003 0.992 0.988 0.987 0.993 0.993 0.867 0.852 0.917 0.996
2020 0.719 0.951 0.990 0.585 0.998 0.988 1.003 0.991 0.988 0.986 0.993 0.992 0.865 0.856 0.912 0.995
2030 0.726 0.949 0.990 0.577 0.998 0.987 1.003 0.991 0.987 0.986 0.993 0.992 0.864 0.853 0.908 0.995
2055 0.740 0.950 0.990 0.573 0.998 0.987 1.003 0.991 0.987 0.985 0.993 0.992 0.864 0.855 0.912 0.995
2080 0.746 0.950 0.991 0.572 0.998 0.988 1.003 0.993 0.988 0.987 0.994 0.994 0.863 0.853 0.917 0.996
Scenario 4 1930 1.000 1.000 1.000 1.000 1.000 1.000 1.000 1.000 1.000 1.000 1.000 1.000 1.000 1.000 1.000 1.000
1940 0.912 0.994 0.998 0.938 1.000 0.998 1.001 0.998 0.998 0.997 0.998 0.998 0.991 0.990 0.997 0.999
1950 0.880 0.986 0.993 0.825 0.998 0.993 1.000 0.994 0.993 0.991 0.995 0.995 0.978 0.975 0.994 0.997
1960 0.848 0.974 0.990 0.738 0.996 0.988 1.000 0.991 0.988 0.986 0.992 0.992 0.958 0.952 0.989 0.994
1970 0.821 0.961 0.989 0.692 0.996 0.986 1.001 0.990 0.986 0.985 0.992 0.991 0.935 0.922 0.977 0.993
1980 0.792 0.954 0.990 0.679 0.997 0.987 1.002 0.991 0.987 0.986 0.993 0.992 0.912 0.896 0.966 0.995
1990 0.759 0.948 0.991 0.664 0.998 0.988 1.003 0.992 0.988 0.987 0.994 0.993 0.891 0.875 0.947 0.996
2000 0.740 0.943 0.991 0.640 0.998 0.989 1.003 0.992 0.989 0.987 0.994 0.993 0.875 0.856 0.923 0.996
2010 0.729 0.947 0.990 0.604 0.998 0.988 1.003 0.992 0.988 0.987 0.993 0.993 0.867 0.852 0.917 0.996
2020 0.721 0.951 0.990 0.584 0.998 0.988 1.003 0.991 0.988 0.986 0.993 0.992 0.865 0.856 0.912 0.995
2030 0.739 0.949 0.990 0.569 0.998 0.987 1.003 0.991 0.987 0.986 0.993 0.992 0.864 0.853 0.908 0.995
2055 0.813 0.949 0.990 0.522 0.998 0.987 1.003 0.991 0.987 0.985 0.993 0.992 0.864 0.855 0.911 0.995
2080 0.893 0.950 0.992 0.386 0.998 0.989 1.003 0.993 0.989 0.988 0.995 0.994 0.862 0.853 0.917 0.996

74
Table 19 Simulation Results – WELFARE WITH EQUIVALENT VARIATION (continued)
Birth year JAPAN USA CHINA S.
KOREA INDIA INDONESIA
BANGLADESH
PHILIPPINES
THAILAND
VIETNAM
BRAZIL PERU AUSTR
ALIA CANA
DA EUROPEREST
OF WORLD
Scenario 5 1930 1.000 1.000 1.000 1.000 1.000 1.000 1.000 1.000 1.000 1.000 1.000 1.000 1.000 1.000 1.000 1.000
1940 0.912 0.994 0.998 0.938 1.000 0.998 1.001 0.998 0.998 0.997 0.998 0.998 0.991 0.990 0.997 0.999
1950 0.880 0.986 0.993 0.825 0.998 0.993 1.000 0.994 0.993 0.991 0.995 0.995 0.978 0.975 0.994 0.997
1960 0.848 0.974 0.990 0.738 0.996 0.988 1.000 0.991 0.988 0.986 0.992 0.992 0.958 0.952 0.989 0.994
1970 0.821 0.961 0.989 0.692 0.996 0.986 1.001 0.990 0.986 0.985 0.992 0.991 0.935 0.922 0.977 0.993
1980 0.793 0.954 0.990 0.679 0.997 0.987 1.002 0.991 0.987 0.986 0.993 0.992 0.912 0.896 0.966 0.995
1990 0.760 0.948 0.991 0.664 0.998 0.988 1.003 0.992 0.988 0.987 0.994 0.993 0.891 0.875 0.947 0.996
2000 0.741 0.943 0.991 0.639 0.998 0.989 1.003 0.992 0.989 0.987 0.994 0.993 0.875 0.856 0.923 0.996
2010 0.728 0.947 0.990 0.604 0.998 0.988 1.003 0.992 0.988 0.987 0.993 0.993 0.867 0.852 0.917 0.996
2020 0.716 0.951 0.990 0.586 0.998 0.988 1.003 0.991 0.988 0.986 0.993 0.992 0.865 0.856 0.912 0.995
2030 0.728 0.949 0.990 0.575 0.998 0.987 1.003 0.991 0.987 0.986 0.993 0.992 0.864 0.853 0.908 0.995
2055 0.773 0.950 0.990 0.552 0.998 0.987 1.003 0.991 0.987 0.985 0.993 0.992 0.864 0.855 0.912 0.995
2080 0.828 0.950 0.992 0.504 0.998 0.988 1.003 0.993 0.988 0.987 0.994 0.994 0.863 0.853 0.917 0.996
Scenario 6 1930 1.000 1.000 1.000 1.000 1.000 1.000 1.000 1.000 1.000 1.000 1.000 1.000 1.000 1.000 1.000 1.000
1940 0.897 0.994 0.998 0.938 1.000 0.998 1.001 0.998 0.998 0.997 0.998 0.998 0.991 0.990 0.997 0.999
1950 0.846 0.986 0.994 0.825 0.998 0.993 1.000 0.994 0.993 0.992 0.995 0.995 0.978 0.976 0.995 0.997
1960 0.797 0.974 0.990 0.738 0.996 0.988 1.000 0.991 0.988 0.987 0.992 0.992 0.958 0.952 0.989 0.994
1970 0.756 0.961 0.989 0.692 0.996 0.986 1.001 0.990 0.986 0.985 0.992 0.991 0.935 0.922 0.977 0.993
1980 0.714 0.953 0.990 0.678 0.997 0.987 1.002 0.991 0.987 0.986 0.993 0.992 0.912 0.896 0.966 0.995
1990 0.669 0.948 0.991 0.664 0.998 0.988 1.003 0.992 0.988 0.987 0.994 0.993 0.891 0.875 0.947 0.996
2000 0.643 0.943 0.991 0.641 0.998 0.989 1.003 0.992 0.989 0.987 0.994 0.993 0.875 0.856 0.923 0.996
2010 0.627 0.946 0.990 0.608 0.998 0.988 1.003 0.992 0.988 0.986 0.993 0.993 0.866 0.852 0.917 0.996
2020 0.608 0.950 0.990 0.593 0.998 0.987 1.003 0.991 0.987 0.986 0.993 0.992 0.865 0.856 0.912 0.995
2030 0.605 0.949 0.990 0.587 0.998 0.987 1.003 0.991 0.987 0.986 0.993 0.992 0.864 0.853 0.908 0.995
2055 0.603 0.950 0.990 0.587 0.998 0.987 1.003 0.991 0.987 0.985 0.993 0.992 0.864 0.855 0.912 0.995
2080 0.608 0.950 0.991 0.587 0.998 0.988 1.003 0.992 0.988 0.987 0.994 0.993 0.864 0.854 0.917 0.996
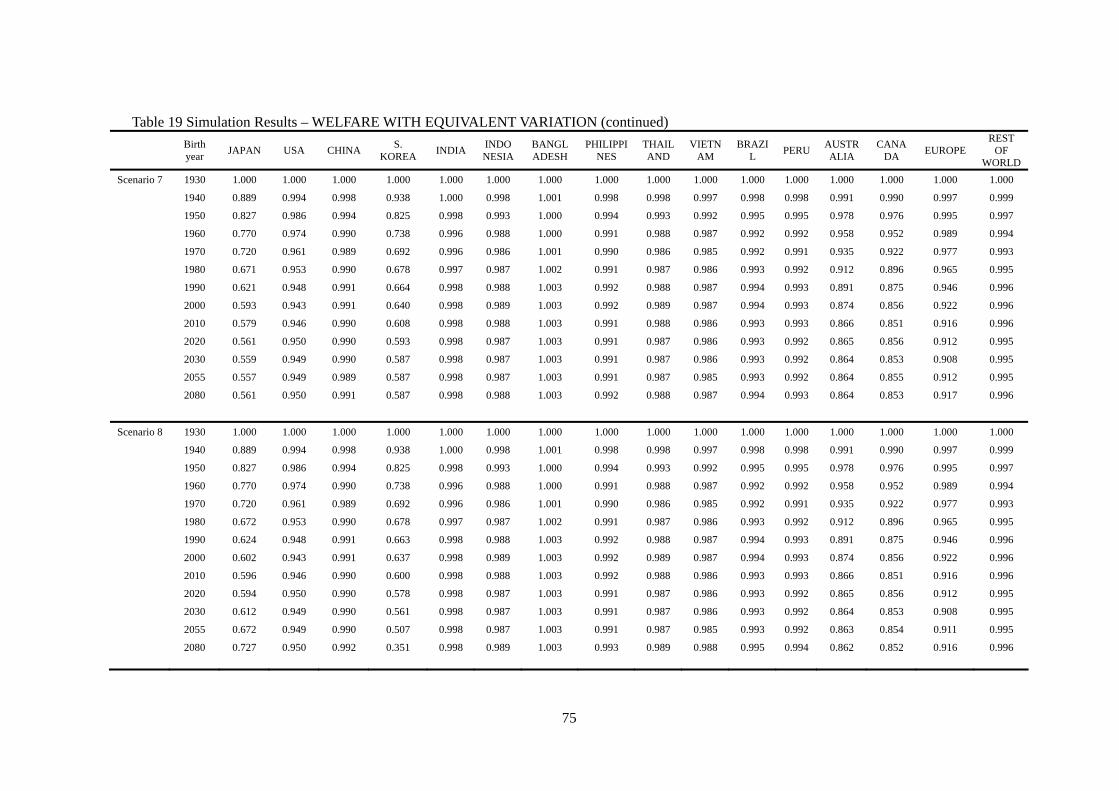
75
Table 19 Simulation Results – WELFARE WITH EQUIVALENT VARIATION (continued)
Birth year JAPAN USA CHINA S.
KOREA INDIA INDONESIA
BANGLADESH
PHILIPPINES
THAILAND
VIETNAM
BRAZIL PERU AUSTR
ALIA CANA
DA EUROPEREST
OF WORLD
Scenario 7 1930 1.000 1.000 1.000 1.000 1.000 1.000 1.000 1.000 1.000 1.000 1.000 1.000 1.000 1.000 1.000 1.000
1940 0.889 0.994 0.998 0.938 1.000 0.998 1.001 0.998 0.998 0.997 0.998 0.998 0.991 0.990 0.997 0.999
1950 0.827 0.986 0.994 0.825 0.998 0.993 1.000 0.994 0.993 0.992 0.995 0.995 0.978 0.976 0.995 0.997
1960 0.770 0.974 0.990 0.738 0.996 0.988 1.000 0.991 0.988 0.987 0.992 0.992 0.958 0.952 0.989 0.994
1970 0.720 0.961 0.989 0.692 0.996 0.986 1.001 0.990 0.986 0.985 0.992 0.991 0.935 0.922 0.977 0.993
1980 0.671 0.953 0.990 0.678 0.997 0.987 1.002 0.991 0.987 0.986 0.993 0.992 0.912 0.896 0.965 0.995
1990 0.621 0.948 0.991 0.664 0.998 0.988 1.003 0.992 0.988 0.987 0.994 0.993 0.891 0.875 0.946 0.996
2000 0.593 0.943 0.991 0.640 0.998 0.989 1.003 0.992 0.989 0.987 0.994 0.993 0.874 0.856 0.922 0.996
2010 0.579 0.946 0.990 0.608 0.998 0.988 1.003 0.991 0.988 0.986 0.993 0.993 0.866 0.851 0.916 0.996
2020 0.561 0.950 0.990 0.593 0.998 0.987 1.003 0.991 0.987 0.986 0.993 0.992 0.865 0.856 0.912 0.995
2030 0.559 0.949 0.990 0.587 0.998 0.987 1.003 0.991 0.987 0.986 0.993 0.992 0.864 0.853 0.908 0.995
2055 0.557 0.949 0.989 0.587 0.998 0.987 1.003 0.991 0.987 0.985 0.993 0.992 0.864 0.855 0.912 0.995
2080 0.561 0.950 0.991 0.587 0.998 0.988 1.003 0.992 0.988 0.987 0.994 0.993 0.864 0.853 0.917 0.996
Scenario 8 1930 1.000 1.000 1.000 1.000 1.000 1.000 1.000 1.000 1.000 1.000 1.000 1.000 1.000 1.000 1.000 1.000
1940 0.889 0.994 0.998 0.938 1.000 0.998 1.001 0.998 0.998 0.997 0.998 0.998 0.991 0.990 0.997 0.999
1950 0.827 0.986 0.994 0.825 0.998 0.993 1.000 0.994 0.993 0.992 0.995 0.995 0.978 0.976 0.995 0.997
1960 0.770 0.974 0.990 0.738 0.996 0.988 1.000 0.991 0.988 0.987 0.992 0.992 0.958 0.952 0.989 0.994
1970 0.720 0.961 0.989 0.692 0.996 0.986 1.001 0.990 0.986 0.985 0.992 0.991 0.935 0.922 0.977 0.993
1980 0.672 0.953 0.990 0.678 0.997 0.987 1.002 0.991 0.987 0.986 0.993 0.992 0.912 0.896 0.965 0.995
1990 0.624 0.948 0.991 0.663 0.998 0.988 1.003 0.992 0.988 0.987 0.994 0.993 0.891 0.875 0.946 0.996
2000 0.602 0.943 0.991 0.637 0.998 0.989 1.003 0.992 0.989 0.987 0.994 0.993 0.874 0.856 0.922 0.996
2010 0.596 0.946 0.990 0.600 0.998 0.988 1.003 0.992 0.988 0.986 0.993 0.993 0.866 0.851 0.916 0.996
2020 0.594 0.950 0.990 0.578 0.998 0.987 1.003 0.991 0.987 0.986 0.993 0.992 0.865 0.856 0.912 0.995
2030 0.612 0.949 0.990 0.561 0.998 0.987 1.003 0.991 0.987 0.986 0.993 0.992 0.864 0.853 0.908 0.995
2055 0.672 0.949 0.990 0.507 0.998 0.987 1.003 0.991 0.987 0.985 0.993 0.992 0.863 0.854 0.911 0.995
2080 0.727 0.950 0.992 0.351 0.998 0.989 1.003 0.993 0.989 0.988 0.995 0.994 0.862 0.852 0.916 0.996


