The Impact of IFRS Implementation, Leverage, Audit Quality ...

1
The Impact of IFRS 16 Leases on Financial Statements of Airline Companies
JIA YOU
A dissertation submitted to
Auckland University of Technology
in fulfilment of the requirements for the degree of
Master of Business (MBus)
2017
Business & Law
Auckland University of Technology

2
Abstract
In 2016, IASB has published a new lease accounting standard International Financial Report-
ing Standard (IFRS) 16 to replace the previous one “IAS 17” and the new standard will be imple-
mented from 1 January 2019 onwards. The new standard eliminates the distinction between operating
lease and finance lease, and requires the lessee to record an asset and a liability for an operating lease
in financial statements. The objective of this dissertation is to examine how IFRS 16 would change
the financial position and financial performance of the lessee.
The study sample comprises 31 airline companies worldwide for the period from 2013 to 2015
and adopts the constructive capitalization method developed by Imhoff et al. (1991). Results indicate
that after capitalization, there will be €1,724.7 million of unrecorded lease liabilities, which is 30.68%
of the total reported liabilities for the 31 sample companies. After capitalization, both leverage ratio
and profitability ratio increase. The additional test for negative and positive income effect provides a
closer insight into the companies’ reform. After capitalization, positive income sub-group experi-
ences an increase in both ROA and ROE ratios, while negative income sub-group experiences a de-
crease in both ratios. In addition, to estimate the change on companies, this paper ranks the companies
according to the ratios before and after capitalization. The rank difference after capitalization means
the company presents a positive performance may exist in higher risks and negative financial ratios
under the new lease standard when comparing with peers.
In general, the results suggest that IFRS 16 would have a material impact on the financial
statements and financial ratios of the lessee, and this paper provides valuable information for financial
statement users when transiting to the new standard.
Key words: IFRS 16, IAS 17, accounting for leases, constructive capitalization

3
Table of Contents
Acknowledgement ............................................................................................................................... 4
Chapter 1. Introduction ........................................................................................................................ 5
Chapter 2. Literature Review ............................................................................................................... 8
2.1 Impact of accounting for leases with industry effects .................................................... 8
2.2 Impact of accounting for leases on financial positions .................................................. 9
2.2.1 Financial statement ................................................................................................. 9
2.2.2 Financial ratios ..................................................................................................... 10
Chapter 3. Lease accounting standards .............................................................................................. 17
3.1 Background and regulatory changes ............................................................................ 17
3.2 IAS 17 Leases .............................................................................................................. 18
3.3 IFRS 16 Leases ............................................................................................................ 19
Chapter 4. Research Methods ............................................................................................................ 21
4.1 Data and sample ........................................................................................................... 21
4.2 Constructive capitalization methods ............................................................................ 21
4.3 Measurement method ................................................................................................... 23
4.3.1 Method for estimating the lease liability............................................................... 23
4.3.2 Method for estimating the lease asset ................................................................... 23
4.3.3 Estimation of income effect .................................................................................. 24
4.4 Choice of Ratio ............................................................................................................ 25
Chapter 5. Findings and discussion.................................................................................................... 26
5.1 Impact of lease capitalization on unrecorded lease liabilities ....................................... 26
5.2 Impact of IFRS 16 on financial statement .................................................................... 26
5.3 Impact of IFRS 16 on financial ratios ........................................................................... 27
5.4 Impact of IFRS 16 on financial ratios in positive and negative income ...................... 28
Chapter 6. Summary and conclusion ................................................................................................. 37
Reference ........................................................................................................................................... 39

4
Acknowledgement
I would like to thank my supervisor Dr. Huamyun. Kabir for his guidance, patience and mo-
tivation. He encouraged me to face trouble spots bravely and solve them patiently rather than to fear
and escape from the problems. His mentorship was paramount in developing me to be an independent
thinker and a self-sufficiency learner. He was also patient with my language problem and research
question and steered me in the right direction whenever I sank into the problems.
I would also like to thank the AUT library facility for providing us with considerable paper
resources, excellent equipment and comfortable 24 hours studying rooms.
In addition, I would like to thank my friends who accompany me and support me spiritually.

5
Chapter 1. Introduction
Lease activity is used by almost all sector entities especially in retail and airline industry and
it has been recognized as an important source of funding for a variety of assets such as laptops, planes
and real estate. Fifty years ago, lease activity did not exist in the field of air transport. However, since
aircraft requires a high investment and a long lifetime (25 years or more), most companies choose to
lease rather than buy (Bourjade, Huc and Muller-Vibes, 2017). The proportion of leased aircraft
worldwide experienced a dramatic growth these years, increasing from 0.5% in 1970 to 40% in 2015.
Meanwhile, nearly fifty percent of Airbus deliveries are financed by lessors (Bourjade et al. 2017).
The current lease accounting standard was introduced by the International Accounting Stand-
ards Board (IASB) in 1997: International Accounting Standard 17 (IAS 17). It makes a fundamental
distinction between finance leases and operating leases, and refers the finance lease as a loan, that
transfers substantial all risks and rewards of ownerships to lessee (IASB, 2003). However, lease pay-
ments under the operating lease are treated as operational expenses; no lease asset and liability appear
on the balance sheet of the lessee. They are disclosed in footnotes of financial statement rather than
on balance sheet. Because of these different accounting treatments, IAS 17 has been criticized for a
long time. More recently Beattie, Goodacre, & Thomson (2006), argued that entities do not recognize
all lease obligations and assets in their balance sheets, which can result in a lack of comparability.
For example, for the same asset, one company decides to take an operating lease while another com-
pany acquires the asset under a finance lease. Under IAS 17, the first company does not need to
recognize the asset on the balance sheet, while the second company shall have to recognize it as an
asset. Hence, PricewaterhouseCoopers (2009) concluded that when some assets and abilities are ex-
cluded from the financial statements, it seems difficult to compare financial information and ratios
between companies that purchases assets and companies that financed with operating leases.
To address this, in 2016, IASB has published a new lease accounting standard International
Financial Reporting Standard (IFRS 16) to replace the previous one “IAS 17” and the new standard
will be implemented from 1 January 2019 onwards. The new standard establishes new rule for the

6
lease recognition, measurement and disclosure in the financial statement (Marian, 2017), including
eliminating the classification of financial lease and operating lease, which means lessees will be re-
quired to recognize almost all leases in the balance sheet. Since the new accounting lease model has
been proposed, many argued against the recognition of lease assets and lease liabilities by lessees. In
fact, in the accompanying documents (Project Summary and Feedback Statement) of IFRS 16, IASB
itself was concerned that, some preparers had questioned the advantages from reporting all lease on
the balance sheet. Although this change is generally accepted by the respondents, especially by fi-
nancial statement users, regulators and accounting firms, there are still some negative feedbacks from
lessors and lessees using operating leases, who fear that this change may bring adverse financial
consequences (Beattie et al., 2006).
In response to these concerns with the potential adverse effects of IFRS 16 on the lessees’
financial statements, I examine how IFRS 16 would affect the financial statements and ratios of airline
companies. I use the constructive capitalization method to estimate the impact the capitalization of
operating leases would have on the financial statements and ratios of the lessees had the operating
leases been capitalized.
The sample is comprised of 31 listed airlines companies that report under IFRS across a wide
range of countries, these airline companies acquire assets, especially planes, under operating leases
(Bourjade et al. 2016). Recently, PricewaterhouseCoopers (PwC, 2016) also conducted a worldwide
leasing capitalization research to investigate the impact of IFRS 16 on EBITD, reported debt, leverage
and solvency in 2014. From these 3000 listed entities from various industries and countries, the figure
demonstrated the median increase in debt and EBIDA of airline industry is the second position, fol-
lowing retailers industry. Since their research focused on the different effects depending on different
industries, there was an unbalanced amount of firms from each industry when comparing or there
was limited examination within one specific industry. Therefore, on the one hand, I limit the sample
to the airline industry and also divide sample into positive income sub-group and negative income
sub-group to further investigate the effect of IFRS 16 related to the different companies’ performance.

7
On the other hand, I extent the research period from the one year (2014) in their research to 3 years
(2013-2015) in this research.
I find that operating lease capitalization has great impact on financial statement and financial
ratios. After capitalization, due to the added unrecorded lease liabilities and the interest expense they
brings, the adjusted assets and liability increase, but the adjusted equity decreases. In terms of finan-
cial ratios, leverage ratios increase. Median ROA and ROE also increase, while this is a bit different
from pervious results, that median ROA decreased in the study by Fülbier et al.(2008). Another sig-
nificant finding from the rank test indicates that, except for the changes in several companies, most
companies do not experience a significant rank difference in D/E and D/A ratios, while the fluctua-
tions of ROA and ROE ratio are unregularly. The rank difference after capitalization means the com-
pany presents a positive performance may exist in higher risks and negative financial ratios under the
new lease standard when comparing with peers. This is accord with the motivation of IFRS 16 im-
plantation to increase the comparability within various companies.
The remaining part of this paper is constructed as follows. Chapter 2 surveys the literature on
the potential impact of the capitalization of operating leases. Chapter 3 introduces the regulatory
changes between IAS 17 and IFRS 16. Chapter 4 describes relevant to adjustment of methodology
and outlines the research design and examination methods employed. In Chapter 5, I report and dis-
cuss the findings. A final Chapter will summarize and come to conclusion.

8
Chapter 2. Literature Review
Lease capitalization refers to the recognition of off balance sheet leases from income state-
ment to the balance sheet of companies and has been widely researched by previous studies over
several decades. In earlier 2010, IASB and the Financial Accounting Standard Board (FASB) issued
a joint exposure Draft (ED) 2010/9, which proposed the concept of “right of use” on lease accounting
and later revised ED 2013 eliminated the classification of operating leases but implemented one sin-
gle lease standard — Lease Capitalization. Although the standard is issued in recent years, there has
been considerable lease-related and capitalization studies examining the effects of eliminating the
distinction between operating and financial lease. The first study about the lease capitalization was
conducted by Nelson (1963). He chose eleven American companies that voluntarily provided the
lease information about the changes in key financial figure resulted from present value of the capital-
ization of the unrecorded lease obligation. The results indicated that the unadjusted financial figures
for lease obligation can mislead the investor and shareholders, as he found the lease capitalization
affected key financial ratios adversely.
2.1 Impact of accounting for leases with industry effects
One stream of the literature has discussed the industry effects associated with leasing stand-
ards. The research has pointed out that the impact of operating lease capitalization varies according
to the various industries.
Singh (2012) focused on retail and restaurant firms from 2006 to 2008 and investigated the
impact of operating lease capitalization on the financial statement and also 11 financial ratios. Con-
sequently, the results showed that (1) both sectors were affected dramatically by this reform in interest
coverage, leverage and profitability, (2) retail firms were affected more greatly than the restaurant
firms and (3) the size of the companies were an important factor in operating lease usage and small
firms were more likely to use operating leases than large firms.

9
The paper by Bostwick and O’Keefe (2013) compared the effects of constructive lease capi-
talization techniques on financial statement elements (assets, liabilities, equity and net profit) and key
performance scales (total liabilities/assets, total liabilities/equity, long term liabilities/equity, return
on asset, return on equity) for five companies from five different industries on financial. It is found
the sample of retail firm is the most affected by lease capitalization, followed by oil and gas con-
glomerate, banking industry, heavy equipment manufacturing and pharmaceutical industry, which
indicated the smallest extent of change among five industries.
Similar studies were performed in some specific industries and presented material conse-
quences from interfirm comparison in difference industries, including retail (Imhoff et al. (1991,
1997); Singh (2012); Mulford and Gram (2007)), foods (Tai, 2013), transportation particularly airline
companies (Öztürk and Serçemeli, 2016).
In addition to industry-specific studies, another line that pervious literature followed is coun-
try-specific. They collected data in New Zealand (Bennett and Bradbury, 2003); Germany (Fülbier et
al., 2008); U.S. (Duke, Hsieh, and Su, 2009); Australia (Wong and Joshi, 2015); Turkey, (Öztürk and
Serçemeli, 2016). Regardless of the wide range of capitalization research, the sample of these previ-
ous studies is generally limited to one industry or one countries. Although this paper will focus merely
on airline industries, the selected airline entities are from various countries.
2.2 Impact of accounting for leases on financial positions
Another common stream of the literature has analyzed the significant effects that operating
lease capitalization brings to off-balance liabilities, assets, equity, profit margins and main financial
indicators. This impacts’ analysis will focus on two dimensions: financial statement and financial
ratios, including leverage ratio and profitability ratios.
2.2.1 Financial statement

10
Imhoff et al., (1991) is the earliest one who developed constructive lease capitalization
method and purposed to highlight the importance of operating lease commitments on commonly used
measures of risk and performance. They investigated 14 U.S. companies in seven industries in fiscal
1987 and found the changes in ratios were linked with operating lease usage, that was a higher decline
(34%) in the ROA ratio for high lessees and lower (10% decline) lease usage companies. In addition,
there was an increase in unrecorded lease asset and liabilities (32.4% and 72.8%) to the total asset
and total debt respectively and a decrease of 21.4% in total equity.
In 2003, Bennett and Bradbury used Imhoff et al, (1991) method and examine the impact of
operating leases capitalization on 38 public New Zealand firms for the fiscal 1995. They changed the
interest rate of Imhoff’s (10%) but assumed 9.4% as interest rate to discount future cash flow and
33% as tax rate. The results indicated the percentage increase of leverage ratio and liabilities was
8.8% and 22.9% respectively, while 3% decrease in equity.
Similarly, in 1998 Beattie et al. found an average increase of 6% in assets and 39% in total
liabilities (with the sample of 232 industrial and commercial firms listed in U.K.). Later, in 2008,
Durocher recorded an increase by 5.6% in assets and 11.5% in liabilities (with the sample in Canada).
Recently, in 2015, Wong et al. found a mean increase of 3.47% in assets and 4.34% in liabilities but
a mean decrease of 0.27% in total equity (with the sample of 107 Australian companies). Also in
2015, Pardo, Giner, and Cancho reported a mean increase of 3.54% in asset and 7.01% in debt and a
decrease of 2.35% in equity (with a sample of all Ibex 35 Spanish entities).
Although these papers used different sample with various industries, the general results
showed under the operating lease capitalization, the amount of unrecorded asset and liabilities pre-
sented an increasing trend but the amount of equity saw a decrease trend and consequently has sig-
nificant impacts on financial ratios.
2.2.2 Financial ratios

11
Leverage ratio is used to measure the liquidity of the companies and present how companies
are financed. D/E and D/A ratios are most commonly used by previous papers and it documented that
capitalization has a negative impact on leverage ratio.
Profitability ratio is another important companies’ operating performance indicators that aca-
demics examined. ROA and ROE are two fundamental profitability ratios to measure the companies’
ability to generate earnings from their investments. IFRS 16 will result in the capitalization of the
majority of current operating leases and recognize all leases to the balance sheets of the lessees and
requires to record separately as leased assets or specifically as property and equipment. Therefore,
under IFRS 16, as the operating leases are capitalized and the expense will be removed from footnote
to balance sheet, the ROA, ROE and profit margins will experience a significant difference. However,
the results from previous studies on the changes of ROA and ROE ratios are different and various.
Tai (2013) investigated the potential problems resulting from the transition to the proposed
new standard. The researcher examined two fast-food company chains in Hong Kong for the period
from 2008 to 2012 and used different assumptions about interest rate and lease period. The average
results showed that the adjusted ROA and ROE suffer serious deterioration with a decrease by nearly
50% in ROA and increase by 1000% in ROE.
In the study conducted by Wong and Joshi (2015) with 109 Australian companies in fiscal
2013, they involved considerable industries, such as material, mental, financial sector, energy and IT
industries. By comparing the difference between impacts on financial ratios, they found an increase
in both D/E (31.69%) and D/A (10.11%) ratios but a decline in ROA (-15.35%) and ROE ratios (-
1.23%).
A research conducted in Indonesia by Nuryani, Heng & Juliesta (2015), they observed 19
companies form various industries and aimed to examine determinants of operating lease policies
(i.e. financial constraint, asset value, growth, and firm’s size). As a result, all the determinants (finan-
cial constraint excluded) can have influence the financial ratios, and after the capitalization, the fi-
nancial ratios were affect negatively, with both adjusted ROA and ROE decreased.

12
More recently, Fafatas and Fischer (2016) examined 22 retailer companies and then did an
additional test to confirm the findings in retail and restaurant industries with a wider sample (109
companies worldwide) in 2014. They found an average decline in the EBIT/Assets ratio was 4.07%.
In addition to the increase in total asset and liabilities, the results from literature also indicated that
operating lease capitalization can result in a materially decline in profit margin, ROA ratio and ROE.
The results from the research by Öztürk et al. (2016) also presented different findings. They
chose one airline company in Turkey to investigate the impacts of IFRS 16 on financial positions and
key ratios. In relation to the results, on the one hand, similar as the pervious papers, the D/E and D/A
ratios presented an increase trend (by 75.3% and 16.9% respectively). On the other hand, there was a
34.4% decline in ROA but a 15.6% increase in ROE ratio. However, they only selected one firm in
one country and this lacked universality. Compared with their paper, this paper is more representative
by widening the sample from one firm in specific country to 31 firms worldwide.
From the reviewing above, as Morales-Díaz and Zamora-Ramírez (2016) concluded, the
leases literature mainly consists of four directions, which are the valuation of the leases, economic
effect of leasing standards, lease determinant and the effect of leasing standards on financial ratio.
This paper will follow the last direction and investigate how IFRS 16 affect airline companies’ finan-
cial statements and also estimate how the current market price the operating lease. Further, this paper
will also consider the influence of the companies’ income factor to discuss what the differences are
under the firms with positive net income and others with loss at the year-end. This contributes to
provider a wider insight to the impacts of the new standard.

13
Table 1 The summary of the main literature review
Authors (Years/Jour-
nal)
Sample Industries Main Findings
Imhoff, Lipe & Wright
(1991, Accounting Hori-
zons)
14 U.S. companies in 1987 In seven industries Lease capitalization resulted in a material decline in the
ROA ratio for both high (a 34% decline) and low (a 10%
decline) lease usage firms.
The negative impact on the D/E ratio was even more sig-
nificant with an average increase of 191% and 47% for
the high and low lease usage firms, respectively.
Bennett & Bradbury
(2003, Journal of Interna-
tional Financial Manage-
ment and Accounting)
38 public firms in New Zea-
land in 1995
Various industries An average unreported lease liability of $31.99 million
(or 22.9% of total liabilities), average unreported lease
assets of $26.97 million (or 8.8% of total assets) and a
decrease in equity of 3%;
An increase in debt to total assets ratio, a decline in
ROA, and a decline in the current ratio.
Fülbier,Silva & Pfer-
dehirt (2008,
Schmalenbach Business
Review)
90 companies in German in
2003 and 2004
Various industries Germany showed great effects on financial ratios, partic-
ularly for assets and liability relations;
Most industries remain unaffected.

14
Authors (Years/Jour-
nal)
Sample Industries Main Findings
Duck, Hsieh&Su (2009,
Advances in Accounting,
incorporating Advances
in international account-
ing)
366 post- Enron era compa-
nies in 2003
50% in manufacturing; 11%
in financial activities indus-
try; 10% information indus-
try; 9% in retail; remaining
from others
There was also a significant negative impact on liquidity,
leverage and performance ratios.
Singh (2012, Journal of
Hospitality & Tourism
Research)
2006~2008, worldwide
companies
Retail and restaurant Retail firms will be affected to a greater extent than res-
taurant firms;
Small firms face higher debt-related ratios than larges.
Tai (2013, International
Journal of Accounting
and Financial Reporting)
Two companies in Hong
Kong for the period from
2008 to 2012
Fast-food Companies with significant operating leases are likely to
experience an increase in assets and liabilities, but de-
crease in equity, resulting in the deterioration of their
ROA and ROE.

15
Authors (Years/Jour-
nal)
Sample Industries Main Findings
Wong&Joshi (2015, Aus-
tralasian Accounting,
Business and Finance
Journal)
107 Australian companies
in 2013
Industrial and material sec-
tor (23), metal & mining
sector (20), energy and util-
ities sector (17), the finan-
cial sector (14), health care
and biotechnology (7) and
IT and telecommunications
(6)
A comparison between positive and negative income
subgroups also shows significant changes in the financial
ratios of both these sub-groups
Fafatas&Fischer (2016,
Journal of Accounting &
Finance)
109 companies worldwide
in 2014
Retail and restaurant The retail industry is by far the most affected; profitabil-
ity ratios can be affected; EBIT/Assets decreases
Öztürk&Serçemeli
(2016, Business and Eco-
nomics Research Journal)
One company (Pegasus Air-
line Company) in Turkey,
2015
Airline After reflection of operating leases, assets and liabilities
increase, equity decreases;
D/A increases but ROA decreases
But the findings are limited in one firm

16
Authors (Years/Jour-
nal)
Sample Industries Main Findings
Bourjade, Huc & Muller-
Vibes (2017, Policy and
Practice)
73 airlines worldwide over
the period 1996–2011
Airline Airlines face a decreasing marginal return to leasing on
their profit margin;
The impact of leasing is therefore positive at first, when
airlines have a low proportion of leased aircraft, but be-
comes negative when this proportion exceeds some
threshold.
In addition to little research about operating lease capital-
isation, this paper focused more on the effects of airline
business model and airline experience on profitability
Nuryani, Heng & Juliesta
(2015,Social and Behav-
ioral Sciences)
19 companies in Indonesia
Stock Exchange from 2008-
2011
Various Decrease on ROA and ROE after capitalization;
It is possible for managers to take advantage of operating
lease as off the balance sheet to hide company’s debt.

17
Chapter 3. Lease accounting standards
3.1 Background and regulatory changes
Initially, these two lease standards are established by different group that IAS 17 is developed
by International Accounting Standards Committee, while IFRS 16 is developed by International Ac-
counting Standards Board. In addition, in comparison to IAS 17, the most fundamental change within
IFRS 16 is the application of the new accounting lease model. There are some main differences of
these two standards summarized generally in the table below (Table 2).
Table 2. Main differences between lessee accounting
IAS 17 IFRS 16
Types of leases IAS 17 distinguishes between finance
leases and operating leases.
IFRS 16 abolishes the distinction
between finance leases and operat-
ing leases.
Recognition of a
lease asset
Finance lease: recognized as assets;
any initial direct costs of the lessee
are added to the value of the asset.
Operating lease: recognized as ex-
penses
Right to control the use of an identi-
fied asset
Recognition of a
lease liability
Finance lease: measured at the fair
value of the leased property, if lower
the PV of the minimum lease pay-
ments.
Operating lease: recognized as ex-
penses.
Measured at the present value of the
lease payments payable over the
lease term, discounted at the rate
implicit in the lease or at borrowing
rate
Balance Sheet Finance lease: lease asset and liability
Operating lease: not asset or liability
recognized
Right-of-use asset and lease liabil-
ity for all the leases
Income Statement Finance lease: as same as IFRS 16
Operating lease: lease payments rec-
ognized as expenses over the lease
term on a straight-line basis.
Depreciation on the right-of-use as-
set and interest on the lease liability
using the effective interest rate
method

18
3.2 IAS 17 Leases
The IAS 17 Leases was first published by the IASC in 1997 and then issued in 2001 by IASB.
This standard is currently adopted by entities to reflect leasing information in financial statement in
accordance with the IFRS. Under IAS 17, accounting to substance of the contracts, lessees are re-
quired to divide all lease contracts into two different categories: financial leases and operating leases.
On the one hand, leases are recognized as financial one when the lessor transfer substantially all risk
and rewards to the lessees and the related payment should be recoded in balance sheet. Operating
leases, on the other hand, are those contracts that do not meet the metric for financial leases, and the
lessee only recognize rental expense accrual.
However, there are some issues associated with operating lease. In relation to the core of the
current lease accounting standard, IAS 17, Wong and Joshi (2015) described that it is a matter of the
classification of financial and operating leases, since the finance lease is recognized as an asset and a
liability on the balance sheet, whereas the rental payment classifies as the operating lease is recog-
nized as an expense in income statement rather than as an asset or a liability on the balance sheet.
Therefore, within IAS 17, companies have more possibilities to determinate their leases as financial
or operating lease and this different treatment can result in issues in financial statement preparation,
since the off-recorded operating leases in balance sheets can cause that the liabilities and profitability
of the company to be documented less than it should be (Öztürk and Serçemeli, 2016). Similarly,
Beattie et al. (2006) and IFRS (2010) the existing standard and argued that the omitted operating
leases can cause a lack of consistency and comparability in financial statements. This gives entities
opportunities to present financial statement unfaithfully in order to generate more economic benefits
or future obligations. As consequence, for financial statement users, such as shareholders and inves-
tors, these unrecorded lease assets and liabilities may make them overlook the significant financial
information.

19
3.3 IFRS 16 Leases
IASB issued this new leasing “IFRS 16 Leases” standard in earlier 2016. The main objective
for this reform is to resolve the risks of current leasing standard discussed above and to provide high
quality, transparent and comparable information from the financial statements (IFRS Foundation,
2013). IFRS 16 seems likely a single lessee accounting model, eliminating the classification between
financial lease and operating lease and requiring lessees to recognize assets and liabilities for all lease
contracts unless the lease term is 12 months or less or the underlying asset has a low value. It is
similar but not equal to the financial lease model under IAS 17.
On the one hand, under the IFRS 16, as lessees, entities recognize asset as right-of-use and
lease liability as debt. The lease asset is the liability and other payments, including lessee’s initial
direct costs, prepayments, removal and dismantling. In terms of lease liabilities, it is the present value
of future lease payments during the lease term. The lease term is recognized as non-cancellable period
in current standard and the minimum lease payment are disclosed compulsorily in IAS 17, while
under IFRS 16, the lease term is wider than non-cancellable period. In fact, in addition to cash flows
from merely the non-cancellable lease term, IFRS 16 also require entities to consider payments in
period, since the estimation varies from the changes in lease contracts, such as cancelation or exten-
sion. Except for lease term, discount rate is another significant factor in IFRS 16 calculation. The
discount rate seems like an implicit interest rate to estimate the value of remainder of the lease term.
The disclosed discount rate varies from different companies and financial years, while most of per-
vious research assumed a unique discount rate for the sample, such as 10% (Imhoff. and Lipe, 1997;
Beattie et al., 1998; Duke et al., 2009; Wong and Joshi 2015). Furthermore, pension obligations rate
has also been employed as discount rate (Fülbier et al. 2008). On the other hand, under the IFRS 16,
as lessors, entities remain unchanged. Both within IAS 17 and IFRS 16, the lessor is supposed to
recognize finance lease as a financed sale of the asset, while they recognize operating lease as rental
income. Hence, this reform makes a little impact on entities as lessors.

20
IFRS 16 is similar to ASC 842 (FASB Accounting Standards Codification (ASC)-topic 842),
the equivalent new leasing standards under USGAAP, which is issued on February 25, 2016. Never-
theless, the recognition for lessees are different (Morales-Díaz and Zamora-Ramírez , 2017). IFRS
16 only recognizes a single model for all leases, while ASC 842 recognizes two models depending
on whether the lease is operating lease or direct financing lease. For the operating lease, it will be-
measured on a linear basis and for the financial lease, it will be classified as same as IFRS 16.

21
Chapter 4. Research Methods
4.1 Data and sample
The initial sample comprises a total of 100 airline companies (top 100 airline company listed
on website: http://www.airlinequality.com/review-pages/top-10-airlines/), while the research re-
moved the companies from sample that do not adopt IFRS, do not provide English editing financial
statement and did not show commitment for operating lease, which means 71 observations are ex-
cluded. Thus, the final sample is 31 airline listed companies. Table 3 describes the sample selection
process.
Table 3 Sample selection process
Airline companies
Number of top 100 airline companies 100
Less number of companies that do not adopt IFRS 42
Less number of companies with no annual report in English edit 23
Less number of companies that did not disclose minimum future operating lease
payment
4
Final sample 31
For this research, I build a database in excel sheets containing financial information for 31
global airline companies. The data was derived from the audited annual reports of the entities pub-
lished on the websites of the selected companies. I collected financial data in original currency that
present in the annual report. When reconcile different currencies of these companies from different
countries, I used an exchange rate based on the financial year end date and then for the whole figure
in that financial year will be reconciled to Euro dollars at that exchange rate.
4.2 Constructive capitalization methods
Reviewing from previous studies, there are two methodologies applied in examining the
changes in balance sheet, income statement and cash flow when operating leases are recognized in
balanced sheet, namely factor method and constructive method.

22
Factor method was released by Moody (2006) to enable lease adjustment simpler and financial
statement more transparent. This method calculates present value in a modified approach, which var-
ies from different sectors. In general, this method is less suitable for accounting research, but more
aligned to market management, since credit ratings can contribute to understand the market exception
and then make wise decisions (Fülbier, Silva, and Pferdehirt,2008).
In contrast to factor method, another important method is the constructive method introduced
by Imhoff et al. (1991, 1997). This method extracts operating leases from the footnote of the financial
statement. The authors examined the lease liability by present vault of future cash flow and the dura-
tion of the future cash flow payment under non-cancellable operating leases were assumed for three
time periods: less than one year, years two to five and more than five years. In their first paper, Imhoff,
Lipe and Wright (1991) revealed the importance of operating lease commitments on the commonly
used measures of risks and performance and illustrated its financial effects on asset, liability and net
income of McDonald’s. They not only introduced the process of constructive lease capitalization
technique that they proposed, but also applied this technique to a sample of seven pairs of firms in
different industries. The results showed that operating leases affect key financial ratios comparison
between companies, since the decrease in return on assets (ROA) was more dramatical for high les-
sees than that for low lessees. Then based on their previous horizons paper, in the later paper, Imhoff,
Lipe and Wright (1997) aimed to demonstrate the influence of adjusting the asset and liabilities on
two main financial ratios, which are ROA and debt to equity (D/E).
Since then, this method is highly accepted and widely employed by prior literature for the
purpose of examining the effects of lease capitalization on financial statements and financial ratios
such as Beattie et.al. (1998), Bennet and Bradbury et.al. (2003), Fülbier, Silva and Pferdehirt (2008),
Singh (2012), Branswijck et.al. (2011), Tai (2013), Bostwick and O’Keefe (2013), Wong and Joshi
(2015) and Öztürk and Serçemeli (2016). Similar to these research studies, this study also follows
Imhoff et al.’(1991, 1997) constructive method but makes some improvements to address the limita-
tion from previous papers, such as the assumptions. It can be a strong criticism for previous studies

23
to follow the assumptions used by Imhoff et al.(1991, 1997), since these uniform assumptions may
not suitable for all companies today (Wong et al., 2015). This study hence uses firm specific discount
rate, interest rate and reminding life to calculate the unrecorded liabilities and assets.
4.3 Measurement method
4.3.1 Method for estimating the lease liability
The lease liabilities are estimated by the present value of future cash flow under the operating
lease. Since 2005, IAS has required all listed companies in Europe to disclose total minimum future
operating lease payment in their additional footnote, including within 1 year, years 2-5 and over
5years. As the future payments are disclosed in an aggregate amount for different years rather than
in a specified amount per year. We assume equal payments over the specified year period and then
determine the duration of future cash flows. To calculating the lease term, this paper follows the
pervious literature (Imhoff, 1991, 1997) and divides the aggregate lease payments over five years by
the average lease payments beyond the years 2-5 to approximate how many years the payments would
continue. To discount the lease cash flows, we obtain long-term borrowing rate for each firm of each
years and calculate the present value factor. Multiplying the present value factor with the scheduled
cash flow, the unrecorded liabilities are obtained.
4.3.2 Method for estimating the lease asset
Imhoff et al. (1991) developed a model to estimate the unrecorded asset. The lease assets are
estimated by multiplying the estimated lease liabilities with the ratio of asset to liability. Regarding
annuity factor, we calculate the company-specific for each company. To obtain the proportion of total
lease life expired, we follow Fülbier et al., 2008 and assume the ratio of remaining life (RL) to the
total life (TL) is 50%. Based on the pervious literature, the calculation can be implied as:

24
PVA= present value of unrecorded asset,
PVL= present value of unrecorded debt,
RL = remaining lease life,
TL = total lease life,
PVAFTL= present value annuity factor for 1€ at r% for n years for the total lease life
PVFRL= present value annuity factor for 1€ at r% for n years for the remaining lease life.
4.3.3 Estimation of income effect
Within IFRS 16, as the operating lease payment is removed from income statement but re-
placed by depreciation, the effect of capitalization on income statement can be significant. To esti-
mate the adjusted equity, the deferred tax effect is calculated as follows:
(unrecorded lease liabilities - unrecorded lease assets) * marginal tax rate
We use the average tax rate (tax expenses/pre-tax profit) for two years (i..e, current year and
the previous year) as the estimate of marginal tax rate. Unlikely as previous studies, who assumed a
certain income tax rate for the whole sample (such as 40% by Imhoff et al. 1997; 30% by Wong et
al. 2015), we use specific-tax rate of each company.
In relation to the calculation of adjusted net income after tax, the lease rental expense is equal
to the sum of the depreciation of liabilities and the interest expense resulting from the unrecognized
lease liabilities. Straight-line depreciation method has been assumed while calculating the deprecia-
tion expense. The interest adjustment is equal to the figure that unrecorded liabilities multiple the
interest rate. Hence, the adjusted net income is calculated as follows:

25
(Earning before tax + operating lease expense - depreciation expense - interest expense) * (1-
tax rate)
4.4 Choice of Ratio
Durocher (2008) developed three main dimensions to measure the entities’ operations, which
are financial strength, management performance and investment return. In relation to the consequence
of lease capitalization, we analyze ratios from three dimensions: balance sheet/ leverage ratios, prof-
itability and interest coverage. To measure management and profitability, return on equity (ROE: net
income/average shareholders' equity) and return on assets (ROA: operating income before interest
expense but after taxes/average total assets) are calculated. In terms of leverage, debt-to-asset (D/A)
and debt-to-equity (D/E) will be calculated. Therefore, this paper will focus on the ratios of D/A,
D/E, ROE and ROA to examine the impacts of IFRS 16 leasing on financial indicators.
In relation to the ROA calculation, there are two main methods delivered by pervious papers.
Fülbier et al.( 2008) calculated ROA as earning before interest and taxation(EBIT) divided by total
assets, while Duke et al. (2009) and calculated ROA with a more pure formula, dividing total assets
by net income. This paper will follow Fülbier et al.( 2008) and calculates the ROA by dividing total
assets by EBIT. Since not all companies disclose EBIT in annual reports, I use the reported earning
before tax to add reported interest expense as the EBIT under current standard. In terms of the ad-
justed EBIT after the capitalization, it is calculated as follows:
Reported EBIT + operating lease expense - depreciation on unrecognized lease asset

26
Chapter 5. Findings and discussion
5.1 Impact of lease capitalization on unrecorded lease liabilities
Table 4: Result of Average Unrecorded Lease Liabilities for 31 sample companies
(€m) Mean % recognised total
Asset
% of recognised Total
Liabilities
Unrecorded Lease Liabili-
ties
1,724.675978 22.57% 30.68%
Unrecorded Lease Assets 1,486.319866 0.21% 0.28%
Equity Adjustment 37.70288171 0.005% 0.00%
The results from Table 4 show the computed unrecorded lease liabilities resulting from the
capitalization adjustment. If the companies adopt IFRS 16, there shall be an amount of average
€1,724.7 million of unrecorded lease liabilities, average €1,486.3 million of unrecorded assets and
average €37.7 million of equity adjustment for the 31 sample companies. Initially, this change re-
sults in the related inflation to the bottom line in balance sheet, as well as financial ratios.
5.2 Impact of IFRS 16 on financial statement
Table 5: Comparison of financial statement summary (total) under IAS 17 and IFRS 16
Reported
€m
After capitaliza-
tion
€m
Differences €m
% of the
Changes
Total Assets 710,674.77 848,902.52 138,227.74 19.45%
Total Liabilities 522,820.53 683,215.4 160,394.87 30.68%
Equity 186,291.25 18,2784.88 -3,506.37 -1.88%
Results summarized in Table 5 show operating lease capitalization has a significant impact
on assets, liabilities and equity. As the capitalization of the unrecorded leases, there is an increase
€138,227.74 million (19.45%) in the total assets and an increase €160,394.87 million (30.68%) in
the liabilities of the companies. The increase is due to the increased liabilities and the recognition of
the new assets. Meanwhile, there is a significant decrease in the total equity, accounting €3,506.37

27
million (-1.88%). The comparisons of the results are in line with the findings from previous studies
and show capitalization lease can result in a significant increase in total asset and liabilities but a
decrease in total equity.
Table 6: Impact of operating lease capitalization on financial statement positions
In
EUR
m
Total asset Total liabilities Total equity Net Income
Unad-
justed
Ad-
juste
d
Cha
nge
Unad-
justed
Ad-
juste
d
Cha
nge
Unad-
justed
Ad-
juste
d
Chan
ge
Unad-
justed
Ad-
juste
d
Cha
nge
Mini-
mum
274.7 320.3 0.1
%
196.9 253.7 0.2
%
-18.3 -
375.9
-
4277.
1%
-
1,962.
3
-
28,87
6.2
-
148
5.4
%
Me-
dian
3,306.
4
4,192
.3
14% 2,418.
8
3,475
.3
24.2
%
723.4 673.8 -
3.4%
20.4 59.4 2.9
%
Maxi-
mum
3,2462 4,427
8.6
259
%
2,3894 3,690
2.6
451.
4%
18,860
.7
18,76
5.5
256.4
%
3,402.
4
16,36
0.2
188.
2%
Mean 7,641.
7
9127.
9
28% 5,621.
7
7,346
.4
45.5
%
2,003.
1
1,965
.4
-
53.3
%
112.8 267.4 -
19.4
%
Results in Table 6 show the statistic results comparison of main financial statement segments
between IAS 17 and IFRS 16. Capitalization results in a mean increase in total assets of 28%. The
median net income increase is 2.9%, but 19.4% decrease for mean net income, while minimum and
maximum observed percentage of the changes are -1485.4% and 188.2% respectively.
5.3 Impact of IFRS 16 on financial ratios
Table 7: Changes in Median Financial Ratios
Debt/Equity Debt/Asset Return on Asset (ROA) Return on Equity (ROE)
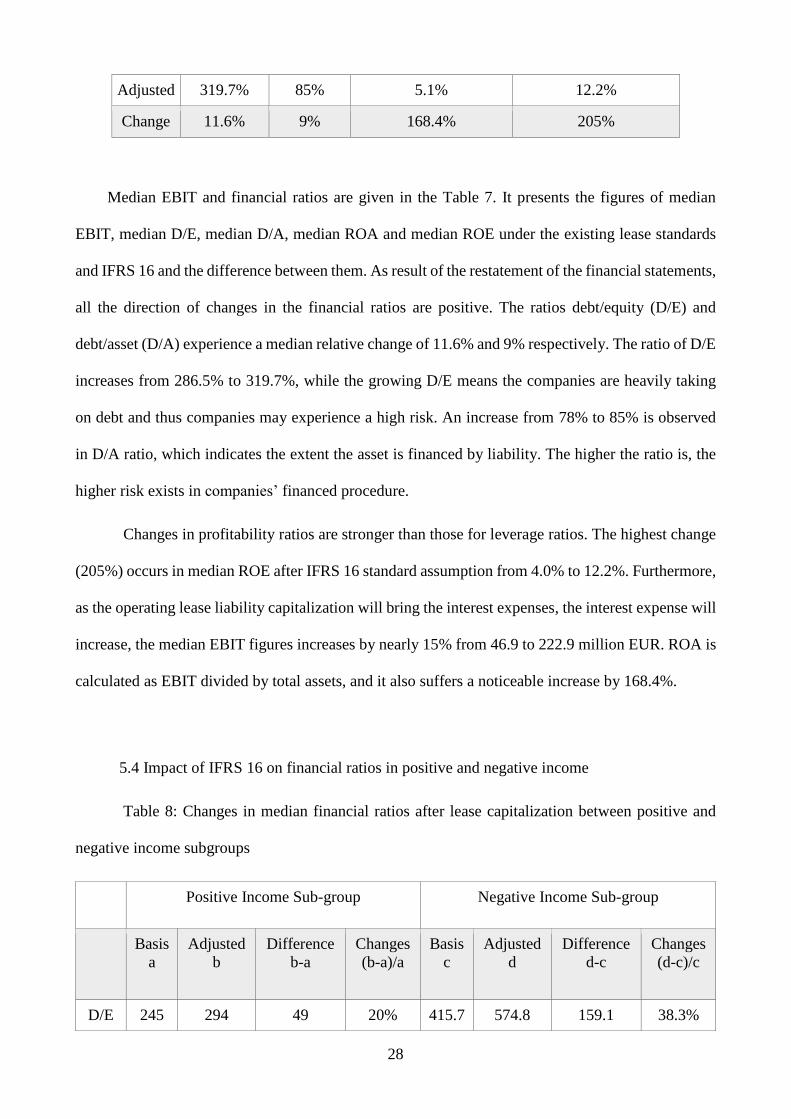
Basis 286.5% 78% 1.9% 4.0%
28
Adjusted 319.7% 85% 5.1% 12.2%
Change 11.6% 9% 168.4% 205%
Median EBIT and financial ratios are given in the Table 7. It presents the figures of median
EBIT, median D/E, median D/A, median ROA and median ROE under the existing lease standards
and IFRS 16 and the difference between them. As result of the restatement of the financial statements,
all the direction of changes in the financial ratios are positive. The ratios debt/equity (D/E) and
debt/asset (D/A) experience a median relative change of 11.6% and 9% respectively. The ratio of D/E
increases from 286.5% to 319.7%, while the growing D/E means the companies are heavily taking
on debt and thus companies may experience a high risk. An increase from 78% to 85% is observed
in D/A ratio, which indicates the extent the asset is financed by liability. The higher the ratio is, the
higher risk exists in companies’ financed procedure.
Changes in profitability ratios are stronger than those for leverage ratios. The highest change
(205%) occurs in median ROE after IFRS 16 standard assumption from 4.0% to 12.2%. Furthermore,
as the operating lease liability capitalization will bring the interest expenses, the interest expense will
increase, the median EBIT figures increases by nearly 15% from 46.9 to 222.9 million EUR. ROA is
calculated as EBIT divided by total assets, and it also suffers a noticeable increase by 168.4%.
5.4 Impact of IFRS 16 on financial ratios in positive and negative income
Table 8: Changes in median financial ratios after lease capitalization between positive and
negative income subgroups
Positive Income Sub-group Negative Income Sub-group
Basis
a
Adjusted
b
Difference
b-a
Changes
(b-a)/a
Basis
c
Adjusted
d
Difference
d-c
Changes
(d-c)/c
D/E 245 294 49 20% 415.7 574.8 159.1 38.3%

29
D/A 71 75 4 5.6% 90.4 94.1 3.7 4.1%
ROA 5.8 10 4.2 72.4% -5.9 -1.4 4.5 -76.3%
ROE 14.9 21.6 6.7 45% -24.3 -10.1 14.2 -58.4%
Since there are 17 out of 31 companies that suffered a loss at the year-end, this paper estimates
the relation between the effect of IFRS 16 on financial ratios and the operating performance of com-
panies. This estimation separates the companies with loss as net income from the whole sample, and
then divides the sample into two sub-groups, which are Positive Income Sub-group and Negative
Income Sub-group. Both income sub-groups record an increase in D/E and the increase of companies
with negative income (38.3%) is higher than the companies with negative income (20%). Meanwhile,
although both two groups report an increase in D/A ratios after capitalization, the changes for negative
income sub-group is lower than the figure for positive income sub-group A closer look at the results
in Table 8 shows the significant difference of the changes in financial ratios on both ROA and ROE
figures, which are directly linked to the positive or negative income. Capitalization on ROA and ROE
show a significant increase (72.4% and 45% respectively) in positive income sub-group but result in
a noticeable decrease (76.3% and 58.4% respectively) in negative income sub-group.
The increase in D/E and D/A ratio for positive income and negative income sub-group is
consistent with the findings in both Duke et al. (2009) and Wong et al. (2015), who also recorded an
increase for both group. In addition, the decrease in ROE for negative income sub-group also con-
firmed with results in their studies. However, the changes of ROA and ROE for positive income sub-
group are different from the results in Duke et al. (2009) and Wong et al. (2015), who found an
increase trend but I found a decrease
5.5 Impact of IFRS 16 on rank of airline companies according to the financial ratios
Table 9 illustrates the rank of individual airline company for their financial ratio and makes a
comparison between the rank under the current lease standard and the rank under operating lease

30
capitalization. The purpose of this rank analysis is to provide a general view to all these adeline
companies, since from the rank fluctuation, the change of companies’ financial performance can be
recorded. As the results shown, on the one hand, only the rank in D/A and D/E ratio remains similarly,
while the fluctuations of ROA and ROE ratio are unregularly. Except for the changes in several com-
panies, most companies do not experience a significant rank difference in D/E and D/A ratios. On the
other hand, the rank for the same fluctuates differently in different year. For example, the rank of
ROE for Air Berlin in 2013 and 2015 is same (29 for unadjusted and 29 for adjusted), while in 2014,
the rank changes dramatically (29 for the unadjusted but 1 for adjusted one).

31
Table 9
Panel A
Ranking of companies for 2015
Sample company
name
Debt/Assets Debt/Equity Return on Assets Return on Equity
Before
capitaliza-
tion
After capital-
ization
Before capi-
talization
After capital-
ization
Before capi-
talization
After capi-
talization
Before capi-
talization
After capi-
talization
Aer Lingus 15 15 11 8 8 15 7 7
Air Asia 17 4 13 13 18 1 19 28
Air Berlin 2 2 15 3 31 26 29 29
Air Canada 6 10 1 29 17 4 1 30
Air France 7 8 2 2 21 22 2 8
Air NZ 21 23 18 17 7 13 14 17
Air Transat 31 27 28 18 16 2 20 4
British 23 22 21 16 1 7 3 6
Easy Jet 26 28 26 24 3 6 8 13
Emirates 19 18 16 9 11 3 10 3
Finnair 24 20 24 12 10 14 18 10
Icelandair 27 26 27 23 2 5 9 11
Kenya Airways 5 7 3 30 28 30 31 1
Klm 8 9 4 31 20 19 17 31
Korean air 11 14 29 27 25 25 23 22

32
Kulula 20 21 17 14 6 9 12 12
Lufthansa 30 31 19 15 9 18 5 9
Norwegian 10 11 7 5 22 27 21 5
Oman Air 9 12 5 4 26 29 30 27
Qantas 16 19 12 10 13 16 15 15
Royal Jordaian 12 5 8 28 14 8 6 26
SAS Scandinavian 29 30 22 22 12 17 16 18
Singapore 28 29 30 25 19 21 22 20
SriLankan Airline 1 1 23 20 29 24 26 21
TAM Airlines 13 16 9 7 23 20 24 19
TAP Air Portugal 3 3 14 11 27 28 28 25
Tiger airlines 18 17 31 26 30 31 27 24
Turkish airlines 22 24 20 19 5 11 11 14
Virgin Atlantic 4 6 6 1 15 12 4 2
Virgin Australia 14 13 10 6 24 23 25 23
WestJet 25 25 25 21 4 10 13 16
Panel B
Ranking of companies for 2014

33
Sample company
name
Debt/Assets Debt/Equity Return on Assets Return on Equity
Before
capitaliza-
tion
After capital-
ization
Before capi-
talization
After capital-
ization
Before capi-
talization
After capi-
talization
Before capi-
talization
After capi-
talization
Aer Lingus 24 11 23 2 23 27 19 30
Air Asia 16 4 14 10 15 1 14 31
Air Berlin 3 2 8 31 29 23 29 1
Air Canada 5 6 3 4 12 4 11 4
Air France 7 9 2 3 14 17 24 14
Air NZ 23 24 22 22 7 11 10 12
Air Transat 31 27 28 19 10 2 12 3
British 12 15 9 8 8 12 3 6
Easy Jet 27 28 26 25 1 5 6 9
Emirates 18 19 16 14 9 3 8 2
Finnair 20 18 20 13 20 15 22 15
Icelandair 26 26 25 24 3 8 7 8
Kenya Airways 14 16 11 11 18 18 18 19
Klm 8 8 1 30 5 6 1 28
Korean air 10 13 27 28 17 22 17 18
Kulula 19 21 19 17 2 7 4 7
Lufthansa 30 31 17 18 13 19 15 17

34
Norwegian 9 10 4 1 21 24 26 29
Oman Air 11 14 6 5 27 28 31 26
Qantas 13 17 10 12 28 29 30 27
Royal Jordaian 6 7 31 29 26 20 2 5
SAS Scandinavian 28 30 18 20 19 21 20 20
Singapore 29 29 30 27 11 16 13 16
SriLankan Airline 1 1 5 7 31 31 28 23
TAM Airlines 15 20 13 16 16 13 16 24
TAP Air Portugal 2 3 12 15 22 26 21 21
Tiger airlines 21 22 29 26 30 30 23 22
Turkish airlines 22 23 21 21 6 10 5 10
Virgin Atlantic 4 5 7 9 25 14 27 13
Virgin Australia 17 12 15 6 24 25 25 25
WestJet 25 25 24 23 4 9 9 11
Panel C
Ranking of companies for 2013
Sample company
name
Debt/Assets Debt/Equity Return on Assets Return on Equity

35
Before
capitaliza-
tion
After capital-
ization
Before capi-
talization
After capital-
ization
Before capi-
talization
After capi-
talization
Before capi-
talization
After capi-
talization
Aer Lingus 28 29 28 29 12 19 14 18
Air Asia 19 20 18 18 15 1 12 1
Air Berlin 4 2 3 5 29 25 29 29
Air Canada 3 4 6 9 20 4 18 31
Air France 7 8 5 4 17 20 27 14
Air NZ 24 23 24 22 6 11 9 15
Air Transat 31 28 29 17 5 2 5 4
British 13 14 11 12 10 18 8 12
Easy Jet 27 27 27 28 1 7 2 10
Emirates 16 15 14 11 9 3 6 3
Finnair 23 19 22 19 18 10 16 7
Icelandair 26 24 26 24 4 8 4 8
Kenya Airways 17 16 16 13 27 29 26 27
Klm 10 12 9 7 14 13 11 16
Korean air 9 13 7 6 23 27 25 26
Kulula 20 17 19 15 2 6 1 6
Lufthansa 30 31 23 23 11 21 13 19
Norwegian 11 7 10 2 8 16 7 17
Oman Air 8 9 4 3 30 30 30 30

36
Qantas 21 22 20 21 19 22 19 22
Royal Jordaian 6 5 2 31 28 26 31 5
SAS Scandinavian 22 25 21 25 16 15 17 20
Singapore 29 30 31 30 13 17 15 21
SriLankan Airline 1 1 15 16 31 31 28 28
TAM Airlines 14 18 12 14 25 12 23 9
TAP Air Portugal 2 3 8 10 21 23 20 23
Tiger airlines 12 10 30 27 26 28 22 24
Turkish airlines 18 21 17 20 7 14 10 13
Virgin Atlantic 5 6 1 1 22 5 21 2
Virgin Australia 15 11 13 8 24 24 24 25
WestJet 25 26 25 26 3 9 3 11
Note: 1 is the highest rank indicating the highest value of the ratio and 31 is the lowest rank indicating the lowest value of the ratio.

37
Chapter 6. Summary and conclusion
This paper examines the impact of the new lease accounting standards (IFRS 16) on financial
statement and financial ratios. I focused the sample on airline industries and chose 31 airline compa-
nies, since companies in this industry lease a large amount of aircrafts and other assets, they are more
likely to be affected by the new lease standard. Similar to most previous studies, this study followed
Imhoff et al.’ (1991) constructive capitalization model as main research method to calculate the un-
recorded lease liabilities. In general, the results indicate that operating lease capitalization can deliver
a material effect to reported liabilities and financial ratios. As the results record, under operating
leases, firms avoid €1,724.7 million of unrecorded lease liabilities, which is 30.68% of the total re-
ported liabilities.
As a result of the restatement of unrecorded lease liabilities, some figures in financial state-
ment experienced a significant fluctuation. The adjusted assets and adjusted liabilities increase while
the adjusted equity decrease after the capitalization. These results are consistent with prior operating
lease capitalization studies (Benett et al., 2003; Fülbier et al., 2008; Wong et al., 2015; Öztürk et al.,
2016).
In relation to the financial ratios changes that IFRS 16 will brings, the results show both
Debt/Equity and Debt/Asset increase after the adjustment, which means that the risks that companies
face will higher. Öztürk et al. (2016) explained that under the current lease standard, unrecorded
financing provides companies opportunities to decrease or conceal the risks by removing their assets,
liabilities, incomes and expenses from the financial statements, since in operating lease, the lease
assets is not required to reflected in the balance sheet of the lessee and lease payments are recorded
on income statement instead. Hence, the results from this paper with the increasing risk and negative
impacts on companies’ financial ratios achieve the motivation that IASB public this new lease stand-
ard (IFRS 16), which contributes to provide the high quality, transparent and comparable information
from the financial statements. Initially, this new lease standard removes the classification of finance

38
lease or operating lease but reflects all the lease contracts on balance sheet. This reform brings a
clearer insight on companies’ performance for investors and other financial statement users. In addi-
tion, the companies’ rank analysis also reflects that companies with a favorable performance and
positive financial ratio may behave negatively as a result of the operating lease capitalization. Alt-
hough most airline companies do not experience a significant rank difference in D/E and D/A ratios,
the fluctuations of ROA and ROE ratio are unregularly. Another significant finding from the rank
test indicates that, except for the changes in several companies, most companies do not experience a
significant rank difference in D/E and D/A ratios, while the fluctuations of ROA and ROE ratio are
unregularly. The rank difference means that the company presents a positive performance may exist
in higher risks and negative financial ratios under the new lease standard when comparing with peers.
Hence, when measuring various companies, the new standard can assist financial statement users to
obtain a more comprehensive and comparable insight on companies’ performance.
As additional analysis, this paper estimated the changes in median financial ratios after lease
capitalization between positive and negative income subgroups and it is found the impact on compa-
nies’ financial ratios varied according to the negative or positive of the companies’ net income. Com-
paring these two income sub-group, the result showed the D/A and D/E were not affect as much, and
they all increased after capitalization. However, there is a different change in ROA and ROE ratios.
Compared to companies with loss sub-group, where both ROA and ROE decrease significantly, the
companies with positive net income sub-group have a high increase in these two ratios.
This paper still has a few limitations that may influence the results. The sample of this paper
only focuses on airline industry, the results may not be generalized to other industries and the effect
of these changes for other industries remains to be investigated. In addition, the results may vary
according to the various size of companies to the operating lease coverage in the companies (Singh,
2012).
39
Reference Beattie, V., Edwards, K., & Goodacre, A. (1998). The impact of constructive operating lease capi-
talization on key accounting ratios. Accounting and Business Research, 28 (4), 233−254.
Bennett, B. K., & Bradbury, M. E. (2003). Capitalizing non-cancelable operating leases. Journal of
International Financial Management and Accounting, 14(2), 101−114.
Bourjade, S., Huc, R., & Muller-Vibes, C. (2017), Leasing and profitability: Empirical evidence
from the airline industry. Policy and Practice 97, (10), 30-49.
Bostwick, E. D., Fahnestock, R. T., & O'Keefe, W. T. (2013). Effects of lease capitalization tech-
niques on key measures of financial performance. Journal of Finance & Accountancy, 12, 91-
102.
Duke, J., & Hsieh, S. J. (2006). Capturing the benefits of operating and synthetic leases — a case
study. Journal of Corporate Accounting & Finance, 18(1), 45−52.
Duke, J.C., Su, J. H., & Su.Y. L.(2009). Operating and Synthetic Leases: Exploiting Financial Ben-
efits in the Post-Enron Era. Advances in Accounting, 25(1). 28– 39.
Fafatas,S & Fischer, B (2016).The Effect of the New Lease Accounting Rules on Profitability Anal-
ysis in the Retail Industry, Journal of Accounting & Finance,16(5), 111-122.
Fülbier, Uwe Rolf, Jorge Lirio Silva, and Henrik Marc Pferdehirt. 2008. “Impact of Lease Capitali-
zation on Financial Ratios of Listed German Companies **.” Schmalenbach Business Review
60(4). 122–45.
IFRS Foundation(2013), IFRS Foundation Constitution, paragraph 2, available online at:
http://www.ifrs.org/The-organisation/Governance- and-accountability/Constitution/Docu-
ments/IFRS- Foundation-Constitution-January-2013.pdf.
IASB, (2016a). Effects analysis, IFRS 16 Leases.
IASB, (2016c). IFRS 16 leases basis for conclusions. IFRS Foundation Publications Department,
London, United Kingdom.
IFRS 16 Leases Standard. IFRS Foundation Publications Department, London, United Kingdom.
January, 2016.
Imhoff, E. A., Lipe, R. C., & Wright, D. W. (1991). Operating leases: Impact of constructive capi-
talization. Accounting Horizons, 5(1), 51−63.
Imhoff, E. A., Lipe, R. C., & Wright, D. W. (1993). The effects of recognition verses disclosure on
shareholder risk and executive compensation. Journal of Accounting, Auditing, and Finance,
8(4), 335−368.
Imhoff, E. A., Lipe, R. C., & Wright, D. W. (1997). Operating leases: Income effects of construc-
tive capitalization. Accounting Horizons, 11(2), 12−32.
Marian, S.,(2017). “Leases”-consequences on the financial statements and financial indicators. Au-
dit financiar, 1(145), 114-122.
Mulford, C., & Gram, M., (2007). The Effects of Lease Capitalization on Various Financial
Measures: An Analysis of the Retail Industry. Journal of Applied Research in Accounting and
Finance. 2(2), 3–13.
Moody’s. 2015. “Financial Statement Adjustments in the Analysis of Non-Financial Corporations.”.
Accounting for Leases: A Literature Review..

40
Nelson, A.T. (1963), “Capitalizing leases – the effect on financial ratios”, Journal of Accountancy.
49-58.
Nuryani, N., Heng, T. T., & Juliesta, N. (2015). Capitalization of operating lease and its impact on
firm’s financial ratios. Social and Behavioral Sciences, 2 (11), 268-276.
Öztürk, M., & Serçemeli, M., (2016). Impact of New Standard “IFRS 16 Leases” on Statement of
Financial Position and Key Ratios: A Case Study on an Airline Company in Turkey. Business
and economics research journal, 7(4), 143-157.
PricewaterhouseCoopers (2009), Point of view: The future of leasing, PricewaterhouseCoopers,
view 3rd October 2011, http://www.pwc.com/us/en/point-of-view/future-of-leasing.jhtml.
Standard & Poor’s (2002), CreditStats operating lease analytical model, New York: Standard &
Poor’s.
Singh, A., (2012). Proposed Lease Accounting Changes: Implications for the Restaurant and Retail
industries. Journal of Hospitality & Tourism Research. 36(3). 335–365.
Tai, B. Y. (2013). Constructive capitalization of operating leases in the Hong Kong fast-food indus-
try. International Journal of Accounting and Financial Reporting, 3(1), 128-142.
Taylor, J. (2011), <<The history of leasing>>, Finance and Business Institute.
Wong, K., & Joshi, M. (2015). The impact of lease capitalization on financial statements and key
ratios: Evidence from Australia. Australasian Accounting, Business and Finance Journal, 9(3),
26-44.