The Impact of Foreign Labour on Host Country Wages: … · The Impact of Foreign Labour on Host...
34
0 The Impact of Foreign Labour on Host Country Wages: The Experience of a Southern Host, Malaysia Prema-chandra Athukorala* Arndt-Corden Department of Economics Australian National University Evelyn S. Devadason Faculty of Economics and Administration University of Malaya Abstract..─This paper investigates the impact of foreign labour on domestic manufacturing wages through a case study of Malaysia, a country where foreign labour immigration has played a key role in manufacturing growth over the past two decades. The main focus of the paper is on an econometric analysis of the determinants of inter-industry variation in wage growth using a new panel dataset. The results suggest that wage growth is fundamentally embedded in the structure and performance of domestic manufacturing. There is evidence of a statistically significant negative impact of foreign labour on the growth of unskilled-worker wages, but the magnitude of the impact is rather small. Keywords: International labour migration, foreign workers, wages, Asia, Malaysia JEL Classification: F22, J31, J61, O53
Transcript of The Impact of Foreign Labour on Host Country Wages: … · The Impact of Foreign Labour on Host...

0
The Impact of Foreign Labour on Host Country Wages:
The Experience of a Southern Host, Malaysia
Prema-chandra Athukorala*
Arndt-Corden Department of Economics
Australian National University
Evelyn S. Devadason
Faculty of Economics and Administration University of Malaya
Abstract..─This paper investigates the impact of foreign labour on domestic manufacturing wages through a
case study of Malaysia, a country where foreign labour immigration has played a key role in manufacturing
growth over the past two decades. The main focus of the paper is on an econometric analysis of the
determinants of inter-industry variation in wage growth using a new panel dataset. The results suggest that
wage growth is fundamentally embedded in the structure and performance of domestic manufacturing. There
is evidence of a statistically significant negative impact of foreign labour on the growth of unskilled-worker
wages, but the magnitude of the impact is rather small.
Keywords: International labour migration, foreign workers, wages, Asia, Malaysia
JEL Classification: F22, J31, J61, O53
1
The Impact of Foreign Labour on Host Country Wages: The Experience of a Southern Host, Malaysia
Summary.─ This paper investigates the impact of foreign labour on domestic manufacturing wages
through a case study of Malaysia, a country where foreign labour immigration has played a key role in
manufacturing growth over the past two decades. The main focus of the paper is on an
econometric analysis of the determinants of inter-industry variation in wage growth using a
new panel dataset. The results suggest that wage growth is fundamentally embedded in the
structure and performance of domestic manufacturing. There is evidence of a statistically
significant negative impact of foreign labour on the growth of unskilled-worker wages, but
the magnitude of the impact is rather small.
1. INTRODUCTION
An important feature of international migration over the past half a century has been the growing importance
of temporary labour migration, mostly the migration of semiskilled and unskilled workers, compared to
permanent (settlement) migration (Hatton and Williamson 2005, Solimano 2010). In the 1960s and 1970s, the
temporary labour flows were overwhelmingly from developing countries to high-income countries in Europe
and North America (‘South-North’ migration). However, the past two decades have seen a rapid increase in
labour flows from less-developed to rapidly-growing countries within the developing world (‘South-South’
migration).1 East Asia occupies a prominent position in this emerging South-South migration system. From
the late 1980s, high-performing economies in the region (Japan, Singapore, Korea, Taiwan, Malaysia and,
more recently, Thailand) have been absorbing an increasing volume of workers from the neighbouring
countries that are at earlier stages of demographic and economic transition. By the middle of the first decade
of this century, over 5 million temporary foreign workers were employed in these countries (Athukorala
2006), compared to an estimated total of 2.5 million in the member countries of the Organization of Economic
Cooperation and Development (OECD) (OECD 2008).

2
The growing presence of foreign workers has sparked a continuing debate in labour importing
countries in East Asia on the social and economic consequences of labour inflows and the policy options for
dealing with the ‘foreign worker problem’. A key concern of this debate is that influx of cheap foreign labour
suppresses domestic wage growth, with adverse implication for long-term growth and improvement of
economic welfare of native workers. In this view, availability of low-wage immigrant labour forestalls skill
upgrading and modernization of technology in the domestic economy that might have occurred otherwise.
Regulating labour inflows so that foreign workers are made available only to supplement native workers and
not to replace them has, therefore, become a contentious issue in policy debates in labour importing countries
(Ducanes and Abella 2008, Hugo 2004, Lee 2002).
Despite the prominence given to this issue in public policy debate, there is a dearth of systematic
empirical research on the impact of migrant worker presence on domestic wages in labour-importing countries
in East Asia. The debate is largely driven by a priori theorizing and casual empiricism. There is of course a
large empirical literature on the experiences of the traditional immigration countries in the North.2 However, it
is hazardous to generalise from this literature because labour market consequences of immigrants are likely to
vary across countries depending on the types of immigrants, local labour market conditions and the stage of
development.
The paper aims to fill this knowledge gap through a case study of Malaysia. Malaysia is an
interesting ‘laboratory’ for an in-depth study of the issue at hand, given its heavy dependence on migrant
workers and the emphasis placed on the migration issue in the public policy debate. Malaysia is the biggest
net importer of labour in Asia with a migrant labour force of around 2 million (21 percent of the total work
force) as of 2008 (Ministry of Finance, 2010). There is a growing concern in the Malaysian policy circles that
wage suppression resulting from the heavy dependence on migrant labour is a key factor that has locked the
Malaysian economy in the ‘the middle income trap’ (NEAC 2010, p. 59). The reform initiatives under
consideration for dealing with the ‘foreign worker problem’ include enforcing equal labour standards for local
and foreign workers and revamping and streamlining of the present worker levy system (which has been in
place since 1992) to achieve specific limits on the entry of unskilled foreign labour in line with national
priorities of industrial upgrading/restructuring (NEAC 2010, Ministry of Finance 2010).
3
In this paper we focus specifically on the experience of Malaysian manufacturing because the
contemporary debate on the wage effect of migrant labour is specifically focussed on this sector. Also data of
reasonable quality required for the analysis are available only for this sector. The core of the paper is an
econometric analysis of the impact of foreign worker dependence on inter-industry wage differentials using a
new panel data set, paying attention to possible simultaneity involved in the relationship between the two
variables. This is embodied in a survey of emerging patterns of migrant worker presence in the manufacturing
sector. We do find a statistically significant negative impact of migrant-worker presence on real wages, but
the magnitude of the impact is rather small. Our results suggest that variables relating to the structure and
performance of domestic manufacturing are far more important than foreign worker dependence in explaining
real wage behaviour.
The rest of the paper is organized as follows. Section 2 surveys the theoretical underpinnings of the
debate on the implications of foreign workers on domestic wages. Section 3 provides an overview of the
trends and characteristics of migrant worker presence to set the stage for the ensuing empirical analysis.
Section 4, which forms the core of the paper, undertakes an econometric analysis of the determinants of real
wages in Malaysian manufacturing using a plant-level panel data set. It begins with a snapshot view of wage
patterns, and then discusses model formulation, variables construction and econometric methodology,
followed by an interpretation of econometric estimates, focussing on the relative importance of foreign worker
dependence in determining wage trends compared to other influences relating to the structure and conduct of
domestic manufacturing. The paper ends in Section 5 with some concluding remarks.
2. ANALYTICAL PERSPECTIVE
Elementary theorizing provides a simple story. In a competitive labour market setting, the wages paid to
unskilled foreign workers in the labour importing country could exceed the sending country wage only by an
amount to cover migration cost plus a premium for the higher cost of living in the foreign country. Once the
premium is established, there will be a downward pressure on the supply price of domestic labour in the
receiving country; the arrival of more foreign workers depresses the local real wage growth since foreign
labour is available in unlimited quantities, with high levels of labour mobility and reliable sources of labour
4
market information. This is the view often reasserted in the contemporary discussion of the impact of foreign
workers on domestic wages in labour importing countries.
The underlying assumption here is that immigrants and natives are close (if not perfect) substitutes
within given skill categories. However, the contemporary labour migration process has two distinct
characteristics which make foreign workers a ‘non-competing group’ within the host-country labour market
(Kindleberger 1967, Bhagwati 1979, Piore 1979).
First, unlike the traditional settlement migration, labour migration is fundamentally driven by ‘built-
in-demand’ stemming from the growth process in the host country; foreign workers enter the country
primarily to take up occupations shunned by the local workers as the growth process generates more attractive
employment opportunities or greater preference for leisure. The jobs filled by foreign workers generally tend
to fall into two categories which are not entirely mutually exclusive (‘dirty, dangerous and difficult’ jobs, or 3-
D jobs): tasks that involve studious and monotonous work processes and static jobs that do not provide a
setting for future career advancement (‘dead-end’ jobs). Good examples of the first category are
manufacturing activities such as welding, metal working, pluming, carpentry and automobile repairing. Most
of these jobs may carry high wages, but the locals shun them mainly because of the nature of work involved.
The second category includes activities such as unskilled construction and agricultural workers, cleaners and
various activities in the entertainment industry. Most of these tasks carry relatively low wages. The two
categories taken together can be termed ‘undesired jobs’ from the point of view of the native workers.
Second, unlike in the case of mass international labour migration in the half century before the First
World War, the magnitude and composition of contemporary international labour (and also other forms of)
migration is governed by autonomy of action by the receiving countries (Bhagwati 1979, Piore 1979, Hatton
and Williamson 2005). Host-country governments usually attempt to restrict and direct the inflow of migrants
with a view to minimizing (perceived or real) adverse effects on the domestic economy. Of course the
restrictions on legal migration, imposed against the back drop of the strong demand for migrant workers in
recipient countries and ample supply of labour in sending countries often lead to clandestine migration.3
However, in a given host country, workers without immigrant status and labour rights do not have the capacity
to directly compete with local workers, regardless of their original employment/labour market status in their
country of origin; they are normally part of a ‘reserve army’ that takes up ‘unwanted jobs’. Thus, the very

5
presence of immigration controls reinforces the duality in the host country labour market that stems from the
process of growth and structural transformation.
The duality of the host-country labour market, with foreign workers forming a complementary rather
than competing group, imply that native workers could in fact gain from an influx of foreign workers. The
entry of foreign workers could improve functioning of the domestic labour market by removing bottlenecks
created by the growth process, enabling them to move up in the employment ladder in an expanding economy.
In addition, the entry of foreign workers can have favourable economy-wide impact on overall
employment and wage levels in the host-country economy through two channels. First, as predicted by the
celebrated Lewis model, augmentation of domestic labour supply through in-migration of labour may yield
high profits, permitting the country to expand investment and output (Kindleberger 1967). In a dual labour
market setting as discussed above, the native workers are likely to gain disproportionately from such
economic expansion. Second, net immigration shifts the demand curve for domestic goods and services
outward and this in turn increases the derived demand for labour. The positive wage effect of the increased
labour demand could at least partly offset the possible direct negative effect of the influx of foreign workers
on wages operating on the supply side.
What the above discussion adds up to is that in-migration of foreign labour might not necessarily
result in a decline in domestic real wage equilibrium down the demand curve. In other words, whether or not
foreign workers suppress domestic real wages is very much an empirical issue.
3. FOREIGN WORKERS IN MALAYSIA
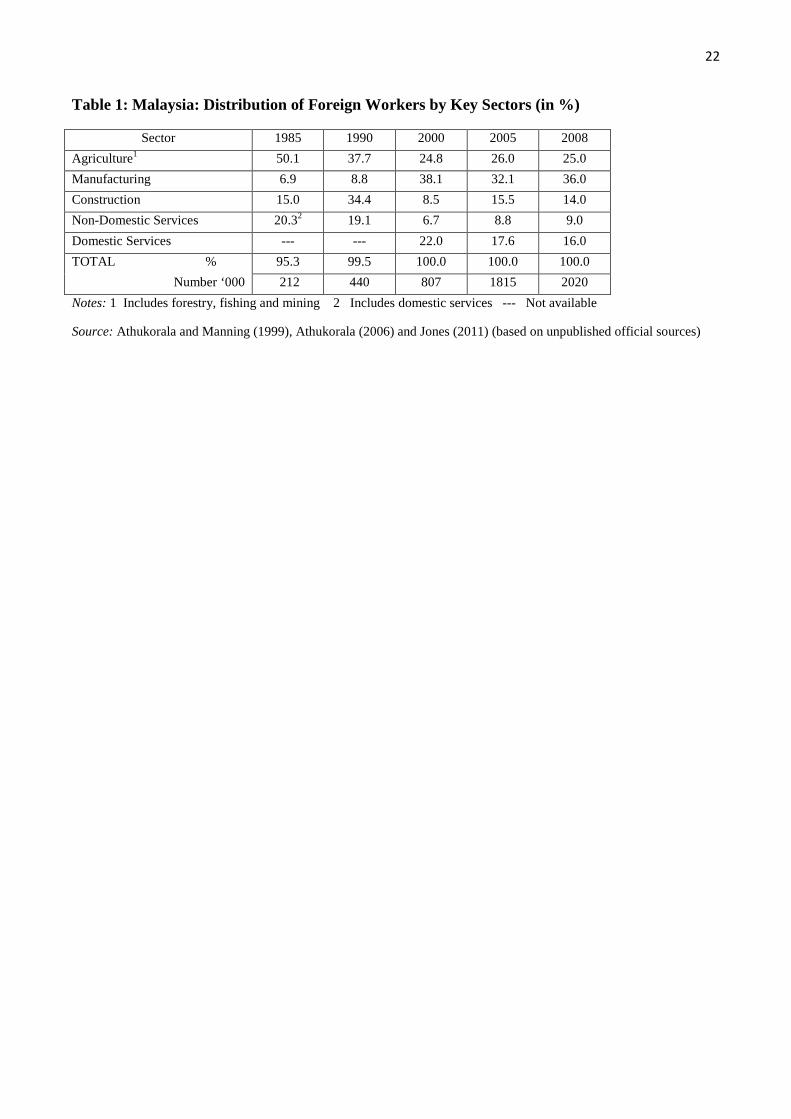
Labour migration has played a key role in the Malaysian economy over the past two decades (Jones 2011,
Athukorala and Manning 1999). The number of registered foreign workers increased from around 440
thousand (3.2 per cent of the labour force) in 1990 to over 2 million (21 per cent of the labour force) in 2008,
accounting for over a third of the increase in total labour supply in the economy between these two years
(Table 1). From about the late 1990s, Malaysia has been the largest labour importer in Asia, both in terms of
the absolute number of foreign workers and their share in the domestic labour force (Athukorala 2006, Ducane
and Abella 2008).4
6
Table 1 about here
Until about the mid-1980s, foreign workers in Malaysia were engaged predominantly in the
agricultural sector (mainly in plantation agriculture), which faced severe labour shortages as native workers
moved to take up employment opportunities in the booming modern sector. Since then they have gradually
penetrated the modern sector of the economy, first to the construction industry and subsequently modern
sector services, household services and manufacturing. The share of documented foreign workers in
manufacturing increased from less than 10 per cent in the early 1990s to 36 per cent in 2007, by far the largest
share among the major economic sectors in the Malaysian economy (Table 1).5
Foreign workers in Malaysia are predominantly from the neighbouring Indonesia. However, over the
years the recruitment network has expanded to other countries in the region and beyond (Bangladesh,
Philippines, Nepal, Vietnam, Sri Lanka, India, Pakistan, Burma, Thailand, Timor Leste, Uzbekistan,
Kazakhstan and Turkmenistan) (Ramasamy, 2004).6 In general, the diversification of source-country
composition of labour supply reflects the government’s attempt to control the source of inflows on socio-
cultural grounds, rather than supply-side factors, in determining labour inflows. Interestingly, the
industry/sectoral composition of workers is quite segmented by country of origin: Indonesian workers are
heavily concentrated in construction and agriculture; Bangladeshis are predominantly in manufacturing;
Filipinos are mainly employed as higher status maids, alongside lower paid Indonesians meeting demand in a
different segment of the market; and Vietnamese are mainly in the construction sector.
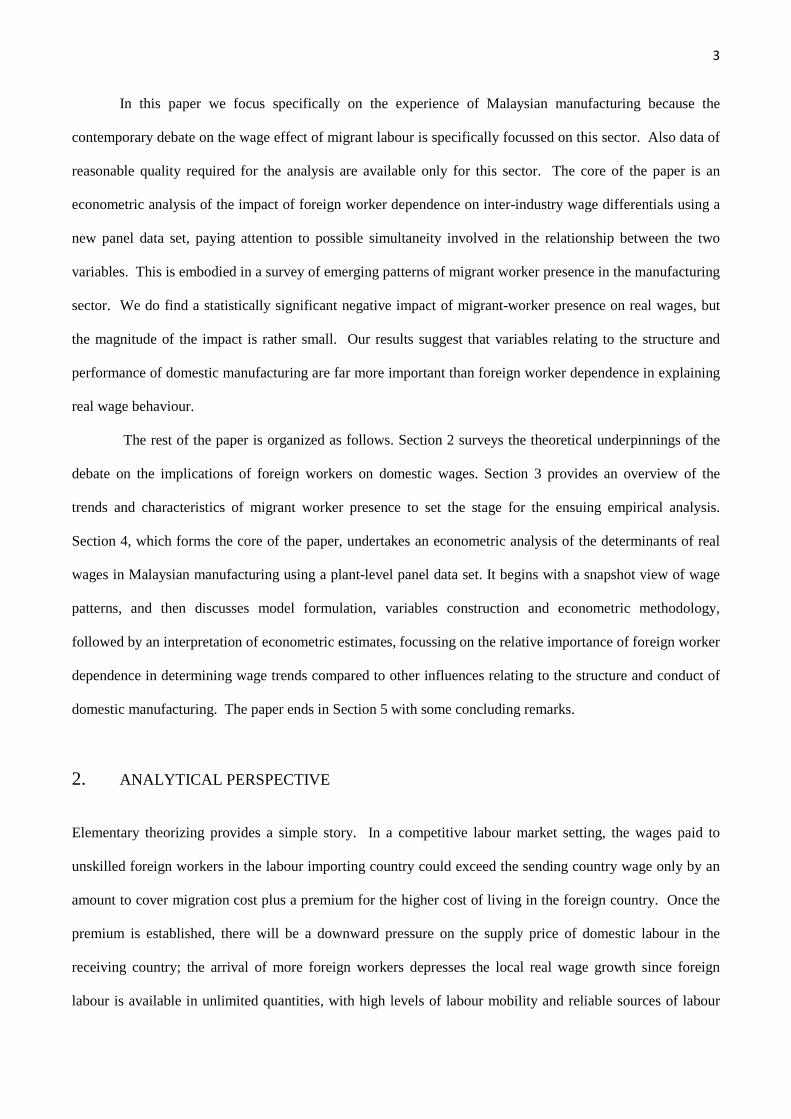
The number of registered foreign workers employed in Malaysian manufacturing increased from
about 8,000 (1.6 per cent of the manufacturing labour force) over 2000,000 (14.5 per cent) by 1995. 7
Following a mild decline during the years of the Asian financial crisis (1997-98) the number increased sharply
during the ensuing years, 360,000 mark by 2005 (Figure 1). Foreign workers in Malaysian manufacturing are
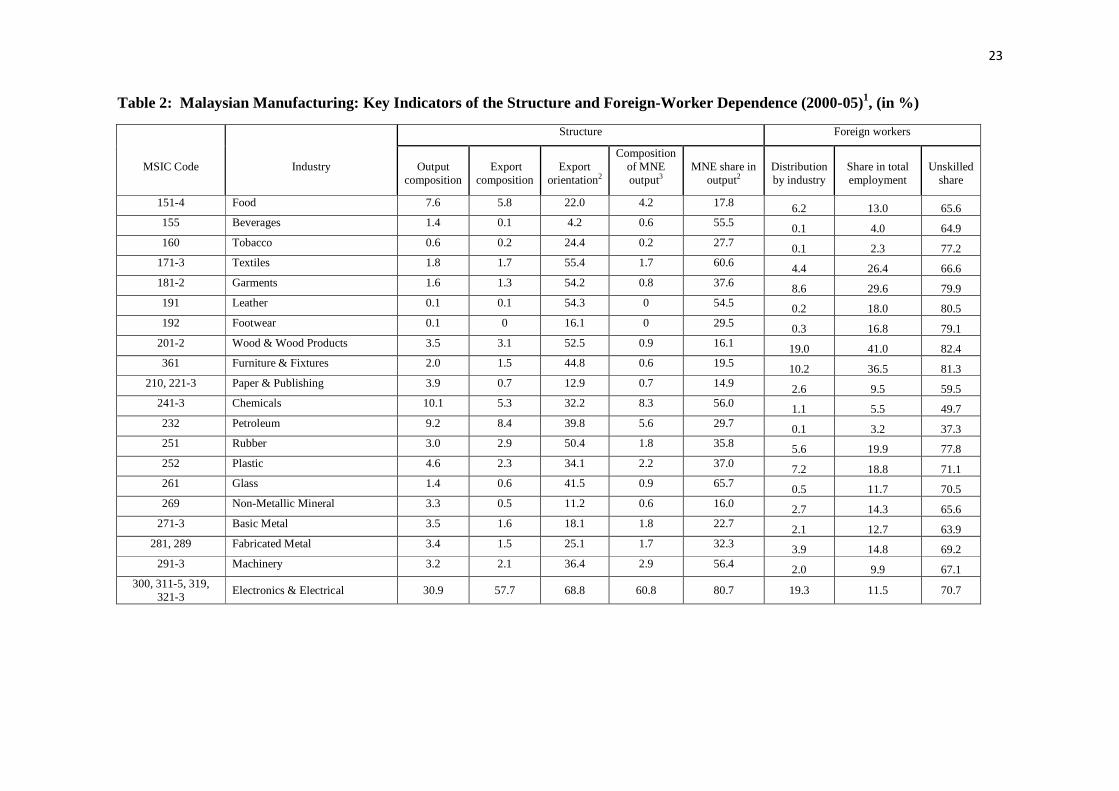
unevenly distributed across industries (Table 2). They are heavily concentrated in export-oriented industries
compared to domestic-market oriented industries. During 2000-05, export-oriented industries (defined to
cover industries with export-output ratios of more than 50 per cent) accounted for over two-thirds of total
foreign workers engaged in Malaysian manufacturing (Table 2). Among export-oriented industries, the degree

7
of dependence on foreign workers is much higher relative to the overall manufacturing average only the
traditional labour-intensive export-oriented industries (wood products, rubber goods, textiles and garments
and miscellaneous manufacturing), but also the electronics and electrical (E&E) industry, which is
conventionally classified as a capital intensive/high-tech industry. It seems that the types of jobs taken up by
foreign workers (3-D jobs) not necessarily industry-specific. Even though it is generally believed that jobs in
the high-tech industries are clean and highly paid, there are many jobs in these industries that involve long
working hours and hard labour and hence shunned by native workers.
Table 2 about here
Figure 1 about here
Foreign workers are predominantly engaged in low-skill (unskilled and semi-skilled) jobs (Table 3).
Over 80 per cent of foreign workers are engaged in low-skill jobs compared to less than half of the native
workers. The share of skilled workers among foreign workers has declined across all industries. Nearly 78 per
cent of all foreign workers in manufacturing in 1990 were production workers/operatives. This figure then
increased to 95 per cent in 2005. The share of foreign production workers in total production workers had
similarly increased from 3.5 per cent to 30.3 per cent over the period of review. Interestingly, the low-skilled
share in total foreign workers is unfirmly high (over 90 per cent) across all industries (with the exception of
petroleum and chemical industries) (Table 2). These patterns reaffirm our earlier observation that migrant
worker concentration in unskilled jobs is not industry specific, but a common phenomenon.
An important feature of the process of export-oriented industrialisation in Malaysia is its heavy
concurrent reliance on both foreign workers and foreign capital (involvement of multinational enterprises
(MNEs). As already noted, export-oriented industries are generally more reliant on foreign workers compared
to domestic-market oriented industries. The degree of MNE participation (as measured by the MNE share in
output) is also much higher in these industries. In particular, MNE dominated E&E industry, by far the major
export-oriented industry in the country, accounted for one fifth of total foreign workers in manufacturing.
Why both foreign labour and foreign capital move to Malaysia? Why MNEs do not relocate manufacturing
in labour abundant neighbouring countries instead of relying on foreign labour for undertaking production in

8
Malaysia? The answer seems to be that availability of cheap labour, while important, is secondary to the
quality of the overall investment environment in determining a country’s attractiveness for foreign direct
investment (FDI). Since the early 1970s, Malaysia’s investment climate has remained highly favourable for
international production compared to that in all source countries of foreign workers employed in Malaysia.
Table 3 about here
4. MIGRANT LABOUR AND DOMESTIC MANUFACTURIING WAGES
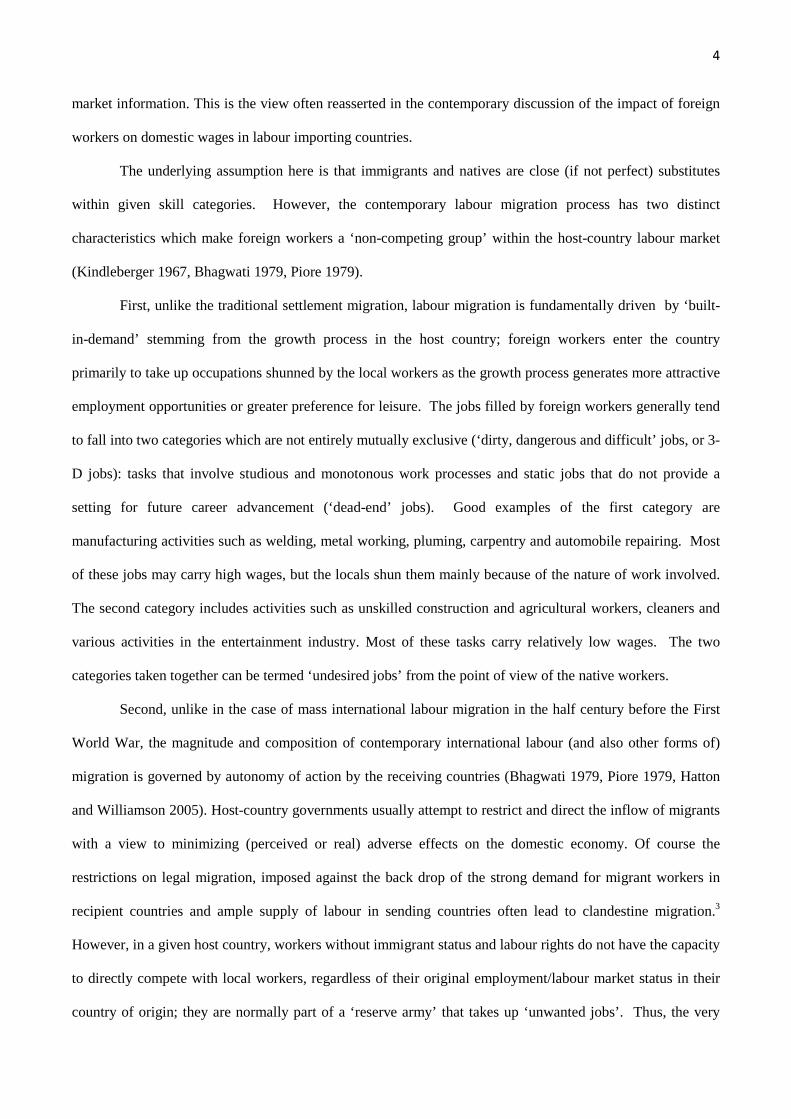
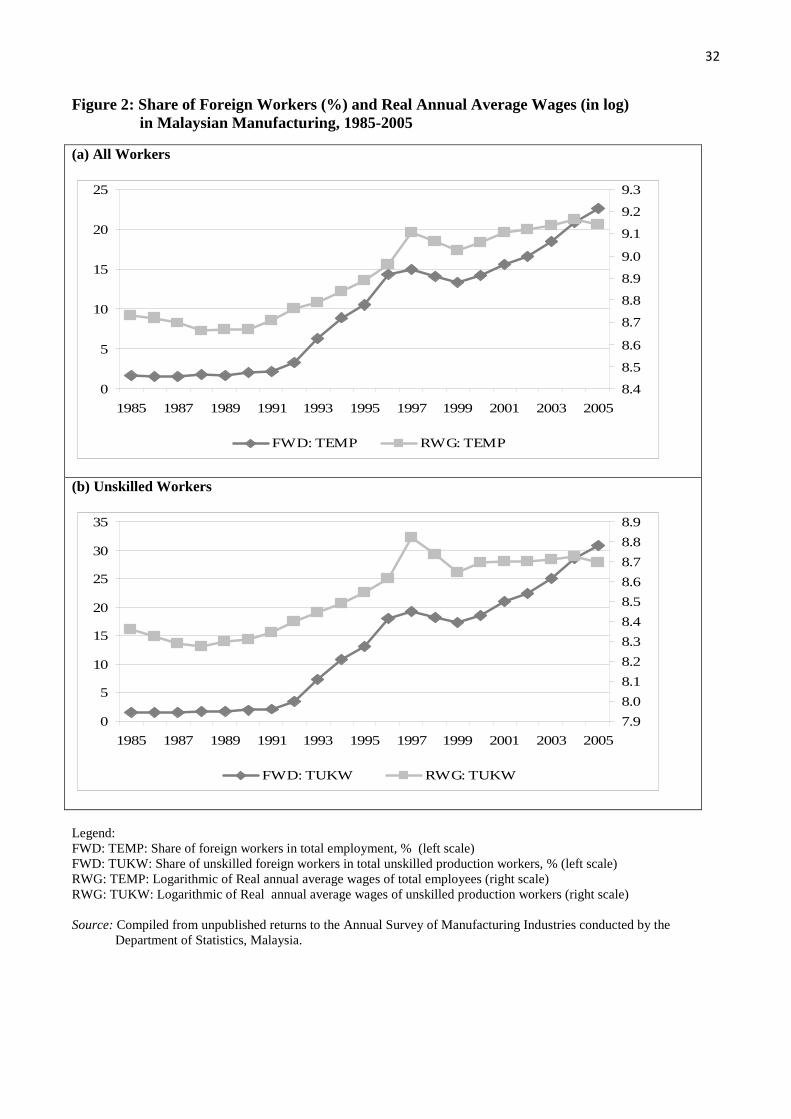
Figure 2 depicts the time patterns of average real wages and migrant worker presence in manufacturing,
focussing separately on total workers and low-skill (production) workers. The data are generally consistent
with the popular perception that the increased presence of foreign workers has been associated with a slowing
down of real wage growth. Real wage of both all manufacturing workers and unskilled workers increased at
an annual average rate of 4 per cent during 1992-1999. During 2000-05, when there was a significant
continuous increase the degree of dependence on foreign workers, average total manufacturing wage grew by
only 1.95 per cent and the rate of increase in average low-skill wage rate was even lower, 0.92 per cent. The
patterns revealed by the scatter plot of real annual wages and shares of foreign workers in total employment of
five-digit over the period 2000-2005 (Figure 3) are consistent with those revealed in the time-series
comparison. The Pearson rank correlation coefficients between real wages and foreign worker dependency, -
0.402 and -0.322 for total workers and unskilled (production) workers respectively, are both statistically
significant at the one per cent level.
Figure 2 about here
Figure 3 about here
Thus the first impression from a casual inspection of data is consistent with the widely-held view that
migrant worker presence suppress domestic manufacturing wage. But, it is hazardous to read too much
meaning into this simple correlation because there are many other factors which impact on inter-industry
9
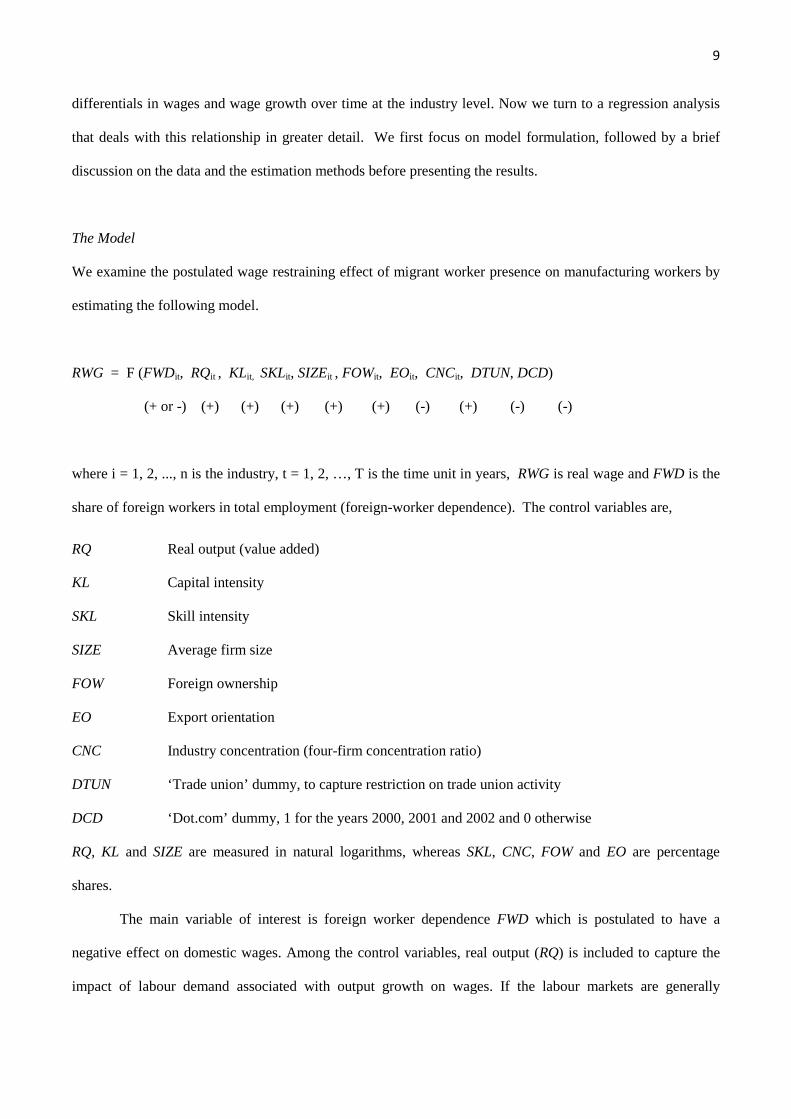
differentials in wages and wage growth over time at the industry level. Now we turn to a regression analysis
that deals with this relationship in greater detail. We first focus on model formulation, followed by a brief
discussion on the data and the estimation methods before presenting the results.
The Model
We examine the postulated wage restraining effect of migrant worker presence on manufacturing workers by
estimating the following model.
RWG = F (FWDit, RQit , KLit, SKLit, SIZEit , FOWit, EOit, CNCit, DTUN, DCD)
(+ or -) (+) (+) (+) (+) (+) (-) (+) (-) (-)
where i = 1, 2, ..., n is the industry, t = 1, 2, …, T is the time unit in years, RWG is real wage and FWD is the
share of foreign workers in total employment (foreign-worker dependence). The control variables are,
RQ Real output (value added)
KL Capital intensity
SKL Skill intensity
SIZE Average firm size
FOW Foreign ownership
EO Export orientation
CNC Industry concentration (four-firm concentration ratio)
DTUN ‘Trade union’ dummy, to capture restriction on trade union activity
DCD ‘Dot.com’ dummy, 1 for the years 2000, 2001 and 2002 and 0 otherwise
RQ, KL and SIZE are measured in natural logarithms, whereas SKL, CNC, FOW and EO are percentage
shares.
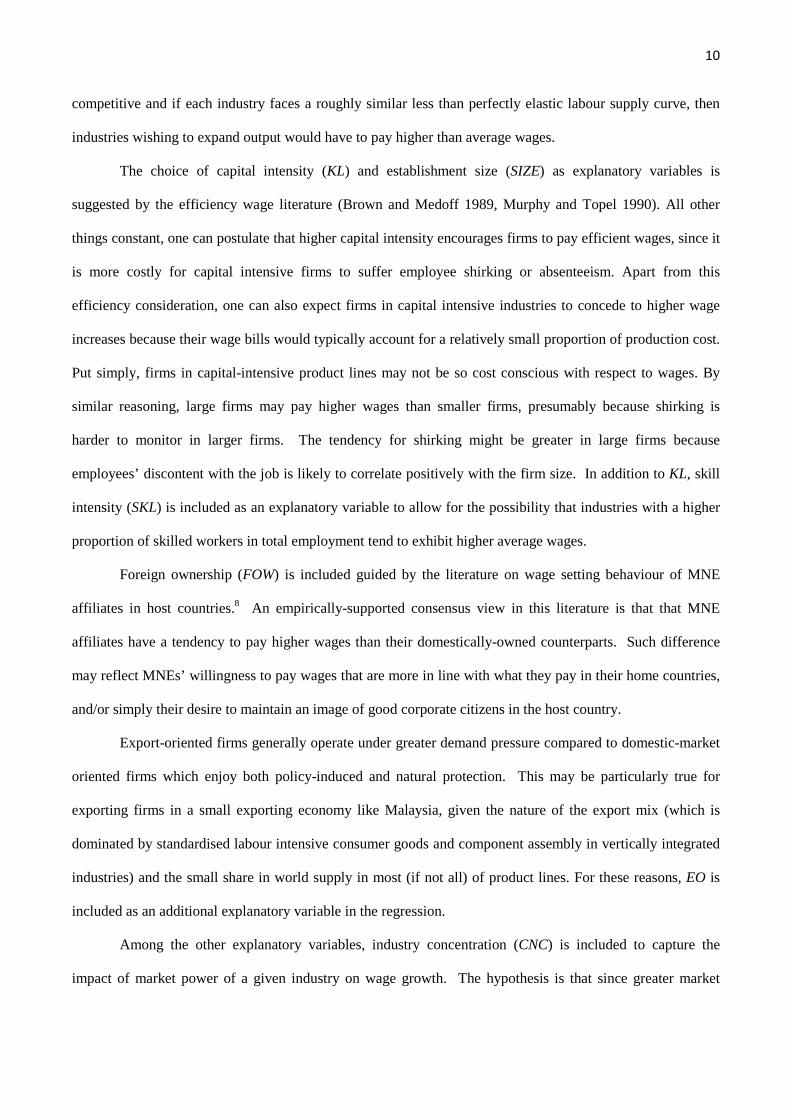
The main variable of interest is foreign worker dependence FWD which is postulated to have a
negative effect on domestic wages. Among the control variables, real output (RQ) is included to capture the
impact of labour demand associated with output growth on wages. If the labour markets are generally
10
competitive and if each industry faces a roughly similar less than perfectly elastic labour supply curve, then
industries wishing to expand output would have to pay higher than average wages.
The choice of capital intensity (KL) and establishment size (SIZE) as explanatory variables is
suggested by the efficiency wage literature (Brown and Medoff 1989, Murphy and Topel 1990). All other
things constant, one can postulate that higher capital intensity encourages firms to pay efficient wages, since it
is more costly for capital intensive firms to suffer employee shirking or absenteeism. Apart from this
efficiency consideration, one can also expect firms in capital intensive industries to concede to higher wage
increases because their wage bills would typically account for a relatively small proportion of production cost.
Put simply, firms in capital-intensive product lines may not be so cost conscious with respect to wages. By
similar reasoning, large firms may pay higher wages than smaller firms, presumably because shirking is
harder to monitor in larger firms. The tendency for shirking might be greater in large firms because
employees’ discontent with the job is likely to correlate positively with the firm size. In addition to KL, skill
intensity (SKL) is included as an explanatory variable to allow for the possibility that industries with a higher
proportion of skilled workers in total employment tend to exhibit higher average wages.
Foreign ownership (FOW) is included guided by the literature on wage setting behaviour of MNE
affiliates in host countries.8 An empirically-supported consensus view in this literature is that that MNE
affiliates have a tendency to pay higher wages than their domestically-owned counterparts. Such difference
may reflect MNEs’ willingness to pay wages that are more in line with what they pay in their home countries,
and/or simply their desire to maintain an image of good corporate citizens in the host country.
Export-oriented firms generally operate under greater demand pressure compared to domestic-market
oriented firms which enjoy both policy-induced and natural protection. This may be particularly true for
exporting firms in a small exporting economy like Malaysia, given the nature of the export mix (which is
dominated by standardised labour intensive consumer goods and component assembly in vertically integrated
industries) and the small share in world supply in most (if not all) of product lines. For these reasons, EO is
included as an additional explanatory variable in the regression.
Among the other explanatory variables, industry concentration (CNC) is included to capture the
impact of market power of a given industry on wage growth. The hypothesis is that since greater market

11
power translates into excess profits, firms in monopolistic or oligopolistic industries insulate from market
pressure and therefore pursue a policy of paying highly competitive wages.
A binary ‘trade union dummy’ (DTUN) (1 for industries which come under the standard industry
classification of electronics products and parts) is included to capture the impact on inter-industry wage
differentials of the prevailing restrictions trade union activity. As parts of an understanding reached in the
early 1970s with foreign electronics companies which set up production in the country, the Malaysian
government has continued to strictly prohibit workers in these industries becoming members of national trade
unions. They are permitted to join only in-house-unions limited to individual firms (Crouch 1996, 224-25). It
is generally believed that this restriction on trade union activity has constrained wage bargaining power of
electronics workers (Koshi 2010). Ideally, we should have included a direct indicator of trade union
influence such as the rate of unionization (union membership in total work force) or the number of days lost
due to trade union action, encompassing all industries, but unfortunately data are not available. Finally, the
dot.com dummy (DCD) is included to capture the effect of the bursting of the dot-com boom in early 2001
and the subsequent economic slowdown in the USA on export-oriented manufacturing, in particular the
electronics industry, in Malaysia.
Data and Variable Construction
Data on manufacturing wages, employment, output, capital and exports were compiled from the electronic
data files containing unpublished returns to the Annual Survey of Manufacturing Industries (ASMI) conducted
by the Department of Statistics (DOS), Malaysia. Price indices used for deflating current-price output and
wage series were from the Monthly Statistical Bulletin database of the Bank Negara Malaysia.
The ASMI data are available electronically from 1992, but it is not possible to consistently match the
data after 1999 with those for the preceding years at the four- or five-digit level of the standard industry
classification because of a major change in the classification system introduced with effect from 2000.
Moreover, the data file for the years prior to the introduction of the new revision do not contain data required
for the construction of three variables relevant for our analysis (FOW, EO and CNC). For these reasons, we
opted to focus primarily on a data panel constructed at the five-digit level covering the six-year period from
2000 to 2005 (the latest year for which data were available at the time of data compilation). However as a
12
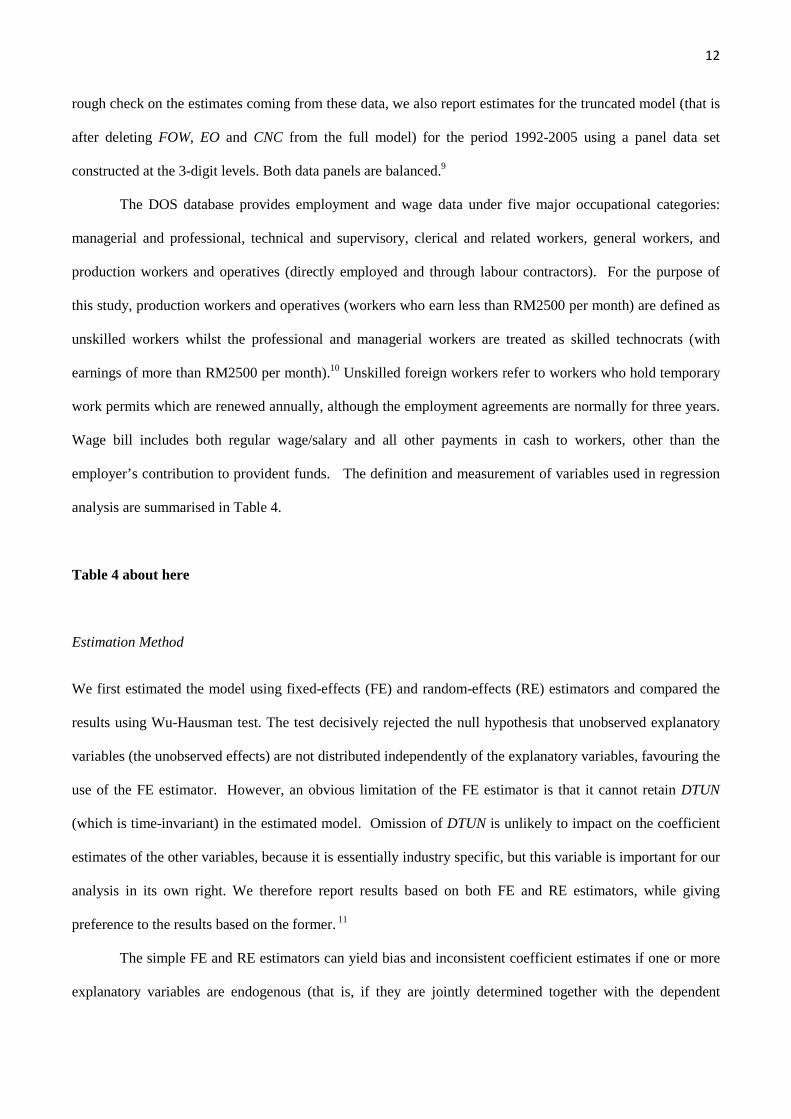
rough check on the estimates coming from these data, we also report estimates for the truncated model (that is
after deleting FOW, EO and CNC from the full model) for the period 1992-2005 using a panel data set
constructed at the 3-digit levels. Both data panels are balanced.9
The DOS database provides employment and wage data under five major occupational categories:
managerial and professional, technical and supervisory, clerical and related workers, general workers, and
production workers and operatives (directly employed and through labour contractors). For the purpose of
this study, production workers and operatives (workers who earn less than RM2500 per month) are defined as
unskilled workers whilst the professional and managerial workers are treated as skilled technocrats (with
earnings of more than RM2500 per month).10 Unskilled foreign workers refer to workers who hold temporary
work permits which are renewed annually, although the employment agreements are normally for three years.
Wage bill includes both regular wage/salary and all other payments in cash to workers, other than the
employer’s contribution to provident funds. The definition and measurement of variables used in regression
analysis are summarised in Table 4.
Table 4 about here
Estimation Method
We first estimated the model using fixed-effects (FE) and random-effects (RE) estimators and compared the
results using Wu-Hausman test. The test decisively rejected the null hypothesis that unobserved explanatory
variables (the unobserved effects) are not distributed independently of the explanatory variables, favouring the
use of the FE estimator. However, an obvious limitation of the FE estimator is that it cannot retain DTUN
(which is time-invariant) in the estimated model. Omission of DTUN is unlikely to impact on the coefficient
estimates of the other variables, because it is essentially industry specific, but this variable is important for our
analysis in its own right. We therefore report results based on both FE and RE estimators, while giving
preference to the results based on the former. 11
The simple FE and RE estimators can yield bias and inconsistent coefficient estimates if one or more
explanatory variables are endogenous (that is, if they are jointly determined together with the dependent
13
variable). In our case, there are reasons to suspect that FWD in the wage equation is potentially endogenous
for a number of reasons. For instance, foreign workers may tend to concentrate in industries where positive
demand shocks have led to better labour market conditions and higher wages for both immigrants and native
workers. In this case, immigrant inflows are not only driven by labour market changes but labour market
changes, in turn, are driven by migrant inflows. The government usually takes into account labour market
conditions (including wage trends) faced by individual industries in regulating labour inflows. Moreover,
unobserved factors affecting migrant flows (industry lobbying) are likely to simultaneously affect wages.
Compared to the RE estimator, the FE estimator has the advantage that it controls for industry-specific fixed
factors affecting both these variables. However, the FE estimator would not help addressing the endogeneity
problem if there are time-varying omitted variables affecting the dependent variable and correlated with the
foreign worker dependency variable.
Given this concern, we re-estimated the model by combining FE and RE estimators each with the
instrumental variable (IV) estimator. The instrument used is the lagged foreign worker dependency (FWDt-1).
The rationale behind this instrumental variable choice is that variation in past migration affects current-year
migration but should have no direct effect on current year wages. It captures persistence in migration.
Persistence is indeed a well-known feature in the migratory process; past migration leads to future migration
through network effect (Hanson 2010) and also as firms become accustomed to relying on foreign workers
(Borjas 1999). Admittedly, this instrument is not perfect: past migration rate could well be correlated with
future wages anticipated by firms. However, we fail to detect significant correlation between our instrument
and the error term of our second stage regression.
Results
The final FE and RE instrumental variable (IV) estimates of the model for the period 2000-05 are reported in
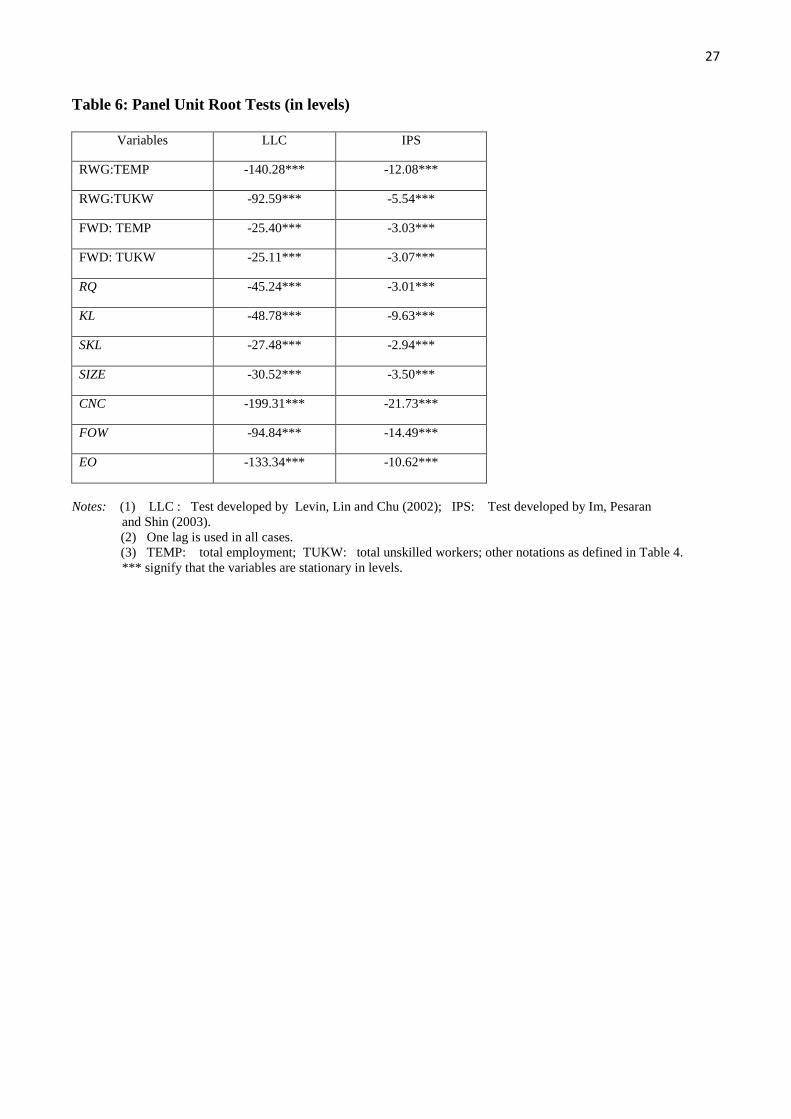
Table 5.12 Panel unit root tests, summary statistics of the variables and their correlation matrix are reported in
Tables 6, 7 and 8 respectively to facilitate interpretation of the results. The alternative simple FE and RE
estimates are reported in Appendix Table A-1 for comparison.
Table 5 about here

14
Table 6 about here
Table 7 about here
Table 8 about here
As already noted, in interpreting the estimates our prime focus is on the FE estimates. The coefficient
of foreign-worker dependence variable (FWD) has the negative sign in both total wage equation (Equation 1)
and unskilled-worker wage equation (Equation 3). It is however statistically insignificant in the former, but
highly significant in the latter. Overall, the results are consistent with the general perception that the presence
of foreign workers suppresses real wages, but the magnitude of the wage suppression effect seems rather
small. In relation to unskilled-worker wages for with the relationship is more precisely estimated, the result
suggests only a 1.4 per cent decline in real wages for a 10 per cent increase in the degree of foreign worker
dependency.13 In both cases, the FE and RE estimates of the coefficient of foreign worker dependence variable
overlap within the two-standard error band, but the difference in magnitude between the two estimates is not
large, suggesting that our inference is not sensitive to the choice of estimation method.
One could reasonably question whether the estimated coefficient of FWD is affected by
multicollinearity: in particular, it is possible that FWD is (negatively) correlated with capital intensity given
the tendency for foreign workers to concentrate in labour intensive industries. But, the estimated correlation
coefficient between FWD and KL is only -0.28 for all workers and -0.22 for unskilled workers (Table 8).14
FWD is also only weakly correlated with all other explanatory variables in both cases. To be sure, we also
estimated the equation after omitting KL and found the coefficient of FWD is robust to this alternative
specification.15
Among the control variables, the coefficients of RQ, KL, SKL, SIZE are highly significant (at 1
percent level or 5 per cent level) with expected signs in both total workers and unskilled worker equations,
and the results are remarkably robust to the method of estimation. The estimated degree of elasticity of real
wage with respect to each of these variables is much larger compared to that with respect to FWD. Thus there
is strong statistical support for the proposition that factors closely related to manufacturing performance and
industrial structure are much more important compared to foreign worker dependence in explaining real wage
behavior.

15
The coefficient of EO bears the expected (negative) sign but is not statistically significant in both FE-
IV equations, providing no statistical support for the hypothesis that greater export orientation is associated
with lower wages. At the same time, there is only weak statistical support for the hypothesis that foreign firms
tend to pay higher wages compared to their local counterparts. The coefficient of FOW has the expected sign
in both FE-IV regressions but is statistically significant (at 10 per cent level) only in the wage equation for all
workers. The result for this variable is also highly sensitive to the choice between instrumented FE and RE
estimators. The results for the impact of industrial concentration on real wages are also mixed.
The coefficient of DCD is highly significant (at the 1 per cent level) in all equations with the expected
(negative) sign. The result is not surprising as there was considerable labour shedding in the export-oriented
electronics industry during the two years following the bursting of the dot-com bubble.
The coefficient of DTUN in both RE-IV equations (Equations 2 and 4) 16 is significant at the 5 per
cent level with the expected (negative) sign. The estimates suggest that workers in industries where national
trade unions are prohibited on average earn 11.3 per cent less than their counterparts in other industries.17 The
impact is even larger for unskilled worker wages, 21.7 per cent. These results, although they are very much in
line with the generally expected impact of trade union pressure on wage setting, need to be treated with
caution because the Malaysian policy of national union membership prohibition is applicable solely to the
electronics industry. The estimates presumably capture not only the impact of labor law but also some
structural peculators of this industry, to the extent the latter are not appropriately captured in the other control
variables in the model. This is certainly an important issue which deserves further scrutiny.
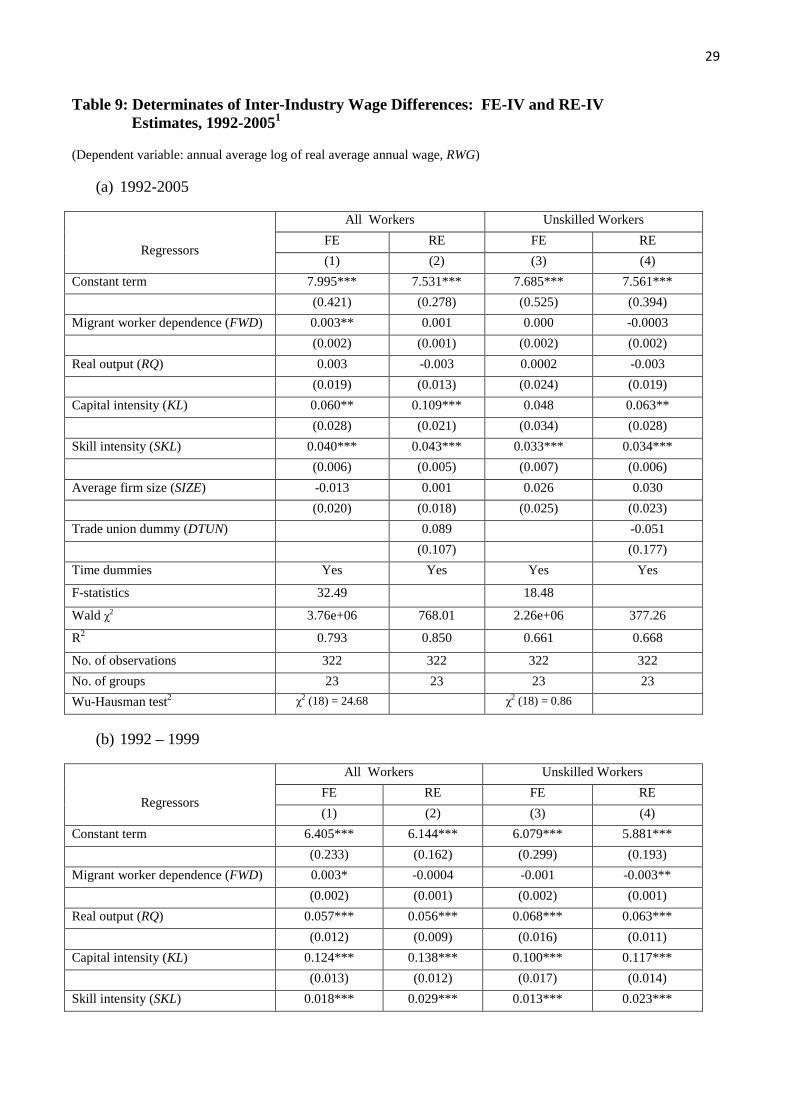
Finally, we turn to the estimates based on the truncated model (that is after dropping FOW, EO and
CNC) estimated using three-digit data over the period 1992-2005 (Table 9). Estimates are reported for the
entire period as well as for two sub-periods, 1992-99 and 2000-05 to facilitate comparison. The coefficient of
FWD in the alternative estimate for period 2000-2005 is remarkably similar to our earlier result from the full
model estimated using five-digit level data. Both coefficients suggest a highly significant negative effect of
foreign worker dependence on real wages, and they overlap within a two standard error band. However, the
coefficient estimate for the full period suggests a highly significant complementary (positive) relationship
between foreign worker dependence and real wages for both all workers and unskilled workers. The estimates
for the two sub-periods indicate that this complementary relationship for the overall period is the net outcome

16
of a strong positive effect in the first sub period that overwhelmed the negative effect in the latter period.
During 1992-99, a 10 per cent increase in foreign worker dependency was associated with 0.8 per cent
increase in wages of all manufacturing workers and 0.4 per cent increase in wages of unskilled workers.
These estimates are generally consistent with the prevailing view in Malaysian policy circles that foreign
workers, who were mostly complementary to local employment to begin with, have begun to compete with
local workers with the passage of time, as domestic labour market tightened and the presence of migrant
workers because a ‘permanent’ feature of the economic landscape of the country. However, the estimates
need to be treated cautiously because of the possible aggregation bias involved in the use of data at the three-
digit level. In any case, from policy point of view, what is more important is the magnitude of the estimated
relationship, which is rather small compared to the estimated impact of industry structure and performance
variables.
Table 9 about here
5. CONCLUDING REMARKS
With the rapid growth of labour inflows from less-developed to rapidly-growing countries within the
developing world, whether increased presence of foreign workers constrains domestic wage growth with
adverse implications for growth and structural transformation in the domestic economy has become a major
concern in economic policy debate in the latter countries. In this paper, we have attempted to inform this
debate through a case study of Malaysia, which has emerged over the past one-and-a-half decades as the
major host to foreign workers in Asia.
We do find a statistically significant negative impact of foreign worker dependency on real
manufacturing wages, but the magnitude of the impact is small. Real manufacturing wages seem
fundamentally embedded in the structure and performance of domestic manufacturing, with the influx of
foreign workers having an impact only at the margin. Our results caution against putting the blame for slow
wage growth mainly (in not solely) on foreign workers, as has been done, for example, in an influential policy
report (NEAC 2010), without probing the issue in the wider context of the industrialization process, the

17
underlying policy framework and the resultant incentive structure. The long standing labour market regime
that has cushioned specific industries against wage bargaining within the national trade unions may also have
played a role.
In this paper we have solely examined the impact of foreign workers presence on manufacturing
wages treating the contemporary policy concern that foreign workers thwarts capital deepening and industrial
upgrading through wage suppression at face value. Further research need to focus specifically on the nexus of
wage and technological change. As Kindleberger (1967, p. 203) has aptly put it in an important early study of
the impact of migrant workers on European growth, this is an issue ‘in which our ignorance is profound’.
NOTES
1 Over the past two decades, South-South flows amounted to approximately 47 per cent of total labour out-
migration from developing countries (about 74 million out of 191 million) (Ratha and Shaw 2007).
2 For surveys of this literature, see Borjas (1999), Ottaviano and Peri (2006), Zimmermann et al (2007).
3 The magnitude of clandestine in-migration varies among countries depending on various factors such as the
efficacy of the administrative mechanism and ‘geography’ (distance to surplus-labour countries and porous
border).
4 The official figures understate the foreign-worker dependence of the Malaysian economy: alongside formal
labour migration has grown a vast network of clandestine (undocumented) migration. The exact size of the
clandestine migrant labour force is unknown; estimates run from half a million to a million.
5 These figures perhaps overstate the relative degree of foreign worker dependence of manufacturing because
clandestine workers are heavily concentrated in other sectors, in particular agriculture and construction.
6 Indonesians still account for the lion’s share in the foreign labour force in Malaysia (over 57 per cent in
2009) (Ministry of Finance 2010).
7 Figures given here relate to foreign workers employed in organized manufacturing (firms employing more
than 5 workers). According to survey-based evidence, the incidence of clandestine worker presence in
organized manufacturing is negligible compared to other sectors in the economy, in particular agriculture,
construction and non-household services.
18
8 Lipsey (2004) provides a comprehensive survey of this literature.
9 Ideally we should have worked with plant-level data, but unfortunately DOS does not release data at that
level; company ownership is a highly sensitive issue in multi-ethnic Malaysia.
10 This is the standard definition used by DOS, but according to some media reports the average wage of a
unskilled workers could be much lower, between RM1800 to 2000. In preliminary analysis, we used both
RM1800 and 2000 as alternative cut-off points and found the econometric estimates to be remarkably
resilient.
11 RE-based results are also useful as a check on the FE-based results because the FE estimator is highly
sensitive to measurement errors because as part of the ‘demeaning’ process it removes a significant portion of
variation in the right-hand-side variables (Angrist and Pischke 2009).
12 The model was estimated with time dummies added to capture time-specific fixed effects. In all cases, the
dot.com dummy (DCD) could not be retained because it was highly correlated with the time dummy.
13 Note that RWG is in log form but FWD is measured as a percentage share. Thus the elasticity of RWG with
respect to FWD is ‘the coefficient of FWD times the mean value of FWD.’
14 To be sure, we estimated the model after deleting KL and found that the estimated coefficient of FWD is
remarkably resilient.
15 Alternative estimates (not reported here for wan of space) are available from the authors on request.
16 As already noted, the effect of this variable is captured as part of industry-specific fixed effects in the FE
estimation.
17 Note that, as the dependent variable is in natural logarithms, the proportionate equivalent for any dummy
coefficient need to be calculated as, [exp (dummy coefficient) – 1]* 100.
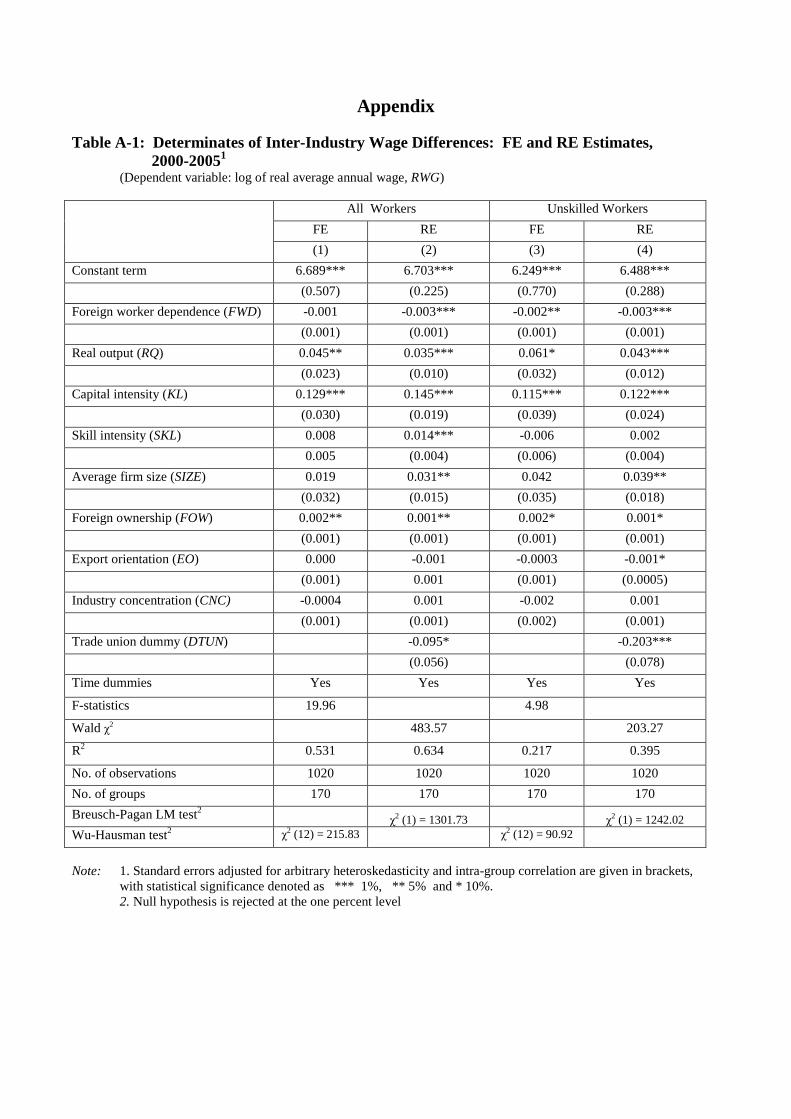
Appendix
Table A-1: Determinates of Inter-Industry Wage Differences: FE and RE Estimates, 2000-20051
(Dependent variable: log of real average annual wage, RWG)
All Workers Unskilled Workers
FE RE FE RE
(1) (2) (3) (4)
Constant term 6.689*** 6.703*** 6.249*** 6.488***
(0.507) (0.225) (0.770) (0.288)
Foreign worker dependence (FWD) -0.001 -0.003*** -0.002** -0.003***
(0.001) (0.001) (0.001) (0.001)
Real output (RQ) 0.045** 0.035*** 0.061* 0.043***
(0.023) (0.010) (0.032) (0.012)
Capital intensity (KL) 0.129*** 0.145*** 0.115*** 0.122***
(0.030) (0.019) (0.039) (0.024)
Skill intensity (SKL) 0.008 0.014*** -0.006 0.002
0.005 (0.004) (0.006) (0.004)
Average firm size (SIZE) 0.019 0.031** 0.042 0.039**
(0.032) (0.015) (0.035) (0.018)
Foreign ownership (FOW) 0.002** 0.001** 0.002* 0.001*
(0.001) (0.001) (0.001) (0.001)
Export orientation (EO) 0.000 -0.001 -0.0003 -0.001*
(0.001) 0.001 (0.001) (0.0005)
Industry concentration (CNC) -0.0004 0.001 -0.002 0.001
(0.001) (0.001) (0.002) (0.001)
Trade union dummy (DTUN) -0.095* -0.203***
(0.056) (0.078)
Time dummies Yes Yes Yes Yes
F-statistics 19.96 4.98
Wald χ2 483.57 203.27
R2 0.531 0.634 0.217 0.395
No. of observations 1020 1020 1020 1020
No. of groups 170 170 170 170
Breusch-Pagan LM test2 χ
2 (1) = 1301.73 χ
2 (1) = 1242.02 Wu-Hausman test2 χ
2 (12) = 215.83 χ2 (12) = 90.92
Note: 1. Standard errors adjusted for arbitrary heteroskedasticity and intra-group correlation are given in brackets,
with statistical significance denoted as *** 1%, ** 5% and * 10%. 2. Null hypothesis is rejected at the one percent level
20
References
Angrist, Joshua D. and JÖrn-Steffen Pischke (2008). Mostly Harmless Econometrics: An Empiricist’s
Companion (NJ: Princeton University Press).
Athukorala, P. (2006). International labour migration in East Asia: trends, patterns and policy issues, Asian
Pacific Economic Literature, 20(1): 18-39.
Athukorala, P. and Chris Manning (1999). International labour migration: a third dimension of East Asian
growth, in Structural Change and International Migration in East Asia: Adjusting to Labour Scarcity
(London: Routledge), pp.1-10.
Bank Negara Malaysia, BNM (2010). Annual Report 2009 (Kuala Lumpur: Bank Negara Malaysia).
Bhagwati, Jagdish 1979 (1983). The economic analysis of international migration, in Robert C. Feenstra (ed.),
Essays in International Economic Theory, Vol. 2: International Factor Mobility (Cambridge,
Massachusetts: MIT Press), pp.44–56.
Bhagwati, Jagdish (1988). Global interdependence and international migration, in J. Cassing and S. Husted
(eds.), Capital Technology and Labour in the New Global Economy (Washington DC: American
Enterprise Institution), pp.149-193.
Borjas, G. J. (1999). The economic analysis of immigration, in Orley C. Ashenfelter and David Card (eds.),
Handbook of Labour Economics, Volume 3, Part 1 (Amsterdam: North Holland), pp.1697-1760.
Brown, Charles and James Medoff J. (1989). The employer size-wage effect, Journal of Political Economy,
97(4): 1027-59.
Crouch, Harold (1996). Government & Society in Malaysia (Ithaca: Cornell University Press).
Ducanes, G. and M. Abella (2008). Labour shortage responses in Japan, Korea, Singapore, Hong Kong and
Malaysia: a review and evaluation, ILO Asian Regional Programme on Governance of Labour
Migration, Working Paper No.2, International Labour Organization (ILO): Geneva.
Hanson, Gordon H. (2010). International migration and the developing world, in Dani Rodrik and Mark R,
Rosenzweig (eds.), Handbook of Development Economics, Volume 5 (Netherlands: North-Holland),
pp.4363-4414.
Hatton, Timothy J. and Jeffrey G. Williamson (2005). Global Migration and the World Economy: Two Centuries
of Policy and Performance (Cambridge, Massachusetts: MIT Press).
Hugo, Graeme (2004). International labour migration in the Asia-Pacific region: emerging trends and issues, in
D.S. Massey and J.E. Taylor (eds.), International Migration: Prospects and Policies in a Global Market
(New York: Oxford University Press), pp.77–103.
Im, Kyung So, M. Hashem Pesaran and Yongcheol Shin (2003). Testing for unit roots in heterogenous panels,
Journal of Econometrics, 115(1): 53-74.
Jones, Gavin W. (2011). Demographic and labour force dynamics, in Hal Hill, Ragayah Haji Mat Zin and
Tham Siew Yean (eds.), Graduating from the Middle: Malaysia’s Development Challenges (London:
Routledge) (forthcoming).
21
Kindleberger, Charles P. (1967). Europe’s Postwar Growth: The Role of Labour Supply, (Cambridge,
Massachusetts.: Harvard University Press).
Koshy, Shaila (2010). Four regional unions for electronics workers soon, The Nation (Kuala Lumpur), May 2.
Lee, Joseph (2002). The role of low-skilled foreign workers in Taiwan’s economic development, Asia Pacific
Business Review, 8(4): 41-66.
Levin, A., C.F. Lin, and C.J. Chu (2002). Unit root tests in panel data: asymptotic and finite-sample
properties, Journal of Econometrics, 108(1):1-24.
Lipsey, Robert E. (2004). Home and host country effects of FDI, in Robert E. Baldwin and L. Alan Winters
(eds.), Challenges to Globalization: Analyzing the Economics (Chicago: Chicago University Press),
pp.333-382.
Ministry of Finance, Malaysia (2010). Economic Report 2009 (Kuala Lumpur: Government Printers).
Murphy, Kevin M. and Robert H. Topel (1990). Efficiency wages reconsidered: theory and evidence, in
Yaram Weiss and Gideon Fishelson (eds.), Advances in Theory and Measurement of Unemployment
(London: Macmillan).
National Economic Advisory Council (NEAC) (2010). New Economic Model for Malaysia (Kuala Lumpur:
National Printers of Malaysia Ltd.).
OECD (Organisation of Economic Cooperation and Development) (2009). International Migration Outlook
2008 (Paris: OECD).
Ottaviano, Peri and G. Peri (2006). Rethinking the effects of immigration on wages, NBER Working Paper
No.12497, National Bureau of Economic Research: Cambridge.
Piore, Michael J. (1979). Birds on Passage: Migrant labour and Industrial Societies (Cambridge: Cambridge
University Press).
Ramasamy, P. (2004). International migration and conflict: foreign labour in Malaysia, in Aris
Ananta and Evi Nurvidya Arifin (eds.), International Migration in Southeast Asia
(Singapore: Institute of Southeast Asian Studies).
Ratha, Dulip and William Shaw (2007). South-South migration and remittances, World Bank Working Paper
No.102, Washington DC: World Bank.
Solimano, Andrea (2010). International Migration in the Age of Crisis and Globalization (Cambridge:
Cambridge University Press).
Zimmermann, Klaus F., Holger Bonin, Rene Fahr and Holger Hinte (2007). Immigration Policy and Labour
Market (Berlin: Springer).
22
Table 1: Malaysia: Distribution of Foreign Workers by Key Sectors (in %)
Sector 1985 1990 2000 2005 2008
Agriculture1 50.1 37.7 24.8 26.0 25.0
Manufacturing 6.9 8.8 38.1 32.1 36.0
Construction 15.0 34.4 8.5 15.5 14.0
Non-Domestic Services 20.32 19.1 6.7 8.8 9.0
Domestic Services --- --- 22.0 17.6 16.0
TOTAL % 95.3 99.5 100.0 100.0 100.0
Number ‘000 212 440 807 1815 2020
Notes: 1 Includes forestry, fishing and mining 2 Includes domestic services --- Not available
Source: Athukorala and Manning (1999), Athukorala (2006) and Jones (2011) (based on unpublished official sources)
23
Table 2: Malaysian Manufacturing: Key Indicators of the Structure and Foreign-Worker Dependence (2000-05)1, (in %)
Structure Foreign workers
MSIC Code
Industry
Output
composition
Export
composition
Export
orientation2
Composition of MNE output3
MNE share in
output2
Distribution by industry
Share in total employment
Unskilled
share
151-4 Food 7.6 5.8 22.0 4.2 17.8 6.2 13.0 65.6 155 Beverages 1.4 0.1 4.2 0.6 55.5 0.1 4.0 64.9 160 Tobacco 0.6 0.2 24.4 0.2 27.7 0.1 2.3 77.2
171-3 Textiles 1.8 1.7 55.4 1.7 60.6 4.4 26.4 66.6 181-2 Garments 1.6 1.3 54.2 0.8 37.6 8.6 29.6 79.9 191 Leather 0.1 0.1 54.3 0 54.5 0.2 18.0 80.5 192 Footwear 0.1 0 16.1 0 29.5 0.3 16.8 79.1
201-2 Wood & Wood Products 3.5 3.1 52.5 0.9 16.1 19.0 41.0 82.4 361 Furniture & Fixtures 2.0 1.5 44.8 0.6 19.5 10.2 36.5 81.3
210, 221-3 Paper & Publishing 3.9 0.7 12.9 0.7 14.9 2.6 9.5 59.5 241-3 Chemicals 10.1 5.3 32.2 8.3 56.0 1.1 5.5 49.7 232 Petroleum 9.2 8.4 39.8 5.6 29.7 0.1 3.2 37.3 251 Rubber 3.0 2.9 50.4 1.8 35.8 5.6 19.9 77.8 252 Plastic 4.6 2.3 34.1 2.2 37.0 7.2 18.8 71.1 261 Glass 1.4 0.6 41.5 0.9 65.7 0.5 11.7 70.5 269 Non-Metallic Mineral 3.3 0.5 11.2 0.6 16.0 2.7 14.3 65.6
271-3 Basic Metal 3.5 1.6 18.1 1.8 22.7 2.1 12.7 63.9 281, 289 Fabricated Metal 3.4 1.5 25.1 1.7 32.3 3.9 14.8 69.2
291-3 Machinery 3.2 2.1 36.4 2.9 56.4 2.0 9.9 67.1 300, 311-5, 319,
321-3 Electronics & Electrical 30.9 57.7 68.8 60.8 80.7 19.3 11.5 70.7

24
Table 2 contd.
Structure Foreign workers
MSIC Code Industry Output composition
Export composition
Export orientation2
Composition of MNE output3
MNE share in output2
Distribution by industry
Share in total employment
Unskilled share
341-3, 351, 353, 359 Transport Equipment 3.0 1.0 8.1 1.2 11.8 2.1 10.5 69.8 331-2 Scientific/Measuring
Equipment 1.0 1.0 52.9 1.6 89.9
0.8 9.9 70.8 369 Miscellaneous Manufacturing 0.8 0.5 38.7 0.5 39.1 1.2 13.2 74.9
Total Manufacturing 100 100 44.5 100 49.5 100 17.2 70.6 Notes: (1) Annual average (2) Exports as a percentage of gross output (3) Covers firms with a foreign (MNE) equity ownership share of 50% or more (these firms provides an almost
full coverage of MNE presence in Malaysian manufacturing because foreign equity restriction apply only to a few domestic-market oriented industries. (4) MSIC refers to the Category D (manufacturing) of the Malaysia Standard Industrial Classification (2000).
Source: Compiled from unpublished returns to the Annual Survey of Manufacturing Industries conducted by the Department of Statistics, Malaysia.

25
Table 3: Occupational Composition of Foreign Workers in Malaysian Manufacturing (in %)
Occupational Category1 1985 1990 1995 2000 2005
Professional & Managerial 18.2 15.7 3.4 2.3 1.5
Technical & Supervisory 3.6 3.0 1.2 1.3 1.2
Clerical & Related Occupations 1.5 0.8 0.2 0.2 0.5
General Workers 3.7 2.8 0.9 1.5 2.3
Unskilled (Production) Workers 73.1 77.8 94.4 94.8 94.8
Total % 100 100 100 100 100
Number 7517 16377 141930 217262 363029
Note: Based on the International Labour Organisation (ILO) occupational classification. Source: Compiled from unpublished returns to the Annual Survey of Manufacturing Industries conducted by the
Department of Statistics, Malaysia.
Table 4: Definition and Measurement of Variables
Variable Measurement RWG Real wage
Average annual earnings per full-time worker (wage/salary plus other payments in cash excluding employer’s contribution to provident funds) deflated by the consumer price index.
FWD Foreign worker dependency Share of foreign workers in total full-time employment
RQ Real output (value added) Nominal value-added (gross output at ex-factory price – cost of intermediate inputs) deflated by producer price index (available only at the two-digit level). The same two-digit price index is used for the five-digit industries falling under that category.
KL Capital intensity Real fixed assets (nominal fixed assets deflated by the implicit deflator for gross fixed capital formation) divided by full-time employees.
SKL Skill intensity Share of professional and managerial workers in total full-time employment
SIZE Average firm size Number of employees per firm FOW Foreign ownership The share of foreign firms (affiliates of MNEs)
defined as firms with 50 per cent or more foreign equity ownership to total gross output
EO Export orientation The share of exports in gross output. CNC Industry concentration
The share of the four largest plants in total gross output in a given industry
DTUN Trade union dummy 1 for industries in which national trade union membership is prohibited (electronics products and components) and zero for other industries
DCD Dot.com dummy
1 for the years 2000, 2001 and 2002 and 0 for other years.

26
Table 5: Determinates of Inter-Industry Wage Differences: FE-IV and RE-IV Estimates, 2000-2005
(Dependent variable: log of real annual average wage, RWG)
Regressors
All Workers Unskilled Workers
FE RE FE RE
(1) (2) (3) (4)
Constant term 6.647*** 6.786*** 6.167*** 6.727***
(0.234) (0.164) (0.327) (0.202)
Foreign worker dependence (FWD) -0.004 -0.007*** -0.010*** -0.008***
(0.003) (0.002) (0.004) (0.002)
Real output (RQ) 0.041*** 0.032*** 0.057*** 0.038***
(0.010) (0.008) (0.015) (0.010)
Capital intensity (KL) 0.146*** 0.147*** 0.131*** 0.114***
(0.016) (0.014) (0.023) (0.017)
Skill intensity (SKL) 0.005** 0.011*** -0.006** 0.002
(0.002) (0.002) (0.003) (0.003)
Average firm size (SIZE) 0.039** 0.045*** 0.094*** 0.064***
(0.016) (0.012) (0.024) (0.015)
Foreign ownership (FOW) 0.001* 0.001* 0.001 0.0005
(0.001) (0.001) (0.001) (0.001)
Export orientation (EO) 0.000 -0.0004 -0.0002 -0.001
(0.0004) (0.0004) (0.001) (0.0007)
Industry concentration (CNC) 0.001 0.001** -0.000 0.001
(0.001) (0.001) (0.001) (0.001)
Trade union dummy (DTUN) -0.120** -0.244***
(0.053) (0.064)
Time dummies Yes Yes Yes Yes
Wald χ2
1.28e+07
561.15
5.84+06
249.64
R2 0.553 0.639 0.295 0.410
No. of observations 850 850 850 850
No. of groups 170 170 170 170
Wu-Hausman test 2 χ2 (12) = 766.91 χ
2 (12) = 52.13
Note: 1. Standard errors adjusted for arbitrary heteroskedasticity and intra-group correlation are given in brackets,
with statistical significance denoted as *** 1%, ** 5% and * 10%. 2. Null hypothesis is rejected at the one percent level
27
Table 6: Panel Unit Root Tests (in levels)
Variables LLC IPS
RWG:TEMP -140.28*** -12.08***
RWG:TUKW -92.59*** -5.54***
FWD: TEMP -25.40*** -3.03***
FWD: TUKW -25.11*** -3.07***
RQ -45.24*** -3.01***
KL -48.78*** -9.63***
SKL -27.48*** -2.94***
SIZE -30.52*** -3.50***
CNC -199.31*** -21.73***
FOW -94.84*** -14.49***
EO -133.34*** -10.62***
Notes: (1) LLC : Test developed by Levin, Lin and Chu (2002); IPS: Test developed by Im, Pesaran and Shin (2003).
(2) One lag is used in all cases. (3) TEMP: total employment; TUKW: total unskilled workers; other notations as defined in Table 4.
*** signify that the variables are stationary in levels.

28
Table 7: Descriptive Statistics
Variable Mean Std. Dev. Min Max
RWG: TEMP 9.1 0.3 8.1 10.2
RWG: TUKW 8.7 0.3 7.7 9.8
FWD: TEMP 14.0 10.1 0.0 76.2
FWD: TUKW 18.9 13.0 0.0 82.2
RQ 18.5 1.6 13.5 22.9
KL 10.6 0.9 8.5 14.7
SKL 7.4 3.8 0.5 31.3
SIZE 4.2 1.0 0.6 7.2
CNC 31.1 20.5 6.6 97.6
FOW 35.5 22.6 0.0 99.2
EO 29.6 19.0 0.0 92.9
Notes: (1) TEMP: total employment; TUKW: total unskilled workers (2) Other notations as defined in Table 4.
Table 8: Correlation Matrix RWG:
TEMP RWG: TUKW
FWD: TEMP
FWD: TUKW
RQ KL SKL SIZE CNC FOW
RWG: TUKW
0.91
FWD: TEMP
-0.41 -0.33
FWD: TUKW
-0.34 -0.30 0.97
RQ 0.37 0.33 0.04 0.05
KL 0.68 0.55 -0.28 -0.22 0.40
SKL 0.71 0.55 -0.42 -0.35 0.13 0.59
SIZE 0.26 0.22 0.11 0.10 0.54 0.23 -0.03
CNC 0.23 0.23 -0.14 -0.15 0.11 0.06 0.08 0.31
FOW 0.14 0.08 -0.04 -0.05 0.20 -0.03 0.10 0.36 0.48
EO -0.19 -0.17 0.22 0.17 0.19 -0.19 -0.17 0.31 0.10 0.57
Notes: (1) TEMP: total employment; TUKW: total unskilled workers (2) Other notations as defined in Table 4.
29
Table 9: Determinates of Inter-Industry Wage Differences: FE-IV and RE-IV Estimates, 1992-20051 (Dependent variable: annual average log of real average annual wage, RWG)
(a) 1992-2005
Regressors
All Workers Unskilled Workers
FE RE FE RE
(1) (2) (3) (4)
Constant term 7.995*** 7.531*** 7.685*** 7.561***
(0.421) (0.278) (0.525) (0.394)
Migrant worker dependence (FWD) 0.003** 0.001 0.000 -0.0003
(0.002) (0.001) (0.002) (0.002)
Real output (RQ) 0.003 -0.003 0.0002 -0.003
(0.019) (0.013) (0.024) (0.019)
Capital intensity (KL) 0.060** 0.109*** 0.048 0.063**
(0.028) (0.021) (0.034) (0.028)
Skill intensity (SKL) 0.040*** 0.043*** 0.033*** 0.034***
(0.006) (0.005) (0.007) (0.006)
Average firm size (SIZE) -0.013 0.001 0.026 0.030
(0.020) (0.018) (0.025) (0.023)
Trade union dummy (DTUN) 0.089 -0.051
(0.107) (0.177)
Time dummies Yes Yes Yes Yes
F-statistics 32.49 18.48
Wald χ2 3.76e+06 768.01 2.26e+06 377.26
R2 0.793 0.850 0.661 0.668
No. of observations 322 322 322 322
No. of groups 23 23 23 23
Wu-Hausman test2 χ2 (18) = 24.68 χ
2 (18) = 0.86
(b) 1992 – 1999
Regressors
All Workers Unskilled Workers
FE RE FE RE
(1) (2) (3) (4)
Constant term 6.405*** 6.144*** 6.079*** 5.881***
(0.233) (0.162) (0.299) (0.193)
Migrant worker dependence (FWD) 0.003* -0.0004 -0.001 -0.003**
(0.002) (0.001) (0.002) (0.001)
Real output (RQ) 0.057*** 0.056*** 0.068*** 0.063***
(0.012) (0.009) (0.016) (0.011)
Capital intensity (KL) 0.124*** 0.138*** 0.100*** 0.117***
(0.013) (0.012) (0.017) (0.014)
Skill intensity (SKL) 0.018*** 0.029*** 0.013*** 0.023***

30
(0.003) (0.003) (0.014) (0.003)
Average firm size (SIZE) -0.010 0.008 0.002 0.016
(0.012) (0.011) (0.016) (0.013)
Trade union dummy (DTUN) -0.014 -0.082
(0.060) (0.068)
Time dummies Yes Yes Yes Yes
F-statistics 119.81 84.61
Wald χ2 7.10e+06 1231.37 5.29e+06 1231.80
R2 0. 649 0.723 0.603 0.651
No. of observations 960 960 960 960
No. of groups 120 120 120 120
Wu-Hausman test2 χ2 (12) = 64.00 χ
2 (12) = 21.98
(c ) 2000 - 2005
Regressors
All Workers Unskilled Workers
FE RE FE RE
(1) (2) (3) (4)
Constant term 6.717*** 6.842*** 6.200*** 6.757***
(0.232) (0.165) (0.323) (0.202)
Migrant worker dependence (FWD) -0.004 -0.007*** -0.010*** -0.008***
(0.003) (0.002) (0.004) (0.002)
Real output (RQ) 0.041*** 0.032*** 0.057*** 0.037***
(0.010) (0.008) (0.015) (0.010)
Capital intensity (KL) 0.145*** 0.146*** 0.131*** 0.114***
(0.016) (0.014) (0.023) (0.017)
Skill intensity (SKL) 0.005** 0.011*** -0.007** 0.001
(0.002) (0.002) (0.003) (0.003)
Average firm size (SIZE) 0.039** 0.051*** 0.094*** 0.070***
(0.016) (0.012) (0.024) (0.015)
Trade union dummy (DTUN) -0.087* -0.234***
(0.052) (0.062)
Time dummies Yes Yes Yes Yes
F-statistics 24.34 11.32
Wald χ2 1.28+07 515.79 5.87e+06 230.86
R2 0.555 0.625 0.300 0.394
No. of observations 850 850 850 850
No. of groups 170 170 170 170
Wu- Hausman test2 χ2 (9) = 785.12 χ
2 (9) = 45.41
Note: 1. Standard errors adjusted for arbitrary heteroskedasticity and intra-group correlation are given in brackets,
with statistical significance denoted as *** 1%, ** 5% and * 10%. 2. Null hypothesis is rejected at the one percent level

31
Figure 1: Foreign Workers in Malaysian Manufacturing, 1985-2005
Legend: FW: Total number of foreign workers (left scale) FWD: TEMP: Share of foreign workers in total employment, % (right scale) Source: Compiled from unpublished returns to the Annual Survey of Manufacturing Industries conducted by the Department of Statistics, Malaysia.
0
50000
100000
150000
200000
250000
300000
350000
400000
1985 1987 1989 1991 1993 1995 1997 1999 2001 2003 2005
0
5
10
15
20
25
FW FWD: TEMP
32
Figure 2: Share of Foreign Workers (%) and Real Annual Average Wages (in log) in Malaysian Manufacturing, 1985-2005
(a) All Workers
(b) Unskilled Workers
Legend: FWD: TEMP: Share of foreign workers in total employment, % (left scale) FWD: TUKW: Share of unskilled foreign workers in total unskilled production workers, % (left scale) RWG: TEMP: Logarithmic of Real annual average wages of total employees (right scale) RWG: TUKW: Logarithmic of Real annual average wages of unskilled production workers (right scale) Source: Compiled from unpublished returns to the Annual Survey of Manufacturing Industries conducted by the Department of Statistics, Malaysia.
0
5
10
15
20
25
1985 1987 1989 1991 1993 1995 1997 1999 2001 2003 2005
8.4
8.5
8.6
8.7
8.8
8.9
9.0
9.1
9.2
9.3
FWD: TEMP RWG: TEMP
0
5
10
15
20
25
30
35
1985 1987 1989 1991 1993 1995 1997 1999 2001 2003 2005
7.9
8.0
8.1
8.2
8.3
8.4
8.5
8.6
8.7
8.8
8.9
FWD: TUKW RWG: TUKW

33
Figure 3: Share of Foreign Workers in Total Employment (%) and Real Annual Average Wages (in log) in MSIC 5-digit Industries, 2000-2005 (a) All W orkers
(b) (b) Unskilled Workers
Legend: FWD: TEMP: Share of foreign workers in total employment, % (left scale) FWD: TUKW Share of unskilled foreign workers in total unskilled production workers, % (left scale) RWG: TEMP: Logarithmic of Real annual average wages of total employees (right scale) RWG: TUKW: Logarithmic of Real annual average wages of unskilled production workers (right scale) Source: Compiled from unpublished returns to the Annual Survey of Manufacturing Industries conducted by the Department of Statistics, Malaysia.
88.
59
9.5
1010
.5
RW
G: T
EM
P
0 20 40 60 80FWD: TEMP
7.5
88.
59
9.5
10
RW
G: T
UKW
0 20 40 60 80FWD: TUKW