
The impact of crime and violence on economic sector diversity · 2014), rm-level (Amodio and Di...
27
The impact of crime and violence on economic sector diversity Viridiana R´ ıos * [email protected] Research Fellow, The Wilson Center June 27, 2016 Abstract Literature has focused attention on identifying whether crime and violence im- pact growth via changes in economic factor accumulation, i.e. reducing labor supply or increasing capital costs. Yet, much little is known as to how crime and violence may affect how economic factors are allocated. Using a unique dataset created with a text-analysis algorithm of web content, this paper traces a decade of economic ac- tivity at the subnational level to show that increases in criminal presence and violent crime reduce economic diversification, increase sector concentration, and diminish economic complexity. An increase of 9.8% in the number of criminal organizations is enough to eliminate one economic sector. Similar effects can be felt if homicides rates increase by more than 22.5%, or if gang-related violence increases by 5.4%. By addressing the impact that crime has on the diversification of production fac- tors, this paper takes current literature one step forward: It goes from exploring the effects of crime in the demand/supply of production factors, to analyzing its effects on economic composition. * Author thanks Mariana Galindo, Mylene Cano, and Victor Cruz for research assistance, and is grateful with The Wilson Center for International Scholars for generous research funding. This paper was made better by the thoughtful comments of Duncan Wood, Diana Negroponte and Christopher Wilson, but was made possible by the encouragement and the friendship of Aleister Monfort and Sofia Viguri. Special thanks to Cesar Martinelli for that morning at Dolcezza inGeorgwtown. 1
Transcript of The impact of crime and violence on economic sector diversity · 2014), rm-level (Amodio and Di...

The impact of crime and violence on economic sectordiversity
Viridiana Rıos∗
[email protected] Fellow, The Wilson Center
June 27, 2016
Abstract
Literature has focused attention on identifying whether crime and violence im-pact growth via changes in economic factor accumulation, i.e. reducing labor supplyor increasing capital costs. Yet, much little is known as to how crime and violencemay affect how economic factors are allocated. Using a unique dataset created witha text-analysis algorithm of web content, this paper traces a decade of economic ac-tivity at the subnational level to show that increases in criminal presence and violentcrime reduce economic diversification, increase sector concentration, and diminisheconomic complexity. An increase of 9.8% in the number of criminal organizationsis enough to eliminate one economic sector. Similar effects can be felt if homicidesrates increase by more than 22.5%, or if gang-related violence increases by 5.4%.By addressing the impact that crime has on the diversification of production fac-tors, this paper takes current literature one step forward: It goes from exploring theeffects of crime in the demand/supply of production factors, to analyzing its effectson economic composition.
∗Author thanks Mariana Galindo, Mylene Cano, and Victor Cruz for research assistance, and isgrateful with The Wilson Center for International Scholars for generous research funding. This paperwas made better by the thoughtful comments of Duncan Wood, Diana Negroponte and ChristopherWilson, but was made possible by the encouragement and the friendship of Aleister Monfort and SofiaViguri. Special thanks to Cesar Martinelli for that morning at Dolcezza inGeorgwtown.
1

Violence increasingly mutates and spreads. France has become pray of its most cruelterrorist attack since WWII: over 130 casualties. Honduras has seen homicides increaseto rates similar to war areas: 90 per a hundred thousand inhabitants. Philippines hasturned into the non-war country with the largest number of journalists assassinated: amurder every 45 days(CPJ, 2015). Spain has become a regular target of political violence:extremists groups have attacked the country 14 times since 2001 (The-Economist, 2015).Mexico has seen the emergence of violent battles for turf between drug cartels: the tollhas been 51 thousand casualties from 2007 to 2010 (Rıos, 2012; Rios, 2015).
Yet, as urgent as properly understanding the impact of crime and violence in the economyhas recently become, much empirical evidence is still needed to properly identify concretemechanisms under which conflict and violent crime may negatively affect economic per-formance (Mihalache-O’Keef and Vashchilko, 2010; Blattman and Miguel, 2010; Driffieldet al., 2013; Enamorado et al., 2014; Amodio and Di Maio, 2014; Cook, 2014; Maher,2015a,b).
We contribute to economic literature by presenting a subnational study that providesevidence of a previously unexplored mechanism under which crime and violence affect theeconomy: by reducing economic diversification. Rather than concentrating on how crimechanges factor accumulation, we explore how it affects factor allocation. In other words,we present evidence of changes in economic composition rather than on economic activity.
This paper shows that increases in violent crime reduce the number of sectors that op-erate in an area, limiting economic diversification, increasing market concentration, anddiminishing economic complexity. Our more conservative specification, which instrumentshomicide rates with its lag, shows that increases of 22.5% in the rate of homicides reducesby one the number of different sectors that produce in an area. Our more innovativespecification, which relies on a big data exercise of text analysis to identify where crimi-nal organizations operate, shows that increases of 9.8% in criminal presence is enough toeliminate one economic sector.
The following discussion is divided in four sections. First, we discuss what we knowabout the impact of violence in economic performance, and how this paper fits into suchliterature. Then, we explain the main argument behind this paper and the unique datathat we used to test it, including the unusual challenges involved in gathering it. A thirdsection lays out the strategy for analysis, reports results and conducts several robustnesstests to debunk alternative hypothesis. Finally, we conclude by discussing the relevanceof the results, and exploring next avenues of research.
2

The impact of crime and violence in the economy
Our understanding of the effects of violence on the economy has been greatly sharpenedover the last decade. Studies showing a negative relationship between violent crime and ag-gregate economic activity (Bannon and Collier, 2003; Gaibulloev and Sandler, 2008), havegiven way to more nuanced analysis showing how the effects of crime are heterogeneousacross industries, sectors and even gender. Recent evidence shows, for example, that vio-lence seems to affect the most the informal sector (Bozzoli et al., 2012), women (BenYishayand Pearlman, 2013; Dell, 2015; Velasquez, 2014), younger and smaller firms (Camachoand Rodriguez, 2013), smaller urban areas (Enamorado et al., 2014), firms whose inputsare predominantly imported (Amodio and Di Maio, 2014) and non-extractive industries(Mihalache-O’Keef and Vashchilko, 2010; Ashby and Ramos, 2013; Driffield et al., 2013;Maher, 2015a,b) . Yet, even if the literature has been able to accumulate growing evi-dence of the heterogeneous effects of violent crime on the economy, much little is knownwith respect to the channels through which these effects take place, and to understandwithin-country variation (Mihalache-O’Keef and Vashchilko, 2010; Blattman and Miguel,2010; Driffield et al., 2013; Enamorado et al., 2014; Amodio and Di Maio, 2014; Maher,2015a,b).
First, within country variation and micro studies are rare. Due to the difficulties ofdata collection, studies rely mostly on cross-country evidence to illuminate any discussionabout conflict, crime and its impact on economic variables (Organski and Kugler, 1977;Alesina and Perotti, 1996; Alesina et al., 1996; Collier, 1999; Imai et al., 2000; Hoefflerand Reynal-Querol, 2003; Murdoch and Sandler, 2004; Blomberg and Mody, 2005; Busseand Hefeker, 2007; Abadie and Gardeazabal, 2008; Cerra and Saxena, 2007). It is notuntil recent that we have started to see the emergence of subnational (Enamorado et al.,2014), firm-level (Amodio and Di Maio, 2014) and other micro-oriented studies (Maher,2015a,b).
Second, the channels that have been explored mostly concentrate on understanding howcrime and violence affect factor accumulation or productivity, leaving other prominent ar-eas of economic analysis, such as factor allocation, mostly unexplored. We have evidenceof impacts on human capital flows (Rıos, 2014; Maher, 2015a,b), human capital accu-mulation (Barrera and Ibanez, 2004; Rodriguez and Sanchez, 2012; Shemyakina, 2011;Leon, 2012; Marquez-Padilla et al., 2015; Orraca Romano, 2015), labor (BenYishay andPearlman, 2013; Dell, 2015), rates of self-employment (Bozzoli et al., 2013), unemploy-ment (Arias and Esquivel (2012) cited by Enamorado et al. (2014)), per capita income(Enamorado et al., 2014), firm investment ((Fajnzylber et al., 1998, 2002; Londono et al.,2000; Powell et al., 2010; Pshisva and Suarez, 2010), FDI (Ashby and Ramos, 2013;Driffield et al., 2013), firm-exit (Camacho and Rodriguez, 2013), productivity (Amodioand Di Maio, 2014) and changes in prices and household expenditure (Velasquez, 2014).
3

Yet, besides (Amodio and Di Maio, 2014) neither of these studies address factor alloca-tion and economic diversification, two concepts that have become fundamental for currentanalysis of economic growth.
This paper presents the first subnational study to explore a new channel through whichviolent crime may affect the economy: factor allocation. We depart from studying factoraccumulation and, instead, incursion on studying how crime affects the composition ofthe economy, particularly its number of sectors, diversity and complexity. Our focus isunique in talking to economic research that tries to understand economic development,not only as a function of factor accumulation and productivity, but as a function ofeconomic composition, allocation and capital distortions. It connects with the literaturethat analyzes misallocation of resources (Wasmer and Weil, 2000; Guner et al., 2008;Restuccia and Rogerson, 2008; Hsieh and Klenow, 2010; Bartelsman et al., 2013; Davidet al., 2014; Hausmann et al., 2014; Hopenhayn, 2014) and tries to understand crime asa form of market distortion that induces such misallocation.
Research question and data collection
Our testable hypothesis is that violent crime and criminal presence reduces economicdiversification, limiting the number of sectors that operate in a territory, favoring concen-tration, and inhibiting the development of complex industries.
We expect this result due to different levels of sensitivity that different industries havetowards violence. Literature has been able to identify that some sectors are more affectedby violence than others. Typically, sectors that are resource-bounded tend to be particu-larly resilient to crime and violence because the high profits that such sectors obtain helpthem internalize violence as a cost in their production function (Mihalache-O’Keef andVashchilko, 2010). Contrary, industries that have lower obstacles to relocate to other ar-eas, due to lacking geographic-specific inputs, are less resilient to violence, having a higherprobability to leave a conflict area (Mihalache-O’Keef and Vashchilko, 2010; Ashby andRamos, 2013; Driffield et al., 2013). The retail sector and tourism, for example, aremore likely to be targets of criminal organizations, and are highly movable, which makesthem not resilient to violence (Daniele and Marani, 2011). The size may also matters.Multinational companies are more resilient to violence because these companies typicallyhave large high sunk costs, long investment horizons, and have developed an expertise tocope with difficult regions but sectors where firms are smaller tend to be less resilient toviolence (Bennett, 2002; Oetzel et al., 2007; Ashby and Ramos, 2013).
To test our hypothesis, we selected Mexico as our study case. Mexico is a suitable caseto conduct our subnational study because it has both, one of the most detailed economic
4

censuses available in the developing world, and broad presence of criminal organizations.The Mexican economic census has more than 15 years of panel data for 4,231 thousandeconomic units along all its territory (INEGI, 2014). Each economic unit has informationabout yearly production, and is classified by economic sector according to the NorthAmerican Industry Classification System (NAICS). The last iteration of the census wasjust released during the fall of 2015 making it highly updated and mostly unexplored.Furthermore, Mexico is well known for the existence of several criminal organizationsthat operate in its territory (Guerrero-Gutierrez, 2011; Rıos, 2012; Castillo et al., 2013;Rios, 2015; Escalante, 2011; O’Neil, 2009; Osorio, 2012; Snyder and Duran-Martinez, 2009;Astorga, 2005; Chabat, 2006; Felbab-Brown, 2009). Actually, private intelligence serviceshave collected detailed information about the areas of operation of different drug cartels(Stratfor, 2013).
Given how suitable Mexico is for this type of studies, it is not a surprise that academiahas already started to use it to study the impact that crime and violence have in theeconomy. Yet, all studies have concentrated on understanding the cost of violence ineconomic factors like employment and capital investments 1 , not on factor allocation andeconomic diversity like this paper proposes.
An important innovation of this paper, beyond the study of economic diversity, is theunique dataset we use to test our hypothesis. We do not only rely on homicide rates asour main independent variable, as most literature does (Fajnzylber et al., 2002; Detottoand Otranto, 2010; Forni and Paba, 2001; Cardenas, 2007). Instead, we developed a big-data framework that uses text analysis to obtain quantitative information about wherecriminal groups operate by reading digitalized news content, blogs and Google-News in-dexed content. Our framework allows us to obtain information of a phenomenon thatwould otherwise require large scale, expensive intelligence exercises. This approach isunique, not only because of the procedure used to obtain it but because it allow us toidentify, not only where violent crime happens, but where crime inhabits.
1Villoro and Teruel (2004), for example, estimate losses of up to 0.6% of GDP due to violence, andRıos (2008) argues that drug trafficking causes economic losses of 4.3 million dollars per year. Others like,Dell (2015) find that female labor participation falls in municipalities where drug violence erupts aftercrackdowns, or that for every 10 drug-related homicides per a 100 thousand unemployment increasesby 0.5% (Arias and Esquivel, 2012). Ashby and Ramos (2013) identify that violence deters FDI infinancial services, commerce and agriculture, and BenYishay and Pearlman (2013) show an increase in10 in homicide rates (per 100 thousand) declines 0.3 weekly hours worked. Enamorado et al. (2014) alsocontributes by finding that a one standard deviation increase in the number of drug-related homicidesdecreases income growth by 0.2 percentage points. Robles et al. (2013) finds a negative effect of violenceon labor participation. Most recently, Rozo (2014) estimates consumption among white and blue-collardworkers is reduced by 2.8% and 6.3% when homicide rates increase 10%, Velasquez (2014) finds thatelevated violence leads self-employed women to leave the labor market, and Yepes et al. (2015) finds thatcrime shocks are responsible for 0.25% reductions in GDP per capita.
5

Data on the areas of operation of drug cartels was obtained by crawling online newspa-pers and blogs. We used unambiguous query terms to perform text analysis on contentextracted from Googles servers. The crawler was created entirely in Python to extractJSON objects, and the data was cleaned using an hyper-geometric cumulative distributionfunction. The final list of queries includes 2,449 locations, and 178 actor terms associatedwith traffickers and drug trafficking organizations. Each actor was classified according aspart of 13 criminal organizations and a residual category. A more detailed description ofthe methodology can be found at (Coscia and Rios, 2012).
(Figure 1 about here)
Our dataset of criminal operations gives information of 13 trafficking organizations inMexico for 19 years (1991 - 2010). As figure 1 shows, the disaggregation up to the munic-ipal level allows us to challenge the widespread assumption that drug traffickers controlvast regions of Mexicos territory, and that criminal organizations operate in oligopolisticmarkets. Actually, drug trafficking organizations only operate in 713 of 2,441 munici-palities in Mexico. Large areas the country completely lack of the presence of a drugtrafficking organizations. Furthermore, as of 2010, 444 (62 %) of all municipalities withtrafficking operations had more than one criminal organization operating simultaneously.
In the following section, we describe the empirical specification used to test our hypothesisusing as main independent variables traditional statistics of violent crime and the resultsof our big data exercise, as out dependent variable the information of Mexican longitudinaleconomic census.
Empirical specification, results and robustness checks
Testing is conducted using first a simple OLS, and then an instrumental variables (IV)specification. We use IV because reverse causality is a matter of concern. Economicdiversification may affect crime and violence by, for example, creating conditions for theexistence of more violent-prone locations.
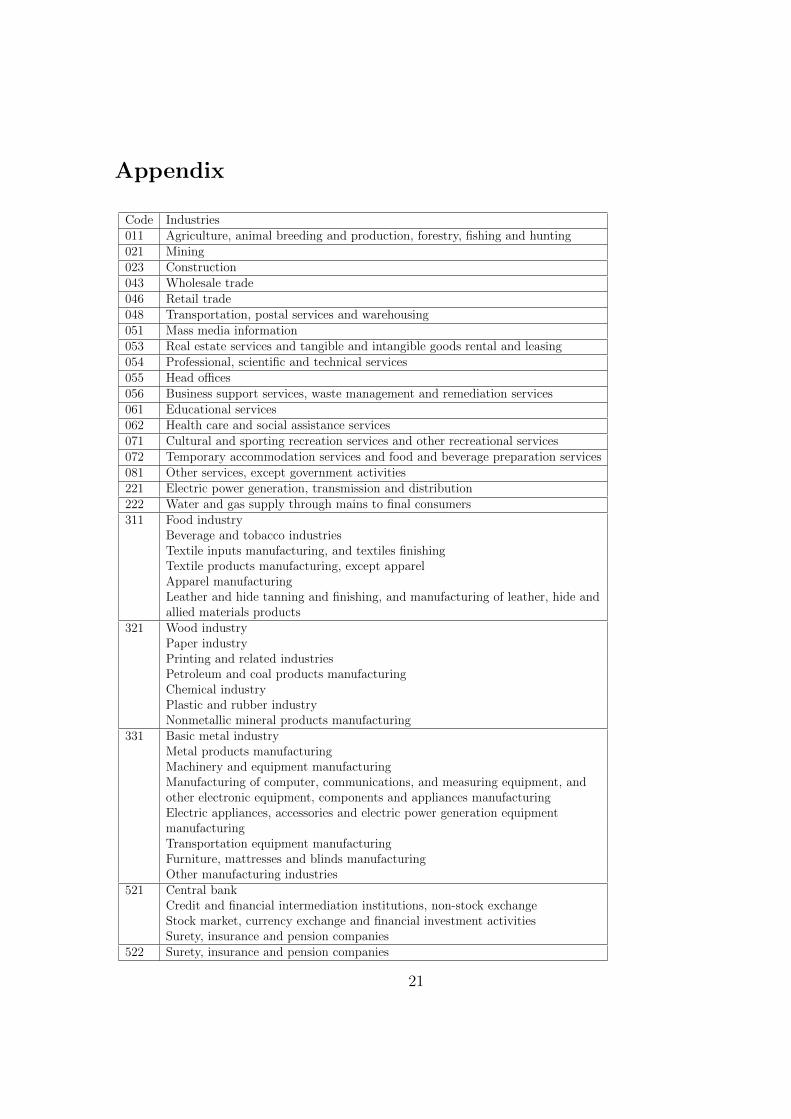
Data is disaggregated by year, municipality and economic sector. There are 2,456 munic-ipalities i; three years j, where j=[2004, 2009, 2014]; and 23 industries (see appendix fora list of each of them).
The main independent variable, V, is crime and violence. This is operationalized by either(a) average homicide rate (homicides per a 100,000 inhabitants) in i during the five yearspreceding j (INEGI, 2012), or (b) the number of criminal organizations that operate in
6

i during j (Coscia and Rios, 2012). Homicide rates were used to proxy crime followingcriminology literature best practices (Fajnzylber et al., 2002), and were logarithmicallytransformed according to equation (1). This transformation was made because ceros areconsidered valuable information about criminal violence.
ln(νij) =
{ln(νij + 1) if νij ≥ 0
− ln | νij | if νij < 0(1)
The main dependent variable, D, refers to the number of different economic sectors thatexist in municipality i during year j (INEGI, 2014). We consider an economic sector existsin i if its local value added was reported be positive during j. D was always transformedfollowing a similar procedure than equation (1).
All models include controls C, that are (a) the natural log of added value (pesos, trans-formed according to equation (1)) (INEGI, 2014), (b) the number of hours worked (IN-EGI, 2014), (c) rates of employment (INEGI, 2014), and (d) road-distance to the border(calculated in kilometers) (Rıos, 2014). Table 1 descriptive statistics for all variables.
(Table 1 about here)
The simplest OLS model is specified in equation (2).
Dij = β0 + β1 ln(νij) +l∑
k=1
βlCij l + · · ·+ eij (2)
Results are presented in Table 2. Column (1) shows the simplest specification. To controlfor unobserved time invariant state and year effects column (2) adds fixed effects by state,and (3) fixed effects by state and year. Results are solid in showing a strong and negativecorrelation between increases in homicide rates and changes in the number of industriesthat exist in a municipality. A 10% in homicide rates is correlated with reductions of (1)0.32, (2) 0.34, (3) 0.34, in the number of industries.
(Table 2 about here)
The IV model is specified in equations (3) and (4). Equation (4) is the first stage of a2SLS model containing an instrument I.
7

Dij = β0 + β1ln(νij) +l∑
k=1
βlCij l + · · ·+ eij (3)
ln(νij) = α0 + α1Iij +l∑
k=1
αlKij l + · · ·+ uij (4)
All models were instrumented with two different instruments. First, homicide rates duringthe nineties (INEGI, 2012), a variable that is correlated with current crime and violence,but not associated with current number of economic sectors. In addition, as robustnesscheck, we used as alternative instrument the extension of hectares of marihuana eradicatedfrom 1998 to 2010 in municipality j (Dube et al., 2014). There is a strong correlationbetween criminal violence and drug-trafficking operations (Dell, 2015; Rıos, 2012, 2013;Robles et al., 2013; Rios, 2015) but not between drug trafficking operations and thenumber of different economic sectors.
The preferred specification is presented in Table 3, Column (1). It uses as main indepen-dent variable logged rates of homicides, and is an IV model. Results show that to reducein one the sectors that operate in a municipality general homicide rates must increase by21%.
(Table 3 about here)
Alterative independent variables for IV models are presented in other columns of Table3. Column (2) uses the number of criminal organizations operating in a municipality, asextracted with our text-analysis algorithm. Column (3) uses as independent logged ratesof drug-related homicides, and (4) the logged rates of drug-related targeted executions2.Results show that any significant increase in the number of criminal organizations causeseconomic sectors to diminish in number, and that an increase of 5.9% in the number ofeither drug related homicides or executions is enough to eliminate one economic sector.
2Unlike any other country, during 2007-2010 Mexico divided its murder statistics in two types ofhomicides, general homicides and drug-related homicides. According to Mexican authorities, a homicideneeded to meet six criteria to be considered drug-related. These were (i) victim was killed by high-caliberfirearms,(ii) victims with signs of torture or severe lesions, (iii) victims found at the crime scene or ina vehicle, (iv) victims whose bodies were taped, wrapped or gagged, (v) if the murder happened in aprison and involved criminal organizations, and (vi) if one of several special circumstances occurred,including if the victim was abducted prior to assassination (levanton), ambushed or chased, if the victimwas an alleged member of a criminal organization, or if a narco-message was left on or near the body. Asub-classification inside drug-related homicides was created for homicides that were targeted executions,meaning the victim was an alleged member of a criminal organization (Molzahn et al., 2012).
8

To control for unobserved time invariant, state and industry effects, Table 4 replicates theresults of Table 3 with time, state and industry fixed effects. Column (1) shows year fixedeffects, (2) state and year fixed effects, and (3 to 6) state, year and industry fixed effects.In columns (1-3) independent variables are logged rates of (1 to 3) general homicides,in (4) is drug-related homicides (SNSP, 2011), in (5) is drug-related targeted executions(SNSP, 2011), and in (6) is number of criminal organizations. Results holds strongly andwith similar magnitudes. In column (3), for example, the model with the most traditionalindependent variable and the more fixed effects controls, an increase in 22.5% in homiciderates causes the extinction of an economic sector.
(Table 4 about here)
To discard alternative hypothesis and conduct robustness tests we created specificationsof Table 5, 6 and 7.
As robustness checks, Table 5 presents similar specifications than in previous tables butusing data sub-samples. All columns present 2SLS specifications with fixed effects bystate, year and sector. The dependent variable is always the number of sectors operatingin a municipality. The independent variable is always logged rates of general homicides.Column (1) presents a sub-samples for municipalities with more than 10K inhabitants,(2) for municipalities with at least one homicide during the nineties, (3) for municipalitieswhere drug is not produced (Dube et al 2013), (4) for municipalities without criminal or-ganizations (Coscia and Rios, 2012), and (5) for municipalities with monopolistic criminalorganizations (Coscia and Rios, 2012).
(Table 5 about here)
Alternative hypothesis discarded in Table 5 are, for column (1), that the process is drivenby rural areas where homicide rates are larger because population denominator is smaller;for column (2), that the process only applies to non-violent municipalities turning violent;for columns (3 to 4), that process only applies to municipalities where drug traffickersoperate, and for column (5), that process only applies to municipalities where criminalorganizations are fighting for turf.
Results hold for all models in Table 5 but the effect is diminished. In sample (1), forexample, to reduce in one the sectors that operate in a municipality, general homiciderates must increase in 34%. Overall, the models show that in rural areas, and in areasthat have become violent more recently, the economic effects of increments in crime andviolence are larger.
9

To further check for the strength of the models presented, in Table 6 and 7, we createdalternative, more complex versions of the dependent variables. The goal is to identifywhether the negative effects that crime and violence have for the number of economicsectors, can also be felt on the concentration of the economy, its diversity3 , and itscomplexity4.
Table 6 and 7 present 2SLS models with fixed effects by state, year and sector. Thedependent variable is always the rate of homicides logged for Table 6, and the number ofcriminal organizations for Table 7. All odd columns use added value as the input variableto perform calculations, and all even columns use total production. Both added value andproduction were transformed according to equation one. In both tables, the dependentvariable is, for column (1-2) Herfindahl-Hirschman Index (HH); for column (3-4) economicdiversity (Hausmann and Hidalgo, 2009), and for (5-6) economic complexity (Hausmannand Hidalgo, 2009). Results hold in all specifications. When using homicides rates (Table7), an increase of 9.3% in the rates of homicides reduces concentration (a larger andpositive HH) by 57.7, diversity by 0.87, and complexity by 0.23. When using number ofcriminal organizations, any significant increase in the number of criminal organizationscauses reductions in concentration, diversity and complexity.
(Table 6 about here)
(Table 7 about here)
Conclusion
Literature has focused attention on identifying how crime and violence impact economicfactor accumulation, not on how crime and violence affect factor allocation, particularlythe diversity and complexity economies. This is the gap in the literature this paperaddresses. Using a IV specification that allow us to address problems of reverse causality,and relying on a unique dataset created with a text-analysis algorithm of web content,this paper shows that increases in criminal presence and violent crime reduce economicdiversification, increased sector concentration, and diminished economic complexity.
The results here presented are strong, consistent, significant, and hold over a varietyof specifications and robustness tests. Overall, it can be argued that, according to the
3Diversity is calculated following Hausmann and Hidalgo (2009) as the number of economic sectors inwhich municipality i has a relative comparative advantage (RCA > 1).
4Complexity is a measure of the sophistication of the economy. It is calculated following Hausmannand Hidalgo (2009).
10

preferred specification, an increase of 9.8% in the number of criminal organizations isenough to eliminate one economic sector. Similar effects can be felt if homicides ratesincrease by more than 22.5%, or if gang-related violence increases by 5.4%.
By addressing the impact that crime has on the diversification of production factors,this paper takes current literature one step forward: It goes from exploring the effects ofcrime in the demand/supply of production factors, to analyzing its effects on economiccomposition. Furthermore, our results talk directly to scholars who have analyzed theeffects of criminal violence on growth, and provides a first building block towards betterunderstand why highly violent areas do not always exhibit diminished growth in theshort term. If, as argue, the negative effects of violence in economic growth are not onlyexplained by reductions in investments, outflows of human capital, or increased productioncosts, but by changes in the productive composition of an area, it follows that, in the shorttime, violence may not necessarily reduce economic growth, but just change the sourcesof it.
Further work will need to be developed to address whether growth may continue in theshort term even if the economy is less diverse. In other words, while violence will mostprobably reduce economic growth in the long term via diversification reductions, in theshorter term, violence may leave growth unaffected. The effects of violence in the longerterm, and its differences with short term effects is a promising agenda that would needto be explored.
Tables and Figures
11

Figure 1: Presence of Criminal Organizations
12

Table 1: Descriptive Statitsics
Statistic N Mean St. Dev. Min Max
Rate, Homicides 115,138 26.44 43.13 0.78 1,358.1Rate, Homicides 1990 148,212 7.551 22.243 1 419.2Rate, Drug Related Homicides 56,488 8.558 31.934 0 636.2Rate, Drug Related Excecutions 56,488 6.782 23.871 0 631.5Population 169,073 44,699.4 131,543.9 91.2 1,830,289Employed Population 169,464 341.8 2,746.7 0 242,934Hour Worked 169,464 821.7 6,766.8 0 659,020Margination Index 112,884 −0.001 1 −2.37 4.5Road Distance 169,395 951.2 407.7 1.37 2,308.0Production (P, billons of pesos) 169,464 0.202 3.88 0 755Added Value (AV, billions of pesos) 169,464 0.095 2.82 0 649Economic Sectors 169,464 17.725 9.430 0 42Diversity (AV) 169,464 5.648 2.697 1 23Complexity (AV) 169,464 0 1 −2.296 8.587Diversity (P) 169,464 6.008 2.722 1 23Complexity (P) 169,464 0 1 −2.266 7.996
13

Table 2: Simple OLS
Dependent variable:
Industries
(1) (2) (3)
Homicide Rate −3.337∗∗∗ −3.611∗∗∗ −3.575∗∗∗
(0.022) (0.022) (0.024)
Added Value 0.113∗∗∗ 0.105∗∗∗ 0.081∗∗∗
(0.009) (0.008) (0.008)
Worked Hours −0.498∗∗∗ −0.404∗∗∗ −0.304∗∗∗
(0.029) (0.028) (0.026)
Employment 2.234∗∗∗ 2.102∗∗∗ 1.757∗∗∗
(0.034) (0.033) (0.031)
Border Distance −0.002∗∗∗ −0.002∗∗∗ 0.001∗∗∗
(0.0001) (0.0001) (0.0002)
Constant 27.103∗∗∗ 26.676∗∗∗ 25.393∗∗∗
(0.090) (0.092) (0.259)
Observations 115,115 115,115 115,115
Note: OLS specification. Dependent variable is the number
of industries operating in a municipality. Model (1) shows
simplest specification, (2) with state fixed effects, (3) with state
and year fixed effects. An increase of 10% in homicide rates
is correlated with reductions of (1) 0.32, (2) 0.34, (3) 0.34 in
the number of industries.* p <0.1; ** p <0.05; *** p <0.01.
Standard errors in parentheses.
14

Table 3: Instrumental Variables, Several Independent Variables
Dependent variable:
Industries
(1) (2) (3) (4)
Homicide Rate −5.247∗∗∗
(0.034)
Criminal Org −896.281∗
(524.824)
Drug Homicide Rate −17.520∗∗∗
(0.529)
lDrug Targeted Homicide Rate −17.633∗∗∗
(0.516)
Added Value 0.098∗∗∗ −10.134∗ 0.598∗∗∗ 0.537∗∗∗
(0.009) (6.130) (0.058) (0.056)
Worked Hours −0.494∗∗∗ −70.800∗ −1.011∗∗∗ −0.964∗∗∗
(0.030) (41.290) (0.190) (0.184)
Employment 2.047∗∗∗ 213.327∗ 3.806∗∗∗ 3.814∗∗∗
(0.035) (123.419) (0.221) (0.215)
Border Distance −0.002∗∗∗ −0.372∗ −0.020∗∗∗ −0.016∗∗∗
(0.0001) (0.217) (0.001) (0.001)
Constant 33.341∗∗∗ 467.905∗ 47.277∗∗∗ 43.077∗∗∗
(0.124) (265.463) (1.020) (0.874)
Observations 109,641 145,820 48,990 48,990
Note: 2SLS specification. Instrument is average homicide rate during the nineties (logged). De-
pendent variable is the number of sectors operating in a municipality. Independent variables are
logged rates of (1) general homicides, (3) drug-related homicides, and (4) drug-related targetted
excecutions, and (2) number of criminal organizations. To reduce in one the sectors that operate in
a municipality (1) general homicide rates must increase by 21%, (3-4) drug related homicides and
excecutions by 5.9%. Any significant increase in the number of drug cartels leads to the elimination
of at least one sectors. * p <0.1; ** p <0.05; *** p <0.01. Standard errors in parentheses.
15

Tab
le4:
Inst
rum
enta
lV
aria
ble
s,Sev
eral
Indep
enden
tV
aria
ble
s
Dep
ende
nt
vari
able
:
Indust
ries
(1)
(2)
(3)
(4)
(5)
(6)
Hom
icid
eR
ate
−5.
275∗
∗∗−
6.45
7∗∗∗
−4.
951∗
∗∗
(0.0
33)
(0.0
44)
(0.0
39)
Cri
min
alO
rg−
73.3
55∗∗
∗
(5.0
52)
Dru
gH
omic
ide
Rat
e−
28.5
63∗∗
∗
(1.5
75)
Dru
gT
arge
ted
Hom
icid
eR
ate
−35
.142
∗∗∗
(2.2
49)
Added
Val
ue
0.08
8∗∗∗
0.06
4∗∗∗
0.10
2∗∗∗
−0.
708∗
∗∗0.
382∗
∗∗0.
378∗
∗∗
(0.0
09)
(0.0
08)
(0.0
07)
(0.0
96)
(0.0
70)
(0.0
81)
Wor
ked
Hou
rs−
0.37
5∗∗∗
−0.
270∗
∗∗1.
127∗
∗∗3.
225∗
∗∗1.
778∗
∗∗1.
981∗
∗∗
(0.0
29)
(0.0
28)
(0.0
29)
(0.3
20)
(0.2
62)
(0.3
06)
Em
plo
ym
ent
1.91
4∗∗∗
1.52
8∗∗∗
1.03
3∗∗∗
11.7
90∗∗
∗2.
639∗
∗∗2.
937∗
∗∗
(0.0
35)
(0.0
33)
(0.0
32)
(0.7
91)
(0.2
98)
(0.3
50)
Bor
der
Dis
tance
−0.
002∗
∗∗0.
002∗
∗∗0.
001∗
∗∗−
0.01
3∗∗∗
0.01
0∗∗∗
0.01
6∗∗∗
(0.0
001)
(0.0
002)
(0.0
002)
(0.0
02)
(0.0
01)
(0.0
02)
Con
stan
t31
.875
∗∗∗
31.6
73∗∗
∗29
.439
∗∗∗
18.1
63∗∗
∗38
.018
∗∗∗
34.2
83∗∗
∗
(0.1
21)
(0.3
06)
(0.2
70)
(2.7
07)
(2.4
95)
(2.8
05)
Obse
rvat
ions
109,
641
109,
641
109,
641
145,
820
48,9
9048
,990
Not
e:P
refe
red
mod
el(3
)sh
ows
that
anin
crea
sein
22.5
%in
the
rate
sof
hom
icid
ew
ill
red
uce
inon
eth
enu
mb
erof
sect
ors
.2S
LS
spec
ifica
tion
.In
stru
men
tis
aver
age
hom
icid
era
ted
uri
ng
the
nin
etie
s(l
ogged
).D
epen
den
tva
riab
leis
the
nu
mb
erof
sect
ors
oper
atin
gin
am
un
icip
alit
y.In
dep
end
ent
vari
ab
les
are
logged
rate
sof
(1-3
)gen
eral
hom
icid
es,
(4)
dru
g-r
elate
dh
om
icid
es,
(5)
dru
g-re
late
dta
rget
ted
exce
cuti
ons,
and
(6)
nu
mb
erof
crim
inal
org
an
izati
on
s.M
od
el(1
)sh
ows
year
fixed
effec
ts,
(2)
wit
hst
ate
and
year
fixed
effec
ts,
(3-6
)st
ate,
year
an
din
du
stry
fixed
effec
ts.
*p<
0.1
;**p<
0.0
5;
***p<
0.0
1.
Sta
nd
ard
erro
rsin
par
enth
eses
.
16

Table 5: Instrumental Variables, Different Samples
Dependent variable:
Industries
(1) (2) (3) (4) (5)
Homicide Rate −3.384∗∗∗ −4.951∗∗∗ −4.618∗∗∗ −5.007∗∗∗ −4.308∗∗∗
(0.055) (0.039) (0.049) (0.042) (0.145)
Added Value 0.076∗∗∗ 0.102∗∗∗ 0.120∗∗∗ 0.117∗∗∗ 0.115∗∗∗
(0.007) (0.007) (0.009) (0.009) (0.020)
Worked Hours 1.357∗∗∗ 1.127∗∗∗ 1.189∗∗∗ 1.005∗∗∗ 1.131∗∗∗
(0.030) (0.029) (0.035) (0.033) (0.082)
Employment 0.863∗∗∗ 1.033∗∗∗ 0.960∗∗∗ 0.976∗∗∗ 0.704∗∗∗
(0.033) (0.032) (0.039) (0.037) (0.090)
Border Distance 0.002∗∗∗ 0.001∗∗∗ 0.001∗∗∗ 0.003∗∗∗ −0.0004(0.0002) (0.0002) (0.0002) (0.0002) (0.0004)
Constant 27.287∗∗∗ 29.439∗∗∗ 29.903∗∗∗ 29.479∗∗∗ 32.346∗∗∗
(0.279) (0.270) (0.331) (0.317) (0.643)
Observations 80,569 109,641 65,550 81,926 11,109
Note: 2SLS specification, fixed effects by state, year and sector. Instrument is average homi-
cide rate during the nineties (logged). Dependent variable is the number of sectors operating
in a municipality. Independent variable is logged rates of general homicides. Includes only
sub-samples for (1) muncipalities with more tan 10K inhabitants, (2) municipalities with at
least one homcide during the nineties, (3) municipalities where drug is not produced, (4)
municipalities without criminal organizations, (5) municipalities with monopolistic criminal
organizations. In sample (1), to reduce in one the sectors that operate in a municipality
general homicide rates must increase in 34% in sample. * p <0.1; ** p <0.05; *** p <0.01.
Standard errors in parentheses.
17

Tab
le6:
Inst
rum
enta
lV
aria
ble
s,Sev
eral
Dep
enden
tV
aria
ble
s,H
omic
idio
s
Dep
ende
nt
vari
able
:
Con
centr
atio
nA
Con
centr
atio
nB
Div
ersi
tyA
Div
ersi
tyB
Com
ple
xit
yA
Com
ple
xit
yB
(1)
(2)
(3)
(4)
(5)
(6)
Hom
icid
eR
ate
605.
835∗
∗∗24
0.56
0∗∗∗
−0.
914∗
∗∗−
0.54
9∗∗∗
−0.
242∗
∗∗−
0.22
0∗∗∗
(11.
927)
(12.
844)
(0.0
17)
(0.0
18)
(0.0
07)
(0.0
07)
Added
Val
ue
−11
.567
∗∗∗
−5.
301∗
∗0.
001
0.00
50.
002∗
0.00
01(2
.268
)(2
.443
)(0
.003
)(0
.003
)(0
.001
)(0
.001
)
Wor
ked
Hou
rs3.
638
−12
.115
−0.
067∗
∗∗−
0.02
9∗∗
0.00
6−
0.00
03(7
.561
)(8
.142
)(0
.011
)(0
.011
)(0
.004
)(0
.004
)
Em
plo
ym
ent
−89
.326
∗∗∗
−47
.959
∗∗∗
0.30
2∗∗∗
0.19
6∗∗∗
0.03
1∗∗∗
0.04
3∗∗∗
(8.9
78)
(9.6
68)
(0.0
13)
(0.0
13)
(0.0
05)
(0.0
05)
Bor
der
Dis
tance
−0.
336∗
∗∗−
0.10
7∗∗
0.00
1∗∗∗
0.00
1∗∗∗
−0.
0004
∗∗∗
−0.
0000
4(0
.048
)(0
.052
)(0
.000
1)(0
.000
1)(0
.000
03)
(0.0
0003
)
Con
stan
t2,
727.
058∗
∗∗3,
482.
636∗
∗∗6.
118∗
∗∗5.
899∗
∗∗1.
317∗
∗∗0.
941∗
∗∗
(82.
162)
(88.
479)
(0.1
17)
(0.1
23)
(0.0
46)
(0.0
49)
Obse
rvat
ions
109,
641
109,
641
109,
641
109,
641
109,
641
109,
641
Not
e:2S
LS
spec
ifica
tion
,fi
xed
effec
tsby
state
,ye
ar
an
dse
ctor.
Dep
end
ent
vari
ab
leis
the
rate
of
hom
icid
eslo
ged
.In
stru
men
tis
aver
age
hom
icid
era
ted
uri
ng
the
nin
etie
s(l
ogge
d).
Dep
end
ent
vari
ab
leis
(1)
her
fin
dah
l-h
irsc
hm
an
ind
ex(H
H)
of
ad
ded
valu
e,(2
)H
Hof
tota
lgro
ss
pro
du
ctio
n,
(3)
div
ersi
tyas
calc
ula
ted
by
(Hau
sman
net
al.
,2014)
usi
ng
ad
ded
valu
e,(4
)d
iver
sity
usi
ng
gro
ssp
rod
uct
ion
,(5
)co
mp
lexit
y
asca
lcu
late
dby
(Hau
sman
net
al.,
2014
)u
sin
gad
ded
valu
e,an
d(6
)co
mp
lexit
yu
sin
ggro
ssp
rod
uct
ion
).A
nin
crea
seof
9.3
%in
the
rate
s
ofh
omic
ides
red
uce
sco
nce
ntr
atio
nby
57.7
,d
iver
sity
by
0.8
7an
dco
mp
lexit
yby
0.2
3.
*p<
0.1
;**p<
0.0
5;
***p<
0.0
1.
Sta
nd
ard
erro
rs
inp
aren
thes
es.
18

Tab
le7:
Inst
rum
enta
lV
aria
ble
s,Sev
eral
Dep
enden
tV
aria
ble
s,C
arte
ls
Dep
ende
nt
vari
able
:
Con
centr
atio
nA
Con
centr
atio
nB
Div
ersi
tyA
Div
ersi
tyB
Com
ple
xit
yA
Com
ple
xit
yB
(1)
(2)
(3)
(4)
(5)
(6)
Cri
min
alO
rg8,
551.
101∗
∗∗4,
366.
805∗
∗∗−
10.7
07∗∗
∗−
7.88
3∗∗∗
−1.
876∗
∗∗−
1.64
6∗∗∗
(652
.076
)(3
38.4
06)
(0.7
70)
(0.5
86)
(0.1
51)
(0.1
40)
Added
Val
ue
76.3
72∗∗
∗37
.542
∗∗∗
−0.
104∗
∗∗−
0.07
1∗∗∗
−0.
017∗
∗∗−
0.01
7∗∗∗
(11.
785)
(6.4
06)
(0.0
15)
(0.0
11)
(0.0
03)
(0.0
03)
Wor
ked
Hou
rs−
373.
105∗
∗∗−
224.
217∗
∗∗0.
469∗
∗∗0.
375∗
∗∗0.
113∗
∗∗0.
099∗
∗∗
(38.
814)
(21.
445)
(0.0
49)
(0.0
37)
(0.0
10)
(0.0
09)
Em
plo
ym
ent
−1,
264.
921∗
∗∗−
627.
952∗
∗∗1.
769∗
∗∗1.
254∗
∗∗0.
285∗
∗∗0.
266∗
∗∗
(100
.398
)(5
3.00
9)(0
.121
)(0
.092
)(0
.024
)(0
.022
)
Bor
der
Dis
tance
0.64
9∗∗∗
−0.
001∗
∗∗−
0.00
1∗∗∗
−0.
001∗
∗∗−
0.00
04∗∗
∗
(0.1
20)
(0.0
003)
(0.0
002)
(0.0
001)
(0.0
0005
)
Con
stan
t4,
931.
417∗
∗∗3,
964.
683∗
∗∗4.
222∗
∗∗4.
791∗
∗∗0.
691∗
∗∗0.
428∗
∗∗
(308
.487
)(1
81.2
83)
(0.4
12)
(0.3
14)
(0.0
81)
(0.0
75)
Obse
rvat
ions
145,
820
145,
820
145,
820
145,
820
145,
820
145,
820
Not
e:2S
LS
spec
ifica
tion
,fi
xed
effec
tsby
state
,yea
ran
dse
ctor.
Dep
end
ent
vari
ab
leis
nu
mb
erof
crim
inal
org
an
izati
on
sop
erati
ng
ina
mu
nic
ipal
ity.
Inst
rum
ent
isav
erag
eh
omic
ide
rate
du
rin
gth
en
inet
ies
(logged
).D
epen
den
tva
riab
leis
(1)
her
fin
dahl-
hir
sch
man
ind
ex(H
H)
ofad
ded
valu
e,(2
)H
Hof
tota
lgr
oss
pro
du
ctio
n,(3
)d
iver
sity
as
calc
ula
ted
by
(Hau
sman
net
al.
,2014)
usi
ng
ad
ded
valu
e,(4
)d
iver
sity
usi
ng
gros
sp
rod
uct
ion
,(5
)co
mp
lexit
yas
calc
ula
ted
by
(Hau
sman
net
al.
,2014)
usi
ng
ad
ded
valu
e,an
d(6
)co
mp
lexit
yu
sin
ggro
ssp
rod
uct
ion
).
*p<
0.1;
**p<
0.05
;**
*p<
0.01
.S
tan
dard
erro
rsin
pare
nth
eses
.
19

20
Appendix
Code Industries011 Agriculture, animal breeding and production, forestry, fishing and hunting021 Mining023 Construction043 Wholesale trade046 Retail trade048 Transportation, postal services and warehousing051 Mass media information053 Real estate services and tangible and intangible goods rental and leasing054 Professional, scientific and technical services055 Head offices056 Business support services, waste management and remediation services061 Educational services062 Health care and social assistance services071 Cultural and sporting recreation services and other recreational services072 Temporary accommodation services and food and beverage preparation services081 Other services, except government activities221 Electric power generation, transmission and distribution222 Water and gas supply through mains to final consumers311 Food industry
Beverage and tobacco industriesTextile inputs manufacturing, and textiles finishingTextile products manufacturing, except apparelApparel manufacturingLeather and hide tanning and finishing, and manufacturing of leather, hide andallied materials products
321 Wood industryPaper industryPrinting and related industriesPetroleum and coal products manufacturingChemical industryPlastic and rubber industryNonmetallic mineral products manufacturing
331 Basic metal industryMetal products manufacturingMachinery and equipment manufacturingManufacturing of computer, communications, and measuring equipment, andother electronic equipment, components and appliances manufacturingElectric appliances, accessories and electric power generation equipmentmanufacturingTransportation equipment manufacturingFurniture, mattresses and blinds manufacturingOther manufacturing industries
521 Central bankCredit and financial intermediation institutions, non-stock exchangeStock market, currency exchange and financial investment activitiesSurety, insurance and pension companies
522 Surety, insurance and pension companies
21

References
Abadie, A. and Gardeazabal, J. (2008). Terrorism and the world economy. EuropeanEconomic Review, 52(1):1–27.
Alesina, A., Ozler, S., Roubini, N., and Swagel, P. (1996). Political instability and eco-nomic growth. Journal of Economic growth, 1(2):189–211.
Alesina, A. and Perotti, R. (1996). Income distribution, political instability, and invest-ment. European economic review, 40(6):1203–1228.
Amodio, F. and Di Maio, M. (2014). Making do with what you have: Conflict, firm perfor-mance and input misallocation in palestine. Centro Studi Luca d’Agliano DevelopmentStudies Working Paper, (379).
Arias, J. and Esquivel, G. (2012). A note on the side effects of the war on drugs: labormarket outcomes in mexico. Unpublished working paper.
Ashby, N. J. and Ramos, M. A. (2013). Foreign direct investment and industry response toorganized crime: The mexican case. European Journal of Political Economy, 30:80–91.
Astorga, L. (2005). El siglo de las drogas: el narcotrafico, del Porfiriato al nuevo milenio.Plaza y Janes Mexico City.
Bannon, I. and Collier, P. (2003). Natural resources and violent conflict: options andactions. World Bank publications.
Barrera, F. and Ibanez, A. M. (2004). Does violence reduce investment in education?: Atheoretical and empirical approach. Technical report, Universidad de los Andes-CEDE.
Bartelsman, E., Haltiwanger, J., and Scarpetta, S. (2013). Cross-country differences inproductivity: The role of allocation and selection. The American Economic Review,103(1):305–334.
Bennett, J. (2002). Multinational corporations, social responsibility and conflict. Journalof International Affairs-Columbia University, 55(2):393–414.
BenYishay, A. and Pearlman, S. (2013). Homicide and work: The impact of mexico’sdrug war on labor market participation. Available at SSRN 2302437.
Blattman, C. and Miguel, E. (2010). Civil war. Journal of Economic Literature, 48(1):3–57.
Blomberg, S. B. and Mody, A. (2005). How severely does violence deter internationalinvestment? Claremont Colleges Economics Departments Working Paper, (2005-01).
22

Bozzoli, C., Bruck, T., and Muhumuza, T. (2012). Movers or stayers? understanding thedrivers of idp camp decongestion during post-conflict recovery in uganda.
Bozzoli, C., Bruck, T., and Wald, N. (2013). Self-employment and conflict in colombia.Journal of Conflict Resolution, 57(1):117–142.
Busse, M. and Hefeker, C. (2007). Political risk, institutions and foreign direct investment.European journal of political economy, 23(2):397–415.
Camacho, A. and Rodriguez, C. (2013). Firm exit and armed conflict in colombia. Journalof Conflict Resolution, 57(1):89–116.
Cardenas, M. (2007). Economic growth in colombia: a reversal of fortune? Fedesarrollo.
Castillo, J. C., Mejıa, D., and Restrepo, P. (2013). Illegal drug markets and vio-lence in mexico: The causes beyond calderon. Version electronica: http://cie. itam.mx/SEMINARIOS/Marzo Mayo 2013/Mejia. pdf, 3(10):2013.
Cerra, V. and Saxena, S. C. (2007). Growth dynamics: the myth of economic recovery.
Chabat, J. (2006). Mexico: The security challenge. Centro de Investigacion y DocenciaEconomicas.
Collier, P. (1999). On the economic consequences of civil war. Oxford economic papers,51(1):168–183.
Cook, L. D. (2014). Violence and economic activity: evidence from african americanpatents, 1870–1940. Journal of Economic Growth, 19(2):221–257.
Coscia, M. and Rios, V. (2012). Knowing where and how criminal organizations operateusing web content. CIKM.
CPJ (2015). Database: Journalists killed 1992-2015. https://cpj.org/killed/.
Daniele, V. and Marani, U. (2011). Organized crime, the quality of local institutions andfdi in italy: A panel data analysis. European Journal of Political Economy, 27(1):132–142.
David, J. M., Hopenhayn, H. A., and Venkateswaran, V. (2014). Information, misal-location and aggregate productivity. Technical report, National Bureau of EconomicResearch.
Dell, M. (2015). Trafficking networks and the mexican drug war. American economicreview, pages 1738–1779.
23

Detotto, C. and Otranto, E. (2010). Does crime affect economic growth? Kyklos,63(3):330–345.
Driffield, N., Jones, C., and Crotty, J. (2013). International business research and risky in-vestments, an analysis of fdi in conflict zones. International business review, 22(1):140–155.
Dube, O., Garcia Ponce, O., and Thom, K. (2014). From maize to haze: Agriculturalshocks and the growth of the mexican drug sector. Center for Global DevelopmentWorking Paper, (355).
Enamorado, T., Lopez-Calva, L. F., and Rodrıguez-Castelan, C. (2014). Crime andgrowth convergence: Evidence from mexico. Economics Letters, 125(1):9–13.
Escalante, F. (2011). Homicidios 20082009: La muerte tiene permiso.
Fajnzylber, P., Lederman, D., and Loayza, N. (1998). Determinants of crime rates inLatin America and the world: an empirical assessment. World Bank Publications.
Fajnzylber, P., Lederman, D., and Loayza, N. (2002). What causes violent crime? Euro-pean Economic Review, 46(7):1323–1357.
Felbab-Brown, V. (2009). The violent drug market in Mexico and lessons from Colombia.Brookings Institution.
Forni, M. and Paba, S. (2001). Knowledge spillovers and the growth of local industries.
Gaibulloev, K. and Sandler, T. (2008). Growth consequences of terrorism in westerneurope. Kyklos, 61(3):411–424.
Guerrero-Gutierrez, E. (2011). Security, drugs, and violence in mexico: A survey, 7thnorth american forum. Washington, US.
Guner, N., Ventura, G., and Xu, Y. (2008). Macroeconomic implications of size-dependentpolicies. Review of Economic Dynamics, 11(4):721–744.
Hausmann, R. and Hidalgo, C. (2009). The building blocks of economic complexity.Proceedings of the National Academy of Sciences, 106(26):10570–10575.
Hausmann, R., Hidalgo, C., Stock, D. P., and Yildirim, M. A. (2014). Implied comparativeadvantage.
Hoeffler, A. and Reynal-Querol, M. (2003). Measuring the costs of conflict. Washington,DC: World Bank.
24

Hopenhayn, H. A. (2014). Firms, misallocation, and aggregate productivity: A review.Annu. Rev. Econ., 6(1):735–770.
Hsieh, C.-T. and Klenow, P. J. (2010). Development accounting. American EconomicJournal: Macroeconomics, 2(1):207–223.
Imai, K., Weinstein, J. M., et al. (2000). Measuring the economic impact of civil war.Center for International Development, Harvard University.
INEGI (2012). Estadısticas vitales (1990-2012). http://www.inegi.org.mx.
INEGI (2014). Censos economicos (2004-2014). http://www.inegi.org.mx.
Leon, G. (2012). Civil conflict and human capital accumulation the long-term effects ofpolitical violence in peru. Journal of Human Resources, 47(4):991–1022.
Londono, J. L., Guerrero, R., Londono, J., Gaviria, A., and Guerrero, R. (2000). Violenciaen america latina: epidemiologıa y costos. Asalto al desarrollo. Violencia en AmericaLatina.
Maher, D. (2015a). The fatal attraction of civil war economies: Foreign direct investmentand political violence. a case study of colombia. International Studies Review.
Maher, D. (2015b). Rooted in violence: Civil war, international trade and the expansionof palm oil in colombia. New Political Economy, 20(2):299–330.
Marquez-Padilla, F., Perez-Arce, F., Rodriguez Castelan, C., et al. (2015). The (non-)effect of violence on education: evidence from the” war on drugs” in mexico. Technicalreport, The World Bank.
Mihalache-O’Keef, A. and Vashchilko, T. (2010). Chapter seven: Foreign direct investorsin conflict zones. Adelphi Paper, 50(412-413):137–156.
Molzahn, C., Rios, V., and Shirk, D. (2012). Drug violence in Mexico: Data and analysisthrough 2012. Trans-Border Institute.
Murdoch, J. C. and Sandler, T. (2004). Civil wars and economic growth: Spatial disper-sion. American Journal of Political Science, 48(1):138–151.
Oetzel, J., Getz, K. A., and Ladek, S. (2007). The role of multinational enterprisesin responding to violent conflict: A conceptual model and framework for research.American Business Law Journal, 44(2):331–358.
O’Neil, S. (2009). The real war in Mexico: How democracy can defeat the drug cartels.Foreign Affairs, 88:63.
25

Organski, A. F. and Kugler, J. (1977). The costs of major wars: the phoenix factor.American Political Science Review, 71(04):1347–1366.
Orraca Romano, P. P. (2015). Crime exposure and educational outcomes in mexico.
Osorio, J. (2012). Democratization and drug violence in Mexico. Program on Order,Conict and Violence at Yale University.
Powell, B., Manish, G., and Nair, M. (2010). 13 corruption, crime and economic growth.Handbook on the Economics of Crime, page 328.
Pshisva, R. and Suarez, G. A. (2010). Capital crimes: Kidnappings and corporate invest-ment in colombia. In The economics of crime: Lessons for and from Latin America,pages 63–97. University of Chicago Press.
Restuccia, D. and Rogerson, R. (2008). Policy distortions and aggregate productivitywith heterogeneous establishments. Review of Economic Dynamics, 11(4):707–720.
Rıos, V. (2008). Evaluating the economic impact of mexicos drug trafficking industry.Manuscript, Spring.
Rıos, V. (2012). How Government Structure Encourages Criminal Violence: The causesof Mexicos Drug War. PhD thesis, Harvard University Cambridge, Massachusetts.
Rıos, V. (2013). Why did Mexico become so violent? A self-reinforcing violent equilibriumcaused by competition and enforcement. Trends in Organized Crime, 16:138–155.
Rıos, V. (2014). The role of drug-related violence and extortion in promoting mexicanmigration. Latin American Research Review, 49(3).
Rios, V. (2015). How government coordination controlled organized crime the case ofmexicos cocaine markets. Journal of Conflict Resolution, 59(8):1433–1454.
Robles, G., Calderon, G., and Magaloni, B. (2013). The economic consequences of drugtrafficking violence in mexico. Poverty and Governance Series Working Paper, StanfordUniversity.
Rodriguez, C. and Sanchez, F. (2012). Armed conflict exposure, human capital in-vestments, and child labor: evidence from colombia. Defence and peace economics,23(2):161–184.
Rozo, S. V. (2014). Is murder bad for business and real income? the effects of violentcrime on economic activity.
Shemyakina, O. (2011). The effect of armed conflict on accumulation of schooling: Resultsfrom tajikistan. Journal of Development Economics, 95(2):186–200.
26
SNSP (2011). Base de datos por fallecimientos por presunta rivalidad delincuencial, di-ciembre de 2006 a septiembre de 2011. http://secretariadoejecutivo.gob.mx.
Snyder, R. and Duran-Martinez, A. (2009). Does illegality breed violence? drug traffickingand state-sponsored protection rackets. Crime, law and social change, 52(3):253–273.
Stratfor (2013). Mexicos drug war: Balkanization leads to regional challenges.
The-Economist (2015). Terror attacks and arrests in western europe.
Velasquez, A. (2014). The economic burden of crime: evidence from mexico. Technicalreport, Duke University, mimeo.
Villoro, R. and Teruel, G. (2004). The social costs of crime in mexico city and suburbanareas. Estudios Economicos, pages 3–44.
Wasmer, E. and Weil, P. (2000). The macroeconomics of labor and credit market imper-fections. Number 1. IZA Discussion Paper.
Yepes, M. C. V., Pedroni, M. P. L., and Hu, X. (2015). Crime and the Economy in MexicanStates: Heterogeneous Panel Estimates (1993-2012). Number 15-121. InternationalMonetary Fund.
27