
The Homogenization of US Equity Trading - Bank of Canada · The Homogenization of US Equity Trading...
30
The Homogenization of US Equity Trading Larry Harris FMB Microstructure Workshop FMB Microstructure Workshop October 25, 2012
-
Upload
duonghuong -
Category
Documents
-
view
215 -
download
2
Transcript of The Homogenization of US Equity Trading - Bank of Canada · The Homogenization of US Equity Trading...

The Homogenization of US Equity Trading
Larry HarrisFMB Microstructure WorkshopFMB Microstructure Workshop
October 25, 2012

Main PointsMain Points• Competition for order flow now focuses onCompetition for order flow now focuses on
traders and not on issuers.– Fragmentation and homogenization resultedFragmentation and homogenization resulted.
• Externalities prevent competition from revealing potentially better consolidatedrevealing potentially better consolidated systems. Shifting control o er market str ct re back• Shifting control over market structure back to issuers might help in principle.
2
AgendaAgenda• The competition for listingsThe competition for listings
– Market structure differences between NASDAQ and listed exchangesg
• The competition for order flow• The empirical study• The empirical study• A policy proposal
3

Competing Market Str ct resCompeting Market Structures• Exchanges compete for listings fromExchanges compete for listings from
issuers. The two main US market structures were:structures were:
• Traditional exchanges (NYSE and Amex) Order driven auction– Order-driven auction
– Specialist stabilizedNASDAQ• NASDAQ– Quote-driven dealer network
4

Market Str ct re DifferencesMarket Structure Differences• Volumes in dealer markets often areVolumes in dealer markets often are
double counted and thus higher.• Bid/ask spreads in dealer markets are• Bid/ask spreads in dealer markets are
wider.Wide spreads raise transitory volatility– Wide spreads raise transitory volatility.
• Exchange specialists stabilize prices. S bili i l i l ili– Stabilization lowers transitory volatility.
5

The Competition for Order FloThe Competition for Order Flow• Exchanges now compete for order flowExchanges now compete for order flow
from traders. Major recent changes:• Regulations in US• Regulations in US
– Unlisted trading privilegesReg ATS– Reg ATS
– Ret NMSTh th f l t i t di• The growth of electronic trading
6

Recent Res ltsRecent Results• SEC regulations promoting competition forSEC regulations promoting competition for
order flow produced innovative systems and decreased trade costs.and decreased trade costs.
• NASDAQ and listed market shares have plummetedplummeted.
• Trading has homogenized across stocks into a common blend of many fragmentedinto a common blend of many fragmented market segments that serve diverse traderstraders.
7

NYSE Listed Market SharesNYSE-Listed Market Shares90%
60%
70%
80%
NYSE
40%
50%
60%NYSE Arca
Nasdaq
BATS
20%
30%BATS
DirectEdge
Other
0%
10%
2002 2004 2006 2008 2010
8
2002 2004 2006 2008 2010
Source: Angel, Harris, and Spatt, “Equity Trading in the 21st Century”

A Potential ProblemA Potential Problem• Some market structures are incompatibleSome market structures are incompatible
with fragmented trading.– Universal time precedence and otherUniversal time precedence and other
consolidated matching algorithms – Concentrated trading hoursCo ce t ated t ad g ou s– Specialist stabilization
• Externalities associated with trader routing• Externalities associated with trader routing decisions undermine these structures.
9

The E ternalit ProblemThe Externality Problem• Traders route orders based only onTraders route orders based only on
personal cost/benefit considerations.– They do not consider consequences of theirThey do not consider consequences of their
order routing decisions on other traders. • Consolidated trading structures generallyConsolidated trading structures generally
cannot compete even if they are socially desirabledesirable.
10

This Empirical St dThis Empirical Study• Provide an empirical characterization ofProvide an empirical characterization of
the homogenization of trading. • Compare volumes and transitory• Compare volumes and transitory
volatilities between NASDAQ and listed stocksstocks.– Control for cross-sectional determinants.
Match samples using weights from a– Match samples using weights from a propensity score analysis.
• Repeat every year to identify trends• Repeat every year to identify trends.11
Identif ing Ca sal Effects (1)Identifying Causal Effects (1)• Estimate the regressions each yearEstimate the regressions each year
separately for both sets of stocks.• Predict volumes and transitory volatilities• Predict volumes and transitory volatilities
for stocks in each market using the estimates from the other marketestimates from the other market.
12

Identif ing Ca sal Effects (2)Identifying Causal Effects (2)• The causal effect is the differenceThe causal effect is the difference
between the actual and the predicted values.values.
• Weighted means and medians summarize their cross-section distributionstheir cross-section distributions.
• Plot results across years.
13

The T o Dependent VariablesThe Two Dependent Variables
14

• Proportional to the square of Roll’s bid/askProportional to the square of Roll s bid/ask spread estimator.
• Bid/ask bounce increases transitory• Bid/ask bounce increases transitory volatility.Positive return serial correlation decreases• Positive return serial correlation decreases transitory volatility and can make it negativenegative.
15

The ModelsThe Models
16
Propensit Anal sis Moti ationPropensity Analysis Motivation• Cross-sectional stock characteristics varyCross sectional stock characteristics vary
by exchange.– NASDAQ has smaller stocks and moreNASDAQ has smaller stocks and more
technology stocks.• A balanced design can reduce regressionA balanced design can reduce regression
misspecification bias and potential selection biasselection bias.
17

Propensit Anal sis ModelPropensity Analysis Model
18

The Weighting SchemeThe Weighting Scheme• Sort all stocks by their propensity scoresSort all stocks by their propensity scores
into 50 groups. • Within each group count the NASDAQ• Within each group, count the NASDAQ
and listed stocks. Give a weight of 1 to each stock from the• Give a weight of 1 to each stock from the market with the smaller count. Gi l i h h i i• Give equal weights to each remaining stock so that the total weights assigned to
h k heach market are the same. 19

Weighting Scheme PropertiesWeighting Scheme Properties• The aggregate weight of a group dependsThe aggregate weight of a group depends
on the degree to which propensity scores from the two markets overlap.from the two markets overlap.
• Within each group, and thus overall, the stocks in both markets have the samestocks in both markets have the same aggregate weights.
20

The DataThe Data• 1993-2010 CRSP daily returns1993 2010 CRSP daily returns
– NASDAQ data reporting procedures changed in 1992.
• Filters– All trades at or above $1– All trades at or above $1– No stocks with less than 120 annual trades
10 or more stocks in the same 2 digit SIC– 10 or more stocks in the same 2-digit SIC code
– No stocks that changed market mid year– No stocks that changed market mid year21

ResultsResults
All causal effects are reported as Nasdaq compared to Listed

Median $ Vol me Ca sal EffectMedian $ Volume Causal Effect120%
80%
100%
40%
60%
0%
20%
‐20%
1992 1994 1996 1998 2000 2002 2004 2006 2008 2010
23Full model LogMKVal only

Median Transitor Volatilit C EMedian Transitory Volatility C.E.6
4
5
2
3
0
1
‐1
1992 1994 1996 1998 2000 2002 2004 2006 2008 2010
24Full model LogMKVal only

Median Dail Dollar Vol mesMedian Daily Dollar Volumes6
$ Millions
5
3
4
1
2
0
1
1992 1994 1996 1998 2000 2002 2004 2006 2008 2010
25
1992 1994 1996 1998 2000 2002 2004 2006 2008 2010Listed NASDAQ

Median Dail Dollar Vol mesMedian Daily Dollar Volumes10
$ Millions
1
0.1
1992 1994 1996 1998 2000 2002 2004 2006 2008 2010
26
1992 1994 1996 1998 2000 2002 2004 2006 2008 2010Listed NASDAQ

Median Dail Ret rn VolatilitiesMedian Daily Return Volatilities20
% squared
14
16
18
10
12
14
4
6
8
0
2
1992 1994 1996 1998 2000 2002 2004 2006 2008 2010
27
1992 1994 1996 1998 2000 2002 2004 2006 2008 2010Listed NASDAQ
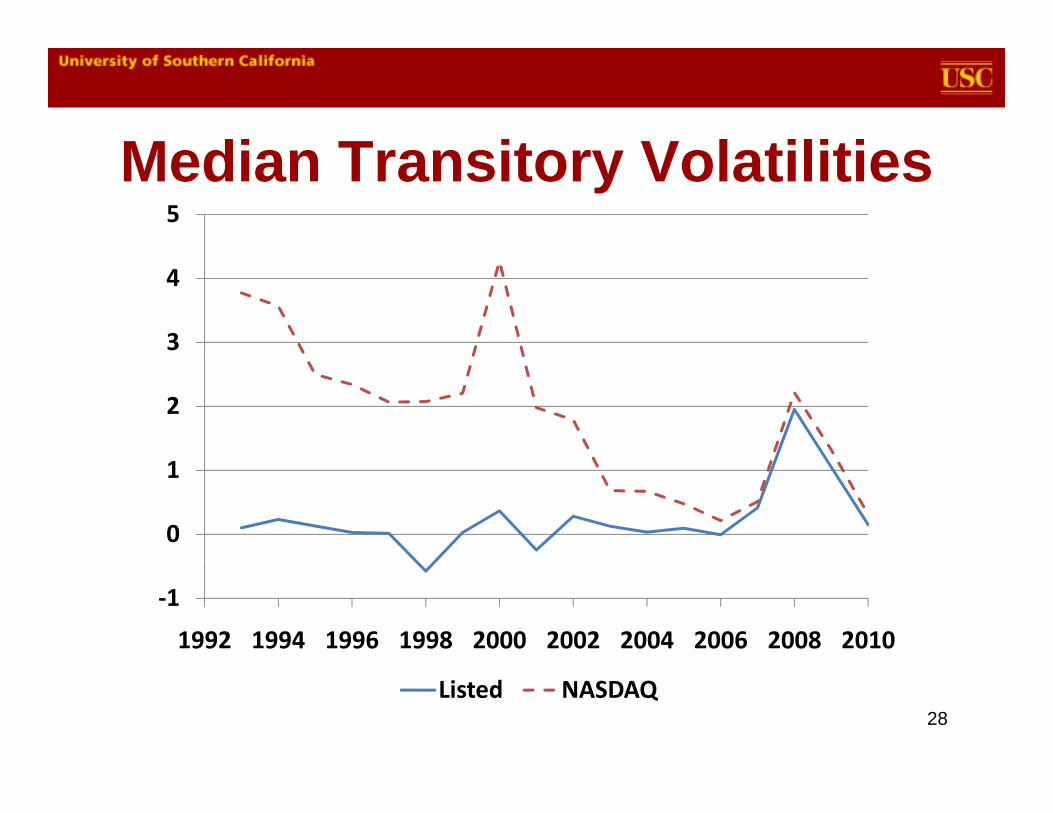
Median Transitor VolatilitiesMedian Transitory Volatilities5
3
4
2
0
1
‐1
1992 1994 1996 1998 2000 2002 2004 2006 2008 2010
Listed NASDAQ28

Concl sionConclusion• SEC efforts to improve the competitionSEC efforts to improve the competition
among exchange service providers for trader order flow has fragmented tradingtrader order flow has fragmented trading and homogenized market structures across stocks.ac oss stoc s
• These decisions effectively eliminated the ability of corporations to specify marketability of corporations to specify market structures for the trading of their stocks.
29

A Polic ProposalA Policy Proposal• Regulators should allow corporations orRegulators should allow corporations or
their shareholders to choose market structure for the trading of their stocks.structure for the trading of their stocks.
• These structures may require complete consolidation but need notconsolidation, but need not.
• Any exchange monopolies thus created should be contested every 2 5 yearsshould be contested every 2-5 years.
• Supermajority votes would be necessary i l bi hto implement big changes.
30