The Hillman Companies, Inc.
44
UNITED STATES SECURITIES AND EXCHANGE COMMISSION Washington, D.C. 20549 FORM 10-Q ☒ QUARTERLY REPORT PURSUANT TO SECTION 13 OR 15(d) OF THE SECURITIES EXCHANGE ACT OF 1934 For the quarterly period ended June 26, 2021 OR ☐ TRANSITION REPORT PURSUANT TO SECTION 13 OR 15(d) OF THE SECURITIES EXCHANGE ACT OF 1934 For the transition period from ______ to ______ Commission file number 1-13293 The Hillman Companies, Inc. (Exact name of registrant as specified in its charter) Delaware 23-2874736 (State or other jurisdiction of incorporation or organization) (I.R.S. Employer Identification No.) 10590 Hamilton Avenue 45231 Cincinnati , Ohio (Address of principal executive offices) (Zip Code) Registrant’s telephone number, including area code: (513) 851-4900 Securities registered pursuant to Section 12(g) of the Act: None Indicate by check mark whether the registrant (1) has filed all reports required to be filed by Section 13 or 15(d) of the Securities Exchange Act of 1934 during the preceding 12 months (or for such shorter period that the registrant was required to file such reports), and (2) has been subject to such filing requirements for the past 90 days. Yes ☒ No ☐ Indicate by check mark whether the registrant has submitted electronically and posted on its corporate Web site, if any, every Interactive Data File required to be submitted and posted pursuant to Rule 405 of Regulation S-T during the preceding 12 months (or for such shorter period that the registrant was required to submit and post such files). Yes ☒ No ☐ Indicate by check mark whether the registrant is a large accelerated filer, an accelerated filer, a non-accelerated filer, smaller reporting company, or an emerging growth company. See the definitions of “large accelerated filer,” “accelerated filer,” “smaller reporting company,” and “emerging growth company” in Rule 12b‑2 of the Exchange Act. (Check one): Large accelerated filer ☐ Accelerated filer ☐ Non-accelerated filer ☒ (Do not check if a smaller reporting company) Smaller reporting company ☐ Emerging growth company ☐ If an emerging growth company, indicate by check mark if the registrant has elected not to use the extended transition period for complying with any new or revised financial accounting standards provided pursuant to Section 13(a) of the Exchange Act. ☐ Indicate by check mark whether the registrant is a shell company (as defined in Rule 12b-2 of the Exchange Act). Yes ☐ No ☒ Securities registered pursuant to Section 12(b) of the Act: Title of Class Trading symbols Name of Each Exchange on Which Registered 11.6% Junior Subordinated Debentures None Preferred Securities Guaranty None On July 29, 2021, 5,000 shares of the Registrant’s common stock were issued and outstanding and 4,217,837 Trust Preferred Securities were issued and outstanding by the Hillman Group Capital Trust. The Trust Preferred Securities trade on the NYSE Amex under symbol HLM.Pr.
Transcript of The Hillman Companies, Inc.
UNITED STATESSECURITIES AND EXCHANGE COMMISSION
Washington, D.C. 20549
FORM 10-Q ☒ QUARTERLY REPORT PURSUANT TO SECTION 13 OR 15(d) OF
THE SECURITIES EXCHANGE ACT OF 1934For the quarterly period ended June 26, 2021
OR
☐ TRANSITION REPORT PURSUANT TO SECTION 13 OR 15(d) OF THE SECURITIES EXCHANGE ACT OF 1934For the transition period from ______ to ______
Commission file number 1-13293
The Hillman Companies, Inc.(Exact name of registrant as specified in its charter)
Delaware 23-2874736(State or other jurisdiction of incorporation or organization) (I.R.S. Employer Identification No.)
10590 Hamilton Avenue45231Cincinnati , Ohio
(Address of principal executive offices) (Zip Code)
Registrant’s telephone number, including area code: (513) 851-4900
Securities registered pursuant to Section 12(g) of the Act: None
Indicate by check mark whether the registrant (1) has filed all reports required to be filed by Section 13 or 15(d) of the Securities Exchange Act of 1934 during the preceding 12 months (or forsuch shorter period that the registrant was required to file such reports), and (2) has been subject to such filing requirements for the past 90 days. Yes ☒ No ☐
Indicate by check mark whether the registrant has submitted electronically and posted on its corporate Web site, if any, every Interactive Data File required to be submitted and postedpursuant to Rule 405 of Regulation S-T during the preceding 12 months (or for such shorter period that the registrant was required to submit and post such files). Yes ☒ No ☐
Indicate by check mark whether the registrant is a large accelerated filer, an accelerated filer, a non-accelerated filer, smaller reporting company, or an emerging growth company. See thedefinitions of “large accelerated filer,” “accelerated filer,” “smaller reporting company,” and “emerging growth company” in Rule 12b‑2 of the Exchange Act. (Check one):Large accelerated filer ☐ Accelerated filer ☐Non-accelerated filer ☒ (Do not check if a smaller reporting company) Smaller reporting company ☐Emerging growth company ☐
If an emerging growth company, indicate by check mark if the registrant has elected not to use the extended transition period for complying with any new or revised financial accountingstandards provided pursuant to Section 13(a) of the Exchange Act. ☐
Indicate by check mark whether the registrant is a shell company (as defined in Rule 12b-2 of the Exchange Act). Yes ☐ No ☒Securities registered pursuant to Section 12(b) of the Act:
Title of Class Trading symbols Name of Each Exchange on Which Registered11.6% Junior Subordinated Debentures NonePreferred Securities Guaranty None
On July 29, 2021, 5,000 shares of the Registrant’s common stock were issued and outstanding and 4,217,837 Trust Preferred Securities were issued and outstanding by the Hillman GroupCapital Trust. The Trust Preferred Securities trade on the NYSE Amex under symbol HLM.Pr.
Table of ContentsTHE HILLMAN COMPANIES, INC. AND SUBSIDIARIES
INDEX
PART I. FINANCIAL INFORMATION PAGE
Item 1. Condensed Consolidated Financial Statements (Unaudited)Condensed Consolidated Balance Sheets 3Condensed Consolidated Statements of Comprehensive Loss 4Condensed Consolidated Statements of Cash Flows 5Condensed Consolidated Statement of Stockholders' Equity 6
Notes to Condensed Consolidated Financial Statements 7Item 2. Management’s Discussion and Analysis of Financial Condition and Results of Operations 23Item 3. Quantitative and Qualitative Disclosures about Market Risk 37Item 4. Controls and Procedures 38PART II. OTHER INFORMATIONItem 1. Legal Proceedings 38Item 1A. Risk Factors 38Item 2. Unregistered Sales of Equity Securities and Use of Proceeds 38Item 3. Defaults upon Senior Securities 38Item 4. Mine Safety Disclosures 38Item 5. Other Information 38Item 6. Exhibits 39SIGNATURES 40
Page 2

Table of ContentsTHE HILLMAN COMPANIES, INC. AND SUBSIDIARIES
CONDENSED CONSOLIDATED BALANCE SHEETS (Unaudited)(dollars in thousands, except per share amounts)
June 26,
2021December 26,
2020ASSETSCurrent assets:
Cash and cash equivalents $ 16,255 $ 21,520 Accounts receivable, net of allowances of $2,586 ($2,395 - 2020) 146,865 121,228 Inventories, net 482,645 391,679 Other current assets 22,125 19,280
Total current assets 667,890 553,707 Property and equipment, net of accumulated depreciation of $260,692 ($236,031 - 2020) 174,466 182,674 Goodwill 826,969 816,200 Other intangibles, net of accumulated amortization of $322,230 ($291,434 - 2020) 826,949 825,966 Operating lease right of use assets 85,312 76,820 Deferred tax assets 2,728 2,075 Other assets 12,739 11,176
Total assets $ 2,597,053 $ 2,468,618 LIABILITIES AND STOCKHOLDERS’ EQUITYCurrent liabilities:
Accounts payable $ 229,618 $ 201,461 Current portion of debt and capital leases 11,442 11,481 Current portion of operating lease liabilities 11,838 12,168 Accrued expenses:
Salaries and wages 16,738 29,800 Pricing allowances 7,636 6,422 Income and other taxes 2,647 5,986 Interest 13,550 12,988 Other accrued expenses 33,935 31,605
Total current liabilities 327,404 311,911 Long term debt 1,651,476 1,535,508 Deferred tax liabilities 151,970 156,118 Operating lease liabilities 78,204 68,934 Other non-current liabilities 24,154 31,560
Total liabilities $ 2,233,208 $ 2,104,031 Commitments and contingencies (Note 6)Stockholders' Equity:
Preferred stock, $0.01 par, 5,000 shares authorized, none issued or outstanding atJune 26, 2021 and December 26, 2020 — — Common stock, $0.01 par, 5,000 shares authorized, issued and outstanding at June 26,2021 and December 26, 2020 — — Additional paid-in capital 571,122 565,824 Accumulated deficit (184,204) (171,849)Accumulated other comprehensive loss (23,073) (29,388)
Total stockholders' equity 363,845 364,587 Total liabilities and stockholders' equity $ 2,597,053 $ 2,468,618
The accompanying notes are an integral part of these Condensed Consolidated Financial Statements.
Page 3
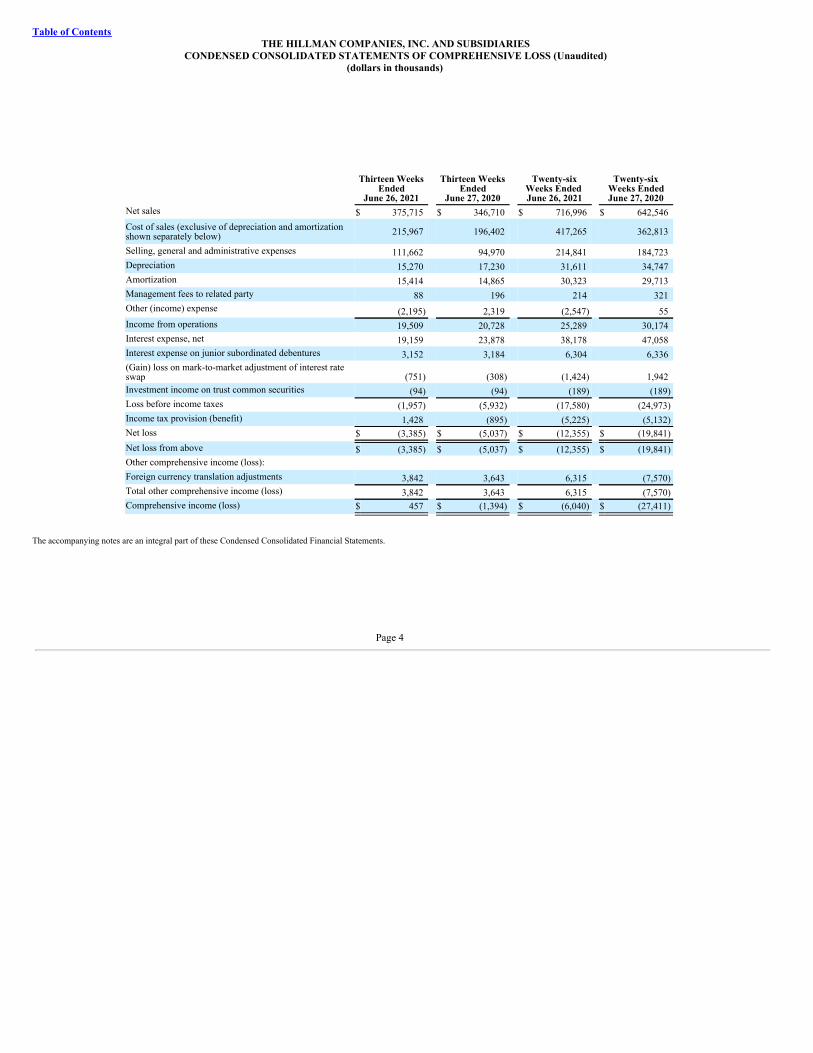
Table of ContentsTHE HILLMAN COMPANIES, INC. AND SUBSIDIARIES
CONDENSED CONSOLIDATED STATEMENTS OF COMPREHENSIVE LOSS (Unaudited)(dollars in thousands)
Thirteen WeeksEnded
June 26, 2021
Thirteen WeeksEnded
June 27, 2020
Twenty-sixWeeks Ended June 26, 2021
Twenty-sixWeeks EndedJune 27, 2020
Net sales $ 375,715 $ 346,710 $ 716,996 $ 642,546 Cost of sales (exclusive of depreciation and amortizationshown separately below) 215,967 196,402 417,265 362,813
Selling, general and administrative expenses 111,662 94,970 214,841 184,723 Depreciation 15,270 17,230 31,611 34,747 Amortization 15,414 14,865 30,323 29,713 Management fees to related party 88 196 214 321 Other (income) expense (2,195) 2,319 (2,547) 55 Income from operations 19,509 20,728 25,289 30,174 Interest expense, net 19,159 23,878 38,178 47,058 Interest expense on junior subordinated debentures 3,152 3,184 6,304 6,336 (Gain) loss on mark-to-market adjustment of interest rateswap (751) (308) (1,424) 1,942 Investment income on trust common securities (94) (94) (189) (189)Loss before income taxes (1,957) (5,932) (17,580) (24,973)Income tax provision (benefit) 1,428 (895) (5,225) (5,132)Net loss $ (3,385) $ (5,037) $ (12,355) $ (19,841)Net loss from above $ (3,385) $ (5,037) $ (12,355) $ (19,841)Other comprehensive income (loss):Foreign currency translation adjustments 3,842 3,643 6,315 (7,570)Total other comprehensive income (loss) 3,842 3,643 6,315 (7,570)Comprehensive income (loss) $ 457 $ (1,394) $ (6,040) $ (27,411)
The accompanying notes are an integral part of these Condensed Consolidated Financial Statements.
Page 4
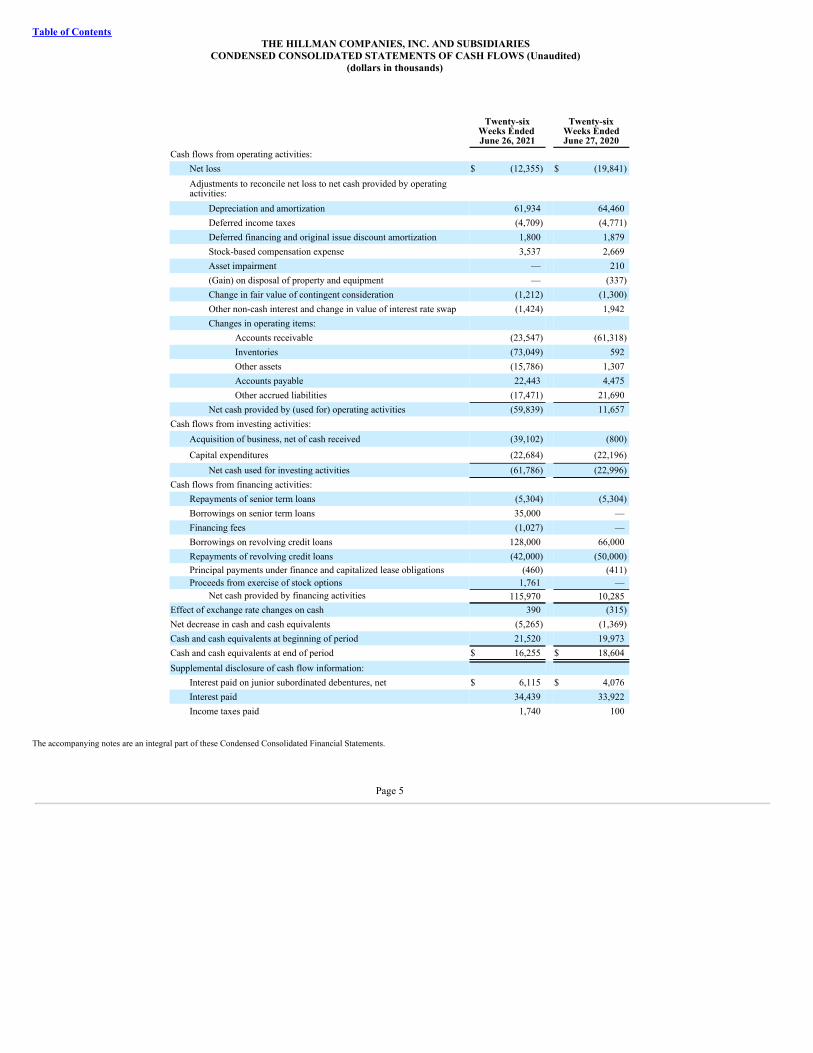
Table of ContentsTHE HILLMAN COMPANIES, INC. AND SUBSIDIARIES
CONDENSED CONSOLIDATED STATEMENTS OF CASH FLOWS (Unaudited)(dollars in thousands)
Twenty-sixWeeks Ended June 26, 2021
Twenty-sixWeeks EndedJune 27, 2020
Cash flows from operating activities:Net loss $ (12,355) $ (19,841)Adjustments to reconcile net loss to net cash provided by operatingactivities:
Depreciation and amortization 61,934 64,460 Deferred income taxes (4,709) (4,771)Deferred financing and original issue discount amortization 1,800 1,879 Stock-based compensation expense 3,537 2,669 Asset impairment — 210 (Gain) on disposal of property and equipment — (337)Change in fair value of contingent consideration (1,212) (1,300)Other non-cash interest and change in value of interest rate swap (1,424) 1,942 Changes in operating items:
Accounts receivable (23,547) (61,318)Inventories (73,049) 592 Other assets (15,786) 1,307 Accounts payable 22,443 4,475 Other accrued liabilities (17,471) 21,690
Net cash provided by (used for) operating activities (59,839) 11,657 Cash flows from investing activities:
Acquisition of business, net of cash received (39,102) (800)
Capital expenditures (22,684) (22,196)Net cash used for investing activities (61,786) (22,996)
Cash flows from financing activities:Repayments of senior term loans (5,304) (5,304)Borrowings on senior term loans 35,000 — Financing fees (1,027) — Borrowings on revolving credit loans 128,000 66,000 Repayments of revolving credit loans (42,000) (50,000)Principal payments under finance and capitalized lease obligations (460) (411)Proceeds from exercise of stock options 1,761 —
Net cash provided by financing activities 115,970 10,285 Effect of exchange rate changes on cash 390 (315)Net decrease in cash and cash equivalents (5,265) (1,369)Cash and cash equivalents at beginning of period 21,520 19,973 Cash and cash equivalents at end of period $ 16,255 $ 18,604 Supplemental disclosure of cash flow information:
Interest paid on junior subordinated debentures, net $ 6,115 $ 4,076 Interest paid 34,439 33,922 Income taxes paid 1,740 100
The accompanying notes are an integral part of these Condensed Consolidated Financial Statements.
Page 5
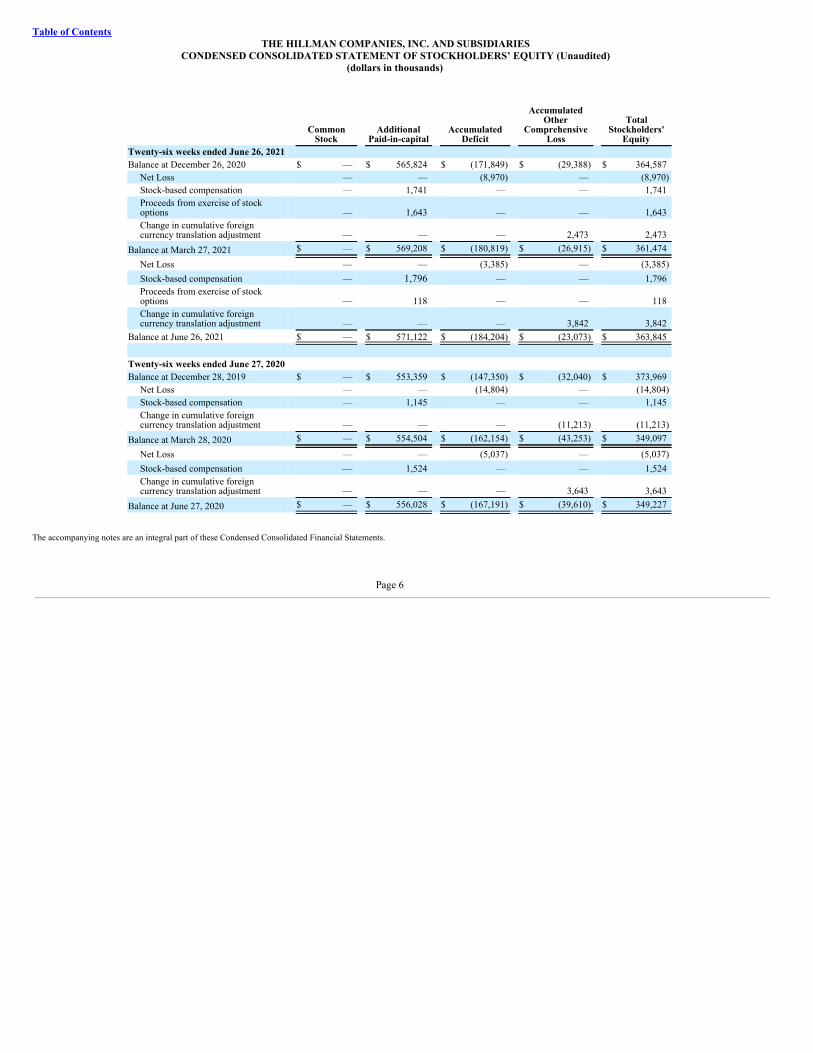
Table of ContentsTHE HILLMAN COMPANIES, INC. AND SUBSIDIARIES
CONDENSED CONSOLIDATED STATEMENT OF STOCKHOLDERS’ EQUITY (Unaudited)(dollars in thousands)
CommonStock
AdditionalPaid-in-capital
AccumulatedDeficit
AccumulatedOther
ComprehensiveLoss
TotalStockholders'
EquityTwenty-six weeks ended June 26, 2021Balance at December 26, 2020 $ — $ 565,824 $ (171,849) $ (29,388) $ 364,587
Net Loss — — (8,970) — (8,970)Stock-based compensation — 1,741 — — 1,741 Proceeds from exercise of stockoptions — 1,643 — — 1,643 Change in cumulative foreigncurrency translation adjustment — — — 2,473 2,473
Balance at March 27, 2021 $ — $ 569,208 $ (180,819) $ (26,915) $ 361,474
Net Loss — — (3,385) — (3,385)Stock-based compensation — 1,796 — — 1,796 Proceeds from exercise of stockoptions — 118 — — 118 Change in cumulative foreigncurrency translation adjustment — — — 3,842 3,842
Balance at June 26, 2021 $ — $ 571,122 $ (184,204) $ (23,073) $ 363,845
Twenty-six weeks ended June 27, 2020Balance at December 28, 2019 $ — $ 553,359 $ (147,350) $ (32,040) $ 373,969
Net Loss — — (14,804) — (14,804)Stock-based compensation — 1,145 — — 1,145 Change in cumulative foreigncurrency translation adjustment — — — (11,213) (11,213)
Balance at March 28, 2020 $ — $ 554,504 $ (162,154) $ (43,253) $ 349,097
Net Loss — — (5,037) — (5,037)Stock-based compensation — 1,524 — — 1,524 Change in cumulative foreigncurrency translation adjustment — — — 3,643 3,643
Balance at June 27, 2020 $ — $ 556,028 $ (167,191) $ (39,610) $ 349,227
The accompanying notes are an integral part of these Condensed Consolidated Financial Statements.
Page 6
Table of ContentsTHE HILLMAN COMPANIES, INC. AND SUBSIDIARIES
NOTES TO CONDENSED CONSOLIDATED FINANCIAL STATEMENTS(dollars in thousands)
1. Basis of Presentation:The accompanying unaudited financial statements include the condensed consolidated accounts of The Hillman Companies, Inc. and its wholly-owned subsidiaries (collectively“Hillman” or the “Company”) for the twenty-six weeks ended June 26, 2021. Unless the context requires otherwise, references to "Hillman," "we," "us," "our," or "ourCompany" refer to The Hillman Companies, Inc. and its wholly-owned subsidiaries. All significant intercompany balances and transactions have been eliminated. The HillmanCompanies, Inc. is a wholly-owned subsidiary of HMAN Intermediate II Holdings Corp., and a wholly-owned subsidiary of HMAN Group Holdings Inc. (“Holdco”).
The accompanying unaudited condensed consolidated financial statements present information in accordance with accounting principles generally accepted in the United Statesfor interim financial information and the instructions to Form 10-Q and applicable rules of Regulation S-X. Accordingly, they do not include all information or footnotesrequired by U.S. generally accepted accounting principles for complete financial statements. Operating results for the twenty-six weeks ended June 26, 2021 do not necessarilyindicate the results that may be expected for the full year. For further information, refer to the consolidated financial statements and notes thereto included in the Company’sannual report filed on Form 10-K for the year ended December 26, 2020.
On July 14, 2021, subsequent to quarter end, the Company’s parent, HMan Group Holdings, Inc., and Landcadia Holdings III, Inc. (“Landcadia” and after the BusinessCombination described herein, “New Hillman”), a special purpose acquisition company ("SPAC") consummated the previously announced business combination (the“Closing”) pursuant to the terms of the Agreement and Plan of Merger, dated as of January 24, 2021 (as amended on March 12, 2021, and as it may be further amended orsupplemented from time to time, the “Merger Agreement”). In accordance with the terms and subject to the conditions set forth in the Merger Agreement, Landcadia paidaggregate consideration in the form of New Hillman common stock calculated as described herein and equal to a value of approximately (i) $911,300,000 plus (ii) $28,280,000,such amount being the value of 2,828,000 shares of Class B common stock of Landcadia, valued at $10.00 per share, that TJF, LLC (“TJF Sponsor”) and Jefferies FinancialGroup Inc., (“JFG Sponsor” and, together with TJF Sponsor, the “Sponsors”) agreed to forfeit at the Closing.
2. Summary of Significant Accounting Policies:The significant accounting policies should be read in conjunction with the significant accounting policies included in the Form 10-K for the year ended December 26, 2020.
Use of Estimates in the Preparation of Financial Statements:
The preparation of financial statements in conformity with U.S. generally accepted accounting principles requires management to make estimates and assumptions that affect thereported amounts of assets and liabilities and disclosure of contingent assets and liabilities at the dates of the financial statements and the reported amounts of revenues andexpenses for the reporting periods. Actual results may differ from these estimates.
The extent to which COVID-19 impacts the Company’s business and financial results will depend on numerous evolving factors including, but not limited to: the magnitudeand duration of COVID-19, the extent to which it will impact worldwide macroeconomic conditions including interest rates, employment rates and health insurance coverage,the speed of the anticipated recovery, and governmental and business reactions to the pandemic. The Company assessed certain accounting matters that generally requireconsideration of forecasted financial information in context with the information reasonably available to the Company and the unknown future impacts of COVID-19 as ofJune 26, 2021 and through the date of this report. The accounting matters assessed included, but were not limited to the carrying value of the goodwill and other long-livedassets. While there was not a material impact to the Company’s consolidated financial statements as of and for the quarter ended June 26, 2021, the Company’s futureassessment of the magnitude and duration of COVID-19, as well as other factors, could result in material impacts to the Company’s Consolidated Financial Statements in futurereporting periods.
Revenue Recognition:Revenue is recognized when control of goods or services is transferred to our customers, in an amount that reflects the consideration the Company expects to be entitled to inexchange for those goods or services. Sales and other taxes the Company collects concurrent with revenue-producing activities are excluded from revenue.
Page 7
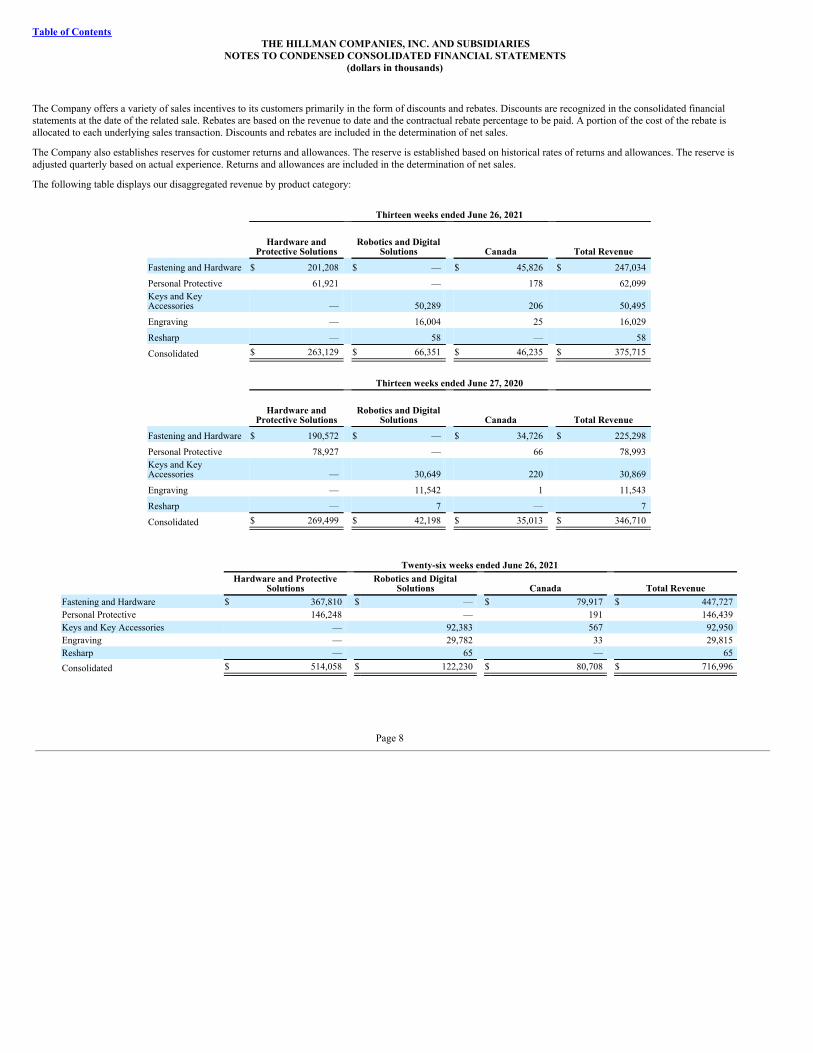
Table of ContentsTHE HILLMAN COMPANIES, INC. AND SUBSIDIARIES
NOTES TO CONDENSED CONSOLIDATED FINANCIAL STATEMENTS(dollars in thousands)
The Company offers a variety of sales incentives to its customers primarily in the form of discounts and rebates. Discounts are recognized in the consolidated financialstatements at the date of the related sale. Rebates are based on the revenue to date and the contractual rebate percentage to be paid. A portion of the cost of the rebate isallocated to each underlying sales transaction. Discounts and rebates are included in the determination of net sales.
The Company also establishes reserves for customer returns and allowances. The reserve is established based on historical rates of returns and allowances. The reserve isadjusted quarterly based on actual experience. Returns and allowances are included in the determination of net sales.
The following table displays our disaggregated revenue by product category:
Thirteen weeks ended June 26, 2021
Hardware andProtective Solutions
Robotics and DigitalSolutions Canada Total Revenue
Fastening and Hardware $ 201,208 $ — $ 45,826 $ 247,034
Personal Protective 61,921 — 178 62,099 Keys and KeyAccessories — 50,289 206 50,495
Engraving — 16,004 25 16,029
Resharp — 58 — 58
Consolidated $ 263,129 $ 66,351 $ 46,235 $ 375,715
Thirteen weeks ended June 27, 2020
Hardware andProtective Solutions
Robotics and DigitalSolutions Canada Total Revenue
Fastening and Hardware $ 190,572 $ — $ 34,726 $ 225,298
Personal Protective 78,927 — 66 78,993 Keys and KeyAccessories — 30,649 220 30,869
Engraving — 11,542 1 11,543
Resharp — 7 — 7
Consolidated $ 269,499 $ 42,198 $ 35,013 $ 346,710
Twenty-six weeks ended June 26, 2021Hardware and Protective
SolutionsRobotics and Digital
Solutions Canada Total RevenueFastening and Hardware $ 367,810 $ — $ 79,917 $ 447,727 Personal Protective 146,248 — 191 146,439 Keys and Key Accessories — 92,383 567 92,950 Engraving — 29,782 33 29,815 Resharp — 65 — 65 Consolidated $ 514,058 $ 122,230 $ 80,708 $ 716,996
Page 8
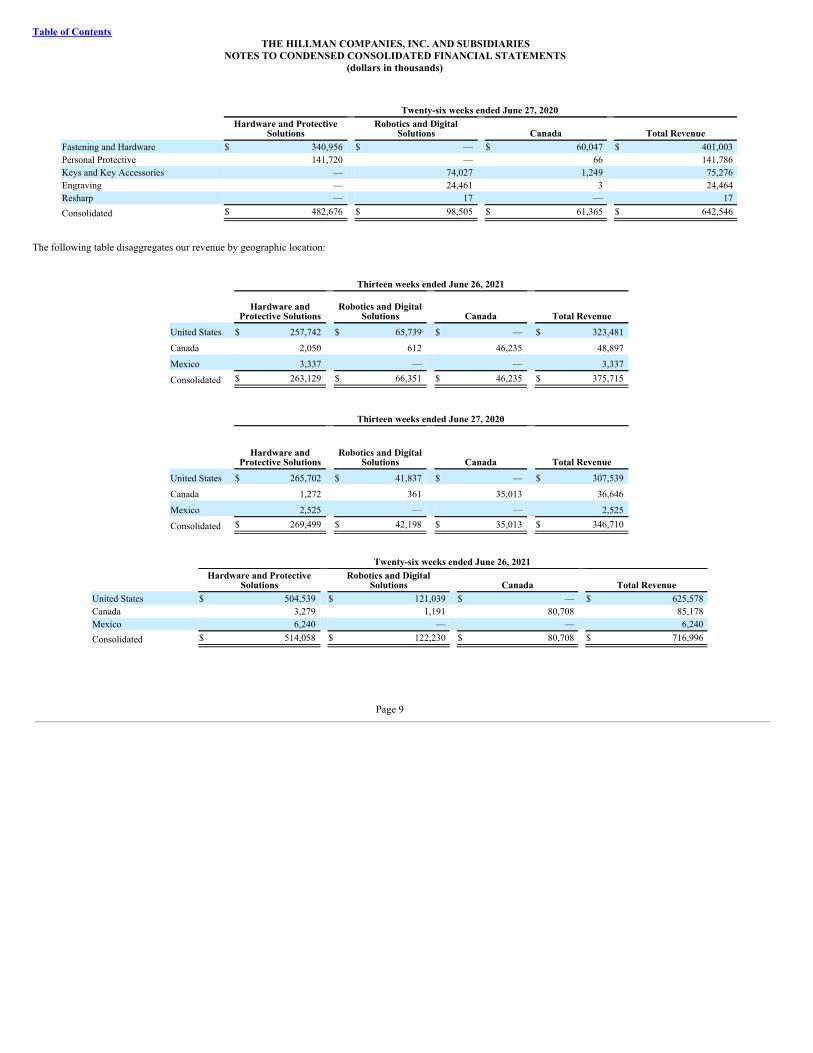
Table of ContentsTHE HILLMAN COMPANIES, INC. AND SUBSIDIARIES
NOTES TO CONDENSED CONSOLIDATED FINANCIAL STATEMENTS(dollars in thousands)
Twenty-six weeks ended June 27, 2020Hardware and Protective
SolutionsRobotics and Digital
Solutions Canada Total RevenueFastening and Hardware $ 340,956 $ — $ 60,047 $ 401,003 Personal Protective 141,720 — 66 141,786 Keys and Key Accessories — 74,027 1,249 75,276 Engraving — 24,461 3 24,464 Resharp — 17 — 17 Consolidated $ 482,676 $ 98,505 $ 61,365 $ 642,546
The following table disaggregates our revenue by geographic location:
Thirteen weeks ended June 26, 2021
Hardware andProtective Solutions
Robotics and DigitalSolutions Canada Total Revenue
United States $ 257,742 $ 65,739 $ — $ 323,481
Canada 2,050 612 46,235 48,897
Mexico 3,337 — — 3,337
Consolidated $ 263,129 $ 66,351 $ 46,235 $ 375,715
Thirteen weeks ended June 27, 2020
Hardware andProtective Solutions
Robotics and DigitalSolutions Canada Total Revenue
United States $ 265,702 $ 41,837 $ — $ 307,539
Canada 1,272 361 35,013 36,646
Mexico 2,525 — — 2,525
Consolidated $ 269,499 $ 42,198 $ 35,013 $ 346,710
Twenty-six weeks ended June 26, 2021Hardware and Protective
SolutionsRobotics and Digital
Solutions Canada Total RevenueUnited States $ 504,539 $ 121,039 $ — $ 625,578 Canada 3,279 1,191 80,708 85,178 Mexico 6,240 — — 6,240 Consolidated $ 514,058 $ 122,230 $ 80,708 $ 716,996
Page 9
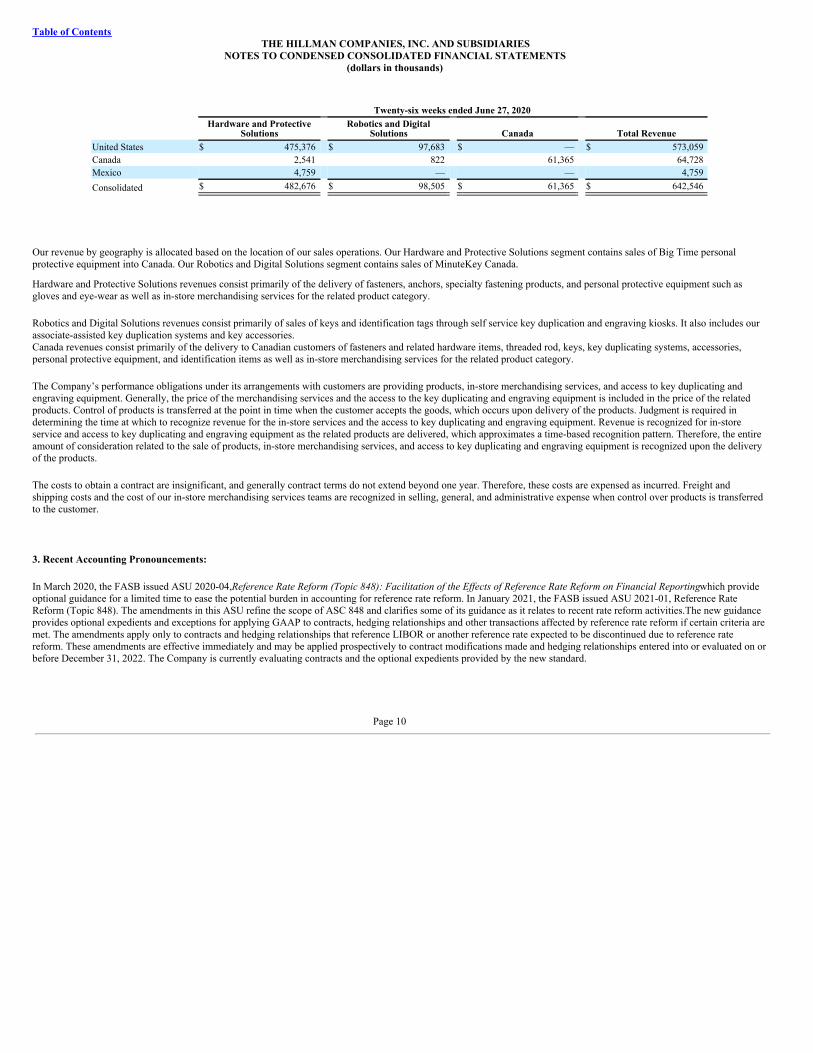
Table of ContentsTHE HILLMAN COMPANIES, INC. AND SUBSIDIARIES
NOTES TO CONDENSED CONSOLIDATED FINANCIAL STATEMENTS(dollars in thousands)
Twenty-six weeks ended June 27, 2020Hardware and Protective
SolutionsRobotics and Digital
Solutions Canada Total RevenueUnited States $ 475,376 $ 97,683 $ — $ 573,059 Canada 2,541 822 61,365 64,728 Mexico 4,759 — — 4,759 Consolidated $ 482,676 $ 98,505 $ 61,365 $ 642,546
Our revenue by geography is allocated based on the location of our sales operations. Our Hardware and Protective Solutions segment contains sales of Big Time personalprotective equipment into Canada. Our Robotics and Digital Solutions segment contains sales of MinuteKey Canada.
Hardware and Protective Solutions revenues consist primarily of the delivery of fasteners, anchors, specialty fastening products, and personal protective equipment such asgloves and eye-wear as well as in-store merchandising services for the related product category.
Robotics and Digital Solutions revenues consist primarily of sales of keys and identification tags through self service key duplication and engraving kiosks. It also includes ourassociate-assisted key duplication systems and key accessories.Canada revenues consist primarily of the delivery to Canadian customers of fasteners and related hardware items, threaded rod, keys, key duplicating systems, accessories,personal protective equipment, and identification items as well as in-store merchandising services for the related product category.
The Company’s performance obligations under its arrangements with customers are providing products, in-store merchandising services, and access to key duplicating andengraving equipment. Generally, the price of the merchandising services and the access to the key duplicating and engraving equipment is included in the price of the relatedproducts. Control of products is transferred at the point in time when the customer accepts the goods, which occurs upon delivery of the products. Judgment is required indetermining the time at which to recognize revenue for the in-store services and the access to key duplicating and engraving equipment. Revenue is recognized for in-storeservice and access to key duplicating and engraving equipment as the related products are delivered, which approximates a time-based recognition pattern. Therefore, the entireamount of consideration related to the sale of products, in-store merchandising services, and access to key duplicating and engraving equipment is recognized upon the deliveryof the products.
The costs to obtain a contract are insignificant, and generally contract terms do not extend beyond one year. Therefore, these costs are expensed as incurred. Freight andshipping costs and the cost of our in-store merchandising services teams are recognized in selling, general, and administrative expense when control over products is transferredto the customer.
3. Recent Accounting Pronouncements:
In March 2020, the FASB issued ASU 2020-04, Reference Rate Reform (Topic 848): Facilitation of the Effects of Reference Rate Reform on Financial Reporting which provideoptional guidance for a limited time to ease the potential burden in accounting for reference rate reform. In January 2021, the FASB issued ASU 2021-01, Reference RateReform (Topic 848). The amendments in this ASU refine the scope of ASC 848 and clarifies some of its guidance as it relates to recent rate reform activities.The new guidanceprovides optional expedients and exceptions for applying GAAP to contracts, hedging relationships and other transactions affected by reference rate reform if certain criteria aremet. The amendments apply only to contracts and hedging relationships that reference LIBOR or another reference rate expected to be discontinued due to reference ratereform. These amendments are effective immediately and may be applied prospectively to contract modifications made and hedging relationships entered into or evaluated on orbefore December 31, 2022. The Company is currently evaluating contracts and the optional expedients provided by the new standard.
Page 10
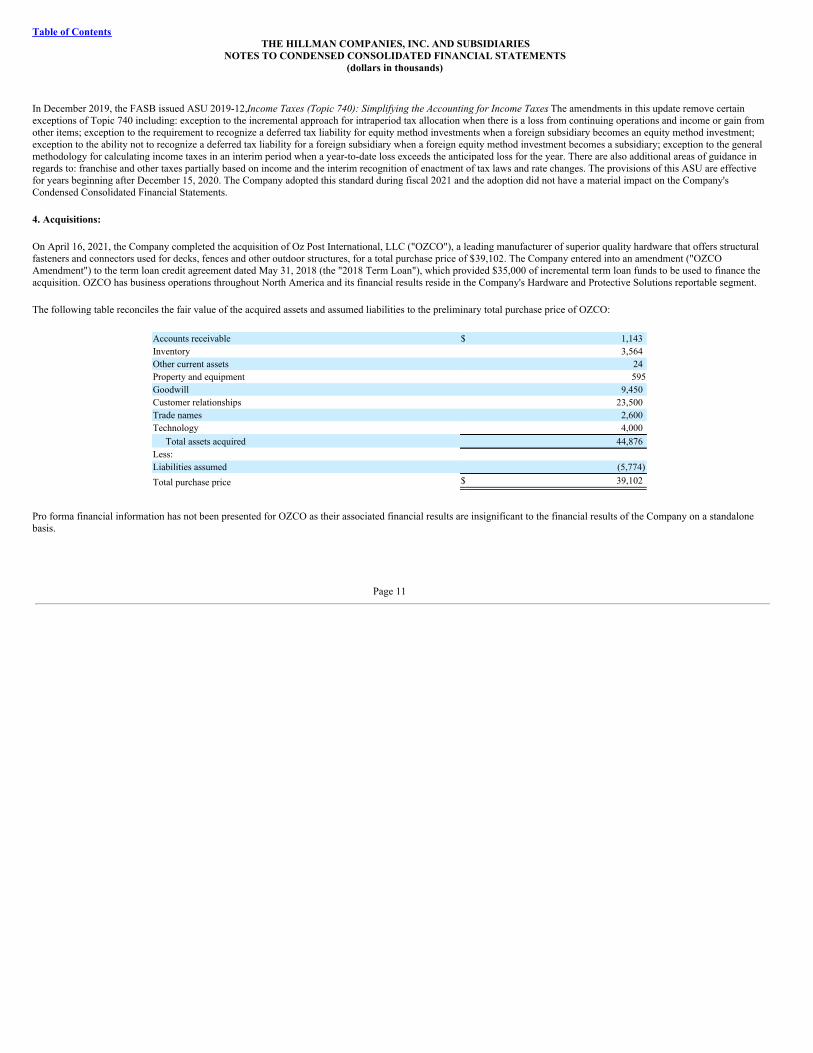
Table of ContentsTHE HILLMAN COMPANIES, INC. AND SUBSIDIARIES
NOTES TO CONDENSED CONSOLIDATED FINANCIAL STATEMENTS(dollars in thousands)
In December 2019, the FASB issued ASU 2019-12, Income Taxes (Topic 740): Simplifying the Accounting for Income Taxes. The amendments in this update remove certainexceptions of Topic 740 including: exception to the incremental approach for intraperiod tax allocation when there is a loss from continuing operations and income or gain fromother items; exception to the requirement to recognize a deferred tax liability for equity method investments when a foreign subsidiary becomes an equity method investment;exception to the ability not to recognize a deferred tax liability for a foreign subsidiary when a foreign equity method investment becomes a subsidiary; exception to the generalmethodology for calculating income taxes in an interim period when a year-to-date loss exceeds the anticipated loss for the year. There are also additional areas of guidance inregards to: franchise and other taxes partially based on income and the interim recognition of enactment of tax laws and rate changes. The provisions of this ASU are effectivefor years beginning after December 15, 2020. The Company adopted this standard during fiscal 2021 and the adoption did not have a material impact on the Company'sCondensed Consolidated Financial Statements.
4. Acquisitions:
On April 16, 2021, the Company completed the acquisition of Oz Post International, LLC ("OZCO"), a leading manufacturer of superior quality hardware that offers structuralfasteners and connectors used for decks, fences and other outdoor structures, for a total purchase price of $39,102. The Company entered into an amendment ("OZCOAmendment") to the term loan credit agreement dated May 31, 2018 (the "2018 Term Loan"), which provided $35,000 of incremental term loan funds to be used to finance theacquisition. OZCO has business operations throughout North America and its financial results reside in the Company's Hardware and Protective Solutions reportable segment.
The following table reconciles the fair value of the acquired assets and assumed liabilities to the preliminary total purchase price of OZCO:
Accounts receivable $ 1,143 Inventory 3,564 Other current assets 24 Property and equipment 595Goodwill 9,450 Customer relationships 23,500 Trade names 2,600 Technology 4,000
Total assets acquired 44,876 Less:Liabilities assumed (5,774)Total purchase price $ 39,102
Pro forma financial information has not been presented for OZCO as their associated financial results are insignificant to the financial results of the Company on a standalonebasis.
Page 11
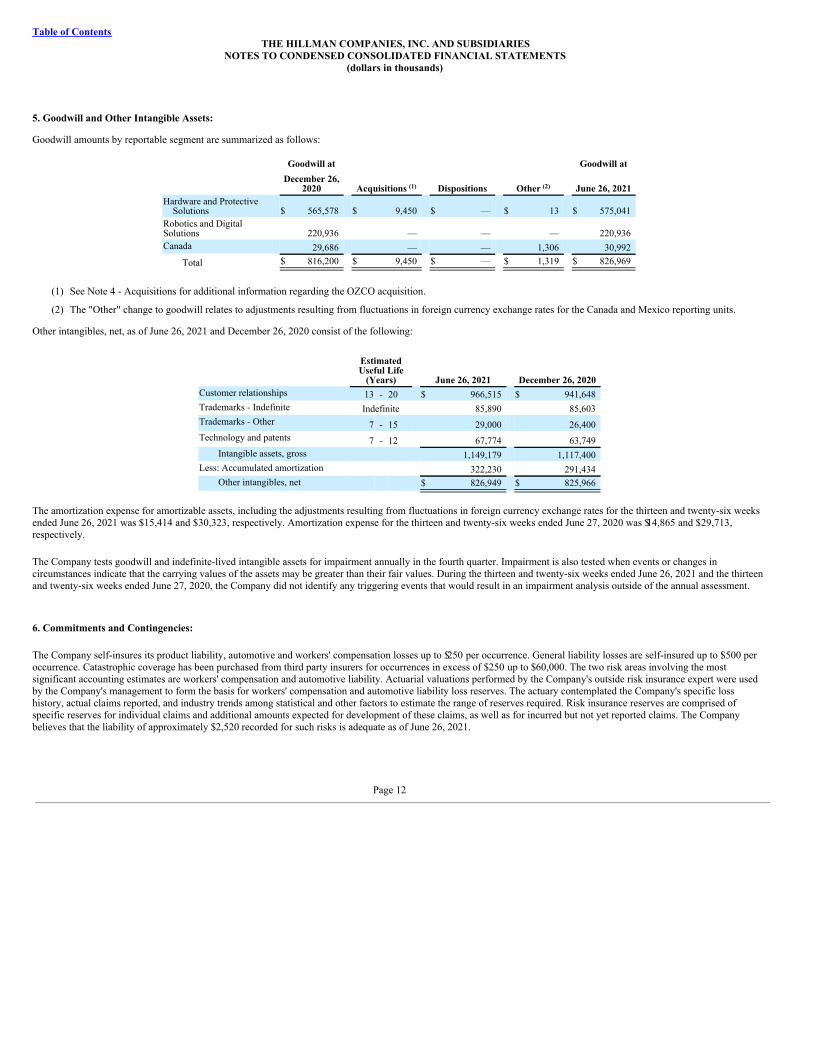
Table of ContentsTHE HILLMAN COMPANIES, INC. AND SUBSIDIARIES
NOTES TO CONDENSED CONSOLIDATED FINANCIAL STATEMENTS(dollars in thousands)
5. Goodwill and Other Intangible Assets:
Goodwill amounts by reportable segment are summarized as follows:
Goodwill at
Acquisitions Dispositions Other
Goodwill atDecember 26,
2020 June 26, 2021Hardware and Protective
Solutions $ 565,578 $ 9,450 $ — $ 13 $ 575,041 Robotics and DigitalSolutions 220,936 — — — 220,936 Canada 29,686 — — 1,306 30,992
Total $ 816,200 $ 9,450 $ — $ 1,319 $ 826,969
(1) See Note 4 - Acquisitions for additional information regarding the OZCO acquisition.
(2) The "Other" change to goodwill relates to adjustments resulting from fluctuations in foreign currency exchange rates for the Canada and Mexico reporting units.
Other intangibles, net, as of June 26, 2021 and December 26, 2020 consist of the following:
EstimatedUseful Life
(Years) June 26, 2021 December 26, 2020Customer relationships 13 - 20 $ 966,515 $ 941,648 Trademarks - Indefinite Indefinite 85,890 85,603 Trademarks - Other 7 - 15 29,000 26,400 Technology and patents 7 - 12 67,774 63,749
Intangible assets, gross 1,149,179 1,117,400 Less: Accumulated amortization 322,230 291,434
Other intangibles, net $ 826,949 $ 825,966
The amortization expense for amortizable assets, including the adjustments resulting from fluctuations in foreign currency exchange rates for the thirteen and twenty-six weeksended June 26, 2021 was $15,414 and $30,323, respectively. Amortization expense for the thirteen and twenty-six weeks ended June 27, 2020 was $14,865 and $29,713,respectively.
The Company tests goodwill and indefinite-lived intangible assets for impairment annually in the fourth quarter. Impairment is also tested when events or changes incircumstances indicate that the carrying values of the assets may be greater than their fair values. During the thirteen and twenty-six weeks ended June 26, 2021 and the thirteenand twenty-six weeks ended June 27, 2020, the Company did not identify any triggering events that would result in an impairment analysis outside of the annual assessment.
6. Commitments and Contingencies:
The Company self-insures its product liability, automotive and workers' compensation losses up to $250 per occurrence. General liability losses are self-insured up to $500 peroccurrence. Catastrophic coverage has been purchased from third party insurers for occurrences in excess of $250 up to $60,000. The two risk areas involving the mostsignificant accounting estimates are workers' compensation and automotive liability. Actuarial valuations performed by the Company's outside risk insurance expert were usedby the Company's management to form the basis for workers' compensation and automotive liability loss reserves. The actuary contemplated the Company's specific losshistory, actual claims reported, and industry trends among statistical and other factors to estimate the range of reserves required. Risk insurance reserves are comprised ofspecific reserves for individual claims and additional amounts expected for development of these claims, as well as for incurred but not yet reported claims. The Companybelieves that the liability of approximately $2,520 recorded for such risks is adequate as of June 26, 2021.
(1) (2)
Page 12
Table of ContentsTHE HILLMAN COMPANIES, INC. AND SUBSIDIARIES
NOTES TO CONDENSED CONSOLIDATED FINANCIAL STATEMENTS(dollars in thousands)
As of June 26, 2021, the Company has provided certain vendors and insurers letters of credit aggregating $27,908 related to our product purchases and insurance coverage forproduct liability, workers’ compensation, and general liability.
The Company self-insures group health claims up to an annual stop loss limit of $250 per participant. Historical group insurance loss experience forms the basis for therecognition of group health insurance reserves. Provisions for losses expected under these programs are recorded based on an analysis of historical insurance claim data andcertain actuarial assumptions. The Company believes that the liability of approximately $2,300 recorded for such risks is adequate as of June 26, 2021.
On June 3, 2019, The Hillman Group, Inc. ("Hillman Group") filed a complaint for patent infringement against KeyMe, LLC ("KeyMe"), a provider of self-service keyduplication kiosks, in the United States District Court for the Eastern District of Texas (Marshall Division). The case was assigned Civil Action No. 2:19-cv-0209. HillmanGroup’s complaint alleges that KeyMe’s self-named and “Locksmith in a Box” key duplication kiosks infringe U.S. Patent Nos. 8,979,446 and 9,914,179, which are assigned toHillman Group, and seeks damages and injunctive relief against KeyMe. After the United States Patent and Trademark Office issued U.S. Patent No. 10,400,474 to HillmanGroup on September 3, 2019, Hillman Group filed a motion the same day to amend its initial complaint to add the new patent to the litigation. The Texas court granted themotion on September 13, 2019. KeyMe filed two motions in the case on July 25, 2019, the first seeking to dismiss Hillman Group's complaint under Rule 12(b)(3) of theFederal Rules of Civil Procedure for improper venue, or in the alternative, to move the case from Marshall, Texas to the Southern District of New York. KeyMe’s secondmotion seeks to transfer the venue of the case from Texas to New York under 28 U.S.C. § 1404. Subsequently, Hillman Group filed a motion on September 4, 2019 todisqualify KeyMe's counsel Cooley LLP from the litigation due to Cooley's concurrent and prior representation of Hillman Group and predecessor-in-interest MinuteKeyHoldings, Inc ("MinuteKey"). Hillman Group served its initial infringement contentions for the patents-in-suit on KeyMe on September 6, 2019, and KeyMe served its initialinvalidity and unenforceability contentions for the patents-in-suit on Hillman Group on November 15, 2019. The parties filed a joint claim construction statement with the Courton January 31, 2020, setting forth the disputed constructions of terms and phrases recited in the asserted claims of the patents-in-suit. On February 14, 2020, the Court grantedHillman Group’s motion to disqualify Cooley LLP, and denied KeyMe’s pending venue-related motion to dismiss and motion to transfer without prejudice to refiling. The casewas stayed until March 30, 2020 to permit KeyMe to retain new legal counsel. The parties filed a joint status report on March 25, 2020, and on March 27, 2020, the Texas Courtset a new case schedule with a trial in early December 2020. On April 14, 2020, KeyMe re-filed a single motion to dismiss for improper venue, or in the alternative, to transferthe case to the Southern District of New York. After an oral hearing held on September 30, 2020, the Texas Court denied KeyMe’s motion to dismiss on November 13, 2020.
The Texas Court conducted a claim construction hearing in Marshall, TX, on June 23, 2020 to construe various disputed claim terms of the three patents-in-suit, and issued aclaim construction order on July 2, 2020. On August 31, 2020, KeyMe filed two motions for partial summary judgment on portions of the case, and also filed a motionobjecting to portions of the testimony of one of Hillman Group’s technical expert witnesses. At a pretrial conference held March 23, 2021, the Texas Court denied KeyMe'smotion to exclude expert testimony and KeyMe's motion for summary judgment of no willful infringement in full. KeyMe's motion for summary judgment of non-infringementrelating to U.S. Patent No. 10,400,474 was granted in-part and denied in-part; Hillman Group was permitted to proceed with a theory of infringement under the doctrine ofequivalents at trial.
On March 2, 2020, Hillman Group filed a second complaint for patent infringement against KeyMe in the same Texas Court, alleging that KeyMe’s key duplication kiosksinfringe Hillman Group’s U.S. Patent No. 10,577,830. The case was assigned Civil Action No. 2:20-cv-0070. Hillman Group added a second patent to the case, U.S. Patent No.10,628,813, upon that patent's issuance on April 21, 2020. Upon issuance of U.S. Patent No. 10,737,336 to Hillman Group on August 10, 2020, Hillman Group moved for leaveof Court to add that patent to the case; however, KeyMe opposed the motion.
KeyMe filed a motion to consolidate the two Texas patent cases involving KeyMe and Hillman Group on April 14, 2020. In addition, on April 30, 2020, KeyMe filed asubstantially identical motion to dismiss the case for improper venue, or in the alternative, to transfer the case to the Southern District of New York. The Texas Court heard oralargument on the motion to consolidate, the motion to dismiss, and Hillman Group’s motion to add the ’336 patent on September 30, 2020. On October 23, 2020, the TexasCourt granted KeyMe’s motion to consolidate the two Texas cases, and granted Hillman Group’s motion to add the ’336 patent. The Texas Court denied KeyMe’s motion todismiss on November 13, 2020. On November 18, 2020, the Texas Court issued a new case schedule for the consolidated case, setting a trial date of April 5, 2021 for the six-patent case. The parties stipulated in November, 2020 that no new claim construction hearing would be held, and that selected constructions from the 2:19-cv-209 action thatpertained to claims in the 2:20-cv-0070 action would govern. Fact discovery closed in the consolidated case on December 21, 2020, and expert discovery closed on January 22,2021.
Page 13

Table of ContentsTHE HILLMAN COMPANIES, INC. AND SUBSIDIARIES
NOTES TO CONDENSED CONSOLIDATED FINANCIAL STATEMENTS(dollars in thousands)
On January 25, 2021, KeyMe filed a second summary judgment motion for a judgment of no willful infringement, and also filed another motion objecting to portions of thetestimony of one of Hillman Group's technical expert witnesses. At a pretrial conference held March 23, 2021, the Texas Court denied both of KeyMe's motions in full.
On September 9, 2020, the parties conducted a mediation before Ret. District Judge David Folsom of the U.S. District Court of the Eastern District of Texas. Thoughsubstantive discussion took place, no agreement on resolution of the litigation was reached.
A jury trial was held in the Texas case from April 5-12, 2021 in Marshall, Texas. On April 12, 2021, the jury returned a verdict that KeyMe did not infringe any of the sixasserted patents, and several of the asserted claims were invalid. Final judgment was entered on April 13, 2021. Both parties filed renewed motions for judgment as a matter oflaw on issues they did not prevail on at trial on May 11, 2021, and Hillman Group additionally filed a motion for a new trial on the same date.
On August 16, 2019, KeyMe filed a complaint for patent infringement against Hillman Group in the United States District Court for the District of Delaware. KeyMe allegesthat Hillman Group’s KeyKrafter key duplication machines and MinuteKey self-service key duplication kiosks infringe KeyMe’s U.S. Patent No. 8,682,468 when thosemachines are used in conjunction with Hillman Group’s KeyHero system. Hillman Group filed an answer to KeyMe’s complaint on October 23, 2019, and assertedcounterclaims seeking declaratory judgments of invalidity and noninfringement of U.S. Patent No. 8,682,468. On May 4, 2020, the Delaware Court entered a scheduling ordersetting trial for November 2021. KeyMe served its initial infringement contentions on June 11, 2020, with Hillman Group serving its initial invalidity contentions on July 16,2020. The Delaware Court held a claim construction hearing on November 24, 2020, and issued its claim construction order on January 25, 2021. Fact discovery closed in theDelaware case on January 28, 2021. KeyMe served its final infringement contentions on January 4, 2021; Hillman Group served its final invalidity contentions on January 18,2021. Expert discovery closed on April 8, 2021. Following the close of discovery, Hillman Group filed a motion for summary judgment of noninfringement and no willfulinfringement in the case on April 15, 2021.
As of June 14, 2021, Hillman Group and KeyMe have globally resolved all pending legal disputes, including the Texas and Delaware district court actions discussed above.
On June 1, 2021, Hy-Ko Products Company LLC ("Hy-Ko"), a manufacturer of key duplication machines, filed a complaint for patent infringement against Hillman Group inthe United States District Court for the Eastern District of Texas (Marshall Division). The case was assigned Civil Action No. 2:21-cv-0197. Hy-Ko's complaint alleges thatHillman's KeyKrafter and PKOR key duplication machines infringe U.S. Patent Nos. 9,656,332, 9,682,432, 9,687,920, and 10,421,113, which are assigned to Hy-Ko, and seeksdamages and injunctive relief against Hillman Group. Hy-Ko's complaint additionally contains allegations of unfair competition under the Federal Lanham Act andconversion/receipt of stolen property, as well as a cause of action for "replevin" for return of stolen property.
Management and legal counsel for Hillman Group are still investigating this recent suit but are initially of the opinion that Hy-Ko's claims are without merit and Hillman Groupintends to vigorously defend the claims. Hillman Group is unable to estimate the possible loss or range of loss at this early stage in the case.
7. Related Party Transactions
The Company has recorded aggregate management fee charges and expenses from CCMP Capital Advisors, LLC (“CCMP”), Oak Hill Capital Partners III, L.P., Oak HillCapital Management Partners III, L.P. and OHCP III HC RO, L.P. (collectively, “Oak Hill Funds”) of $88 and $214 for the thirteen and twenty-six weeks ended June 26, 2021,respectively, and $196 and $321 for the thirteen and twenty-six weeks ended June 27, 2020, respectively.
Gregory Mann and Gabrielle Mann are employed by Hillman. The Company leases an industrial warehouse and office facility from companies under the control of the Manns.The rental expense for the lease of this facility was $88 and $176 for the thirteen and twenty-six weeks ended June 26, 2021, respectively, and was $88 and $175 for the thirteenand twenty-six weeks ended June 27, 2020, respectively.
Page 14
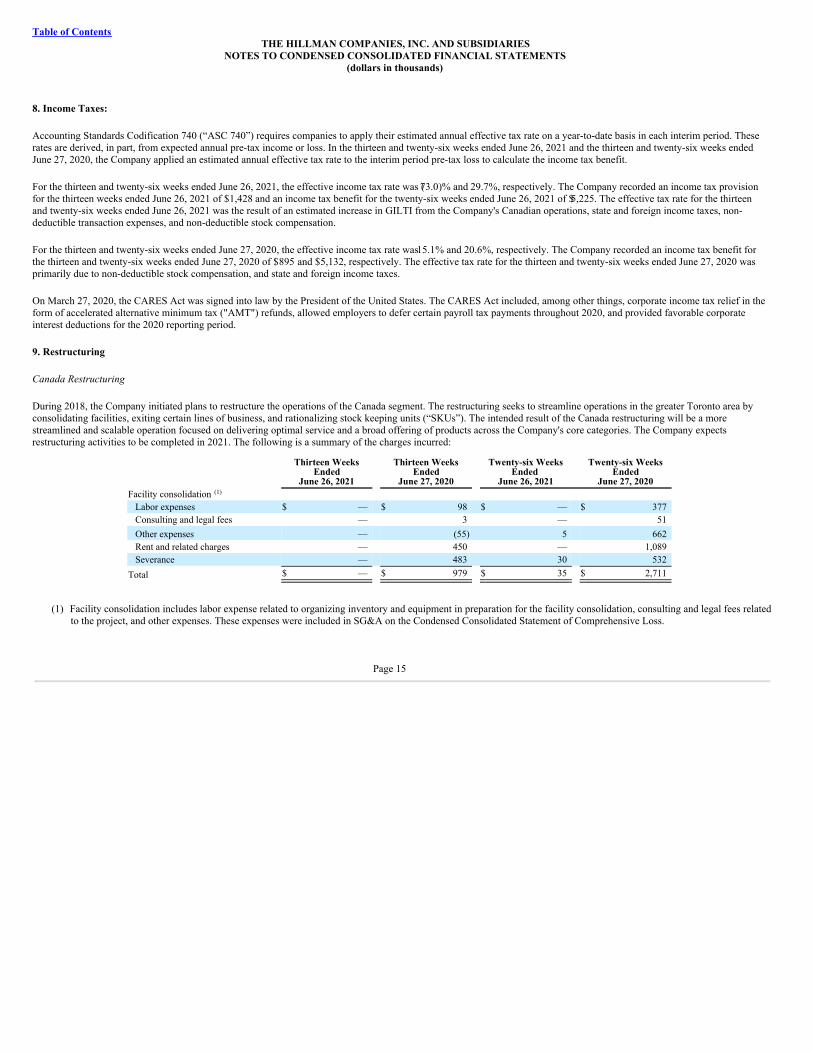
Table of ContentsTHE HILLMAN COMPANIES, INC. AND SUBSIDIARIES
NOTES TO CONDENSED CONSOLIDATED FINANCIAL STATEMENTS(dollars in thousands)
8. Income Taxes:
Accounting Standards Codification 740 (“ASC 740”) requires companies to apply their estimated annual effective tax rate on a year-to-date basis in each interim period. Theserates are derived, in part, from expected annual pre-tax income or loss. In the thirteen and twenty-six weeks ended June 26, 2021 and the thirteen and twenty-six weeks endedJune 27, 2020, the Company applied an estimated annual effective tax rate to the interim period pre-tax loss to calculate the income tax benefit.
For the thirteen and twenty-six weeks ended June 26, 2021, the effective income tax rate was (73.0)% and 29.7%, respectively. The Company recorded an income tax provisionfor the thirteen weeks ended June 26, 2021 of $1,428 and an income tax benefit for the twenty-six weeks ended June 26, 2021 of $5,225. The effective tax rate for the thirteenand twenty-six weeks ended June 26, 2021 was the result of an estimated increase in GILTI from the Company's Canadian operations, state and foreign income taxes, non-deductible transaction expenses, and non-deductible stock compensation.
For the thirteen and twenty-six weeks ended June 27, 2020, the effective income tax rate was 15.1% and 20.6%, respectively. The Company recorded an income tax benefit forthe thirteen and twenty-six weeks ended June 27, 2020 of $895 and $5,132, respectively. The effective tax rate for the thirteen and twenty-six weeks ended June 27, 2020 wasprimarily due to non-deductible stock compensation, and state and foreign income taxes.
On March 27, 2020, the CARES Act was signed into law by the President of the United States. The CARES Act included, among other things, corporate income tax relief in theform of accelerated alternative minimum tax ("AMT") refunds, allowed employers to defer certain payroll tax payments throughout 2020, and provided favorable corporateinterest deductions for the 2020 reporting period.
9. Restructuring
Canada Restructuring
During 2018, the Company initiated plans to restructure the operations of the Canada segment. The restructuring seeks to streamline operations in the greater Toronto area byconsolidating facilities, exiting certain lines of business, and rationalizing stock keeping units (“SKUs”). The intended result of the Canada restructuring will be a morestreamlined and scalable operation focused on delivering optimal service and a broad offering of products across the Company's core categories. The Company expectsrestructuring activities to be completed in 2021. The following is a summary of the charges incurred:
Thirteen WeeksEnded
June 26, 2021
Thirteen WeeksEnded
June 27, 2020
Twenty-six WeeksEnded
June 26, 2021
Twenty-six WeeksEnded
June 27, 2020Facility consolidation Labor expenses $ — $ 98 $ — $ 377 Consulting and legal fees — 3 — 51 Other expenses — (55) 5 662
Rent and related charges — 450 — 1,089 Severance — 483 30 532
Total $ — $ 979 $ 35 $ 2,711
(1) Facility consolidation includes labor expense related to organizing inventory and equipment in preparation for the facility consolidation, consulting and legal fees relatedto the project, and other expenses. These expenses were included in SG&A on the Condensed Consolidated Statement of Comprehensive Loss.
(1)
Page 15
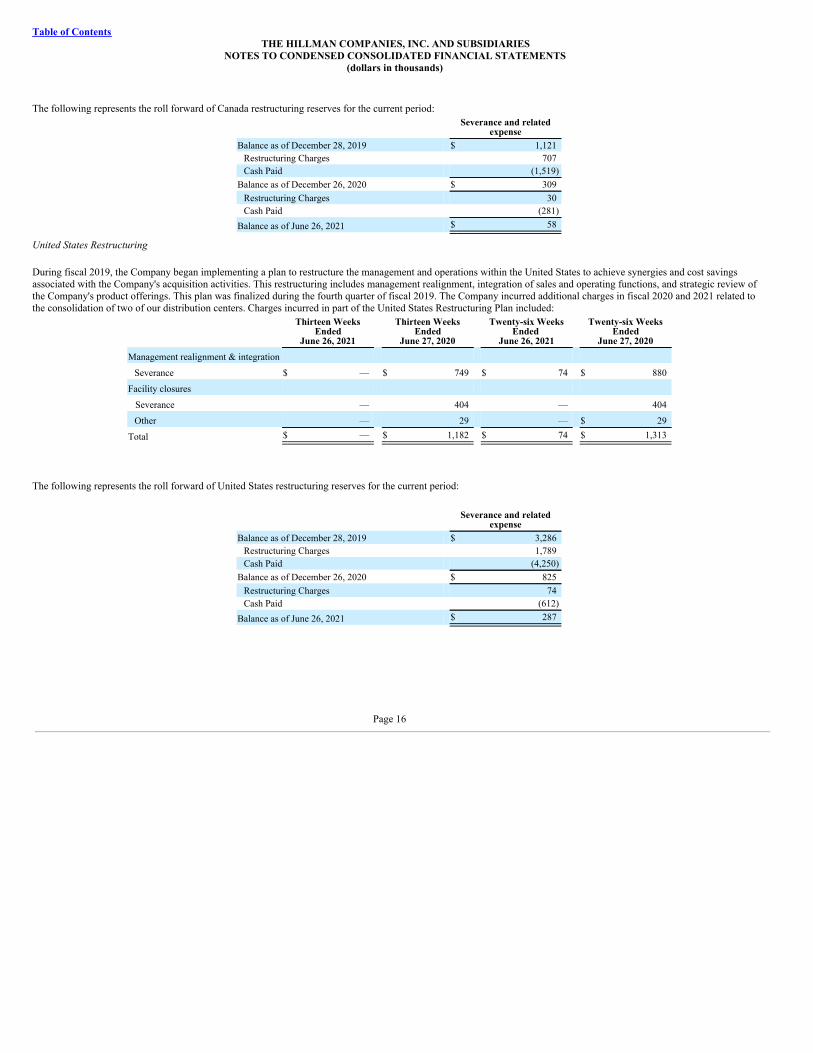
Table of ContentsTHE HILLMAN COMPANIES, INC. AND SUBSIDIARIES
NOTES TO CONDENSED CONSOLIDATED FINANCIAL STATEMENTS(dollars in thousands)
The following represents the roll forward of Canada restructuring reserves for the current period:Severance and related
expenseBalance as of December 28, 2019 $ 1,121
Restructuring Charges 707 Cash Paid (1,519)
Balance as of December 26, 2020 $ 309 Restructuring Charges 30 Cash Paid (281)
Balance as of June 26, 2021 $ 58
United States Restructuring
During fiscal 2019, the Company began implementing a plan to restructure the management and operations within the United States to achieve synergies and cost savingsassociated with the Company's acquisition activities. This restructuring includes management realignment, integration of sales and operating functions, and strategic review ofthe Company's product offerings. This plan was finalized during the fourth quarter of fiscal 2019. The Company incurred additional charges in fiscal 2020 and 2021 related tothe consolidation of two of our distribution centers. Charges incurred in part of the United States Restructuring Plan included:
Thirteen WeeksEnded
June 26, 2021
Thirteen WeeksEnded
June 27, 2020
Twenty-six WeeksEnded
June 26, 2021
Twenty-six WeeksEnded
June 27, 2020
Management realignment & integration
Severance $ — $ 749 $ 74 $ 880
Facility closures
Severance — 404 — 404
Other — 29 — $ 29
Total $ — $ 1,182 $ 74 $ 1,313
The following represents the roll forward of United States restructuring reserves for the current period:
Severance and relatedexpense
Balance as of December 28, 2019 $ 3,286 Restructuring Charges 1,789 Cash Paid (4,250)
Balance as of December 26, 2020 $ 825 Restructuring Charges 74 Cash Paid (612)
Balance as of June 26, 2021 $ 287
Page 16

Table of ContentsTHE HILLMAN COMPANIES, INC. AND SUBSIDIARIES
NOTES TO CONDENSED CONSOLIDATED FINANCIAL STATEMENTS(dollars in thousands)
10. Long Term Debt:
The following table summarizes the Company’s debt:
June 26, 2021 December 26, 2020
Revolving loans $ 158,000 $ 72,000
Senior term loan, due 2025 1,066,740 1,037,044
6.375% Senior Notes, due 2022 330,000 330,000
11.6% Junior Subordinated Debentures - Preferred 105,443 105,443
Junior Subordinated Debentures - Common 3,261 3,261
Capital & finance leases 1,773 2,044
1,665,217 1,549,792 Unamortized premium on 11.6% Junior SubordinatedDebentures 13,777 14,591
Unamortized discount on Senior term loan (5,783) (6,532)Current portion of long term debt, capital leases and financeleases (11,442) (11,481)
Deferred financing fees (10,293) (10,862)
Total long term debt, net $ 1,651,476 $ 1,535,508
As of June 26, 2021, there was $1,066,740 outstanding under the 2018 Term Loan. As of June 26, 2021, the Company had $158,000 outstanding under the ABL Revolver alongwith $27,908 of letters of credit. The Company has approximately $64,092 of available borrowings under the ABL Revolver as a source of liquidity.
On April 16, 2021, the Company acquired Oz Post International, LLC ("OZCO"). The Company entered into an amendment ("OZCO Amendment") to the term loan creditagreement dated May 31, 2018 (the "2018 Term Loan"), which provided $35,000 of incremental term loan funds to be used to finance the acquisition. See Note 4 - Acquisitionsfor additional information regarding the OZCO acquisition.
Additional information with respect to the fair value of the Company’s fixed rate senior notes and junior subordinated debentures is included in Note 13 - Fair ValueMeasurements.
11. Leases
Lessee
The Company determines if a contract is or contains a lease at inception or modification of a contract. A contract is or contains a lease if the contract conveys the right tocontrol the use of an identified asset for a period in exchange for consideration. Control over the use of the identified asset means the lessee has both (a) the right to obtainsubstantially all of the economic benefits from the use of the asset and (b) the right to direct the use of the asset. The Company leases certain distribution center locations,vehicles, forklifts, computer equipment, and its corporate headquarters with expiration dates through 2032. Certain lease arrangements include escalating rent payments andoptions to extend the lease term. Expected lease terms include these options to extend or terminate the lease when it is reasonably certain the Company will exercise the option.The Company's leasing arrangements do not contain material residual value guarantees nor material restrictive covenants.
Page 17

Table of ContentsTHE HILLMAN COMPANIES, INC. AND SUBSIDIARIES
NOTES TO CONDENSED CONSOLIDATED FINANCIAL STATEMENTS(dollars in thousands)
The components of operating and finance lease cost for the thirteen and twenty-six weeks ended June 26, 2021 and thirteen and twenty-six weeks ended June 27, 2020 were asfollows:
Thirteen WeeksEnded
June 26, 2021
Twenty-sixWeeks Ended June 26, 2021
Thirteen WeeksEnded
June 27, 2020
Twenty-six WeeksEnded
June 27, 2020Operating lease cost $ 5,149 $ 10,243 $ 4,547 $ 9,294 Short term lease costs 1,100 1,986 528 1,049 Variable lease costs 453 757 491 671 Finance lease cost:
Amortization of right of useassets 224 438 200 402 Interest on lease liabilities 32 67 36 72
Rent expense totaled $6,702 and $12,986 in the thirteen and twenty-six weeks ended June 26, 2021, respectively, and $5,566 and $11,014 in the thirteen and twenty-six weeksended June 27, 2020, respectively. Rent expense includes operating lease cost as well as expense for non-lease components such as common area maintenance, real estate taxes,real estate insurance, variable costs related to our leased vehicles and also short-term rental expenses.
The implicit rate is not determinable in most of the Company’s leases, as such management uses the Company’s incremental borrowing rate based on the information availableat commencement date in determining the present value of future payments. The weighted average remaining lease terms and discount rates for all of our operating and financeleases were as follows as of June 26, 2021 and December 26, 2020:
June 26, 2021 December 26, 2020Operating
Leases Finance LeasesOperating
Leases Finance LeasesWeighted average remaining leaseterm 7.09 2.47 7.19 2.61
Weighted average discount rate 8.20% 7.15% 8.28% 7.14%
Supplemental balance sheet information related to the Company's finance leases was as follows as of June 26, 2021 and December 26, 2020:
June 26, 2021 December 26, 2020Finance lease assets, net, included inproperty plant and equipment $ 1,783 $ 1,919
Current portion of long-term debt 833 872
Long-term debt, less current portion 940 1,172
Total principal payable on finance leases 1,773 2,044
Supplemental cash flow information related to the Company's operating leases was as follows for the twenty-six weeks ended June 26, 2021 and twenty-six weeks ended June27, 2020:
Twenty-six WeeksEnded
June 26, 2021
Twenty-six WeeksEnded
June 27, 2020Cash paid for amounts included in the measurement of leaseliabilities:
Operating cash outflow from operating leases $ 9,778 $ 8,956 Operating cash outflow from finance leases 68 72 Financing cash outflow from finance leases 460 411
Page 18
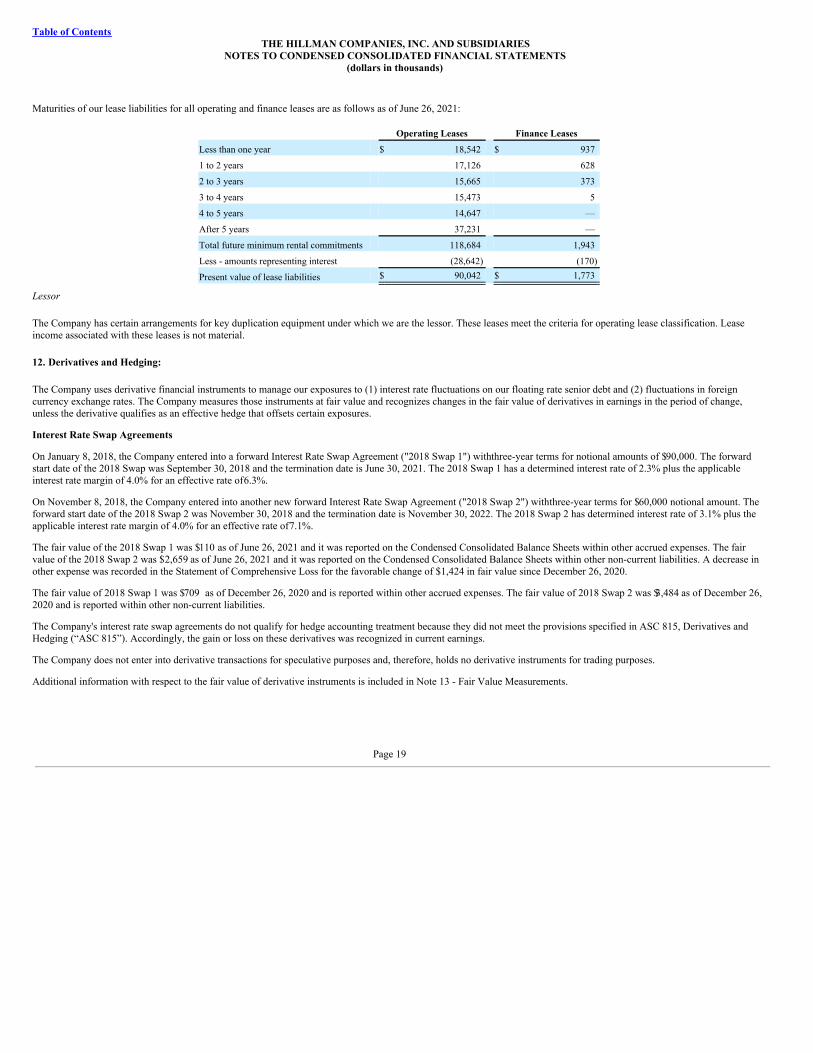
Table of ContentsTHE HILLMAN COMPANIES, INC. AND SUBSIDIARIES
NOTES TO CONDENSED CONSOLIDATED FINANCIAL STATEMENTS(dollars in thousands)
Maturities of our lease liabilities for all operating and finance leases are as follows as of June 26, 2021:
Operating Leases Finance Leases
Less than one year $ 18,542 $ 937
1 to 2 years 17,126 628
2 to 3 years 15,665 373
3 to 4 years 15,473 5
4 to 5 years 14,647 —
After 5 years 37,231 —
Total future minimum rental commitments 118,684 1,943
Less - amounts representing interest (28,642) (170)
Present value of lease liabilities $ 90,042 $ 1,773
Lessor
The Company has certain arrangements for key duplication equipment under which we are the lessor. These leases meet the criteria for operating lease classification. Leaseincome associated with these leases is not material.
12. Derivatives and Hedging:
The Company uses derivative financial instruments to manage our exposures to (1) interest rate fluctuations on our floating rate senior debt and (2) fluctuations in foreigncurrency exchange rates. The Company measures those instruments at fair value and recognizes changes in the fair value of derivatives in earnings in the period of change,unless the derivative qualifies as an effective hedge that offsets certain exposures.
Interest Rate Swap Agreements
On January 8, 2018, the Company entered into a forward Interest Rate Swap Agreement ("2018 Swap 1") with three-year terms for notional amounts of $90,000. The forwardstart date of the 2018 Swap was September 30, 2018 and the termination date is June 30, 2021. The 2018 Swap 1 has a determined interest rate of 2.3% plus the applicableinterest rate margin of 4.0% for an effective rate of 6.3%.
On November 8, 2018, the Company entered into another new forward Interest Rate Swap Agreement ("2018 Swap 2") with three-year terms for $60,000 notional amount. Theforward start date of the 2018 Swap 2 was November 30, 2018 and the termination date is November 30, 2022. The 2018 Swap 2 has determined interest rate of 3.1% plus theapplicable interest rate margin of 4.0% for an effective rate of 7.1%.
The fair value of the 2018 Swap 1 was $110 as of June 26, 2021 and it was reported on the Condensed Consolidated Balance Sheets within other accrued expenses. The fairvalue of the 2018 Swap 2 was $2,659 as of June 26, 2021 and it was reported on the Condensed Consolidated Balance Sheets within other non-current liabilities. A decrease inother expense was recorded in the Statement of Comprehensive Loss for the favorable change of $1,424 in fair value since December 26, 2020.
The fair value of 2018 Swap 1 was $709 as of December 26, 2020 and is reported within other accrued expenses. The fair value of 2018 Swap 2 was $3,484 as of December 26,2020 and is reported within other non-current liabilities.
The Company's interest rate swap agreements do not qualify for hedge accounting treatment because they did not meet the provisions specified in ASC 815, Derivatives andHedging (“ASC 815”). Accordingly, the gain or loss on these derivatives was recognized in current earnings.
The Company does not enter into derivative transactions for speculative purposes and, therefore, holds no derivative instruments for trading purposes.
Additional information with respect to the fair value of derivative instruments is included in Note 13 - Fair Value Measurements.
Page 19
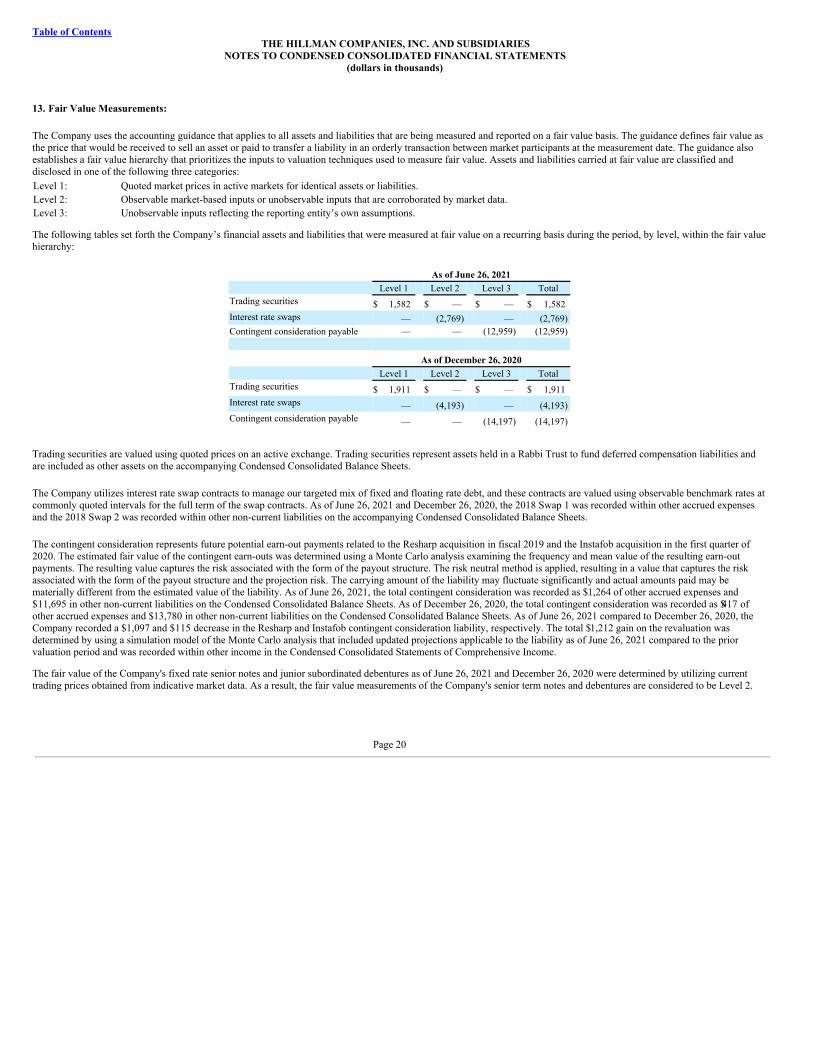
Table of ContentsTHE HILLMAN COMPANIES, INC. AND SUBSIDIARIES
NOTES TO CONDENSED CONSOLIDATED FINANCIAL STATEMENTS(dollars in thousands)
13. Fair Value Measurements:
The Company uses the accounting guidance that applies to all assets and liabilities that are being measured and reported on a fair value basis. The guidance defines fair value asthe price that would be received to sell an asset or paid to transfer a liability in an orderly transaction between market participants at the measurement date. The guidance alsoestablishes a fair value hierarchy that prioritizes the inputs to valuation techniques used to measure fair value. Assets and liabilities carried at fair value are classified anddisclosed in one of the following three categories:Level 1: Quoted market prices in active markets for identical assets or liabilities.Level 2: Observable market-based inputs or unobservable inputs that are corroborated by market data.Level 3: Unobservable inputs reflecting the reporting entity’s own assumptions.
The following tables set forth the Company’s financial assets and liabilities that were measured at fair value on a recurring basis during the period, by level, within the fair valuehierarchy:
As of June 26, 2021 Level 1 Level 2 Level 3 TotalTrading securities $ 1,582 $ — $ — $ 1,582 Interest rate swaps — (2,769) — (2,769)Contingent consideration payable — — (12,959) (12,959)
As of December 26, 2020 Level 1 Level 2 Level 3 TotalTrading securities $ 1,911 $ — $ — $ 1,911 Interest rate swaps — (4,193) — (4,193)Contingent consideration payable — — (14,197) (14,197)
Trading securities are valued using quoted prices on an active exchange. Trading securities represent assets held in a Rabbi Trust to fund deferred compensation liabilities andare included as other assets on the accompanying Condensed Consolidated Balance Sheets.
The Company utilizes interest rate swap contracts to manage our targeted mix of fixed and floating rate debt, and these contracts are valued using observable benchmark rates atcommonly quoted intervals for the full term of the swap contracts. As of June 26, 2021 and December 26, 2020, the 2018 Swap 1 was recorded within other accrued expensesand the 2018 Swap 2 was recorded within other non-current liabilities on the accompanying Condensed Consolidated Balance Sheets.
The contingent consideration represents future potential earn-out payments related to the Resharp acquisition in fiscal 2019 and the Instafob acquisition in the first quarter of2020. The estimated fair value of the contingent earn-outs was determined using a Monte Carlo analysis examining the frequency and mean value of the resulting earn-outpayments. The resulting value captures the risk associated with the form of the payout structure. The risk neutral method is applied, resulting in a value that captures the riskassociated with the form of the payout structure and the projection risk. The carrying amount of the liability may fluctuate significantly and actual amounts paid may bematerially different from the estimated value of the liability. As of June 26, 2021, the total contingent consideration was recorded as $1,264 of other accrued expenses and$11,695 in other non-current liabilities on the Condensed Consolidated Balance Sheets. As of December 26, 2020, the total contingent consideration was recorded as $417 ofother accrued expenses and $13,780 in other non-current liabilities on the Condensed Consolidated Balance Sheets. As of June 26, 2021 compared to December 26, 2020, theCompany recorded a $1,097 and $115 decrease in the Resharp and Instafob contingent consideration liability, respectively. The total $1,212 gain on the revaluation wasdetermined by using a simulation model of the Monte Carlo analysis that included updated projections applicable to the liability as of June 26, 2021 compared to the priorvaluation period and was recorded within other income in the Condensed Consolidated Statements of Comprehensive Income.
The fair value of the Company's fixed rate senior notes and junior subordinated debentures as of June 26, 2021 and December 26, 2020 were determined by utilizing currenttrading prices obtained from indicative market data. As a result, the fair value measurements of the Company's senior term notes and debentures are considered to be Level 2.
Page 20
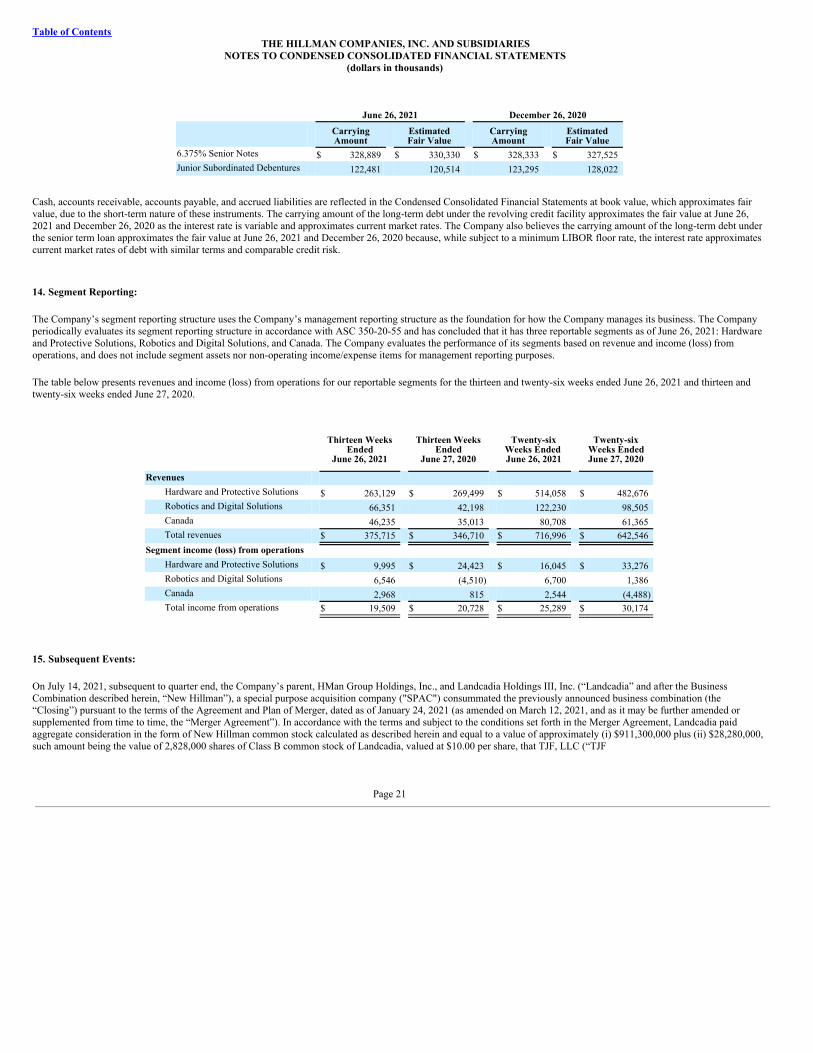
Table of ContentsTHE HILLMAN COMPANIES, INC. AND SUBSIDIARIES
NOTES TO CONDENSED CONSOLIDATED FINANCIAL STATEMENTS(dollars in thousands)
June 26, 2021 December 26, 2020
CarryingAmount
EstimatedFair Value
CarryingAmount
EstimatedFair Value
6.375% Senior Notes $ 328,889 $ 330,330 $ 328,333 $ 327,525 Junior Subordinated Debentures 122,481 120,514 123,295 128,022
Cash, accounts receivable, accounts payable, and accrued liabilities are reflected in the Condensed Consolidated Financial Statements at book value, which approximates fairvalue, due to the short-term nature of these instruments. The carrying amount of the long-term debt under the revolving credit facility approximates the fair value at June 26,2021 and December 26, 2020 as the interest rate is variable and approximates current market rates. The Company also believes the carrying amount of the long-term debt underthe senior term loan approximates the fair value at June 26, 2021 and December 26, 2020 because, while subject to a minimum LIBOR floor rate, the interest rate approximatescurrent market rates of debt with similar terms and comparable credit risk.
14. Segment Reporting:
The Company’s segment reporting structure uses the Company’s management reporting structure as the foundation for how the Company manages its business. The Companyperiodically evaluates its segment reporting structure in accordance with ASC 350-20-55 and has concluded that it has three reportable segments as of June 26, 2021: Hardwareand Protective Solutions, Robotics and Digital Solutions, and Canada. The Company evaluates the performance of its segments based on revenue and income (loss) fromoperations, and does not include segment assets nor non-operating income/expense items for management reporting purposes.
The table below presents revenues and income (loss) from operations for our reportable segments for the thirteen and twenty-six weeks ended June 26, 2021 and thirteen andtwenty-six weeks ended June 27, 2020.
Thirteen WeeksEnded
June 26, 2021
Thirteen WeeksEnded
June 27, 2020
Twenty-sixWeeks Ended June 26, 2021
Twenty-sixWeeks EndedJune 27, 2020
RevenuesHardware and Protective Solutions $ 263,129 $ 269,499 $ 514,058 $ 482,676 Robotics and Digital Solutions 66,351 42,198 122,230 98,505 Canada 46,235 35,013 80,708 61,365 Total revenues $ 375,715 $ 346,710 $ 716,996 $ 642,546
Segment income (loss) from operationsHardware and Protective Solutions $ 9,995 $ 24,423 $ 16,045 $ 33,276 Robotics and Digital Solutions 6,546 (4,510) 6,700 1,386 Canada 2,968 815 2,544 (4,488)Total income from operations $ 19,509 $ 20,728 $ 25,289 $ 30,174
15. Subsequent Events:
On July 14, 2021, subsequent to quarter end, the Company’s parent, HMan Group Holdings, Inc., and Landcadia Holdings III, Inc. (“Landcadia” and after the BusinessCombination described herein, “New Hillman”), a special purpose acquisition company ("SPAC") consummated the previously announced business combination (the“Closing”) pursuant to the terms of the Agreement and Plan of Merger, dated as of January 24, 2021 (as amended on March 12, 2021, and as it may be further amended orsupplemented from time to time, the “Merger Agreement”). In accordance with the terms and subject to the conditions set forth in the Merger Agreement, Landcadia paidaggregate consideration in the form of New Hillman common stock calculated as described herein and equal to a value of approximately (i) $911,300,000 plus (ii) $28,280,000,such amount being the value of 2,828,000 shares of Class B common stock of Landcadia, valued at $10.00 per share, that TJF, LLC (“TJF
Page 21
Table of ContentsTHE HILLMAN COMPANIES, INC. AND SUBSIDIARIES
NOTES TO CONDENSED CONSOLIDATED FINANCIAL STATEMENTS(dollars in thousands)
Sponsor”) and Jefferies Financial Group Inc., (“JFG Sponsor” and, together with TJF Sponsor, the “Sponsors”) agreed to forfeit at the Closing.
In connection with the Closing, the Company entered into a new credit agreement with Jefferies Finance LLC, as administrative agent, and the lenders and other parties thereto(the “Term Credit Agreement”), which provided for a new funded term loan facility of $835.0 million and a delayed draw term loan facility of $200.0 million (of which $16.0million was drawn). The Company also also entered into an amendment to their existing asset-based revolving credit agreement (the “ABL Amendment”) with Barclays BankPLC, as administrative agent, and the lenders and other parties thereto (the “ABL Credit Agreement”), increasing the aggregate commitments thereunder to $250.0 million,extended the maturity and conformed certain provisions to the Term Credit Agreement. The proceeds of the funded term loans under the Term Credit Agreement and revolvingcredit loans under the ABL Credit Agreement were used, together with other available cash, to (1) refinance in full all outstanding term loans and to terminate all outstandingcommitments under the credit agreement, dated as of May 31, 2018, (2) refinance outstanding revolving credit loans, and (3) redeem in full senior notes due July 15, 2022 (the“6.375% Senior Notes”).
In anticipation of the Business Combination and the refinancings described above, on July 13, 2021, the Company delivered a notice to redeem in full 11.6% JuniorSubordinated Debentures due September 30, 2027 (the “Junior Subordinated Debentures”) issued under the Indenture, dated as of September 5, 1997 (as amended andsupplemented, the “Debentures Indenture”), between The Hillman Companies and The Bank of New York Mellon, a New York banking corporation, as Trustee (the “Trustee”)and deposited an amount with the Trustee sufficient to satisfy and discharge the Debentures Indenture, which is no longer in effect. Notices to redeem 4,217,837 trust preferredsecurities (the “Trust Preferred Securities”) issued in a public offering by the Hillman Group Capital Trust ("Trust") and 130,449 of trust common securities (the “TrustCommon Securities”) issued by the Trust to Hillman Companies were also delivered on July 13, 2021. Upon the payment of the redemption price for the Debentures on August12, 2021, the Trust will redeem the Trust Preferred Securities and the Trust Common Securities, which as of August 12, 2021 will no longer be deemed to be outstanding. Thelast day of trading for the Trust Preferred Securities on the New York Stock Exchange (the “NYSE”) will be August 11, 2021 and the Company is voluntarily delisting the TrustPreferred Securities from the NYSE.
Page 22
Item 2.
MANAGEMENT’S DISCUSSION AND ANALYSIS OF FINANCIAL CONDITIONAND RESULTS OF OPERATIONS
The following discussion provides information which the Company’s management believes is relevant to an assessment and understanding of the Company’s operations andfinancial condition. This discussion should be read in conjunction with the condensed consolidated financial statements and accompanying notes in addition to the consolidatedstatements and notes thereto included in the Company’s Annual Report on Form 10-K for the year ended December 26, 2020.
Forward-Looking Statements
Certain disclosures related to acquisitions, refinancing, capital expenditures, resolution of pending litigation, and realization of deferred tax assets contained in this quarterlyreport involve substantial risks and uncertainties and may constitute forward-looking statements within the meaning of the Private Securities Litigation Reform Act of 1995, asamended. In some cases, you can identify forward-looking statements by terminology such as “may,” “will,” “should,” “could,” “would,” “expect,” “plan,” “anticipate,”“believe,” “estimate,” “continue,” “project,” or the negative of such terms or other similar expressions.
These forward-looking statements are not historical facts, but rather are based on management’s current expectations, assumptions, and projections about future events.Although management believes that the expectations, assumptions, and projections on which these forward-looking statements are based are reasonable, they nonetheless couldprove to be inaccurate, and as a result, the forward-looking statements based on those expectations, assumptions, and projections also could be inaccurate. Forward-lookingstatements are not guarantees of future performance. Instead, forward-looking statements are subject to known and unknown risks, uncertainties, and assumptions that maycause the Company’s strategy, planning, actual results, levels of activity, performance, or achievements to be materially different from any strategy, planning, future results,levels of activity, performance, or achievements expressed or implied by such forward-looking statements. Actual results could differ materially from those currently anticipatedas a result of a number of factors, including the risks and uncertainties discussed under the caption “Risk Factors” set forth in Item 1A of the Company’s Annual Report onForm 10-K for the year ended December 26, 2020. Given these uncertainties, current or prospective investors are cautioned not to place undue reliance on any such forward-looking statements.
All forward-looking statements attributable to the Company or persons acting on our behalf are expressly qualified in their entirety by the cautionary statements included in thisreport and the risks and uncertainties discussed under the caption “Risk Factors” set forth in Item 1A of the Company’s Annual Report on Form 10-K for the year endedDecember 26, 2020; they should not be regarded as a representation by the Company or any other individual. We undertake no obligation to update publicly or revise anyforward-looking statements, whether as a result of new information, future events, or otherwise. In light of these risks, uncertainties, and assumptions, the forward-lookingevents discussed in this report might not occur or be materially different from those discussed.
Page 23
General
The Hillman Companies, Inc. and its wholly-owned subsidiaries (collectively, "Hillman" or "Company") are one of the largest providers of hardware-related products andrelated merchandising services to retail markets in North America. Our principal business is operated through the wholly-owned subsidiary, The Hillman Group, Inc. and itswholly-owned subsidiaries (collectively, “Hillman Group”). Hillman Group sells its products to hardware stores, home centers, mass merchants, pet supply stores, and otherretail outlets principally in the United States, Canada, Mexico, Latin America, and the Caribbean. Product lines include thousands of small parts such as fasteners and relatedhardware items; threaded rod and metal shapes; keys, key duplication systems, and accessories; builder's hardware; personal protective equipment; and identification items, suchas tags and letters, numbers, and signs. We support our product sales with services that include design and installation of merchandising systems and maintenance of appropriatein-store inventory levels.
On July 14, 2021, subsequent to quarter end, the Company’s parent, HMan Group Holdings, Inc., and Landcadia Holdings III, Inc. (“Landcadia” and after the BusinessCombination described herein, “New Hillman”), a special purpose acquisition company ("SPAC") consummated the previously announced business combination (the“Closing”) pursuant to the terms of the Agreement and Plan of Merger, dated as of January 24, 2021 (as amended on March 12, 2021, and as it may be further amended orsupplemented from time to time, the “Merger Agreement”). In accordance with the terms and subject to the conditions set forth in the Merger Agreement, Landcadia paidaggregate consideration in the form of New Hillman common stock calculated as described herein and equal to a value of approximately (i) $911,300,000 plus (ii) $28,280,000,such amount being the value of 2,828,000 shares of Class B common stock of Landcadia, valued at $10.00 per share, that TJF, LLC (“TJF Sponsor”) and Jefferies FinancialGroup Inc., (“JFG Sponsor” and, together with TJF Sponsor, the “Sponsors”) agreed to forfeit at the Closing.
In connection with the Closing, the Company entered into a new credit agreement with Jefferies Finance LLC, as administrative agent, and the lenders and other parties thereto(the “Term Credit Agreement”), which provided for a new funded term loan facility of $835.0 million and a delayed draw term loan facility of $200.0 million (of which $16.0million was drawn). The Company also also entered into an amendment to their existing asset-based revolving credit agreement (the “ABL Amendment”) with Barclays BankPLC, as administrative agent, and the lenders and other parties thereto (the “ABL Credit Agreement”), increasing the aggregate commitments thereunder to $250.0 million,extended the maturity and conformed certain provisions to the Term Credit Agreement. The proceeds of the funded term loans under the Term Credit Agreement and revolvingcredit loans under the ABL Credit Agreement were used, together with other available cash, to (1) refinance in full all outstanding term loans and to terminate all outstandingcommitments under the credit agreement, dated as of May 31, 2018, (2) refinance outstanding revolving credit loans, and (3) redeem in full senior notes due July 15, 2022 (the“6.375% Senior Notes”).
In anticipation of the Business Combination and the refinancings described above, on July 13, 2021, the Company delivered a notice to redeem in full 11.6% JuniorSubordinated Debentures due September 30, 2027 (the “Junior Subordinated Debentures”) issued under the Indenture, dated as of September 5, 1997 (as amended andsupplemented, the “Debentures Indenture”), between The Hillman Companies and The Bank of New York Mellon, a New York banking corporation, as Trustee (the “Trustee”)and deposited an amount with the Trustee sufficient to satisfy and discharge the Debentures Indenture, which is no longer in effect. Notices to redeem 4,217,837 trust preferredsecurities (the “Trust Preferred Securities”) issued in a public offering by the Hillman Group Capital Trust ("Trust") and 130,449 of trust common securities (the “TrustCommon Securities”) issued by the Trust to Hillman Companies were also delivered on July 13, 2021. Upon the payment of the redemption price for the Debentures on August12, 2021, the Trust will redeem the Trust Preferred Securities and the Trust Common Securities, which as of August 12, 2021 will no longer be deemed to be outstanding. Thelast day of trading for the Trust Preferred Securities on the New York Stock Exchange (the “NYSE”) will be August 11, 2021 and the Company is voluntarily delisting the TrustPreferred Securities from the NYSE.
On April 16, 2021, the Company completed the acquisition of Oz Post International, LLC ("OZCO"), a leading manufacturer of superior quality hardware that offers structuralfasteners and connectors used for decks, fences and other outdoor structures, for a total purchase price of $39,102. The Company entered into an amendment ("OZCOAmendment") to the term loan credit agreement dated May 31, 2018 (the "2018 Term Loan"), which provided $35,000 of incremental term loan funds to be used to finance theacquisition. Refer to Note 4 - Acquisitions for additional information.
Page 24
Current Economic Conditions
Our business is impacted by general economic conditions in the North American and international markets, particularly the U.S. and Canadian retail markets including hardwarestores, home centers, mass merchants, and other retailers.
In December 2019, a novel strain of coronavirus (COVID-19) was reported to have surfaced in Wuhan, China, and has since spread to a number of other countries, includingthe United States and Canada. In March 2020, the World Health Organization characterized COVID-19 as a pandemic. Efforts to contain the spread of COVID-19 intensifiedduring our fiscal 2020 second quarter and remained in effect throughout our third quarter. Most states and municipalities within the U.S. enacted temporary closures ofbusinesses, issued quarantine orders and took other restrictive measures in response to the COVID-19 pandemic. Within the United States and Canada, our business has beendesignated an essential business, which allows us to continue to serve customers that remain open.
While all of our operations are located in North America, we participate in a global supply chain, and the existence of a worldwide pandemic and the reactions of governmentsaround the world in response to COVID-19 to regulate the flow of labor and products began to impact our business in March 2020. If we need to close any of our facilities or acritical number of our employees become too ill to work, our distribution network could be materially adversely affected in a rapid manner. Similarly, if our customersexperience adverse business consequences due to COVID-19, demand for our products could also be materially adversely affected in a rapid manner. The Company continues toexperience customer demand both during the thirteen and twenty-six weeks ended June 26, 2021 and during the subsequent period. Our teams continue to monitor demanddisruption and there can be no assurance as to the level of demand that will prevail through the remainder of fiscal 2021. A large portion of our customers continue to operateand sell our products, with some customers reducing operations or restricting some access to portions of the retail space. The magnitude of the financial impact on our quarterlyand annual results is dependent on the duration of the COVID-19 pandemic and how quickly the U.S. and Canada economies resume normal operations.
An extended period of global supply chain, workforce availability, and economic disruption could materially affect the Company's business, the results of operations, financialcondition, access to sources of liquidity, and the carrying value of goodwill and intangible assets. While a triggering event did not occur during the thirteen and twenty-sixweeks ended June 26, 2021, a prolonged COVID-19 pandemic could negatively impact net sales growth, change key assumptions and other global and regional macroeconomicfactors that could result in future impairment charges for goodwill, indefinite-lived intangible assets and definite lived intangible assets. The impact of the COVID-19 pandemicis fluid and continues to evolve, and therefore, we cannot predict the extent to which our business, results of operations, financial condition, or liquidity will ultimately beimpacted.
We are exposed to the risk of unfavorable changes in foreign currency exchange rates for the U.S. dollar versus local currency of our suppliers located primarily in China andTaiwan. We purchase a significant variety of our products for resale from multiple vendors located in China and Taiwan. The purchase price of these products is routinelynegotiated in U.S. dollar amounts rather than the local currency of the vendors and our suppliers' profit margins decrease when the U.S. dollar declines in value relative to thelocal currency. This puts pressure on our suppliers to increase prices to us. The U.S. dollar increased in value relative to the CNY by approximately 1.7% in 2019, declined by6.5% in 2020, and declined by 1.3% during the twenty-six weeks ended June 26, 2021. The U.S. dollar declined in value relative to the Taiwan dollar by approximately 0.2% in2019, declined by 7.9% in 2020, and declined by 0.8% during the twenty-six weeks ended June 26, 2021.
In addition, the negotiated purchase price of our products may be dependent upon market fluctuations in the cost of raw materials such as steel, zinc, and nickel used by ourvendors in their manufacturing processes. The final purchase cost of our products may also be dependent upon inflation or deflation in the local economies of vendors in Chinaand Taiwan that could impact the cost of labor used in the manufacturing of our products. We identify the directional impact of changes in our product cost, but thequantification of each of these variable impacts cannot be measured as to the individual impact on our product cost with a sufficient level of precision.
We are also exposed to risk of unfavorable changes in the Canadian dollar exchange rate versus the U.S. dollar. Our sales in Canada are denominated in Canadian dollars while amajority of the products are sourced in U.S. dollars. A weakening of the Canadian dollar versus the U.S. dollar results in lower sales in terms of U.S. dollars while the cost ofsales remains unchanged. We have a practice of hedging some of our Canadian subsidiary's purchases denominated in U.S. dollars. The U.S. dollar declined in value relative tothe Canadian dollar by approximately 4.1% in 2019, declined by 1.9% in 2020, and declined by 4.2% during the twenty-six weeks ended June 26, 2021. We may take pricingaction, when warranted, in an attempt to offset a
Page 25
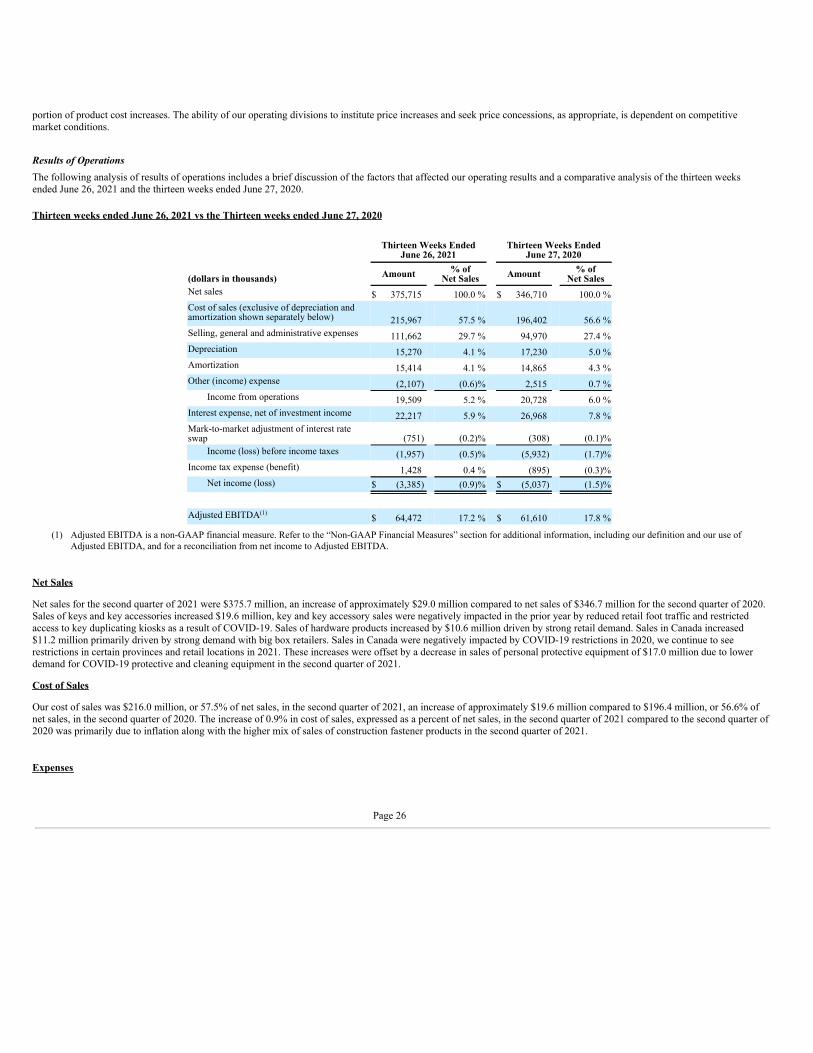
portion of product cost increases. The ability of our operating divisions to institute price increases and seek price concessions, as appropriate, is dependent on competitivemarket conditions.
Results of OperationsThe following analysis of results of operations includes a brief discussion of the factors that affected our operating results and a comparative analysis of the thirteen weeksended June 26, 2021 and the thirteen weeks ended June 27, 2020.
Thirteen weeks ended June 26, 2021 vs the Thirteen weeks ended June 27, 2020
Thirteen Weeks Ended
June 26, 2021Thirteen Weeks Ended
June 27, 2020
(dollars in thousands) Amount % ofNet Sales Amount % of
Net SalesNet sales $ 375,715 100.0 % $ 346,710 100.0 %Cost of sales (exclusive of depreciation andamortization shown separately below) 215,967 57.5 % 196,402 56.6 %Selling, general and administrative expenses 111,662 29.7 % 94,970 27.4 %Depreciation 15,270 4.1 % 17,230 5.0 %Amortization 15,414 4.1 % 14,865 4.3 %Other (income) expense (2,107) (0.6)% 2,515 0.7 %
Income from operations 19,509 5.2 % 20,728 6.0 %Interest expense, net of investment income 22,217 5.9 % 26,968 7.8 %Mark-to-market adjustment of interest rateswap (751) (0.2)% (308) (0.1)%
Income (loss) before income taxes (1,957) (0.5)% (5,932) (1.7)%Income tax expense (benefit) 1,428 0.4 % (895) (0.3)%
Net income (loss) $ (3,385) (0.9)% $ (5,037) (1.5)%
Adjusted EBITDA $ 64,472 17.2 % $ 61,610 17.8 %
(1) Adjusted EBITDA is a non-GAAP financial measure. Refer to the “Non-GAAP Financial Measures” section for additional information, including our definition and our use ofAdjusted EBITDA, and for a reconciliation from net income to Adjusted EBITDA.
Net Sales
Net sales for the second quarter of 2021 were $375.7 million, an increase of approximately $29.0 million compared to net sales of $346.7 million for the second quarter of 2020.Sales of keys and key accessories increased $19.6 million, key and key accessory sales were negatively impacted in the prior year by reduced retail foot traffic and restrictedaccess to key duplicating kiosks as a result of COVID-19. Sales of hardware products increased by $10.6 million driven by strong retail demand. Sales in Canada increased$11.2 million primarily driven by strong demand with big box retailers. Sales in Canada were negatively impacted by COVID-19 restrictions in 2020, we continue to seerestrictions in certain provinces and retail locations in 2021. These increases were offset by a decrease in sales of personal protective equipment of $17.0 million due to lowerdemand for COVID-19 protective and cleaning equipment in the second quarter of 2021.
Cost of Sales
Our cost of sales was $216.0 million, or 57.5% of net sales, in the second quarter of 2021, an increase of approximately $19.6 million compared to $196.4 million, or 56.6% ofnet sales, in the second quarter of 2020. The increase of 0.9% in cost of sales, expressed as a percent of net sales, in the second quarter of 2021 compared to the second quarter of2020 was primarily due to inflation along with the higher mix of sales of construction fastener products in the second quarter of 2021.
Expenses
(1)
Page 26
Selling, general, and administrative ("SG&A") expenses were approximately $111.7 million in the thirteen weeks ended June 26, 2021, an increase of approximately $16.7million, compared to $95.0 million in the thirteen weeks ended June 27, 2020. The following changes in underlying trends impacted the change in operating expenses:
• Selling expense was $40.0 million in the second quarter of 2021, an increase of $5.0 million compared to $35.0 million in the second quarter of 2020. The increase inselling expense was primarily due to increased marketing, variable compensation, and travel and entertainment expense in the second quarter of 2021.
• Warehouse and delivery expenses were $44.2 million in the second quarter of 2021, an increase of $4.9 million compared to $39.3 million in the second quarter of 2020.The additional expense was primarily driven by higher sales volume and inflation.
• General and administrative (“G&A”) expenses were $27.4 million in the second quarter of 2021, an increase of $6.7 million compared to $20.7 million in the secondquarter of 2020. In the second quarter of 2021 we incurred $9.6 million of legal and consulting expense associated with the pending merger with Landcadia along withincreased legal fees associated with our litigation with KeyMe (see Note 6 - Commitments and Contingencies of the Notes to Condensed Consolidated FinancialStatements for additional information) an increase of $7.1 million compared to the second quarter of 2020.
Depreciation expense was $15.3 million in the second quarter of 2021 compared to depreciation expense of $17.2 million in the second quarter of 2020. Amortization expensewas $15.4 million in the second quarter of 2021 which was comparable to the second quarter of 2020.
Other income was $2.1 million in the second quarter of 2021 compared to other expense of $2.5 million in the second quarter of 2020. Other income in the second quarter of2021 was comprised primarily of a $1.2 million gain on the revaluation of the contingent consideration associated with the acquisitions of Resharp and Instafob, (see Note 13 -Fair Value Measurements of the Notes to Condensed Consolidated Financial Statements for additional information) along with exchange rate gains of $0.9 million. In thesecond quarter of 2020 other expense was comprised of a $3.1 million loss on the revaluation of the contingent consideration associated with the acquisition of Resharp, (seeNote 13 - Fair Value Measurements of the Notes to Condensed Consolidated Financial Statements for additional information) partially offset by exchange rate losses of $0.2million.
Page 27
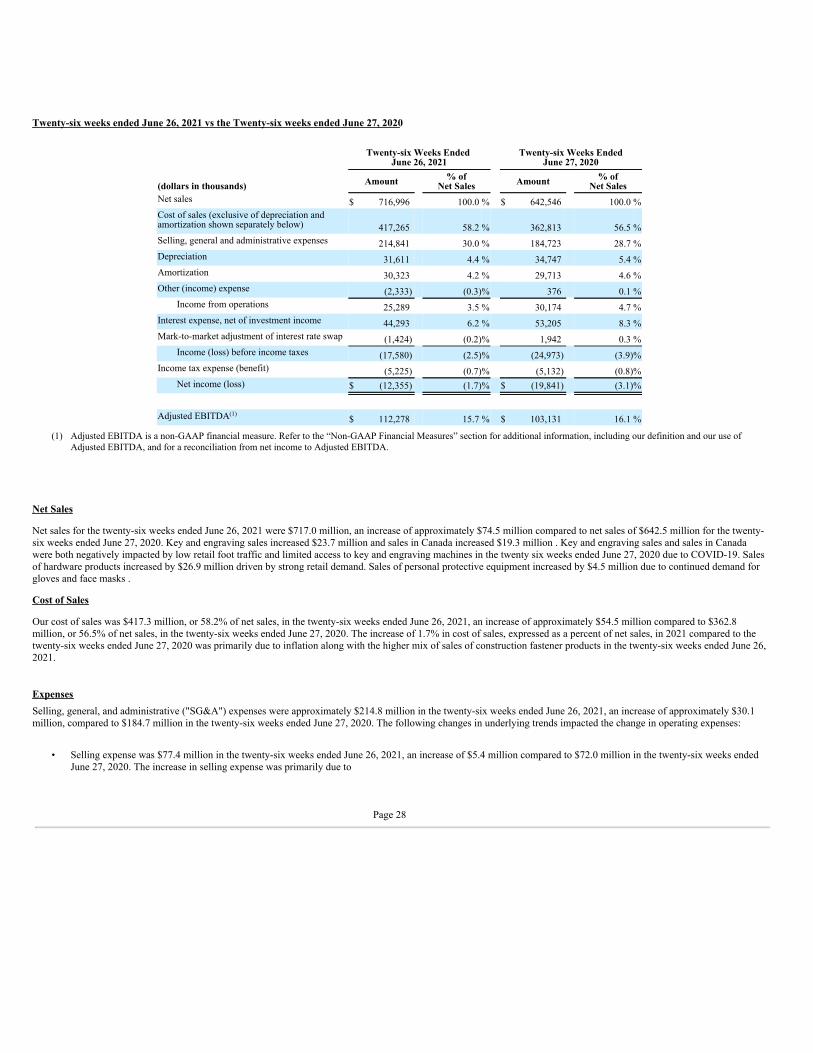
Twenty-six weeks ended June 26, 2021 vs the Twenty-six weeks ended June 27, 2020
Twenty-six Weeks Ended
June 26, 2021Twenty-six Weeks Ended
June 27, 2020
(dollars in thousands) Amount % ofNet Sales Amount % of
Net SalesNet sales $ 716,996 100.0 % $ 642,546 100.0 %Cost of sales (exclusive of depreciation andamortization shown separately below) 417,265 58.2 % 362,813 56.5 %Selling, general and administrative expenses 214,841 30.0 % 184,723 28.7 %Depreciation 31,611 4.4 % 34,747 5.4 %Amortization 30,323 4.2 % 29,713 4.6 %Other (income) expense (2,333) (0.3)% 376 0.1 %
Income from operations 25,289 3.5 % 30,174 4.7 %Interest expense, net of investment income 44,293 6.2 % 53,205 8.3 %Mark-to-market adjustment of interest rate swap (1,424) (0.2)% 1,942 0.3 %
Income (loss) before income taxes (17,580) (2.5)% (24,973) (3.9)%Income tax expense (benefit) (5,225) (0.7)% (5,132) (0.8)%
Net income (loss) $ (12,355) (1.7)% $ (19,841) (3.1)%
Adjusted EBITDA $ 112,278 15.7 % $ 103,131 16.1 %
(1) Adjusted EBITDA is a non-GAAP financial measure. Refer to the “Non-GAAP Financial Measures” section for additional information, including our definition and our use ofAdjusted EBITDA, and for a reconciliation from net income to Adjusted EBITDA.
Net Sales
Net sales for the twenty-six weeks ended June 26, 2021 were $717.0 million, an increase of approximately $74.5 million compared to net sales of $642.5 million for the twenty-six weeks ended June 27, 2020. Key and engraving sales increased $23.7 million and sales in Canada increased $19.3 million . Key and engraving sales and sales in Canadawere both negatively impacted by low retail foot traffic and limited access to key and engraving machines in the twenty six weeks ended June 27, 2020 due to COVID-19. Salesof hardware products increased by $26.9 million driven by strong retail demand. Sales of personal protective equipment increased by $4.5 million due to continued demand forgloves and face masks .
Cost of Sales
Our cost of sales was $417.3 million, or 58.2% of net sales, in the twenty-six weeks ended June 26, 2021, an increase of approximately $54.5 million compared to $362.8million, or 56.5% of net sales, in the twenty-six weeks ended June 27, 2020. The increase of 1.7% in cost of sales, expressed as a percent of net sales, in 2021 compared to thetwenty-six weeks ended June 27, 2020 was primarily due to inflation along with the higher mix of sales of construction fastener products in the twenty-six weeks ended June 26,2021.
ExpensesSelling, general, and administrative ("SG&A") expenses were approximately $214.8 million in the twenty-six weeks ended June 26, 2021, an increase of approximately $30.1million, compared to $184.7 million in the twenty-six weeks ended June 27, 2020. The following changes in underlying trends impacted the change in operating expenses:
• Selling expense was $77.4 million in the twenty-six weeks ended June 26, 2021, an increase of $5.4 million compared to $72.0 million in the twenty-six weeks endedJune 27, 2020. The increase in selling expense was primarily due to
(1)
Page 28
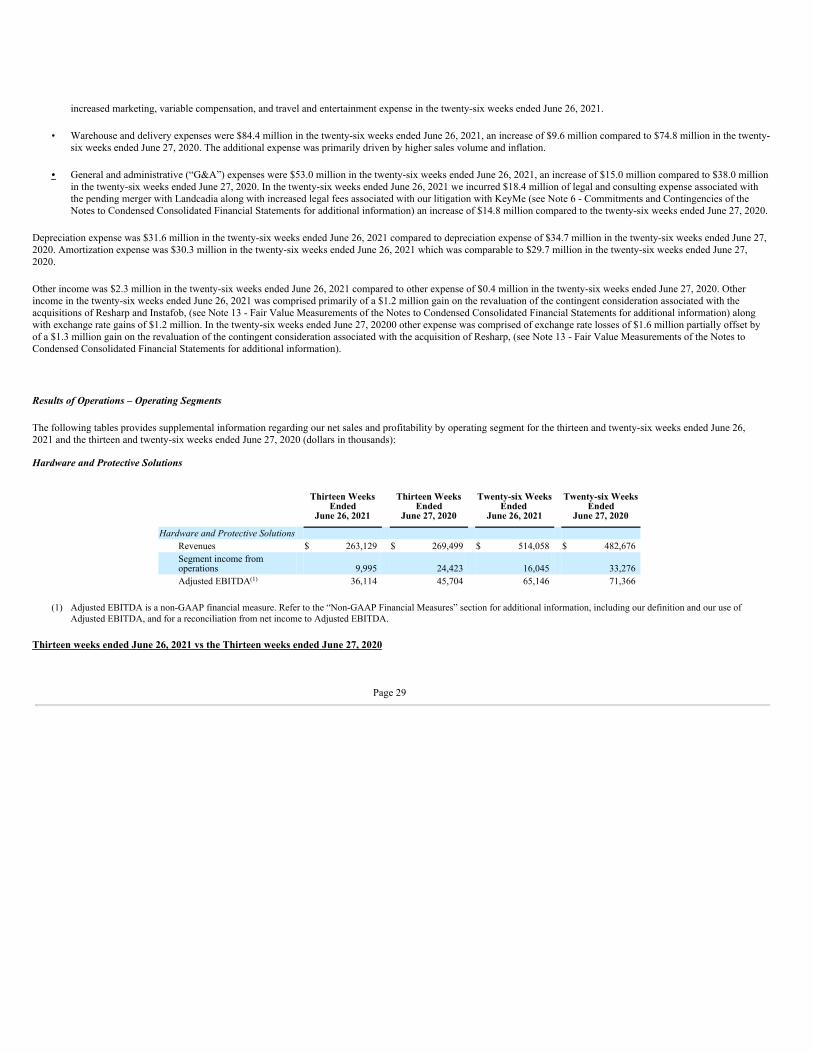
increased marketing, variable compensation, and travel and entertainment expense in the twenty-six weeks ended June 26, 2021.
• Warehouse and delivery expenses were $84.4 million in the twenty-six weeks ended June 26, 2021, an increase of $9.6 million compared to $74.8 million in the twenty-six weeks ended June 27, 2020. The additional expense was primarily driven by higher sales volume and inflation.
• General and administrative (“G&A”) expenses were $53.0 million in the twenty-six weeks ended June 26, 2021, an increase of $15.0 million compared to $38.0 millionin the twenty-six weeks ended June 27, 2020. In the twenty-six weeks ended June 26, 2021 we incurred $18.4 million of legal and consulting expense associated withthe pending merger with Landcadia along with increased legal fees associated with our litigation with KeyMe (see Note 6 - Commitments and Contingencies of theNotes to Condensed Consolidated Financial Statements for additional information) an increase of $14.8 million compared to the twenty-six weeks ended June 27, 2020.
Depreciation expense was $31.6 million in the twenty-six weeks ended June 26, 2021 compared to depreciation expense of $34.7 million in the twenty-six weeks ended June 27,2020. Amortization expense was $30.3 million in the twenty-six weeks ended June 26, 2021 which was comparable to $29.7 million in the twenty-six weeks ended June 27,2020.
Other income was $2.3 million in the twenty-six weeks ended June 26, 2021 compared to other expense of $0.4 million in the twenty-six weeks ended June 27, 2020. Otherincome in the twenty-six weeks ended June 26, 2021 was comprised primarily of a $1.2 million gain on the revaluation of the contingent consideration associated with theacquisitions of Resharp and Instafob, (see Note 13 - Fair Value Measurements of the Notes to Condensed Consolidated Financial Statements for additional information) alongwith exchange rate gains of $1.2 million. In the twenty-six weeks ended June 27, 20200 other expense was comprised of exchange rate losses of $1.6 million partially offset byof a $1.3 million gain on the revaluation of the contingent consideration associated with the acquisition of Resharp, (see Note 13 - Fair Value Measurements of the Notes toCondensed Consolidated Financial Statements for additional information).
Results of Operations – Operating Segments
The following tables provides supplemental information regarding our net sales and profitability by operating segment for the thirteen and twenty-six weeks ended June 26,2021 and the thirteen and twenty-six weeks ended June 27, 2020 (dollars in thousands): Hardware and Protective Solutions
Thirteen WeeksEnded
June 26, 2021
Thirteen WeeksEnded
June 27, 2020
Twenty-six WeeksEnded
June 26, 2021
Twenty-six WeeksEnded
June 27, 2020
Hardware and Protective SolutionsRevenues $ 263,129 $ 269,499 $ 514,058 $ 482,676 Segment income fromoperations 9,995 24,423 16,045 33,276 Adjusted EBITDA 36,114 45,704 65,146 71,366
(1) Adjusted EBITDA is a non-GAAP financial measure. Refer to the “Non-GAAP Financial Measures” section for additional information, including our definition and our use ofAdjusted EBITDA, and for a reconciliation from net income to Adjusted EBITDA.
Thirteen weeks ended June 26, 2021 vs the Thirteen weeks ended June 27, 2020
(1)
Page 29
Net Sales
Net sales for our Hardware and Protective Solutions operating segment decreased by $6.4 million in thirteen weeks ended June 26, 2021 to $263.1 million as compared to$269.5 million in the thirteen weeks ended June 27, 2020. Sales of personal protective equipment decreased by $17.0 million due to high demand for gloves and face masks in2020 as compared to the same period in 2021. This was partially offset by sales of hardware products, which increased by $10.6 million driven by strong retail demand.
Income from Operations
Income from operations of our Hardware and Protective Solutions operating segment decreased by approximately $14.4 million in the thirteen weeks ended June 26, 2021 to$10.0 million as compared to $24.4 million in the thirteen weeks ended June 27, 2020. The decrease was driven by the decreases in sales along with increased expenses.
• Cost of good sold increased by approximately $3.1 million in the thirteen weeks ended June 26, 2021 to $164.7 million as compared to $161.6 million in the thirteenweeks ended June 27, 2020. Cost of sales as a percentage of net sales was 62.6% in the thirteen weeks ended June 26, 2021, an increase of 2.6% from 60.0% in thethirteen weeks ended June 27, 2020. The increase in cost of sales as a percentage of net sales was primarily driven by inflation along with the higher mix of sales ofconstruction fastener products in the thirteen weeks ended June 26, 2021.
• Warehouse expense increased $3.1 million in the thirteen weeks ended June 26, 2021 compared to the thirteen weeks ended June 27, 2020. The additional expense wasprimarily driven by higher sales volume and inflation.
• G&A expense increased $1.7 million in the thirteen weeks ended June 26, 2021 compared to the thirteen weeks ended June 27, 2020. The additional expense wasprimarily due to increased legal and consulting expense associated with the pending merger with Landcadia.
Twenty-six weeks ended June 26, 2021 vs the Twenty-six weeks ended June 27, 2020Net Sales
Net sales for our Hardware and Protective Solutions operating segment increased by $31.4 million in twenty-six weeks ended June 26, 2021 to $514.1 million as compared to$482.7 million in the twenty-six weeks ended June 27, 2020. Sales of hardware products increased by $26.9 million driven by strong retail demand. Sales of personal protectiveequipment increased by $4.5 million due to continued demand for gloves and face masks.
Income from Operations
Income from operations of our Hardware and Protective Solutions operating segment decreased by approximately $17.2 million in the twenty-six weeks ended June 26, 2021 to$16.0 million as compared to $33.3 million in the twenty-six weeks ended June 27, 2020. The decrease was driven by the decreases in sales along with increased expenses.
• Cost of good sold increased by approximately $33.1 million in the twenty-six weeks ended June 26, 2021 to $514.1 million as compared to $482.7 million in the twenty-six weeks ended June 27, 2020. Cost of sales as a percentage of net sales was 63.2% in the twenty-six weeks ended June 26, 2021, an increase of 2.8% from 60.4% inthe twenty-six weeks ended June 27, 2020. The increase in cost of sales as a percentage of net sales was primarily driven inflation along with the higher mix of sales ofconstruction fastener products in the twenty-six weeks ended June 26, 2021.
• Warehouse expense increased $8.8 million in the twenty-six weeks ended June 26, 2021 compared to the twenty-six weeks ended June 26, 2021. The additional expensewas primarily driven by higher sales volume and inflation.
• G&A expense increased $6.5 million in the twenty-six weeks ended June 26, 2021 compared to the twenty-six weeks ended June 26, 2021. The additional expense wasprimarily due to increased legal and consulting expense associated with the pending merger with Landcadia.
Robotics and Digital Solutions
Page 30

Thirteen WeeksEnded
June 26, 2021
Thirteen WeeksEnded
June 27, 2020
Twenty-sixWeeks Ended June 26, 2021
Twenty-sixWeeks EndedJune 27, 2020
Robotics and Digital Solutions
Revenues $ 66,351 $ 42,198 $ 122,230 $ 98,505 Segment income from operations 6,546 (4,510) 6,700 1,386 Adjusted EBITDA 23,696 12,373 41,113 29,943
(1) Adjusted EBITDA is a non-GAAP financial measure. Refer to the “Non-GAAP Financial Measures” section for additional information, including our definition and our use ofAdjusted EBITDA, and for a reconciliation from net income to Adjusted EBITDA.
Thirteen weeks ended June 26, 2021 vs the Thirteen weeks ended June 27, 2020Net Sales
Net sales in our Robotics and Digital Solutions operating segment increased by $24.2 million in the thirteen weeks ended June 26, 2021 to $66.4 million as compared to $42.2million in the thirteen weeks ended June 27, 2020. The increased sales were primarily due to an increase of $19.6 million in keys sales along with an increase of $4.5 million inengraving sales. Key sales in the second quarter of 2020 were negatively impacted by restricted access to retail key duplication services as a result of COVID-19 in certainmarkets. As the economy has started to reopen, our service team has worked closely with our customers to restore access to key duplicating services in 2021.
Income from OperationsIncome from operations of our Robotics and Digital Solutions operating segment increased by approximately $11.1 million in the thirteen weeks ended June 26, 2021 to $6.5million as compared to a $4.5 million loss in the thirteen weeks ended June 27, 2020. The increase was primarily due to the increased sales partially offset by increased legaland consulting expense associated with the pending merger with Landcadia along with increased legal fees associated with our litigation with KeyMe (see Note 6 -Commitments and Contingencies of the Notes to Condensed Consolidated Financial Statements for additional information), along with the gain on the revaluation of contingentconsideration included in other income in the thirteen weeks ended June 26, 2021. In the second quarter of 2020 we recorded a loss of $3.1 million related to the revaluation ofthe contingent consideration associated with the acquisitions of Resharp and Instafob, (see Note 13 - Fair Value Measurements of the Notes to Condensed ConsolidatedFinancial Statements for additional information). In the first quarter of 2021, the contingent consideration revaluation adjustment was a gain of $1.2 million.
Twenty-six weeks ended June 26, 2021 vs the Twenty-six weeks ended June 27, 2020Net Sales
Net sales in our Robotics and Digital Solutions operating segment increased by $23.7 million in the twenty-six weeks ended June 26, 2021 to $122.2 million as compared to$98.5 million in the twenty-six weeks ended June 27, 2020. The increased sales were primarily due to an increase of $18.4 million in keys sales along with an increase of $5.3million in engraving sales. Key sales in the second quarter of 2020 were negatively impacted by restricted access to retail key duplication services as a result of COVID-19 incertain markets. As the economy has started to reopen, our service team has worked closely with our customers to restore access to key duplicating services in 2021.
Income from OperationsIncome from operations of our Robotics and Digital Solutions operating segment increased by approximately $5.3 million in the twenty-six weeks ended June 26, 2021 to $6.7million as compared to $1.4 million in the twenty-six weeks ended June 27, 2020. The increase was primarily due to the increased sales partially offset by increased legal andconsulting expense associated with the pending merger with Landcadia along with increased legal fees associated with our litigation with KeyMe (see Note 6 - Commitmentsand Contingencies of the Notes to Condensed Consolidated Financial Statements for additional information), along with increased sales and marketing expenses.
(1)
Page 31
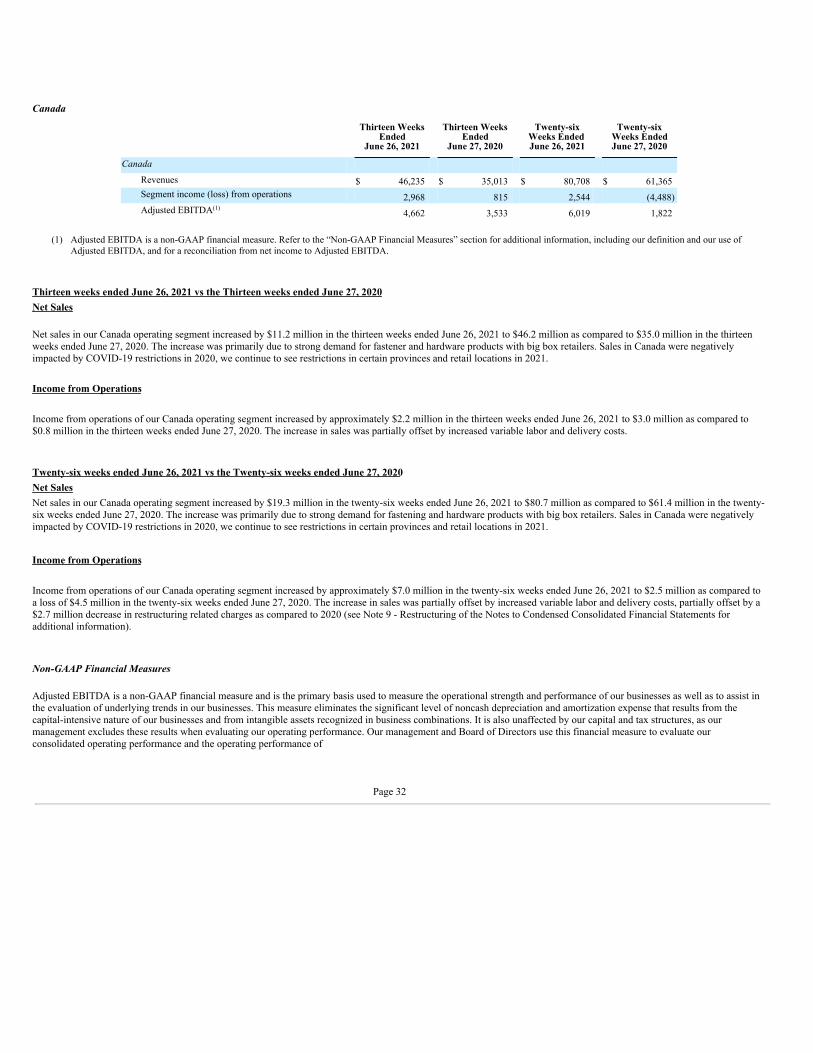
Canada
Thirteen WeeksEnded
June 26, 2021
Thirteen WeeksEnded
June 27, 2020
Twenty-sixWeeks Ended June 26, 2021
Twenty-sixWeeks EndedJune 27, 2020
Canada
Revenues $ 46,235 $ 35,013 $ 80,708 $ 61,365 Segment income (loss) from operations 2,968 815 2,544 (4,488)Adjusted EBITDA 4,662 3,533 6,019 1,822
(1) Adjusted EBITDA is a non-GAAP financial measure. Refer to the “Non-GAAP Financial Measures” section for additional information, including our definition and our use ofAdjusted EBITDA, and for a reconciliation from net income to Adjusted EBITDA.
Thirteen weeks ended June 26, 2021 vs the Thirteen weeks ended June 27, 2020Net Sales
Net sales in our Canada operating segment increased by $11.2 million in the thirteen weeks ended June 26, 2021 to $46.2 million as compared to $35.0 million in the thirteenweeks ended June 27, 2020. The increase was primarily due to strong demand for fastener and hardware products with big box retailers. Sales in Canada were negativelyimpacted by COVID-19 restrictions in 2020, we continue to see restrictions in certain provinces and retail locations in 2021.
Income from Operations
Income from operations of our Canada operating segment increased by approximately $2.2 million in the thirteen weeks ended June 26, 2021 to $3.0 million as compared to$0.8 million in the thirteen weeks ended June 27, 2020. The increase in sales was partially offset by increased variable labor and delivery costs.
Twenty-six weeks ended June 26, 2021 vs the Twenty-six weeks ended June 27, 2020Net SalesNet sales in our Canada operating segment increased by $19.3 million in the twenty-six weeks ended June 26, 2021 to $80.7 million as compared to $61.4 million in the twenty-six weeks ended June 27, 2020. The increase was primarily due to strong demand for fastening and hardware products with big box retailers. Sales in Canada were negativelyimpacted by COVID-19 restrictions in 2020, we continue to see restrictions in certain provinces and retail locations in 2021.
Income from Operations
Income from operations of our Canada operating segment increased by approximately $7.0 million in the twenty-six weeks ended June 26, 2021 to $2.5 million as compared toa loss of $4.5 million in the twenty-six weeks ended June 27, 2020. The increase in sales was partially offset by increased variable labor and delivery costs, partially offset by a$2.7 million decrease in restructuring related charges as compared to 2020 (see Note 9 - Restructuring of the Notes to Condensed Consolidated Financial Statements foradditional information).
Non-GAAP Financial Measures
Adjusted EBITDA is a non-GAAP financial measure and is the primary basis used to measure the operational strength and performance of our businesses as well as to assist inthe evaluation of underlying trends in our businesses. This measure eliminates the significant level of noncash depreciation and amortization expense that results from thecapital-intensive nature of our businesses and from intangible assets recognized in business combinations. It is also unaffected by our capital and tax structures, as ourmanagement excludes these results when evaluating our operating performance. Our management and Board of Directors use this financial measure to evaluate ourconsolidated operating performance and the operating performance of
(1)
Page 32
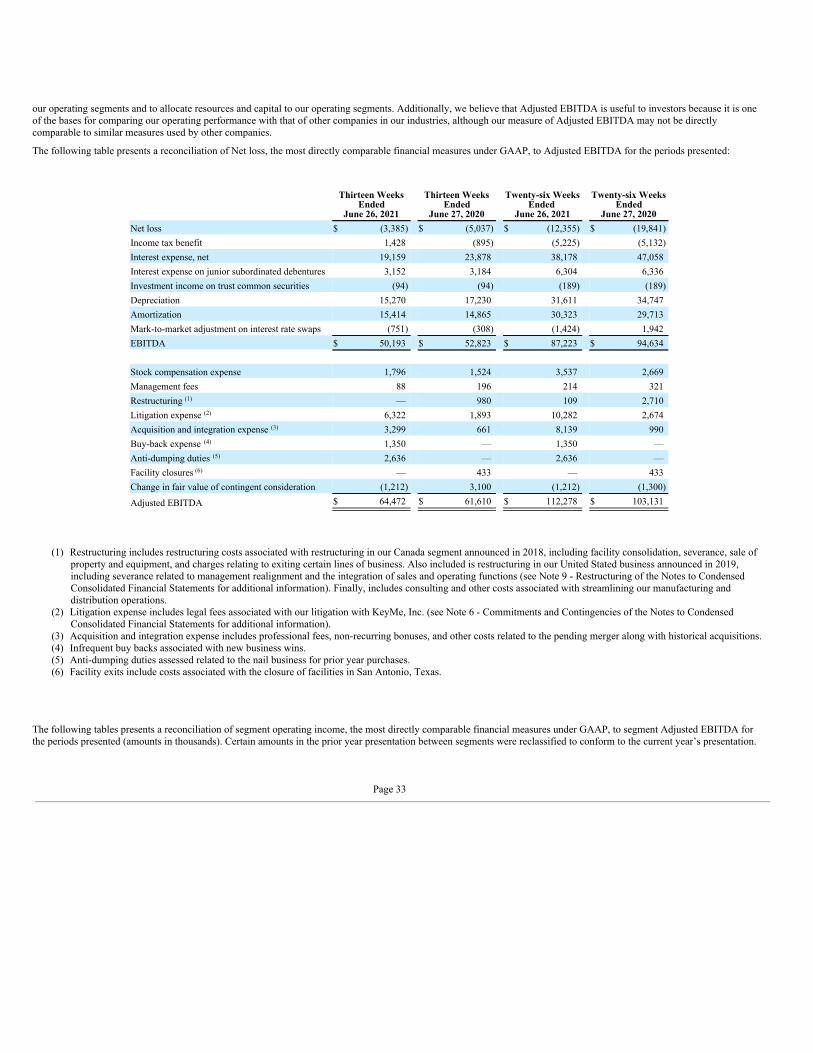
our operating segments and to allocate resources and capital to our operating segments. Additionally, we believe that Adjusted EBITDA is useful to investors because it is oneof the bases for comparing our operating performance with that of other companies in our industries, although our measure of Adjusted EBITDA may not be directlycomparable to similar measures used by other companies.
The following table presents a reconciliation of Net loss, the most directly comparable financial measures under GAAP, to Adjusted EBITDA for the periods presented:
Thirteen WeeksEnded
June 26, 2021
Thirteen WeeksEnded
June 27, 2020
Twenty-six WeeksEnded
June 26, 2021
Twenty-six WeeksEnded
June 27, 2020Net loss $ (3,385) $ (5,037) $ (12,355) $ (19,841)Income tax benefit 1,428 (895) (5,225) (5,132)Interest expense, net 19,159 23,878 38,178 47,058 Interest expense on junior subordinated debentures 3,152 3,184 6,304 6,336 Investment income on trust common securities (94) (94) (189) (189)Depreciation 15,270 17,230 31,611 34,747 Amortization 15,414 14,865 30,323 29,713 Mark-to-market adjustment on interest rate swaps (751) (308) (1,424) 1,942 EBITDA $ 50,193 $ 52,823 $ 87,223 $ 94,634
Stock compensation expense 1,796 1,524 3,537 2,669 Management fees 88 196 214 321 Restructuring — 980 109 2,710 Litigation expense 6,322 1,893 10,282 2,674 Acquisition and integration expense 3,299 661 8,139 990 Buy-back expense 1,350 — 1,350 — Anti-dumping duties 2,636 — 2,636 — Facility closures — 433 — 433 Change in fair value of contingent consideration (1,212) 3,100 (1,212) (1,300)
Adjusted EBITDA $ 64,472 $ 61,610 $ 112,278 $ 103,131
(1) Restructuring includes restructuring costs associated with restructuring in our Canada segment announced in 2018, including facility consolidation, severance, sale ofproperty and equipment, and charges relating to exiting certain lines of business. Also included is restructuring in our United Stated business announced in 2019,including severance related to management realignment and the integration of sales and operating functions (see Note 9 - Restructuring of the Notes to CondensedConsolidated Financial Statements for additional information). Finally, includes consulting and other costs associated with streamlining our manufacturing anddistribution operations.
(2) Litigation expense includes legal fees associated with our litigation with KeyMe, Inc. (see Note 6 - Commitments and Contingencies of the Notes to CondensedConsolidated Financial Statements for additional information).
(3) Acquisition and integration expense includes professional fees, non-recurring bonuses, and other costs related to the pending merger along with historical acquisitions.(4) Infrequent buy backs associated with new business wins.(5) Anti-dumping duties assessed related to the nail business for prior year purchases.(6) Facility exits include costs associated with the closure of facilities in San Antonio, Texas.
The following tables presents a reconciliation of segment operating income, the most directly comparable financial measures under GAAP, to segment Adjusted EBITDA forthe periods presented (amounts in thousands). Certain amounts in the prior year presentation between segments were reclassified to conform to the current year’s presentation.
(1)
(2)
(3)
(4)
(5)
(6)
Page 33
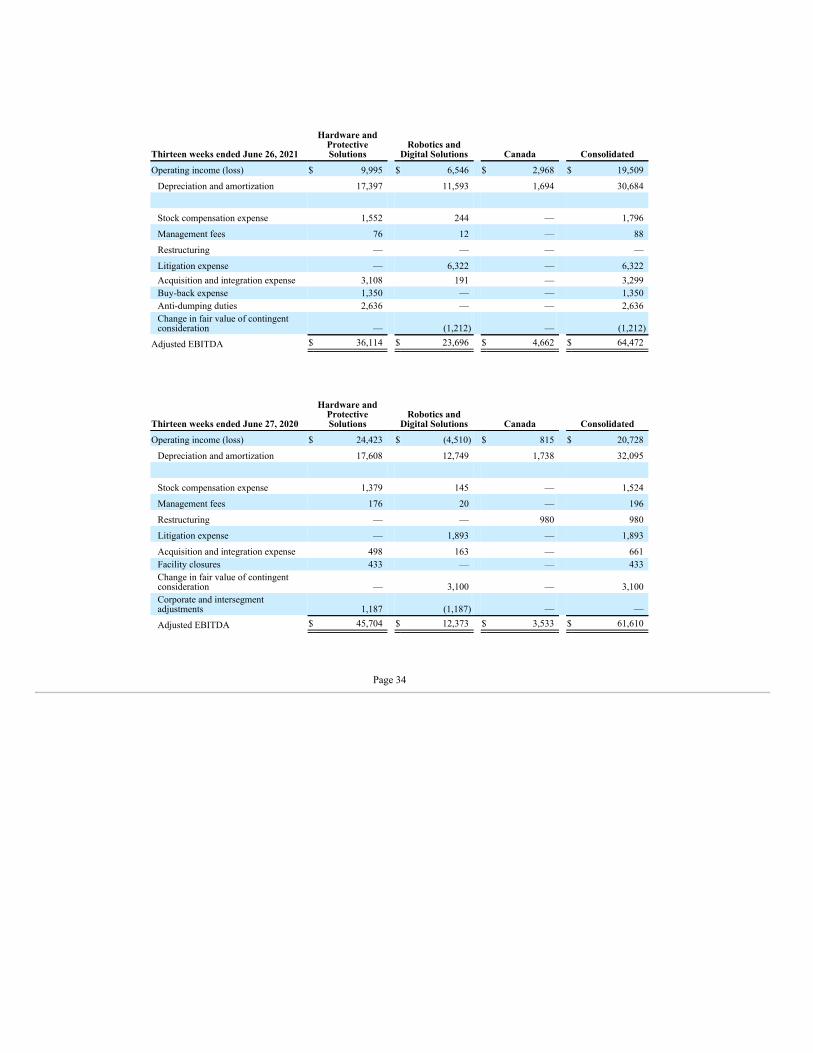
Thirteen weeks ended June 26, 2021
Hardware andProtectiveSolutions
Robotics andDigital Solutions Canada Consolidated
Operating income (loss) $ 9,995 $ 6,546 $ 2,968 $ 19,509
Depreciation and amortization 17,397 11,593 1,694 30,684
Stock compensation expense 1,552 244 — 1,796
Management fees 76 12 — 88
Restructuring — — — —
Litigation expense — 6,322 — 6,322 Acquisition and integration expense 3,108 191 — 3,299 Buy-back expense 1,350 — — 1,350 Anti-dumping duties 2,636 — — 2,636 Change in fair value of contingentconsideration — (1,212) — (1,212)
Adjusted EBITDA $ 36,114 $ 23,696 $ 4,662 $ 64,472
Thirteen weeks ended June 27, 2020
Hardware andProtectiveSolutions
Robotics andDigital Solutions Canada Consolidated
Operating income (loss) $ 24,423 $ (4,510) $ 815 $ 20,728
Depreciation and amortization 17,608 12,749 1,738 32,095
Stock compensation expense 1,379 145 — 1,524
Management fees 176 20 — 196
Restructuring — — 980 980
Litigation expense — 1,893 — 1,893
Acquisition and integration expense 498 163 — 661 Facility closures 433 — — 433 Change in fair value of contingentconsideration — 3,100 — 3,100 Corporate and intersegmentadjustments 1,187 (1,187) — —
Adjusted EBITDA $ 45,704 $ 12,373 $ 3,533 $ 61,610
Page 34
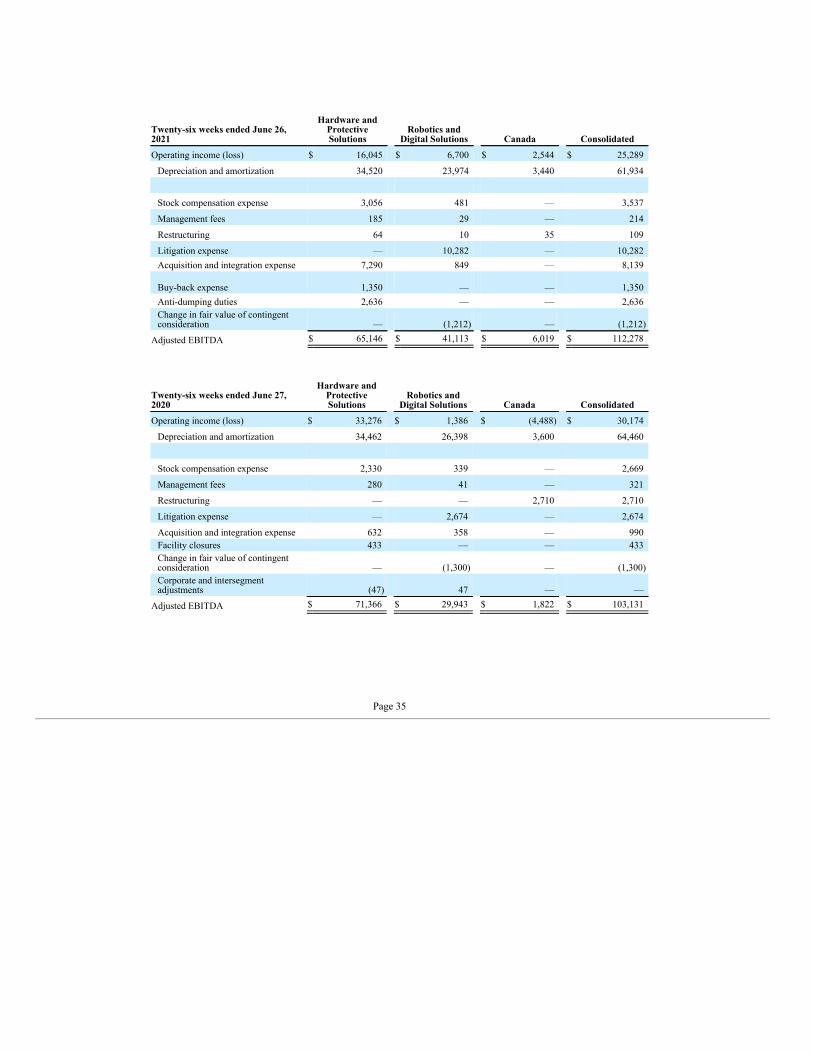
Twenty-six weeks ended June 26,2021
Hardware andProtectiveSolutions
Robotics andDigital Solutions Canada Consolidated
Operating income (loss) $ 16,045 $ 6,700 $ 2,544 $ 25,289
Depreciation and amortization 34,520 23,974 3,440 61,934
Stock compensation expense 3,056 481 — 3,537
Management fees 185 29 — 214
Restructuring 64 10 35 109
Litigation expense — 10,282 — 10,282 Acquisition and integration expense 7,290 849 — 8,139
Buy-back expense 1,350 — — 1,350 Anti-dumping duties 2,636 — — 2,636 Change in fair value of contingentconsideration — (1,212) — (1,212)
Adjusted EBITDA $ 65,146 $ 41,113 $ 6,019 $ 112,278
Twenty-six weeks ended June 27,2020
Hardware andProtectiveSolutions
Robotics andDigital Solutions Canada Consolidated
Operating income (loss) $ 33,276 $ 1,386 $ (4,488) $ 30,174
Depreciation and amortization 34,462 26,398 3,600 64,460
Stock compensation expense 2,330 339 — 2,669
Management fees 280 41 — 321
Restructuring — — 2,710 2,710
Litigation expense — 2,674 — 2,674
Acquisition and integration expense 632 358 — 990 Facility closures 433 — — 433 Change in fair value of contingentconsideration — (1,300) — (1,300)Corporate and intersegmentadjustments (47) 47 — —
Adjusted EBITDA $ 71,366 $ 29,943 $ 1,822 $ 103,131
Page 35

Income Taxes
For the thirteen weeks ended June 26, 2021, the Company recorded an income tax provision of $1.4 million based on a pre-tax loss of $2.0 million. The Company recorded anincome tax benefit for the twenty-six weeks ended June 26, 2021 of $5.2 million based on a pre-tax loss of $17.6 million. The effective income tax rate was (73.0)% and 29.7%for the thirteen and twenty-six weeks ended June 26, 2021, respectively.
The effective rate differed from the federal statutory rate due to an estimated increase in GILTI from the Company's Canadian operations, state and foreign income taxes, andnon-deductible stock compensation expenses.
For the thirteen weeks ended June 27, 2020, the Company recorded an income tax benefit of $0.9 million based on a pre-tax loss of $5.9 million. The Company recorded anincome tax benefit for the twenty-six weeks ended June 27, 2020 of $5.1 million based on a pre-tax loss of $25.0 million. The effective income tax rate was 15.1% and 20.6%for the thirteen and twenty-six weeks ended June 27, 2020, respectively.
The effective income tax rate differed from the federal statutory tax rate in the thirteen and twenty-six weeks ended June 27, 2020 primarily due to non-deductible stockcompensation expenses, and state and foreign income taxes.
On March 27, 2020, the President of the United States signed the Coronavirus Aid, Relief, and Economic Security Act (“CARES Act”) into law. The CARES Act included,among other things, corporate income tax relief in the form of accelerated alternative minimum tax ("AMT") refunds, allowed employers to defer certain payroll tax paymentsthroughout 2020, and provided favorable corporate interest deductions for the 2020 reporting period.
Liquidity and Capital Resources
The statements of cash flows reflect the changes in cash and cash equivalents for the twenty-six weeks ended June 26, 2021 and the twenty-six weeks ended June 27, 2020 byclassifying transactions into three major categories: operating, investing, and financing activities.
Net cash used for operating activities for the twenty-six weeks ended June 26, 2021 was $59.8 million as compared to $11.7 million of cash provided by operation activities inthe comparable prior year period. Operating cash flows for the twenty-six weeks ended June 26, 2021 were unfavorably impacted by increased inventory for the spring andsummer busy season and new business wins. Operating cash flows for the twenty-six weeks ended June 27, 2020 were unfavorably impacted by the increase in accountsreceivable due to higher sales.Net cash used for investing activities was $61.8 million and $23.0 million for the twenty-six weeks ended June 26, 2021 and the twenty-six weeks ended June 27, 2020,respectively. During the twenty-six weeks ended June 26, 2021, we acquired Oz Post International, LLC ("OZCO") for approximately $39.1 million, (see Note 4 - Acquisitionsof the Notes to Condensed Consolidated Financial Statements for additional information). Excluding acquisitions, the primary use of cash in both periods was our investment innew key duplicating kiosks and machines.
Net cash provided by financing activities was $116.0 million for the twenty-six weeks ended June 26, 2021. Our revolver draws, net of repayments, provided cash of $86.0million in the twenty-six weeks ended June 26, 2021. In the second quarter of 2021, we entered into an amendment ("OZCO Amendment") to the term loan credit agreementdated May 31, 2018, which provided $35,000 of incremental term loan funds to be used to finance the acquisition, (see Note 4 - Acquisitions of the Notes to CondensedConsolidated Financial Statements for additional information) Additionally, we used cash to pay $5.3 million in principal payments on the senior term loan under the SeniorFacilities. Finally, in the twenty-six weeks ended June 26, 2021 the Company received $1.8 million on the exercise of stock options.
Net cash provided by financing activities was $10.3 million for the twenty-six weeks ended June 27, 2020. Revolver repayments were $16.0 million, net of draws, in the twenty-six weeks ended June 27, 2020. Additionally, we used cash to pay $5.3 million in principal payments on the senior term loan under the Senior Facilities.
Management believes that projected cash flows from operations and revolver availability will be sufficient to fund working capital and capital expenditure needs for the next 12months. Our working capital (current assets minus current liabilities)
Page 36
position of $340.5 million as of June 26, 2021 represents an increase of $98.7 million from the December 26, 2020 level of $241.8 million. Because COVID-19 pandemic hasnot, as of the date of this report, had a materially negative impact on our operations or demand for our products, it has not had a materially negative impact on the Company'sliquidity position. We have initiated mitigating efforts to manage non-critical capital spending, assess operating spend, and preserve cash. We expect to generate sufficientoperating cash flows to meet our short-term liquidity needs, and we expect to maintain access to the capital markets, although there can be no assurance of our ability to do so.However, the continued spread of COVID-19 has led to disruption and volatility in the global capital markets, which, depending on future developments, could impact ourcapital resources and liquidity in the future.
Off-Balance Sheet Arrangements
We do not have any off-balance sheet arrangements, as defined in Item 303(a)(4)(ii) of Regulation S-K under the Securities Exchange Act of 1934, as amended (the “ExchangeAct”).
Critical Accounting Policies and EstimatesSignificant accounting policies and estimates are summarized in the notes to the condensed consolidated financial statements. Some accounting policies require management toexercise significant judgment in selecting the appropriate assumptions for calculating financial estimates. Such judgments are subject to an inherent degree of uncertainty. Thesejudgments are based on our historical experience, known trends in our industry, terms of existing contracts, and other information from outside sources, as appropriate.Management believes that these estimates and assumptions are reasonable based on the facts and circumstances as of June 26, 2021, however, actual results may differ fromthese estimates under different assumptions and circumstances.
There have been no material changes to our critical accounting policies and estimates which are discussed in the “Critical Accounting Policies and Estimates” section of“Management’s Discussion and Analysis of Financial Condition and Results of Operations” in Part II, Item 7 of the Annual Report on Form 10-K for the year endedDecember 26, 2020, as filed with the Securities and Exchange Commission. In addition, our most significant accounting policies are discussed in Note 2 and elsewhere in theNotes to the Consolidated Financial Statements included in the Annual Report on Form 10-K for the year ended December 26, 2020.
Recent Accounting Pronouncements
See “Note 3 - Recent Accounting Pronouncements” of the Notes to Condensed Consolidated Financial Statements.
Item 3.Quantitative and Qualitative Disclosures About Market Risk
Interest Rate ExposureWe are exposed to the impact of interest rate changes as borrowings under the Senior Facilities bear interest at variable interest rates. It is our policy to enter into interest rateswap and interest rate cap transactions only to the extent considered necessary to meet our objectives. Furthermore, regulatory changes, such as the announcement of the UnitedKingdom’s Financial Conduct Authority to phase out the London Interbank Offered Rate ("LIBOR") by the end of 2021, may adversely affect our floating rate debt and interestrate derivatives. If LIBOR ceases to exist, we may need to renegotiate any credit agreements or interest rate derivatives agreements extending beyond 2021 that utilize LIBORas a factor in determining the interest rate or hedge rate, which could adversely impact our cost of debt.Based on our exposure to variable rate borrowings at June 26, 2021, after consideration of our LIBOR floor rate and interest rate swap agreements, a one percent (1%) changein the weighted average interest rate for a period of one year would change the annual interest expense by approximately $10.7 million.
Foreign Currency Exchange
We are exposed to foreign exchange rate changes of the Canadian and Mexican currencies as they impact the $174.9 million tangible and intangible net asset value of ourCanadian and Mexican subsidiaries as of June 26, 2021. The foreign subsidiaries net tangible assets were $109.0 million and the net intangible assets were $65.9 million as ofJune 26, 2021.
Page 37

We utilize foreign exchange forward contracts to manage the exposure to currency fluctuations in the Canadian dollar versus the U.S. Dollar. See Note 12 - Derivatives andHedging of the Notes to Condensed Consolidated Financial Statements.
Item 4.
Controls and ProceduresDisclosure Controls and ProceduresWe carried out an evaluation, under the supervision and with the participation of management, including the Chief Executive Officer and the Chief Financial Officer, of theeffectiveness of the design and operation of our disclosure controls and procedures, as defined in Rules 13a-15(e) and 15d-15(e) under the Exchange Act. Based upon thatevaluation, our Chief Executive Officer and Chief Financial Officer concluded that our disclosure controls and procedures were not effective, as of June 26, 2021, in ensuringthat material information required to be disclosed in reports that we file or submit under the Exchange Act is recorded, processed, summarized, and reported within the timeperiods specified in the SEC’s rules and forms and that such information is accumulated and communicated to management, including the Chief Executive Officer and the ChiefFinancial Officer, as appropriate, to allow timely decisions regarding required disclosure.As previously disclosed in our Annual Report on Form 10-K for the fiscal year ended December 26, 2020, management concluded that we did not design and maintain effectivecontrols over the completeness and accuracy of the accounting for, and disclosure of, the valuation allowance against deferred income taxes. The material weakness resulted inmaterial errors in the application of certain provisions of the Tax Cuts and Jobs Act of 2017 (“2017 Tax Act”) related to the IRC §163(j) interest limitation (Interest Limitation).This material weakness resulted in material errors in our income tax benefit and deferred tax liabilities that were corrected through the restatement of the consolidated financialstatements as of and for the years ended December 28, 2019 and December 29, 2018. Additionally, this material weakness could result in misstatements to the aforementionedaccount balances or disclosures that would result in a material misstatement to the annual or interim consolidated financial statements that would not be prevented or detected.In response to the material weakness described above, management implemented changes to its internal control over financial reporting to remediate the control deficienciesthat gave rise to the material weakness. Those changes included the engagement of third party consultants to assist with technical tax accounting research and application ofguidance, the addition of a committee to review technical accounting issues and ensure we have the appropriate subject matter experts engaged, and hiring additional personnelin our tax department.While significant progress has been made to enhance our internal control over financial reporting, we are still in the process of testing these recently implemented processes,procedures, and controls. Additional time is required to complete the assessment to ensure the sustainability of these procedures. We believe the above actions will be effectivein remediating the material weaknesses described above. However, the material weaknesses cannot be considered remediated until the applicable remedial controls operate for asufficient period of time and management has concluded, through testing, that these controls are operating effectively.The remediation efforts are intended both to address the identified material weakness and to enhance our overall financial control environment. Management is committed tocontinuous improvement of the company’s internal control over financial reporting and will continue to diligently review the company’s internal control over financialreporting.
Changes in Internal Control over Financial ReportingExcept as described above, there were no changes in our internal control over financial reporting (as defined in Rule 13a-15(f) of the Exchange Act) that occurred during thetwenty-six weeks ended June 26, 2021 that have materially affected, or are reasonably likely to materially affect, our internal control over financial reporting.
PART IIOTHER INFORMATION
Item 1. – Legal Proceedings.We are subject to various claims and litigation that arise in the normal course of business. In the opinion of our management, the ultimate resolution of the pending litigationmatters will not have a material adverse effect on our condensed consolidated financial position, operations, or cash flows.
Item 1A – Risk Factors.
Page 38
There have been no material changes to the risks from those disclosed in Part I, Item 1A of our Annual Report on Form 10-K for the year ended December 26, 2020.
Item 2. – Unregistered Sales of Equity Securities and Use of Proceeds.Not Applicable.
Item 3. – Defaults Upon Senior Securities.Not Applicable.
Item 4. – Mine Safety Disclosures.Not Applicable.
Item 5. – Other Information.Not Applicable.
Item 6. – Exhibits.
a) Exhibits, including those incorporated by reference.
31.1 * Certification of Chief Executive Officer pursuant to Rule 13a-14(a) or 15d-14(a) under the Exchange Act31.2 * Certification of Chief Financial Officer pursuant to Rule 13a-14(a) or 15d-14(a) under the Exchange Act32.1 * Certification of Chief Executive Officer pursuant to 18 U.S.C. Section 1350, as adopted pursuant to Section 906 of the Sarbanes-Oxley Act of 200232.2 * Certification of Chief Financial Officer pursuant to 18 U.S.C. Section 1350, as adopted pursuant to Section 906 of the Sarbanes-Oxley Act of 2002101 The following financial information from the Company’s Quarterly Report on Form 10-Q for the quarter ended June 26, 2021 filed with the Securities and
Exchange Commission on July 29, 2021, formatted in eXtensible Business Reporting Language: (i) Condensed Consolidated Balance Sheets as of June 26, 2021and December 26, 2020, (ii) Condensed Consolidated Statements of Comprehensive Income (Loss) for the thirteen and twenty-six weeks ended June 26, 2021and the thirteen and twenty-six weeks ended June 27, 2020, (iii) Condensed Consolidated Statements of Cash Flows for the twenty-six weeks ended June 26,2021 and the twenty-six weeks ended June 27, 2020, (iv) Condensed Consolidated Statements of Stockholders' Equity for the thirteen and twenty-six weeksended June 26, 2021 and the thirteen and twenty-six weeks ended June 27, 2020, and (v) Notes to Condensed Consolidated Financial Statements.
* Filed herewith.
Page 39

SIGNATURES
Pursuant to the requirements of the Exchange Act, the Registrant has duly caused this report to be signed on its behalf by the undersigned thereunto duly authorized.
THE HILLMAN COMPANIES, INC.
/s/ Robert O. Kraft /s/ Anne S. McCallaRobert O. Kraft Anne S. McCalla
Chief Financial Officer Controller(Chief Accounting Officer)
DATE: July 29, 2021
Page 40
Exhibit 31.1
CERTIFICATION OF CHIEF EXECUTIVE OFFICER
I, Douglas J. Cahill, certify that:
1. I have reviewed this quarterly report on Form 10-Q of The Hillman Companies, Inc.;
2. Based on my knowledge, this report does not contain any untrue statement of a material fact or omit to state a material fact necessary to make the statements made, inlight of the circumstances under which such statements were made, not misleading with respect to the period covered by this report;
3. Based on my knowledge, the financial statements, and other financial information included in this report, fairly present in all material respects the financial condition,results of operations, and cash flows of the registrant as of, and for, the periods presented in this report;
4. The registrant’s other certifying officer and I are responsible for establishing and maintaining disclosure controls and procedures (as defined in Exchange Act Rules 13a-15(e) and 15d-15(e)) and internal control over financial reporting (as defined in Exchange Act Rules 13a-15(f) and 15d-15(f)) for the registrant and have:
a) Designed such disclosure controls and procedures, or caused such disclosure controls and procedures to be designed under our supervision, to ensure thatmaterial information relating to the registrant, including its consolidated subsidiaries, is made known to us by others within those entities, particularly duringthe period in which this report is being prepared;
b) Designed such internal control over financial reporting, or caused such internal control over financial reporting to be designed under our supervision, to providereasonable assurance regarding the reliability of financial reporting and the preparation of financial statements for external purposes in accordance withgenerally accepted accounting principles;
c) Evaluated the effectiveness of the registrant’s disclosure controls and procedures and presented in this report our conclusions about the effectiveness of thedisclosure controls and procedures, as of the end of the period covered by this report based on such evaluation; and
d) Disclosed in this report any change in the registrant’s internal control over financial reporting that occurred during the registrant’s most recent fiscal quarter (theregistrant’s fourth fiscal quarter in the case of an annual report) that has materially affected, or is reasonably likely to materially affect, the registrant’s internalcontrol over financial reporting.
5. The registrant’s other certifying officer and I have disclosed, based on our most recent evaluation of internal control over financial reporting, to the registrant’s auditorsand the audit committee of registrant’s board of directors (or persons performing the equivalent functions):
a) All significant deficiencies and material weaknesses in the design or operation of internal control over financial reporting which are reasonably likely toadversely affect the registrant’s ability to record, process, summarize, and report financial information; and
b) Any fraud, whether or not material, that involves management or other employees who have a significant role in the registrant’s internal control over financialreporting.
Date: July 29, 2021 /s/ Douglas J. CahillDouglas J. CahillPresident and Chief Executive Officer

Exhibit 31.2
CERTIFICATION OF CHIEF FINANCIAL OFFICER
I, Robert O. Kraft, certify that:
1. I have reviewed this quarterly report on Form 10-Q of The Hillman Companies, Inc.;
2. Based on my knowledge, this report does not contain any untrue statement of a material fact or omit to state a material fact necessary to make the statements made, inlight of the circumstances under which such statements were made, not misleading with respect to the period covered by this report;
3. Based on my knowledge, the financial statements, and other financial information included in this report, fairly present in all material respects the financial condition,results of operations, and cash flows of the registrant as of, and for, the periods presented in this report;
4. The registrant’s other certifying officer and I are responsible for establishing and maintaining disclosure controls and procedures (as defined in Exchange Act Rules 13a-15e and 15d-15(e)) and internal control over financial reporting (as defined in Exchange Act Rules 13a-15(f) and 15d-15(f)) for the registrant and have:
a) Designed such disclosure controls and procedures, or caused such disclosure controls and procedures to be designed under our supervision, to ensure thatmaterial information relating to the registrant, including its consolidated subsidiaries, is made known to us by others within those entities, particularly duringthe period in which this report is being prepared;
b) Designed such internal control over financial reporting, or caused such internal control over financial reporting to be designed under our supervision, to providereasonable assurance regarding the reliability of financial reporting and the preparation of financial statements for external purposes in accordance withgenerally accepted accounting principles;
c) Evaluated the effectiveness of the registrant’s disclosure controls and procedures and presented in this report our conclusions about the effectiveness of thedisclosure controls and procedures, as of the end of the period covered by this report based on such evaluation; and
d) Disclosed in this report any change in the registrant’s internal control over financial reporting that occurred during the registrant’s most recent fiscal quarter (theregistrant’s fourth fiscal quarter in the case of an annual report) that has materially affected, or is reasonably likely to materially affect, the registrant’s internalcontrol over financial reporting.
5. The registrant’s other certifying officer and I have disclosed, based on our most recent evaluation of internal control over financial reporting, to the registrant’s auditorsand the audit committee of registrant’s board of directors (or persons performing the equivalent functions):
a) All significant deficiencies and material weaknesses in the design or operation of internal control over financial reporting which are reasonably likely toadversely affect the registrant’s ability to record, process, summarize, and report financial information; and
b) Any fraud, whether or not material, that involves management or other employees who have a significant role in the registrant’s internal control over financialreporting.
Date: July 29, 2021 /s/ Robert O. KraftRobert O. KraftChief Financial Officer
Exhibit 32.1
CERTIFICATION OF CHIEF EXECUTIVE OFFICER PURSUANT TO 18 U.S.C. 1350, AS ADOPTED PURSUANT TO SECTION 906 OF THE SARBANES-OXLEY ACT OF 2002
In connection with the Quarterly Report on Form 10-Q for the thirteen and twenty-six weeks ended June 26, 2021 (the “Report”) of The Hillman Companies, Inc. (the“Registrant”), as filed with the Securities and Exchange Commission on the date hereof; I, Douglas J. Cahill, the President and Chief Executive Officer of the Registrant,certify, to the best of my knowledge, that:
(1) The Report fully complies with the requirements of Section 13(a) or 15(d) of the Securities Exchange Act of 1934, as amended; and
(2) The information contained in the Report fairly presents, in all material respects, the financial condition and results of operations of the Registrant.
/s/ Douglas J. Cahill Name: Douglas J. Cahill Date: July 29, 2021

Exhibit 32.2
CERTIFICATION OF CHIEF FINANCIAL OFFICER PURSUANT TO 18 U.S.C. 1350, AS ADOPTED PURSUANT TO SECTION 906 OF THE SARBANES-OXLEY ACT OF 2002
In connection with the Quarterly Report on Form 10-Q for the thirteen and twenty-six weeks ended June 26, 2021 (the “Report”) of The Hillman Companies, Inc. (the“Registrant”), as filed with the Securities and Exchange Commission on the date hereof; I, Robert O. Kraft, the Chief Financial Officer of the Registrant, certify, to the best ofmy knowledge, that:
(1) The Report fully complies with the requirements of Section 13(a) or 15(d) of the Securities Exchange Act of 1934, as amended; and
(2) The information contained in the Report fairly presents, in all material respects, the financial condition and results of operations of the Registrant.
/s/ Robert O. Kraft Name: Robert O. Kraft Date: July 29, 2021