The High Yield Handbook - QUANTLABS.NETquantlabs.net/academy/download/free_quant... · The High...
211
European High Yield Credit Research January 2006 Our ‘Bottom-Up’ View of European High Yield The High Yield Handbook www.GlobalMarkets.bnpparibas.com Please refer to important information found at the end of the report ■ 2006 European High Yield Market Outlook ■ 81 Credit Snapshots: Recommendations, Financials, Structures, Covenants Part 1
Transcript of The High Yield Handbook - QUANTLABS.NETquantlabs.net/academy/download/free_quant... · The High...

European High Yield Credit Research January 2006
Our ‘Bottom-Up’ View of European High Yield
The High Yield Handbook
www.GlobalMarkets.bnpparibas.com Please refer to important information found at the end of the report
n 2006 European High Yield Market Outlook
n 81 Credit Snapshots:Recommendations, Financials, Structures, Covenants
Th
eH
igh
Yield
Han
db
oo
kJan
uary
2006
AMSTERDAMBNP ParibasHerengracht 4771017 BS AmsterdamNetherlandsTel + 31 20 550 1212Fax + 31 20 625 3921
DUBLINBNP Paribas5 George’s DockIFSCDublin 1IrelandTel + 353 1 612 50 00Fax + 353 1 612 51 00
LONDONBNP Paribas10 Harewood AvenueLondon NW1 6AAUnited KingdomTel + 44 20 7595 2000Fax + 44 20 7595 2555
MUMBAIBNP ParibasFrench Bank Building62 Homji StreetFortMumbai 400 001IndiaTel + 91 22 22642 006Fax + 91 22 22679 710
SHANGHAIBNP Paribas (China) Limited13/F Shanghai Stock Exchange Building528 Pu Dong Road (S)Shanghai 200120People’s Republic of ChinaTel + 86 21 5840 5500Fax + 86 21 5879 1702
BRUSSELSBNP ParibasAvenue Louise, 489B-1000 - BrusselsBelgiumTel + 32 2 518 08 11Fax + 32 2 518 09 34/511 4626
HONG KONGBNP Paribas63/F Two International Finance Centre8 Finance StreetHong KongTel + 852 2909 8888Fax + 852 2865 2523
MANILABNP Paribas30/F Philamlife Tower8767 Paseo de RoxasMakati City 1226PhilippinesTel + 632 885 0252Fax + 632 885 7028
SAN FRANCISCOBNP ParibasOne Front Street23rd FloorSan FranciscoCA 94111U.S.A.Tel + 1 415 772 1370Fax + 1 415 391 3390
TAIPEIBNP Paribas3 - 6/F, 52 Min Sheng East RoadSec. 4, Taipei 105P.O.Box 118-980 TaipeiTaiwanTel + 88 62 27 16 1167Fax + 88 62 27 15 2027
BANGKOKBNP Paribas29th FloorAbdulrahim Place990 Rama IV RoadBangkok 10500Tel + 66 2 636 19 00Fax + 66 2 636 19 33/34/35
GENEVABNP Paribas2 Place de Hollande1211 Geneva 11SwitzerlandTel + 41 22 787 7111Fax + 41 22 787 8000
MADRIDBNP ParibasHermanos Becquer 3PO Box 5078428006 MadridSpainTel + 34 91 745 9000Fax + 34 91 745 8888
PARISBNP Paribas3 rue d’Antin75078 Paris Cedex 2FranceTel + 33 1 42 98 12 34Fax + 33 1 42 98 11 42
SYDNEYBNP Paribas60 Castlereagh StreetSydney NSW 2000AustraliaTel + 61 2 9232 8733Fax + 61 2 9221 3026
ATHENSBNP Paribas94 Vassilissis Sofias Avenue and1 Kerasountos Street115 28 Athensor: P.O.Box 171 58 - 100 24 AthensGreeceTel + 30 210 74 68 000Fax + 30 210 74 86 726
FRANKFURTMainzer Landstrasse 16D-60325Frankfurt am MainGermanyTel + 49 69 71 930Fax + 49 69 71 93219
LUXEMBOURGBNP Paribas10A Boulevard Royal2093 LuxembourgTel + 35 24 64 61Fax + 35 24 64 64 141
NEW YORKBNP ParibasThe Equitable Tower787 Seventh AvenueNew YorkNY 10019U.S.A.Tel + 1 212 841 3000Fax + 1 212 841 3555
SINGAPOREBNP Paribas20 Collyer Quay#05-01 Tung CentreSingapore 049319Tel + 65 6439 5000Fax + 65 6538 4300
CHICAGOBNP Paribas209 South La Salle StreetChicagoIllinois 60604U.S.A.Tel + 1 312 977 2200Fax + 1 312 977 1380
LISBONBNP ParibasAv. 5 de Outubro, 2061050-065 LisbonPortugalTel + 351 21 791 0000Fax + 351 21 795 5616
MILANBNP ParibasPiazza San Fedele 220121 MilanItalyTel + 39 02 72 471Fax + 39 02 86 6388
SEOULBNP Paribas23rd & 24th Floor, Taepyeongno Building310 Taepyeongno 2-ga, Jung-guSeoul 100-767KoreaTel + 82 2 317 1700Fax + 82 2 757 2530
TOKYOBNP ParibasTokyo Sankei Building20th Floor1-7-2- Otemachi, Chiyoda-kuTokyo 100-0004JapanTel + 81 3 5290 1000Fax + 81 3 3529 1120
Part 1

Thursday 19th January 2006Renaissance Chancery Court Hotel252 High Holborn London WC1V 7EN
Annual
High YieldConference

The High Yield Handbook ⎪ January 2006
3 European High Yield Research
Introduction Our 2006 High Yield Handbook is similar to the 2005 version but with an increased number of credits covered and the addition of our 2006 Market Outlook. In 2005, we expanded our single-name research coverage to comprise roughly 90% of the European market in the BB-CCC spectrum while at the same time focussing increasingly on structural and technical factors affecting price action. Notwithstanding the current market trend, our analyses and publications remain fundamentally-driven, involving detailed company and sector assessment and frequent dialogue with issuers and investors.
A glance through the pages that follow suggests that the European High Yield market is alive and well. Investors in European high yield have enjoyed 3 consecutive years of positive returns; despite the increasingly LBO-dominated new issuance, the European market has never seen the diversity (in ratings and sectors) it currently enjoys and the number of market participants (mutual funds, hedge funds, underwriters) continues to reach new highs. Moreover, despite all the talk of the shortening economic cycles this credit cycle appears to be moving forward arduously (or mercifully) slowly. Our bottom up assessment of the credits in the market gives us little cause for panic; conversely, we find it hard to find a significant number of bad apples.
All this good news would suggest that the market is primed to disappoint soon, and looking at the balance of risk and valuations, risk aversion would not be an unreasonable reaction. Credit spreads are not far from their all time lows of early 2005 and by any measure absolute yields are dismally low. The current market population is dominated by the 2003-2005 vintages whose successful performance leaves the majority of bonds dangerously high in price terms, when considering the likelihood of increasing European government bond yields and the picture-perfect execution implied by credit spreads. Given the slim pickings, investors will be increasingly dependent on new issue performance to earn returns respectable enough to warrant exposure to junk-rated credit.
The environment therefore seems opportune for a slow but steady separation of high and low quality credit, and investors will be rewarded by monitoring companies and managements closely. To that end, we hope this publication is a useful resource.
Aizaz Shaikh Head of European High Yield Research

The High Yield Handbook ⎪ January 2006
4 European High Yield Research
European High Yield � 2006 Outlook Executive Summary In 2006, we expect European high yield to post a total return in the 4-5% range, based on the development of a number of scenarios.
A downside case sees a significantly higher number of stressed credits, as well as materially reduced liquidity in the credit markets, in which scenario we would expect total returns to be closer to 0-2%.
In our base case, we see little shift in European default rates, though an increase in corporate financial risk should result in a higher number of �stressed� credits, causing greater credit differentiation than we saw in the 2003-2005 period.
Our view is underpinned by a continuing environment of stable credit quality in the broad-based population of European HY bonds, non-threatening macro-economic factors and balanced supply/demand characteristics in the high yield bond market.
Key Risk Factors ! European 5-year government yields increasing beyond the current 50bp
expectation, causing a reversal in liquidity. Though typically less sensitive to government rates, extension risk (duration) is significant in the current High Yield market.
! Default or stress in benchmark situations. A GM bankruptcy or cracking of a significant or recent LBO would fundamentally alter the current risk appetite for credit.
Q1 2005 Spreads: The Bottom of the Cycle
0 %
1 %
2 %
3 %
4 %
5 %
6 %
2002-Q1 2002-Q3 2003-Q1 2003-Q3 2004-Q1 2004-Q3 2005-Q1 2005-Q3bp
200 bp
400 bp
600 bp
800 bp
1,000 bp
1,200 bp
1,400 bp
Quarterly High YieldDefault Rate (global)(LHS)
10 y Euro GovernmentBenchmark Yield (LHS)
Eurozone GDP growth yoy (LHS)
� High Yield OAS Spreads (RHS)
Source - BNP Paribas, Ecowin
Aizaz Shaikh [email protected] +44 20 7595 8607 Tran Dang, CFA [email protected] +44 20 7595 8291
The High Yield Handbook ⎪ January 2006
5 European High Yield Research
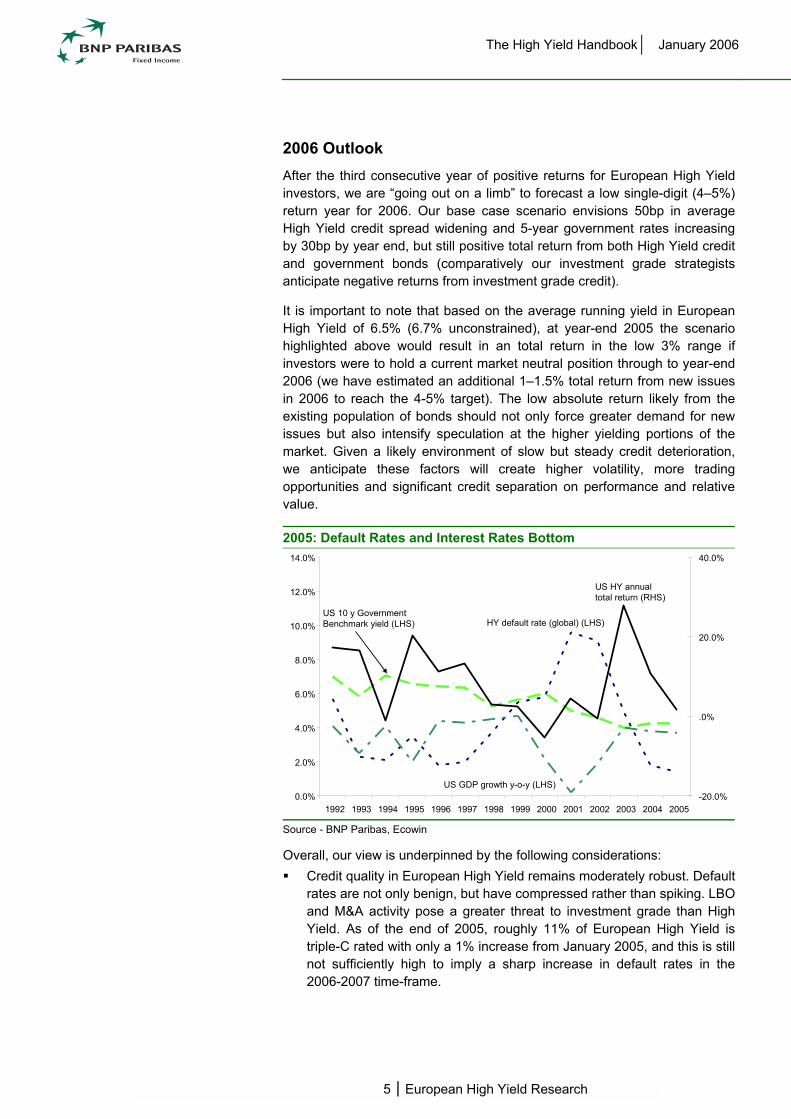
2006 Outlook After the third consecutive year of positive returns for European High Yield investors, we are �going out on a limb� to forecast a low single-digit (4�5%) return year for 2006. Our base case scenario envisions 50bp in average High Yield credit spread widening and 5-year government rates increasing by 30bp by year end, but still positive total return from both High Yield credit and government bonds (comparatively our investment grade strategists anticipate negative returns from investment grade credit).
It is important to note that based on the average running yield in European High Yield of 6.5% (6.7% unconstrained), at year-end 2005 the scenario highlighted above would result in an total return in the low 3% range if investors were to hold a current market neutral position through to year-end 2006 (we have estimated an additional 1�1.5% total return from new issues in 2006 to reach the 4-5% target). The low absolute return likely from the existing population of bonds should not only force greater demand for new issues but also intensify speculation at the higher yielding portions of the market. Given a likely environment of slow but steady credit deterioration, we anticipate these factors will create higher volatility, more trading opportunities and significant credit separation on performance and relative value.
2005: Default Rates and Interest Rates Bottom
0.0%
2.0%
4.0%
6.0%
8.0%
10.0%
12.0%
14.0%
1992 1993 1994 1995 1996 1997 1998 1999 2000 2001 2002 2003 2004 2005-20.0%
.0%
20.0%
40.0%
HY default rate (global) (LHS)US 10 y GovernmentBenchmark yield (LHS)
US GDP growth y-o-y (LHS)
US HY annualtotal return (RHS)
Source - BNP Paribas, Ecowin Overall, our view is underpinned by the following considerations: ! Credit quality in European High Yield remains moderately robust. Default
rates are not only benign, but have compressed rather than spiking. LBO and M&A activity pose a greater threat to investment grade than High Yield. As of the end of 2005, roughly 11% of European High Yield is triple-C rated with only a 1% increase from January 2005, and this is still not sufficiently high to imply a sharp increase in default rates in the 2006-2007 time-frame.

The High Yield Handbook ⎪ January 2006
6 European High Yield Research
! Eurozone macroeconomic factors are not threatening. In an environment of mild economic (GDP) growth, central bank action and inflation worries have been underwhelming and in Europe these factors do not pose a major hazard.
! Supply and Demand factors are generally in-line, with the imbalance primarily reflecting a lack of supply. While LBO volume is high, corporate refinancing has been muted, largely because much of this activity has been completed over the last 3 years of healthy credit market conditions. While the market expects a fat first quarter of new issuance volume (roughly �11bn), the significant bond maturities in 2006 (roughly �10bn) should provide a counterbalance. This stated, as deal size is rapidly increasing and buyouts increasingly unpredictable, forecasting new issue volume beyond 1-2 quarters is difficult.
While this represents our base case, we note that a combination of the following downside scenarios could contribute to a negative return year:
! Minor increase in the default rate but significant change in risk aversion: A GM/GMAC default coupled with a �cracking� of any of the major leveraged structures (Wind, Basell, Rexel, WDAC, KDG, NTL) could push average total return into negative territory for market-weighted investors.
! Credit market liquidity dries up and risk aversion increases: Less likely, but harder to predict and potentially more dangerous, a macro shock, either oil, inflation- or rates-related could remove the ubiquitous liquidity that has driven credit spreads to tight levels.

The High Yield Handbook ⎪ January 2006
7 European High Yield Research
Valuations and Returns Away from a broad-based deterioration in credit quality, the twin dilemmas facing High Yield investors today are the limited risk premium (spreads) for non-investment grade credit and the low absolute return. While we are somewhat concerned by the tightness of spreads, and do anticipate some spread widening, we are more troubled by the low absolute yield levels. Not only are the low yields problematic ahead of what could be more than just a brief rate increase cycle, but it could also pose a problem as capital moves to better rewarding assets such as equities, in a stronger economic environment, or higher in the capital structure (loans and crossover credit) in a deteriorating environment.
In 2005 through 1 December, European High Yield returned 5.9% in a year of modest spread tightening and stable credit quality. While 2005 was a subdued year for High Yield investors in Europe, from the record 30% in 2003 and 14% in 2004, the asset class performed well in comparison to US High Yield which has posted a 2% total return so far in 2005, lagging Europe for a third consecutive year, and in comparison to a 4% total return for European investment grade bonds. In contrast, European equities were up 15% for the year. We note the correlations (see table) indicate total returns on High Yield as more closely related to equities than investment grade bonds.
Total Returns for EUR HY and Other Asset Classes
4%
12%
49%
21%
-4%
-15%
-5%
-2%
-9%
6%
-14%
5%
-19%
-12%
7%
-7%
-1%
-36%
-22%
8%
26%28%
18%
29%
7%
15%
11%9%
11%8%
6%
2%
20%
5%3%3%
1%
29%
-4%
-50%
-40%
-30%
-20%
-10%
0%
10%
20%
30%
40%
50%
1998 1999 2000 2001 2002 2003 2004 2005
� High Yield $ High Yield DJ Stoxx 50 S&P500 I Boxx � C t
Source: BNP Paribas, Ecowin, Bloomberg � Data for 2005 in this report refer to the period 1 January to 1 December 2005 - EUR HY and USD HY indices are constrained indices

The High Yield Handbook ⎪ January 2006
8 European High Yield Research
Going forward, as of 1 December 2005, the current (constrained) market average yield is 6.5%, comprising an average coupon value of roughly 8%, with 4.3 average years to worst call. The average yield for single B credit in Europe is 7.4% versus 7.9% in US High Yield. (On an unconstrained basis the average yield is 6.7%). These data are hardly compelling; given the risk profile of much of the single-B spectrum of the market investors maybe better rewarded in the equity or subordinated capital portions of the capital markets.
On the positive side, given the link between the drivers of High Yield and equity returns, High Yield investors should have a positive year in 2006 in the event of strong earnings momentum as long as the ECB remains somewhat restrained.
In terms of High Yield credit, we saw a widening of the average of European non-investment spreads by 48bp between 1 January and 1 December 2005 to 348bp, with the widepoint of 480bp in June. We define the market as EUR HY fixed coupon bonds, with remaining time to maturity over 1 year. The market appears to have reached its bottom in HY spreads in this cycle in February 2005 when the average of non-investment grade spreads reached 242bp, the tightest since market inception in 1997.
Spreads for EUR HY Bonds by Rating
bp
200 bp
400 bp
600 bp
800 bp
1,000 bp
1,200 bp
1,400 bp
1,600 bp
Dec-01
Mar-02
Jun-02
Sep-02
Dec-02
Mar-03
Jun-03
Sep-03
Dec-03
Mar-04
Jun-04
Sep-04
Dec-04
Mar-05
Jun-05
Sep-05
Dec-05
BB �HY
B �HY
CCC and below �HY
� HY (constrained)
Source � BNP Paribas, Ecowin � OAS spreads to government curves � Ratings based on average of S&P, Moody�s and Fitch notes � includes GM /GMAC and Ford Extension Risk and Current Pricing Ordinarily High Yield will be less sensitive to interest rate movements than investment grade bonds, given the relative returns coming from the government and credits portion of the respective bonds. However, the high cash price of bonds in the European High Yield market is worrying as it creates a particularly unique vulnerability for certain bonds in the market.

The High Yield Handbook ⎪ January 2006
9 European High Yield Research
Price Distribution of EUR High Yield Fixed Coupon Bonds, Excluding GM in EUR bn of amounts outstanding January 2005 December 2005
% of total EUR bn % of total EUR bn Price <100 14% 7 19% 9 100 < Price < 110 53% 27 59% 30 Price >110 33% 16 22% 11 Total 100% 50 100% 50
Source � BNP Paribas, Bloomberg Not only do a large majority of bonds trade above par (81%), but 22% trade above 110. We believe a significant portion of this debt is from the 2003-2005 vintage of High Yield issuance, where mild credit enhancement has occurred in the context of a flattening yield curve. Not only are these bonds vulnerable from a credit weakening standpoint (given that the price action would imply near-perfect execution), but an increase in government rates beyond expectations could have a pronounced impact on bond prices due to their call structures. More specifically, an upward shifting and steepening yield curve, could mechanically shift the worst-call dates for these bonds (particularly those trading between 105-112) to their second, third or last call. While this is purely a mechanical shift in worst call dates, it can be understood conceptually that in an environment of rising interest rates, companies are more likely to keep the current bonds outstanding rather than refinancing them in the short/medium term. This extension of expected maturity, and the resulting change in duration, could accelerate bond price movements on the downside, without necessarily a shift in spreads (although spread widening would ensue along with the extension of the worst-call date in line with an upward sloping credit curve). Currently 30% of the callable EUR High Yield bonds are priced based on a worst call date being the next call.

The High Yield Handbook ⎪ January 2006
10 European High Yield Research
2006 Scenarios for High Yield Below, we outline some basic scenarios for 2006 and their expected impact on European High Yield. In 2005, the total return of 5.9% in European High Yield was comprised of a 3% from the government curve and a 2.9% credit return.
For 2006, we expect 2006 total return to vary between 0% and 5%, with 4-5% being our base case scenario. Our economists forecast 5-year interest rates in the Eurozone to increase by 30bp to 3.35% by December 2006, which would give a return of 1.8% on government bonds for the year. Our assessment is based on the EUR currency fixed rate bonds.
1. Base Scenario: Credit Spreads to Widen by 50bp We forecast a market average widening of 50bp in 2006 for EUR High Yield (vs. a 48bp widening to 338bp between January 2005 and December 2005) based on:
! A tightening by the ECB towards 2.75% and by the Fed to 4.75% by end 2006, with core inflation maintained;
! Oil price between $55-60/bbl over 2006; ! Eurozone GDP growth of 2% and US GDP growth of 3.5%; ! No surprise from Ford or GM;
If we take 3.3 as the duration of the EUR High Yield market (which has an average time to worst of 4.3 years), we forecast that the credit return would be 338bp-3.3*50bp = 173bp. Hence, we expect a 2006 total return of 1.8% + 1.7% = 3.5%. If we adjust for bond maturities and redemptions and additional total return from new issuance volume, we arrive to a total return of between 4% and 5%.
2. Downside Scenarios: Either GM or Worse GM/GMAC Default 2.1 GM Corp Default by End 2006 EUR bonds issued by GM Corp represent approximately 0.6% of EUR High Yield indices (constrained at 3%). If we assume that GM Corps bonds fall to 35 cents to the dollar, the yield on the bonds would widen by 1,100bp, which would lead to a 0.6%*1100 = 7bp additional widening of the index (more precisely 14bp widening of the EUR HY index if we take into account the longer duration of the GM Corp bonds compared to the EUR High Yield universe).
If we assume another 20bp widening from an increase in risk aversion from the market, the credit return for 2006 would be 0.6 % and total return 2.4%. If we adjust for bond maturities and redemptions and additional total return from new issuance volume, we arrive to a total return of 3.2%.

The High Yield Handbook ⎪ January 2006
11 European High Yield Research
2.2 Both GM Corp and GMAC default GM and GMAC bonds currently represent about �11bn of the �62bn market of EUR High Yield bonds with over 1 year to maturity. If we consider once again a 3% constrained index and we assume that spreads widen by 500bp on the GMAC bonds (we take a duration of 2 years and weighting of 2.4%) and 1,100bp on the GM Corp bonds before leaving the EUR index, we would have a negative impact on the index spread of 2.4%*500*2/3.3+0.6%*1100*7/3.3= 21bp.
If we assume another 25bp widening from an increase in risk aversion from the market, the credit return for 2006 would be 0.2% and total return 2 %. If we adjust for bond maturities and redemptions and additional total return from new issuance volume, we arrive to a total return of 2.8%.
3. Scenario 3: Scenario 2 combined with a more difficult Macro/economic environment We would forecast a widening of 150bp in 2006 for EUR High Yield based on:
! A tightening by the ECB towards 3% and by the Fed to 5% by end 2006; ! An average oil price of above $70/bbl over 2006; ! A sharp fall in US consumer spending; ! The fact that EUR High Yield credit spreads reached a record-high
150bp above the current level in Spring 05; Under this scenario, the credit return would be 338bp-3.3*150bp = -157bp.
We would expect a 2006 total return for EUR High Yield of between 0% and 1%.

The High Yield Handbook ⎪ January 2006
12 European High Yield Research
State of the European High Yield Market at Year End 2005 2005: Slight Deterioration in Credit Quality in European High Yield � More so in EUR Bonds Credit quality in European High Yield deteriorated slightly in 2005, with bonds rated B- and below representing 33% of the market (excluding GM) in December 2005 vs 30% in January 2005 (CCC ratings were 12% versus 10% in January).
Rating Distribution of European High Yield Market, Excluding GM, F January 2005 December 2005
% of market EUR bn % of market EUR bn
BB family 44% 40 43% 44 B+/B 23% 20 21% 21 B- 19% 17 21% 21 CCC family 11% 10 12% 12 NR 4% 3 3% 3 Total 100% 91 100% 101
Source � BNP Paribas, Ecowin, Bloomberg Ratings are based on average of Moody�s, S&P and Fitch notes Our definition of the European High Yield bond market include bonds denominated in EUR, GBP, CHF and USD and issued by European incorporated entities, including fixed rate, floating rate and PIK notes of amount outstanding over �100mn. We exclude bonds maturing within 1 year. We estimate that the European High Yield bond market is comprised of �115bn face value debt outstanding as of 1 December 2005 (+ �10bn maturing in 2006); or roughly 15% of the size US High Yield market. By currency, EUR bonds represent �71bn, USD bonds �32bn, GBP bonds �11bn and CHF bonds �1bn. These data include GM Corp and GMAC bonds totalling �13bn and Ford bonds totalling �1bn. If we consider EUR fixed cash pay coupon bonds only, deterioration in rating is greater.
Rating Distribution of EUR High Yield Fixed Coupon Bond, Excluding GM, F January 2005 December 2005
% of total EUR bn % of of total EUR bn
BB family 49 % 25 40% 20 B+/B 18% 9 18% 9 B- 20% 10 28% 14 CCC family 13% 6 15% 8 Total 100% 50 100% 50
Source - BNP Paribas, Ecowin, Bloomberg The slight deterioration is due to the lower quality of new issuance (see below), which was partially compensated by a higher number of upgrades vs downgrades by the rating agencies on the outstanding High Yield credits. Between 1 January 2005 and 1 December 2005, the composite rating of 34 issuers (representing �15bn of bonds) within European High Yield was upgraded while 23 issuers (�6bn of bonds) were lowered. Overall, agency

The High Yield Handbook ⎪ January 2006
13 European High Yield Research
rating changes in 2005 for European High Yield issuers was not significantly different from recent history and we have seen a slight decrease in downgrades � we expect a similar trend in 2006.
S&P�s Issuer Ratings Transition in Europe (% of Issuers)
From To Trailing 12m Sept �05 2004 Average
�81 � �04
BBB BB and below 2.6 1.6 5.6 BB B and below 8.4 9.9 9.6 B CCC and below 3.9 3.3 10.0 CCC/C D 20.0 40.0 28.7
From To Trailing 12m Sept �05 2004 Average
�81 � �04
BB BBB and above 5.6 2.0 5.7 B BB and above 7.8 8.3 5.8 CCC/C B and above 40.0 40.0 11.6
Source � BNP Paribas, S&P The amount of fallen angel debt in the European High Yield market remained fairly constant over 2005, primarily as GM paper replaced the maturing debt of credits that fell into High Yield in the 2001-2003 period. Excluding GM, fallen angels represented 27% (�27bn) of the market in December 2005 vs. 37% (�34bn) in January (the drop is largely driven by the exclusion of bonds maturing in 2006). Including GM, fallen angels represented 35% (�41bn) of the market in December.
Rating Distribution of European HY Bonds Outstanding (EUR bn) Industry Distribution of European HY Bonds
Outstanding (EUR bn)
� bn
� 5 bn
� 10 bn
� 15 bn
� 20 bn
� 25 bn
BB+ BB BB- B+ B B- CCC+ CCC CCC- CC C NR
as of 1 December 2005as of 1 January 2005
BB ratings: 48% of European High Yield
of which GM/GMAC:13% B ratings: 39% of European High Yield
CCC ratings: 10 % of European High Yield
GMAC �10bnGM �1bn
GM �2bn
�0 bn
�5 bn
�10 bn
�15 bn
�20 bn
�25 bn
�30 bn
Auto M
anufa
cturer
s
Buildin
g Mate
rials
Chemica
ls
Energy
Financ
ial / O
ther
Food C
onsu
mer Reta
il
Indus
trial
Packa
ging
Service
s Tran
sport
Steel
TMT
as of 1 December 2005as of 1 January 2005
GM/GMAC �13bn
Source � BNP Paribas � Ratings are average of S&P, Moody�s and Fitch � Excludes bonds with less than one year to maturity
Source � BNP Paribas � Ratings are average of S&P, Moody�s and Fitch � Excludes bonds with less than one year to maturity
The European High Yield market remains well diversified in terms of industry exposures. Telecoms Media and Technologies, with �25bn outstanding, still represents a significant portion of the market (23% excluding GM), but nowhere near its 75% dominance in 2000.

The High Yield Handbook ⎪ January 2006
14 European High Yield Research
Quality of Recent Issuance Given that new issuance and maturities result in a turnover of roughly 20% of the European High Yield market annually, it is important to examine quality of recently issued paper as a gauge of market health.
In 2005, the share of overall new issuance used to refinance debt and general corporate purposes fell significantly to 40% from over 60% in 2004. Comparatively the volume of LBO-financing deals has been the most notable change, increasing to �5bn (or 26% of total new issue voume) in 2005 vs. �2bn (or 16%) in 2003. Additionally, acquisition and dividend deals and a material amount (roughly �3bn) of deeply subordinated Payment-in-Kind (*) notes has resulted in a marked change in deal quality towards increasingly shareholder-friendly transactions.
*(Almatis, Ardagh, Avio, Cognis, Ecobat, Jefferson Smurfit, Kabel Deutschland World Directories).
European High Yield Issuance in 2005: Use of Proceeds (EUR bn) European High Yield Issuance in 2005: Bond
Ratings at issuance (EUR bn)
�0 bn
�5 bn
�10 bn
�15 bn
�20 bn
�25 bn
2002 2003 2004 2005
Issued by Financial institutionsShare repurchasing programmeRestructuringAcquisitionDividend to shareholdersLBO acquisitionDebt refinancingGeneral Corporate Purposes
�0 bn
�5 bn
�10 bn
�15 bn
�20 bn
�25 bn
2000 2001 2002 2003 2004 2005
NRCCCB-B/B+BB
Source � BNP Paribas Source � BNP Paribas
As a consequence the credit quality of new issuance deteriorated in 2005, with the proportion of B-/CCC growing from 23% of rated issuance in 2003 to 46% in 2005. Additionally, we estimate that leverage in LBO transactions has increased by between 0.5x and 1.0x EBITDA over past the past two years.

The High Yield Handbook ⎪ January 2006
15 European High Yield Research
European High Yield Issuance: Industry of Issuer (EUR bn)
�0 bn
�5 bn
�10 bn
�15 bn
�20 bn
�25 bn
2000 2001 2002 2003 2004 2005
TMTSteelServices TransportPackagingIndustrialFood Consumer RetailFinancial / OtherEnergyChemicalsBuilding MaterialsAuto Manufacturers
Source � BNP Paribas From a sectoral standpoint, TMT once again led the way, and was also the largest share of LBO-related High Yield issuance with the �1.3bn deal for the acquisition of Tim Hellas by a TPG/Apax, which was the largest all-bond financed leveraged buyout in Europe and Wind, the largest European LBO to-date.

The High Yield Handbook ⎪ January 2006
16 European High Yield Research
Quality of Recent Issuance Given that new issuance and maturities result in a turnover of roughly 20% of the European High Yield market annually, it is important to examine quality of recently issued paper as a gauge of market health.
In 2005, the share of overall new issuance used to refinance debt and general corporate purposes fell significantly to 40% from over 60% in 2004. Comparatively the volume of LBO-financing deals has been the most notable change, increasing to �5bn (or 26% of total new issue voume) in 2005 vs. �2bn (or 16%) in 2003. Additionally, acquisition and dividend deals and a material amount (roughly �3bn) of deeply subordinated Payment-in-Kind (*) notes has resulted in a marked change in deal quality towards increasingly shareholder-friendly transactions.
*(Almatis, Ardagh, Avio, Cognis, Ecobat, Jefferson Smurfit, Kabel Deutschland World Directories).
European High Yield Issuance in 2005: Use of Proceeds (EUR bn) European High Yield Issuance in 2005: Bond
Ratings at issuance (EUR bn)
�0 bn
�5 bn
�10 bn
�15 bn
�20 bn
�25 bn
2002 2003 2004 2005
Issued by Financial institutionsShare repurchasing programmeRestructuringAcquisitionDividend to shareholdersLBO acquisitionDebt refinancingGeneral Corporate Purposes
�0 bn
�5 bn
�10 bn
�15 bn
�20 bn
�25 bn
2000 2001 2002 2003 2004 2005
NRCCCB-B/B+BB
Source � BNP Paribas Source � BNP Paribas
As a consequence the credit quality of new issuance deteriorated in 2005, with the proportion of B-/CCC growing from 23% of rated issuance in 2003 to 46% in 2005. Additionally, we estimate that leverage in LBO transactions has increased by between 0.5x and 1.0x EBITDA over past the past two years.

The High Yield Handbook ⎪ January 2006
17 European High Yield Research
European High Yield Issuance: Industry of Issuer (EUR bn)
�0bn
�5bn
�10bn
�15bn
�20bn
�25bn
2000 2001 2002 2003 2004 2005
TMTSteelServices TransportPackagingIndustrialFood Consumer RetailFinancial / OtherEnergyChemicalsBuilding MaterialsAuto Manufacturers
Source � BNP Paribas From a sectoral standpoint, TMT once again led the way, and was also the largest share of LBO-related High Yield issuance with the �1.3bn deal for the acquisition of Tim Hellas by a TPG/Apax, which was the largest all-bond financed leveraged buyout in Europe and Wind, the largest European LBO to-date.

The High Yield Handbook ⎪ January 2006
18 European High Yield Research
Default Rates: No Signs Yet of the Expected Increase Default Rates and GDP Growth Rates
0.0%
1.0%
2.0%
3.0%
4.0%
5.0%
6.0%
7.0%
8.0%
9.0%
10.0%
1992 1993 1994 1995 1996 1997 1998 1999 2000 2001 2002 2003 2004 2005
HY default rate (global) (LHS)
US GDP growth y-o-y (LHS)
Source - BNP Paribas, Ecowin We expect the non-investment grade default rate to remain well below its long term average rate (4.9% for global issuers) in 2006, causing some restraint to the widely expected spread-widening. In 2005, after 3 years of steady decline, the European High Yield default rate reached 0% in the first quarter of 2005 and is currently at 0.4%. This is likely to increase in 2006 as the larger proportion of CCC issuance since 2003 is likely to put pressure on market credit spreads over the next 2 years (cumulative average default rate for CCC is 36% after 2 years ). S&P forecasts US speculative default rate to grow from 2% today to 2.6% at end of 2006.
Correlation between Spreads and Default Rates
bp
200 bp
400 bp
600 bp
800 bp
1,000 bp
1,200 bp
1,400 bp
May-02 Sep-02 Jan-03 May-03 Sep-03 Jan-04 May-04 Sep-04 Jan-05 May-05 Sep-05%
2%
4%
6%
8%
10%
12%
14%
16%
OAS Spreads (LHS)
European Default rate � High YieldCompanies (LHS)
Source - BNP Paribas, Ecowin, S&P

The High Yield Handbook ⎪ January 2006
19 European High Yield Research
Earnings and Sectoral Outlook In 2006, corporate earnings growth is likely to continue but at a slower pace, due to high energy prices and the high cost of raw materials. Our equity analysts (BNP Paribas Exane) expect 9% earnings growth in Europe in 2006 vs 14% in 2005 (and +10% for S&P500 in 2005). The Eurozone economies seem to have improved over the past few months; our economists forecast a 2% GDP growth in 2006 vs. 1.4% in 2005. However, the health of the economy is still fragile as the recovery is currently driven by external demand and not domestic consumption.
The impact of a stronger US dollar vs. the Euro should benefit European companies, however the main earnings risk remains the threat of a renewed increase in oil and raw material prices. In our view, there is a potential downside risk from current expectations if oil prices continue to trend higher after their decline from August records, as central banks appear to be more concerned over inflation to the potential detriment of economic growth.
Consensus expectations for higher interest rates in 2006 (50bp in Fed target rate by end of H1 2006, 50bp in ECB main refinancing rate to 2.75% by end 06) mean a more difficult environment for credit markets in general, and a surprise move by the ECB would be a negative catalyst for European High Yield.
From an event risk standpoint, GM filing for Chapter 11 is a risk - especially if a Delphi strike affects GM production, leading to large cash burns or if the sale of GMAC is delayed � this could have direct knock-on effect on suppliers and indirect effect on high beta names in the European High Yield universe. What is a mild positive for European investors is that 80% of the GM EUR outstanding bonds are issued by GMAC, which means that if GMAC is sold, the final impact on European credit spreads could be mild.
Key High Yield Sectors 1. TMT Contributed by Aizaz Shaikh, Senior High Yield Analyst
TMT continues to be an area of intense activity for European High Yield with a significant volume of new issuance and re-issuance. In 2005, M&A was the driver of much of the price action as consolidation in cable, mobile, and wireline telecom created opportunities to make and lose money. In terms of credit quality, 2005 was a year of mild improvement in certain sectors (directories, mobile) but higher financial risk in others (cable, telecom). In 2006 we would expect the current trends to continue, but also accelerate, as the frenzy for higher shareholder returns drives increasingly challenging deal structures. All this stated, TMT still is favourably positioned as a sector of decent immunity against cyclical weakness in the economy. Balance sheets in TMT are still healthy from the 2002-2004 reparation period, though some slight damage has been done in 2005. We do not expect to see a default in the roughly 30 credits TMT in European High Yield in 2006, however underperformance from the cable sector (as growth targets fail) or from

The High Yield Handbook ⎪ January 2006
20 European High Yield Research
certain telecom services companies (C&W, COLT, Wind) as competition becomes severe, would not be a surprise.
2. Industrials & Chemicals Contributed by Adam Harnetty, Senior High Yield Analyst
From a sector standpoint, mild earnings growth should remain in industrial sectors; the majority of the European High Yield capital goods companies have a stable outlook at S&P.
Given the increased risks in respect of worldwide growth and the secular changes occurring within Europe, it is difficult to have a particularly bullish view on the sector. Within general industrials, there are credits with secular stories we like, such as Alstom and Corus, whereas companies like Invensys and Grohe will be particularly sensitive to any weakening in the general economic outlook.
Within the chemicals sector, we would look to avoid exposure to very commoditised businesses and have a higher weighting towards speciality type companies where raw materials are typically a lower portion of the company's cost base. Of course, to the extent that growth surprises on the upside, this recommendation would be reversed.
While most European High Yield issuers have little exposure to the Far East, China and India continue to influence the fortunes of European industrial companies. Growth in China and India, due to increased domestic demand and off-shoring, has resulted in huge demand for commodities while serving as a disinflationary force for manufactured goods. This trend is set to continue with the following impacts:
! Commodity prices are likely to stay high; ! Basic manufacturing will continue to migrate away from Europe; ! A continuation of pressure on manufactured goods prices. Finally, energy costs (and especially oil) are a significant factor in many industrial companies and especially the chemicals industry. It would appear that prices are likely to remain high in the current environment. It is not at all clear that the supply of crude oil can be materially increased. Indeed given the lack of spare refining capacity, even if more crude oil were to become available it is not at all obvious that the price of refined products would fall significantly.
3. Consumers, Retail and Services Contributed by Oleksiy Soroka, Senior High Yield Analyst
We do not believe that consumer sector bonds will outperform the market in 2006. We think for this to happen, the retail environment and consumer confidence in Europe would need to improve materially relative to the current levels. At this stage, we are not convinced that this will be the case and, therefore, maintain our cautious stance with regards to the consumer sector notes. A strong macroeconomic recovery in Europe presents a positive risk relative to our base-case scenario.

The High Yield Handbook ⎪ January 2006
21 European High Yield Research
However, we expect more pressure in consumer and retail where we see weak consumer sentiment. S&P has 1/3 of European consumer goods companies under negative outlook or credit watch negative, the highest proportion among industries in Europe covered by S&P.
In terms of individual sub-sectors, we believe that retailers and food manufacturers will have another lacklustre year in 2006. We think that airlines will have a positive year, in spite of the continued high fuel prices. We do not expect any actual defaults in consumer sectors in 2006. However, a number of the consumer bonds are already in the "stressed" territory and things might get worse for some of them.
For instance, we are still cautious with regards to Focus as we do not see a recovery in the UK DIY market until the latter part of 2006. In addition, we note that IT Holding remains reliant on the support of its Italian bank group. Should that support falter, the company may face a liquidity crisis (we think that the banks will remain supportive throughout 2006). Waterford Wedgwood would be the most straightforward default candidate, were it not for a continued support of its shareholders.
Finally, we expect that operating results should improve at Fage Dairy. We expect that large and highly levered consumer sector LBO's, such as Rexel and Vendex, will continue to delever gradually during 2006. We now do not anticipate that any of the crossover names will actually make it to high grade next year, as we now expect that Ahold will only cross over the line in 2007.

The High Yield Handbook ⎪ January 2006
22 European High Yield Research
2006 Market Supply and Demand 2005 European High Yield Issuance: Healthy, but Short of 2004 and Below Expectations The low interest environment and attractive performance of the asset class in 2004 resulted in another healthy volume of new paper � roughly �21bn � in 2005. While this number was not far from the record levels of 2004, the anticipated volume was about �5-7bn higher. The cancellation or delay of a number of transactions into 2006 destabilized the market slightly in favour of the issuers with demand outstripping supply.
Overall, the European High Yield share of global High Yield issuance continued to increase, representing 30% of US issuance in 2005 vs 8% in 2002, however in the second half of 2005, the US market was significantly more active than Europe.
In 2006, we expect new issuance volume to reach �25bn, about the same as in 2004. This compares with bond maturities of roughly �10bn in 2006 and roughly �30bn in total by 2008.
European and US HY Issuance 2000-2005 (USD bn) Maturity Date of European HY market (Amount
Outstanding - EUR bn)
128
5
16
3025
43
79
59
131136
85
$0 bn
$20 bn
$40 bn
$60 bn
$80 bn
$100 bn
$120 bn
$140 bn
2000 2001 2002 2003 2004 2005
European High Yield issuanceUS High Yield issuance
�bn
�2bn
�4bn
�6bn
�8bn
�10bn
�12bn
�14bn
�16bn
Q106 Q206 Q306 Q406 2007 2008 2009 2010 2011 2012 2013 2014 2015 After2015
Total 2006 �10bn
Source � BNP Paribas Source � BNP Paribas
Difficult Supply/Demand Equation, Despite Significant Market Liquidity
Overall, we believe the current European High Yield market demonstrates balanced supply/demand features as seen with the more �reasonable� pricing of transactions in the second half of 2005 versus the first half. Still, in 2006 the supply and demand equation will be more difficult as a significant amount of new issuance is likely and mutual outflows, which have been steady, are likely to exacerbate in a number or scenarios. While investors and hedge funds continue to demonstrate significant cash and liquidity, we believe a minor disruption due to heightened risk aversion or unexpected interest rate movements could dramatically withdraw interest in non-investment grade credit until valuations are materially more attractive. This scenario, which occurred in the second quarter of each of the last 2 years, could be more pronounced in 2006 as other asset classes (i.e. equities, loans) present more appealing risk/reward characteristics.

The High Yield Handbook ⎪ January 2006
23 European High Yield Research
European High Yield Issuance Calendar for Q1 2006 (Estimated) Issuer Amount (mn) Use of Proceeds Almatis �200 Fund the acquisition by Investcorp Amadeus �900 Fund the acquisition by Cinven and BC Partners Colt Telecom �500 Refinancing of bonds and converts European Beverages �300 Fund the acquisition by Blackstone/Lion Capital Fresenius �700 Fund the acquisition of Helios Ineos �2,500 Fund the acquisition of Innovene
ISS �975 Fund the acquisition by EQT and Goldman Sachs Capital Partners
NTL �2,600 Fund the acquisition by Telewest ONO �270 Fund the acquisition of Auna�s cable division
TDC �2,275 Fund the acquisition by Apax, Blackstone, KKR, Permira and Providence.
Total �11,220 Source - BNP Paribas In terms of supply, the European High Yield Issuance calendar for Q1 2006 is heavy, partly because the second half of 2005 saw muted activity with certain large deals postponed to the New Year. In Q1 2006, �11bn equivalent in High Yield deals are expected to price, the majority of which will most probably be rated B or below. This compares with �8bn issued in Q1 2005, the period of tightest non-investment grade spreads in Europe to date, and which was followed by a significant pull back in spreads and investor interest in new issue.
Additionally, the growth of leveraged transactions is set to continue in 2006, with the emerging trend of private equity club deals increasing the size (and therefore number) of potential LBO targets. It is likely that the TMT sector will continue to be fertile ground for the large buyouts, in this context. Over the first 9 months of 2005, leveraged loan issuance was roughly �100bn vs. �44bn in 2004.
On the demand side, market conditions are less favourable than 1 year ago. US High Yield mutual funds, even though only represent 15% of investors, show negative signs � $12bn left the US High Yield mutual funds in 2005, compared to a $20bn inflow in 2003 and $3bn outflow in 2004 � underpinning the wariness of US investors toward High Yield over the past year.
AMG data � US Mutual Funds Inflow/Outflow 2002-2005 (USD bn)
-$3 bn
-$2 bn
-$1 bn
$ bn
$1 bn
$2 bn
$3 bn
$4 bn
Jan-02 Apr-02 Jun-02 Sep-02 Dec-02 M ar-03 M ay-03 Aug-03 Nov-03 Feb-04 Apr-04 Jul-04 O ct-04 Jan-05 M ar-05 Jun-05 Sep-05
W eely AM G Flow4 week m oving average
2002: +$8.0 bn (Inflow)
2003: +$20.0 bn (Inflow)
2004: -$3.0 bn (Outflow)
2005: -$12.0 bn (O utflow)
Source � BNP Paribas, AMG

The High Yield Handbook ⎪ January 2006
24 European High Yield Research
Companies Included in this Analysis Ticker Group Name Ticker Group Name Ticker Group Name ABB ABB FIAT Fiat NOMOS Commerzbank AES AES FKI FKI NSKIES New Skies AG Agco FOCFIN Focus NTLI NTL AGROK Agrokor FREGR Fresenius NYCO Nycomed AGZFIN Antargaz FSTINV First Investment Bank OCRNO Ocean Rig AHBR Allg Hypobank Rheinb GALFIN Global Automotive Logistics OI Owens Illinois AHOLD Ahold GAZPRU Gazprom ONOFIN Ono AHTLN Ashtead GBLXQ Global Crossing ORICB Industry & Construction Bank St Petersburg ALAFP Alcatel GERRES Gerresheimer PAREX Parex Banka ALFARU Alfa Bank GGY Compagnie Gle de Geophysique PENTAP Kloeckner Pentaplast ALLIBK Alliance Bank GILGR Gildemeister PERI Peri ALMAT Almatis GM GMAC PGSNO Petroleum Geo Services ALOFP Alstom GMKNRU Norilsk Nickel PIAGIM Piaggio ALROSA Alrosa GROHE Grohe PIPEHO Polypipe ANTTEN Antenna TV HCA HCA PPOUS Polypore ARGID Ardagh HCFB HCFB PREEM Preem ASPRO Avio HEADHO Head PREGIS Pregis ATUGRP ATU HECKKO Heckler & Koch PROMBK JSC Promsvyazbank AVECIA Avecia HEI HeidelbergCement PROSIE Prosieben BAB British Airways HELLAS Tim Hellas RAYAC Rexel BARY Barry Callebaut HHLCN Petrokazakhstan REMFIN Remy Cointreau BASLNV Basell HORN Hornbach RHA Rhodia BAXI Baxi HUNTSM Huntsman RHIAG Rhiag BCPLU Celanese IESYRP Iesy RIFP Allied Domecq BGY British Energy IFCOF Ifco RIVDEE Riverdeep BKBLN Brake Bros IMPEX Impex ROCKWO Rockwood BOMB Bombardier IMPMET Impress ROSBNK Rosbank BTAS Bank Turanalem INEACR Lucite RUSB Russian Standard Bank CABCOM Cablecom INMARS Inmarsat SAFILO Safilo CARMLI Carmeuse INTERG Intergas SAMC Samsonite CBBUS Concordia Bus INVTEL Invitel SAS SAS CCK Crown IRM Iron Mountain SAUR Saur CEDCUS Central European Distribution ISATIJ Indosat SCHEFE Schefenacker CELLSA Cell C ISSDC ISS SEAT Seat Pagine Gialle CETV Central European Media ISYSLN Invensys SGL SGL Carbon CFRMA CFR Marfa ITHOLD IT Holding SICPA Sicpa CHMFRU Severstal JENGR Jenoptik SINEK Sinek Capital CIRSA Cirsa JONDIV JohnsonDiversey SISFIN Sistema Capital CLONDA Clondalkin KABEL Kabel Deutschland SLTBSS Esselte CMACG CMA CGM KABLBW Kabel BW SOFTBK Softbank CODERE Codere KAMPS Kamps STENA Stena COGNIS Cognis KAPPA Kappa STZ Constellation Brands COLTEL Colt Telecom KKB Kazkommerts SUNSAG Sun Sage CORUS Corus KLOCK Kloeckner TEKS Teksid CPNL Calpine KOFFP Kaufman & Broad TELEC Tele Columbus CSK Chesapeake KRONOS Kronos TGHGR Thiel Logistik CULLI Culligan KVINO Aker Kvaerner TLNET Telenet CWLN Cable & Wireless LBCLUX LBC TMENRU Tyumen Oil DAMOVO Damovo LEA Lear TRW TRW Automotive DANKA Danka LEVI Levi Strauss TUIGR TUI DRRA Dura LR Legrand TVNSPZ TVN DUERR Duerr LUXHOL Luxfer UBF United Biscuits ECOBAT Ecobat LVLT Level 3 Communications UNM Provident EDITIS Editis MAUSER Mauser UPC UPC EIRCOM Eircom MBRDRU Moskow Bank VED Vedanta ELECAR Electricidad de Caracas MDPAC Jefferson Smurfit VENDEX Vendex ELETUR Elektrownia Turow MEGAFO Megafon VIP Vimpelcom ELN Elan MEPC MEPC VOD Mobifon EMI EMI MESSA M-Real WASTER Waste Recycling EP El Paso METSO Metso WBDFRU Wimm-bill-dann ESCADA Escada MICC Millicom WDAC World Dierctories ETL Eurotunnel MMKFIN MMK WINDIM Wind EVCINA Ineos Vinyls MOBTEL Mobile Telesystems WMG Warner Music EVRAZ Evraz MTUAER MTU Aero WTRFRD Waterford Wedgwood EXCLIJ Excelcomindo MTW Manitowoc XRX Xerox F Ford NELL Basell YELFIN Yell FAGEGA Fage Dairy NIKOIL Nikoil YIOULA Yioula Glassworks FDCSJ FoodCorp NLC Nalco
Source � BNP Paribas

The High Yield Handbook ⎪ January 2006
25 European High Yield Research
List of Issuers � Part 1 ABB 26 Invitel 220 Ahold 30 IT Holding 224 Alstom 32 Jenoptik 230 Antenna 36 Kabel BW 236 Ardagh 42 Kabel Deutschland 240 Avio Holding Spa (Aspropulsion) 46 Kamps 246 Barry Callebaut 50 Klockner Pentaplast 250 Basell 54 Kronos 254 Brake Brothers 58 Legrand 258 British Airways 64 Lucite 262 Cable & Wireless 66 MTU 266 CableCom 70 Nalco 270 UPC 71 NTL Cable plc 276 Carmeuse 80 ONO 280 Cell C 84 Polypore 284 Central European Media 90 Preem 288 CIRSA 94 Rallye 292 Clondalkin 100 Remy Cointreau 298 CMA CGM 104 Rexel 304 Codere 110 Rhodia 310 Cognis 116 Rockwood 314 Colt Telecom 122 Safilo 320 Corus 126 SAS 324 Culligan 130 Saur 328 Ecobat 136 Seat Pagine Gialle 334 Editis 140 Sicpa 340 Eircom 146 Smurfit Kappa Group 344 EMI 152 Sol Melia 350 Escada 158 Tele Columbus 352 Fage Dairy 162 Telenet 356 FKI 168 Tim Hellas 362 Focus 172 TUI 368 Gildemeister 178 TVN 372 GM 182 United Biscuits 376 Grohe 186 Unity Media (Iesy) 380 Head NV 190 Vendex KBB 386 Heckler & Koch 194 Warner 392 Hornbach 198 Wind 400 Impress Group 202 World Directories 406 Ineos Vinyls (EVC) 206 Yell 412 Inmarsat 210 Invensys 216

ABB Ltd ⎪ January 2006
26 European High Yield Research
ABB Ltd Bond Description & Market Data, as of 5 January 2006
Next Call Issuer Credit Trend: Positive
Description Amount (o/s) Ratings Date Price Price YTW STW
9.5% Sr Nts due 2008 EUR 500mn Ba2/BB- NC NC 114 3.65% 69bp 10% Sr Nts due 2009 GBP 200mn Ba2/BB- NC NC 116.29 6.10% 156bp 6.5% Sr Nts due 2011 EUR 650mn Ba2/BB- NC NC 112.8 4.03% 86bp
Source � BNP Paribas
Company Profile The ABB Group is a global provider of power and automation technologies that enable utility and industry customers to improve performance while lowering environmental impact. ABB works with their customers to engineer and install networks, facilities and plants with particular emphasis on enhancing efficiency and productivity for customers that source, refine and distribute energy. The group was formed in 1988 through a merger between Asea AB and BBC Brown Boveri AG. In June 1999, ABB Ltd became the holding company for the entire ABB Group. For the 12 months ended 30 September 2005, the group�s sales totalled $22.4bn with an EBITDA of $2.1bn, implying an EBITDA margin of 9.5%. Net debt stood at $866mn at the end of 30 September 2005.
Investment Recommendation ABB continues to make good progress on its restructuring and on growing revenues and the order book. As a result, cash flow has been materially strengthened. Importantly, ABB has come to an agreement with plaintiffs on its major asbestos suit, and is awaiting the final outcome of the Appeals Court process. Resolution of this issue is key to any move back to investment grade, which we expect in H1 06. Bond prices strike us as fair with the exception of the GBP bond which we think is expensive given our view of a move back to investment grade in H106 and the consequent step down of its coupon.
Debt Profile ABB�s gross debt at 30 September 2005 stood at $4,494mn. This was comprised of approximately $1.7bn of convertible bonds ($968mn 4.625% 2007 and CHF1bn 3.5% 2010), $2.1bn of bonds (�500mn 9.5% 2008, £200mn 10% 2009, CHF500mn 3.75% 2009 and �650mn 6.5% 2011) and $0.7bn of unanalysed debt. In terms of bank facilities, ABB recently signed a $2bn 5 year revolving credit facility due July 2010. In October 2005 ABB repurchased CHF392mn of the 2009 bond leaving CHF108mn outstanding.
Adam Harnetty, ACA +44 20 7595 8831 [email protected]

ABB Ltd ⎪ January 2006
27 European High Yield Research
ABB Ltd Structure
ABB Ltd
ABBHolding AG
ABB CapitalB.V.
ABB InternationalFinance Limited
ABB FinanceInc.
ABB Asea BrownBoveri Ltd
ABB FinancialServices B.V.
99.9996%
0.0004%
Keep-Well Agreement
ABB Ltd
ABBHolding AG
ABB CapitalB.V.
ABB InternationalFinance Limited
ABB FinanceInc.
ABB Asea BrownBoveri Ltd
ABB FinancialServices B.V.
99.9996%
0.0004%
Keep-Well Agreement
Keep-Well Agreement If the Issuer at any time will run short of cash and other liquid assets to meet any payment obligation on its debt, then the Issuer will promptly notify ABB Ltd of the shortfall and ABB Ltd will make available to the Issuer, before the due date of such payment obligation, funds sufficient to enable the Issuer to fulfil such payment obligation as it falls due. However, the agreement is not a guarantee by ABB Ltd of the payment of any indebtedness, liability or obligation of the Issuer.
Source � ABB

ABB Ltd ⎪ January 2006
28 European High Yield Research
Bond Covenants
EUR 500mn 9.5% (currently at 11%) Senior Notes 2008
GBP 200mn 10% (Currently at 11.5%) Senior Notes 2009
EUR 650mn 6.5% Senior Notes 2011
Bond description EUR Notes 9.5% + GBP Notes 10% EUR Notes 6.5%
Issuing entity ABB International Finance Ltd ABB International Finance Ltd
Ranking Senior notes Senior notes Position vs. bank debt No information provided No information provided
Position vs. other bonds Pari passu Pari passu
Security/guarantees None None
Optional redemption Optional early redemption (Call) � none Optional early redemption (Call) � none
Optional early redemption (Put) � none Optional early redemption (Put) � change of control
Change of control No 101 put if accompanied by ratings decline
Tax redemption Yes � at their principal amount Yes � at their principal amount
Negative pledge Yes Yes
Cross default Yes Yes
Fall away covenants No No
Anti-layering No No
Asset sales No No
Debt limit No No
Restricted payments No No
Transactions with affiliates No No
Rate of interest increase
The rate of interest may be increased/decreased depending upon the ratings assigned to the notes. Interest paid is 9.5% if Moody�s and S&P assign Baa3 and BBB- rating, respectively. In case of a downgrade by the aforementioned agencies or a termination of coverage by the aforementioned agencies (Rating decrease event), then the interest rate will be 9.5% plus 1.5% p.a. A return to the aforementioned ratings will reinstate the 9.5% coupon.
No
Source � BNP Paribas, ABB

ABB Ltd ⎪ January 2006
29 European High Yield Research
ABB Ltd, Financial Model FYE 31 December Actual Actual Restated Restated Restated Actual Actual Actual Actual Actual Forecast ForecastUSD mn 2002 2003 Q1 04 Q2 04 Q3 04 Q4 04 2004 Q1 05 Q2 05 Q3 05 2005 2006
PROFIT & LOSS Revenue 17,466 18,795 4,528 5,209 5,013 5,971 20,721 5,088 5,724 5,648 22,800 24,168 Cost of sales -13,067 -14,080 -3,350 -3,930 -3,834 -4,643 -15,757 -3,783 -4,327 -4,258 Gross Profit 4,399 4,715 1,178 1,279 1,179 1,328 4,964 1,305 1,397 1,390 SG&A -3,954 -3,830 -918 -948 -909 -1,011 -3,786 -955 -1,008 -929 Amortisation -41 -40 -11 -11 -12 -11 -45 -11 -11 -11 Other expense -58 -189 -2 1 -6 -42 -49 52 -7 -8 EBIT 346 656 247 321 252 264 1,084 391 371 458 1,695 1,933 D&A 611 585 148 148 142 195 633 142 145 156 600 600 EBITDA 957 1,241 395 469 394 459 1,717 533 516 614 2,295 2,533
Net Interest -126 -410 -79 -50 -28 -66 -223 -41 -95 -55
Revenue growth y/y 7.6% 5.1% 7.6% 10.1% 17.6% 10.2% 12.4% 9.9% 12.7% 10.0% 6.0% Gross margin 25.2% 25.1% 26.0% 24.6% 23.5% 22.2% 24.0% 25.6% 24.4% 24.6% EBITDA margin 5.5% 6.6% 8.7% 9.0% 7.9% 7.7% 8.3% 10.5% 9.0% 10.9% 10.1% 10.5%
CASHFLOW
Change in working capital 418 253 -285 -467 89 645 20 -555 -259 -167 Cash from operating activities 19 -161 -141 -136 322 880 962 -235 168 387
Capex -602 -547 -98 -137 -109 -199 -543 -79 -101 -133 Acquisitions/disposals 2,365 488 16 283 806 53 1,158 -5 -13 -23 Other 888 813 -806 852 -164 -143 -261 -442 692 -213 Cash from investing activities 2,651 754 -888 998 533 -289 354 -526 578 -369
Net debt repayment -2,815 -1,028 -1,070 -647 -1,027 29 -2,752 -185 -25 -218 Other 3 2,619 -40 -22 3 6 -53 6 -43 -11 Cash from financing activities -2,812 1,591 -1,110 -669 -1,024 35 -2,805 -179 -68 -229
FX & Other 167 149 53 138 106 87 382 -122 -104 12
Net change in cash 25 2,333 -2,086 331 -63 713 -1,107 -1,062 574 -199
BALANCE SHEET
Cash & Equivalents 2,925 5,142 3,820 3,405 3,596 4,200 4,200 3,651 3,575 3,628
Total Debt 7,928 7,887 6,748 6,115 5,178 5,534 5,534 5,161 4,912 4,494
Net Debt 5,003 2,745 2,928 2,710 1,582 1,334 1,334 1,510 1,337 866
Pension Liability 2,077 1,820
LTM RATIOS Coverage 7.6 3.0 3.8 4.8 6.8 7.7 7.7 10.0 8.3 8.3 EBITDA-Capex/Interest 2.8 1.7 2.3 3.1 4.7 5.3 5.3 7.2 6.1 6.3
Gross leverage 8.3 6.4 4.9 3.9 3.3 3.2 3.2 2.8 2.6 2.1 Net leverage 5.2 2.2 2.1 1.7 1.0 0.8 0.8 0.8 0.7 0.4
Source � BNP Paribas, ABB

Ahold ⎪ January 2006
30 European High Yield Research
Ahold Bond Description & Market Data, as of 5 January 2006
Next Call Issuer Credit Trend: Positive
Description Amount (o/s) Ratings Date Price Price YTW STW
6.375% Senior Notes due 2007 EUR 200mn Ba2/BB NC NC 104.79 3.70% 75bp 5.875% Senior Notes due 2008 EUR 1,500mn Ba2/BB NC NC 105.28 3.57% 58bp 5.875% Senior Notes due 2012 EUR 600mn Ba2/BB NC NC 107.70 4.42% 119bp
Source � BNP Paribas
Company Profile Ahold operates a number of large supermarket chains in the United States and in Europe, and runs foodservice business in North America. Ahold�s largest US retail franchises include Stop & Shop (Massachusetts, Connecticut, Rhode Island, New Jersey and New York), Giant-Carlisle (Maryland, Virginia and West Virginia) and Giant Food/Giant Landover (Maryland, Virginia, Delaware, New Jersey, District of Columbia). In Europe, Ahold�s Albert Heijn is the leading food retailer in The Netherlands. Ahold also owns 60% of ICA AB, a food retailer and wholesaler in Scandinavia and the Baltic countries (the retailer is not consolidated in the group�s financials). Ahold also operates supermarkets in Portugal (Jeronimo Martins) and in Central Europe. In the US, Ahold is the second-largest foodservice operator, in terms of turnover, after Sysco Corporation. In February 2003, significant accounting irregularities were uncovered in Ahold�s financials. The company has since changed the top managers and restated its accounts for the period of 2001-2003. We calculate that for the twelve months ended 9 October 2005, in its continuing operations, Ahold had turnover of �45,491mn and EBITDA of �2,319mn. At the end of third quarter 2005, the company had lease-adjusted leverage of 3.6x and lease-adjusted coverage of 2.4x.
Investment Recommendation We maintain our HOLD/Positive Credit Trend recommendation for Ahold�s notes. We continue to think that the company is on track to regain an investment-grade status, but we now feel that it may take longer than we have originally envisaged to achieve this. We note that the agreed sizeable cash payout slated for 2006 and related to the settlement of the class actions will probably delay the upgrade until 2007 (rather than the second half of 2006 we expected earlier). S&P�s comment published on 26 November 2006 states that the magnitude of the cash payout related to the settlement �will delay the potential restoration of an investment-grade rating� and that the company is now expected to reach the minimum parameters commensurate with the current rating level by the end of 2006. S&P�s issuer credit rating for Ahold is BB+ (Positive Outlook), while the bond rating is one notch lower, at BB. Moody�s has Ahold�s senior implied rating at Ba2 (Outlook Positive) and the bond rating is the same. We think that the rating agencies will need to see a consistent and satisfactory operating performance by the company, including an improvement in profitability of the US Foodservice business, before effecting any further upgrades. In our view, a marked deterioration in the company�s profitability will delay the ratings upgrade further.
Debt Profile As of 9 October 2005, Ahold had total debt of �8,856mn, including long-term portion of �7,944mn and short-term portion of �912mn. The company�s total debt comprised bonds and loans of �5,661mn, finance leases of �1,830mn, cumulative preferred financing shares of �666mn and short-term borrowings of �699mn. On 18 May 2005, Ahold signed a new credit facility with a syndicate of 15 banks. This is a five-year �2.0bn multi-currency facility which matures in five years. The facility is unsecured and is, therefore, pari passu with the company�s unsubordinated bonds. This is subject to a leverage covenant, which falls away when the corporate rating is BBB/Baa2 or better. As of the end of third quarter 2005, the credit facility was undrawn, except for the use of letters of credit in the amount of $665mn (�549mn). As of 9 October 2005, Ahold also had pension and other retirement benefit liabilities of �563mn.
Oleksiy Soroka, CFA +44 20 7595 4878 [email protected]

Ahold ⎪ January 2006
31 European High Yield Research
Ahold, Financial Model BNPP BNPP BNPP BNPP BNPPFYE 31 December Actual Actual Actual Actual Actual Actual F�cast F�cast F�cast F�cast F�castEUR mn 2002 2003 2004 Q1 05 Q2 05 Q3 05 Q4 05 2005 2006 2007 2008 P&L SUMMARY Sales breakdown Net sales 62,683 56,068 52,000 12,966 10,447 10,249 12,291 45,953 47,106 47,601 48,757 % change -10.6% -7.3% -1.0% -0.9% 0.7% 3.9% 0.7% 2.5% 1.0% 2.4% Operating profit breakdown Stop & Shop/Giant-Landover Arena 1,186 1,012 681 235 150 166 245 796 812 791 790 % change 7.5% 7.4% 5.3% 6.1% 4.9% 5.5% 7.0% 5.9% 5.9% 5.9% 5.8% Giant-Carlisle/Tops Arena 219 105 113 39 44 -17 -17 49 64 74 73 % change 3.5% 1.9% 2.2% 2.6% 3.7% -1.5% -1.3% 1.0% 1.3% 1.5% 1.5% Albert Heijn Arena 348 289 297 90 67 62 76 295 308 316 324 % change 5.5% 4.6% 4.6% 4.5% 4.4% 4.3% 4.5% 4.4% 4.5% 4.5% 4.5% Central Europe Arena -40 -59 -54 -12 -2 -12 -14 -40 -18 5 19 % change -2.6% -3.7% -3.2% -3.0% -0.5% -2.8% -2.8% -2.3% -1.0% 0.3% 1.0% Schuitema 27 13 27 31 98 98 99 100 % change 2.9% 1.8% 3.8% 3.8% 3.1% 3.1% 3.1% 3.1% Other retail 2 0 0 0 2 0 0 0 Total retail sales 381 272 226 320 1,199 1,264 1,284 1,306 % change 4.4% 3.9% 3.4% 4.1% 4.0% 4.1% 4.2% 4.2% US Foodservice 160 -200 -74 17 35 43 55 150 277 341 402 % change 0.9% -1.3% -0.5% 0.4% 1.0% 1.2% 1.3% 1.0% 1.7% 2.0% 2.3% Group Support Office -52 -59 -907 -55 -1,073 -210 -210 -210 Operating profit 239 718 208 346 248 -638 320 276 1,331 1,415 1,498 operating margin 0.4% 1.3% 0.4% 2.7% 2.4% -6.2% 2.6% 0.6% 2.8% 3.0% 3.1% EBITA before impairments & gains on disposal & one-offs 2,399 1,328 1,341 391 268 337 405 1,401 1,519 1,603 1,686 % of net sales 3.8% 2.4% 2.6% 3.0% 2.6% 3.3% 3.3% 3.0% 3.2% 3.4% 3.5% Estimated Depreciation 1,285 1,126 1,047 246 178 183 190 797 857 917 977 EBITDA before impairments & gains on disposal & one-offs 3,684 2,454 2,388 637 446 520 595 2,198 2,376 2,520 2,663 % of net sales 5.9% 4.4% 4.6% 4.9% 4.3% 5.1% 4.8% 4.8% 5.0% 5.3% 5.5% Net cost of rentals and operating leases 866 822 682 136 136 136 136 544 510 464 418 EBITDAR before impairments & gains on disposal & one-offs 4,550 3,276 3,070 773 582 656 731 2,742 2,886 2,984 3,081 Net interest income -944 -952 -717 -193 -137 -128 -125 -583 -453 -337 -313 Gain (loss) on foreign exchange -50 14 5 3 20 16 15 54 0 0 0 Other financial income and expense -14 0 1 -22 0 0 0 -22 0 0 0 Net financial expense -1,008 -938 -711 -212 -117 -112 -110 -551 -453 -337 -313 Income before income taxes -769 -220 -503 134 131 -750 210 -275 879 1,078 1,186 Income taxes -390 72 -66 -35 -18 282 -80 149 -307 -377 -415 effective tax rate -50.7% 32.7% -13.1% 26.1% 13.7% 37.6% 38.0% 54.3% 35.0% 35.0% 35.0% Income after income taxes -1,159 -148 -569 99 113 -468 130 -126 571 701 771 Share in income/loss of joint ventures and equity investees -38 161 146 30 26 40 35 131 140 150 160 Minority interest -11 -14 -13 -5 -11 -5 -5 -26 -28 -30 -32 Net income -1,208 -1 -436 124 128 -433 160 -21 683 821 899 Dividends on cumulative pref fin. shares/inc from discont�d ops -38 -38 -44 10 2 194 0 206 0 0 0 Net income available to common shareholders -1,246 -39 -480 134 130 -239 160 185 683 821 899 CASH FLOW ITEMS EBITDA 3,684 2,454 2,388 637 446 520 595 2,198 2,376 2,520 2,663 Net cash interest expense -944 -952 -717 -193 -137 -128 -125 -583 -453 -337 -313 Other operating cash items -64 14 6 6 7 3 5 21 20 20 20 Cash flow before changes in working capital & cash taxes 2,676 1,516 1,677 450 316 395 475 1,636 1,944 2,203 2,371 Cash effect from changes in working capital 76 468 -94 -182 51 8 -50 -173 -50 -50 50 Change in other non-current assets -7 18 30 34 -2 0 0 32 0 0 0 Change in other provisions 33 53 42 12 21 0 0 33 0 0 0 Corporate income taxes paid -423 -13 -113 -47 -40 53 -21 -55 -6 -377 -415 Change in other non-current liabilities 100 -111 29 -3 -10 -263 0 -276 0 0 0 Other operating cash items 0 0 0 0 0 0 0 0 0 0 0 Net cash from operating activities 2,455 1,931 1,571 264 336 193 404 1,197 1,887 1,776 2,006 Purchase of tangible and intangible fixed assets (capex) -2,160 -1,357 -1,402 -225 -342 -366 -517 -1,450 -1,500 -1,500 -1,500 Free cash flow 295 574 169 39 -6 -173 -113 -253 387 276 506 BALANCE SHEET ITEMS Cash and cash equivalents at end of period (cont�d ops) 1,002 3,340 3,270 3,947 3,107 3,019 2,042 2,042 2,077 1,648 1,682 Including cash on hand 261 271 274 275 275 285 295 305 Cash and cash equivalents without cash on hand 3,686 2,836 2,745 1,767 1,767 1,792 1,353 1,377 Loans 5,416 5,592 5,550 4,371 4,371 3,888 3,680 3,303 Finance lease liabilities 1,592 1,708 1,728 1,719 1,719 1,617 1,515 1,413 Cumulative preferred financing shares 666 666 666 666 666 666 666 666 Long-term portion of long-term debt 8,768 7,231 7,674 7,966 7,944 6,756 6,756 6,171 5,861 5,382 Short-term borrowings 660 703 699 699 699 699 699 699 Current portion of loans 1,748 205 111 280 280 483 208 377 Current portion of finance lease liabilities 97 94 102 102 102 102 102 102 Short-term debt and current portion of long-term debt 1,991 2,039 2,505 1,002 912 1,081 1,081 1,284 1,009 1,178 Total debt 12,907 10,759 9,270 10,179 8,968 8,856 7,837 7,837 7,455 6,870 6,560 Net debt 11,905 7,419 6,000 6,232 5,861 5,837 5,795 5,795 5,378 5,222 4,878 CREDIT RATIOS Total debt/EBITDA 3.5x 4.4x 3.9x 4.4x 3.9x 3.8x 3.6x 3.6x 3.1x 2.7x 2.5x Net debt/EBITDA 3.2x 3.0x 2.5x 2.7x 2.6x 2.5x 2.6x 2.6x 2.3x 2.1x 1.8x EBITDA/Net interest expense 3.9x 2.6x 3.3x 3.4x 3.5x 3.7x 3.8x 3.8x 5.2x 7.5x 8.5x Net lease-adjusted debt/EBITDAR* 4.1x 4.3x 3.7x 3.8x 3.7x 3.6x 3.7x 3.7x 3.3x 3.0x 2.7x EBITDAR/(Net interest and lease expenses)** 2.5x 1.8x 2.2x 2.2x 2.3x 2.4x 2.4x 2.4x 3.0x 3.7x 4.2x
Source � BNP Paribas Estimates, Ahold Leverage and Coverage are based on the last 12 months� results. Some of the ratios are adjusted for the effects of acquisitions and disposals. In addition, these 2 measures are usually calculated based on EBITDA adjusted for exceptional or non-recurring items. *Leverage is defined as net lease-adjusted debt (x8 operating leases)-to-EBITDAR. ** Coverage is defined as EBITDAR-to-(net interest+rental expenses).

Alstom ⎪ January 2006
32 European High Yield Research
Alstom Bond Description & Market Data, as of 5 January 2006
Next Call Issuer Credit Trend: Positive
Description Amount (o/s) Ratings Date Price Price YTW STW
5% Senior Notes due 2006 EUR 227.6mn NR NC NC 100.5 4.00% 134bp EB + 220 Notes due 2009 EUR 600mn NR NC NC 103 3.60% 62bp 6.25% Senior Notes due 2010 EUR 1,000mn NR NC NC 106 4.62% 151bp
Source � BNP Paribas
Company Profile
Alstom is a global producer of products and services that supply the electrical power generation and transport markets. The company has production facilities in Europe (principally France, UK and Germany), North and South America, Asia and Africa. For the 12 months ended 30 September 2005, the Company had sales of �14.1bn and employed approximately 70,000 people in around 70 countries. The company is organised into 4 main divisions, power turbo systems, power service, transport and marine.
Investment Recommendation
The company�s operational and financial issues now appear well and truly behind them. Having hit a low point in H1FY05 revenues have grown strongly off the back of an improving order book. Operating margins have rebounded from a mixture of cost cutting, better contract execution and increased scale. The operational issues relating to the GT24/GT26 turbines also appear resolved with Alstom having gained new orders and the existing installed fleet is operating without incident. Alstom�s bonds have performed strongly since issued but we believe that the operational improvement will continue and drive spreads tighter. Accordingly, we have a BUY recommendation on Alstom�s bonds.
Debt Profile
The group�s main borrowings are as follows:
! Bonds Outstanding As at 30 September 2005, the group had 3 material bond issues outstanding. A 5% 2006 bond for �228mn which had been reduced from �650mn following a tender offer. In February 2005, the group issued a new �1bn 6.25% 5-year bond to finance a tender of its existing issues and raise additional finance. In September 2005 the Group issued �600mn of floating rate notes due March 2009 at Euribor plus 220bp to be used for general corporate purposes.
! Bank Debt
The group has 2 main facilities: � �704mn multi-currency revolver due 3 August 2006, undrawn at 30 September 2005. This facility is pari passu with the public bond issues. � �1,563mn PSSD subordinated bank facility due 30 September 2008, following various repayments and related cancellations, �418mn was drawn and �121mn was available at 30 September 2005.
! Other Debt
Other debt at 30 September 2005 amounts to �750mn and is structurally senior to the bonds. Included within this amount are �205mn preference shares due in 2006, �128mn of bilateral loans, �4mn of securitised receivables and �413mn of other borrowings.
! Capital Leases
Under IFRS, the company now capitalises finance leases. As at 30 September 2005 finance leases totalled �250mn.
Adam Harnetty, ACA +44 20 7595 8831 [email protected]
An officer, director, or employee of BNP Paribas currently sits on the board of Alstom.

Alstom ⎪ January 2006
33 European High Yield Research
Alstom Structure
ALSTOM(France)
ALSTOM Holdings(France)
8
7
6
5
4
3
2
1
ALSTOM UK Holdings Ltd(Holding - UK)
ALSTOM Espana IB(Holding � Spain)
ALSTOM NV(Holding � Netherlands)
ALSTOM Power Holdings Ltd(Holding � Brazil)
ALSTOM (China) Investment Co. Ltd(Holding � China)
ALSTOM Mexico SA de CV(Holding � Mexico)
ALSTOM Inc.(Holding � USA)
ALSTOM GmbH(Holding � Germany)
ALSTOM Power Holdings(France)
ALSTOM Power Boilers SA(France)
ALSTOM Power Service SA(France)
ALSTOM Power Hydro(France)
4
4
4
4
4
4
4
4
4
4
44
4
4
2
ALSTOM Power Turbomachines
(France)
ALSTOM Power Services GmbH
(Germany)
ALSTOM Power Italia SpA
(Italy)
ALSTOM Power SP Zoo(Poland)
ALSTOM Power Sweden AB
(Sweden)
ALSTOM Power Switzerland Ltd
(Switzerland)
ALSTOM Power Centrales(France)
ALSTOM Power Hydraulique
(France)
ALSTOM Power sro
(Czech Republic)
ALSTOM Power Inc
(USA)
ALSTOM Power UK Holdings Ltd
(UK)
ALSTOM Power Asia Pacific SdnBhd (Malaysia)
ALSTOM Power Generation AG
(Germany)
ALSTOM KK(Japan)
ALSTOM Power Boiler GmbH
(Germany)
ALSTOM Transport SA (France)
ALSTOM Ferroviaria SpA(Italy)
ALSTOM Transporte(Spain)
ALSTOM LHB GmbH (Germany)
ALSTOM Transporte SA DE CV (Mexico)
ALSTOM Brasil Ltda(Brazil)
ALSTOM Transport (UK)
ALSTOM Transportation Inc (USA)
ALSTOM Signaling Inc. (USA)
4
3
1
5
5
2
6
8
Chantiers de L�Atlantique(France)
ALSTOM Leroux Naval (France)
A.M.R. (France)
ALSTOM Power Conversion SA
(France)
ALSTOM Power Conversion
GmbH (Germany)
ALSTOM Power Conversion Ltd
(UK)
1
2
Source � Alstom

Alstom ⎪ January 2006
34 European High Yield Research
Bond Covenant Bond description EB + 220 Notes due 2009 6.25% Senior Notes due 2010
Issuing entity Alstom Alstom
Ranking Senior Notes Senior Notes
Position vs. bank debt Pari passu/Senior Pari passu/Senior
Position vs. other bonds Pari passu Pari passu
Security/guarantees None None
Optional redemption No No
Tax redemption Yes � at par Yes � at par
Negative pledge Yes but listed/traded bonds only Yes but listed/traded bonds only
Cross default Yes Yes
Fall away covenants No No
Anti-layering No No
Change of control Put at 101, based on >50% voting power Put at 101, based on >50% voting power
Asset sales No No
Debt limit None None
Restricted payments None None
Transactions with affiliates None None
Source � BNP Paribas, Alstom

Alstom ⎪ January 2006
35 European High Yield Research
Alstom, Financial Model
IFRS IFRS IFRS IFRS
FYE 31 March Actual Actual Actual Actual Actual Actual Actual EUR mn 2002 2003 2004 H1 05 H2 05 2005 H1 06
PROFIT & LOSS Orders 22,686 19,123 16,500 8,363 7,478 15,841 7,454
Revenues 23,453 21,351 16,688 6,316 7,211 13,527 6,938 Cost of sales -19,623 -19,187 -14,304 -5,376 -6,190 -11,566 -5,810 Gross Margin 3,830 2,164 2,384 940 1,021 1,961 1,128 SG&A -2,889 -2,671 -2,084 -803 -791 -1,594 -781 Operating Income 941 -507 300 137 230 367 347 Restructure Charges -227 -268 -655 -69 -289 -358 -38 Pension & other -227 -354 -516 -41 -34 -75 -6 EBIT 487 -1,129 -871 27 -93 -66 303 Financial Expense -294 -270 -460 -242 -156 -398 -88 Tax -10 263 -251 -23 -140 -163 -75 Minority Interests -36 -12 2 -4 3 -1 -3 Goodwill -286 -284 -256 0 0 0 0 Net Profit/(Loss) -139 -1,432 -1,836 -242 -386 -628 137
EBIT 487 -1,129 -871 27 -93 -66 303 D&A 506 470 470 236 311 547 296 (Gain)/loss on fixed asset disposals -198 -19 -175 1 -52 -51 -123 EBITDA post restructure 795 -678 -576 264 166 430 476 Restructure Charge 227 268 655 69 289 358 38 Adjusted EBITDA 1,022 -410 79 333 455 788 514
Order growth y/y -15.7% -13.7% -10.9% Revenue growth y/y -9.0% -21.8% 9.8% Gross Margin 16.3% 10.1% 14.3% 14.9% 14.2% 14.5% 16.3% EBITDA Margin 4.4% -1.9% 0.5% 5.3% 6.3% 5.8% 7.4%
CASHFLOW
Change in working capital -920 550 -5 -326 297 -29 -66 Net cash from operating activities -579 -537 -1,058 -286 276 -10 230
Gross capex -550 -410 -254 -96 -169 -265 -123 Net disposals 659 -128 1,446 340 588 928 272 Other 14 197 369 -541 231 -310 18 Net cash used in investing activities 123 -341 1,561 -297 650 353 167
Net cash from financing activities -136 621 1,173 1,979 19 1,998 -3
FX & Other 4 -505 -21 -32 61 29 37
Change in net debt -588 -762 1,655 1,364 1,006 2,370 431
BALANCE SHEET
Cash & ST Investments 2,236 1,770 1,466 1,329 1,404 1,404 1,952
Redeembale Preference shares 205 205 205 205 205 Subordinated bonds due 2006 250 250 5 5 5 Syndicated loans 722 666 0 0 0 Subordinated long term bonds 500 0 0 0 0 Subordinated syndicated loans 1,200 1,039 1,039 1,039 418 Securitised receievables 265 100 49 49 4 Leases 0 255 268 268 250 Other 580 1,699 973 973 536 5% 2006 bond 650 650 228 228 228 FRN 2009 0 0 0 0 559 6.25% 2010 bonds 0 0 1,000 1,000 1,000 Gross Debt 6,490 6,331 4,372 4,864 3,767 3,767 3,205
Net debt 4,254 4,561 2,906 3,535 2,363 2,363 1,253
LTM RATIOS
Coverage 3.5 na 0.2 2.0 4.0 EBITDA-Capex/Interest 2.0 na 0.2 1.3 2.8 Gross leverage 5.6 na 55.3 4.8 3.3 Net leverage 3.7 na 36.8 3.0 1.3
Source � BNP Paribas Estimates, Alstom

Antenna ⎪ January 2006
36 European High Yield Research
Antenna Bond Description & Market Data, as of 5 January 2006
Next Call Issuer Credit Trend: Stable
Description Amount (o/s) Ratings Date Price Price YTW STW
7.25% Senior Notes due 2015 EUR 120mn B1/B+ 15-Feb-10 103.625 97 1/2 7.63% 441 bp Source � BNP Paribas
Company Profile Antenna TV is the leading television broadcast network and producer of television programming in Greece with the number one position in terms of both ratings and audience share. In addition, the company publishes 13 magazines through its subsidiary, Daphne Communications (89.4% ownership), owns and operates a leading radio station, Antenna Radio, and also pursues activities in pay television, music production and other media related sectors. Outside of Greece, Antenna distributes its programming internationally and owns radio and television assets in Bulgaria. On 24 October 2005, Antenna TV entered into an agreement with G&J Intl. Publishing, pursuant to which Antenna agreed to sell a 50% interest in Antenna Publications (the holder of a 95% interest of Daphne) for an aggregate purchase price of �19.8mn. The transaction is expected to close by February 2006 and will be treated as an asset sale for purposes of the indenture governing the 2015 Notes. The beneficial ownership of 98.5% of the Antenna TV�s outstanding capital stock is held by entities which are solely owned by members of the Kyriakou family. For the last twelve months ended 30 September 2005, Antenna TV had revenue of �208mn and EBITDA of �26mn.
Debt Profile As at 30 September 2005, Antenna TV had approximately �183mn of debt, consisting primarily of �120mn of 2015 Notes, �40mn of long-term debt from other local credit facilities, bank overdrafts and short-term borrowings of �22.1mn and �0.8mn of long-term obligations under capital leases.
�25mn Credit Facility
In December 2004, Antenna TV entered into a four-year term facility with a group of banks. The �25mn principal amount is repayable in seven instalments and bears interest at 3-month or 6-month EURIBOR plus a margin. A portion of Antenna TV�s obligations under the facility is secured and a portion is guaranteed by Minos Kyriakou.
�15mn Credit Facility
In December 2004, Antenna TV entered into a loan facility with RBS. The �15mn principal amount is repayable in three equal �5mn instalments on 30 August 2007, 31 December 2007 and 31 May 2008. The loan bears interest at EURIBOR plus a margin. Minos Kyriakou has guaranteed the payment obligation under the loan facility.
Daphne Communications
Daphne has working capital revolving credit facilities with several banks. Daphne�s obligations under the facilities are guaranteed by Antenna TV and are secured by post-dated checks in a manner similar to the pledges under Antenna TV�s �25mn credit facility. �17.7mn was drawn under the facility at 30 September 2005.
Short Term Borrowings and Revolving Credit Facilities
Antenna Radio and Nova Television have working capital revolving credit facilities with several banks. Obligations under the facilities are guaranteed by Antenna TV and, in the case of Antenna Radio, are secured by post-dated checks in a manner similar to the pledges under Antenna TV�s �25mn credit facility. At 30 September 2005, Nova Bulgaria had short-term borrowings of �2.4mn and Antenna Radio had drawn �2.1mn of debt under its revolving facility.
Bank Lines
Antenna TV had unused bank lines at 30 September 2005 of �22.3mn, of which Antenna Television�s share was �13mn.
�120mn 7.25% Senior Notes due 2015
The notes are unsecured senior obligations issued in February 2005 to refinance Antenna TV�s EUR 9.75% 2008 notes. The notes are not guaranteed by any subsidiary of Antenna TV.
Aizaz Shaikh +44 20 7595 8607 [email protected]

Antenna ⎪ January 2006
37 European High Yield Research
Antenna Structure
Antenna TV S.A.
2015 Notes(�120 million)
Bank Credit Facilities
(�40 million)
DaphneCommunications Other Subsidiaries
100%89.4%
Working CapitalFacilities
Guarantee
Working CapitalFacilities
Antenna TV S.A.
2015 Notes(�120 million)
Bank Credit Facilities
(�40 million)
DaphneCommunications Other Subsidiaries
100%89.4%
Working CapitalFacilities
Guarantee
Working CapitalFacilities
Source � Antenna

Antenna ⎪ January 2006
38 European High Yield Research
Bond Covenant Bond description EUR 7.25% Senior Notes due 2015
Issuing entity Antenna TV S.A.
Ranking Senior
Position vs. bank debt Subordinated to the extent of security given
Position vs. other bonds Not applicable
Security/Guarantees The notes are unsecured obligations of Antenna TV and are not guaranteed by any subsidiary of Antenna TV.
Optional Redemption
Equity Claw � prior to 15 February 2008 max 35% at 107.25%.
Call Schedule:
! 15 February 2010 � 103.625%
! 15 February 2011 � 102.417%
! 15 February 2012 � 101.208%
! 15 February 2013 � 100.000%
Tax redemption Yes � at par
Negative pledge Yes
Cross default Yes � on �10mn or more of other debt
Fall away covenants No
Anti-layering No
Change of control Put at 101%
Asset sales
The issuer cannot sell assets unless:
! The issuer receives a fair market value for them and at least 75% of the consideration is received in the form of cash, cash equivalents or replacement assets;
! Proceeds are used within 270 calendar days to repay indebtedness under a bank credit agreement or within 360 calendar days in a permitted related investment.
! When excess proceeds surpass �10mn, Antenna must make an offer to purchase the notes and pari passu indebtedness at par plus accrued and unpaid interest.
Debt limit
Fixed Charge Coverage Ratio of at least 2.0x.
Carve outs:
! Indebtedness under Bank Credit Agreements up to �40mn;
! CLOs or purchase money indebtedness up to �10mn;
! Letters of credit issued in the ordinary course of business up to �0.5mn;
! Guarantees by Antenna of indebtedness of one or more persons engaged in the media and entertainment business with whom Antenna has a cooperation agreement of up to �10mn;
! General basket up to �20mn.
Source � BNP Paribas, Antenna

Antenna ⎪ January 2006
39 European High Yield Research
Bond Covenant Bond description EUR 7.25% Senior Notes due 2015
Restricted payments
If Antenna can incur �1 of additional debt then 50% of Consolidated Net Income (minus 100% of net loss); plus 100% of equity and equity-like proceeds; plus �10mn.
Carve outs:
! Repurchase, redemption or defeasance of any capital stock or indebtedness that is subordinate to the notes by (i) conversion into or by an exchange for capital stock or (ii) from the concurrent sale of indebtedness that is contractually subordinated to the notes;
! The transfer of up to �1mn of broadcast assets to any of its subsidiaries in any one fiscal year;
! Investments in joint ventures or partnerships that are not subsidiaries of Antenna (i) in which Antenna owns not less than 20% of the capital stock and otherwise Antenna has the right to designate a majority of the board of directors in an amount not to exceed �20mn, plus (ii) in any person provided that such investment is of strategic importance (as determined by the Board of Directors of Antenna) in an amount not to exceed �10mn;
! Any investment made to produce, acquire, create or develop product in Antenna�s music business in the ordinary course of business, including the formation or funding of joint ventures and subsequent loans to or acquisitions of stock in any such joint venture to fund working capital.
Transactions with affiliates
Transactions with affiliates must be in good faith and on terms no less favourable than those that could be obtained in a comparable arm�s length transaction. Transactions above �2.5mn must be approved by a majority of the disinterested members of the Board of Directors. Transactions over �7.5mn also require a fairness opinion from an independent financial advisor.
Source � BNP Paribas, Antenna

Antenna ⎪ January 2006
40 European High Yield Research
Antenna, Financial Model FYE 31 December Actual Actual Actual Actual Actual Actual Actual Actual Actual Actual
EUR mn 2002 2003 Q1 04 Q2 04 Q3 04 Q4 04 2004 Q1 05 Q2 05 Q3 05 PROFIT & LOSS Revenue 169 158 42 65 36 56 198 50 65 38 COGS -70 -63 -17 -22 -14 -21 -74 -23 -22 -15 Gross profit 99 95 24 43 22 36 124 27 43 23 SG&A -31 -28 -9 -10 -10 -12 -41 -11 -14 -10 Cash Programming Costs -57 -49 -13 -13 -18 -15 -59 -12 -14 -15 EBITDA 11 17 3 19 -6 8 24 5 16 -2 P&L Interest -22 -19 -5 -5 -5 -4 -19 -4 -3 -3
Revenue growth y/y -6.8% 20.3% 17.5% 0.7% 6.0% Gross margin 58.5% 60.0% 58.4% 66.6% 60.1% 63.3% 62.8% 54.0% 66.3% 60.5% SG&A / sales 18.2% 17.7% 20.5% 16.2% 27.6% 22.2% 20.9% 20.9% 21.0% 26.2% EBITDA margin 6.7% 11.0% 6.3% 30.1% -17.6% 14.5% 12.1% 9.0% 24.3% -5.3% CASH FLOW Change in working capital 24 22 -12 -20 21 26 16 -6 -11 6 Cash Interest -24 -21 -10 0 -9 -2 -21 -9 -1 -5 Cash from Operating Activities 11 18 -19 -1 6 33 19 -10 4 -2
Capex -4 -7 0 -1 -2 3 0 -1 -1 -1 Acquisitions/Disposals 0 -1 0 0 -3 0 -4 0 0 -3 Cash from Investing Activities -5 -8 0 -1 -6 3 -4 -2 -1 -4
Net Change in Cash -15 -8 -34 -2 0 35 -1 -34 2 -10 Cash from Financing Activities -9 -8 -16 0 0 0 -16 -142 -1 -4
BALANCE SHEET
Cash & Equivalents 90 81 47 46 46 80 80 46 49 39
Bank Debt 18 19 19 19 20 20 20 20 21 22 Bonds- HY 213 194 179 179 165 165 165 165 160 160 9.75% �150m 2008 150 150 150 150 45 45 45 45 40 40 9.00% $115m 2007 63 44 29 29 0 0 0 0 0 0 7.25% �120m 2015 0 0 0 0 120 120 120 120 120 120 Capital Leases 3 2 2 2 1 1 1 1 1 1 Total Debt 234 214 200 200 186 186 186 186 182 183 Net Debt 144 133 153 154 141 106 106 139 133 144
RATIOS
Leverage Bank Leverage (gross) 1.6x 1.1x 1.1x 1.1x 1.1x 1.1x 0.8x 0.8x 0.9x 0.8x Senior Notes Leverage (gross) 20.5x 12.2x 11.4x 11.4x 10.6x 10.6x 7.7x 7.2x 8.1x 6.9x Total leverage (gross) 20.8x 12.3x 11.5x 11.5x 10.7x 10.7x 7.8x 7.2x 8.2x 6.9x Total leverage (net) 12.8x 7.7x 8.8x 8.9x 8.1x 6.1x 4.4x 5.4x 6.0x 5.4x
Source � BNP Paribas Estimates, Antenna

Antenna ⎪ January 2006
41 European High Yield Research
This page has been left blank intentionally
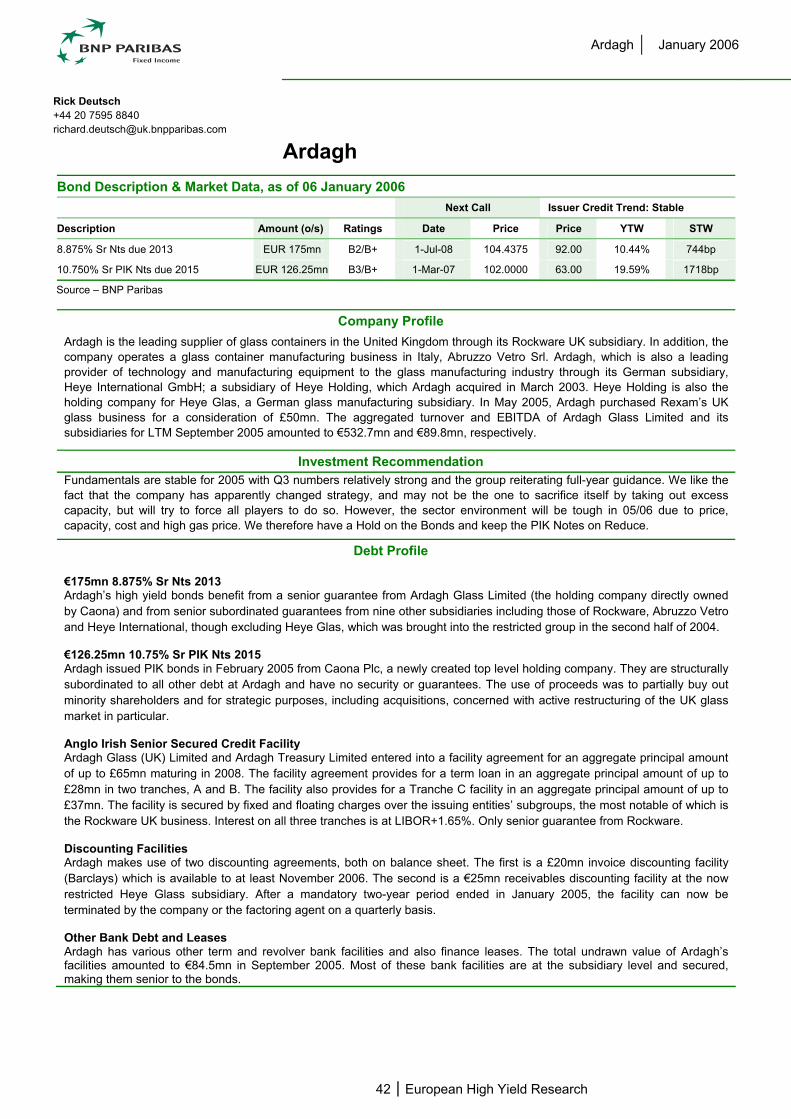
Ardagh ⎪ January 2006
42 European High Yield Research
Ardagh Bond Description & Market Data, as of 06 January 2006
Next Call Issuer Credit Trend: Stable
Description Amount (o/s) Ratings Date Price Price YTW STW
8.875% Sr Nts due 2013 EUR 175mn B2/B+ 1-Jul-08 104.4375 92.00 10.44% 744bp
10.750% Sr PIK Nts due 2015 EUR 126.25mn B3/B+ 1-Mar-07 102.0000 63.00 19.59% 1718bp
Source – BNP Paribas
Company Profile Ardagh is the leading supplier of glass containers in the United Kingdom through its Rockware UK subsidiary. In addition, the company operates a glass container manufacturing business in Italy, Abruzzo Vetro Srl. Ardagh, which is also a leading provider of technology and manufacturing equipment to the glass manufacturing industry through its German subsidiary, Heye International GmbH; a subsidiary of Heye Holding, which Ardagh acquired in March 2003. Heye Holding is also the holding company for Heye Glas, a German glass manufacturing subsidiary. In May 2005, Ardagh purchased Rexam’s UK glass business for a consideration of £50mn. The aggregated turnover and EBITDA of Ardagh Glass Limited and its subsidiaries for LTM September 2005 amounted to €532.7mn and €89.8mn, respectively.
Investment Recommendation Fundamentals are stable for 2005 with Q3 numbers relatively strong and the group reiterating full-year guidance. We like the fact that the company has apparently changed strategy, and may not be the one to sacrifice itself by taking out excess capacity, but will try to force all players to do so. However, the sector environment will be tough in 05/06 due to price, capacity, cost and high gas price. We therefore have a Hold on the Bonds and keep the PIK Notes on Reduce.
Debt Profile €175mn 8.875% Sr Nts 2013 Ardagh’s high yield bonds benefit from a senior guarantee from Ardagh Glass Limited (the holding company directly owned by Caona) and from senior subordinated guarantees from nine other subsidiaries including those of Rockware, Abruzzo Vetro and Heye International, though excluding Heye Glas, which was brought into the restricted group in the second half of 2004.
€126.25mn 10.75% Sr PIK Nts 2015 Ardagh issued PIK bonds in February 2005 from Caona Plc, a newly created top level holding company. They are structurally subordinated to all other debt at Ardagh and have no security or guarantees. The use of proceeds was to partially buy out minority shareholders and for strategic purposes, including acquisitions, concerned with active restructuring of the UK glass market in particular.
Anglo Irish Senior Secured Credit Facility Ardagh Glass (UK) Limited and Ardagh Treasury Limited entered into a facility agreement for an aggregate principal amount of up to £65mn maturing in 2008. The facility agreement provides for a term loan in an aggregate principal amount of up to £28mn in two tranches, A and B. The facility also provides for a Tranche C facility in an aggregate principal amount of up to £37mn. The facility is secured by fixed and floating charges over the issuing entities’ subgroups, the most notable of which is the Rockware UK business. Interest on all three tranches is at LIBOR+1.65%. Only senior guarantee from Rockware.
Discounting Facilities Ardagh makes use of two discounting agreements, both on balance sheet. The first is a £20mn invoice discounting facility (Barclays) which is available to at least November 2006. The second is a €25mn receivables discounting facility at the now restricted Heye Glass subsidiary. After a mandatory two-year period ended in January 2005, the facility can now be terminated by the company or the factoring agent on a quarterly basis.
Other Bank Debt and Leases Ardagh has various other term and revolver bank facilities and also finance leases. The total undrawn value of Ardagh’s facilities amounted to €84.5mn in September 2005. Most of these bank facilities are at the subsidiary level and secured, making them senior to the bonds.
Rick Deutsch +44 20 7595 8840 [email protected]

Ardagh ⎪ January 2006
43 European High Yield Research
Ardagh Structure
Ardagh Glass Group Plc(Ireland)
Ardagh Glass Group Holdings Ltd
(Ireland)
Issuer of PIK Notes due 2015
Ardagh Glass Ltd(Guernsey)
Ardagh GlassHoldings Ltd
(Ireland)Parent Guarantor of the 8 7/8% Notes due 2013
Italy*UKRockware & Redfearn
Ardagh GlassFinance BV*(Netherlands)
Ardagh InternationalHoldings Ltd
Ardagh Holdings BV(Netherlands)Germany
Poland
Issuer of the 8 7/8% Notes due 2013
Source – Ardagh, BNP Paribas
*The sale of Abruzzo Vetro and Ardagh Glass Finance B.V. from Ardagh Holdings BV to Ardagh Glass Holdings will be completed later in the year.

Ardagh ⎪ January 2006
44 European High Yield Research
Bond Covenants Bond description Senior Notes PIK Notes
Issuing entity Ardagh Glass Finance BV Caona Plc
Ranking Senior Notes Senior PIK Notes
Position vs. bank debt Structurally subordinated Structurally subordinated
Position vs. other bonds Structurally senior Structurally subordinated
Security/guarantees Senior guarantee from Ardagh Glass Ltd (holding company below Caona Plc) and senior subordinated guarantees by nine subsidiaries
–
Optional redemption
Make Whole – bunds+50bp
Equity Claw – 35% at par+coupon
Call Schedule:
1 Jul 2008 – 104.4375% 1 Jul 2009 – 102.9583% 1 Jul 2011 – 101.4792% 1 Jul 2012 – 100.0000%
Make Whole – not applicable
Equity Claw – not applicable
Call Schedule:
1 Mar 2007 – 102.000% 1 Mar 2008 – 101.000% 1 Mar 2009 – 100.000%
Change of control Put at 101%, 30%+ of voting power
Tax redemption Yes – at par
Negative pledge No
Cross default Yes – at least €10mn
Fall away covenants –
Anti-layering Yes –
Debt limit
Pro Forma Fixed Charge Coverage at least 2.25x Carve outs: restricted subsidiary bank debt up to greater of
€125mn or sum of 60% of inventory plus 85% of receivables
Capitalised Lease Obligations, mortgages and purchase money obligations up to €7.5mn
interest, FX & commodity hedges receivables securitisation of £20mn RBS
Invoice Discounting Facility and a further €10mn
debt refinancing general basket €15mn
Pro Forma Fixed Charge Coverage at least 2.00x Carve outs: restricted subsidiary bank debt up to greater of
€125mn or sum of 60% of inventory plus 85% of receivables
Capitalised Lease Obligations, mortgages and purchase money obligations up to €7.5mn
interest, FX & commodity hedges receivables securitisation of £20mn Barclays
Invoice Discounting Facility and a further €10mn
debt refinancing general basket €15mn
Restricted payments
If can incur €1 of debt then 50% net income less 100% net loss plus 100% equity proceeds. Carve outs: dividends if allowed under covenants sub debt funded from equity proceeds or
refinancing €15mn debt at Heye Holding GmbH
outstanding at the time of the offering a general basket of €15mn
If can incur €1 of debt then 50% net income less 100% net loss plus 100% equity proceeds. Carve outs: dividends if allowed under covenants sub debt funded from equity proceeds or
refinancing a general basket of €20mn
Transactions with affiliates Must be done on an arm's length basis with an officer's certificate for €5mn+ transactions and a board resolution (with a majority of disinterested directors) for €10mn+ transactions and an independent opinion for €15mn+ transactions
Asset sales
Company can not sell assets unless: receives at least fair market value at least 75% is cash or equivalents or replacement assets must use proceeds within a year to pay down debt, fund capex or purchase similar assets if not, any excess proceeds above €15mn will be used to offer to repurchase the notes at par
Source – BNP Paribas, Ardagh

Ardagh ⎪ January 2006
45 European High Yield Research
Ardagh, Financial Model FYE 31 December Restate Historic Historic Historic Historic Historic Historic Historic Historic Historic Proj’d Proj’d P’FormaEUR mn FY 02 FY 03 Q1 04 Q2 04 Q3 04 Q4 04 FY 04 Q1 05 Q2 05 Q3 05 FY 05 FY 06 LTM
PROFIT & LOSS
Group revenue 289.0 428.1 99.1 125.2 110.7 135.3 470.3 102.9 138.8 155.7 538.0 447.3 532.7 COGS -244.4 -357.9 -85.1 -105.2 -90.7 -116.4 -397.4 -92.1 -118.8 -135.6 -469.7 -392.4 -462.9 Gross profit 44.6 70.1 14.0 20.1 20.0 18.9 72.9 10.8 20.0 20.1 68.3 54.9 69.8 SG&A -10.1 -22.9 -5.3 -6.7 -7.1 -8.2 -27.4 -7.1 -6.3 -9.2 -32.0 -34.4 -30.8 EBITDA 71.0 84.8 18.0 23.0 22.9 22.0 85.9 14.0 26.1 27.7 89.0 81.2 89.8 P&L Net Interest -20.5 -21.1 -5.3 -6.1 -6.3 -6.3 -23.9 -6.2 -6.5 -7.1 -26.0 -26.0 -26.0
Revenue growth y/y 48.1% 2.3% 14.9% -1.5% 23.2% 9.9% 3.8% 10.9% 40.7% 14.4% -16.9% Gross margin 15.4% 16.4% 14.1% 16.0% 18.1% 14.0% 15.5% 10.5% 14.4% 12.9% 12.7% 12.3% 13.1% SG&A / sales 3.5% 5.3% 5.4% 5.4% 6.4% 6.1% 5.8% 6.9% 4.6% 5.9% 5.9% 7.7% 5.8% EBITDA margin 24.6% 19.8% 18.2% 18.4% 20.7% 16.3% 18.3% 13.6% 18.8% 17.8% 16.5% 18.2% 16.9%
CASH FLOW
Cash interest -7.0 -17.0 -8.2 -2.0 -9.4 -4.0 -23.6 -10.1 -2.3 -10.8 -25.5 -25.5 -27.3 Change in working capital -4.3 -8.3 -22.7 9.7 0.0 7.2 -5.9 -3.1 -9.4 12.7 7.3 Cash from Operating Activities 59.8 40.1 -13.7 27.0 11.6 28.7 53.6 -3.4 5.1 27.1 57.5
Capex -20.5 -33.6 -11.0 -16.3 -8.9 -9.5 -45.7 -21.5 -10.8 -10.3 -48.0 -33.6 -52.0 Acquisitions/Disposals -2.1 0.0 0.0 0.0 0.0 -8.1 -8.2 -0.1 -18.2 0.8 -25.6 Cash from Investing Activities -22.6 -33.6 -11.1 -15.5 -8.7 -17.6 -52.9 -21.6 -29.0 -9.4 -77.6
Net movement on borrowings -18.2 44.2 7.3 14.6 -7.8 -11.6 2.5 26.9 -8.5 -10.9 -4.1 Cash from Financing Activities -18.2 26.8 6.4 -14.8 -8.0 -9.6 -26.0 26.5 15.6 -23.2 9.3
Net Change in Cash 19.0 33.3 -18.3 -3.2 -5.2 1.5 -25.3 1.5 -8.4 -5.9 -2.5 5.6 -11.2
BALANCE SHEET
Cash & Equivalents 29.9 51.5 33.9 30.8 25.5 26.8 26.8 28.8 26.4 18.2 24.3 29.9 18.2
Bank Debt 92.1 98.1 104.1 105.0 102.6 104.3 104.3 108.3 110.9 105.0 110.9 110.9 105.0 Bonds- HY 0.0 175.0 175.0 175.0 175.0 175.0 175.0 175.0 175.0 175.0 175.0 175.0 175.0 Financial leases, Sub-Notes and other 181.1 -4.1 2.1 15.4 7.8 -3.9 -3.9 22.0 61.1 51.0 61.1 61.1 51.0
Total Senior Debt 273.1 269.0 281.3 295.3 285.4 275.4 275.4 305.3 346.9 330.9 347.0 347.0 330.9 Net Senior Debt 243.2 217.5 247.3 264.6 259.9 248.5 248.5 276.5 320.6 312.7 322.7 317.1 312.7
Notes (Junior/PIK) 0.0 0.0 0.0 0.0 0.0 0.0 0.0 125.0 125.0 125.1 128.4 142.2 125.1
Total Debt 273.1 269.0 281.3 295.3 285.4 275.4 275.4 430.3 472.0 456.0 475.4 489.2 456.0 Net Debt 243.2 217.5 247.3 264.6 259.9 248.5 248.5 401.5 445.6 437.8 451.1 459.3 437.8
RATIOS
Coverage Cash Interest Coverage 10.1x 5.0x 2.2x 11.5x 2.4x 5.5x 3.6x 1.4x 11.4x 2.6x 3.5x 3.2x 3.3x Total Coverage 3.5x 4.0x 3.4x 3.8x 3.6x 3.5x 3.6x 2.3x 4.0x 3.9x 3.4x 3.1x 3.5x EBITDA- Capex/Interest 7.2x 3.0x 0.9x 3.4x 1.5x 3.1x 1.7x -0.7x 6.7x 1.6x 1.6x 1.9x 1.4x
Leverage Bank Leverage (gross) 1.3x 1.2x 1.2x 1.2x 1.2x 1.2x 1.2x 1.3x 1.3x 1.2x 1.2x 1.4x 1.2x Senior Notes Leverage (gross) 0.0x 2.1x 2.1x 2.0x 2.1x 2.0x 2.0x 2.1x 2.1x 1.9x 2.0x 2.2x 1.9x Total leverage (gross) 3.8x 3.2x 3.3x 3.4x 3.4x 3.2x 3.2x 5.3x 5.6x 5.1x 5.3x 6.0x 5.1x Total leverage (net) 3.4x 2.6x 2.9x 3.1x 3.1x 2.9x 2.9x 4.9x 5.2x 4.9x 5.1x 5.7x 4.9x Total leverage (net) less €55mn cash from PIK 4.4x 5.0x
Source – BNP Paribas, Ardagh

Avio Holding ⎪ January 2006
46 European High Yield Research
Avio Holding SpA Bond Description & Market Data, as of 5 January 2006
Next Call
Description Amount (o/s) Ratings Date Price Price YTW STW
9.625% Senior Notes due 2013 EUR 200mn B3/CCC+ 1-Oct-08 104.8125 113.5 5.85% 291bp EB+8.5% PIK FRNs due 2015 EUR 375mn NR/CCC+ 1-Mar-06 100.00
Source – BNP Paribas
Company Profile Avio is a leader in the design, development and production of sub-systems and components for the military and civil aeroengines, aeroengine derivatives for power generation and marine applications, and propulsion systems for space launch vehicles and tactical missile applications. The company is also involved in the maintenance, repair and overhaul of military and civil aeroengines and their derivatives. Avio’s primary customers are the leading manufacturers of aeroengines, including General Electric, Pratt & Whitney and Rolls Royce, the Italian military and through various consortia the UK/German/Spanish and Saudi Arabian air forces. Other significant customers include the European Space Agency, Alitalia and Midwest Express. For the 12 months ended 30 September 2005, the company had revenues of €1,290.2mn and EBITDA of €207.1mn.
Debt Profile As part of the acquisition and refinancing of Avio by the Carlyle Group and Finmeccanica the Company entered into the following facilities: Senior Credit Facilities
The facility is for a total of €1,101mn split into a term A of €351mn, a term B of €200mn, a term C of €200mn and a €150mn revolving credit facility and a €200mn performance bond facility. The term A facility matures in June 2010, term B in June 2011 and the term C in June 2012. The revolver matures in June 2010 and the final maturity date of the performance bond facility is 5 years post closing. The facility is guaranteed by the note issuer, Avio SpA, and the other guarantors of the notes. In certain cases, a security interest exists over their assets. The facility is further secured by the shares of Avio SpA and certain other subsidiaries. As at 30 September 2005 €445mn was outstanding under the term loans, the revolving credit was undrawn and €79mn of guarantees had been issued under the performance bonding facility.
9.65% Senior Notes 2013
In December 2003, Avio issued €200mn senior notes to repay an acquisition bridge loan. Floating Rate Senior PIK Notes due 2015
In February 2005, Aero Invest 1, a holding company of Avio Holding Spa, issued €375mn of PIK notes due 2015. Use of proceeds was to acquire the Liftgate Srl loan note and fund a dividend to shareholders.
Adam Harnetty, ACA +44 20 7595 8831 [email protected]

Avio Holding ⎪ January 2006
47 European High Yield Research
Avio Holding Structure
Finmeccanica ManagementCarlyle
Aero Invest 1S.A.
Aero Invest 2S.à.r.l.
Avio HoldingS.p.A.
AvioS.p.A.
LiftgateS.r.l
€375million Notes
€175m subordinated proceeds loan
26.9%
73.1%
€175million vendor loan
€595m senior credit facilities
€200m senior performance bond facility
Certain subsidiaries
AvioInc.
ASPropulsionInternational
B.V.
ASPropulsionCapital B.V.
Certain subsidiaries
€200m Senior Notes
Source – Avio Holding

Avio Holding ⎪ January 2006
48 European High Yield Research
Bond Covenants Bond description 9.625% Senior Notes due 2013 EB+8.5% PIK FRNs due 2015
Issuing entity ASPropulsion Capital BV Aero Invest I SA
Ranking Senior Senior
Position vs. bank debt Subordinated Subordinated
Position vs. other bonds Senior Subordinated
Security/guarantees Senior guarantees from Aero Invest2, senior subordinated by Avio Holding, Avio SpA, Avio Inc and ASPropulsion International BV
None
Optional redemption
Make whole – After 1 April 2005 and before 1 October 2008 at T+50bp
Equity claw – Prior to 1 October 2006 35% at 109.625%
Call Schedule: 1 October 2008 – 104.8125% 1 October 2009 – 103.2083% 1 October 2010 – 101.6042% 1 October 2011 – 100%
Make whole – none
Equity claw – none
Call Schedule:
1 March 2006 – 100%
1 March 2007 – 102%
1 March 2008 – 101%
1 March 2009 – 100%
Tax redemption Yes at par Yes at par
Negative pledge Limitation on liens but carve outs (carves out any debt allowed to be incurred under the limitation on indebtedness clause)
Limitation on liens
Cross default Yes Yes
Fall away covenants No No
Anti-layering Yes No
Change of control Put at 101, >50% of voting power or substantial sale of assets
Asset sales
Fair market value and >75% proceeds in cash or equivalents. Within 12 months reinvest in similar business or repay debt. Any proceeds remaining (subject to €10mn minimum) must be used to tender for bonds at par.
Debt limit
Consolidated interest cover ratio must exceed 2:1.
Carve outs:
Credit facilities up to €901mn (as reduced by any pay down from asset sales);
Capital leases and similar up to the greater of €25mn and 1% of total assets;
€75mn general basket.
Consolidated leverage ratio must be less than 5:1 then Avio Holdings and restricted subsidiaries may borrow.
Carve outs:
Credit facilities up to €901mn (as reduced by any pay down from asset sales);
Capital leases and similar up to the greater of €25mn and 1% of total assets;
€75mn general basket.
Restricted payments
Subject to being able to incur €1 of additional debt then:
50% of consolidated net income;
€5mn p.a. to repurchase employee stock with carry forward of unused amounts (up to €15mn p.a.);
6% p.a. of the net proceeds received from a public offering;
€25mn general basket.
Transactions with affiliates Must be no less favourable than if executed in an arms length transaction. If greater than €5mn requires a board certificate and if greater than €15mn requires a fairness certificate from an external advisor.
Source – Avio Holding, BNP Paribas

Avio Holding ⎪ January 2006
49 European High Yield Research
Avio Holding, Financial Model FYE 31 December Avio Avio EUR mn Division Division Combined Actual Actual Actual Actual Actual Actual Actual Actual
2001 2002 2003 Q1 04 Q2 04 Q3 04 Q4 04 2004 Q1 05 Q2 05 Q3 05 PROFIT & LOSS Revenues from sales & services 1,596.4 1,504.5 1,273.4 270.5 328.6 292.0 335.1 1,226.2 280.6 309.6 314.5 Change in WIP, and inventories -26.6 -15.6 -11.6 0.4 -9.9 -5.8 -19.1 -34.4 10.3 13.0 1.2 Other income & revenues 49.1 42.5 35.2 8.2 9.0 11.6 16.7 45.5 4.4 16.6 7.2 Total Value of Production 1,618.9 1,531.4 1,297.0 279.1 327.7 297.8 332.7 1,237.3 295.4 339.2 322.9 Total Cost of Production -1,423.4 -1,319.4 -1,244.7 -289.7 -319.4 -295.2 -344.0 -1,248.3 -302.1 -330.9 -313.3 Operating Income 195.5 212.0 52.3 -10.6 8.3 2.6 -11.3 -11.0 -6.8 8.2 9.6 Other income inc FX 0.5 -9.0 7.6 0.8 1.6 1.2 45.2 48.8 -16.8 -22.0 -2.3 Interest income 19.0 9.9 4.6 0.6 -0.1 0.4 3.4 4.3 0.1 0.2 0.4 Interest expense -12.0 -10.1 -31.7 -17.8 -16.9 -17.3 -19.6 -71.6 -17.9 -18.5 -17.3 Net income before extraordinary items
203.0 202.8 32.8 -27.0 -7.1 -13.1 17.7 -29.5 -41.3 -32.0 -9.6
Extraordinary income/(expense) -30.2 -11.9 -24.7 -0.2 0.2 -0.5 -8.2 -8.7 -1.0 -0.2 -6.9 Tax -75.1 -74.3 -17.9 -4.2 7.5 1.3 -4.4 0.2 4.0 1.5 14.2 MSI -0.5 -0.4 0.4 0.7 0.2 -0.5 0.2 0.6 0.4 0.0 0.0 Net Income 97.2 116.2 -9.4 -30.7 0.8 -12.8 5.3 -37.3 -37.9 -30.7 -2.3
PIK Interest -4.0 -6.9 -7.2
Operating Income 195.5 212.0 52.3 -10.6 8.3 2.6 -11.3 -11.0 -6.8 8.2 9.6 D&A 87.0 68.6 118.0 39.7 39.8 38.4 57.9 175.8 41.3 40.8 40.2 Adjustments 0.0 1.6 35.8 7.6 10.0 7.3 13.4 38.3 4.7 7.0 2.1 EBITDA 282.5 282.2 206.1 36.7 58.1 48.3 60.0 203.1 39.2 56.0 51.9
Revenue from sales & services growth
y/y -5.8% -15.4% -8.4% 2.4% 0.2% -8.3% -3.7% 3.7% -5.8% 7.7%
Operating income margin 12.1% 13.8% 4.0% -3.8% 2.5% 0.9% -3.4% -0.9% -2.3% 2.4% 3.0% EBITDA margin 17.5% 18.4% 15.9% 13.1% 17.7% 16.2% 18.0% 16.4% 13.3% 16.5% 16.1%
CASHFLOW Net income before MSI 97.8 116.7 -9.9 -31.4 0.6 -12.3 5.2 -37.9 -38.4 -30.7 -2.4 D&A 87.0 68.6 118.0 39.7 39.8 38.4 57.9 175.8 41.3 40.8 40.2 Other -7.0 13.8 2.6 1.8 1.0 0.7 -2.0 1.5 11.3 14.0 -7.5 Change in working capital -18.0 5.6 36.5 -31.0 6.9 5.1 71.8 52.8 -36.7 97.4 20.8 Cashflow from operating activities 159.8 204.7 147.2 -20.9 48.3 31.9 132.9 192.2 -22.4 121.6 51.2
Capex -40.4 -129.5 -60.2 -6.0 -9.2 -7.9 -15.5 -38.6 -2.7 -5.0 -7.5 Intangible assets & deferred charges -51.8 -4.1 -70.1 -2.4 -1.0 -0.1 -92.3 -95.8 -3.0 -0.6 -0.7 Other 6.8 4.6 -1,337.2 0.3 18.6 0.1 -1.0 18.0 0.6 -2.5 -2.5 Cashflow from investing activities -85.4 -129.0 -1,467.5 -8.1 8.4 -7.9 -108.8 -116.4 -5.1 -8.1 -10.6
Dividends paid -264.1 -67.3 -100.6 0.0 0.0 0.0 0.0 0.0 0.0 0.0 Other 9.7 -12.4 313.6 2.4 0.5 -1.0 -7.1 -5.2 3.8 5.5 2.7 Cashflow from financing activities -254.4 -79.7 213.0 2.4 0.5 -1.0 -7.1 -5.2 3.8 5.5 2.7
Cashflow for the period -180.0 -4.0 -1,107.3 -26.6 57.2 23.0 17.0 70.6 -23.7 118.9 43.2 BALANCE SHEET Cash 145.6 110.3 81.9 78.7 61.9 61.9 47.9 130.3 65.0
Senior bank debt 697.0 699.4 664.5 626.9 578.3 578.3 603.8 575.7 444.8 Other debt 186.0 59.6 8.0 8.3 28.4 14.2 8.3 11.8 13.3 €200m 9.625% 2013 bonds 200.0 200.0 200.0 200.0 200.0 200.0 200.0 200.0 200.0 Gross debt* 1,083.0 959.0 872.5 835.2 806.7 792.5 812.1 787.5 658.1 2015 PIK Notes 375.0 375.0 396.2 Gross debt including PIKs 1,187.1 1,162.5 1,054.3
Net debt ex PIKS* 937.4 848.7 790.6 756.5 744.8 730.6 764.2 657.2 593.1
LTM RATIOS Coverage 7.6 4.3 3.4 2.9 3.0 3.0 3.0 2.9 3.0 EBITDA-Caoex/Interest 5.4 3.2 2.7 2.3 2.4 2.4 2.5 2.5 2.6 Gross Leverage 4.7 5.0 4.3 4.0 3.9 3.9 3.9 3.9 3.2 Net Leverage 3.9 4.5 3.9 3.7 3.6 3.6 3.7 3.2 2.9
Gross PIK Leverage 5.8 5.7 5.1 Net PIK Leverage 5.5 5.1 4.8
* Excludes loan from Liftgate Srl which is non cash pay and fully subordinate to the 2013 bonds. Source – BNP Paribas Estimates, Avio Holding

Barry Callebaut ⎪ January 2006
50 European High Yield Research
Barry Callebaut Bond Description & Market Data, as of 5 January 2006
Next Call Issuer Credit Trend: Positive
Description Amount (o/s) Ratings Date Price Price YTW STW
9.25% Senior Subordinated Notes due 2010 EUR 165mn B1/BB- 15-Mar-07 104.62 110.00 4.33% 152bp
Source – BNP Paribas
Company Profile Barry Callebaut is one of the leading manufacturers of high-quality cocoa, chocolate, and confectionery products in the world and a fully-integrated chocolate manufacturing company. Barry Callebaut’s customers include multinational branded consumer goods manufacturers, artisanal and professional users of chocolate such as chocolatiers, pastry chefs, bakeries, restaurants and hotels and food retailers, which buy the company’s branded and private label chocolate products. In the fiscal year ended 31 August 2005, the company had sales of CHF 4,061mn and EBITDA of CHF 379mn. As of the end of the period, Barry Callebaut had leverage of 2.6x and coverage of 4.6x.
Investment Recommendation We maintain our HOLD/Positive Credit Trend recommendation for Barry Callebaut’s notes. The company has already secured financing for buying the bonds back when the first call becomes effective on 15 March 2007 (the call price is 104.62). Therefore, we believe that the notes will trade to the first call in the meantime.
Debt Profile As of 31 August 2005, Barry Callebaut had total debt of CHF992.7mn, comprised of CHF233,7mn of bank overdrafts and short-term debt and CHF759.0mn of long-term debt. On 29 August 2005, Barry Callebaut signed a new syndicated Revolving Credit Facility agreement for a total amount of €850mn. The facility comprises three tranches:
Tranche A is a €435mn revolver with a minimal tenor of 5 and maximal tenor of 7 years; Tranche B is a €250mn revolver with a minimal tenor of 3 and maximal tenor of 5 years, backing up the company’s
Commercial Paper programme amounting to €250mn; Tranche C is a €165mn revolver with a minimal tenor of 5 and maximal tenor of 7 years, structured for the sole purpose
of redeeming the Senior Subordinated Notes on or after March 2007.
Barry Callebaut Services N.V., the issuer for the Senior Subordinated Notes, is a borrower under the Revolving Credit Facility. The facility is supported by the parent company, Barry Callebaut AG, as well as a number of other material subsidiaries of the Group, acting as co-obligors. Barry Callebaut also has an off-balance sheet $100mn ABS facility. The ABS facility is secured by the receivables of certain of the company’s contracts and benefits from upstream guarantees from the following operating entities – Barry Callebaut AG, Barry Callebaut Sourcing AG, Barry Callebaut Belguim NV, Barry Callebaut France SAS.
Oleksiy Soroka, CFA +44 20 7595 4878 [email protected]

Barry Callebaut ⎪ January 2006
51 European High Yield Research
Barry Callebaut Structure
Barry Callebaut AG(1)*ΔSwitzerland
Barry CallebautSourcing AG(1)*Δ
Switzerland
AdisHoldings Inc.Panama
Barry CallebautHolding BVΔNetherlands
ChocosenSenegal †
C.J Van Houten& Zoon Holding
GmbH*ΔGermany
Other Van Houten
Subsidiaries
Barry CallebautSchweizAG †
Switzerland
Other African subsidiaries
Barry CallebautGhana Ltd.†
Ghana
SACO SA†Ivory Coast
100%
100%
100%
Barry CallebautServices NV(2)
Belgium
100%
Barry CallebautItalia Spa
Italy
Other European subsidiaries
Barry CallebautBelgium NV(1)*Δ
Belgium
100% 100%91.32%
Barry CallebautDeutschland
GmbH †Germany
Barry CallebautAsia Pacific (Singapore) Pte. Ltd. †Singapore
Barry CallebautCanada Inc. †
Canada
100%
100%
100%
GraverboomGroup †
Netherlands
100%
Barry CallebautFrance
SAS(1)*ΔFrance
100%
Barry CallebautUSA Inc.*†
USA
Barry CallebautBrasil †Brazil
100%100%
Other German Van HoutenSubsidiaries
Van HoutenGmbH & Co.KG†
Germany
100%
100%
Van HoutenBeteiligungs
GmbH Germany
100%
Van HoutenBeteiligungs
AG&G Co. Kg* Germany
Stollwerck AG†Germany
StollwerckEuropean
subsidiaries
98.66%
100%
100%
Chococam†Cameroon
Barry CallebautPolska
Sp.z.o.o.†Poland
Barry Callebaut
(UK) Ltd.*† UK
Other UK subsidiaries
S N ChocodiSA† Ivory Coast
S & A LesmeLtd. UK
SIC Cacaos SA†Cameroon
Barry CallebautManufacturing
FranceFrance
72.2%98.6%67.1%
100% 100%
100% 100% 100%
100% 100% 100% 100% 100% 100% 100%
Source – Barry Callebaut
(1) Barry Callebaut AG, Barry Callebaut Sourcing AG, Barry Callebaut Belgium NV and Barry Callebaut France SAS are guarantors of the notes. (2) Barry Callebaut Services NV is the issuer of the notes. ∆ Major holding company † Owners of significant production facilities * Guarantors of the new senior credit facility

Barry Callebaut ⎪ January 2006
52 European High Yield Research
Bond Covenant Bond description 9.25% Senior Subordinated Notes due 2010
Issuing entity Barry Callebaut Services NV
Ranking Senior Subordinated
Position vs. bank debt Contractually subordinated (can also be structurally subordinated if subsidiaries accede to the Senior Credit Agreement)
Position vs. other bonds -
Security/Guarantees Guaranteed on a senior subordinated basis by Barry Callebaut AG, Barry Callebaut Belgium NV, Barry Callebaut France SAS and Barry Callebaut Sourcing AG.
Optional redemption
Male Whole – Bund+50bp prior to 15 March 2007 Equity Claw – 35% at 109.25% prior to 15 March 2006 Call Schedule:
15 March 2007 – 104.625% 15 March 2008 – 102.313% 15 March 2009 and thereafter – 100.000%
Tax redemption Yes – at par. Negative pledge Yes. Cross default Yes – on €15mn or more of other debt Fall away covenants Yes. Anti-layering No. Change of control 101%
Asset sales
The Issuer cannot sell assets unless: The issuer receives a fair market value for them; The fair market value is evidenced by a resolution of the Board of Directors, the Board
Committee or the CEO; At least 75% of the consideration is in cash or equivalent (including a transfer of the
Issuer’s debt); Must use proceeds within 360 days to pay down senior debt, to pay down the pari
passu indebtedness, to purchase businesses so that they become the Restricted Subsidiaries, to make capital expenditures or to acquire other assets useful for Permitted Business.
Net proceeds from an Asset Sale not used for the above will constitute Excess Proceeds an when the aggregate amount exceeds €20mn the Issuer shall make a pro rata offer for the portion of the bonds outstanding and any pari passu indebtedness in accordance to the Asset Sale Offer.
Debt limit
Pro forma Fixed Charge Coverage Ratio of at least 2.5x. Carve outs: Debt in connection with a Receivable Facility provided such debt is not reflected on the
balance sheet; Finance Lease Obligations, mortgage financings and purchase money obligations
used for investment in PP&E in the aggregate principal amount not to exceed €10mn; Inter-company debt provided it must be expressly subordinated in right of payment to
the Notes; Guarantees of indebtedness of the Restricted Subsidiaries if permitted under the terms
of the Indenture; General basket of €30mn.
Restricted payments
If company can raise €1.00 of debt then 50% of accumulated net income less 100% accumulated net loss plus 100% of equity or equity-like proceeds, plus 50% of any cash dividends received from an Unrestricted Subsidiary, plus the Fair Market Value of an Unrestricted Subsidiary re-designated as a Restricted Subsidiary. Carve outs: Redemption, repurchase, retirement or other acquisition of any Equity Interests of the
Parent held by employees or management of up to €2mn per annum. General basket in aggregate amount of up to €30mn.
Transactions with affiliates
Transactions of over €5mn have to be at fair terms and approved by a majority of the disinterested members of the Board of Directors; for transactions of over €20mn, an opinion as to the fairness from an accounting, appraisal or investment banking firm of international standing is needed.
Source – BNP Paribas, Barry Callebaut

Barry Callebaut ⎪ January 2006
53 European High Yield Research
Barry Callebaut, Financial Model BNPP BNPP BNPP Actual Actual Actual Actual Actual Actual Actual F’cast F’cast F’cast CHF mn 2003 2004 Q1 05 Q2 05 Q3 05 Q4 05 2005 2006 2007 2008 P&L SUMMARY External Sales Revenue Cocoa, Sourcing & Risk Management 614.2 564.0 137.1 114.6 121.0 188.6 561.3 551.4 539.5 525.3 % change -1.4% -8.2% -13.6% 0.8% -7.7% 17.4% -0.5% -1.8% -2.2% -2.6% Food Manufacturers 1,579.7 1,639.3 463.1 415.3 371.4 439.9 1,689.7 1,729.8 1,763.0 1,779.6 % change 13.5% 3.8% -0.3% 6.1% 0.9% 5.9% 3.1% 2.4% 1.9% 0.9% Industrial Business Segment 2,193.9 2,203.3 600.2 529.9 492.4 628.5 2,251.0 2,281.2 2,302.6 2,305.0 % change 8.9% 0.4% -3.7% 4.9% -1.4% 9.1% 2.2% 1.3% 0.9% 0.1% Food Service/Retail Segment 1,377.4 1,845.6 554.6 481.4 365.0 409.1 1,810.1 1,738.3 1,711.8 1,711.4 % change 127.0% 34.0% -7.8% 2.6% -9.4% 10.0% -1.9% -4.0% -1.5% 0.0% Revenue from Sales and Services 3,571.3 4,048.9 1,154.8 1,011.3 857.4 1,037.6 4,061.1 4,019.5 4,014.3 4,016.3 % change 36.2% 13.4% -5.7% 3.8% -4.9% 9.5% 0.3% -1.0% -0.1% 0.1% Cost of goods sold -3,355.0 -3,362.5 -3,312.0 -3,291.7 -3,283.4 Gross Profit 693.9 698.6 707.4 722.6 733.0 gross margin 17.1% 17.2% 17.6% 18.0% 18.3% Marketing & Sales Expenses -243.4 -228.2 -229.1 -232.8 -232.9 % of sales 6.0% 5.6% 5.7% 5.8% 5.8% General & Administration Expenses -221.1 -219.8 -221.1 -220.8 -220.9 % of sales 5.5% 5.4% 5.5% 5.5% 5.5% Other income 48.5 47.0 48.2 48.2 48.2 % of sales 1.2% 1.2% 1.2% 1.2% 1.2% Other expense -49.6 -32.4 -40.2 -40.1 -40.2 % of sales 1.2% 0.8% 1.0% 1.0% 1.0% EBIT before restructuring, write-downs and impairments 208.7 228.3 87.3 72.4 28.4 77.2 265.3 265.3 277.0 287.2 % of sales 5.8% 5.6% 6.5% 6.6% 6.9% 7.2% Restructuring expense, write-downs and impairments 0.0 0.0 0.0 0.0 0.0 -94.0 -94.0 0.0 0.0 0.0 EBIT 208.7 228.3 87.3 72.4 28.4 -16.8 171.3 265.3 277.0 287.2 D&A 124.4 136.6 113.8 122.1 127.3 132.6 EBITDA before restructuring, write-downs andimpairments 333.2 364.9 115.5 100.6 56.1 106.9 379.1 387.4 404.3 419.8 % of sales 9.3% 9.0% 10.0% 9.9% 6.5% 10.3% 9.3% 9.6% 10.1% 10.5% Financial cost, net -80.2 -92.4 -20.7 -17.5 -22.7 -22.3 -83.2 -64.5 -65.2 -62.4 Non-operating income, net 0.0 -0.2 0.0 0.0 0.0 0.0 0.0 0.0 0.0 0.0 Profit before tax and monirity interest 128.5 135.7 66.6 54.9 5.7 -39.1 88.1 200.8 211.8 224.7 Taxes -25.0 -19.4 -11.5 -8.7 -4.8 4.6 -20.4 -46.2 -47.7 -50.6 effective tax rate 19.4% 14.3% 17.3% 15.8% 84.2% 11.7% 23.2% 23.0% 22.5% 22.5% Profit before minority interest 103.5 116.3 55.1 46.2 0.9 -34.5 67.7 154.6 164.2 174.2 Minority interest -0.2 -0.7 0.1 -0.1 -0.4 1.0 0.6 0.0 0.0 0.0 Net profit 103.3 115.6 55.2 46.1 0.5 -33.5 68.3 154.6 164.2 174.2 CASH FLOW ITEMS EBITDA 333.2 364.9 115.5 100.6 56.1 106.9 379.1 387.4 404.3 419.8 Net cash interest -87.6 -84.6 -20.7 -17.5 -22.7 -17.8 -78.7 -64.5 -65.2 -62.4 Cash effect from changes in working capital -96.7 99.0 -99.7 49.7 -19.1 116.6 47.5 -10.0 -10.0 -10.0 Cash taxes -24.2 -33.1 -11.5 -8.7 -4.8 -2.4 -27.4 -46.2 -47.7 -50.6 Restructuring charges -35.0 -35.0 -2.0 -15.0 -1.0 -31.0 -49.0 0.0 0.0 0.0 Other operating cash items 32.5 -68.1 0.0 -0.2 0.0 -71.7 -71.9 0.0 0.0 0.0 Realised exchange gain/(loss) -3.8 -9.0 2.1 15.0 1.1 -13.7 4.5 0.0 0.0 0.0 Net cash flow from operating activities 118.4 234.0 -16.3 123.9 9.6 87.0 204.2 266.7 281.5 296.8 Capex -69.0 -90.0 -39.5 -16.2 -27.0 -19.5 -102.2 -165.0 -105.0 -105.0 Free cash flow 49.4 144.0 -55.8 107.7 -17.4 67.5 102.0 101.7 176.5 191.8 BALANCE SHEET ITEMS Cash, CE and short-term deposits 36.8 38.6 83.6 44.3 80.6 27.2 27.2 0.9 121.2 254.3 Bank overdrafts and short-term debt 494.8 325.5 476.8 404.1 510.4 233.7 233.7 311.7 313.7 314.7 Long-term debt 575.2 659.5 653.9 625.3 636.6 759.0 759.0 759.0 759.0 759.0 Total debt 1,069.9 985.0 1,130.7 1,029.4 1,147.0 992.7 992.7 1,070.7 1,072.7 1,073.7 Net debt 1,033.2 946.4 1,044.3 982.2 1,063.6 962.7 962.7 1,067.0 948.7 816.5 Off-balance sheet receivables financing programme 260.0 260.0 260.0 260.0 CREDIT RATIOS Total debt/EBITDA before one-offs 3.2x 2.7x 2.9x 3.0x 3.4x 2.6x 2.6x 2.8x 2.7x 2.6x Net debt/EBITDA before one-offs 3.1x 2.6x 2.7x 2.9x 3.1x 2.5x 2.5x 2.8x 2.3x 1.9x Net debt (with receivables programme)/EBITDA (beforeone-offs) 3.2x 3.4x 3.0x 2.6x EBITDA/Financial cost, net 4.2x 3.9x 4.4x 4.1x 4.0x 4.6x 4.6x 6.0x 6.2x 6.7x
Source – BNP Paribas Estimates, Barry Callebaut Leverage and Coverage are based on the last 12 months’ results. Some of the ratios are adjusted for the effects of acquisitions and disposals. In addition, these 2 measures are usually calculated based on EBITDA adjusted for exceptional or non-recurring items. Leverage is defined as net lease-adjusted debt (x8 operating leases)-to-EBITDAR. Coverage is defined as EBITDAR-to-(net interest+rental expenses).

Basell ⎪ January 2006
54 European High Yield Research
Basell Bond Description & Market Data, as of 5 January 2006
Next Call Issuer Credit Trend: Positive
Description Amount (o/s) Ratings Date Price Price YTW STW
8.375% Senior Notes due 2015 EUR 500m B2/B- 15-Aug-10 104.188 102.75 7.96% 470bp 8.375% Senior Notes due 2015 USD 615m B2/B- 15-Aug-10 104.188 100 8.37% 351bp 8.1% Guaranteed Notes due 2027 USD 300m B2/B- NC - 92.25 8.92% 386bp
Source – BNP Paribas
Company Profile
Basell is the world’s largest manufacturer and marketer of polyolefins and advanced polyolefins. The company is also a global leader in the development and licensing of technologies for the production of polyolefins. Polyolefins (polypropylene and polyethylene) are the fastest growing products in their industry segment (thermoplastics) and comprise approximately two thirds of worldwide thermoplastics demand. Basell’s products are used in consumer and industrial applications ranging from food and beverage packaging to housewares and construction materials.
Basell was formerly a joint venture between Shell and BASF that was formed in September 2000. In May 2005 Basell was acquired by Access Industries for €4.4bn. Basell has 39 manufacturing facilities in 21 countries and a global sales, distribution and marketing network that serves over 4,000 customers in more than 129 countries. For the last twelve months ended 30 June 2005 the company generated revenues of €7,734mn and in the last twelve months ended 30 September 2005 EBITDA of €799mn.
Investment Recommendation
Following the release of Q3 2005 results and the disclosure of EBITDA for October and November Basell’s bonds moved up a couple of bond points. At this stage we feel unable to change our REDUCE recommendation for the following reasons:
a) We do not yet have clarity with regard to a €35mn adjustment to EBITDA for Q3. Without this, EBITDA for Q3 would have been significantly down on the prior year.
b) We are still concerned as to the volatility of results with respect to their margin over raw materials. As the release showed, cracker margins were heavily impacted by increased ethylene costs. Although Basell have rebuilt margins in Q4 every time, there is a margin squeeze their free cash flow generation ahead of the expected industry downturn in 2008 will be reduced.
c) We are somewhat concerned that they are seeing no growth in the European and North American polyolefins market. If in a year of fairly robust GDP growth (particularly in the US), there is no growth what will the next couple of years look like if there is an economic slowdown?
d) Finally, we think that the current debt level represents the low point of the working capital cycle and that disclosed debt may also require upwards adjustment for the €150mn of acquisitions and possibly €200mn from the unpaid transaction costs. We suspect that Q3 is normally a quarter that releases working capital. Since Basell did not release a comparative quarter for Q3 2004, we do not know this for certain but note that in 2004 the first half consumed working capital of €182mn whereas the second half released €120mn. Looking at the first quarters of 2004 and 2005 working capital consumed €200mn and €300m respectively. Based on current monomer prices an outflow of perhaps €250mn would appear to be an appropriate level to expect in Q1 2006.
On the basis of Basell’s disclosed net leverage of 3.6x, the bonds would appear attractive. However, until we clarify certain matters with the Company we will retain our sceptical stance.
Adam Harnetty, ACA +44 20 7595 8831 [email protected]

Basell ⎪ January 2006
55 European High Yield Research
Debt Profile €1.95bn Senior Credit Facilities
The senior credit facilities comprise an amortising Term A loan of €540mn maturing August 2012, a Term B loan of €530mn with a bullet maturity of August 2013 and a Term C loan of €530mn with a bullet maturity of August 2014. Additionally, there is a €350mn revolving credit facility maturing August 2012. As at 30 September 2005 the revolver was undrawn. The senior credit facility benefits from guarantees from the bond issuer and a number of subsidiaries. The facility is also secured on the shares of a number of subsidiaries, certain assets of a number of subsidiaries and also on the high yield proceeds loan.
€500mn and $200mn Securitisation Programs
At the time of the acquisition, Basell entered into 5 year securitisation programs in Europe and the US. As at 30 September 2005, €500mn was drawn under the programs.
€200mn 8.1% Guaranteed Notes due 2027
This is a legacy bond issued prior to the acquisition by Access Industries. The notes were issued by Basell Finance Company BV and are guaranteed on an unsecured, unsubordinated basis by Basell BV. The notes are subject to a number of covenants restricting Basell’s ability to incur Liens, additional indebtedness and other customary covenants.
$615mn 8.375% and €500mn 8.375% Senior Notes due 2015
As part of the acquisition financing, Basell issued the equivalent of €1bn of high yield notes in August 2005. Although there were limited guarantees in place at the time of the transaction, Basell has to use its commercially reasonable endeavours to procure that within 180 days of issue certain subsidiaries (accounting for more than 50% of consolidated EBITDA) guarantee the notes on a senior subordinated basis. Failure to do so will mean the coupon on the $ and € bonds will increase by 0.25% per annum. The notes also benefit from a second priority pledge of the high yield proceeds loan.
Basell Structure
Nell AcquisitionS.a.r.l.
Nell A.F. S.a.r.l.
Nell FundingS.a.r.l.
Equity(€860 million)
€500m Senior Notes$615m Senior Notes
100%
100%
Nell Bidco B.V.
Basell B.V.
Basell FinanceCompany
100%
100%
100%
Nell (US)Acquisition S.a.r.l.
Nell Acquisition(US) LLC
US Basell GroupCompanies
100%
100%
100%
SeniorSecured Credit
FacilitiesNon-US Basell
Group Companies
100%
High Yield Proceeds Loan
Senior Secured CreditFacilities
Senior Secured CreditFacilities
Senior Secured CreditFacilities
Senior Secured CreditFacilities
Source – Basell

Basell ⎪ January 2006
56 European High Yield Research
Bond Covenants Bond Description USD 8.375% and EUR 8.375% Senior Notes due 2015
Issuing entity Nell AF Sarl
Ranking Senior
Position vs. bank debt Subordinated
Position vs. other bonds Structurally subordinated
Security/Guarantees Senior subordinated upstream guarantees to be put in place covering more than 50% of consolidated EBITDA. Failure to do so within 180 days will increase the coupon by 0.25% per annum. Second priority security over the high yield proceeds loan.
Optional Redemption
Make Whole – prior to 15 August 2010 at T+50bp
Equity Claw – prior to 15 August 2008 35% at 108.375%
Call Schedule:
15 August 2010 – 104.188%
15 August 2011 – 102.792%
15 August 2012 – 101.396%
15 August 2013 – 100.000%
Tax redemption Yes—at par
Negative pledge Limitation on liens
Cross default Yes
Fall away covenants No
Anti-layering Yes, but only debt subordination not lien subordination
Change of control Put at 101 based on Access having less than 51% prior to an IPO or less than 35% thereafter or if after an IPO a new holder has more votes than Access.
Asset sales Fair market value and > 75% proceeds in cash or equivalents. Within 365 days reinvest in similar business or repay debt. Any proceeds remaining (subject to €20mn minimum) must be used to tender for the notes at par.
Debt Limit
Consolidated fixed charge coverage ratio must exceed 2:1.
Carve outs:
Credit facilities up to €1.95bn (as reduced by any pay down from asset sales);
Capital leases and similar up to €50mn;
Guarantees of joint venture debt up to €75mn;
€50mn general basket.
Restricted Payments
Subject to being able to incur €1 of additional debt then:
50% of consolidated net income;
5 years after the issue date up to 2% of the share capital to permit employee stock repurchases;
€10mn general carve out.
Transactions with Affiliates Must be no less favourable than if executed in an arm’s length transaction. If greater than €5mn requires a board resolution and if greater than €25mn requires a fairness certificate from an independent advisor.
Source – Basell, BNP Paribas

Basell ⎪ January 2006
57 European High Yield Research
Basell, Financial Model FYE 31 December US GAAP US GAAP US GAAP IFRS IFRS IFRS IFRS IFRS IFRS IFRS IFRS EUR mn 2002 2003 2004 Q1 04 Q2 04 Q3 04 Q4 04 2004 Q1 05 Q2 05 Q3 05 PROFIT & LOSS
Sales 5,891 5,729 6,728 1,495 1,630 6,747 1,996 2,116 2,148 Cost of sales -5,128 -5,163 -5,952 -1,303 -1,448 -5,954 -1,686 -1,888 -2,028 Selling expenses -372 -345 -345 -74 -81 -342 -97 -98 -104 R&D & other -184 -193 -163 -37 -39 -163 -36 -41 -43 Amortisation -101 -100 -94 -23 -24 -95 -24 -24 -18 Operating profit 106 -72 174 58 38 193 153 65 -45 Financial income & expense -120 -88 -67 -24 -10 -68 -16 -16 -59 Profit before tax -14 -160 107 34 28 125 137 49 -104 Tax -7 43 -57 -21 -15 -61 -92 -64 38 Associates 28 49 93 16 20 93 34 30 23 Profit after tax 7 -68 143 29 33 157 79 15 -43
Operating profit 106 -72 174 58 38 193 153 65 -45 D&A 401 411 419 96 98 429 99 103 88
57 32 50 1 1 49 1 0 112 EBITDA 564 371 643 155 137 156 223 671 253 168 155
Sales change y/y -8.9% -2.7% 17.4% 33.5% 29.8% Operating profit margin 1.8% -1.3% 2.6% 3.9% 2.3% 2.9% 7.7% 3.1% -2.1% EBITDA margin 9.6% 6.5% 9.6% 10.4% 8.4% 9.9% 12.7% 7.9% 7.2%
CASHFLOW
Net loss 7 -69 143 29 33 157 79 15 -43 D&A 401 411 419 96 98 429 99 103 88 Other -4 -8 -34 -1 -1 -33 -1 -2 0 Change in working capital -42 -138 -55 -196 14 -61 -313 46 177 Cashflow from operations 362 196 473 -72 144 492 -136 162 222
Capex -286 -279 -237 -63 -55 -73 -65 -256 -42 -78 -52 Other 52 12 47 0 3 47 0 4 250 Cashflow from investing -234 -267 -190 -63 -52 -209 -42 -74 198
Net debt repayment -182 44 -266 123 -61 -266 149 -80 -159
FX -3 -2 -2 1 -1 -2 1 2 1
Change in cash -57 -29 15 -11 30 15 -28 10 262
BALANCE SHEET PF PF
Cash 29 39 505
Bank debt 1,563 1,663 1,599 Securitisation 500 500 499 Existing debt 468 578 317 HY Bonds 1,100 1,100 1,010 Unamortised fees -103 -103 -70 Gross debt 3,528 3,738 3,355
Net debt 3,499 3,699 2,850
LTM RATIOS PF PF
Coverage 3.4 3.6 3.6 EBITDA-Capex/Interest 2.4 2.4 2.5 Gross leverage 4.6 4.5 4.2 Net leverage 4.6 4.5 3.6
Source – BNP Paribas Estimates, Basell

Brake Bros ⎪ January 2006
58 European High Yield Research
Brake Bros Bond Description & Market Data, as of 5 January 2006
Next Call Issuer Credit Trend: Stable
Description Amount (o/s) Ratings Date Price Price YTW STW
11.50% Senior Notes due 2011 EUR 105mn B3/B- 15-Apr-07 105.75 111.75 6.12% 338bp 12.00% Senior Notes due 2011 GBP 105mn B3/B- 15-Oct-07 106.00 111.00 8.37% 380bp
Source – BNP Paribas
Company Profile Brake Bros is a leading foodservice distributor in the UK and France. The company is the market leader in the UK foodservice sector. In France, Brake Bros is one of the handful of foodservice distributors with a nationwide presence. The company supplies food products across all temperature ranges including frozen, ambient and chilled/fresh, with particular strength in the frozen segment. Brake Bros was acquired in the autumn of 2002 by Clayton, Dubilier & Rice (CD&R) for £593.0mn (equity contribution of £269.9mn). CD&R, together with certain co-investors, indirectly owns 100% of the company. For the twelve months ended 30 September 2005, Brake Bros had turnover of £1,624mn and EBITDA before exceptional items of £82mn. At the end of third quarter 2005, Brake Bros had leverage of 4.2x and coverage of 2.2x.
Investment Recommendation We maintain our HOLD/Stable Credit Trend recommendation for Brake Bros’ notes. We believe that Brake Bros’ operating performance has turned the corner in the third quarter of this year after a weak first half. We expect that the company will perform consistently during the next several quarters. We feel that further upside for the bonds is limited from the current levels, especially when considering the offer-side prices. We think that the company will exercise an option to call the bonds in 2007.
Debt Profile Brake Bros had £405mn of total debt outstanding at the end of third quarter 2005, including £176.5mn of the GBP- and EUR-denominated high yield bonds, £183.6mn of term loans, £26.2mn of finance lease obligations, £13.0mn outstanding under the revolver credit facility and £5.9mn of loan notes and bank overdrafts. Brake Bros’ credit facility is for £295mn in total, including a £75mn revolving credit facility and four term tranches (A for £70mn, B for £60mn, C for £60mn and D for £30mn, all fully drawn). The £5.4mn loan notes represent obligations to the Brake family, the former owners of the company.
Brake Bros’ credit facilities are secured by fixed and floating charges over substantially all of the assets of Brake Bros Acquisition, fixed and floating charges over assets of Brake Bros Acquisition’s material subsidiaries incorporated in England and Wales and the Scottish-law governed security over material properties in Scotland. Brake Bros Limited also pledged its shares in Brake France S.A.S. as a further security.
The bonds are senior obligations of Brake Bros Finance PLC whose only asset is the stock of Brake Bros Acquisition PLC, the borrower under the bank facilities and the owner of the operating subsidiaries. Bondholders benefit from a pledge on an intercompany loan from Brake Bros Finance PLC to Brake Bros Acquisition PLC. Under the terms of the intercreditor agreement, the intercompany loan is subordinated to the bank debt. The bonds also benefit from upstream senior subordinated guarantees from Brake Bros Acquisition PLC and from the operating subsidiaries and by this virtue are contractually subordinated to the bank debt.
Oleksiy Soroka, CFA +44 20 7595 4878 [email protected]

Brake Bros ⎪ January 2006
59 European High Yield Research
Brake Bros Structure
CD&R Fund VI(1)
JP Morgan Partners Co-Investors and Other Co-InvestorsInvestment vehicles
100% owned
23.3% owned76.7% owned
Brake Bros Limited Partnership
Holding Companies(3)
Brake Bros Finance PLC
Brake Bros Acquisition PLC(6)
Brake Bros Limited(6)
Management Investments (on-going program)
Operating Subsidiaries(6)(12)
100% owned(2)
100% owned(4)
100% owned(5)
100% owned(9)
Senior Facilities(8)
Intercompany Loan(7)
Notes
Second-Priority Shares Pledge(10)
Senior-Subordinated Guarantee
Pledge of Intercompany Loan(11)
Senior-Subordinated Guarantee
Senior-Subordinated Guarantee
Source – Brake Brothers
(1) Approximately £270mn of proceeds from the investments made by CD&R Fund VI were invested through CD&R Fund VI affiliates as an equity contribution to the Issuer and then invested as an equity contribution from the Issuer to Brake Bros Acquisition, for use in the Acquisition.
(2) By Principal Shareholders. (3) The Holding Companies are Brake Bros Holding I Limited, Brake Bros Holding II Limited and Brake Bros Holding III Limited. (4) One share in the Issuer is held in trust for Brake Bros Holding III Limited by CDRP Nominees Limited, a company indirectly wholly-
owned by Brake Bros Holding I Limited, to comply with UK minimum shareholder requirements. (5) One share in Brake Bros Acquisition is held in trust for the Issuer by CDRP Nominees Limited to comply with UK minimum
shareholder requirements. (6) Guarantors of the Senior Facilities. (7) The Issuer will make an intercompany loan of the net proceeds of the Offering to Brake Bros Acquisition, the proceeds of which will
be used to repay a previous intercompany loan from the Issuer to Brake Bros Acquisition of the proceeds of the interim Loan agreement. The Issuer will use the proceeds from the repayment of the First Intercompany Loan to repay all amounts outstanding under the Interim Loan Agreement.
(8) Senior Facilities include term loans, revolving credit facility and a capital expenditure facility. (9) One share in Brake Bros Limited is held by CDRP Nominees Limited. (10) Brake Bros Acquisition granted a second-priority security over the shares of Brake Bros Limited, a subsidiary of Brake Bros
Acquisition. The shares of Brake Bros Limited are also pledged to the lenders under the Senior Facility Agreement on a first-priority basis.
(11) A first-priority assignment by way of security of the Intercompany Loan. (12) Brake Bros Foodservice Limited, an operating subsidiary, is not a guarantor under the Notes.

Brake Bros ⎪ January 2006
60 European High Yield Research
Bond Covenants Bond description EUR 11.50% Senior Notes due 2011 GBP 12.00% Senior Notes due 2011
Issuing entity Brake Bros Finance PLC
Ranking Senior Notes Senior Notes
Position vs. bank debt Structurally and contractually subordinated Structurally and contractually subordinated
Position vs. other bonds -
Security/Guarantees
Senior subordinated guarantees from Brake Bros Acquisition, Brake Bros Limited and certain of the Issuer’s subsidiaries. The notes are secured by a first-priority pledge on the Issuer’s intercompany loan to its subsidiary, Brake Bros Acquisition. The senior subordinated guarantee by Brake Bros Acquisition is secured by a second-priority grant of security over the shares of Brake Bros Limited, a subsidiary of Brake Bros Acquisition.
Optional redemption
Make Whole – Bunds+50bp before 15 April 2007
Equity Clawback – 35% at 111.5% before 15 April 2006
Call Schedule: - during the twelve-month period beginning
15 April 2007 – 105.750%
15 April 2008 – 103.833%
15 April 2009 – 101.917%
15 April 2010 and thereafter – 100.000%
Make Whole – Gilt+50bp before 15 October 2007
Equity Clawback – 35% at 112.0% before 15 April 2006
Call Schedule: - during the twelve-month period beginning
15 October 2007 – 106.000%
15 October 2008 – 104.000%
15 October 2009 – 102.000%
15 October 2010 and thereafter – 100.000%
Tax redemption Yes – at par
Negative pledge Yes
Cross default Yes – on £10mn or more of other debt
Fall away covenants No
Anti-layering Yes
Change of control Put at 101%.
Asset sales
The Issuer cannot sell assets unless:
The issuer receives a fair market value for them (as determined by the Board of Directors for Asset Dispositions of over £8.5mn);
For Asset Dispositions of over £8.5mn, at least 75% of the consideration is in cash or equivalent (including a transfer of the Issuer’s debt, cash equivalents, accumulated non-cash proceeds not to exceed £10mn);
Must use proceeds within a year to pay down senior debt, reinvest in Additional Assets (as authorised by the Board of Directors), pay down the Notes and the pari passu indebtedness.
Debt limit
Pro forma Fixed Charge Coverage Ratio of at least 2.00x before 15 April 2006 and 2.25x after 15 April 2006.
Carve outs:
Purchase Money Obligations and Capitalised Lease Obligations not to exceed £45mn in aggregate amount at any one time;
Indebtedness of a Receivables Subsidiary;
Indebtedness assumed upon an Acquisition, provided the company could incur at least £1.00 of additional indebtedness under the Fixed Charge Coverage test.
£20mn.
Source – BNP Paribas, Brake Brothers

Brake Bros ⎪ January 2006
61 European High Yield Research
Bond Covenants Bond description EUR 11.50% Senior Notes due 2011 GBP 12.00% Senior Notes due 2011
Restricted payments
If company can raise €1.00 of debt then 50% of accumulated net income less 100% accumulated net loss plus 100% of equity or equity-like proceeds
Carve outs:
loans, advances, dividends or distributions to a Parent company to allow it to repurchase the company stock from the management of up to £7.5mn, plus £3.0mn multiplied by the number of calendar years that have commenced since the issue date of the bonds;
dividends, distributions and any like payments to a Parent Company in an amount not to exceed in any fiscal year 6% of the aggregate gross proceeds from a public offering of stock;
General basket of up to £10mn.
Transactions with affiliates
Transactions of over £3mn have to be on fair terms and be approved by a majority of the members of the Board of Directors with no material interest in the transactions. For transactions of over £10mn, the Board of Directors should also receive a written opinion as to its fairness from an Independent Qualified Party.
Carve outs:
any Restricted Payment Transactions;
Payments related to employment compensation;
Payments to CDR of fees of up to £2mn in any fiscal year and fees in connection with any acquisition, merger, recapitalization or similar transaction as provided in a Management Agreement.
Source – BNP Paribas, Brake Brothers

Brake Bros ⎪ January 2006
62 European High Yield Research
Brake Bros, Financial Model BNPP BNPP BNPP BNPP BNPP FYE 31 December Actual Actual Actual Actual Actual Actual F'cast F'cast F'cast F'cast F'cast GBP mn FY 02 FY 03 FY 04 Q1 05 Q2 05 Q3 05 Q4 05 FY 05 FY 06 FY 07 FY 08 P&L SUMMARY Segmental Turnover Brakes Broadline 1,046.5 1,131.8 1,150.5 270.9 298.5 295.4 315.4 1,180.2 1,215.6 1,246.0 1,271.0 growth yoy 4.5% 8.2% 1.7% -2.4% 4.4% 4.1% 4.0% 2.6% 3.0% 2.5% 2.0% Country Choice (bakery) 44.3 50.1 54.4 12.6 14.8 15.4 13.7 56.5 58.5 60.3 61.5 growth yoy 6.5% 13.1% 8.6% 5.0% 2.8% 4.1% 4.0% 3.9% 3.5% 3.0% 2.0% M&J Seafood 84.8 93.2 91.0 21.0 26.3 27.9 28.1 103.3 113.6 119.3 122.8 growth yoy 8.4% 9.9% -2.4% 7.1% 15.4% 15.3% 15.0% 13.5% 10.0% 5.0% 3.0% Wild Harvest 1.0 1.2 1.2 1.2 4.6 4.8 5.0 5.2 growth yoy 5.0% 4.0% 3.0% Total UK 1,175.6 1,275.1 1,295.9 305.5 340.8 339.9 358.4 1,344.6 1,387.7 1,425.6 1,455.3 growth yoy 4.8% 8.5% 1.6% -1.2% 5.5% 5.3% 5.1% 3.8% 3.2% 2.7% 2.1% Brake France 282.1 270.4 270.9 73.7 72.7 77.1 77.4 300.9 325.0 347.7 365.1 growth yoy 5.5% -4.1% 0.2% 20.8% 14.8% 5.8% 5.0% 11.1% 8.0% 7.0% 5.0% Total Turnover 1,457.7 1,545.5 1,566.8 379.2 413.5 417.0 435.8 1,645.5 1,712.7 1,773.3 1,820.3 % change 5.0% 6.0% 1.4% 2.5% 7.0% 5.4% 5.1% 5.0% 4.1% 3.5% 2.7% Segmental EBITDA Brakes Broadline 59.7 63.3 68.9 8.4 13.4 15.0 21.4 58.3 65.6 71.6 73.1 % of sales 5.7% 5.6% 6.0% 3.1% 4.5% 5.1% 6.8% 4.9% 5.4% 5.8% 5.8% Country Choice (bakery) 4.7 6.1 7.5 2.0 2.4 2.2 2.4 9.0 9.4 9.6 9.8 % of sales 10.6% 12.2% 13.8% 15.9% 16.2% 14.3% 17.5% 15.9% 16.0% 15.9% 15.9% M&J Seafood 5.2 6.1 6.0 0.9 1.7 2.2 3.9 8.7 8.5 8.9 9.2 % of sales 6.1% 6.5% 6.6% 4.3% 6.5% 7.9% 14.0% 8.5% 7.5% 7.5% 7.5% Wild Harvest -0.2 0.0 -0.5 -0.4 -1.1 -0.7 -0.3 0.1 % of sales -20.0% 0.0% -41.7% -33.3% -23.9% -15.0% -5.0% 2.0% Total UK 69.6 75.5 82.4 11.1 17.5 18.9 27.4 76.0 83.5 90.2 92.1 % of sales 5.9% 5.9% 6.4% 3.6% 5.1% 5.6% 7.6% 5.7% 6.0% 6.3% 6.3% Brake France 2.6 4.5 7.6 0.7 1.7 3.8 3.0 9.2 6.5 7.0 7.3 % of sales 0.9% 1.7% 2.8% 0.9% 2.3% 4.9% 3.9% 3.1% 2.0% 2.0% 2.0% EBITDA before exceptionals 72.2 80.0 90.0 11.8 19.2 22.7 30.4 85.2 90.0 97.1 99.4 EBITDA margin 5.0% 5.2% 5.7% 3.1% 4.6% 5.4% 7.0% 5.2% 5.3% 5.5% 5.5% CASH FLOW ITEMS EBITDA before exceptional items 72.2 80.0 90.0 11.8 19.2 22.7 30.4 85.2 90.0 97.1 99.4 Exceptional items -32.7 -19.1 -11.3 -3.3 -3.9 -3.6 0.0 -10.8 0.0 0.0 0.0 Loss (profit) on sale of tangible fixed assets -0.1 -0.3 -1.1 -0.3 -1.0 -0.1 0.0 -1.4 0.0 0.0 0.0 Movement in pension provision -1.0 -0.4 -0.4 -0.5 0.0 -1.3 -1.5 -1.5 -1.5 Operating cash flow before interest andtax 72.5 73.6 110.1 -27.7 43.3 -2.5 68.9 83.1 92.5 99.6 101.9 Cash interest, net -14.6 -32.1 -37.7 -5.6 -13.0 -4.9 -12.5 -36.0 -34.1 -33.3 -32.5 Other (debt issue, acqn & lease costs) -17.4 -11.3 0.0 0.0 0.0 0.0 0.0 0.0 0.0 0.0 0.0 Cash Tax -5.8 -3.0 1.8 3.8 0.0 0.2 0.0 4.0 -3.0 -3.0 -3.0 Operating cash flow 34.7 27.2 74.2 -29.5 30.3 -7.2 56.4 51.1 55.4 63.3 66.3 Capex -30.9 -8.3 -47.2 -11.0 -15.9 -7.4 -5.7 -40.0 -30.0 -30.0 -30.0 Free Cash Flow 3.8 18.9 27.0 -40.5 14.4 -14.6 50.7 11.1 25.4 33.3 36.3 BALANCE SHEET ITEMS Cash, equivalents & restricted cash 83.7 60.3 104.5 57.0 68.3 60.6 93.9 95.7 111.0 132.9 158.7 Term A £70m 225 bp over 30.3 54.5 60.5 55.5 50.0 47.5 29.7 29.7 19.7 9.7 -0.3 Term B £60m 275 bp over 30.0 30.0 60.0 60.0 60.0 58.1 58.1 58.1 58.1 58.1 58.1 Term C £60m 325 by over 30.0 30.0 54.8 54.8 55.1 53.5 53.5 53.5 53.5 53.5 53.5 Term D £30m 250 bp over 15.0 30.0 30.0 26.0 24.5 24.5 24.5 24.5 24.5 24.5 £220m Term Loans 90.3 129.5 205.3 200.3 191.1 183.6 165.8 165.8 155.8 145.8 135.8 £75m Revolver 225 bp over 11.0 0.0 0.0 13.0 13.0 13.0 0.0 0.0 0.0 Bank overdrafts 4.9 0.0 0.0 1.3 0.5 0.5 0.5 0.0 0.0 0.0 Loan notes 142.9 70.1 5.8 5.8 5.4 5.4 5.8 5.8 6.0 6.0 6.0 Interim bank loan 175.0 HY Bonds 179.0 179.3 177.2 175.9 176.5 180.5 180.5 185.5 185.5 185.5 Other bank loans (current bank notes) 0.3 Finance lease obligations 12.9 22.8 22.2 20.8 26.8 26.2 26.2 26.2 21.2 16.2 11.2 Total Debt 437.3 401.4 412.9 404.1 400.5 405.2 391.8 391.8 368.5 353.5 338.5 Net Debt 353.6 341.1 308.3 347.1 326.7 344.6 297.9 296.1 257.5 220.6 179.9 CREDIT RATIOS EBITDA / Cash Interest 4.9x 2.5x 2.4x 2.2x 2.2x 2.2x 2.3x 2.4x 2.6x 2.9x 3.1x Total Debt / EBITDA 6.1x 5.0x 4.6x 4.7x 4.9x 4.9x 4.6x 4.6x 4.1x 3.6x 3.4x Net Debt / EBITDA 4.9x 4.3x 3.4x 4.0x 4.0x 4.2x 3.5x 3.5x 2.9x 2.3x 1.8x
Source – BNP Paribas Estimates, Brake Bros Leverage and Coverage are based on the last 12 months’ results. Some of the ratios are adjusted for the effects of acquisitions and disposals. In addition, these 2 measures are usually calculated based on EBITDA adjusted for exceptional or non-recurring items. Leverage is defined as net lease-adjusted debt (x8 operating leases)-to-EBITDAR. Coverage is defined as EBITDAR-to-(net interest+rental expenses).

Brake Bros ⎪ January 2006
63 European High Yield Research
This page has been left blank intentionally

British Airways ⎪ January 2006
64 European High Yield Research
British Airways Bond Description & Market Data, as of 5 January 2006
Next Call Issuer Credit Trend: Positive
Description Amount (o/s) Ratings Date Price Price YTW STW
10.875% notes due 2008 GBP 100mn Ba2/BB- NC NC 111.14 5.80% 115bp 7.250% notes due 2016* GBP 250mn Ba2/BB- NC NC 110.60 7.30% 284bp
* A coupon for the notes due 2016 stepped up to 8.75% on 24 August 2002 after Moody’s reduced the bond rating to Ba2 in March 2002. Source – BNP Paribas
Company Profile
British Airways (BA) is a leading provider of international and UK domestic passenger and cargo airline services. In the year ended 31 March 2005, BA carried over 35.7 million passengers, the majority of them on international routes. The airline operates flights to and from the UK to multiple destinations around the world. British Airways uses Heathrow Airport as its hub and it controlled 40.0% of the slot space at the airport as of March 2004. A strong presence in Heathrow allows BA to capture a large share of transatlantic travel, especially in the lucrative premium class segment. The airline is a member of the oneworld alliance together with Aer Lingus, American Airlines, Cathay Pacific, Finnair, Iberia, LanChile, Qantas and Swiss International Airlines. In the twelve months ended 30 September 2005, British Airways had turnover of £8,096mn and EBITDA before exceptional items of £1,349mn. As of the last balance sheet date, the company had lease-adjusted leverage of 2.9x and lease-adjusted coverage of 3.7x.
Investment Recommendation
We maintain a HOLD/Positive Credit Trend recommendation for BA’s bonds. We believe that further short-term tightening upside is limited for the bonds from the current levels. We forecast that the airline will continue to generate free cash flow during the next two years and will delever gradually. However, at present, we do not see BA crossing over to high grade during the next couple of years. We are encouraged by the initial moves made by BA’s new CEO Willie Walsh and do not expect major deviations from the airline’s earlier strategic plan. However, we also note that the recent management reshuffle does adds certain element of unpredictability with regards to the company’s future moves. We also feel that there will probably be some negative implications for BA once the UK-US (specifically, Heathrow Airport – US Airports) route is finally liberalized. On the other hand, unless some of the airline’s current Heathrow slots will have to be re-auctioned (which we believe is quite unlikely), the negative effect should be relatively modest. Finally, the airline industry continues to be exposed to a risk of terrorist attacks or other potential shocks to international travel.
Debt Profile
As of 30 September 2005, British Airways had total balance sheet debt of £4,342mn. We estimate that it consisted of £1,151mn of bank debt and bonds (which we understand are pari passu), £1,574mn of finance leases and £1,617mn of hire purchase agreements. British Airways also uses off-balance sheet operating leases to finance the acquisition of new aircraft. Finally, we note that as of the latest reported balance sheet date, BA had very substantial employee benefit obligations of £1,813mn.
Oleksiy Soroka, CFA +44 20 7595 4878 [email protected]

British Airways ⎪ January 2006
65 European High Yield Research
British Airways, Financial Model BNPP BNPP BNPP BNPP BNPP FYE 31 March Actual Actual Actual Actual Actual F’cast F’cast F’cast F’cast F’cast GBP mn 2003 2004 2005 Q1 06 Q2 06 Q3 06 Q4 06 2006 2007 2008 P&L SUMMARY Turnover Traffic revenue - passenger 6,545 6,476 6,500 1,690 1,792 1,679 1,617 6,778 7,085 7,079 % change -7.0% -1.1% 0.4% 4.3% 9.0% 8.9% Traffic revenue - freight and mail 484 463 482 118 121 136 118 493 518 542 % change 0.2% -4.3% 4.1% 2.3% 5.1% 4.5% Non-scheduled services 45 14 0 0 0 0 0 0 0 0 % change -13.5% -68.9% Other revenue 614 607 790 251 292 263 258 1,063 1,137 1,194 % change -20.2% -1.1% 30.1% 57.9% 35.8% 25.0% 25.0% 27.9% 7.0% 5.0% Turnover 7,688 7,560 7,772 2,059 2,205 2,078 1,992 8,334 8,740 8,815 % change -7.8% -1.7% 2.8% 8.3% 8.2% 6.2% 6.2% 6.7% 4.9% 0.8% Operating costs Employee costs -2,107 -2,180 -2,235 -570 -568 -551 -630 -2,318 -2,273 -2,248 % of turnover 27.4% 28.8% 28.8% 27.7% 25.8% 26.5% 31.6% 27.8% 26.0% 25.5% Depreciation and amortisation -676 -679 -739 -178 -171 -171 -185 -705 -675 -650 Aircraft operating lease costs -189 -135 -106 -25 -31 -32 -27 -115 -125 -130 % of turnover 2.5% 1.8% 1.4% 1.2% 1.4% 1.5% 1.4% 1.4% 1.4% 1.5% Fuel and oil costs -842 -922 -1,128 -355 -410 -467 -420 -1,653 -1,748 -1,763 % of turnover 11.0% 12.2% 14.5% 17.2% 18.6% 22.5% 21.1% 19.8% 20.0% 20.0% Engineering and other aircraft costs -566 -511 -432 -117 -118 -101 -126 -461 -481 -485 % of turnover 7.4% 6.8% 5.6% 5.7% 5.4% 4.9% 6.3% 5.5% 5.5% 5.5% Landing fees and en route charges -576 -549 -556 -142 -145 -141 -131 -560 -590 -599 % of turnover 7.5% 7.3% 7.2% 6.9% 6.6% 6.8% 6.6% 6.7% 6.8% 6.8% Handling, catering & other operating costs -961 -934 -918 -234 -248 -239 -221 -942 -988 -992 % of turnover 12.5% 12.4% 11.8% 11.4% 11.2% 11.5% 11.1% 11.3% 11.3% 11.3% Selling costs -706 -554 -490 -108 -106 -83 -95 -392 -406 -405 % of turnover 9.2% 7.3% 6.3% 5.2% 4.8% 4.0% 4.8% 4.7% 4.7% 4.6% Accommodation, group equip costs & currency diffs -686 -691 -612 -154 -147 -152 -140 -593 -612 -617 % of turnover 8.9% 9.1% 7.9% 7.5% 6.7% 7.3% 7.0% 7.1% 7.0% 7.0% Exceptional operating costs -84 0 0 0 0 0 0 0 0 0 Total operating expenditure -7,393 -7,155 -7,216 -1,883 -1,944 -1,937 -1,975 -7,739 -7,897 -7,889 Operating profit 295 405 556 176 261 141 18 595 843 926 % of turnover 3.8% 5.4% 7.2% 8.5% 11.8% 6.8% 0.9% 7.1% 9.6% 10.5% EBITDA 971 1,084 1,295 354 432 312 203 1,300 1,518 1,576 % of turnover 12.6% 14.3% 16.7% 17.2% 19.6% 15.0% 10.2% 15.6% 17.4% 17.9% Exceptional operational items -84 0 0 0 0 0 0 0 0 0 EBITDA before exceptional costs 1,055 1,084 1,295 354 432 312 203 1,300 1,518 1,576 % of turnover 13.7% 14.3% 16.7% 17.2% 19.6% 15.0% 10.2% 15.6% 17.4% 17.9% Operating lease costs -370 -338 -235 -76 -76 -76 -76 -305 -315 -320 EBITDAR before exceptional items 1,425 1,422 1,530 430 508 388 279 1,605 1,833 1,896 % of turnover 18.5% 18.8% 19.7% 20.9% 23.0% 18.7% 14.0% 19.3% 21.0% 21.5% Net interest payable -247 -216 -182 -38 -32 -36 -35 -141 -126 -98 CASH FLOW ITEMS Cash flow from operating activities (BNPP defn) 942 886 1,090 367 198 198 322 1,085 1,161 1,210 Capex -319 -253 -284 -40 -86 -100 -100 -325 -350 -350 Free cash flow (calculated) 623 633 806 327 112 99 222 760 811 860 BALANCE SHEET ITEMS Cash, short-term loans and deposits 1,652 1,670 1,682 1,936 1,925 1,998 2,100 2,100 2,025 2,093 Net Balance Sheet Debt 5,149 4,158 2,922 2,527 2,417 2,228 2,010 2,010 1,612 1,090 Capitalised operating lease obligations (x8) 2,960 2,704 1,880 2,269 2,303 2,334 2,440 2,440 2,520 2,560 Net lease-adjusted debt 8,109 6,862 4,802 4,796 4,720 4,562 4,450 4,450 4,132 3,650 Employee benefit obligations 1,175 1,183 1,816 1,813 CREDIT RATIOS Net balance sheet debt/EBITDA (pre except’s) 4.9x 3.8x 2.3x 1.9x 1.8x 1.7x 1.5x 1.5x 1.1x 0.7x EBITDA (before except’s)/Net interest expense 4.3x 5.0x 7.1x 9.2x 12.0x 16.1x Net lease-adjusted debt/EBITDAR (before except’s) 5.7x 4.8x 3.1x 2.9x 2.9x 2.8x 2.8x 2.8x 2.3x 1.9x EBITDAR (pre except’s)/(Net interest exp + rental) 2.3x 2.6x 3.7x 3.6x 3.7x 3.7x 3.6x 3.6x 4.2x 4.5x
Source – BNP Paribas Estimates, British Airways Leverage and Coverage are based on the last 12 months’ results. Some of the ratios are adjusted for the effects of acquisitions and disposals. In addition, these 2 measures are usually calculated based on EBITDA adjusted for exceptional or non-recurring items. Leverage is defined as net lease-adjusted debt (x8 operating leases)-to-EBITDAR. Coverage is defined as EBITDAR-to-(net interest+rental expenses).

Cable & Wireless ⎪ January 2006
66 European High Yield Research
Cable & Wireless Bond Description & Market Data, as of 05 January 2006
Next Call Issuer Credit Trend: Stable
Description Amount (o/s) Ratings Date Price Price YTW STW
8.75 % Sr UnSub Nts due 2012 GBP 200mn Ba3/B+ NC NC 107 7.35% 271 bp 8.625 % Guar Nts due 2019 GBP 200mn Ba3/B+ NC NC 105 4/7 7.92% 337 bp Source � BNP Paribas
Company Profile Cable & Wireless communications provides telecommunications services and includes corporate, business, internet protocol and wholesale operations. For the six months ended 30 September 2005, the company (excluding Energis) had sales of £1,481mn and an EBITDA of £201mn before exceptionals. The company's operations are split between Global and Regional business segments, and serve clients in the UK, Europe, Caribbean and Asia. The operations include a large business customer base ranging from small to medium enterprises through to large corporate users. The issuer provides data services to more than 117,000 SMEs as well to mobile and global telecom operators.
Investment Recommendation We dropped our rating on the company's bonds to SELL (from HOLD) after the September quarter results. Though C&W continues to stand in strong cash and financial position, we do not doubt that this primary appealing feature of the C&W credit is likely to deteriorate further in coming quarters. As a consequence, the prospect of C&W returning to investment grade standing seems unlikely in the near future. The company�s third quarter results were more or less in line with expectations however the increasing in CAPEX and the dividend, plus the resumed stock buyback plan (£75mn of the £250mn targeted amount had been completed at September 30) all appear to support our above mentioned view.
Debt Profile As of September 30, 2005, the company had £772mn of outstanding debt, £234mn in pension fund obligations and £170mn in current tax liabilities versus roughly £1.3bn in cash (pro forma for the Energis acquisition). Of the Company�s cash balance roughly £142mn is held by the company�s subsidiaries with remainder held by Cable & Wireless plc.
The Group�s debt comprises bank debt and 3 long-dated publicly quoted bonds. Two sterling denominated bonds of £200mn, with 8.75% and 8.625% coupons, maturing in 2012 and 2019, respectively. The company also has £258mn in 4% Senior Unsecured convertible bonds due 2010, with an initial conversion price of 145 pence per share and par redemption value. The 8.625% and 8.75% bonds are non-callable for life, whereas the 4% convertible bonds are callable after July 2007, if company's share price is 130% of the conversion price. The company's bonds were issued with limited covenant protection, as High Grade rated issues by Cable & Wireless Plc.
The remainder of the group's debt of £115mn outstanding at September 2005, represents primarily amortising term loans. As of 30 September 2005, we estimate the company had roughly £1.2bn in cash pro forma for the Energis acquisition.
Aizaz Shaikh +44 20 7595 8607 [email protected]

Cable & Wireless ⎪ January 2006
67 European High Yield Research
Bond Covenants GBP 200mn 8.625% Guaranteed Bonds 2019
GBP 200mn 8.75% Bonds 2012
Bond description 8.625% Sterling notes 8.75% Sterling notes
Issuing entity Cable and Wireless Plc Ranking Guaranteed bonds Bonds
Position vs. bank debt NA
Position vs. other bonds Pari passu with all other bonds (including convertibles)
Security/Guarantees 2nd priority security interest in the inter-company loan - the banks have 1st priority
Optional Redemption No
Tax redemption No
Negative pledge Yes
Cross default Yes
Fall away covenants No
Anti-layering No
Change of control No
Asset sales No
Debt Limit No
Restricted Payments No
Transactions with Affiliates No
Source � BNP Paribas, C&W

Cable & Wireless ⎪ January 2006
68 European High Yield Research
Bond Covenant Bond description GBP 257mn 4.000% Convertible Bonds 2010
Issuing entity Cable and Wireless Plc
Ranking Guaranteed bonds
Position vs. bank debt NA
Position vs. other bonds Pari passu with all other bonds (including convertibles)
Security/Guarantees 2nd priority security interest in the inter-company loan - the banks have 1st priority
Optional Redemption
The bond can be redeemed at the issuer's option after 16 July 2007 at par + accrued interest, provided that no such redemption may be made unless the middle market price of the ordinary shares is greater than 130% than optional Conversion price (into shares) or 85% of the bonds have been converted under such Conversion. Conversion Price: On or before 16th July 2004 - £1.09 Thereafter, but on or before 16th July 2005 - £1.16 Thereafter, but on or before 16th July 2006 - £1.23 Thereafter, but on or before 16th July 2007 - £1.31 Thereafter - £1.38
Tax redemption No
Negative pledge Yes
Cross default Yes
Fall away covenants No
Anti-layering No
Change of control No
Asset sales No
Debt Limit No
Restricted Payments No
Transactions with Affiliates No
Source � BNP Paribas, C&W

Cable & Wireless ⎪ January 2006
69 European High Yield Research
Cable & Wireless, Financial Model FYE 31 March Restated Historic Historic Historic Historic Historic Historic Historic Historic Historic PF* GBP mn FY 02 H1 03 H2 03 FY 03 H1 04 H2 04 FY 04 H1 05 H2 05 FY 05 FY 05 Mar-02 Sep-02 Mar-03 Mar-03 Sep-03 Mar-04 Mar-04 Sep-04 Mar-05 Mar-05 Mar-05 Sales Global 3,271 1,536 1,331 2,867 1,310 910 2,220 1,046 808 1,854 sequential change -17.5% -0.2% -13.3% -12.4% -1.6% -30.5% -22.6% -20.2% -11.2% -16.5% Regional 1,459 722 688 1,410 645 542 1,187 576 792 1,368 sequential change 1.8% -1.6% -4.7% -3.4% -6.3% -16.0% -15.8% 15.2% Eliminations -34 -13 -17 -30 -16 -7 -23 -4 -18 -22 Discontinued / Other 1,052 113 31 144 0 0 0 199 199 Total Sales 5,748 2,358 2,033 4,391 1,939 1,445 3,384 1,618 1,604 3,222 3,942 sequential change -29.0% -3.2% -13.8% -23.6% -4.6% -25.5% -22.9% 12.0% -0.9% -4.8% year-on-year -29.0% -28.8% -16.5% -23.6% -17.8% -28.9% -22.9% -16.6% 11.0% -4.8% Operating costs b/f D&A and excep. items 5,013 2,186 1,871 4,057 1,734 1,174 2,908 1,362 1,368 2,730 % of sales 87.2% 92.7% 92.0% 92.4% 89.4% 81.2% 85.9% 84.2% 85.3% 84.7% Exceptional restructuring (est. cash) 210 321 121 442 148 74 222 -12 157 145 Total Operating costs b/f D&A 5,223 2,507 1,992 4,499 1,882 1,248 3,130 1,350 1,525 2,875 Operating Profit Global 199 -57 -63 -120 -20 601 581 -977 956 -21 Global margin 6.1% -3.7% -4.7% -4.2% -1.5% 66.0% 26.2% -93.4% 118.3% -1.1% Regional 627 289 296 585 247 169 416 -285 468 199 Regional margin 43.0% 40.0% 43.0% 41.5% 38.3% 31.2% 35.0% -49.5% 59.1% 38.0% Corporate charges -50 -21 -3 -24 -10 -18 -28 -94 Discontinued / Other -41 -39 -68 -107 -12 67 55 35 EBITDA b/f exceptionals 735 172 162 334 205 271 476 256 236 492 608 EBITDA b/f exceptionals margin 12.8% 7.3% 8.0% 7.6% 10.6% 18.8% 14.1% 15.8% 14.7% 15.3% change yoy -59% -66% -29% -442 19% 67% 43% 25% -13% 3% EBITDA 525 -149 41 -108 57 197 254 268 79 347 453 Working Capital & Other -431 252 -49 203 -64 -117 -181 -89 88 -1 Operating Cash Flow 94 103 -8 95 -7 80 73 179 167 346 Cash Interest Income 383 124 73 197 53 50 103 47 42 89 Cash Interest Expense -238 -45 -43 -88 -40 -49 -89 -29 -39 -68 Servicing of finance 14 -16 -28 -44 -52 6 -46 14 -20 -6 Taxation -139 -30 -408 -438 -21 -22 -43 -18 -42 -60 Capex -1,893 -450 -360 -810 -172 -170 -342 -124 -220 -344 -425 Financial Investments 219 572 23 595 248 53 301 22 54 76 Acquisitions & disposals 1,845 22 88 110 -2 -116 -118 -64 29 -35 Dividends -669 -81 -38 -119 0 0 0 -71 -26 -97 Financing -567 -608 30 -578 -265 -317 -582 -64 -89 -153 Change in cash 1,635 -1,677 -443 -2,120 743 -554 189 -108 -93 -201 Cash & cash equivalents 4,268 3,834 3,152 3,152 2,879 2,354 2,354 2,245 2,152 2,152 1,558 Bank Debt 1,134 496 418 418 600 494 494 201 166 424 461 0% $704m Conv Nts 9 Jun 2003 437 449 445 445 6.500% $400m Sr Nts 16 Dec 2003 248 255 253 253 241 4.000% £258m Conv Nts 2010 258 258 258 258 258 258 8.625% £200m Guar Nts 2019 200 200 200 200 200 200 200 200 200 200 200 8.750% £200m Nts 2012 200 200 200 200 200 200 200 200 200 200 200 6.000% $45m Conv Nts Jun 2005 28 29 28 28 27 24 24 Total Debt 2,248 1,629 1,544 1,544 1,268 918 918 859 824 824 861 Net Debt (Cash) -2,020 -2,205 -1,608 -1,608 -1,611 -1,436 -1,436 -1,386 -1,328 -1,328 -697 Ratios Total Debt / EBITDA bf excp (Ann'd) 3.1x 4.6x 1.9x 1.7x 1.4x Net Debt / EBITDA bf excp NMF NMF NMF NMF NMF EBITDA / Cash Interest Expense 2.2x NMF NMF 5.1x Total Debt / EBITDA NMF NMF NMF 2.4x 1.9x Net Debt / EBITDA NMF NMF NMF NMF NMF
Source � BNP Paribas Estimates, Cable & Wireless * PF (Pro Forma) for the Energis Acquisition

Cablecom ⎪ January 2006
70 European High Yield Research
Cablecom Bond Description & Market Data, as of 05 January 2006
Next Call Issuer Credit Trend: Positive
Description Amount (o/s) Ratings Date Price Price YTW STW
9.375 % Sr Nts due 2014 EUR 290mn Caa1/CCC+ 15-Apr-07 109.375 114 1/4 4.89% 210 bp Source � BNP Paribas
Company Profile Cablecom is the largest cable communications provider in Switzerland. The company provides television, Internet access and telephony to consumer and business customers nationally and has a major presence in 14 of the 16 largest Swiss cities. The company serves approximately 2.0 million analog cable television subscribers, representing approximately 73% of the Swiss cable television market. Analog cable television services represent the most significant contributor to the company revenues. The company had revenues and EBITDA for the twelve-month period ended 30 September 2005 of CHF819mn and CHF 340mn, respectively. At the end of year, net senior leverage (LQA) was 4.7x.
Investment Recommendation We have a REDUCE rating on Cablecom�s 9.375% bond. Our ratings are predominantly based on the relative risk/return profile of various pieces of the Cablecom capital structure in light of the increased financial stress on the financial structure after the acquisition by UPC and concurrent issuance of the PIK and in addition, the likely collapse of the Cablecom capital structure into UPC within the next 18 months.
Debt Profile
Cablecom's debt comprises a �290mn fixed-rate high yield bond issued in 2004, senior secured floating rate notes which replaced the company's CHF1,275mn senior bank facilities in early 2004 and a �550mn Euribor + 825bp PIK issued to fund the acquisition by UPC. The fixed rate notes have standard high yield covenants and are callable beginning in 2007 (NC3), the floating notes became callable starting in October 2005. The bonds were issued by Cablecom Luxembourg SCA, the intermediate holding company owning Cablecom GmbH, the operating company. The fixed rate bonds benefit from a second-ranking security in the intercompany loan between Cablecom GmbH and the issuer and a senior guarantee from Ccom Holding Ltd, a deeply subordinated holding company. The PIK notes were issued from United ACM Holdings Inc, a deeply subordinated holding company. The PIKs are mandatorily redeemable upon early redemption the company�s fixed or floating senior notes; the PIKs are callable at par beginning in 2007.
The company has a CHF150mn revolving Credit Facility, which remains undrawn as of today; the revolver sits at Cablecom GmbH and is therefore structurally senior to all of the company's notes.
BNP Paribas had managed a public offering of securities for Cablecom Holding AG/Cablecom Luxembourg S.C.A (SPV)/HoldCo. (Newly Created) within the past twelve months.
Aizaz Shaikh +44 20 7595 8607 [email protected]

Cablecom ⎪ January 2006
71 European High Yield Research
UPC Bond Description & Market Data, as of 05 January 2006
Next Call Issuer Credit Trend: Stable
Description Amount (o/s) Ratings Date Price Price YTW STW
7.75% Senior Notes due 2014 EUR 500mn B3/CCC+ 15-Jul-2008 107.75 98 8.98% 592 bp 8.625% Senior Notes due 2014 EUR 300mn B3/CCC+ 15-Jul-2008 108.625 94 8.81% 569 bp Source � BNP Paribas
Company Profile
UPC is one of the largest broadband communications providers in terms of aggregate numbers of subscribers and homes passed in Western Europe and Central and Eastern Europe. The company operates the largest cable network in each of The Netherlands, France, Austria, Poland, Hungary, the Czech Republic, the Slovak Republic and Slovenia and the second largest cable network in Norway, in each case in terms of numbers of subscribers. UPC offers a variety of broadband distribution services over its cable networks, including analog video, digital video, telephony services and its chello-branded high-speed Internet access service.
Investment Recommendation We have a HOLD rating on each of UPC�s bonds. While the underlying credit trend is STABLE, headline risk is likely to be negative in the near term as the company is the primary consolidating vehicle for John Malone�s interest in European cable. As a consequence we would not anticipate credit enhancement in the near term. Additionally, the potential overhang of new debt, associated with the recapitalization of Cablecom in 2007, is likely to prevent much bond price appreciation until the overall financial strategy is clarified.
Debt Profile UPC�s outstanding debt comprises bonds and bank facility. The company issued �500mn 7.75% Senior Notes and �300mn 8.625% Senior Notes due both in 2014. These notes have standard high yield covenants, are callable in 2008 (NC3). Both Notes were issued at UPC Holding B.V. level and are therefore structurally subordinated to the Credit Facility. Both Notes benefit from a pledge over all of the shares of the issuer held by Liberty Global Europe Financing B.V.
The senior credit agreements consist of the following facilities: the company entered into a �500mn senior secured credit agreement in October 2000 maturing in 2008 which as of June 2005 has been fully repaid. In January 2004, the company entered into another credit multi-currency facility for an amount of �4.334mn equivalent. The Senior Credit Agreements structure consists of the following facilities: Tranche F1 of �140mn and F2 of $525mn maturing 2011, a Tranche G �1,000mn maturing 2010, a Tranche H1 �550mn and H2 $1,250mn maturing in 2012, and finally a Tranche I of �500mn maturing in 2010. As of September 2005, the company had �2,920mn equivalent outstanding.
The indebtedness under the senior credit facilities is primarily secured by way of a pledge over the shares in the holding company. In addition a pledge over certain receivables has also been granted.

Cablecom ⎪ January 2006
72 European High Yield Research
Cablecom/UPC Structure
CablecomLuxembourg S.C.A.
CCom Holdings(Luxembourg)
S.à.r.l.
CablecomGmbH
Revolving CreditFacility
SeniorIntercompany
Loan
SubordinatedIntercompany
Loan Not e100%
CablecomLuxembourgGP S.à.r.l. 0.03%
100%
99.97%
Cablecom HoldingsAG
United ACMHoldings, Inc.
UCG Europe, Inc.
�550m SeniorPIK Loan
100%
100%
100%
Liberty Global,Inc.
Liberty MediaInternational, Inc.
UnitedGlobalCom,Inc.
46.6%
100%
53.4%
IntermediateHoldCos
100%
100%
VTRGlobalCom SA
United Pan-EuropeCommunications N.V.
Liberty Global EuropeFinancing B.V.(1)
UPC Holding B.V.(1)
(the issuer)
100%
100%
UPC BroadbandHolding B.V.
99%
Other subsidiaries
100%
Issuersubordinated
loans(2)
UPC Broadbandintercompany
loans(3)
chellomediaB.V.
PriorityTelecom N.V.
OtherSubsidiaries
UPC FinancingPartnership
�300 million8.625%
Senior Notes
�500 million7.75%
Senior Notes(1)
100%
1%
SeniorCredit Facilities(4)
New SecuredBank Facility
�290m 9.375%Senior Notes
Source � Cablecom
1. The notes are secured on a shared basis, together with the �500mn 73Ú4% senior notes and any future indebtedness ranking pari passu with the notes on a secured basis, by a pledge over all of the shares of the issuer held by Liberty Global Europe Financing B.V. 2. The shareholder loans between Liberty Global Europe Financing B.V. and the issuer are expressly subordinated to the notes. 3. Represents existing intercompany loans which are currently pledged to the lenders under our senior credit facilities. 4. UPC Financing Partnership and UPC Broadband Holding B.V. and certain of its subsidiaries are borrowers under our senior credit facilities. The issuer has guaranteed the obligations of its subsidiaries under our senior credit facilities.

Cablecom ⎪ January 2006
73 European High Yield Research
This page has been left blank intentionally

Cablecom ⎪ January 2006
74 European High Yield Research
Bond Covenant EUR 900mn 9.375% Senior Notes 2014
Bond description EUR Notes
Issuing entity Cablecom Luxembourg SCA, a holding company
Ranking Senior Notes
Position vs. bank debt Structurally subordinated
Position vs. other bonds Contractually subordinated to the senior secured notes
Security/Guarantees 2nd priority security interest in the inter-company loan - the senior secured notes have 1st priority
Optional redemption
! Equity Claw � prior to 15 March 2007 max 40% of issue at par + coupon
! Call Schedule:
15 April 2007 � 109.375% 15 April 2008 � 107.031% 15 April 2009 � 104.688% 15 April 2010 � 103.125% 15 April 2011 � 101.563% 15 April 2012 � 100.000%
Change control Put at 101, 50%+ of voting power
Tax redemption Yes � at par
Negative pledge Yes
Cross default Yes
Fall away covenants Yes
Anti-layering Yes (Debt and Liens)
Asset sales 75% cash or cash equivalents. No needs to offer to purchase notes unless, after 1 year, excess proceeds invested or used to pay senior debt exceeds CHF 25mn
Debt limit
The company may not incur debt if pro forma leverage exceeds 6.0x. Carve outs: ! Capital lease of CHF 75mn;
! The greater of a CHF 100mn basket or 3.4% of total assets (CHF 92mn, as of 31 December 2004).
Restricted payments carve outs include a) CHF 5mn stock b) post IPO dividends at 6% of IPO proceeds per year and c) general basket of CHF 40mn.
Transactions withaffiliates Not less favourable than arms length transaction; if in excess of CHF 15mn (majority of board of directors); if in excess of CHF 40mn written opinion of an independent entity.
Source � BNP Paribas, Cablecom

Cablecom ⎪ January 2006
75 European High Yield Research
Bond Covenant Bond description EUR 300mn 8.625% Senior Notes due 2014
Issuing entity UPC Holding B.V.
Ranking Senior Notes
Position vs. bank debt Structurally subordinated
Position vs. other bonds Pari passu
Security/Guarantees
The notes benefit from a pledge over all of the shares of the issuer held by Liberty Global Europe Financing B.V. The �500mn 7.75% senior notes of the issuer currently benefit from a first ranking pledge over all the shares of the issuer. The share pledge granted to the holders of the notes offered hereby is a second-ranking pledge because it is granted at a later point in time than the first pledge. However, the terms of the inter-creditor agreement provide that the benefit of the two share pledges is shared equally by the 8.625% and the 7.75% senior notes. The documents relating to the share pledge and the indenture governing the notes also provide that certain future creditors of the issuer can effectively receive the benefit, on a pari passu or junior basis to the holders of the notes, of the security granted to the note holders under the share pledge.
Optional Redemption
! Make Whole � prior to 15 July 2008 at bunds + 50bp ! Equity Claw � prior to 15 July 2008 max 35% of issue at par + coupon ! Call Schedule:
15 July 2008 � 108.625% 15 July 2009 � 104.313% 15 July 2010 � 102.156% 15 July 2011 � 100.000%
Tax redemption Yes at par + accrued and unpaid interest
Negative pledge Yes
Cross default Yes - on �50mn or more of other debt.
Fall away covenants Yes
Anti-layering Yes
Change of control Put at 101%, 50% of voting share capital
Asset sales
If the asset is at least equal to the fair market value, as determined in good faith by the board of directors, of the shares and assets. If 75% of the consideration received by the issuer is in the form of cash or cash equivalents. If the issuer applies 100% of the net available cash from the asset disposal to: ! redeem senior Indebtedness ! acquire additional assets
Debt limit
Debt is permitted if after giving pro forma effect thereto, the consolidated leverage ratio is less than 5.60 to 1.00 if the Incurrence is prior to December 31st 2005, or 5.00 to 1.00 after. Carve outs: ! Credit facility canot exceed �1,150mn. ! CLOs or PMOs cannot exceed if none of the acquisition are consummated �50mn. ! General basket �50mn.
Restricted payments
If company can raise �1.00 of debt then 50% net income less 100% net loss. Carve outs: ! Payments of dividends following the covenant �Debt Limit�. ! Repurchase of stock from employees up to �3.0mn in any calendar year. ! Repurchase of shareholders loan to the extent that after giving pro forma effect to any
such purchase the consolidated leverage ratio do not exceed 5.00 to 1.00. ! General basket up to �25mn.
Transactions with affiliates
All transactions with affiliates should be made in good faith and on an arm�s-length basis, and for transaction involving an aggregate value of �10m or greater the transaction has to be approved by the board of directors; for transactions involving an aggregate value of �50m a written opinion of an independent investment banking is required (transaction has to be fair on a financial stand point).
Limitation on liens The Issuer will not, and will not permit any Restricted Subsidiary to, directly or indirectly, create, Incur or suffer to exist any Lien upon any of its property or assets.
Source � BNP Paribas, Cablecom

Cablecom ⎪ January 2006
76 European High Yield Research
Bond Covenant Bond description EUR 500mn 7.75% Senior Notes due 2014
Issuing entity UPC Holding B.V.
Ranking Senior Notes
Position vs. bank debt Structurally subordinated
Position vs. other bonds Pari passu
Security/Guarantees
The notes benefit from a first-ranking pledge over all of the shares of the issuer held by Liberty Global Europe Financing B.V. The documents relating to the share pledge and the indenture governing the notes provide that certain future creditors of the issuer can effectively receive the benefit, on a pari passu or junior basis to the holders of the notes, of the security granted to the note holders under the share pledge.
Optional redemption
! Make Whole � prior to 15 July 2008 at bunds + 50bp ! Equity Claw � prior to 15 July 2008 max 35% of issue at par + coupon ! Call Schedule:
15 July 2008 � 107.750% 15 July 2009 � 103.875% 15 July 2010 � 101.938% 15 July 2011 � 100.000%
Tax redemption Yes at par + accrued and unpaid interest
Negative pledge Yes
Cross default Yes - on �50mn or more of other debt.
Fall away covenants Yes
Anti-layering Yes
Change of control Put at 101%, 50% of voting share capital
Asset sales
If the asset is at least equal to the fair market value, as determined in good faith by the board of directors, of the shares and assets. If 75% of the consideration received by the issuer is in the form of cash or cash equivalents. If the issuer applies 100% of the net available cash from the asset disposal to: ! redeem senior Indebtedness ! acquire additional assets
Debt limit
At a subsidiary level, debt is permitted if after giving pro forma effect thereto, the consolidated leverage ratio is less than 4.60 to 1.00 if the Incurrence is prior to 31 December 2005, or 4.00 to 1.00 after. Debt is permitted if after giving pro forma effect thereto, the consolidated leverage ratio is less than 5.60 to 1.00 if the Incurrence is prior to 31 December 2005, or 5.00 to 1.00 after. Carve outs: ! Credit facility cannot exceed �1,150mn. ! CLOs or PMOs cannot exceed if none of the acquisition are consummated �50mn. ! General basket �50mn.
Restricted payments
If company can raise �1.00 of debt then 50% net income less 100% net loss. Carve outs: ! Payments of dividends following the covenant �Debt Limit�. ! Repurchase of stock from employees up to �3.0mn in any calendar year. ! Repurchase of shareholders loan to the extent that after giving pro forma effect to any
such purchase the consolidated leverage ratio do not exceed 5.00 to 1.00. ! General basket up to �25mn.
Transactions with affiliates
All transactions with affiliates should be made in good faith and on an arm�s-length basis, and for transaction involving an aggregate value of �10mn or greater the transaction has to be approved by the board of directors; for transactions involving an aggregate value of �30m a written opinion of an independent investment banking is required (transaction has to be fair on a financial stand point).
Limitation on liens The Issuer will not, and will not permit any Restricted Subsidiary to, directly or indirectly, create, Incur or suffer to exist any Lien upon any of its property or assets.
Source � BNP Paribas, Cablecom

Cablecom ⎪ January 2006
77 European High Yield Research
Bond Covenant Bond description EUR 550mn EB + 825 bps PIK Loan 2014
Issuing entity United ACM Holdings Inc., a holding company
Ranking PIK Loan
Position vs. bank debt Structurally subordinated
Position vs. other bonds Structurally subordinated
Security/Guarantees Not applicable
Optional redemption
The Loan can not be prepaid prior to April 15, 2007: ! Optional prepayments during the 12-month period beginning on 15 April 2007 will
be made at par. ! Optional prepayments from and following April 15, 2008 will be made at 102% of
par.
Change control Put at 101, 50%+ of voting power
Tax redemption Yes � at par
Negative pledge Yes
Cross default Yes � on CHF 30mn or more of other debt
Fall away covenants Yes
Anti-layering Yes
Asset sales 75% cash or cash equivalents. No needs to offer to purchase notes unless, after 1 year, excess proceeds invested or used to pay senior debt exceeds CHF 25mn
Debt limit
The company may not incur debt if pro forma leverage exceeds 7.25x. Carve outs: ! Credit facility can not exceed �1,485mn. ! Capital lease of CHF 75mn;
! The greater of a CHF 90mn basket or 3.4% of total assets (CHF 92mn, as of 31 December 2004).
Restricted payments carve outs include a) CHF 5mn stock; b) payment of advances, dividends or distributions to any parent company in the limit of CHF 200k; and c) general basket of CHF 40mn.
Transactions with Affiliates Not less favourable than arms length transaction; if in excess of CHF15mn (majority of board of directors) ; if in excess of CHF 50mn written opinion of an independent entity.
Source � BNP Paribas, Cablecom

Cablecom ⎪ January 2006
78 European High Yield Research
Cablecom, Financial Model FYE 31 December Historic ProForma Historic Historic Historic Historic Historic Historic Historic Historic Historic Proj�d Proj�dCHF mn FY 02 FY 03 FY 03 Q1 04 Q2 04 Q3 04 Q4 04 FY 04 Q1 05 Q2 05 Q3 05 FY 05 FY 06PROFIT & LOSS Revenue 603 653 653 168 177 185 193 725 198 210 217 804 885 COGS -116 -117 -117 -32 -37 -44 -49 -163 -49 -52 -53 -165 -177 Gross profit 487 536 537 136 140 141 144 561 149 158 164 639 708 SG&A -145 -167 -167 -45 -42 -43 -46 -176 -47 -51 -54 -209 -234 Other Operational expenses -98 -89 -89 -18 -18 -16 -16 -68 -19 -21 -21 -85 -97 EBITDA 244 280 281 73 80 82 82 317 83 86 89 345 376 P&L Interest -176 -121 -121 -29 -38 -19 -22 -107 -22 -29 -22 Revenue growth y/y 8.3% 8.3% 8.5% 13.4% 13.3% 9.3% 10.9% 17.6% 18.5% 17.1% 11.0% 10.0% Gross margin 80.7% 82.0% 82.2% 80.8% 78.9% 76.2% 74.5% 77.5% 75.3% 75.1% 75.4% 79.5% 80.0% SG&A / sales 24.1% 25.6% 25.6% 26.6% 23.9% 23.1% 23.8% 24.3% 24.0% 24.4% 24.8% 26.0% 26.5% EBITDA margin 40.4% 42.9% 43.0% 43.4% 45.1% 44.3% 42.4% 43.8% 41.8% 40.8% 41.0% 42.9% 42.5% CASH FLOW Cash interest -188 -139 -139 -28 -48 -10 -31 -117 -13 -28 -15 -95 -121 Change in working capital 60 79 79 128 -83 -66 70 49 53 -56 -60 0 0 Cash from Operating Activities 75 168 169 169 -111 1 118 178 122 -35 9 250 255 Capex -207 -176 -176 -31 -43 -52 -73 -198 -48 -64 -59 -240 -250 Other investing activities -7 0 0 0 0 0 4 4 43 -5 -2 Cash from Investing Activities -215 -176 -176 -31 -43 -52 -69 -194 -5 -69 -60 -240 -250 Increase / Decrease in Sr Debt 0 37 37 -210 146 0 0 -64 -22 106 0 Increase / Decrease in other LT Debt 174 -3 -3 2 0 0 -2 0 0 0 0 Cash from Financing Activities 174 34 34 -208 146 -1 -2 -65 -22 106 -1 0 0 Net Change in Cash 33 26 27 -69 -7 -51 47 -80 95 2 -53 10 5 BALANCE SHEET Cash & Equivalents 119 145 144.0 75 68 17 63 63 159 161 108 73 78 Bank Debt 3,753 1,200 1,722 1,058 1,200 1,200 1,200 1,200 1,200 0 0 1,330 1,330 Revolver � CHF 150m 0 0 250 0 0 0 0 0 0 0 0 New Bank Facility CHF 1.330mn 1,330 1,330 Bank Loans � CHF 1,200m 3,753 1,200 1,472 1,058 1,200 1,200 1,200 1,200 1,200 0 0 Tranche A 0 575 0 0 0 0 0 0 0 0 0 Tranche B 0 325 0 0 0 0 0 0 0 0 0 Tranche C 0 300 0 0 0 0 0 0 0 0 0 Bonds- HY 0 452 0 453 441 450 448 452 434 1,689 1,689 449 449 �290m 9.375% Sr Nts 2014 0 452 0 453 441 450 448 452 434 449 449 449 449 �200m EB+250 Sr Sec Float Nts 2010 0 0 0 0 0 0 0 0 0 310 310 �375m EB+275 Sr Sec Float Nts 2012 0 0 0 0 0 0 0 0 0 581 581 CHF390 LIB+263 Sr Sec Float Nts 2010 0 0 0 0 0 0 0 0 0 350 350 Mortgages & Other 47 42 42 42 59 41 49 45 52 77 83 70 50 Subordinated SH Loan 0 20 0 0 0 0 0 0 0 0 0 PIK Notes EB + 8.25% 852 852 1,005 Total Debt 3,800 1,714 1,765 1,553 1,699 1,690 1,697 1,697 1,686 1,766 2,624 2,701 2,834 Net Debt 3,681 1,569 1,621 1,478 1,632 1,673 1,634 1,634 1,527 1,605 2,516 2,627 2,756 RATIOS Coverage EBITDA- Capex/Interest 1.5x 0.8x 2.9x 0.3x 1.0x 2.8x 0.8x 2.1x 1.1x 1.0x Leverage Bank Leverage (gross) 3.7x 4.0x 3.9x 3.8x 3.8x 3.8x - - 3.9x 3.5x Senior Notes Leverage (gross) 5.2x 3.2x 2.3x 2.3x 5.2x 5.1x 5.1x 5.0x 5.2x 4.7x Total leverage (gross) 5.4x 5.6x 5.4x 5.4x 5.4x 5.3x 5.3x 7.7x 7.8x 7.5x Total leverage (net) 5.1x 5.4x 5.4x 5.2x 5.2x 4.8x 4.9x 7.4x 7.6x 7.4x Source � BNP Paribas Estimates, Cablecom

Cablecom ⎪ January 2006
79 European High Yield Research
UPC, Financial Model FYE 31 December Historic Historic Historic Historic Historic ProForma Proj�d Proj�d Proj�d EUR mn FY 03 FY 04 Q1 05 Q2 05 Q3 05 Q3 05 FY 05 FY 06 FY 07 PROFIT & LOSS Revenue 1,380 1,658 491 499 509 1,932 2,125 2,337 COGS -876 -655 -189 -194 -204 -728 -816 -888 Gross profit 505 1,003 302 305 305 1,203 1,309 1,449 SG&A -323 -388 -107 -116 -110 -444 -510 -563 EBITDA 181 616 195 189 195 195 759 799 886 P&L Interest -827 -884 -179 -187 -198 -198 -733 Revenue growth y/y 20.1% 16.5% 10.0% 10.0% Gross margin 36.6% 60.5% 61.5% 61.1% 59.9% 62.3% 61.6% 62.0% SG&A / sales 23.4% 23.4% 21.7% 23.2% 21.6% 23.0% 24.0% 24.1% EBITDA margin 13.1% 37.1% 39.8% 37.9% 38.3% 39.3% 37.6% 37.9% CASH FLOW Change in working capital 20 5 31 -22 -11 60 50 50 Cash Interest -252 -192 -42 -55 -55 -261 -235 -201 Cash from Operating Activities 306 460 182 107 129 613 849 936 Capex -237 -312 -106 -124 -127 -106 -350 -300 -250 Acquisitions/Disposals 0 -525 -70 -97 0 -500 Cash from Investing Activities -300 -894 -177 -217 -124 -850 -300 -250 Net proceeds (repayments) loan from shareholder 123 662 -44 2,672 391 Net proceeds (repayments) lUPC Broadband Bank Facility -150 -23 135 -2,564 0 Net proceeds (repayments) other debt -15 -167 -14 14 0 Cash from Financing Activities -42 435 45 120 381 -5 -406 -530 FX effect 0 4 3 -3 0 5.0 5.0 5.0 Net Change in Cash -36 5 54 7 386 -263 148 161 BALANCE SHEET Cash & Equivalents 125 130 184 191 577 673 436 584 745 Bank Debt 2,748 2,879 3,047 2,880 3,165 3,047 3,045 2,642 2,115 7.75% �500mn Sr Nts due 2014 0 0 0 0 500 500 500 500 500 8.625% �300mn Sr Nts due 2014 300 300 300 300 Other debt 86 68 73 55 85 5 4 5 5 Network leases 54 37 36 78 0 35 30 27 24 Total Debt 2,888 2,984 3,156 3,014 3,750 3,887 3,879 3,474 2,944 Net Debt 2,763 2,854 2,972 2,823 3,173 3,214 3.443 2,890 2.199 RATIOS Leverage Bank Leverage (gross) 4.7x 3.9x 3.8x 4.1x 3.9x 4.0x 3.3x 2.4x Total leverage (gross) 4.8x 4.0x 4.0x 4.8x 5.0x 5.1x 4.3x 3.3x Total leverage (net) 4.6x 3.8x 3.7x 4.1x 4.1x 4.5x 3.6x 2.5x
Source � BNP Paribas Estimates, UPC

Carmeuse ⎪ January 2006
80 European High Yield Research
Carmeuse Bond Description & Market Data, as of 5 January 2006
Next Call Issuer Credit Trend: Positive
Description Amount (o/s) Ratings Date Price Price YTW STW
10.75% Sr Sec Nts due 2012 EUR 175mn Ba3/B+ 15-Jul-07 105.375 115 3.94% 110bp
Source – BNP Paribas
Company Profile Carmeuse is one of two global producers of lime and lime-related products, with more then 140 years of experience in extraction and processing of limestone and dolomitic stone into lime and lime-related products, for industrial and commercial customers. The company, directly and through joint ventures, has production facilities and quarries in more than 100 locations globally. Carmeuse’s principal operations are in Western Europe (Belgium, Italy, Scandinavia, France and the Netherlands), Central and Eastern Europe (Slovakia, the Czech Republic, Hungary, Romania and Turkey) and North America (USA, Canada, and Mexico). The company has significant market share in most of these regions. Carmeuse had revenues of €541.5mn and an EBITDA of €112.1mn in the twelve months to 30 September 2005.
Investment Recommendation Recent operating results have shown consistent improvement in both revenues and EBITDA. Production cuts in the second half of 2005 in the steel industry will slow revenue growth, especially in North America, but growth in other segments will offset this to some extent. Margin pressure is likely to continue from increased energy costs. However, the company is still producing significant free cash flow. The acquisition of Lafarge’s 40% in Carmeuse North America has been completed and the related financing successfully repaid. Although the fixed rate bonds are not overly cheap we think the company’s stable cash flow generation will be used to reduce leverage and hence have a BUY recommendation. As the floating rate notes will be called shortly at around their current price, we have a HOLD recommendation.
Debt Profile 10.75% Senior Secured Notes 2012 The high yield bonds are senior secured obligations and are structurally and contractually pari passu with the floaters and with the company’s European bank facilities. The bonds and bank facilities are subordinated to certain bank debt at regional subsidiaries, limited to the assets available at such subsidiaries.
EB+4% Senior Secured Notes 2007 The high yield bonds are senior secured obligations and are structurally and contractually pari passu with the fixed rate and with the company’s European bank facilities. The floaters are callable anytime at 101. The bonds and bank facilities are subordinated to certain bank debt at regional subsidiaries. In November 2005, Carmeuse exercised their call option over 45% leaving €41.25mn outstanding. Carmeuse have stated their intention to call the remaining bonds by December 2005.
European Credit Facility In connection with the issuance of the high yield bonds, LVI and certain of its subsidiaries entered into a new European senior secured credit facility composed of a revolving facility with an aggregate principal amount of €40mn expiring in July 2007. The credit facility is secured by a floating charge over all tangible and intangible assets of Carmeuse SA, Carfin SA, and Carmeuse Co-ordination Centre SA securing up to €25mn, with a floating charge mandate over all the tangible and intangible assets of Carmeuse SA, Carfin SA, and Carmeuse Co-ordination Centre SA for an additional €15mn. The facility is guaranteed by LVI Holding NV, with the guarantee secured by a pledge over all the shares owned by LVI in Carmeuse SA, Carfin SA and the shares owend by Carfin SA and Carmeuse SA in Calcipar SA.
North American Credit Facility Currently, the North American operations and debt facilities are ring-fenced from the bondholders and do not form part of the restricted group.
€25mn LVI Holdings NV Bonds
In August 2005 LVI Holdings NV issued €25mn of bonds to a private investor. The interest rate has not been disclosed but the bonds rank pari passu with the senior secured notes.
Adam Harnetty, ACA +44 20 7595 8831 [email protected]

Carmeuse ⎪ January 2006
81 European High Yield Research
Carmeuse Structure
L.V.I. Holding N.V.(Netherlands)
Carmeuse S.A.(Belgium)
(Guarantor)
Carfin S.A.(Belgium)
(Guarantor)
Keramika(Slovakia)
Kalcit Spol. S.r.o.(Slovakia)
Dolomit(Slovakia)
Cedru & Melon S.A.(Slovakia)
Carmeuse MeszK.F.T. (Hungary)
Vapenka(Czech Republic)
SMA Sverska MineralAB (Sweden)
Dolomite ColomboS.p.a. (Italy)
Unicalce(Italy)
Nuovo Crovato Srl(Italy)
Carmeuse LimeProducts (GH) Ltd
(Ghana)
Vista N.V.(Belgium)
Tarento Beheer BV(Netherlands)
100%
100%
100%
100%
100%
100%
80%
100%
15%
50%
50%
50%
Calcipar S.A.(Luxembourg)
53%
100%
100%
100%
Barkisan Holding(Turkey)
20%
Öztüre Kimtas(Turkey)
Mineraria Sacilese S.p.a.(Italy)
Carmeuse NorthAmerica B.V.(Netherlands)
Sicab-CarmeuseFrance
(France)
80%
50%
50%
60%
100%
23.5%
CarmeuseCoordinationCentre S.A.(Belgium)
(Guarantor)17%
83% Carmeuse Lime B.V.(Netherlands)
(Issuer)
100%
Mineral Trade ServicesS.A.
(Switzerland)
Carmeuse Nederland B.V.(branch)
(Netherlands)
Calidra S.A. de C.V.(Mexico)
100%
branch
32%
Calce Mori Srl(Italy)
50%
50%
Source – Carmeuse

Carmeuse ⎪ January 2006
82 European High Yield Research
Bond Covenants Bond description Fixed Rate Notes Floating Rate Notes
Issuing entity Carmeuse Lime BV Ranking Senior Secured Notes
Position vs. bank debt Contractually Pari Passu
Position vs. other bonds Pari Passu
Security/guarantees Secured on pledge on all the shares of Carmeuse SA, Carfin SA & Calcipar SA Senior guarantees from holding companies LVI Holding NV, Carmeuse SA, Carfin SA & Carmeuse Coodination Center SA
Optional redemption
Make Whole – none
Equity Claw – expired
Call Schedule:
15 Jul 2007 – 105.375 15 Jul 2008 – 103.583 15 Jul 2009 – 101.791 15 Jul 2010 – 100.000
Make Whole – none
Equity Claw – none
Call Schedule:
Any time at 101
Tax redemption Yes – at par
Negative pledge Limitation on Liens
Cross default Yes
Fall away covenants No
Anti-layering No
Change of control Put at 101, 50%+ of voting power
Debt limit
Pro Forma Fixed Charge Coverage at least 2.5x Carve outs: €50mn of issuer/guarantor bank debt;
CLOs & Purchase Money Obligations up to €20mn;
Non-guarantor subsidiary debt up to €55mn or 15% of total consolidated debt;
Working capital facilities up to €10mn;
Debt associated with employee stock purchase plans up to €5mn;
General basket €20mn.
Restricted payments
If can incur €1 of additional debt then: €1mn per year of equity interests from/for employees;
50% of consolidated net income.
Transactions with affiliates Must be no less favourable than if done on an arm’s length basis with an officer’s certificate required for > €1mn transactions and a (Disinterested) Board resolution for €5mn+ transactions or an external certificate.
Asset sales Fair market value and 75% of proceeds in cash or equivalents. Within 360 days repay debt or reinvest into similar business. Any proceeds remaining (subject to €25mn minimum) must be used to tender for the bonds at par.
iSource – BNP Paribas, Carmeuse

Carmeuse ⎪ January 2006
83 European High Yield Research
Carmeuse, Financial Model FYE 31 December F’cast F’cast EUR mn 2002 2003 Q1 04 Q2 04 Q3 04 Q4 04 2004 Q1 05 Q2 05 Q3 05 2005 2006
PROFIT & LOSS Western Europe 187.3 214.9 47.6 56.4 52.6 67.4 224.0 Italy 129.0 142.7 36.9 42.0 37.4 40.7 157.0 Central & Eastern Europe 88.5 89.0 19.1 27.2 28.0 27.6 101.9 Other 12.5 6.8 1.6 1.9 1.7 1.8 7.0 Eliminations -1.8 -5.0 -0.4 -1.0 -0.8 -10.6 -12.8 Total Operating Income 415.5 448.4 104.8 126.5 118.9 126.9 477.1 116.2 146.7 151.7 546.6 547.9 Costs of raw materials & consumables 135.3 144.6 35.6 38.0 37.6 40.1 151.3 41.4 42.3 42.8 Costs of subcontracted work & other external charges
106.6 104.6 27.2 32.9 33.4 31.3 124.8 29.9 34.7 33.4
Wages & salaries & social security charges 67.5 67.3 16.8 16.8 17.4 18.4 69.4 17.4 18.6 17.9 Inc (dec) in amounts written off on stocks & trade debtors
1.5 0.7 -1.0 -0.3 -0.3 -1.3 -2.9 -0.3 -0.2 0.1
Inc (dec) in provisions for liabilities & charges 3.7 5.2 0.9 0.6 0.8 2.7 5.0 1.0 1.2 2.1 Other operating charges 19.4 28.6 3.3 3.5 3.1 9.4 19.3 2.5 3.7 4.2 EBITDA 81.5 97.4 22.0 35.0 26.9 26.3 110.2 24.3 46.4 51.2 D&A -33.5 -44.8 -10.1 -11.1 -11.3 -16.2 -48.7 -11.1 -12.9 -11.6 Operating Profit 48.0 52.6 11.9 23.9 15.6 10.1 61.5 13.2 33.5 39.6
Adjusted EBITDA 82.7 84.9 21.9 34.7 26.5 26.8 109.9 24.3 35.2 25.8 111.7 111.0
Interest & Other debt Charges 27.6 30.5 7.4 7.2 7.2 7.2 29.0 8.0 7.6 7.2
Operating Income % Change 7.9% 0.6% 4.2% 5.8% 14.9% 6.4% 10.9% 16.0% 27.6% 14.6
% 0.2%
Adjusted EBITDA Margin % 19.9% 18.9% 20.9% 27.4% 22.3% 21.1% 23.0% 20.9% 24.0% 17.0% 20.4%
20.3%
CASHFLOW
Operating Profit 48.0 52.6 11.9 23.9 15.6 10.1 61.5 13.2 33.5 39.7 D&A 32.9 44.8 10.1 11.1 11.3 16.2 48.7 11.1 12.9 11.6 Net interest & financial charges paid -35.0 -32.1 -11.9 -2.0 -11.7 -1.8 -27.4 -12.2 -4.9 -13.8 Other 6.3 -23.6 -2.0 -3.5 -1.7 -1.1 -8.3 -3.4 -15.8 -23.9 Change in working capital -6.1 0.7 -8.8 0.9 -11.5 25.0 5.6 -17.8 11.5 1.4 Operating cashflow 46.1 42.4 -0.7 30.4 2.0 48.4 80.1 -9.1 37.2 15.0 Net additions in tangible & intangible fixed assets -38.0 -32.9 -6.6 -10.1 -9.5 -14.7 -40.9 -5.6 -12.9 -10.5 Net investment in group companies -28.2 20.8 -1.5 0.0 -0.5 -104.2 -106.2 0.0 27.6 55.4 Net cash used in financing activities 58.5 -46.9 -0.5 -4.5 -1.9 93.8 86.9 -5.2 -65.2 -2.9 Other -25.2 9.4 0.0 -11.9 18.6 -17.1 -10.4 5.6 13.2 -17.6 Change in cash 13.2 -7.2 -9.3 3.9 8.7 6.2 9.5 -14.3 -0.1 39.4
BALANCE SHEET
Bank debt 121.7 95.0 94.1 90.8 89.3 141.5 141.5 138.2 75.0 80.9 HY Bonds 237.7 239.0 239.3 239.6 239.9 240.4 240.4 240.7 241.1 241.4 Other debt 7.5 5.9 6.3 6.7 5.5 38.2 38.2 42.5 44.3 28.5 Gross Debt 366.9 339.9 339.7 337.1 334.7 420.1 420.1 421.4 360.4 350.8
Cash & Marketable securities 72.4 60.1 50.7 54.2 63.0 68.9 68.9 54.6 51.8 91.1
Net Debt 294.5 279.8 289.0 282.9 271.7 351.2 351.2 366.8 308.6 259.7
LTM RATIOS
Coverage 3.0 2.8 3.0 3.4 3.5 3.8 3.8 3.8 3.8 3.7 EBITDA-Capex/Interest 1.6 1.7 1.8 2.2 2.3 2.4 2.4 2.4 2.3 2.3 Gross Leverage 4.4 4.0 3.8 3.4 3.3 3.8 3.8 3.8 3.2 3.1 Net Leverage 3.6 3.3 3.3 2.9 2.7 3.2 3.2 3.3 2.7 2.3
Source – BNP Paribas Estimates, Carmeuse

CellC ⎪ January 2006
84 European High Yield Research
CellC Bond Description & Market Data, as of 05 January 2006
Next Call Issuer Credit Trend: Positive
Description Amount (o/s) Ratings Date Price Price YTW STW
8.625% Senior Secured Notes due 2012 EUR 400mn NA/BB- 15-Jun-09 104.313 107 7.08% 398 bp 11% Senior Sub Notes due 2015 USD 270mn Caa1/B- 1-July-10 105.5 98.75 11.21% 632 bp
Source � BNP Paribas
Company Profile Cell-C is the 3rd mobile operator in South Africa, having obtained a 15-year license and commenced operations in 2001. The company has approximately 2.4 million subscribers including 500,000 postpaid subscribers and 1.9 million prepaid subscribers, representing a roughly 11% market share. In addition the company operates a community telephone service program (CST) through the deployment of manned public pay telephones to under-serviced areas across South Africa. CST service is available at a reduced tariff and preferential interconnect rates; the company deploys roughly 40% of CSTs in South Africa. The company�s mobile network comprises a dual band (900/1800) network comprising roughly 2,000 base stations alongside roaming agreements with Vodacom which in total provides coverage of 95% of South Africa�s population. Cell C�s voting power is divided as follows: 60% Oger Telecom (which is 90% owned by Saudi Oger); 25% CellSaf (a collection of black economic empowerment and historically disadvantaged groups); and 15% Lanun Securities (owned by Rashid Engineering). For the last twelve months ended 30 September 2005, revenues were ZAR 4,418mn and EBITDA was ZAR 126.4mn.
Investment Recommendation We have a BUY rating on Cell-C�s 8.625% senior notes and on the company�s 11% senior subordinated notes. Credit measures are likely to improve materially during the next 12 months as the company becomes free cash flow positive and increases scale, thereby achieving higher margins. While credit strength is largely dependant on �above the EBITDA line� factors such as market penetration and growth, we think the company�s near term subscriber growth targets are reasonable given the strong potential of the still developing South African mobile market. Additionally, the CST business model affords additional stability to the growth metrics, given the company�s exclusive franchise areas.
Debt Profile At 30 September 2005, Cell C had roughly ZAR 4,980mn of total debt outstanding, comprised principally of senior secured notes (ZAR 3,172mn) and senior subordinated notes (ZAR 1,788mn). Cell C also has ZAR 500mn available under its currently undrawn revolving credit facility.
�400mn 8.625% Senior Secured Notes The notes are secured by first priority liens on the company�s assets including the network equipment, shares in the Guarantor subsidiaries, licenses and leases, but excluding some accounts receivables. The senior notes have senior secured guarantees from Cell C Property Company Limited and Cell C Service Provider Company Limited.
$270m 11% Senior Subordinated Notes The notes are unsecured and have senior subordinated guarantees from Cell C Property Company Limited and Cell C Service Provider Company Limited.
ZAR 500mn Revolving Credit Facility Cell C finalised its 3-year revolving credit facility with Nedbank, a South African Bank, on 15 September 2005. The facility is secured by a pledge against the network operator receivables and interconnect receivables of Cell C and its subsidiaries. The company also has a ZAR 167.4mn ICASA loan liability, secured on its fixed telecom license, plus additional capitalized leases and finance costs.
Shareholder Loans Shareholder loans of roughly ZAR 3,658.4mn are comprised of the 3C Telecom Ltd loan, Saudi Oger Loan 2, SOLF, and CellSaf loan and are deeply subordinated to the company�s senior and subordinated bonds.
Aizaz Shaikh +44 20 7595 8607 [email protected]

CellC ⎪ January 2006
85 European High Yield Research
CellC Structure
Cell C (Pty) Limited(Operating Company)
Cell C Service ProviderCompany (Pty) Limited (sales
and distribution company)
Cell C Property Company(Pty) Limited
Upstream GuaranteeUpstream Guarantee
100%100%
R186.3mCellSAf Term Loan
R2,031mSaudi Oger Term
Loan
�400.0m Senior Secured Notes$270.0m Senior
Subordinated Notes
R300m Revolving Credit Facility
Source � CellC

CellC ⎪ January 2006
86 European High Yield Research
Bond Covenant EUR 400mn 8.625% Senior Secured Notes 2012
USD 270mn 11% Senior Subordinated Notes 2015
Issuing entity Cell C (Pty) Limited
Ranking Senior Secured Notes Senior Subordinated Notes
Position vs. bank debt Secured by different assets Contractually Subordinated
Position vs. other bonds Senior Structurally and Contractually Subordinated
Security/Guarantees
Secured on a first priority basis by substantially all of Cell C (Pty) Ltd�s assets, with the exception of a portion of their accounts receivable, which secure the revolving credit facility.
Guaranteed on a senior secured basis by Cell C Service Provider Company Ltd and Cell C Property Company Ltd.
General unsecured obligations of Cell C Ltd.
Guaranteed on a senior subordinated basis by Cell C Service Provider Company Ltd and Cell C Property Company Ltd.
Optional redemption
! Make Whole � prior to 1 July 2009 at Bunds + 50bp
! Equity Claw �prior to 1 July 2008 max 35% of the aggregate principal amount at 108.625% with the net proceeds of one or more public equity offerings.
! Call Schedule:
1 July 2009 � 104.313%
1 July 2010 � 102.156%
1 July 2011 � 100.000%
! Make Whole � prior to 1 July 2010 at Treasuries + 50bp
! Equity Claw �prior to 1 July 2008 max 35% of the aggregate principal amount at 111.00% with the net proceeds of one or more public equity offerings.
! Call Schedule:
1 July 2010 � 105.50%
1 July 2011 � 102.75%
1 July 2012 � 100.00%
Tax redemption Yes � at par
Negative pledge Yes Yes
Cross default Yes�on �10mn or more of other debt
Fall away covenants No
Anti-layering No Yes
Change of control Put at 101%
Asset sales
The Issuer and its Restricted Subsidiaries cannot sell assets unless:
! Receive fair market value as determined by the Board of Directors;
! At least 75% of the consideration is in cash and equivalents, including the assumption by the purchaser of the Issuer�s debt or Debt of any Restricted Subsidiary (other than Subordinated Debt);
Proceeds must be used within 365 days to make an investment in replacement assets, or to permanently repay any secured senior debt of the Issuer or any Guarantor outstanding under the credit facility. Net cash proceeds not used for the above will constitute Excess Proceeds. When Excess Proceeds exceed �10mn the Issuer shall make a pro rata offer to purchase a portion of the Senior Secured Notes and any pari passu debt.
The Issuer and its Restricted Subsidiaries cannot sell assets unless:
! Receive fair market value as determined by the Board of Directors;
! At least 75% of the consideration is in cash and equivalents, including the assumption by the purchaser of the Issuer�s debt or Debt of any Restricted Subsidiary (other than Subordinated Debt);
Proceeds must be used within 365 days to make an investment in replacement assets or to permanently repay any senior debt of the Issuer or any Guarantor outstanding under the credit facility. Net cash proceeds not used for the above will constitute Excess Proceeds. When Excess Proceeds exceed �10mn the Issuer shall make a pro rata offer to purchase a portion of the Senior Subordinated Notes and any pari passu debt.
Source � BNP Paribas, CellC

CellC ⎪ January 2006
87 European High Yield Research
Bond Covenants EUR 400mn 8.625% Senior Secured Notes 2012
USD 270mn 11% Senior Subordinated Notes 2015
Debt limit
Debt is permitted if after giving effect to the incurrence of such debt, on a pro forma basis, the ratio of the outstanding Debt of the Issuer and its Restricted Subsidiaries to EBITDA is less than or equal to 4.5x.
Carve outs:
! Incurrence by the Issuer or any Guarantor of debt under credit facilities in an aggregate principle amount less than (i) the greater of �75mn and 50% of the book value of the trade receivables of the Issuer and its Restricted Subsidiaries, minus (ii) the amount of any permanent repayments or prepayments of such debt with the proceeds of asset sales;
! CLOs, mortgage financings, purchase money obligations in aggregate outstanding not to exceed �15mn;
! Incurrence by the Issuer or any Guarantor of subordinated debt not to exceed �225mn, provided that such subordinated debt is subject to subordination provisions customary for such debt;
! General basket up to �30mn.
Debt is permitted if after giving effect to the incurrence of such debt, on a pro forma basis, the ratio of the outstanding Debt of the Issuer and its Restricted Subsidiaries to EBITDA is less than or equal to 4.5x.
Carve outs:
! Incurrence by the Issuer or any Guarantor of debt under credit facilities in an aggregate principle amount less than (i) the greater of �75mn and 50% of the book value of the trade receivables of the Issuer and its Restricted Subsidiaries, minus (ii) the amount of any permanent repayments or prepayments of such debt with the proceeds of asset sales;
! CLOs, mortgage financings, purchase money obligations in aggregate outstanding not to exceed �15mn;
! General basket up to �30mn.
Restricted payments
If the Issuer can incur at least �1.00 of additional Debt with a Consolidated Net Debt Leverage Ratio less than 3.0x, then the aggregate amount of consolidated EBITDA; minus 200% of consolidated interest expense, each accrued on a cumulative basis; plus 100% of equity or equity-like proceeds; plus, in the case of the disposition or repayment of any investment constituting a restricted payment, an amount equal to the lesser of the return on capital with respect to such investment and the contributed cost of the investment, both net of disposition costs and taxes made after the date of the indenture; plus the fair market value of the Issuer�s interest in any unrestricted subsidiary subsequently designated as a restricted subsidiary.
Carve outs:
! Repurchase, redemption, acquisition or retirement of any Capital Stock of the Issuer or any of its Restricted Subsidiaries held by any employee benefit plan, current or former employees or directors, or pursuant to any management agreement, subscription agreement or stock option agreement, provided the aggregate price paid shall not exceed �2.5mn in any 12-month period;
! Repurchase, redemption, defeasance or other acquisition or retirement of any Deeply Subordinated Shareholder Loans in exchange for, or from the net cash proceeds of, a substantially concurrent incurrence of subordinated debt of up to �225mn.
! General basket of �10mn.
Transactions with affiliates
Transactions must be on terms that are not materially less favourable than an arm�s length transaction. Transactions having a value greater than �5mn require an Officer�s Certificate and those exceeding �10mn need the approval of the majority of the disinterested directors. The written opinion of an investment banking firm, stating the transaction is fair from a financial point of view, is necessary for transactions having an aggregate value greater than �20mn.
Source � BNP Paribas, CellC

CellC ⎪ January 2006
88 European High Yield Research
CellC, Financial Model FYE 31 December Historic Historic Historic Historic Historic Historic Historic Historic Historic Historic Proj'd Proj'd
ZAR mn FY 02 FY 03 Q1 04 Q2 04 Q3 04 Q4 04 FY 04 Q1 05 Q2 05 Q3 05 FY 05 FY 06 PROFIT & LOSS Revenue 1,242 2,461 879 920 1,053 1,248 4,100 1,197 1,277 1,417 5,500 7,315 COGS -2,049 -2,895 -822 -761 -907 -1,043 -3,533 -1,000 -990 -1,096 % of Sales 0 Gross profit -807 -434 57 159 146 204 566 197 287 321 Other Income 21 38 3 5 6 5 18 2 1 22 SG&A -652 -693 -165 -163 -140 -147 -615 -132 -199 -191 EBITDA -1,438 -1,090 -105 1 12 62 -30 66 88 152 500 1,170 Interest -152 -294 -85 -102 -121 -124 -432 -129 -138 -185 -1,000 -1,100 Revenue growth y/y 98.1% 66.6% 134.2% 33.0% Gross margin -65.0% -17.6% 6.5% 17.3% 13.8% 16.4% 13.8% 16.5% 22.5% 22.6% SG&A / sales 52.5% 28.2% 18.8% 17.7% 13.3% 11.7% 15.0% 11.1% 15.6% 13.5% EBITDA margin 115.8% 44.3% -12.0% 0.1% 1.1% 5.0% 0.7% 5.6% 6.9% 10.7% 9.1% 16.0% CASH FLOW Change in working capital -146 406 -135 -10 -144 -350 -65 36 46 -100 -50 Cash from Operating Activities -1,810 -1,186 -323 -158 -292 -988 -160 -149 -177 -600 20 Capex -1,229 -1,197 -225 -284 -191 -932 -148 -134 -108 -600 -900 Proceeds on Disposal 0 1 0 0 0 5 0 0 0 Cash from Investing Activities -1,229 -1,196 -225 -284 -190 -927 -148 -133 -108 -600 -900 Free Cash Flow -3,039 -2,382 -1,915 -1,200 -880 Debt Repayment/Issuance 1,828 3,112 707 333 492 1,871 251 -3,323 4,975 Incr/Decr Current Portion of Loans 1,046 -996 4 5 4 25 4 3,562 -3,554 Cash from Financing Activities 2,875 2,641 712 337 496 1,896 255 240 1,421 Net Change in Cash -165 259 164 -106 14 -19 -53 -43 1,136 BALANCE SHEET Cash & Equivalents 54 275 256 204 168 1,297 R500mn Revolver Bank Debt 1,025 1,400 1,656 1,799 1,939 0 Bonds- HY 4,878 8.625% Sr Nts �400m due 2012 3,121 11% Sr Sub Nts $270m due 2015 1,757 Other Debt 2,554 3,539 4,610 4,989 5,320 3,693 Finance Leases 13 22 23 22 21 20 Capitalised Finance Costs 0 -170 -158 -152 -145 -153 ICASA (Telecom License) 119 138 155 159 163 167 Shareholder Loan 2,423 3,548 4,590 4,959 5,280 3,658 Total Debt 3,579 4,939 6,266 6,788 7,258 8,571 Net Debt 3,525 4,664 6,010 6,584 7,090 7,274 RATIOS Total Leverage (gross) NMF 17x 8x Totalt Leverage (net) NMF 15x 7x
Source � BNP Paribas Estimates, CellC

CellC ⎪ January 2006
89 European High Yield Research
This page has been left blank intentionally

Central European Media ⎪ January 2006
90 European High Yield Research
Central European Media Bond Description & Market Data, as of 05 January 2006
Next Call Issuer Credit Trend: Stable
Description Amount (o/s) Ratings Date Price Price YTW STW
8.25% Senior Notes due 2012 EUR 245mn B1/B+ 15-May-09 104.125 110 1/4 5.96% 295 bp EURIBOR+550bp Senior FRNs due 2012 EUR 125mn B1/B+ 15-May-07 102 102 8.10% 546 bp Source � BNP Paribas
Company Profile Central European Media is a leading commercial television broadcaster in the Czech Republic. Following the 2004 acquisition of the TV Nova Group, CETV owns and operates nine television channels in six Central and Eastern European countries: the Czech and Slovak Republics, Slovenia, Croatia, Romania and Ukraine (the first three of which are members of the EU and the next two of which are expected to accede to the EU after 2007). CETV broadcasts to approximately 90mn people in markets with an estimated combined television advertising spend of approximately $800mn in 2004.
CETV�s stations are ranked number one or two in terms of both television advertising market share and audience share in its core markets: Romania, the Slovak Republic, Slovenia and Ukraine, and the Czech Republic. Advertising revenues are generated from a customer base comprised to a large extent of multi-national companies and, more recently, an increasing number of local advertisers. The top ten advertisers in each of CETV�s markets contribute between 23% and 35% of its annual revenues in such countries. The principal owners of CETV are Ronald Lauder (24.5%), Federated Investors (10.6%), FMR Corp (5.6%), TCS Capital (5.2%), Leonard Lauder (4.8%) and Mark Riely (3.8%). For the last 12 months ended 30 September 2005, CETV�s revenues and EBITDA were $285mn and $44.8mn, respectively.
Investment Recommendation We have a REDUCE rating on CETV bonds and a STABLE credit trend. Our rating is primarily based on valuation, where the yields under 7% on each of the floating and fixed rate notes are not compelling in our view. In addition to finding other bonds in European high yield with similar yield and spread profiles, but more attractive credit features, we feel that that CETV bonds are currently valued on the momentum from recent positive news flow, which is likely not to be sustainable over coming quarters.
Debt Profile Most of CETV�s roughly $510mn in debt, as at 30 September 2005, was raised in its May 2005 financing to fund its December 2004 acquisition of TV Nova. The company issued 2 high yield rated Eurobonds, the �245mn 8.25% senior notes due 2012 and the �125mn senior floating rate notes due 2012, raising proceeds of �361mn net of fees and expenses. The senior fixed and senior floating rate notes were issued with a first ranking pledge of shares in the CME BV and CME NV, CME Ltd�s wholly owned subsidiaries which in turn are owners of CME Ltd�s Eastern European operating companies (see structure chart). The bonds are also guaranteed on a senior basis by CME Ltd�s subsidiary companies, CME NV and CME BV respectively. The floating rate notes were issued with NC2 structure and the fixed rate note with a NC4 structure and a typical high yield covenant package.
Other indebtedness, which is primarily incurred at CETV�s subsidiary companies, amounts to roughly $75mn comprising a $51.5mn mediation liability at CET 21 plus bilateral bank debt and capital leases at other subsidiaries. CETV also has a �37.5mn revolving credit facility at its Slovenian subsidiary Pro Plus of which �20mn was drawn as of 17 October 2005 (undrawn at 30 September 2005). On 27 October 2005, CET 21, CETV�s Czech license-holding company, entered into a multi-currency revolving credit facility for up to roughly $50mn. The security package for the Facility includes a guarantee by each of CP 2000 and MAG MEDIA, with the latter guarantee secured by a pledge of receivables of MAG MEDIA arising from a factoring agreement with Factoring Ceske sporitelny, a.s.
Aizaz Shaikh +44 20 7595 8607 [email protected]

Central European Media ⎪ January 2006
91 European High Yield Research
Central European Media Structure
Central European Media Enterprise Ltd.(Bermuda)
Dutch and Netherlands Antilles HoldingCompanies
100%
CME Development Corporation(Delaware)
Innova, IMSIntermedia
(Ukraine Group)
Nova TV(Croatia)
OperativnaKompanija(Croatia)
Studio 1+1(Ukraine)
Kanal A(Slovenia)
Pop TV(Slovenia)
100%
100%
60%
30%
Pro Plus(Slovenia)
100%
100%
100%
Pro TV(Romania)
85%
STS(Slovak
Republic)
49%Markiza-Slovakia
(SlovakRepublic)
34%
51%
100%CET 21(Czech Republic)*
16.67%
52.075%
CZK 1,200mn Revolver
8.25% Senior Notes
E + 550bp Senior FRNs
34%
CP 2000, MagMedia, etc
(Czech Republic)
Galaxie Sport(Czech
Republic)
100%
100%
�37.5mn Revolver
CZK 700mn WorkingCapital Facility(1)
CZK 850mn Facility forFactoring Trade Receivables(1)
Source � Central European Media
1. Aggregate borrowing under both facilities may not exceed CZK 1,100mn

Central European Media ⎪ January 2006
92 European High Yield Research
Bond Covenant Bond description EUR 245mn 8.25% Senior Notes EUR 125mn Senior FRNs due 2012 Issuing entity Central European Media Enterprises Ltd Ranking Senior Notes Position vs. bank debt Structurally Subordinated Position vs. other bonds Pari passu
Security/Guarantees
The notes are guaranteed, subject to certain limits imposed by local law, on a senior basis by two wholly-owned subsidiaries of CME, Central European Media Enterprises N.V. and CME Media Enterprises B.V. The notes are secured by a security interest over the shares of the subsidiary guarantors and certain contractual rights of CME. The security granted in favour of the notes may be released in certain circumstances. In addition, the collateral subject to the security may be pledged in favour of additional indebtedness in the future.
Optional redemption
! Make Whole � prior to 15 May 2009 at bunds + 50bp
! Equity Claw � prior to 15 May 2008 max 35% of issue at par + coupon
! Call Schedule: 15 May 2009 � 104.125% 15 May 2010 � 102.063% 15 May 2011 � 100.000%
! Make Whole � after 15 May 2007 (see call schedule)
! Equity Claw � prior to 15 May 2008 max 35% of issue at par + coupon
! Call Schedule: 15 May 2007 � 102.000% 15 May 2008 � 101.000% 15 May 2009 � 100.000%
Tax redemption Yes at par + accrued and unpaid interest Negative pledge Yes Cross default Yes - on $25mn or more of other debt Fall away covenants No Anti-layering No Change of control Put at 101%, 35% of voting share capital
Asset sales
If the asset is at least equal to the fair market value, as determined in good faith by the board of directors, of the shares and assets. If 75% of the consideration received by the issuer is in the form of cash or cash equivalents. If the issuer applies 100% of the net available cash from the asset disposal to: ! redeem senior Indebtedness ! acquire additional assets
Debt limit
Debt is permitted if after giving pro forma effect thereto, the consolidated leverage ratio is less than 4.50 to 1.00. Carve outs: ! Credit facility cannot exceed �37.5mn. ! CLOs or PMOs cannot exceed $35mn. ! General basket $75mn.
Restricted payments
If company can raise �1.00 of debt then 50% net income less 100% net loss. Carve outs: ! Payments of dividends following the covenant �Debt Limit�. ! Repurchase of stock from employees up to $1.0mn in any calendar year � in any event
up to a total of $4.0mn a year. ! Dividends in any calendar year, up to 6% of aggregate net cash proceeds, from all
public offerings. ! General basket up to $25mn.
Transactions with affiliates
All transactions with affiliates should be made in good faith and on an arm�s-length basis, and for transaction involving an aggregate value of $10mn or greater the transaction has to be approved by the board of directors; for transactions involving an aggregate value of $20mn a written opinion of an independent financial advisor is required. If the transaction involves a aggregate amount over $75mn CME must receive a written opinion from an independent investment banking firm of internationally recognized standing (transaction has to be fair on a financial stand point).
Limitation on Liens The Issuer will not, and will not permit any Restricted Subsidiary to, directly or indirectly, create, Incur or suffer to exist any Lien upon any of its property or assets.
Source � BNP Paribas, Central European Media

Central European Media ⎪ January 2006
93 European High Yield Research
Central European Media, Financial Model FYE 31 December Historic Historic Historic Historic Historic Historic Historic Pro Forma* Historic Historic Historic
USD mn FY 02 FY 03 Q1 04 Q2 04 Q3 04 Q4 04 FY 04 FY 04 Q1 05 Q2 05 Q3 05
PROFIT & LOSS Revenue 99 125 36 45 37 65 182 390 48 113 87 COGS -61 -77 -20 -23 -26 -36 -105 -199 -34 -50 -56 Gross profit 39 48 16 22 10 29 77 191 15 63 31 SG&A -14 -14 -4 -4 -7 -8 -22 -37 -7 -13 -13 EBITDA 24 33 13 17 4 21 55 154 8 50 19 P&L Interest -16 -7 1 0 0 3 -40 1 -6 -10 Gross margin 38.9% 38.1% 45.1% 48.1% 28.0% 44.5% 42.2% 49.1% 30.4% 55.6% 35.9% SG&A / sales 14.4% 11.4% 9.9% 9.6% 18.3% 11.6% 12.1% 9.6% 14.3% 11.1% 14.7% EBITDA margin 24.5% 26.7% 35.2% 38.5% 9.7% 32.9% 30.1% 39.5% 16.1% 44.5% 21.2% CASH FLOW Change in working capital -23 -43 -14 -83 -8 -9 28 Cash from Operating Activities -6 -6 1 -8 8 14 21 Capex -4 -8 -2 -11 -4 -5 -9 Cash from Investing Activities -5 -14 -19 -47 -13 -245 -27 Debt Repayment Cash from Financing Activities 23 -199 3 2 -2 210 -10 Net Change in Cash 29 140 -25 -40 -8 -30 -13 BALANCE SHEET Cash & Equivalents 0 192 153 162 144 147 134 ST Facility 0 10 48 48 25 18 Bank Debt 17 9 67 67 53 56 8.25% Sr Nts due 2012 315 295 294 288 EB + 550 Sr Float Nts due 2012 161 151 150 147 Total Debt 17 19 590 561 522 508 Net Debt 428 417 375 374 RATIOS Leverage Bank Leverage (gross) 0.7x 2.3x 0.9x 0.8x Total leverage (gross) 3.8x 11.2x 6.3x 5.2x Total leverage (net) 2.8x 8.3x 4.5x 3.8x
Source � BNP Paribas Estimates, Central European Media * Pro Forma for the TV Nova Acquisition

Cirsa ⎪ January 2006
94 European High Yield Research
Cirsa Bond Description & Market Data as of 5 January 2006
Next Call
Description Amount (o/s) Ratings Date Price Price YTW STW
8.75% Sr Nts due 2014 EUR 210mn B1/B+ 15-May-09 104.375 104.50 7.83% 475bp 7.875% Sr Nts due 2012 EUR 130mn B2/B NC NC 98.25 8.23% 515bp
Source – BNP Paribas
Company Profile Cirsa is the leading Spanish gaming company. The company operates slot machines, bongo halls and casinos in the country. In addition, Cirsa manufactures slot machines. The company also has presence outside of Spain, including Latin America and Italy. In Latin America, the largest profit-generating unit is a riverboat casino in the City of Buenos Aires (Argentina), which is the largest casino on the continent. Cirsa has five business divisions: Slots, Casinos, Bingos, Manufacturing and Interactive. The company operates over 22,000 slot machines in Spain (approximately 9% of the market), and owns or manages over 9,500 machines in Italy. Cirsa operates casinos in Marbella, Valencia, Gandia and La Toja. In Latin America, the company operates eight casinos and 36 electronic casinos (casinos with only electronic gaming machines). The company operates 63 bingo halls in Spain. This division generates revenues from the sale of bingo cards and the use of slot machines located in the bingo halls. The company is a leading manufacturer of slot machines in Spain, with over 27,000 slot machines produced in 2004. The manufacturing division designs, assembles and distributes slot machines for the Spanish and international market. Cirsa’s Interactive division develops interactive gaming systems, concentrating on lotteries and linked bingo products, and ensures other divisions participate in new developments in the gaming industry. Cirsa’s principal shareholder is its chairman and managing director, Mr. Manuel Lao Hernandez. Mr. Lao Hernandez founded the company in 1978 and directly and through his holding company, Leisure and Gaming Corporation, S.L., beneficially owns 100% of the outstanding share capital of Cirsa. For the twelve months ended 30 September 2005, the company had revenues of €1,539.2mn and EBITDA of €118.6mn. For this period, Cirsa had leverage of 4.3x and coverage of 3.8x.
Debt Profile Cirsa’s balance sheet indebtedness comprises bank loan agreements, capital lease agreements, gaming tax deferrals, promissory notes, Panamanian notes, two high yield bond tranches and some other obligations. The company is a party to multiple small loan agreements and revolving facilities with a plethora of banks. At the end of third quarter 2005, Cirsa had €45.6mn of bank debt outstanding. According to Cirsa’s management, the company currently has €75mn available under its bank facilities, which can be used in the future to fund the company’s Chilean expansion. In addition, Cirsa is also a party to various capital leasing agreements and had €19.4mn of capital leases outstanding at the end of third quarter 2005. In Spain, the company usually applies for a deferment of the payment of the gaming tax with the tax authorities of the various autonomous regions of the country. These deferments are usually for three to six months and sometimes can be granted for a period greater than one year. Cirsa has granted a mortgage, for an amount of up to €40mn, to secure the payment of certain gaming tax amounts deferred for two years. We expect that those longer-term deferrals will be repaid by the end of 2006. At the end of third quarter 2005, the company had €43.6mn of gaming tax deferrals on its balance sheet. Cirsa has issued promissory notes to finance the purchase of gaming assets, primarily slot machine operations, and some acquisitions. Specifically, during 2004, the company paid a portion of consideration for the Bingo Cinco Estrellas joint venture in Madrid and Andalusia bingo halls through the issuance of promissory notes. As of 30 September 2005, Cirsa had €54.9mn of promissory notes outstanding, some of which were secured by the assets and companies acquired. The company also has some Panamanian notes outstanding. The notes were issued by Cirsa’s local subsidiaries. Certain Panamanian notes benefit from security over certain of the assets of the company’s Panamanian subsidiaries, including share pledges and a guarantee from the parent company. Finally, Cirsa has two high yield bonds outstanding – €270mn of 8.75% senior notes due 2014 and €130mn of 7.875% senior notes due 2012. Both tranches were issued by Cirsa Finance Luxembourg S.A., a wholly-owned Luxembourg-domiciled finance subsidiary of Cirsa Business Corporation, S.A. The 8.75% bonds due 2014 are guaranteed on a senior basis by the aforementioned parent company of the issuer and benefit from senior guarantees from Cirsa’s various operating subsidiaries. Together the guarantors of the notes accounted for 85% of the company’s EBITDA for the twelve months ended 31 March 2005. In addition, the indenture of the 8.75% notes due 2014 (and of the 7.875% senior notes due 2012) provides that, subject to certain conditions, Cirsa’s new subsidiaries that represent 5% each or more of the company’s EBITDA will also become guarantors of the notes. Cirsa’s 7.875% notes due 2012 also benefit from guarantees from the parent company and from various subsidiaries. One material exclusion from the guarantor group is Casino Buenos Aires, S.A. Thus, the guarantors of the 7.875% notes due 2012 accounted only for 48.1% of EBITDA of Cirsa Business Corporation S.A. for the twelve months ended 31 March 2005.
Oleksiy Soroka, CFA +44 20 7595 4878 [email protected]
Cirsa ⎪ January 2006
95 European High Yield Research
Investment Recommendation We maintain our BUY/Positive Credit Trend recommendation for Cirsa’s bonds. We believe that Cirsa’s notes are attractive in the context of the current market. The company’s bonds are quoted materially wider than other European high yield bonds with similar ratings and with comparable credit profiles. Our favourable outlook for Cirsa’s notes is underpinned by our expectations that the company’s operating performance reached the worst point during the second quarter of 2005 and will gradually improve during the next several quarters (probably reaching a positive year-on-year EBITDA dynamic in first quarter 2006). We believe that as Cirsa’s results improve during the next couple of quarters, the bonds will react favourably. While we estimate that the company will have negative free cash flow in 2005-2007, we remark that our expectations of the cash outflow are primarily driven by material repayments of gaming tax deferrals that we expect to take place during the second half of this year and in 2006 and by investments in the Chilean casinos, licenses for which the company is seeking at the moment. Given the expected competition for the Chilean licenses, we think that the company will be able to win only two or three of them (out of the total of seven available) and, therefore, will not have to incur as much in the way of capital expenditures as we have included in our capital expenditure projections. In addition, we believe that trying to secure the Chilean licenses is a sound strategy for Cirsa and that the company will benefit from any new casinos in that country starting from 2007 (we include the positive effect from the new casinos in our forecasts from that year). We also view the recently announced entry into a Mexican bingo market as a logical expansionary step, even if fraught with some execution risks.
In terms of weaknesses and risks, we feel that Cirsa’s active pursuit of opportunities outside of Spain, be it in Latin America, Italy or South Korea, dampens the company’s near-term free cash flow generation and creates additional volatility in the earnings stream. We note that not all of those overseas investments have worked out successfully, as the current withdrawal from South Korea and the troubles in Italy suggest. From the bondholders’ perspective, it would be preferable if the company managed the well-established, if somewhat mature, domestic Spanish franchise for cash. However, on the more positive note, the active international expansion, if successfully executed, does present opportunities to expand the company’s earnings base at a rapid rate. Another notable risk for Cirsa is the regulatory one. A gaming industry is traditionally closely watched and regulated by the authorities and, therefore, various governmental pronouncements or new pieces of legislation may have a material negative affect on the company’s profitability. Finally, a significant exposure of Cirsa to the Latin American gaming business, including a massive floating casino in Buenos Aires, is well-publicised. For example, in 2004, Casino Buenos Aires S.A., essentially, the single aforementioned riverboat casino, generated approximately 10% of the company’s total revenues and nearly 37% of Cirsa’s EBITDA. We recognise that the political and economic environment can be extremely volatile in Latin America. We feel, however, that risks related to Cirsa’s exposure to the South American market are slightly overemphasised. At the same time, we agree that such a significant exposure of the company’s earnings to the Buenos Aires casino, as indicated above, makes the company vulnerable to the adverse developments with regards to that particular asset.

Cirsa ⎪ January 2006
96 European High Yield Research
Cirsa Structure
CirsaBusiness
Corporation, S.A.
Subsidiary Guarantors (5),(10)
Cirsa Capital Luxembourg
S.A.
Cirsa Finance Luxembourg
S.A.
Casino Buenos Aires, S.A.
2012 Noteholders
Notes (1)
€130m
Parent Guarantee (3)
Funding Loan (3)
Senior Subsidiary Guarantees (4)
100%
100%
2014 Noteholders
2014 Notes (6)
€270m
100%
100%
Parent Guarantee (8)
Funding Loan (7)
Senior Subsidiary Guarantor (11)
Senior Subsidiary Guarantees (9)
Source – Cirsa
1. The notes were issued by Cirsa Capital Luxembourg S.A., a wholly-owned Luxembourg finance subsidiary of Cirsa Business Corporation, S.A., except for one share that is owned by Cirsa International Gaming Corporation, S.A. 2. The gross proceeds of the sale of the notes were loaned to Cirsa Business Corporation, S.A. pursuant to a funding loan. The funding loan has the same principal amount and repayment terms as the notes. 3. The notes are unconditionally guaranteed on a senior basis by Cirsa Business Corporation, S.A. 4. Certain of Cirsa Business Corporation, S.A.’s subsidiaries unconditionally guarantee the 2012 notes on a senior basis. These subsidiaries accounted for 48.1% of EBITDA of Cirsa Business Corporation, S.A. on a pro forma consolidated basis for the twelve months ended March 31, 2005. 5. Additional bank and other debt has been incurred and guaranteed by various subsidiaries, including the Subsidiary Guarantors. As of March 31, 2005, on a pro forma basis after giving effect to the offering and the application of the proceeds therefrom, there was €376.5 million of debt in addition to the 2012 notes. 6. The 2014 Notes were issued by Cirsa Finance Luxembourg S.A., a wholly-owned Luxembourg finance subsidiary of Cirsa Business Corporation, S.A. except for one share that is owned by Cirsa International Gaming Corporation, S.A. Cirsa Finance issued €210.0 million of 8.75% Senior Notes due 2014 on May 14, 2004 and €60.0 million of 8.75% Senior Notes due 2014 on September 28, 2004. 7. The gross proceeds of the sale of the 2014 Notes were loaned to Cirsa Business Corporation, S.A. pursuant to a funding loan. The funding loan has the same principal amount and repayment terms as the 2014 Notes. 8. The 2014 Notes are unconditionally guaranteed on a senior basis by Cirsa Business Corporation, S.A. 9. Certain of Cirsa Business Corporation, S.A.’s subsidiaries have unconditionally guaranteed the 2014 Notes on a senior basis. These subsidiaries accounted for 84.0% of the EBITDA of Cirsa Business Corporation, S.A. on a pro forma consolidated basis for the twelve months ended March 31, 2005. 10. All of the subsidiaries of Cirsa Business Corporation, S.A. that have guaranteed the 2014 Notes guarantee the 2012 Notes, other than for Casino Buenos Aires, S.A. 11. Casino Buenos Aires S.A. does not guarantee the 2012 notes. During 2004, Casino Buenos Aires S.A. generated €125.8 million in revenues and €48.5 million in EBITDA, which represented 10.9% of total revenues and 39.8% of total EBITDA, respectively.

Cirsa ⎪ January 2006
97 European High Yield Research
Bond Covenant Bond description EUR 8.75% Senior Notes due 2014
Issuing entity Cirsa Finance Luxembourg S.A
Ranking Unsecured senior notes
Position vs. bank debt Contractually subordinated
Position vs. other bonds Pari passu
Security/Guarantees Senior guarantees from Cirsa Business Corporation S.A pursuant to a funding loan and from certain subsidiaries (together represented 76% of total consolidated EBITDA for the twelve months to 30 June 2004).
Optional Redemption
• Make Whole – prior to 15 May 2009 at bunds+50bp
• Equity Claw – prior to 15 May 2007 max 35% of issue at 108.75%
• Call Schedule: 15 May 2009 – 104.375% 15 May 2010 – 102.917% 15 May 2011 – 101.458% 15 May 2012 and thereafter – 100.000%
Change of control Put at 101%.
Tax redemption Yes – at par
Negative pledge Yes – limitation on liens
Cross default Yes – on €10mn or more of other debt.
Fall away covenants No
Anti-layering No
Debt Limit
Debt is permitted up to 3.0x pro forma coverage. Carve outs: Incurrence of additional debt under credit facilities of up to €100 million less
commitment reductions with respect to revolving credit facility (with the non-guarantor Restricted Subsidiary debt not to exceed €50mn);
Capital leases, mortgages, sale and leaseback transactions or purchase money obligations of up to €25mn;
Guarantees of the indebtedness of Permitted Joint Ventures of up to €25mn; General basket of €25mn.
Restricted payments
If company can raise €1.00 of debt then 50% net income less 100% net loss. Carve outs: Loans or advances made to employees, officers or directors of up to €2mn at any time
outstanding; Following a public offering of shares, the payment of dividends up to 4% on the net
cash proceeds received by the IPO. General basket of €10mn.
Transactions with affiliates
Must be on fair terms; For transactions of over €4mn, a resolution of the Board of Directors is needed; For transactions of over €8mn, a certification form an independent accounting,
appraisal or investment banking firm of national standing is needed.
Asset sales
Asset Sales are transactions with a fair value equal or in excess of €5mn. The Issuer cannot sell assets unless: The issuer receives a fair market value for them; At least 75% of the consideration is received in the form of cash, cash equivalents or
replacement assets; Must use proceeds within 360 days to pay down secured indebtedness, indebtedness
of a Restricted Subsidiary that is not a guarantor or indebtedness incurred under credit facilities, to purchase another Permitted Business, to make a capital expenditure or to purchase long-term assets that are useful in a Permitted Business; with the balance of the proceeds, it such balance is over €10mn, to buy back the bonds or pay down the pari passu indebtedness.
Source – BNP Paribas, Cirsa

Cirsa ⎪ January 2006
98 European High Yield Research
Bond Covenant Bond description EUR 7.875% Senior Notes due 2012
Issuing entity Cirsa Capital Luxembourg S.A
Ranking Unsecured senior notes
Position vs. bank debt Contractually and partially structurally subordinated
Position vs. other bonds Pari passu
Security/Guarantees
The notes are unconditionally guaranteed, jointly and severally, on a senior basis by the Guarantors. A Guarantee given by a subsidiary may be released in the event of certain sales or disposals of the relevant Guarantor (together represented 48.1% of total Pro forma EBITDA for the twelve months to 31 March 2005).
Optional redemption Make Whole – prior to 15 July 2012 at bunds+50bp
Equity Claw – prior to 15 July 2008 max 35% of issue at 107.875%
Change of control Put at 101%.
Tax redemption Yes – at par
Negative pledge Yes – limitation on liens
Cross default Yes – on €10mn or more of other debt.
Fall away covenants No
Anti-layering No
Debt limit
Debt is permitted up to 2.5x pro forma coverage. Carve outs: Incurrence of additional debt under credit facilities of up to €100mn less commitment
reductions with respect to revolving credit facility; Capital leases, mortgages, sale and leaseback transactions or purchase money
obligations of up to €25mn; Guarantees of the indebtedness of Permitted Joint Ventures of up to €25mn; General basket of €25mn.
Restricted payments
If company can raise €1.00 of debt then 50% net income less 100% net loss. Carve outs: Loans or advances made to employees, officers or directors of up to €2mn at any time
outstanding; Following a public offering of shares, the payment of dividends up to 7% on the net
cash proceeds received by the IPO. General basket of €10 mn.
Transactions with affiliates
Must be on fair terms; For transactions of over €4mn, a resolution of the Board of Directors is needed; For transactions of over €8mn, a certification form an independent accounting,
appraisal or investment banking firm of national standing is needed.
Asset sales
Asset Sales are transactions with a fair value equal or in excess of €10mn. The Issuer cannot sell assets unless: The issuer receives a fair market value for them; At least 75% of the consideration is received in the form of cash, cash equivalents or
replacement assets; Must use proceeds within 360 days to pay down secured indebtedness, indebtedness
of a Restricted Subsidiary that is not a guarantor or indebtedness incurred under credit facilities, to purchase another Permitted Business, to make a capital expenditure or to purchase long-term assets that are useful in a Permitted Business; with the balance of the proceeds, it such balance is over €10mn, to buy back the bonds or pay down the pari passu indebtedness.
Source – BNP Paribas, Cirsa

Cirsa ⎪ January 2006
99 European High Yield Research
Cirsa, Financial Model
FYE 31 December Actual Actual Actual Actual Actual Actual Forecast Forecast Forecast Forecast ForecastEUR mn 2002 2003 2004 Q1 05 Q2 05 Q3 05 Q4 05 2005 2006 2007 2008 P&L SUMMARY Revenue Segmental Breakdown Slots Division 331.2 337.4 361.5 105.3 105.8 105.6 115.8 432.6 445.5 458.9 472.7 % change 1.9% 7.1% 22.3% 23.7% 16.8% 16.5% 19.7% 3.0% 3.0% 3.0% Casinos Division 233.8 239.0 254.6 64.5 66.7 82.1 73.5 286.8 309.6 333.5 364.2 % change 6.5% 8.7% 6.8% 17.4% 17.0% 12.6% 8.0% 7.7% 9.2% Bingo Division 260.1 262.2 409.2 183.3 179.8 186.6 192.0 741.8 764.0 787.0 810.6 % change 56.1% 175.2% 176.8% 113.3% 1.0% 81.3% 3.0% 3.0% 3.0% Manufacturing Division 152.5 95.4 106.8 22.6 34.6 15.7 15.5 88.4 91.1 92.9 94.8 % change 11.9% 26.2% -6.2% -39.9% -40.0% -17.2% 3.0% 2.0% 2.0% Interactive Division 15.2 13.7 15.5 3.4 2.9 2.7 1.7 10.7 11.8 11.9 12.0 % change 13.1% 12.7% -30.1% -48.2% -45.0% -30.9% 10.0% 1.0% 1.0% Family Entertainment Centres Division 13.7 13.2 12.0 0.0 0.0 0.0 0.0 0.0 0.0 0.0 0.0 % change -9.1% Structure and adjustments -9.6 -5.2 -4.5 -1.8 -2.0 -1.0 -1.5 -6.3 -6.0 -6.0 -6.0 Total revenues 996.9 955.7 1,155.1 377.3 387.9 391.7 397.1 1,554.0 1,616.0 1,678.2 1,748.3 % change -24.3% -4.1% 20.9% 60.7% 52.3% 38.3% 3.9% 34.5% 4.0% 3.8% 4.2% EBITDA Segmental Breakdown Slots Division 43.4 46.2 45.1 12.6 8.2 9.7 8.4 38.8 41.2 44.7 49.6 % of revenues 13.1% 13.7% 12.5% 12.0% 7.7% 9.2% 7.3% 9.0% 9.3% 9.8% 10.5% Casinos Division 62.3 71.1 81.2 20.5 18.4 25.8 18.7 83.5 91.3 101.7 112.9 % of revenues 26.6% 29.7% 31.9% 31.8% 27.6% 31.4% 25.5% 29.1% 29.5% 30.5% 31.0% Bingo Division 9.9 9.7 15.4 7.8 4.5 7.6 7.9 27.8 26.7 27.5 28.4 % of revenues 3.8% 3.7% 3.8% 4.3% 2.5% 4.1% 4.1% 3.7% 3.5% 3.5% 3.5% Manufacturing Division 21.5 7.0 7.1 -1.5 1.4 -1.6 -1.6 -3.2 1.8 3.3 3.8 % of revenues 14.1% 7.3% 6.6% -6.6% 3.9% -9.9% -10.0% -3.7% 2.0% 3.5% 4.0% Interactive Division 1.6 -5.0 -9.5 -2.6 -2.2 -1.8 -3.0 -9.7 -10.0 -8.0 -8.0 % of revenues 10.5% -36.5% -61.3% -76.5% -78.1% -66.5% -176.5% -90.2% -84.9% -67.2% -66.6% Family Entertainment Centres Division -1.4 -0.8 -1.4 0.0 0.0 0.0 0.0 0.0 0.0 0.0 0.0 % of revenues -10.2% -6.1% -11.7% Structure and adjustments -25.7 -14.4 -15.9 -4.0 -4.0 -2.1 -6.0 -16.1 -16.0 -16.0 -16.0 EBITDA 111.6 113.8 122.1 32.8 26.2 37.6 24.5 121.0 135.1 153.3 170.7 % of revenues 11.2% 11.9% 10.6% 8.7% 6.7% 9.6% 6.2% 7.8% 8.4% 9.1% 9.8% Depreciation and amortisation 44.6 42.8 -52.9 -12.7 -14.5 -14.4 -15.0 -56.6 -60.0 -61.8 -63.7 Operating profit 67.0 71.0 69.2 19.9 11.6 23.2 9.5 64.4 75.1 91.5 107.1 operating margin 6.7% 7.4% 6.0% 5.3% 3.0% 5.9% 2.4% 4.1% 4.6% 5.4% 6.1% Net interest expense -19.4 -13.2 -23.1 -7.3 -8.3 -9.6 -8.0 -33.2 -35.3 -35.8 -35.4 Net exchange losses and variations in financial provisions -11.1 -20.2 -3.9 -0.2 -0.4 0.0 0.0 -0.6 0.0 0.0 0.0 Goodwill amortization -7.8 -7.1 -9.0 -4.4 -5.6 -4.7 -5.6 -20.3 -22.4 -22.4 -22.4 Exceptional results -29.3 -11.8 -6.2 -1.0 3.2 -4.7 0.0 -2.5 0.0 0.0 0.0 Profit before tax -0.6 18.7 27.0 7.0 0.6 4.1 -4.1 7.9 17.4 33.2 49.3 Income tax -4.0 -13.0 -7.2 -4.0 -2.2 -3.1 0.0 -9.2 -13.9 -26.6 -39.4 effective tax rate -666.7% 69.5% 26.7% 57.1% 336.2% 74.9% 1.0% 117.6% 80.0% 80.0% 80.0% Minority interest -1.0 -0.7 -1.8 -0.8 -0.3 -1.2 -0.5 -2.8 0.0 0.0 0.0 Consolidated profit -3.6 5.0 18.0 2.2 -1.8 -0.2 -4.6 -4.2 3.5 6.6 9.9 CASH FLOW ITEMS Adj gross profit from ops before changes in net op assets 114.8 122.2 132.7 37.1 24.4 40.0 24.5 126.0 135.1 153.3 170.7 Variations in: Receivables 41.6 -7.1 -10.5 -10.1 -9.5 3.1 15.0 -1.5 -10.0 -10.0 -10.0 Inventories 10.7 -1.8 -9.5 -3.5 -2.9 0.7 -3.0 -8.7 -4.0 -4.0 -4.0 Payables -39.6 9.7 23.6 -3.0 15.4 -5.2 -10.0 -2.8 7.0 5.0 4.0 Gaming tax deferrals 13.3 0.9 -6.1 1.3 -3.7 -3.0 -13.0 -18.4 -20.6 0.0 0.0 Accruals, net -16.3 -3.9 -24.8 2.9 -5.7 3.3 0.0 0.5 0.0 0.0 0.0 Cash effect from changes in working capital 9.7 -2.2 -27.3 -12.4 -6.4 -1.1 -11.0 -30.9 -27.6 -9.0 -10.0 Cash generated from operations 124.5 120.0 105.4 24.7 18.0 38.9 13.5 95.1 107.5 144.3 160.7 Income taxes paid -8.7 -10.5 -24.4 -3.7 -5.1 -10.1 -8.6 -26.0 -13.9 -26.6 -39.4 Net cash interest -17.8 -16.0 -22.2 -4.3 -10.9 -1.3 -8.5 -25.0 -35.3 -35.8 -35.4 Net cash flows from operating activities 98.0 93.5 58.8 16.7 2.0 27.5 -3.6 44.1 58.3 81.8 85.9 Capex -53.2 -45.9 -57.3 -17.6 -22.4 -31.5 -20.5 -92.0 -113.5 -93.5 -55.0 Free cash flow 44.8 47.6 1.5 -0.9 -20.4 -4.1 -24.1 -47.9 -55.2 -11.7 30.9 BALANCE SHEET ITEMS Cash position 34.2 25.0 35.6 48.4 45.9 73.4 49.3 49.3 28.5 14.2 31.7 Securities portfolio 7.8 5.5 9.1 4.1 3.5 3.3 3.5 3.5 3.5 3.5 3.5 Cash and securities 42.0 30.5 44.7 52.5 49.4 76.7 52.8 52.8 32.0 17.7 35.2 Bank debt 72.2 103.5 147.7 45.6 60.6 60.6 114.7 125.4 122.0 Capital leases 15.0 15.1 18.2 19.4 18.5 18.5 14.4 11.0 10.9 8.750% Senior Notes due 2014 270.0 278.9 273.0 289.7 270.0 270.0 270.0 270.0 270.0 7.875% Senior Notes due 2012 0.0 0.0 0.0 130.0 130.0 130.0 130.0 130.0 130.0 Gaming tax deferrals 47.3 49.2 46.6 43.6 30.6 30.6 10.0 10.0 10.0 Promissory notes and other indebtedness 62.1 54.8 55.3 54.9 53.5 53.5 41.9 34.5 27.1 Total debt 329.5 272.5 466.6 501.5 540.8 583.2 563.2 563.2 581.0 580.9 570.0 Net debt 287.5 242.0 421.9 449.0 491.4 506.5 510.4 510.4 549.0 563.1 534.7 CREDIT RATIOS Total senior debt/EBITDA 1.6x 1.3x 1.3x 1.2x 1.0x Net senior debt/EBITDA 1.2x 0.9x 1.1x 1.1x 0.8x Total debt/EBITDA 3.0x 2.4x 3.8x 4.7x 4.3x 3.8x 3.3x Net debt/EBITDA 2.6x 2.1x 3.5x 3.4x 4.1x 4.3x 4.2x 4.2x 4.1x 3.7x 3.1x FFO/Net debt 30.7% 39.5% 20.4% 14.7% 15.6% 16.1% 17.9% EBITDA/Net interest expense 5.8x 8.6x 5.3x 4.7x 4.3x 3.8x 3.6x 3.6x 3.8x 4.3x 4.8x (EBITDA-Capex)/Net interest expense 3.0x 5.1x 2.8x 0.9x 0.6x 1.7x 3.3x
Source – BNP Paribas Estimates, Cirsa Leverage and Coverage are based on the last 12 months’ results. Some of the ratios are adjusted for the effects of acquisitions and disposals. In addition, these 2 measures are usually calculated based on EBITDA adjusted for exceptional or non-recurring items. Leverage is defined as net lease-adjusted debt (x8 operating leases)-to-EBITDAR. Coverage is defined as EBITDAR-to-(net interest+rental expenses).

Clondalkin ⎪ January 2006
100 European High Yield Research
Clondalkin Bond Description & Market Data, 06 January 2006
Next Call Issuer Credit Trend: Stable
Description Amount (o/s) Ratings Date Price Price YTW STW
8% Sr Nts due 2014 EUR 170mn B3/B- 15-Mar-08 105.333 106.25 6.74% 365bp
Source � BNP Paribas
Company Profile Clondalkin is a leading European and US specialist producer of a wide range of value-added packaging products. The company supplies its products to a diversified customer base principally in the food and beverage, fast-moving consumer goods, service and distribution, industrial, agricultural and horticultural and healthcare sectors. The company manufactures and distributes its products through over 40 packaging businesses located in nine countries and has more than 4,000 employees. For the twelve months to 30 September 2005, the company generated sales of �712.1mn and EBITDA of �82.6mn.
Investment Recommendation Clondalkin is performing satisfactorily in a difficult market. The operating numbers were fine, with some growth in demand and slight growth in consolidated profitability. The plastics segment remains a concern, but it is not the major business line and flexible packaging is more than compensating. The company appears committed to reducing debt. Nevertheless, demand is not strong and raw material prices remain elevated, limiting the potential upside in the credit. In the short-term, we find the bond fully valued and recommend a Hold.
Debt Profile Senior Credit Facility provides in the aggregate �460.0mn in bank financing. Holdings, Clondalkin and Acquisition Co and certain of their subsidiaries guarantee on a senior basis the obligations of the borrowers under the Senior Facilities Agreement, to the extent permitted by law. With the exception of Clondalkin, all of the Senior Guarantors pursuant to the Senior Facilities Agreement will also be Guarantors under the Notes. In addition, the Senior Facilities Agreement requires under certain circumstances that additional subsidiaries of Acquisition Co may become Senior Guarantors under the Senior Facilities Agreement.
Intra-Group Loans Subordinated Shareholders� Loans consists in �157.75mn 7.57% subordinated loan notes due March 2015. The payment of principal and interest on the Subordinated Shareholders� Loans is subordinated in right of payment to the rights of the lenders under the Senior Credit Facility and the holders of the Notes.
Parent Loans Holdings has made a series of Inter Company Loans with an aggregate principal amount of approximately �165.5mn to Clondalkin. The Parent Loans mature after, and the notes are subordinated to, the Senior Credit Facility and the Notes, and is also pledged to the lenders under the Senior Credit Facility on a first priority basis.
Inter Company Loans � Clondalkin has made a series of Inter Company Loans to Acquisition Co. The Inter Company Loans are subordinated to the Senior Credit Facility and the Notes. Clondalkin grants a second priority pledge over the Inter company Loans. The intercompany Loans are also pledged to the lenders under the Senior Credit Facility on a first priority basis.
The 8% Senior Notes due 2014 are guaranteed on a senior subordinated basis by Acquisition Co and Clondalkin�s other subsidiaries which guarantee the Senior Credit Facility, and are also guaranteed on an unconditional and irrevocable basis by Holdings. The Notes are secured by second priority pledges by Clondalkin of Inter Company Loans and the shares of Acquisition Co. A second priority pledge of the Parent Loans and the shares of Clondalkin secures the Guarantee by Holdings. The Notes are general secured, senior obligations of Clondalkin. The Notes are structurally subordinated to all of the existing and future liabilities of its subsidiaries that do not guarantee the Notes.
Rick Deutsch +44 20 7595 8840 [email protected]

Clondalkin ⎪ January 2006
101 European High Yield Research
Clondalkin Structure
Warburg Pincus Funds(1) Management Investments(1)
Clondalkin Group HoldingsB.V.(2)(3)
Clondalkin Industries B.V.(3)
13% owned87% owned
�22.3 million ordinary and preference shares�157.8 million subordinated shareholders� loans
Clondalkin Acquisition B.V.(2)
100% owned
100% owned
Parent Loans(4)
Intercompany Loans(5)
Senior Credit Facility(6)
SeniorGuaranteeand PledgeSenior Guarantee and Pledge
�320.0 million
Guarantor Subsidiaries(2)(3) Non-Guarantor Subsidiaries
Senior Guarantees and Security
Notes�170.0 million
Senior Subordinated Guarantee
SeniorSubordinatedGuarantees
Senior Subordinated Guarantee
Second Priority Pledge(7)
Second Priority Pledge(8)
Source � Clondalkin, BNP Paribas
1. Approximately �165.7mn and approximately �14.3mn were invested in Holdings by the Warburg Pincus Funds through an affiliate and by management of the Target Group, respectively, in each case in the form of ordinary shares, preference shares and subordinated shareholders� loans, the cash proceeds of which will be loaned to Clondalkin. 2. Guarantors under the Notes (the ��Guarantors��). As of and for the year ended December 31, 2003, on a pro forma basis, the Guarantors accounted for approximately 94.5% of tangible assets, 92.8% of EBITDA and 93.8% of sales. 3. Guarantors under the Senior Credit Facility. With the exception of Clondalkin, the guarantors under the Senior Credit Facility are identical to those under the Notes. 4. Holdings will make a series of intercompany loans to Clondalkin (the ��Parent Loans��). 5. Clondalkin will make a series of intercompany loans to Acquisition Co (the ��Intercompany Loans��). 6. Senior facilities of �460.0mn were provided under the Senior Credit Facility and include a �40.0mn revolving credit facility and a �100.0 million acquisition facility, both of which we expect will be undrawn on the closing date of the Acquisition. 7. Holdings will grant a second priority pledge over the Parent Loans and the shares of Clondalkin. The Parent Loans and the shares of Clondalkin were also pledged to the lenders under the Senior Credit Facility on a first priority basis. 8. Clondalkin will grant a second priority pledge over the shares of Acquisition Co and the Intercompany Loans. The shares of Acquisition Co and the Intercompany Loans were also be pledged to the lenders under the Senior Credit Facility on a first priority basis.

Clondalkin ⎪ January 2006
102 European High Yield Research
Bond Covenant Bond description 8% Senior Notes 2014
Issuing entity Clondalkin Industries BV
Ranking Senior Notes
Position vs. bank debt Structurally Subordinated
Position vs. other bonds �
Security/guarantees Senior subordinated guarantees from certain subsidiaries (93% of EBITDA) and second priority pledge on the stock and inter company loans of the issuing entity
Optional redemption
! Make Whole � Bunds+50bp before 15 Mar 2008
! Equity Claw � 35% at par + coupon before 15 Mar 2007
! Call Schedule:
15 Mar 2008 � 105.333 15 Mar 2009 � 104.000 15 Mar 2010 � 102.667 15 Mar 2011 � 101.333 15 Mar 2012 � 100.000
Change of control Put at 101%, 35% of voting power owned by a third party and Warburg Pincus own less than the third party or majority of board cease to be continuing directors
Tax redemption Yes
Negative pledge Yes
Cross default Yes � on �10mn or more of other debt
Fall away covenants No
Anti-layering Yes
Debt limit Pro forma Fixed Charge Coverage of at least 2.0x Carve outs: ! None
Restricted payments
If company can raise �1 of debt then 50% net income less 100% net loss plus 100% of equity proceeds Carve outs: ! payments of dividends as allowed under the indenture;
! redemption of subordinated debt funded by equity or refinancing;
! repurchases of equity from management or employees up to �2.5mn per year, which can rollover up to a maximum of an additional �5mn in any one year;
! dividends following an IPO of up to 6% of IPO proceeds per year;
! general basket of �15mn.
Asset sales
Company can not sell assets unless: ! it receives at least fair market value;
! at least 75% of consideration in cash or equivalent;
! accumulated non-cash proceeds not to exceed 10% of total assets;
! must use proceeds within a year to pay down senior debt or purchase similar assets;
! if not, any excess proceeds above �10mn will be used to repay the notes.
Merger, consolidation, asset sales Company will not consolidate or merge with/into any person or sell substantially all its assets unless: ! surviving entity is organised laws of US or the EU;
! surviving entity can incur �1 of debt.
Transactions with affiliates Must be done on an arm�s length basis with approval from the board of directors for �1mn+ transactions and approval from an independent financial advisor for �10mn+ transactions
Source � Clondalkin, BNP Paribas

Clondalkin ⎪ January 2006
103 European High Yield Research
Clondalkin, Financial Model FYE 31 December Historic Historic Historic Historic Historic Historic Historic Historic Historic Historic Proj�d Proj�d P�FormaEUR mn FY 02 FY 03 Q1 04 Q2 04 Q3 04 Q4 04 FY 04 Q1 05 Q2 05 Q3 05 FY 05 FY 06 LTM PROFIT & LOSS
Group revenue 710.5 687.4 57.9 172.9 177.0 174.3 582.3 173.2 179.8 184.8 605.3 634.4 712.1 COGS -565.3 -551.2 -46.3 -139.5 -143.1 -140.8 -470.4 -141.2 -148.0 -151.2 -496.3 -507.5 -581.1 Gross profit 145.1 136.2 11.6 33.4 33.9 33.5 111.9 32.0 31.9 33.6 109.0 126.9 131.0 EBITDA 93.8 86.5 18.9 21.1 21.7 21.5 83.2 19.6 20.3 21.2 67.0 80.5 82.6 P&L Interest -45.5 -39.5 -3.4 -10.9 -10.9 -11.1 -36.4 -10.9 -11.0 -11.2 -36.9 -32.8 -44.1 Revenue growth y/y -3.2% 1.2% 0.6% 1.6% 2.7% -15.3% -0.2% 4.0% 4.4% 4.0% 4.8% Gross margin 20.4% 19.8% 20.0% 19.3% 19.2% 19.2% 19.2% 18.5% 17.7% 18.2% 18.0% 20.0% 18.4% EBITDA margin 13.2% 12.6% 10.9% 12.2% 12.3% 12.3% 14.3% 11.3% 11.3% 11.5% 11.1% 12.7% 11.6% CASH FLOW Cash interest -29.9 -22.2 -1.7 -4.6 -7.8 -0.6 -14.8 -16.0 -2.7 -7.8 -27.2 Change in working capital -0.8 -2.1 1.4 0.4 -5.2 20.1 16.7 -25.7 3.3 10.2 7.9 Cash from Operating Activities 58.2 49.6 6.0 14.9 8.2 39.5 68.6 -23.2 18.0 17.5 51.8 Capex -17.6 -21.3 -0.9 -4.3 -4.7 -5.0 -14.9 -8.2 -4.6 -7.6 -25.4 Acquisitions/Disposals 5.8 -5.0 -641.7 -2.8 -6.0 39.9 -610.6 0.1 -8.0 0.3 32.2 Cash from Investing Activities -11.7 -26.2 -642.7 -7.1 -10.7 34.8 -625.6 -8.2 -12.6 -7.4 6.8 Repayment of borrowings -47.6 -22.7 490.0 0.0 -5.0 -6.3 478.7 -15.0 0.0 0.0 -21.3 Cash from Financing Activities -47.6 -22.7 670.0 0.0 -5.0 -39.4 625.6 -14.9 -0.1 0.0 -54.5 Net Change in Cash -1.1 0.7 33.3 7.9 -7.5 34.9 68.6 -46.2 5.3 10.1 4.1 BALANCE SHEET Cash & Equivalents 42.6 41.7 33.3 41.4 33.5 68.5 68.5 22.9 29.0 39.0 39.0 Bank Debt 206.1 164.1 322.6 323.0 314.4 299.9 299.9 289.6 303.2 297.9 297.9 Bonds- HY 125.0 125.0 170.0 170.0 170.0 170.0 170.0 170.0 170.0 170.0 170.0 170.0 170.0 Deferred issue costs -4.4 -3.7 -20.1 -19.8 -19.3 -18.6 -18.6 -18.1 -17.6 -17.1 -17.1 Total Senior Debt 326.7 285.4 472.4 473.3 465.2 451.3 451.3 441.5 455.5 450.8 450.8 Net Senior Debt 284.0 243.8 439.1 431.8 431.7 382.8 382.8 418.7 426.5 411.8 404.2 386.2 411.8 Shareholders' loans incl. interest 176.7 195.1 180.6 183.6 179.5 186.5 186.5 189.8 193.0 196.3 200.3 264.2 196.3 Total Debt 503.4 480.5 653.1 656.9 644.7 637.8 637.8 631.4 648.5 647.1 647.1 Net Debt 460.8 438.9 619.8 615.5 611.2 569.3 569.3 608.5 619.5 608.1 604.5 650.4 608.1 RATIOS Coverage Cash Interest Coverage 3.1x 3.9x 11.0x 4.5x 2.8x 33.2x 5.6x 1.2x 7.6x 2.7x 3.0x Total Coverage 2.1x 2.2x 5.5x 1.9x 2.0x 1.9x 2.3x 1.8x 1.9x 1.9x 1.8x 2.5x 1.9x EBITDA- Capex/Interest 2.5x 2.9x 10.5x 3.6x 2.2x 25.5x 4.6x 0.7x 5.9x 1.7x 2.1x Leverage Bank Leverage (gross) 2.2x 1.9x 3.8x 3.9x 3.8x 3.6x 3.6x 3.5x 3.6x 3.6x 3.6x Senior Notes Leverage (gross) 1.3x 1.4x 2.0x 2.0x 2.0x 2.0x 2.0x 2.0x 2.0x 2.1x 2.5x 2.1x 2.1x Total leverage (gross) 5.4x 5.6x 7.8x 7.9x 7.8x 7.7x 7.7x 7.5x 7.8x 7.8x 0.0x 0.0x 7.8x Total leverage (net) 4.9x 5.1x 7.4x 7.4x 7.4x 6.8x 6.8x 7.3x 7.5x 7.4x 9.0x 8.1x 7.4x
Source � BNP Paribas, Clondalkin

CMA CGM ⎪ January 2006
104 European High Yield Research
CMA CGM Bond Description & Market Data, as of 5 January 2006
Next Call Issuer Credit Trend: Negative
Description Amount (o/s) Ratings Date Price Price YTW STW
9.875 % Senior Notes due 2013 EUR 100mn B1/BB+ 15-May-08 104.9375 118.00 3.82% 85bp
Source – BNP Paribas
Company Profile CMA CGM SA is a leading global provider of international container shipping and logistics services. As of July 2005, the company was the fifth largest seaway container carrier in the world, in terms of capacity. CMA CGM offers services on 69 main lines and 27 feeder routes, calling at 210 ports in 126 countries around the globe. The company services primarily the Asia-Europe, Mediterranean, Transpacific, Caribbean and Australasian markets. As of 30 September 2005, CMA CGM operated 191 container vessels with a total capacity of 409,358 twenty-foot equivalent units (TEUs), of which 50 were owned and 141 were chartered. Jacques R. Saade and the members of his immediate family directly and indirectly own approximately 97% of the company (Latest available data – as of 15 May 2003). On 5 September 2005, CMA CGM agreed to acquire 100% of the Delmas shipping group from Bollore Investissement. The acquisition is expected to close early in 2006 (please note that our forecasts for CMA CGM provided below assumes that the Delmas results are consolidated from the beginning of this year). The Delmas business should strengthen CMA CGM’s position in the African market. In the twelve months ended 30 September 2005, CMA CGM transported over 4.6mn TEUs, reporting revenues of €4,893mn and EBITDA of €634mn. At the end of the period, the company had lease-adjusted leverage of 4.8x and lease-adjusted coverage of 1.9x.
Investment Recommendation We maintain our HOLD/Negative Credit Trend recommendation for CMA CGM’s bonds. The notes are being redeemed at a make whole premium (relevant Bund+50 bp) at the moment. The targeted redemption date is 20 January 2006.
Debt Profile As of 30 September 2005, CMA CGM had total balance sheet debt of €1,578mn, comprising €536mn of bank borrowings, €861mn of capital leases, €15mn of bank overdrafts, €100mn of high yield notes and €66mn of other financial liabilities. As of that date, the company had €1,099mn of cash and cash equivalents on its balance sheet. Tax Lease Ship Financing Several of the company’s subsidiaries lease ships pursuant to agreements that have been put in place as part of financing structures designed to take advantage of certain benefits under the tax laws of the United Kingdom or France. These benefits are granted to the lessor of the ships in question, but are also in part passed on to the company’s subsidiaries that are parties to the relevant lease agreements in the form of reduced lease rentals and, in some instances, reduced purchase price option. Bank Overdrafts The company and certain of its consolidated subsidiaries have overdraft facilities pursuant to either written or oral agreements with a variety of commercial banks. Container Lease Financing CMA CGM typically finances the acquisition of containers using finance leases, arranged either by the company or by its special purpose container leasing entities. The company usually enters into six- to 10-year leases and typically has an option to purchase the containers at the end of the lease period for a nominal sum. €130mn Receivables Securitization Programme CMA CGM and its wholly owned subsidiary CGM Antilles-Guyane S.A. are parties to the receivables securitisation agreement of up to €130mn (we understand it was fully utilised as of the last balance sheet date).
Oleksiy Soroka, CFA +44 20 7595 4878 [email protected]

CMA CGM ⎪ January 2006
105 European High Yield Research
CMA CGM Structure
CMA CGM S.A.
ANL Container LinePty Ltd.
CGM Antilles-Guyane S.A.(Limited guarantee)(1) Non-guarantor subsidiaries
9.875% Senior Notesdue 2013(€100.0mn)
Subsidiaries of CMA CGM S.A. that have guaranteed the 2013 notes, or the subsidiary guarantors
CMA CGM S.A.
ANL Container LinePty Ltd.
CGM Antilles-Guyane S.A.(Limited guarantee)(1) Non-guarantor subsidiaries
9.875% Senior Notesdue 2013(€100.0mn)
Subsidiaries of CMA CGM S.A. that have guaranteed the 2013 notes, or the subsidiary guarantors
Source – CMA CGM
1. The liability of CGM AG under its Guarantee is limited to the net income of CGM AG as stated in its statutory accounts (comptes sociaux) for the last completed fiscal year for which audited annual statutory accounts of CGM AG are available prior to the year in which its Guarantee is first called.

CMA CGM ⎪ January 2006
106 European High Yield Research
Bond Covenant Bond description EUR 100mn 9.875% Senior Notes due 2013
Issuing entity CMA CGM S.A.
Ranking Senior Notes
Position vs. bank debt Pari passu (with the new revolving bank facility)
Position vs. other bonds Not applicable
Guarantees and security
CGM Antilles-Guyane S.A. and ANL Container Line Pty Ltd. will each provide an unconditional guarantee of the Notes on a senior basis. ANL will fully and unconditionally guarantee all amounts payable under the Notes. CMA CG also guarantees all amounts payable under the Notes, although the liability of CGM AG under the Guarantee will be limited to the net income of CGM AG for the last fiscal year completed prior to the year in which the Guarantee is first called.
Tax redemption Yes – at par
Anti-layering Yes
Cross default Yes – on over €20mn of other debt
Ranking
The Notes are general unsecured obligations and are: senior in right of payment to subordinated indebtedness; equal in right of payment with the unsubordinated and unsecured indebtedness; effectively subordinated to the secured indebtedness to the extent of the assets
securing such indebtedness; structurally subordinated to all of the Issuer’s Subsidiaries’ (other than the Subsidiary
Guarantors’, to the extent of the Guarantees) existing and future indebtedness. The Guarantees are general unsecured obligations of the Subsidiary Guarantors and are: senior in right of payment to all of the Subsidiary Guarantors’ subordinated
indebtedness; equal in right of payment with all of the Subsidiary Guarantors’ unsubordinated and
unsecured indebtedness; effectively subordinated to all of the Subsidiary Guarantors’ future secured
indebtedness to the extent of assets securing such indebtedness; and structurally subordinated to all of the Subsidiary Guarantors’ Subsidiaries’ existing and
future indebtedness.
Position within capital structure Effectively subordinated to secured ship financing indebtedness.
Optional redemption
Call Schedule
During the twelve-month period starting: 15 May 2008 104.9375% 15 May 2009 103.2917% 15 May 2010 101.6458% 15 May 2011 and thereafter 100.0000%.
Make-Whole
At any time prior to 15 May 2008, at a redemption price of 100% f the principal amount plus the Applicable Premium (calculated at Bund+50bps).
Equity Clawback
Prior to 15 May 2006, up to 35% of the notes at a redemption price of 109.875%.
Restricted payments
If the company can raise €1 of addition debt, then: 50% of our aggregate Consolidated Adjusted Net Income on a cumulative basis during
the period beginning on January 1, 2003 and ending on the last day of our last fiscal quarter ending prior to the date of such proposed Restricted Payment (or, if such aggregate cumulative Consolidated Adjusted Net Income shall be a negative number, minus 100% of such negative amount); plus
General basket of €15mn; The repurchase of capital stock in connection with the employee stock option
agreements of up to €6mn in the aggregate; Another general basket of €5mn.
Source – BNP Paribas, CMA CGM

CMA CGM ⎪ January 2006
107 European High Yield Research
Bond Covenant Bond description EUR 100mn 9.875% Senior Notes due 2013
Limitation on debt
Debt is permitted up to 2.5x Fixed Charge Coverage Ratio. Carve outs: Indebtedness under Credit Facilities of up to €50mn, minus the amount of any
permanent repayments of such with proceeds from Asset Sales; Capital Lease Obligations of up to €100mn; Indebtedness related to the specified vessel and container investment programme
(eight 5,500 TEU vessels, two 5,700 TEU vessels, four 2,200 TEU vessels, one 8,100 TEU vessel and 36,000 TEU containers);
Debt arising out of employment litigations; Overdrafts if extinguished within 15 business days; Permitted Receivables Financing not to exceed 30% of Total Receivables at the time
of such incurrence; Debt in relation to scheduled dry-docking of owned vessels and any expenditures
which are expected to be recoverable from insurance on such vessels; Debt in relation to guarantees required by the US Federal Maritime Commission; Debt in relation to guarantees required to Liens asserted by third parties pursuant to
ship arrests; Debt in relation to a vessel owned at the time of the Indenture and lost under special
circumstances (destruction, confiscation, requisition, etc); General basket of up to €30mn.
Limitation on asset Sales
Asset Sale is not permitted unless: (a) the consideration received for such Asset Sale is not less than the Fair Market Value of the assets sold (as determined by the supervisory board or, in the case of any Asset Sale having a Fair Market Value greater than €10mn, as determined by the supervisory board and evidenced by a resolution of the supervisory board); (b) at least 75% of the consideration received consists of cash or equivalent is used for debt reduction. If the issuer or any Restricted Subsidiary engages in an Asset Sale, the Net Cash Proceeds of the Asset Sale, within 360 days after such Asset Sale, may be used by us or such Restricted Subsidiary to: (a) permanently repay or prepay debt; (b) invest in properties and assets. The amount of such Net Cash Proceeds not used for (a) or (b) constitutes ‘‘Excess Proceeds.’’ When the aggregate amount of Excess Proceeds exceeds €35mn, the issuer will, within 20 business days, make an offer to purchase from all holders of Notes and from the holders of any Pari Passu Debt, to the extent required by the terms thereof, on a pro rata basis.
Source – BNP Paribas, CMA CGM

CMA CGM ⎪ January 2006
108 European High Yield Research
Bond Covenant Bond description EUR 100mn 9.875% Senior Notes due 2013
Limitation on transactions with affiliates
All transactions with affiliates should be made in good faith and on an arm’s-length basis and: for transactions involving an aggregate value greater than €1mn, the issuer will deliver
an Officers’ Certificate to the trustee certifying that such transaction is fair for transaction involving an aggregate value of €5mn or greater a resolution of the
issuer’s supervisory board and ratification by shareholders at AGM are required; for transactions involving an aggregate value of €10mn a written opinion of an
investment banking or accounting firm of international standing is required. Carve-outs: management and employee remuneration; permitted restricted payments and investments (as defined in the respective
covenants); loans, advances and guarantees of third party loans to employees in the aggregate
amount not to exceed €5mn at any time outstanding; agreements and arrangements existing at the date of the Indenture where transactions
with value in excess of €5mn need to be approved by the Supervisory Board; payments or other agreements for the purposes of tax sharing; issuance of securities for the purposes of the funding of employment arrangements,
such as stock options; permitted Investments in Qualified Minority Entities; transactions made in connection with Permitted Receivables Financing.
Limitation on liens Yes
Change of control Put at 101%
Fall away covenants Yes
Source – BNP Paribas, CMA CGM

CMA CGM ⎪ January 2006
109 European High Yield Research
CMA CGM, Financial Model BNPP BNPP BNPP BNPP BNPP FYE 31 December Actual Actual Actual Actual Actual Actual F’cast F’cast F’cast F’cast F’cast EUR ‘000 2002 2003 2004 Q1 05 Q2 05 Q3 05 Q4 05 2005 2006 2007 2008 P&L SUMMARY Freight revenue 1,986,250 2,483,588 3,363,506 880,867 1,044,368 1,083,686 1,109,576 4,118,497 5,145,594 5,596,225 6,623,520 % change 11.2% 25.0% 35.4% 32.7% 26.3% 20.7% 13.9% 22.4% 53.0% 8.8% 18.4% Sale of slots 204,598 163,795 165,783 66,910 71,596 76,833 71,364 286,703 198,940 202,918 206,977 % change 7.5% -19.9% 1.2% 43.5% 534.3% 37.3% 37.5% 72.9% 20.0% 2.0% 2.0% Land and river transport revenues 217,085 255,303 259,748 63,152 58,346 113,664 102,320 337,482 311,698 327,282 343,647 % change 45.3% 17.6% 1.7% -13.0% 0.2% 261.2% 5.0% 29.9% 20.0% 5.0% 5.0% Container hire and other revenues 103,850 120,254 223,147 86,290 71,558 59,984 97,976 315,808 245,462 257,735 270,622 % change 15.8% 85.6% 448.0% -12.5% 76.0% 7.0% 41.5% 10.0% 5.0% 5.0% Total operating revenue 2,511,783 3,022,940 4,012,184 1,097,219 1,245,868 1,334,167 1,381,236 5,058,490 5,901,692 6,126,426 7,174,143 % change 12.2% 20.4% 32.7% 37.4% 27.4% 30.8% 13.6% 26.1% 47.1% 3.8% 17.1% Purchases of supplies -298,301 -355,524 -435,229 -142,046 -169,080 -170,571 -212,020 -693,717 -976,858 -1,056,191 -1,182,248% of freight revenue 15.0% 14.3% 10.8% 16.1% 16.2% 15.7% 15.4% 13.7% 16.6% 17.2% 16.5% Chartering expenses -392,018 -491,419 -702,735 -172,705 -169,229 -215,371 -223,070 -780,375 -821,753 -934,609 -1,077,363% of operating revenue 15.6% 16.3% 17.5% 15.7% 13.6% 16.1% 16.2% 15.4% 13.9% 15.3% 15.0% Port call expenses -863,261 -941,615 -1,118,658 -287,531 -339,513 -364,103 -406,083 -1,397,230 -1,622,965 -1,666,388 -1,944,193% of operating revenue 34.4% 31.1% 27.9% 26.2% 27.3% 27.3% 29.4% 27.6% 27.5% 27.2% 27.1% Other external services -576,967 -659,217 -888,138 -242,102 -293,144 -299,570 -305,253 -1,140,069 -1,327,881 -1,372,319 -1,603,421% of operating revenue 23.0% 21.8% 22.1% 22.1% 23.5% 22.5% 22.1% 22.5% 22.5% 22.4% 22.4% Taxes other than on income -7,998 -12,827 -23,801 -6,745 -6,652 -9,436 -12,000 -34,833 -35,000 -35,000 -35,000 Personnel costs -191,618 -238,297 -301,100 -91,594 -97,435 -99,535 -111,880 -400,444 -457,381 -471,735 -545,235 % of revenue 7.6% 7.9% 7.5% 8.3% 7.8% 7.5% 8.1% 7.9% 7.8% 7.7% 7.6% Total depreciation and amortisation -64,413 -80,652 -89,346 -28,200 -30,601 -33,010 -34,750 -126,561 -240,305 -286,009 -312,808 Additions to reserves and allowances,net of reversales -18,581 6,666 -5,066 -247 -2,985 -634 -1,250 -5,116 0 0 0 Equity in net loss of non-consolidatedjoint ventures 7,071 9,927 5,750 1,248 5,341 -5,145 500 1,944 0 0 0
Total operating expenses -
2,406,086 -
2,762,958 -
3,558,323 -969,922 -
1,103,298 -
1,197,375 -
1,305,806 -
4,576,401 -
5,482,143 -
5,822,251 -
6,700,267 Operating income before relocationcosts 105,697 259,982 453,861 127,297 142,571 136,792 75,430 482,090 419,550 304,175 473,876 % of operating revenue 4.2% 8.6% 11.3% 11.6% 11.4% 10.3% 5.5% 9.5% 7.1% 5.0% 6.6% Relocation costs -55 0 0 0 0 0 0 0 0 0 0 Operating income after relocationcosts 105,642 259,982 453,861 127,297 142,571 136,792 75,430 482,090 419,550 304,175 473,876 % of operating revenue 4.2% 8.6% 11.3% 11.6% 11.4% 10.3% 5.5% 9.5% 7.1% 5.0% 6.6% EBITDA 170,055 340,634 543,207 155,497 173,171 169,802 110,180 608,650 659,855 590,184 786,684 % of revenue 6.8% 11.3% 13.5% 14.2% 13.9% 12.7% 8.0% 12.0% 11.2% 9.6% 11.0% EBITDAR 562,073 832,053 1,245,942 328,202 342,400 385,173 333,250 1,389,025 1,481,607 1,524,793 1,864,047 % of revenue 22.4% 27.5% 31.1% 29.9% 27.5% 28.9% 24.1% 27.5% 25.1% 24.9% 26.0% Interest expense, net -62,295 -43,770 -30,929 2,416 6,474 28,632 1,750 9,240 0 0 0 Income before other inc, inc tax,minorities & goodwill 43,347 216,212 422,932 129,713 149,045 165,424 77,180 491,330 419,550 304,175 473,876 Other income and expense, net 9,755 11,841 7,284 540 905 878 850 3,173 0 0 0 Income taxes -7,508 -17,841 -11,186 -2,032 -11,870 -17,494 -8,193 -39,589 -41,955 -38,022 -71,081 effective tax rate 14.1% 7.8% 2.6% 1.6% 7.9% 10.5% 10.5% 8.0% 10.0% 12.5% 15.0% Net inc before inc from assoc,goodwill amort & minority int. 45,594 210,212 419,030 128,221 138,080 148,808 69,837 454,913 377,595 266,153 402,795 CASH FLOW ITEMS EBITDA 170,055 340,634 543,207 155,497 173,171 169,802 110,180 608,650 659,855 590,184 786,684 Net cash interest -62,295 -43,770 -18,820 -9,183 19,641 19,574 20,500 50,532 -39,004 -54,612 -65,133 Cash taxes -7,508 -17,841 -11,186 -2,032 -11,870 -17,494 -8,193 -39,589 -41,955 -38,022 -71,081 Change in working capital -60,645 9,387 61,345 -9,817 73,203 52,693 0 116,079 -21,845 -83,924 -98,276 Other operating cash items 106,317 -7,342 -4,598 13,946 16,541 11,540 0 42,027 0 0 0 Net operating cash flow 145,924 281,068 569,948 148,411 270,686 236,115 122,487 777,699 557,051 413,627 552,193 Total Capex -326,334 -371,171 -506,252 -122,067 -154,101 -273,511 -204,864 -754,543 -938,234 -743,813 -631,350 Free Cash Flow -180,410 -90,103 63,696 26,344 116,585 -37,396 -82,377 23,156 -381,183 -330,186 -79,157 BALANCE SHEET ITEMS Cash Position 190,683 400,816 608,168 661,219 756,614 1,099,187 1,126,411 1,126,411 1,002,951 1,113,023 1,548,786 Total Debt 725,298 899,591 1,044,453 1,103,482 1,162,171 1,578,446 1,578,446 1,578,446 2,098,693 2,473,369 2,988,289 Net Debt 534,615 498,775 436,285 442,263 405,557 479,259 452,035 452,035 1,095,742 1,360,346 1,439,502 CREDIT RATIOS Total debt / EBITDA 4.3x 2.6x 1.9x 1.8x 1.8x 2.5x 2.6x 2.6x 3.2x 4.2x 3.8x Net debt / EBITDA 3.1x 1.5x 0.8x 0.7x 0.6x 0.8x 0.7x 0.7x 1.7x 2.3x 1.8x Adjusted Net Debt (x8) / EBITDAR 6.7x 5.4x 4.9x 4.7x 4.7x 4.8x 4.9x 4.9x 5.3x 5.9x 5.5x EBITDAR / (Net interest expense +Net rental expense) 1.2x 1.6x 1.7x 1.4x 2.0x 1.9x 1.8x 1.8x 1.8x 1.6x 1.7x
Source – BNP Paribas Estimates, CMA CGM Leverage and Coverage are based on the last 12 months’ results. Some of the ratios are adjusted for the effects of acquisitions and disposals. In addition, these 2 measures are usually calculated based on EBITDA adjusted for exceptional or non-recurring items. Leverage is defined as net lease-adjusted debt (x8 operating leases)-to-EBITDAR. Coverage is defined as EBITDAR-to-(net interest+rental expenses).

Codere ⎪ January 2006
110 European High Yield Research
Codere Bond Description & Market Data, as of 5 January 2006
Next Call Issuer Credit Trend: Positive
Description Amount (o/s) Ratings Date Price Price YTW STW
8.25% Senior Notes due 2015 EUR 335mn B2/B 15-Jun-10 104.125 107.00 7.06% 378bp
Source – BNP Paribas
Company Profile As of 30 September 2005, Codere managed approximately 34,000 slot machines, 87 bingo halls, 39 off-track betting facilities, two horse racing tracks and two casinos (as well as financial interests in four others) in Spain, Latin America and Italy. The company focuses on gaming activities oriented towards the local resident population rather than the more capital intensive tourist oriented casinos and gaming facilities. In Spain, Codere is the second largest operator of amusement with prize machines (AWP), with machines installed in over 8,600 bars, restaurants and nightclubs, and also operates the largest bingo hall in continental Europe. In Mexico, through joint venture agreements, the company is the largest operator of gaming sites with 35 off-track betting sites and 54 bingo halls. Following the 23 June 2005 acquisition of over 95% of Grupo Royal, the owner of six bingo halls and 1,800 slot machines in Buenos Aires, Codere is the industry leader in the bingo and slot machine markets in Argentina’s Buenos Aires province with 14 bingo halls and 3,261 slot machines. In addition, Codere had completed the acquisition of Operbingo, the owner and operator of bingo halls in Italy, in December 2005. The primary shareholders of Codere SA are the Franco brothers Jesus and Joaquin (41.58%), members of the Sampedro family (35.19%), private equity firm Intermediate Capital Investment Ltd. (2.55%), plus Treasury Shares (8.54%). For the twelve months ended 30 September 2005, Codere generated turnover of €479.8mn and EBITDA of €93.7mn. We estimate that at the end of the period, the company had leverage of 3.9x and coverage of 2.4x.
Investment Recommendation We maintain our BUY/Positive Credit Trend recommendation for Codere’s 7.75% senior notes due 2015. Our recommendation assumes a long investment horizon, as we do not expect that the bonds will tighten further in the near term. We note that our favourable recommendation is based on our positive assessment of the bingo hall and slot machine business Codere is pursuing, our expectation that an initial public offering (IPO) of the company’s shares will take place some time in 2006 and on our forecast that the company’s operating performance will continue to be positive during that year. We also recognise that Codere’s maintenance capital expenditure needs are relatively modest and, therefore, the company is in a good position to generate material free cash flow, should it forgo any expansionary investments or refrain from acquisitions. We also note positively that there is a limited amount of priority debt ahead of the bonds at this point. Finally, we recognise Codere’s leading market positions in the Spanish slot-machine market and in the Mexican and Argentine bingo markets.
While we have eventually assigned a favourable rating to Codere’s bonds, we believe that we have a somewhat contrarian view regarding the company. We remark that the credit is subject to multiple hidden risks, which we believe the market is taking somewhat lightly. In our view, the main risks are as follows: (1) Codere may have to buy out minority shareholders at a predetermined price; (2) the company may have to pay cash as a result of the unfavourable outcomes of the current litigations and tax disputes; (3) Codere may fail to renew some of its licenses; (4) importantly, the company may be unable to upstream cash from its Latin American operations; or (5) relationships with its Latin American business partners may turn sour. In our recommendation we assume that none of the above will come to pass or will have a material effect on the company’s operations or leverage measures. However, some unpleasant surprises may indeed happen respect of the aforementioned risk factors.
Oleksiy Soroka, CFA +44 20 7595 4878 [email protected]
Codere ⎪ January 2006
111 European High Yield Research
Debt Profile As of 30 September 2005, Codere, S.A. had total debt of €367.7mn, comprised of €23.4mn of short-term debt, €335mn of high yield notes and €9.3mn of other long-term debt. Codere, S.A. also had €39.4mn of cash and €30mn in short-term financial investments as of the same date.
8.25% Senior Notes 2015
On June 16, 2005, the wholly owned subsidiary Codere Finance issued €335mn 8.25% Senior Notes with the proceeds going toward (i) debt repayments and (ii) financing for the acquisition of Grupo Royal in Argentina. The Notes mature on 15 June 2015 and are guaranteed by Codere, S.A. and by a second-ranking pledge over the issued share capital of Codere Espana, S.L.U. and Codere Internacional, S.L.U.
Senior Credit Facilities In conjunction with its Senior Notes offering, Codere also entered into a €45mn senior credit facility and a €30mn senior performance bond facility. The senior credit facility is a revolving term facility with an interest rate of EURIBOR plus 1.75%. The senior performance bond facility is a revolving credit facility to be used as open-ended performance bonds issued in favour of Spanish gaming authorities in the ordinary course of business. Both facilities have a scheduled final maturity date of three years, renewable for two additional one-year periods. Codere, S.A. will be the borrower under the senior credit facilities, which are in turn secured by a first ranking pledge over the issued share capital of Codere Espana, S.L.U. and Codere Internacional, S.L.U. No amounts had been drawn down under the senior credit facility as of 30 September 2005.

Codere ⎪ January 2006
112 European High Yield Research
Codere Structure
Codere, S.A. (1)
Codere Finance (Luxembourg) S.A.
Codere EspaňaS.L.U. (4)
CodereInternacional, S.L.U.
(5)
€75 million Senior Credit Facilities (2)
€335 million Senior Notes
Funding Loan (3)
Latin American Non-Guarantor
Subsidiaries
Latin American Subsidiary
Guarantors (7)
Spanish Subsidiary
Guarantors (6)
Spanish Non-Guarantor
Subsidiaries
Senior Subordinated Guarantees
Source – Codere
1. Codere, S.A. provides a senior guarantee of the Notes and is the borrower under the senior credit facilities. 2. The senior credit facilities include a €45 million senior credit facility and a €30 million senior performance bond facility. 3. The proceeds of the offering of the Notes were lent to Codere, S.A. pursuant to the funding loan, which was assigned by way of security to secure the obligations of the Issuer under the Notes on a first- ranking basis. 4. Codere Espana, S.L.U. provides a senior guarantee of the senior credit facilities. The shares of Codere Espana, S.L.U. have been pledged to secure the obligations of (i) Codere, S.A. under the senior credit facilities on a first-ranking basis and (ii) the Issuer under the Notes and Codere, S.A. under its Parent Guarantee of the Notes on a second-ranking basis. 5. Codere Internacional, S.L.U. provides a senior guarantee of the senior credit facilities. The shares of Codere Internacional, S.L.U. have been pledged to secure the obligations of (i) Codere, S.A. under the senior credit facilities on a first-ranking basis and (ii) the Issuer under the Notes and Codere, S.A. under its Parent Guarantee of the Notes on a second-ranking basis. 6. The Spanish Subsidiary Guarantors provide senior guarantees of the senior credit facilities and guarantees of the Notes that rank behind and are subordinated (on a senior subordinated basis) pursuant to the Intercreditor Agreement to all obligations of such Subsidiary Guarantor under Credit Facilities, including the senior credit facilities, and certain hedging obligations of such Subsidiary Guarantor. 7. The Latin American Subsidiary Guarantors provide senior guarantees of the senior credit facilities and guarantees of the Notes that rank behind and are subordinated (on a senior subordinated basis) pursuant to the Intercreditor Agreement to all obligations of such Subsidiary Guarantor under Credit Facilities, including the senior credit facilities, and certain hedging obligations of such Subsidiary Guarantor.

Codere ⎪ January 2006
113 European High Yield Research
Bond Covenant Bond description EUR 335mn 8.25% Senior Notes Due 2015
Issuing entity Codere Finance (Luxembourg) S.A.
Ranking Senior Notes
Position vs. bank debt Contractually subordinated
Position vs. other bonds Not applicable
Security/Guarantees
The Notes will be secured by first priority liens over the Funding Loan Agreement and by second priority liens over the shares of Codere Espańa, S.L.U. and Codere Internacional, S.L.U. The obligations of Codere S.A. under the parent guarantee and the indenture will also be secured by second priority liens over the share collateral.
Because of uncertainty under Spanish law as to the enforceability of second priority liens, the intercreditor agreement and any security agreements entered into relating to the share collateral will provide, among other things, that the holders of the Notes and other creditors secured by a lien on such shares will have pari passu security interests as a matter of Spanish law; however, the right to receive distributions upon any foreclosure or other disposition of such assets will be structured so as to give effect to the subordination of the lien securing the Notes.
Optional redemption
Make Whole – prior to 15 June 2010 at bunds + 50bp
Equity Claw – prior to 15 June 2008 max 35% of issue at 108.25%
Call Schedule:
15 June 2010 – 104.125%
15 June 2011 – 102.750%
15 June 2012 – 101.375%
15 June 2013 and thereafter – 100.000%
Tax redemption Yes – at par
Negative pledge Yes – limitation on liens
Cross default Yes – on €10mn or more of other debt.
Fall away covenants No
Anti-layering Yes
Change of control Put at 101%
Asset sales
Asset Sales are transactions with a fair value equal or in excess of €5.0mn.
Codere S.A. and its restricted subsidiaries may not sell assets unless:
They receive a fair market value for the assets or equity interests;
The fair market value is evidenced by a resolution of the Board of Directors set forth in an officer’s certificate delivered to the trustee;
At least 75% of the consideration received in the form of cash, cash equivalents, long-term assets or any combination thereof.
Debt limit
Debt is permitted up to 3.0x pro forma coverage.
Carve outs:
Incurrence of additional debt under credit facilities of up to €100mn less the aggregate amount of net proceeds of asset sales applied to repay any term debt or revolving credit under a credit facility;
CLOs in an aggregate principal amount outstanding not to exceed €15mn;
Debt incurred by any restricted group member (other than the issuer or a subsidiary guarantor) cannot exceed €10mn;
Additional debt incurred by any guarantor or additional public debt incurred by the issuer cannot exceed €25mn.
Source – BNP Paribas, Codere

Codere ⎪ January 2006
114 European High Yield Research
Bond Covenant Bond description EUR 335mn 8.25% Senior Notes Due 2015
Restricted payments
If the company can incur at least €1.00 of additional debt then 50% net income less 100% net loss.
Carve outs:
Payments in connection with the possible acquisition of Operbingo, S.p.A. and the acquisition of Grupo Royal (including payments made by way of a dividend paid by a Grupo Royal entity in connection with such an acquisition;
General basket of €15mn.
Transactions with affiliates
Must be on fair terms;
For transactions involving aggregate consideration in excess of €5.0mn, a resolution of the Board of Directors is required;
For transactions involving aggregate consideration in excess of €10.0mn, an opinion is required from an accounting, appraisal or investment banking firm stating that the transaction is fair from a financial point of view.
Source – BNP Paribas, Codere

Codere ⎪ January 2006
115 European High Yield Research
Codere, Financial Model Spanish GAAP Actual Actual Actual Actual Actual Actual BNPP BNPP BNPP BNPP BNPP EUR mn Forecast Forecast Forecast Forecast ForecastFYE 31 December 2002 2003 2004 Q1 2005 Q2 2005 Q3 2005 Q4 2005 2005 2006 2007 2008
P&L SUMMARY Segmental Revenue Spain AWP 145.3 145.2 148.7 39.3 41.1 38.2 41.5 160.2 168.2 173.2 178.4 % change -0.1% 2.4% 5.1% 7.3% 9.5% 9.0% 7.7% 5.0% 3.0% 3.0% Spain Bingo 79.6 86.8 88.5 22.8 21.3 18.5 20.2 82.8 81.1 82.3 84.0 % change 9.0% 2.0% -2.6% -2.3% -11.4% -10.0% -6.5% -2.0% 1.5% 2.0% Mexico 37.7 30.8 34.5 9.8 9.3 12.6 8.1 39.9 43.8 47.3 49.7 % change -18.3% 12.0% 12.6% -17.0% 55.9% 25.0% 15.5% 10.0% 8.0% 5.0% Argentina 45.9 51.4 59.1 18.9 19.0 63.4 40.8 142.1 229.3 245.2 260.6 % change 12.0% 15.0% 22.7% 28.4% 289.1% 223.4% 140.4% 61.4% 6.9% 6.3% Other Operations 36.9 37.8 63.7 17.8 21.1 22.6 39.6 101.0 272.5 292.9 311.1 % change 2.4% 68.5% 33.8% 55.9% 57.7% 75.4% 58.6% 169.7% 7.5% 6.2% Corporate Overhead 0.8 0.0 0.7 0.3 1.1 0.5 0.5 2.4 2.0 2.0 2.0 Discontinued Operations 7.6 0.0 0.0 0.0 0.0 0.0 0.0 0.0 0.0 0.0 0.0 Operating revenue 353.8 352.0 395.2 108.9 112.9 155.9 150.7 528.3 796.9 843.0 885.9 % change -17.4% -0.5% 12.3% 10.9% 13.2% 64.4% 47.5% 33.7% 50.9% 5.8% 5.1%
528.3
SEGMENTAL EBITDA Spain AWP 36.9 40.0 41.5 11.5 11.9 9.7 12.9 45.9 48.3 49.7 51.2 % of operating revenue 25.4% 27.5% 27.9% 29.3% 29.0% 25.3% 31.0% 28.7% 28.7% 28.7% 28.7% Spain Bingo 1.3 2.9 3.7 1.1 0.9 0.9 1.2 4.1 3.9 4.0 4.0 % of operating revenue 1.6% 3.3% 4.2% 4.8% 4.2% 4.9% 5.8% 4.9% 4.8% 4.8% 4.8% Mexico 23.9 15.7 18.7 4.2 3.5 6.6 3.7 17.9 19.7 21.3 22.4 % of operating revenue 63.4% 51.0% 54.2% 42.9% 37.6% 52.1% 45.0% 45.0% 45.0% 45.0% 45.0% Argentina 10.8 9.6 14.6 5.2 5.4 19.2 7.9 37.7 65.5 69.9 74.2 % of operating revenue 23.5% 18.7% 24.7% 27.5% 28.4% 30.2% 19.4% 26.5% 28.5% 28.5% 28.5% Other Operations 11.2 10.1 12.7 1.9 3.6 2.1 2.1 9.7 17.6 25.3 27.9 % of operating revenue 30.4% 26.7% 19.9% 10.7% 17.1% 9.3% 5.2% 9.6% 6.5% 8.6% 9.0% Corporate Overhead -6.5 -8.2 -8.9 -3.5 -4.0 -4.1 -5.0 -16.6 -20.0 -20.0 -20.0 Discontinued Operations -1.4 0.0 0.0 0.0 0.0 0.0 0.0 0.0 0.0 0.0 0.0 EBITDA 76.2 70.1 82.3 20.4 21.3 34.3 22.7 98.7 135.0 150.1 159.7 % of operating revenue 21.5% 19.9% 20.8% 18.7% 18.9% 22.0% 15.0% 18.7% 16.9% 17.8% 18.0%
CASH FLOW ITEMS Operating profit 51.1 48.4 54.1 12.7 12.5 23.7 14.9 63.7 97.9 111.2 118.3 Depreciation and amortisation 24.3 21.7 26.3 7.5 8.3 9.7 9.7 35.2 37.0 39.3 41.5 Non-operating expenses -3.2 -4.0 -9.4 -1.1 -4.4 -0.9 0.0 -6.4 -5.0 -5.0 -5.0 Non-operating income that represents cash movements 2.3 5.6 3.0 0.2 0.4 1.4 0.0 2.0 2.0 2.0 2.0 Change in working capital 0.8 -4.5 -5.8 3.0 2.9 -3.3 -5.0 -2.4 -3.0 -3.0 -3.0 Corporate income tax -12.7 -10.0 -10.3 -3.6 -2.5 -5.6 -1.7 -13.4 -25.4 -32.0 -35.5 Cash flow from operating and non-operating activities (before interest) 62.6 57.2 57.9 18.7 17.2 25.0 17.9 78.7 103.4 112.5 118.3 Interest income 3.0 4.6 3.0 1.1 1.2 0.8 1.5 4.6 3.0 3.0 3.0 Interest expenses -10.4 -14.1 -14.8 -1.3 -27.6 -0.6 -8.0 -37.5 -30.3 -29.2 -28.3 Operating cash flow after interest payments 55.2 47.7 46.1 18.5 -9.2 25.2 11.4 45.8 76.1 86.3 92.9 Capital expenditures -36.9 -42.0 -43.7 -13.5 -16.1 -16.6 -15.0 -61.2 -55.0 -45.0 -45.0 Free cash flow 18.3 5.7 2.4 5.0 -25.3 8.6 -3.6 -15.4 21.1 41.3 47.9
BALANCE SHEET ITEMS Cash 26.8 34.3 39.4 35.7 35.7 32.1 43.4 81.3 Cash equivalents 30.0 30.0 30.0 30.0 30.0 30.0
Short-term debt 24.6 16.4 23.4 23.4 23.4 18.4 13.4 8.4 Revolver (total availability of EUR45mn) 0.0 0.0 0.0 0.0 0.0 0.0 0.0 0.0 Performance bond facility (total availability of EUR35mn)
0.0 0.0 0.0 0.0 0.0 0.0 0.0 0.0
Mezzanine loan facility 151.4 0.0 0.0 0.0 0.0 0.0 0.0 0.0 High yield notes 0.0 335.0 335.0 335.0 335.0 335.0 335.0 335.0 Other long-term debt 27.3 10.2 9.3 53.2 53.2 33.2 8.2 3.2 Total long-term debt 178.7 345.2 344.3 388.2 388.2 368.2 343.2 338.2 Total debt 203.3 361.6 367.7 411.6 411.6 386.6 356.6 346.6 Net debt 176.5 327.3 298.4 345.9 345.9 324.5 283.2 235.3
MCP Instrument 57.0 58.3 61.1
CREDIT RATIOS Total debt/EBITDA 1.9x 3.2x 3.9x 4.2x 4.2x 2.9x 2.4x 2.2x Net debt/EBITDA 1.7x 2.9x 3.2x 3.5x 3.5x 2.4x 1.9x 1.5x
EBITDA/Net interest expense 2.7x 4.9x 5.7x 6.3x
Source – BNP Paribas Estimates, Codere Leverage and Coverage are based on the last 12 months’ results. Some of the ratios are adjusted for the effects of acquisitions and disposals. In addition, these 2 measures are usually calculated based on EBITDA adjusted for exceptional or non-recurring items. Leverage is defined as net lease-adjusted debt (x8 operating leases)-to-EBITDAR. Coverage is defined as EBITDAR-to-(net interest+rental expenses).

Cognis ⎪ January 2006
116 European High Yield Research
Cognis Bond Description & Market Data, as of 5 January 2006
Next Call Issuer Credit Trend: Stable
Description Amount (o/s) Ratings Date Price Price YTW STW
EB+4.75% 2nd Lien FRNs due 2013 EUR 235mn B2/B- Anytime 104.000 102.5 6.80% 361bp 9.5% Sr Nts due 2014 EUR 345mn B3/B- 15-May-09 104.750 106.75 8.12% 504bp
EB+9% PIK FRNs due 2015 EUR 530mn NR/B- Anytime 101.000 92.5 12.58% 960bp
Source – BNP Paribas
Company Profile Cognis is a German specialty chemicals company with an ethical slant in that almost 40% of its raw materials are natural and renewable. These are predominantly lauric oils (from palm kernel and coconut) and animal fats. The company’s products therefore aim to appeal to environmentally conscious consumers. Cognis markets under the trend of ‘wellness’ for consumer markets such as cosmetics, home care, personal care and food, and under the trend of ‘sustainability & performance’ for more industrial markets such as coatings, mining, textiles, agrochemicals and plastics. Cognis often works closely with its customers to develop specific products with properties tailored to its customers’ particular needs. Cognis operates at 37 sites in 30 countries globally and employs 8,500 people. In 2004, 32% of sales were in Germany, 26% in the rest of Europe, 25% in North America and 17% in Latin America and Asia. Raw materials are 45% petrochemicals, 39% natural oils and fats and 16% other. Cognis operates through five segments: Care Chemicals, Nutrition & Health, Functional Products, Process Chemicals & Oleochemicals.
Investment Recommendation While we are comfortable with Cognis from a credit perspective and think results are likely to remain stable we remain less convinced of the company’s ability to IPO in 2006. In the absence of an IPO exit, we believe that the company’s PIK notes will trade down significantly. In this scenario, we think that the fixed rate notes, although currently attractive in spread terms, may well trade down in sympathy, offsetting to some extent any carry earned in the meantime. The second lien notes are currently trading to the 2007 call and hence their downside is protected to some extent. Accordingly, we have a SELL recommendation on the PIK notes and a HOLD recommendation on the 2nd lien notes and the fixed rate notes.
Debt Profile Bank Debt (1st Lien) As at 30 September 2005, Cognis had €920mn of Senior Facilities 1st lien bank debt outstanding. The facilities consist of €870mn in term loans denominated in EUR, USD and YEN, a €250mn revolver and a €175mn restructuring facility of which €50mn is currently drawn. The facilities benefit to the extent legally possible from (a) 1st priority security over substantially all the assets of Cognis KG and its material subsidiaries, (b) a guarantee from Cognis KG and its material subsidiaries and, (c) a 1st priority pledge from Cognis GmbH of its equity interests in various subsidiaries. Bank Debt (2nd Lien) As at 30 September 2005, Cognis had €166mn of 2nd lien bank debt outstanding. This bank debt consists of term loans denominated in EUR and USD. The 2nd lien bank debt is pari passu with the 2nd lien high yield bonds. The 2nd lien debt benefits from (a) a 2nd priority interest in substantially all the assets of Cognis KG and its material subsidiaries, (b) a 2nd priority pledge from Cognis GmbH of its equity interests in various subsidiaries; and (c) a guarantee from Cognis GmbH that is contractually subordinated to its obligation under the €345mn 9.5% senior notes. €235mn FRNs (2nd Lien) The 2nd lien FRNs are pari passu with the 2nd lien bank debt and therefore share the same collateral as described above. €345mn 9.5% Sr Nts The senior notes benefit from: (a) 3rd priority security in the assets of Cognis KG that also secures the 2nd lien debt; (b) a 3rd priority pledge from Cognis GmbH of its equity interests in each of its three subsidiaries; and (c) a guarantee from Cognis KG that is contractually subordinated to the obligations of Cognis KG under the Senior Facilities and the 2nd lien debt. €573mn FRNs PIK Notes The PIK notes are issued by Cognis Holding GmbH & Co. KG with no security or guarantees. Interest is paid in additional notes or the company may pay in cash with an irrevocable election. Finance Leases Cognis has €9mn of finance leases outstanding as at 30 September 2005.
Adam Harnetty, ACA +44 20 7595 8831 [email protected]

Cognis ⎪ January 2006
117 European High Yield Research
Cognis Structure
Cognis Holding LuxembourgS.à.r.l.
Cognis KG(Operating Company)
Other Subsidiaries
Cognis Holding GmbH & Co. KG
€345m 9.5% Senior Notes Cognis GmbH
Senior Facilities
€573m PIK Notes
Second Lien Debt
Goldman Sachs OthersPermira
45.24%47.02% 7.74%
Cognis Holding LuxembourgS.à.r.l.
Cognis KG(Operating Company)
Other Subsidiaries
Cognis Holding GmbH & Co. KG
€345m 9.5% Senior Notes Cognis GmbH
Senior Facilities
€573m PIK Notes
Second Lien Debt
Goldman Sachs OthersPermira
45.24%47.02% 7.74%
Source – Cognis

Cognis ⎪ January 2006
118 European High Yield Research
Bond Covenants 2nd Lien FRNs 2013 (6 month Euribor +4.75%); 9.5% Senior Notes 2014; PIK FRNs 2015 (6 Month Euribor + 9%)
Bond description 2nd Lien FRNs Senior Notes PIK Notes
Issuing entity Cognis Deutschland GmbH & Co KG
Cognis GmbH Cognis Holding GmbH
Ranking Senior Notes Senior Notes Senior Notes
Position vs. bank debt Structurally/contractually subordinated
Structurally subordinated Structurally subordinated
Position vs. other bonds Structurally senior Structurally subordinated Structurally subordinated
Security/guarantees
2nd lien security in the assets of Cognis KG (23% of 2003 EBITDA)
2nd lien security in stock of Cognis GmbH’s subsidiaries
Subordinated guarantee from Cognis GmbH (subordinated to Sr Nts)
Subordinated guarantee from Cognis KG
3rd lien security in the assets of Cognis KG (23% of 2003 EBITDA)
3rd lien security in the stock of Cognis GmbH’s subsidiaries
None
Optional Redemption
Make Whole – Not applicable
Equity Claw – Not applicable
Call Schedule:
15 May 2005 – 104.000% 15 May 2006 – 102.000% 15 May 2007 – 100.000%
Make Whole – prior to 15 May 2009 bunds+50bp
Equity Claw – prior to 15 May 2007 max 35% of issue at par+coupon following IPO.
Call Schedule:
15 May 2009 – 104.750% 15 May 2010 – 103.167% 15 May 2011 – 101.583% 15 May 2012 – 100.000%
Call Schedule: 15 July 2005 – 101.0% 15 July 2006 – 102.0% 15 July 2007 – 101.0% 15 July 2008 – 100.0%
Change of control Put at 101%, 50%+ of voting power
Put at 101%, 50%+ of voting power
Put at 101%, 50%+ of voting power (or at 100% if fail to own 100% of Cognis GmbH)
Tax redemption Yes – at par Yes – at par Yes – at par
Negative pledge Limitations on liens Limitations on liens Limitations on liens Cross default Yes Yes Yes
Fall away covenants Yes – security and guarantees fall away
Yes – security and guarantees fall away
No
Anti-layering Yes Yes No
Debt limit
Debt is permitted up to 3.8x pro forma coverage Carve outs: Credit facilities up to
€1,330mn less net reduction of asset sales;
CLOs, mortgage & purchase money obligations up to €50mn and 5% of consolidated tangible assets;
Unsecured promissory notes up to €2.5mn;
General basket up to €100mn.
Debt is permitted up to 2.5x pro forma coverage Carve outs: Credit facilities up to
€1,730mn less net reduction of asset sales;
CLOs, mortgage & purchase money obligations up to €50mn and 5% of consolidated tangible assets;
Unsecured promissory notes up to €2.5mn;
General basket up to €100mn.
Debt is permitted by restricted subsidiaries subject to 5x pro forma leverage ratio Carve outs: Credit facilities up to
€2,075mn less net reductions from asset sales;
CLOs, mortgage & purchase money obligations up to €50mn and 5% of consolidated tangible assets;
Unsecured promissory notes up to €2.5mn;
General basket up to €100mn.
Source – BNP Paribas, Cognis

Cognis ⎪ January 2006
119 European High Yield Research
Bond Covenants 2nd Lien FRNs 2013 (6 month Euribor +4.75%); 9.5% Senior Notes 2014; PIK FRNs 2015 (6 Month Euribor + 9%)
Bond description 2nd Lien FRNs Senior Notes PIK Notes
Restricted payments
If company can raise €1 of debt then 50% net income less 100% net loss plus 100% equity (For PIKS limited to restricted investments only).
Carve outs:
Repurchase of equity up to €5mn a year;
Payment of dividend following an IPO up to 6% of proceeds (PIK n/a);
General Basket up to €25mn.
Transactions with affiliates More than €10mn then an approval from the majority of the disinterested board of directors;
More than €25mn then an opinion from a financial qualified expert.
Asset sales At least 75% of consideration in cash or equivalent;
Reinvest within 395 days or repay senior debt. If not, any excess proceeds above £15mn will be used to make a par offer on the notes.
Source – BNP Paribas, Cognis

Cognis ⎪ January 2006
120 European High Yield Research
Cognis, Financial Model FYE 31 December F’cast F’cast EUR mn 2002 2003 Q1 04 Q2 04 Q3 04 Q404 2004 Q1 05 Q2 05 Q305 2005 2006
PROFIT & LOSS Sales 3,126 2,950 777 782 762 752 3,073 780 822 782 3,151 3,246 Cost of Sales -2,287 -2,216 -571 -586 -574 -580 -2,311 -587 -606 -592 Gross Profit 839 734 206 196 188 172 762 193 216 190 Other operating costs -697 -684 -171 -163 -169 -160 -663 -153 -171 -161 Operating Profit 142 50 35 33 19 12 99 40 45 29 Net financial -183 -152 -36 -44 -39 -25 -144 -44 -61 -46 Loss before tax -41 -102 -1 -11 -20 -13 -45 -4 -16 -17 Tax 17 38 -2 6 18 -4 18 -2 -5 -3 MSI -17 -7 -1 -3 -3 0 -7 -2 -3 -2 Loss after tax -41 -71 -4 -8 -5 -17 -34 -8 -24 -22
(PIK Interest) -13 -15 -16
D&A 220 248 50 49 51 50 200 45 50 46 Restructuring 34 47 13 9 4 8 34 3 5 5 Other exceptionals -3 -10 5 3 7 12 27 8 4 4 Gains on fixed asset disposals -1 -19 1 0 2 0 3 1 0 0 Adj. EBITDA 392 316 104 94 83 82 363 97 104 84 365 367
Sales growth y/y -0.2% -5.6% 3.7% 2.2% 4.2% 6.7% 4.2% 0.4% 5.1% 2.6% 2.5% 3.0% Gross margin 26.8% 24.9% 26.5% 25.1% 24.7% 22.9% 24.8% 24.7% 26.3% 24.3% Adj. EBITDA margin 12.5% 10.7% 13.4% 12.0% 10.9% 10.9% 11.8% 12.4% 12.7% 10.7% 11.6% 11.3%
CASHFLOW
Adj EBITDA 392 316 104 94 83 82 363 97 104 84 Tax -34 -23 -5 -6 -3 -9 -23 -2 -5 -4 Other -31 -37 -18 -12 -11 -20 -61 -11 -9 -9 Working Capital 40 59 -23 -28 -9 32 -28 -73 -16 46 Cashflow from operations 367 315 58 48 60 85 251 11 74 117
Capex -98 -102 -20 -29 -35 -48 -132 -28 -32 -33 Other investing cashflows 13 -28 0 1 10 6 17 0 -2 0 Cashflow from investing -85 -130 -20 -28 -25 -42 -115 -28 -34 -33
Financing cashflows & other -179 -290 -11 -125 2 -87 -221 -5 -38 -16
Net change in cash 103 -105 27 -105 37 -44 -85 -22 2 68
BALANCE SHEET
Senior Facilities 906 897 845 845 862 919 920 Second Lien Notes 15/11/13 235 235 235 235 235 235 235 Second Lien Loans 15/11/13 165 163 154 154 158 165 166 Senior Notes 15/5/14 345 345 345 345 345 345 345 FL 23 23 22 22 22 23 22 Other bank 16 19 18 18 12 15 9 Accrued Int 8 33 9 9 35 10 38 Financing fees -114 -108 -101 -101 -97 -94 -90 Gross Debt 1,584 1,607 1,527 1,527 1,572 1,618 1,645
Cash 113 151 106 106 85 87 157
Net Debt 1,471 1,456 1,421 1,421 1,487 1,531 1,488
EB + 900bps PIK 15/1/15 543 548 573
LTM RATIOS
Coverage 2.2 2.2 2.5 2.5 2.3 2.2 2.1 EBITDA-Capex/Interest 1.4 1.4 1.6 1.6 1.4 1.3 1.3 Gross Leverage 4.7 4.6 4.2 4.2 4.4 4.4 4.5 Net Leverage 4.4 4.2 3.9 3.9 4.2 4.2 4.1
Gross Leverage inc PIKs 5.9 5.9 6.0 Net Leverage inc PIKS 5.7 5.7 5.6
GROSS LEVERAGE BY SENIORITY
Through Bank 2.2 2.3 2.3 2.4 Through 2nd Lien 3.3 3.4 3.4 3.5 Through HY 4.2 4.4 4.4 4.4 Through PIK NA 5.9 5.9 6.0
Source – BNP Paribas Estimates, Cognis

Cognis ⎪ January 2006
121 European High Yield Research
This page has been left blank intentionally

Colt Telecom ⎪ January 2006
122 European High Yield Research
Colt Telecom Bond Description & Market Data, as of 05 January 2006
Next Call Issuer Credit Trend: Negative
Description Amount (o/s) Ratings Date Price Price YTW STW
2.000 % Sr Conv Nts due 2007 EUR 332mn B3/B- 03-Apr-05 121.03 7.625% Sr Nts due 2008 DEM 490mn B3/B- 31-July-05 100.00 100 1/8 7.57% 473 bp 7.625 % Sr Nts due 2009 EUR 260mn B3/B- 15-Dec-05 102.54 100 7.62% 483 bp Source � BNP Paribas
Company Profile Colt Telecom, a CLEC, provides a broad range of competitive telecommunications services in Europe and the UK. The company had sales of £1,244mn and an EBITDA of £159mn for the twelve months ended 30 September 2005. Gross leverage at that time was 4.0x and net leverage was 2.1x, each on LQA basis. The company's customers are primarily large business and government end users, and telecommunications carriers. Based in London, the company currently operates in London, Frankfurt, Paris, Munich, Hamburg, Berlin, Zurich, Amsterdam, Brussels, Madrid, Dusseldorf, Milan, Stuttgart, Barcelona, Cologne, Geneva, Lyon, and Vienna.
Investment Recommendation We await COLT�s refinancing which should provide the primary catalyst for the company�s bond in 2006. Anticipation of this refinancing, as well as redemption of nearer term bond maturities has caused some curve flattening already. We have a HOLD on the 2008 and 2009 maturities and SELL on the 2007 maturity, based on the proximity of the current prices to the respective first call prices on each of the bonds. From an underlying credit standpoint, we maintain our NEGATIVE credit trend: COLTs �tough market conditions" story is becoming boring and belies a basic business model problem (with razor thin margins and deteriorating pricing). Additionally, COLT seems resolved to maintain its independent profile, so consolidation is unlikely to provide a salvo.
Debt Profile COLT's remaining outstanding debt of £731mn comprises 1 busted convertible bond and 2 tranches of high yield bonds, all of which are senior unsecured, unsubordinated obligations of the issuer. The company also has a currently undrawn senior secured revolving credit facility in the amount £75mn.
All of COLT's remaining bonds rank pari passu and have been issued by the same corporate entity, COLT Telecom Group, Plc. Each bond is currently callable. The 7.625% bonds in EUR and DEM tranches, have £177mn and £171mn outstanding, respectively. The 2% convertibles of 2007 have £226mn outstanding and have a maturity value of 131.2.
Aizaz Shaikh +44 20 7595 8607 [email protected]

Colt Telecom ⎪ January 2006
123 European High Yield Research
Bond Covenants DEM 490mn 7.625% Senior Notes 2008
EUR 260mn 7.625% Senior Notes 2009
Bond description Euro notes DEM notes
Issuing entity Colt Telecom Group Plc
Ranking Senior notes
Position vs. bank debt Non Applicable
Position vs. other bonds Pari passu with all other bonds (including convertibles)
Security/Guarantees
Optional redemption
! Equity Claw � prior to 15 December 2002 max 35% of issue at 107.625%
! Call Schedule:
15 December 2004 � 103.8125% 15 December 2005 � 102.5417% 15 December 2006 � 101.2708% 15 December 2007 � 100.0000%
! Equity Claw � prior to 15 March 2007 max 35% of issue at 107.625%
! Call Schedule:
31 July 2003 � 103.8125% 31 July 2003 � 101.9062% 31 July 2003 � 100.0000%
Tax redemption Yes � at par + accrued interest
Negative pledge Yes
Cross default Yes
Fall away covenants Yes
Anti-layering Yes (Debt and Liens)
Change of control Put at 101, 35%+ of voting power
Asset sales 85% cash or cash equivalents. No needs to offer to purchase notes unless excess proceeds invested or used to pay senior debt exceeds £10mn.
Debt limit
The company may not incur debt if pro forma leverage exceeds 5.0x. Carve outs: ! The greater of a £100mn basket, indebtedness to finance network build, acquired
indebtedness, among others.
Restricted payments If the company can raise �1.00 of debt then 50% net income less 100% net loss. Carve outs include general basket of £35mn.
Transactions with affiliates
The company will not permit any transaction with affiliated companies unless: The transaction has been approved by the majority of the board of directors. The transaction has received an independent opinion from a recognised investment banking firm stating that the transaction is fair to COLT. The Transaction is solely between COLT and its subsidiaries. The payment of reasonable and customary regular fees to directors of COLT who are not employees of COLT. Any payments or other transactions pursuant to any tax-sharing agreement between COLT and any consolidated company.
Source � BNP Paribas, Colt Telecom

Colt Telecom ⎪ January 2006
124 European High Yield Research
Colt Telecom, Financial Model FYE 31 December Historic Historic Historic Historic Historic Historic Historic Historic Historic Historic Proj�d Proj�d Proj�d GBP mn FY 02 FY 03 Q1 04 Q2 04 Q3 04 Q4 04 FY 04 Q1 05 Q2 05 Q3 05 FY 05 FY 06 FY 07 PROFIT & LOSS Revenue 1,027 1,166 301 301 304 308 1,214 307 317 312 1,247 1,279 1,304 COGS -714 -767 -198 -205 -208 -203 -814 -203 -210 -204 -823 -844 -861 Gross profit 314 399 103 96 96 105 400 105 106 108 424 435 443 SG&A -242 -236 -57 -58 -63 -70 -247 -67 -66 -62 -253 -259 -264 EBITDA 72 163 46 38 33 36 154 37 41 46 172 176 179 P&L Interest -58 -62 -12 -12 -11 -11 -46 -11 -11 -11 -76 -39 -17 Revenue growth y/y 13.5% 10.8% 2.8% 2.8% 0.6% 4.1% 2.0% 5.1% 2.7% 2.8% 2.5% 2.0%
Gross margin 30.5
% 34.2
% 34.2
% 31.9
% 31.6
% 34.1
% 33.0
% 34.0
% 33.6
% 34.6
% 34.0
% 34.0
% 34.0
%
SG&A / sales 23.6
% 20.2
% 18.8
% 19.2
% 20.6
% 22.6
% 20.3
% 22.0
% 20.7
% 19.9
% 20.3
% 20.3
% 20.3
%
EBITDA margin 7.0% 14.0
% 15.4
% 12.7
% 11.0
% 11.5
% 12.7
% 12.1
% 12.9
% 14.7
% 13.8
% 13.8
% 13.8
% CASH FLOW Cash Interest net -32 -37 -4 -9 -5 -8 -25 7 -11 -11 -64 -28 -17 Change in working capital 82 11 6 6 7 -15 4 -12 -6 13 0 0 0 Cash from Operating Activities -38 148 46 42 36 16 141 22 31 56 108 148 163 Capex -412 -141 -32 -29 -33 -36 -129 -31 -33 -27 -120 -110 -100 Acquisitions/Disposals 0 -2 0 0 0 0 0 0 0 0 Cash from Investing Activities -412 -143 -29 -28 -32 -35 -125 -31 -32 -27 Management of liquid resources 400 188 -14 10 -4 351 343 0 -8 -4 Issue (purchase) of convertible debt -56 -10 0 0 -2 -322 -334 -81 0 -25 Issue (purchase) of non-convertible debt -42 -135 0 0 -12 0 -2 0 0 0 Cash from Financing Activities -97 -143 0 0 -13 -322 -335 -81 -8 -28 -125 -100 -100 Net Change in Cash -147 50 4 24 -14 10 25 -90 -17 -3 -137 -62 -37 BALANCE SHEET Cash & Equivalents 935 802 786 794 791 453 453 349 336 340 316 254 216 Bonds- HY 2.000% DM600m sr convert due 2005 41 94 94 94 - - - - - - 2.000% �295m sr convert due 2006 169 129 129 129 129 129 129 125 - - 2.000% �368m sr convert due 2006 137 222 222 222 - - - - - 2.000% �402.5m sr convert due 2007 - 234 234 234 234 234 234 227 227 226 227 7.625% �320m sr nts due 2009 - 183 183 183 183 183 183 178 178 177 178 178 178 7.625% DM600m sr nts due 2008 213 177 177 177 177 177 177 171 171 171 171 171 171 8.875% DM150m sr nts due 2007 - 45 45 45 45 - - - - - 10.125% £50m sr nts due 2007 1,213 35 35 35 35 - - - - - 12.000% $176m sr disc nts due 2006 2 - - Total Debt 1,547 1,497 1,416 1,435 1,115 828 801 756 743 731 594 494 394 Net Debt 612 695 629 641 324 375 348 407 407 391 278 240 178 RATIOS Leverage Total leverage (gross) 21.6x 9.2x 8.0x 8.1x 6.7x 5.4x 5.2x 5.2x 5.1x 4.6x 3.5x 2.8x 2.2x Total leverage (net) 8.5x 4.3x 3.6x 3.6x 1.9x 2.4x 2.3x 2.8x 2.8x 2.5x 1.6x 1.4x 1.0x
Source � BNP Paribas Estimates, Colt Telecom

Colt Telecom ⎪ January 2006
125 European High Yield Research
This page has been left blank intentionally

Corus ⎪ January 2006
126 European High Yield Research
Corus Bond Description & Market Data, as of 5 January 2006
Next Call Issuer Credit Trend: Positive
Description Amount (o/s) Ratings Date Price Price YTW STW
6.75% Unsecured bonds due 2008 GBP 200mn B2/B+ NC NC 100.5 6.47% 184bp 7.5% Senior Notes due 2011 EUR 800mn B2/B+ 1-Oct-08 103.75 107 6.03% 292bp 11.5% Secured Debentures 2016 GBP 150mn NR/BBB- NC NC
Source – BNP Paribas
Company Profile Corus is a leading manufacturer of steel and aluminium products. It is the eighth largest steel manufacturer in the world and the fifth largest producer of rolled and extruded aluminium in the world. Corus was formed in 1999 from the merger of British Steel plc and Koninklijke Hoogovens NV. The company produces steel at several locations in the UK and one in Holland. During the last 12 months to 30 September 2005, the company had consolidated turnover of £10,215mn and EBITDA of £1,156mn.
Investment Recommendation The boom conditions seen in the steel industry in the second half of 2004 and the first half of 2005 are over. However, production cuts by most of the larger producers have reduced excess inventory within Europe and steel prices have started to recover in Q4 2005. Corus expects this trend to continue into the early part of 2006. The company’s restoring success cost savings and rationalisation plans are on track with an annual exit run rate savings achieved of £520mn by 30 September 2005. The remaining £160mn is still on target for completion by the end of 2006. Chinese production and demand continue to increase and at present there does not appear to be a high likelihood of a collapse in the steel price from Chinese exports entering Europe. However, Corus is now better placed to cope with a downturn if it materialises. Most of the restructuring has been focused on the UK so that the large cash losses seen in the 2001/2002 trough should not repeat in the event of a downturn. By way of contrast the Dutch operations have always generated cash, even during the downturn, due to its large scale and efficiency. In our opinion, corporate activity is likely to become a significant driver of the company’s bond prices. Consolidation within the steel industry continues, with the major themes being moves into lower cost countries or vertical integration by way of acquiring iron ore deposits. Corus’ management has stated that they are seeking acquisitions but want to do this from a position of strength. We would also not rule out a bid for Corus. We believe that Corus will be disciplined in targeting acquisitions (witness their decision to walk away from the Erdemir acquisition) and therefore we do not think they will materially overpay for assets. Based on the current wide spread on Corus’ bonds we have a BUY recommendation but acknowledge that the spread is somewhat constrained by the company’s (too low in our opinion) credit rating of B+/B2.
Adam Harnetty, ACA +44 20 7595 8831 [email protected]

Corus ⎪ January 2006
127 European High Yield Research
Debt Profile Corus has a number of sources of finance, the main ones are described below:
€0.8bn Senior Credit Facility In February 2005, Corus signed a new bank facility of €800mn. The maturity date of the new revolving facility is 31 December 2008. The facility comprises 2 tranches, with €700mn available to Corus Group plc and Corus Nederland BV and €100mn available to Corus Nederland BV only. The facility steps down to €700mn on 1 January 2008. The new facility has a fixed charge over the shares of Corus Nederland BV and its UK holding companies and a floating charge over the assets of Corus Group plc (excluding its shares in Corus UK Limited). Corus Nederland BV (formerly Koninklijke Hoogovens NV) There are two legacy bonds issued at this entity from the old Hoogovens company. There is a NLG345mn 4.625% subordinated convertible bond due April 2007 and a NLG300mn 5.625% debenture stock due June 2008. Corus Finance plc There are 3 bonds issued by this entity. The €5.375% bond due August 2006 has been the subject of tenders such that only €20mn is outstanding. There is also a £200mn 6.75% bond due May 2008. This bond is guaranteed by Corus Group plc and by Corus UK Ltd. The third bond is the £150mn 11.5% debenture stock due July 2016. This is guaranteed by Corus UK and Corus Group plc. It is further secured by a floating charge over the assets, undertaking and property of Corus UK Limited and Corus Finance Ltd. There are a number of covenants relating to the debenture stock including a limitation of secured indebtedness of Corus UK Ltd and Corus Finance plc of 20% of their aggregate tangible assets. Corus Group plc At the holding company level, there are two bonds. There is a €307mn 3% unsubordinated convertible bond due November 2007 that is guaranteed by Corus UK. In addition, there is a €800mn 7.5% senior note due October 2011 guaranteed by Corus UK Ltd.
Corus Structure
Corus Group PlcHolding Company
Corus Property LtdHolding Company
Corus Nederland BVHolding Company
Corus Finance PlcFinance Company
Corus UK LtdOperating Company
Steel BusinessesAluminiumBusinesses
SteelBusinesses
Corus CNBV Inv. LtdHolding Company
100%
19%
100%
81%
100%
100%
€307m 3% Convertible Bond Jan 2007
€800m 7.5% Bond Oct 2011
€800mn Banking Facility Dec 2008
€20m 5.375% Bonds 2006
£200m 6.75 Bond 2008
£150m 11.5 Debenture stock 2016
NLG 335m 4.625% Subordinated convertible Debenture loan 2007
NLG 300m 5.625% Debenture loan Jun 2008
Source – Corus

Corus ⎪ January 2006
128 European High Yield Research
Bond Covenant Bond description 7.5% Senior Notes due 2011
Issuing entity Corus Group plc
Ranking Senior
Position vs. bank debt Subordinated
Position vs. other bonds Pari passu (except with regard to the ‘Hoogovens’ bonds and the 11.5% debenture stock)
Security/guarantees Senior unsecured guarantee from Corus UK Ltd.
Optional redemption
Make whole – prior to 1 October 2008 at T+50bp
Equity Claw – prior to 1 October 2007 35% at 107.5%
Call schedule
1 October 2008 – 103.75%
1 October 2009 – 101.875%
1 October 2010 – 100%
Tax redemption Yes at par
Negative pledge Limitation on liens but with some carve outs (principally security over €1bn of credit facilities as defined)
Cross default Yes
Fall away covenants No
Anti-layering No
Change of control Put at 101, >35% of voting power or substantial sale of assets
Asset sales Fair market value and >75% proceeds in cash or equivalents. Within 360 days reinvest in similar business or repay debt. Any proceeds remaining (subject to £10mn minimum) must be used to tender for bonds at par.
Debt limit
Fixed charge coverage ratio must exceed 2.5:1.
Carve outs: Credit facilities (as defined) up to €1bn (as reduced by any pay down from asset sales);
Capital leases and similar up to 5% of consolidated net tangible assets;
Guarantees up to £75mn where an ownership >15% exists;
General basket of £65mn.
Restricted payments
Subject to being able to incur £1 of additional debt then: 50% of consolidated net income;
£2mn p.a. to buy Equity interests from employees;
£10mn general basket.
Transactions with affiliates Must be no less favourable than if executed with an unrelated person. If >£30mn board certificate approved by a majority of disinterested Board members. If >£50mn requires a fairness opinion from an external advisor.
Source – BNP Paribas, Corus

Corus ⎪ January 2006
129 European High Yield Research
Corus, Financial Model Actual Actual Actual Actual Actual Actual Actual Actual IFRS IFRS F’cast F’cast FYE 31 December 2001 2002 H1 03 H2 03 2003 H1 04 H2 04 2004 H1 05 Q3 05 2005 2006 GBP mn 29/12/01 28/12/02 28/06/03 03/01/04 03/01/04 03/07/04 31/12/04 31/12/04 01/07/05 30/09/05 31/12/05 31/12/05PROFIT & LOSS Sales 7,699 7,188 4,023 3,930 7,953 4,477 4,855 9,332 5,333 2,383 Cost of sales -7,327 -6,925 -7,305 Gross profit 372 263 648 SG&A -749 -656 -714 Exceptionals -8 -53 -142 Operating (loss)/profit -385 -446 -57 -151 -208 147 435 582 483 103 Other income 31 136 16 38 54 65 33 98 1 -1 Net interest -103 -92 -46 -52 -98 -48 -70 -118 -49 -22 -93 -100 Net associate interest -5 -2 -2 -1 -3 -1 -2 -3 Profit before tax -462 -404 -89 -166 -255 163 396 559 435 80 Tax 43 -61 -36 -17 -53 -64 -55 -119 -98 -30 MSI 0 7 0 3 3 1 5 6 -2 0 Retained Profit -419 -458 -125 -180 -305 100 346 446 335 50 D&A 376 445 174 190 364 145 163 308 162 76 Cash exceptionals 1 -52 3 91 94 22 22 44 13 -3 EBITDA pre exceptionals -8 -53 120 130 250 314 620 934 658 176 974 700 Revenue growth y/y -6.6% 10.6
% 11.3
% 23.5
% 17.3
% 19.1
% 1.0%
EBITDA Margin % -0.1% -0.7% 3.0% 3.3% 3.1% 7.0% 12.8%
10.0%
12.3%
7.4%
CASHFLOW EBITDA -8 -53 120 130 250 314 620 934 658 176 Net rationalisation -122 -54 -15 -44 -59 -25 -24 -49 -4 -7 Change in working capital 302 148 -206 239 33 -324 7 -317 -332 185 Operating cashflow 172 41 -101 325 224 -35 603 568 322 354 Returns on investment & servicing of finance -101 -79 -47 -68 -115 -52 -54 -106 -52 -8 Taxation 13 -14 -24 -26 -50 -51 -42 -93 -113 -67 Gross Capex -167 -176 -72 -91 -163 -125 -187 -312 -181 -88 -400 -450 Acquisitions & disposals 49 445 -13 -7 -20 30 51 81 -13 -8 Other (inc. share issue) 64 94 22 255 277 136 -187 -51 -10 -1 Net debt issued/(repaid) -60 -266 230 -373 -143 93 -39 54 -7 -1 Change in cash -30 45 -5 15 10 -4 145 141 -54 181 BALANCE SHEET Cash & ST investments 184 270 256 380 380 240 600 600 641 917 Bank Overdrafts & ST Loans 132 78 569 113 113 101 46 46 141 237 Obligations under finance leases 41 41 31 31 Convertible bonds 109 309 328 332 332 316 332 332 314 316 Other borrowings 1,503 1,119 865 948 948 1,026 1,035 1,035 1,011 1,019 Securitised debtors 0 181 215 215 215 215 275 275 275 275 Gross Debt 1,744 1,687 1,977 1,608 1,608 1,658 1,729 1,729 1,772 1,878 Net Debt 1,560 1,417 1,721 1,228 1,228 1,418 1,129 1,129 1,131 961 LTM RATIOS Coverage -0.1 -0.6 2.6 4.4 7.9 7.9 10.7 10.1 Adj. Coverage -1.7 -2.5 0.9 2.3 5.3 5.3 7.6 7.0 Gross Leverage -
218.0 -31.8 6.4 3.7 1.9 1.9 1.4 1.6
Net Leverage -195.0 -26.7 4.9 3.2 1.2 1.2 0.9 0.8 Gross lease adjusted Leverage 6.9 4.5 2.4 2.4 1.8 2.1
Source – BNP Paribas Estimates, Corus

Culligan ⎪ January 2006
130 European High Yield Research
Culligan Bond Description & Market Data, as of 5 January 2006
Next Call Issuer Credit Trend: Positive
Description Amount (o/s) Ratings Date Price Price YTW STW
8% Senior Subordinated Notes due 2014 EUR 185mn B3/B- 01-Oct-09 104 106.50 6.82% 367bp
Source – BNP Paribas
Company Profile Culligan is a leading global provider of water treatment products and services for household and commercial applications. The company generates revenues from the following primary product and service categories: Water Treatment Products and Services (75% of 2004 revenue), Home-Office Delivery Water Service (24% of 2004 revenue) and Vended Water (3% of 2004 revenue). Key products and services are: “point-of-entry” water conditioning systems such as water softeners and water filtration devices; “point-of-use” water filtration systems; equipment installation, maintenance and repair; and delivery of five-gallon and 18-liter water jugs for water cooler use to both household and commercial customers in North America and Europe. Culligan operates its business directly in 12 countries and sells its products in approximately 90 countries, generating the bulk of its revenues from operations in the US, Canada and Europe (including France, Italy and the U.K.). CDRC Holding S.ar.L. (Clayton, Dubilier & Rice, a private investment firm) acquired Culligan Corporation and its subsidiaries from Water Systems Group and Applications, a subsidiary of Veolia Environnement, on 30 September 2004 for a total of $650mn. For the twelve months ended 30 September 2005, Culligan’s revenues were $735.5mn and Adjusted EBITDA was $106.3mn. At the end of third quarter 2005, the company had leverage of 3.6x and coverage of 3.0x.
Investment Recommendation We maintain our REDUCE/Positive Credit Trend recommendation for Culligan’s 8% senior subordinated notes due 2014. We stress that our recommendation is motivated primarily by the already tight valuations of the bonds. We believe that current bond valuations anticipate an immaculate operating performance by the company during the next twelve months. Conversely, we feel that it is premature to disregard a number of competitive challenges and execution risks faced by Culligan. One of the areas which may underperform during the next twelve months is a home-office water delivery business (HOD), which is experiencing increased competition from retail outlets selling water coolers and is suffering from growing customer preference for single-serve bottled water. We also note that Culligan’s organic rates of growth in sales have been relatively modest year-to-date, with North American revenues essentially flat (+0.2% year-on-year) and European revenues up 2.1% y-o-y during the first three quarters of 2005. Finally, we understand that Culligan is still in a fairly early phase of executing its cost savings strategy. In our forecasts, we assume that the planned cost savings will be the main driver of the company’s profitability during the next two-three years, while top line growth will be rather slow. To refresh, at the time of the issuance of the bonds in September 2004, Culligan aimed to achieve the following: (1) to lower manufacturing costs by $20-25mn; (2) to reduce North American corporate and divisional selling, general and administrative expenses by approximately $20mn; and (3) to improve performance of the US and Canadian company-owned dealers (estimated potential earnings enhancing effect of approximately $40mn). While those opportunities appear to be substantial, the company will need to move quickly and skilfully in order to achieve them. Clearly, this poses execution risks. While we cannot identify imminent near-term company-specific negative catalysts for Culligan’s bonds, we also think that short-term upside potential is limited from the current levels. Should the company’s operating performance falter, there is more substantial downside risk. Therefore, we believe it is an appropriate moment to take profits in the name and to look for more attractive investment opportunities. Overall, we think that Culligan is a solid and deleveraging credit and that the bonds will ultimately appreciate further over the long term.
Oleksiy Soroka, CFA +44 20 7595 4878 [email protected]

Culligan ⎪ January 2006
131 European High Yield Research
Debt Profile In connection with the CDRC Holding acquisition, the company entered into two new financing arrangements providing for the majority of its debt capacity. A Senior Secured Credit Facility was established which includes (1) a term loan facility providing for a loan denominated in US dollars equal to $215mn, maturing in 2011, and (2) a multi-currency revolving credit facility, providing for up to $110mn outstanding at any time in revolving loans, maturing in 2010. Undrawn amounts under the revolving credit facility will be available for working capital, capital expenditures and general corporate purposes. In addition, the company issued €185mn of senior subordinated notes, maturing on 30 September 2014. There were no borrowings under the revolving credit facility at 30 September 2005 and total outstanding borrowings of $215mn under the Senor Secured Credit Facility consisted entirely of the term loan.
Senior Secured Credit Facility Guarantees are provided by CDRC Holding S.ar.l. (the Parent) of all borrowings by its subsidiaries under the facility, the Subsidiary Guarantors (Culligan International Company, Culligan Dealer Corp., Culligan of Canada, Ltd., CDRC Holding Inc., CDRC Acquisition UK Limited, and CDRC Holding Corporation B.V), and any US subsidiary or U.S. parent of the U.S. borrower. If a non-U.S. subsidiary becomes a borrower under the revolver, appropriate related non-U.S. subsidiaries may provide a guarantee of the borrowings.
The Parent has pledged the capital stock of its direct subsidiaries to secure its obligations under its guarantee. CDRC International S.ar.l. (the Senior Parent) has also provided a pledge of the capital stock of the Parent. All amounts owing by any U.S. subsidiary of the Parent under the facility are secured by security interests in (1) all capital stock of any of its US subsidiaries and less than 65% of capital stock for non-US subsidiaries, and (2) substantially all other tangible and intangible assets owned by such subsidiary.
8% Senior Subordinated Notes CDRC International S.ar.l. owns 100% of the equity of the Issuer and guarantees the notes on a senior subordinated basis. CRDC Holding S.ar.l., the Parent, guarantees the senior notes on a subordinated unsecured basis. The notes are also guaranteed on a senior subordinated unsecured basis by the Subsidiary Guarantors.

Culligan ⎪ January 2006
132 European High Yield Research
Culligan Structure
CD&R Fund VI
Intermediate Holding Companies
CDRC International S.à.r.l.the “Senior Parent”
note guarantor
CDRC Holding S.à.r.l.the “Parent”
note & credit facility guarantor
CDRC Holding Inc.(1)
note & credit facility guarantor
Culligan of Canada, Ltd.(1)
note & credit facility guarantor
Canadian Operating Companies
credit facility guarantors
Culligan International Company
credit facility borrower, note guarantor
Culligan Dealer Corp.note& credit facility guarantor
Other U.S. Operating Companies
credit facility guarantors
Other U.S. Operating Companies
credit facility guarantors
Culligan Finance Corporation B.V.
Issuer of the notes; credit facility guarantor
European Operating Companies
CDRC AcquisitionUK Ltd.
note & credit facility guarantor
Argentinean Operating Companies
U.K. Operating Companies
CDRC HoldingCorporation B.V.
note and credit facility guarantor
Source – Culligan
1. Immediately after closing of the Transactions, Culligan of Canada, Ltd., CDRC Holding Inc. and their subsidiaries will be held by CDRC Holding Corporation B.V. We expect they will become direct subsidiaries of the Parent at a later time, subject to any then applicable corporate law limitations.

Culligan ⎪ January 2006
133 European High Yield Research
Bond Covenant Bond description EUR 185mn 8% Senior Subordinated Notes due 2014
Issuing entity Culligan Finance Corporation B.V.
Ranking Senior subordinated
Position vs. bank debt Structurally and contractually subordinated
Position vs. other bonds Not applicable
Security/Guarantees
Guaranteed by CDRC International S.ar.l., the senior parent, on a senior unsecured basis. CRDC Holding S.ar.l., the parent, will guarantee the senior notes on a subordinated unsecured basis. The notes will also be guaranteed on a senior subordinated unsecured basis by the Subsidiary Guarantors (Culligan International Company, Culligan Dealer Corp., Culligan of Canada, Ltd., CDRC Holding Inc., CDRC Acquisition UK Limited, and CDRC Holding Corporation B.V).
Optional redemption
Make Whole – Bund plus 50bp prior to 1 October 2009
Equity Claw – 35% at 108% prior to 1 October 2007
Call Schedule:
1 October 2009 – 104.000%
1 October 2010 – 102.667%
1 October 2011 – 101.333%
1 October 2012 – 100.000%
Tax redemption Yes – at par
Negative pledge Yes - limitation on liens
Cross default Yes – on $30mn or more of other debt
Fall away covenants No
Anti-layering Yes
Change of control Put at 101%
Asset sales
The Company and any Restricted Subsidiary will not sell assets unless:
Consideration is at least equal to the fair market value;
Asset dispositions in excess of $10mn require the fair market value to be determined by the Board of Directors and at least 75% of the consideration to be received in cash;
100% of the net cash proceeds must be applied first to either prepay or repay indebtedness or to reinvest in additional assets within 365 days, second to purchase Notes or repay any other Senior Subordinated Indebtedness, and third to fund any general corporate purposes.
Debt limit
Consolidated Coverage Ratio of at least 2.0x.
Carve outs:
Credit Facilities and indebtedness of any Non-U.S. Subsidiary incurred other than under any Credit Facility in a maximum principal amount not exceeding $375mn plus the amount, if any, by which the Borrowing Base (sum of 60% of inventory plus 85% of receivables) minus the amount of indebtedness of a Receivables Subsidiary or a Non U.S. Subsidiary exceeding $53.6mn;
PMOs and CLOs in aggregate not to exceed 7.5% of Consolidated Tangible Assets;
Indebtedness of any Non-U.S. Subsidiary incurred for working capital purposes not to exceed the sum of a) 90% of receivables of all Non-U.S. Subsidiaries and b) 75% of inventory of all Non-U.S. Subsidiaries;
Indebtedness of the Company or any Restricted Subsidiary not to exceed 7.5% of Consolidated Tangible Assets.
Source – BNP Paribas, Culligan

Culligan ⎪ January 2006
134 European High Yield Research
Bond Covenant Bond description EUR 185mn 8% Senior Subordinated Notes due 2014
Restricted payments
If the company can raise €1.00 of debt then 50% of consolidated net income (or 100% of net loss), plus the aggregate net cash proceeds and the fair value of property or assets received for equity or equity like proceeds, plus the aggregate amount equal to the net reduction in investments in Unrestricted Subsidiaries.
Carve outs:
Distributions by the Company to any Parent to permit any Parent to repurchase or otherwise acquire its Capital Stock from Management Investors or Dealer Investors cannot exceed $10mn plus $2mn multiplied by the number of calendar years that have commenced since the issue date;
Distributions by the Company to any Parent to pay dividends on the common stock or equity of the Company or any Parent following a public offering of such common stock cannot exceed 6% of the aggregate proceeds received in any fiscal year;
General basket of €25mn.
Transactions with affiliates Transactions must be no less favourable than could be obtained with a Person who is not an affiliate and must be approved by a majority of the Disinterested Directors when aggregate consideration exceeds $10mn.
Source – BNP Paribas, Culligan

Culligan ⎪ January 2006
135 European High Yield Research
Culligan, Financial Model BNPP BNPP BNPP BNPP BNPP FYE – 31 December Actual Actual Actual Actual Actual Actual ForecastForecastForecastForecastForecastUSD mn 2002 2003 2004 Q1 05 Q2 05 Q3 05 Q4 05 2005 2006 2007 2008 P&L SUMMARY
North America 444.3 443.2 448.1 108.9 116.5 118.3 113.8 457.5 471.2 476.0 479.5 % change -0.2% 1.1% 0.6% 1.4% 3.4% 3.0% 2.1% 3.0% 1.0% 0.8% Europe 192.3 246.2 271.3 67.0 76.7 69.3 69.7 282.7 287.3 290.2 293.1 % change 28.0% 10.2% 8.1% 5.1% 1.9% 2.0% 4.2% 1.7% 1.0% 1.0% Net revenues 636.6 689.4 719.4 175.9 193.2 187.6 183.5 740.2 758.6 766.2 772.6 % change 8.3% 4.4% 3.3% 2.8% 2.9% 2.6% 2.9% 2.5% 1.0% 0.8%
Cost of goods sold -373.3 -395.9 -418.7 -102.5 -106.9 -106.0 -105.5 -420.9 -428.6 -430.2 -431.9 Gross profit 263.3 293.5 300.7 73.4 86.3 81.6 78.0 319.3 330.0 336.0 340.7 gross margin 41.4% 42.6% 41.8% 41.7% 44.7% 43.5% 42.5% 43.1% 43.5% 43.9% 44.1%
SG&A -222.2 -243.8 -245.5 -59.2 -62.1 -57.9 -59.6 -238.8 -244.5 -249.0 -252.0 % of sales 34.9% 35.4% 34.1% 33.7% 32.1% 30.9% 32.5% 32.3% 32.2% 32.5% 32.6% EBIT before other changes and intangible amortisation 41.1 49.7 55.2 14.2 24.2 23.7 18.3 80.4 85.5 87.0 88.7 % of sales 6.5% 7.2% 7.7% 8.1% 12.5% 12.6% 10.0% 10.9% 11.3% 11.3% 11.5%
Adjusted EBITDA: North America 49.9 49.5 52.7 12.4 16.7 18.8 12.9 60.8 65.5 68.5 70.5 % of sales 11.2% 11.2% 11.8% 11.4% 14.3% 15.9% 11.3% 13.3% 13.9% 14.4% 14.7% Europe 27.0 43.9 43.3 8.6 14.8 12.4 13.6 49.4 50.4 50.8 51.0 % of sales 14.0% 17.8% 16.0% 12.8% 19.3% 17.9% 19.5% 17.5% 17.5% 17.5% 17.4% Adjusted EBITDA 76.9 93.4 96.0 21.0 31.5 31.2 26.4 110.1 115.9 119.3 121.5 % of sales 12.1% 13.5% 13.3% 11.9% 16.3% 16.6% 14.4% 14.9% 15.3% 15.6% 15.7%
Restructuring expenses -6.0 -0.5 -0.5 -0.5 -0.5 -1.3 -3.0 -5.3 -10.0 -5.0 0.0 Loss from sale of dealers 0.0 -5.3 -0.8 0.0 0.0 0.0 0.0 0.0 0.0 0.0 0.0 Factoring expense charged by parent -0.8 -0.7 0.0 0.0 0.0 0.0 0.0 0.0 0.0 0.0 0.0 Impairment of investment 0.0 -1.2 0.0 0.0 0.0 0.0 0.0 0.0 0.0 0.0 0.0 Intangible amortisation -3.4 -3.5 -3.2 -0.5 -0.6 -0.3 -0.5 -1.9 -2.0 -2.0 -2.0 Operating income 30.8 38.4 39.6 13.1 23.1 22.1 14.8 73.2 73.5 80.0 86.7 % of sales 4.8% 5.6% 5.5% 7.5% 12.0% 11.8% 8.1% 9.9% 9.7% 10.4% 11.2%
Interest expense, net -3.2 -3.5 -12.9 -8.5 -8.6 -8.9 -9.0 -34.9 -31.5 -30.4 -29.2 Other expense, net -2.0 -1.2 -1.3 -0.1 -0.7 0.5 -0.5 -0.9 -1.0 -1.0 -1.0 Income before taxes 25.6 33.7 25.3 4.6 13.9 13.7 5.3 37.4 40.9 48.5 56.5 Income tax expense -10.7 -14.0 -14.0 -1.5 -6.1 -5.6 -2.2 -15.4 -17.0 -20.1 -23.4 effective tax rate 41.8% 41.4% 55.1% 32.1% 44.0% 41.3% 42.0% 41.2% 41.5% 41.5% 41.5% Income from continuing operations 14.9 19.8 11.4 3.1 7.8 8.0 3.1 22.0 23.9 28.4 33.0
CASH FLOW ITEMS
Adjusted EBITDA 76.9 93.4 96.0 21.0 31.5 31.2 26.4 110.1 115.9 119.3 121.5 Cash interest -3.2 -3.5 -12.9 -8.5 -8.6 -8.9 -9.0 -34.9 -31.5 -30.4 -29.2 Cash taxes -10.7 -14.0 -14.0 -1.5 -6.1 -5.6 -0.7 -13.9 -20.0 -20.1 -23.4 Changes in working capital -10.2 -5.9 20.6 -6.7 3.9 -2.9 5.0 -0.8 10.0 10.0 0.0 Restructuring charges -6.0 -0.5 -0.5 -0.5 -0.5 -1.3 -3.0 -5.3 -12.5 0.0 0.0 Other operating cash items 23.7 14.9 -13.4 0.8 0.8 2.0 0.0 3.6 0.0 0.0 0.0 Cash flows from operating activities 70.4 84.5 75.8 4.6 21.1 14.4 18.7 58.8 61.9 78.8 68.8 Capex -48.3 -40.4 -34.1 -5.1 -6.3 -6.8 -7.0 -25.2 -35.0 -30.0 -30.0 Free cash flow 22.1 44.1 41.7 -0.5 14.8 7.6 11.7 33.6 26.9 48.8 38.8
BALANCE SHEET ITEMS
Cash 39.2 34.1 47.2 54.5 66.1 66.1 89.8 135.6 172.4
Long-term debt, less current installments 470.1 456.1 439.9 437.7 431.6 431.6 442.9 439.9 437.8 Current installents of long-term debt 3.9 3.9 3.7 3.1 3.1 3.1 3.1 3.1 3.1 Total debt 474.0 459.9 443.6 440.8 434.7 434.7 446.0 443.0 440.9 Net debt 434.8 425.8 396.3 386.3 368.6 368.6 356.1 307.4 268.5
CREDIT RATIOS
EBITDA/Net interest exepnse 7.4x 4.7x 3.7x 3.0x 3.2x 3.2x 3.7x 3.9x 4.2x (EBITDA - Capex)/EBITDA 4.8x 2.4x 2.6x 2.9x 3.1x
Senior debt/EBITDA 2.3x 2.0x 1.8x 1.7x 1.7x Total debt/EBITDA 4.9x 3.9x 3.8x 3.7x 3.6x Net debt/EBITDA 4.5x 4.3x 3.9x 3.6x 3.3x 3.3x 3.1x 2.6x 2.2x
Source – BNP Paribas Estimates, Culligan Leverage and Coverage are based on the last 12 months’ results. Some of the ratios are adjusted for the effects of acquisitions and disposals. In addition, these 2 measures are usually calculated based on EBITDA adjusted for exceptional or non-recurring items. Leverage is defined as net lease-adjusted debt (x8 operating leases)-to-EBITDAR. Coverage is defined as EBITDAR-to-(net interest+rental expenses).

Eco-Bat ⎪ January 2006
136 European High Yield Research
Eco-Bat Bond Description & Market Data, as of 5 January 2006
Next Call Issuer Credit Trend: Positive
Description Amount (o/s) Ratings Date Price Price YTW STW
10.125% Sr Nts due 2013 EUR 235mn B1/B- 31-Jan-08 105.063 114 5.22% 232bp 10% PIKs due 2015 EUR 262mn NR/CCC+ 15-Jul-07 102.00 85.5 13.62% 1028bp
Source � BNP Paribas
Company Profile Eco-Bat is the world�s largest producer of lead with an estimated market share of 19% in terms of tonnes of lead sold in Europe and North America. The company is the largest producer of lead in Europe with an estimated market share of approximately 22% in terms of tonnes of lead sold and, on a pro forma basis, the third largest producer of lead in the US, with an estimated market share of approximately 17%. Most of its customers are manufacturers of automotive batteries. Approximately, 88% of the company�s lead production was from recycled lead. The company operates 18 lead facilities, located all around the world. For the last 12 months ended 30 September 2005, the company had revenues of £627.8mn and generated EBITDA of £82.7mn.
Investment Recommendation Ecobat is benefiting from the current high level of the lead price. As measured by LME, the price for three month delivery of lead is $1,000 as compared to an average of $450 in 2003. As a result Ecobat�s EBITDA has more than doubled since 2003 and Ecobat is now generating significant free cash flow. We see no near-term catalyst for a steep decline in the lead price and even if this were to materialize Ecobat is hedged in 2006 by way of put options. We think that the senior notes are attractive and have a BUY recommendation. All other things being equal, we would normally also have a positive view of the company�s PIK notes. However, we do not see an exit route for the PIKs. We do not think Ecobat is an attractive IPO story and so wonder how the PIKs will be taken out. When they are significantly below par we could envisage the company�s controlling shareholder, Harold Myers, buying the PIKs in the market (perhaps even using cash generated by Ecobat itself to fund the purchase). Accordingly, at current levels we have a HOLD recommendation.
Debt Profile The company has 6 main credit facilities:
! �15mn borrowing base facility secured by the assets of Berzelius Stolberg GmbH expiry March 07; ! £32mn secured on assets of certain UK & Italian subsidiaries and Quemetco West LLC expiry March 07; ! �7mn unsecured facility for French subsidiaries expiry February 07; ! £10.8mn (ZAR120.7mn) in 2 secured facilities for Zimco the South African subsidiary expiry; ! £1.7mn (ZAR 19.3mn) bank loan to finance a freehold property purchase in South Africa.
As at 30 September 2005, out of total facilities of £59.5mn only £4.3mn had been drawn leaving available borrowing of £55.2mn.
In January 2003, Eco-Bat Finance plc issued �165mn 10.125% 2013 bonds, the proceeds were used to tender for Eco-Bat Technologies plc�s £9.125% 2007 notes and to fund the purchase of 2 US subsidiaries. In November 2004, the company launched a �70mn tap issue of the 2013 bonds. Proceeds were to be used for general corporate purposes.
10% PIK Notes Due 2015
In February 2005, E B Holdings, a holding company of Eco-Bat Technologies issued �250mn PIK notes due 2015. Interest on the notes is payable in additional notes or in cash at the option of the issuer. The notes are non-callable for two years and are then redeemable at 102%, 101% and 100% thereafter. Use of proceeds was to make a distribution to shareholders.
Adam Harnetty, ACA +44 20 7595 8831 [email protected]

Eco-Bat ⎪ January 2006
137 European High Yield Research
Eco-Bat Structure
Eco-Bat TechnologiesLimited
Eco-Bat Finance PLC
Guarantor Subsidiaries of Existing 2013 Notes:
HJE LimitedEco-Bat Technologies GBH.J. Enthoven LimitedEco-Bat S.p.A.Muldenhutten Recycling and Unwelttechnik GmbH BSB Recycling GmbH�Berzelius� Stolberg GmbH�Berzelius� Metall GmbHQuexco, BVQuexco Investments BV Eco-Bat America LLQuemetco West, LLCQuemetco West, LLCEco-Bat Indiana, L.L.C.Eco-Bat New York, L.L.C.
Non-Guarantor Subsidiaries of Existing 2013 Notes:
BMG Metall und Recycling GmbHLe Plomb Francais Holding, S.A.R.L.Le Plomb Francais S.A.R.L. H.J. Enthoven & Sons LtdAffinerie de Pont-Sainte-Maxence S.A.S.Societe de Traitments Chimiques des Metaus Holding S.A.R.L. Societe de Traitments Chimiques des Metaus S.A.S. Societe Imobilere et Industrielle de Toulouse-NordS.A.R.L.Zimco Group (Proprietary) Limited and its subsidiaries
E B Holdings, Inc. Minority Shareholders
13.5%86.5%
�250,000,00010% Senior PIK Notesdue 2015
�235,000,00010 1/8% Senior Notes due 2013
Source � Eco-Bat

Eco-Bat ⎪ January 2006
138 European High Yield Research
Bond Covenant Bond description 10.125% Senior Notes due 2013 10% PIKs due 2015
Issuing entity Eco-Bat Finance plc E B Holdings, Inc.
Ranking Senior Senior
Position vs. bank debt Structurally subordinate Structurally subordinate
Position vs. other bonds Structurally senior Structurally subordinate
Security/guarantees Parent guarantee and some subsidiary guarantors None
Optional redemption
! Make whole � none
! Equity Claw � Prior to 31 January 2006 maximum 35% at 110.125%
! Call Schedule:
31 January 2008 � 105.063%
31 January 2009 � 103.375%
31 January 2010 � 101.688%
31 January 2011 � 100%
! Call Schedule:
15 February 2007 � 102%
15 February 2008 � 101%
15 February 2009 � 100%
Tax redemption Yes at par Yes at par
Negative pledge Yes � limitation on liens with carve outs (major one is for £50m of bank debt)
Yes � limitation on liens with substantial carve outs
Cross default Yes Yes
Fall away covenants No No
Anti-layering No No
Change of control
Put at 101 � based on a new owner having greater than 50% of voting rights or if a group has more than the voting power of existing Principal (HM Meyers) or substantial sale of assets.
Put at 101 � based on a new owner having greater than 50% of voting rights or if a group has more than the voting power of existing Principal (HM Meyers) or substantial sale of assets (or at 100% if fail to own >80% of Ecobat Technologies).
Asset sales
Market value and >75% to be in cash or equivalents. Within 1 year reinvest in similar business or repay debt. Any proceeds remaining (subject to £5m minimum) must be used to tender for bonds at par.
Market value and >75% to be in cash or equivalents. Within 1 year reinvest in similar business or repay debt. Any proceeds remaining (subject to £5m minimum) must be used to tender for bonds at par.
Debt limit
Fixed charge coverage ratio must exceed 2.5:1.
Carve outs: ! Bank debt up to £50mn (as reduced by
any pay down from asset sales);
! Capital leases and similar up to £5mn;
! General basket of £10mn.
Fixed charge coverage ratio must exceed 2.5:1 (which excludes PIK interest) then Ecobat and subsidiaries may borrow.
Carve outs: ! Bank debt up to £50mn (as reduced by
any pay down from asset sales);
! Capital leases and similar up to £5mn;
! General basket of £10mn.
Restricted payments
Subject to being able to incur £1 of additional debt then: ! 50% of consolidated net income;
! £8mn general basket.
Subject to being able to incur £1 of additional debt then restricted investment only up to: ! 50% of consolidated net income;
! £8mn general basket.
Transactions with affiliates Must be no less favourable than if executed with an unrelated person. If >£1mn requires board certificate and fairness opinion from an external advisor.
Must be no less favourable than if executed with an unrelated person. If >£1mn requires board certificate and fairness opinion from an external advisor.
Source � BNP Paribas, Eco-Bat

Eco-Bat ⎪ January 2006
139 European High Yield Research
Eco-Bat, Financial Model FYE 31 December Restated Forecast ForecastGBP mn 2002 2003 Q1 04 Q2 04 Q3 04 Q4 04 2004 Q1 05 Q2 05 Q3 05 2005 2006
PROFIT & LOSS Turnover 339.2 417.4 137.6 143.3 147.7 163.7 592.3 150.7 161.1 152.3 627.1 642.8 Cost of Sales -289.3 -352.8 -109.4 -114.1 -120.6 -134.0 -478.1 -122.8 -129.4 -123.0 Gross Profit 49.9 64.6 28.2 29.2 27.1 29.7 114.2 27.9 31.7 29.3 Operating expenses -28.1 -40.7 -11.0 -11.6 -11.7 -13.6 -47.9 -11.5 -14.6 -13.6 Operating Profit 21.8 23.9 17.2 17.6 15.4 16.1 66.3 16.4 17.1 15.7 Net interest -7.8 -17.3 -3.9 -4.4 -3.5 -4.5 -16.3 -4.5 -6.7 -3.5 Profit Before Tax 14.0 6.6 13.3 13.2 11.9 11.6 50.0 11.9 10.4 12.2 Tax -3.5 -1.9 -4.4 -5.0 -3.9 -3.3 -16.6 -4.0 -4.1 -4.1 Profit After Tax 10.5 4.7 8.9 8.2 8.0 8.3 33.4 7.9 6.3 8.1 MSI -0.2 0.1 0.0 -0.1 0.0 0.0 -0.1 0.0 0.0 0.0 Preference dividends -1.7 -1.4 -0.4 -0.4 -0.4 -0.2 -1.4 -0.3 -0.2 0.0 Retained Profit/(Loss) 8.6 3.4 8.5 7.7 7.6 8.1 31.9 7.6 6.1 8.1
D&A 10.6 15.2 4.0 4.2 4.2 4.4 16.8 4.1 4.5 4.7 Other adjustments 0.0 0.3 -0.3 -0.3 0.0 0.0 0.0 EBITDA 32.4 39.4 21.2 21.8 19.6 20.2 82.8 20.5 21.6 20.4 82.7 79.0
Revenue growth y/y 1.3% 23.1% 39.0% 42.3% 47.6% 39.2% 41.9% 9.5% 12.4% 3.1% 5.
9% 2.5%
Gross margin 14.7% 15.5% 20.5% 20.4% 18.3% 18.1% 19.3% 18.5% 19.7% 19.2% EBITDA margin 9.6% 9.4% 15.4% 15.2% 13.3% 12.3% 14.0% 13.6% 13.4% 13.4% 13.2% 12.3%
CASHFLOW
Change in working capital 10.8 -14.1 -20.7 Cashflow from operating activities 43.2 25.3 -0.1 16.3 14.5 31.4 62.1 15.8 15.3 34.1
Tax paid -4.2 -4.8 -0.5 -5.6 -1.6 -2.4 -10.1 -0.9 -10.0 -3.4
Cashflow from returns on investments
-9.7 -18.2 -5.9 -2.9 -7.6 -1.3 -17.7 -8.4 -4.1 -7.4
Capex -11.0 -16.4 -2.9 -2.9 -2.7 -5.8 -14.3 -5.5 -4.2 -5.0 Net acquisitions -0.3 -39.9 0.0 0.0 -1.4 -0.3 -1.7 0.0 0.0 -8.2 Other 1.3 -0.2 0.1 0.0 0.1 0.4 0.6 0.0 0.1 0.0 Cashflow from financing -10.0 -56.5 -2.8 -2.9 -4.0 -5.7 -15.4 -5.5 -4.1 -13.2
Net debt repayment -17.1 59.7 5.6 -3.5 0.0 49.9 52.0 1.0 -24.6 -0.6 other -1.7 -5.7 1.8 -1.0 0.6 -40.4 -39.0 -10.1 19.5 7.7 Cashflow from financing -18.8 54.0 7.4 -4.5 0.6 9.5 13.0 -9.1 -5.1 7.1
Net change in cash 0.5 -0.2 -1.9 0.4 1.9 31.5 31.9 -8.1 -8.0 17.2
BALANCE SHEET
Cash 8.0 12.4 14.7 11.2 10.4 78.6 78.6 78.7 39.9 42.0
Bank debt 6.4 8.3 3.3 3.3 Finance leases 4.9 4.8 4.1 4.1 �10.125% 2013 116.3 110.7 166.4 166.4 Residual HY bonds 24.1 24.1 24.1 24.1 Other -12.4 -8.0 -11.3 -11.3 Gross debt 77.4 139.3 146.4 139.9 141.9 186.6 186.6 186.0 164.6 162.7
Net debt 69.4 126.9 131.7 128.7 131.5 108.0 108.0 107.3 124.7 120.7
10% EB Holdings PIK Notes 172.0 169.0 178.0
LTM RATIOS
Coverage 4.2 2.3 3.2 4.0 5.0 5.1 5.1 4.9 4.3 4.3 EBITDA-Capex/Interest 2.7 1.3 2.1 3.0 4.2 4.2 4.2 3.9 3.3 3.2 Gross leverage 2.4 3.5 2.8 2.1 1.7 2.3 2.3 2.3 2.0 2.0 Net leverage 2.1 3.2 2.5 1.9 1.6 1.3 1.3 1.3 1.5 1.5
Net leverage including PIKs 3.4 3.6 3.6
Source � BNP Paribas Estimates, Eco-Bat

Editis ⎪ January 2006
140 European High Yield Research
Editis Bond Description & Market Data, as of 05 January 2006
Next Call Issuer Credit Trend: Stable
Description Amount (o/s) Ratings Date Price Price YTW STW
8.375 % Senior Notes due 2014 EUR 150mn B3/B 28-Oct-08 108.375 112 1/2 5.89% 291 bp Source � BNP Paribas
Company Profile Editis SA is a leading publisher of French language general literature, educational and reference books in France. The company is also a leading book distributor, with an established selling and distribution network throughout France, Belgium, Canada and Switzerland, through which the company sells and distributes titles of its own publishing houses and those of third party publishers. Editis had �769mn of net revenues and �100mn pro forma EBITDA for the twelve-month period ended 30 September 2005. LTM net total leverage at 30 September 2005 was 4.0x.
Investment Recommendation We have a HOLD rating on Editis' bond, with a Stable underlying credit trend. The bond rating is primarily due to valuations which remain tight. Editis' 3rd quarter results were healthy and we are not expecting significant deviation in 2006. The primary investor concern, about lost distribution orders remains unresolved and heightens M&A risk in 2006.
Debt Profile The company's bond and bank debt were issued as part of the LBO by Wendel Investissement in 2004. The company issued �150mn in senior high yield bonds callable in 2008 (NC4). The 8.375% bonds were issued by Odyssee 1, an intermediate holding company of Editis assets, and have a first ranking pledge against shares in Odyssee 1, certain dedicated bank accounts of Odyssee 1 and Editis Holding, and the intercompany loan from Editis Holding SA.
Senior Credit Agreement
As part of the LBO, the company agreed a �417mn senior credit facility of which �247mn was drawn as of 30 September 2005, including term loan tranche A1 of �79mn, tranche B1 of 84mn and tranche C1 of �84mn. The company also has a �50mn acquisition facility of which �10mn was drawn at 30 September 2005. Odyssee 1 S.A.S., Editis Holding S.A., Editis S.A. and certain subsidiaries of Editis Holding S.A. guarantee the obligations of the borrowers under the Senior Credit Agreement. Odyssee 1 S.A.S. and Editis Holding S.A. and certain foreign operating subsidiaries are guarantors of the notes. Odyssee 1 S.A.S., Editis Holding S.A., Editis S.A. and certain subsidiaries of Editis Holding S.A. have granted a security interest in favour of the lenders under the Senior Credit Agreement over shares, bank accounts, receivables material intellectual property, businesses and certain other material assets.
Term A Facility Amortisation Schedule Date Installment (% of loan)
30 June 2005 5.00% 31 December 2005 5.25% 30 June 2006 5.25% 31 December 2006 6.00% 30 June 2007 6.00% 31 December 2007 6.75% 30 June 2008 6.75% 31 December 2008 7.00% 30 June 2009 7.00% 31 December 2009 9.75% 30 June 2010 9.75% 31 December 2010 12.75% 30 September 2011 12.75%
Source - Editis
Aizaz Shaikh +44 20 7595 8607 [email protected]

Editis ⎪ January 2006
141 European High Yield Research
Editis Structure
Wendel(Fr)
Odyssée Holding(Fr)
Odyssée 1(Fr)
Editis Holding(Fr)
100%
100%
100%
Odyssée Financing(Lux)
Issuer of Notes
Guarantor of Notes
99.99%
0.01%
Senior Notes (�150.0 million)
Operating Subsidiaries (Fr)
Subordinated Intercompany Loan
Editis (Fr) Foreign Operating Subsidiaries
100% 100% 100%
Senior Credit Facility (�4.4 million)
Revolving Credit Facility
Senior Credit Facility
Source � Editis

Editis ⎪ January 2006
142 European High Yield Research
Bond Covenant Bond description EUR 150mn 8.375% Senior Notes 2014
Issuing entity Odyssee Financing SA, a holding company
Ranking Senior notes
Position vs. bank debt Structurally subordinated to the Holdco credit facility, structurrally and contractually subordinated to Editis Holding SA credit facility
Position vs. other bonds No other bonds outstanding
Security/Guarantees
(i) First ranking pledge of the �150.0mn subordinated intercompany loan from the issuer to Editis Holding S.A.; (ii) First ranking pledge over the shares of Odyssée 1 S.A.S. and (iii) a first ranking pledge over certain dedicated bank accounts of Odyssée 1 S.A.S and Editis Holding S.A
Optional redemption
! Equity Claw � prior to 15 October 2007 (40%) at 108.375% plus accrued and unpaid interest and additional amounts.
! Call Schedule:
28 October 2008 � 108.375% 28 October 2009 � 104.188% 28 October 2010 � 102.792% 28 October 2011 � 101.396% 28 October 2012 � 100.000%
Tax redemption Yes � at par
Negative pledge Yes
Cross default Yes
Fall away covenants Yes
Anti-layering Yes (Debt and Liens)
Change of control Put at 101, 50%+ of voting power
Asset sales Except for permitted assets swap, at least 75% of the consideration must be in the form of cash or cash equivalents
Debt limit
The company may not incur debt unless pro forma coverage exceeds 2.0x. Carve outs: ! Bank debt not to exceed �305mn outstanding at any one time minus (i) the amount of
any permanent repayments or prepayments of any such Debt with the proceeds of Asset Sales plus (ii) revolving Indebtedness and letters of credit not to exceed the greater of �100mn (less pay downs from Asset Sales) and the amount of the Borrowing Base as of the date of such incurrence. (Borrowing Base = 80% of accounts receivable plus 50% of inventory);
! Leases not to exceed the greater of �20mn of 2% of total assets;
! General Basket of �30mn;
! Debt incurred in connection with the acquisition of a Person engaged in a Similar Business up to an amount equal to 100% of net cash proceeds received by the Parent Guarantor from the issuance or sale of its Equity Interests.
Source � BNP Paribas, Editis

Editis ⎪ January 2006
143 European High Yield Research
Bond Covenant Bond description EUR 150mn 8.375% Senior Notes 2014
Restricted payments
Carveouts: ! 50% of consolidated net income from 1 October 2004 to the end of the most recently
ended quarter;
! 100% of the net cash proceeds or FMV of marketable securities received by the Parent Guarantor as consideration for the issuance or sale of (i) Equity Interests or (ii) Indebtedness, Disqualified Share Capital or preference shares that have been converted into or exchanged for Equity Interests;
! 100% of cash (and FMV of marketable securities) received in connection with the sale or disposition of Restricted Investments.
! Post IPO, 6% per annum of net cash proceed received
! General basket of �35mn.
Transactions with affiliates
The company will not permit any transaction with affiliates company unless: ! Terms of the transaction taken as a whole are not materially less favourable to the
company or its subsidiaries;
! If the transaction involves an aggregate amount in excess of �5mn, and has been approved by the majority of the board of directors;
! If the transaction involves an aggregate amount in excess of �25mn, and has received an independent opinion from a third party (professional Financial advisor) and that this transaction is fair from a financial standpoint.
Limitations on liens No Carve out
Source � BNP Paribas, Editis

Editis ⎪ January 2006
144 European High Yield Research
Editis, Financial Model FYE 31 December Historic Historic Historic Historic Historic PF Historic Historic Historic Historic Historic Historic Proj�d Proj�d Proj�d
EUR mn FY 02 H1 03 H1 03 FY 03 H1 04 H1 04 Q3 04 Q4 04 FY 04 Q1 05 Q2 05 Q3 05 FY 05 FY 06 FY 07 PROFIT & LOSS Revenue 693 277 420 697 294 294 210 213 717 143 176 236 757 731 723 COGS -379 -149 -231 -380 -157 -157 -113 -129 -399 -79 -95 -127 -410 -389 -383 Gross profit 313 127 189 316 137 137 97 85 319 64 81 109 346 342 340 SG&A -261 -125 -137 -262 -127 -127 -68 -67 -261 -63 -69 -70 -262 -263 -265 D&A 27 10 21 30 10 10 13 9 32 4 6 12 34 35 36 EBITDA 80 12 73 85 21 21 43 26 90 5 18 51 86 92 94 P&L Interest -7 -7 -7 -27 -27 -24 Revenue growth y/y 0.6% 6.4% 6.4% 3.0% 12.5% 5.4% -3.4% -1.0% Gross margin 45.3% 46.0% 45.1% 45.4% 46.6% 46.6% 46.3% 39.6% 44.5% 44.6% 45.9% 46.3% 45.8% 46.8% 47.0% SG&A / sales 37.7% 45.2% 32.6% 37.6% 43.1% 43.1% 32.2% 31.3% 36.4% 44.0% 39.1% 29.7% 34.6% 36.0% 36.6% EBITDA margin 11.5% 4.3% 17.4% 12.2% 7.0% 7.0% 20.3% 12.4% 12.5% 3.2% 10.1% 21.7% 11.3% 12.5% 13.0% CASH FLOW Cash Interest -7 -7 -7 -7 -27 -27 -24 Change in working capital 19 -32 43 11 -21 -21 -66 90 3 -3 -28 -27 0 2 2 Cash from Operating Activities 80 -37 106 69 -17 -17 0 0 64 -13 -30 54 67 59 58 Capex -29 -16 -14 -31 -16 -16 -7 -7 -30 -7 -8 -7 -30 -30 -30 Acquisitions/Disposals 0 0 0 0 0 -620 0 0 -672 1 -11 11 -15 -15 -15 Cash from Investing Activities -33 -16 -14 -30 -17 -646 0 0 -707 -7 0 -25 -45 -45 -45 Equity 0 0 0 0 0 180 0 0 180 4 -4 0 0 0 0 Debt Amortization -9 -9 -9 Debt Issuance 0 0 0 0 0 263 0 0 251 0 0 0 10 10 10 Cash from Financing Activities 0 1 0 1 21 640 0 0 579 3 -3 7 1 1 1 Net Change in Cash 47 -52 92 40 -13 -23 0 0 -64 -17 -33 37 23 15 14 BALANCE SHEET Cash & Equivalents 70 63 111 99 90 29 48 48 19 8 6 70 85 99 Overdraft 46 99 55 75 70 2 48 48 36 53 42 40 30 26 Bank Debt 261 261 251 251 251 247 247 246 238 234 Short Term Bridge Loan/Revolver 71 71 0 0 0 0 0 0 0 0 Acquistion Line 0 0 0 0 0 10 10 10 20 20 Bonds- HY 150 150 150 150 150 150 150 150 150 150 Total Debt 553 485 449 449 437 459 448 446 438 430 Net Debt 463 455 401 401 418 451 442 377 353 331 Pensions 26 20 23 21 21 21 32 32 31 30 29 21 21 21 RATIOS Leverage Bank Leverage (gross) 3.5x 2.8x 3.2x 3.3x NA 3.3x 2.9x 2.9x 2.6x 2.5x Total leverage (gross) 5.9x 5.2x 4.8x 5.0x NA 5.0x 4.5x 5.2x 4.8x 4.6x Total leverage (net) 4.9x 4.9x 4.3x 4.5x NA 4.9x 4.4x 4.4x 3.9x 3.5x
Source � BNP Paribas Estimates, Editis

Editis ⎪ January 2006
145 European High Yield Research
This page has been left blank intentionally

Eircom ⎪ January 2006
146 European High Yield Research
Eircom Bond Description & Market Data, as of 05 January 2006
Next Call Issuer Credit Trend: Stable Description Amount (o/s) Ratings Date Price Price YTW STW
8.25 % Sr Sub Nts due 2013 USD 250mn B1/BB- 15-Aug-08 104.125 106 5.77% 101 bp 7.25 % Sr Nts due 2013 EUR 534mn Ba3/BB- 15-Aug-08 103.625 109 4.85% 192 bp 8.25 % Sr Sub Nts due 2013 EUR 281mn B1/BB- 15-Aug-08 104.125 110 1/2 5.37% 226 bp Source � BNP Paribas
Company Profile Eircom is the incumbent provider of fixed-line telecommunications services in Ireland. As such, the majority of the company's revenue derives from voice telephony for residential customers provided over Eircom's local loop. Throughout the three-year period ended 31 March 2003, the company had a market share of approximately 80% of the Irish fixed-line market based on turnover. As of March 2003, it had approximately 1.9 million fixed-line telephone access channels in service, of which approximately 1.6 million were basic public switched telephone network, or PSTN, lines. Approximately 351,000 were advanced integrated services digital network, or ISDN, channels that permit simultaneous, high speed transmission of voice and data over its network. The company had turnover of �1.6bn and an EBITDA of �652m for the 12 months ending 30 September 2005 and net leverage of 3.0x on an LQA basis.
Investment Recommendation
We dropped our rating to HOLD from BUY in light of the Swisscom bid and potential of a clawback. With the breakdown of the bid the CDS has widened, though the bonds remain fairly stable. We think that interest in the company is likely to continue though the potential acquirors may not be as attractive.
Debt Profile The company's debt was issued in 2003 as part of the LBO led by Providence Equity partners, Soros Private equity and other shareholders. The company's debt consists principally of senior and subordinate HY bonds and senior secured bank facilities. The company�s bonds have a standard high yield package which amended during the company�s IPO in 2004 to facilitate dividending of proceeds to shareholders. Bond Debt ! 7.25% 2013 bonds :The �534mn senior unsecured notes outstanding were issued by Valentia Telecommunications, an
intermediate holding company of Eircom Ltd (the operating subsidiary) and have a senior guarantee from Eircom Ltd, the owner of the Eircom operating subsidiaries.
! 8.25% 2013 bonds: The �281mn and $250mn senior subordinated, unsecured notes outstanding were issued by Eircom Funding, a subsidiary of Valentia Telecommunications, the intermediate holding company of Eircom Ltd (the operating subsidiary) and have a senior subordinated guarantee from Eircom Funding and Valentia Telecommunications, which both rank junior to guarantees under the 7.25% bonds and the senior secured facilities.
Credit Facilities Currently the company has �1,204mn in bank debt outstanding from its a �1.4bn credit agreement. These facilities include: (i) a seven-year, �730mn amortising term loan facility, of which � 694mn was drawn as of 30 September 2005; (ii) an eight-year, �260mn term loan facility, of which �260mn was drawn as of 30 September 2005; (iii) a nine-year, �260mn term loan facility; of which �250mn was drawn as of 30 September 2005; and (iv) a seven-year revolving facility of up to �150mn, of which �0m was drawn as of 30 September 2005. The obligations of the borrowers under the facilities agreement are guaranteed by Valentia, eircom, ITI and other companies in the group. They are secured by shares in eircom and the shares of other material subsidiaries, all of the tangible and intangible assets and Eircom Funding�s rights under the inter company loan agreement.
Lease Transactions
! Operating leases: as of September 2005 the value of assets leased to a third party was � 216mn. ! Finance leases: as of September 2005 the aggregate amount outstanding under all the lease agreements is �139mn.
Aizaz Shaikh +44 20 7595 8607 [email protected]

Eircom ⎪ January 2006
147 European High Yield Research
Eircom Structure
Valentia Holdings
Valentia
�1.4bn CreditFacility
�534m 7.25%Senior Notes
eircom
Senior Notes eircom Guarantee
New Credit Facility Guarantee(3)
eircom Funding(Holdings) Limited
Eircom FundingInter-company
Loan(4)�285m 8.25%
Sr Sub Nts$212m 8.25%
Sr Sub Nts
Senior Subordinated eircom Guarantee(2)
Senior Subordinated Valentia Guarantee(1)
Subordinated Holdings Guarantee(4)Valentia Holdings
Valentia
�1.4bn CreditFacility
�534m 7.25%Senior Notes
eircom
Senior Notes eircom Guarantee
New Credit Facility Guarantee(3)
eircom Funding(Holdings) Limited
Eircom FundingInter-company
Loan(4)�285m 8.25%
Sr Sub Nts$212m 8.25%
Sr Sub Nts
Senior Subordinated eircom Guarantee(2)
Senior Subordinated Valentia Guarantee(1)
Subordinated Holdings Guarantee(4)
Source � Eircom
1. The Senior Subordinated Valentia Guarantee is a guarantee of all amounts payable under the Senior Subordinated Notes and ranks junior in right of payment to the Credit Facility and the Senior Notes. 2. The Senior Subordinated eircom Guarantee is a guarantee of all amounts payable under the Senior Subordinated Notes and ranks junior in right of payment to the New Credit Facility Guarantee. The Senior Subordinated eircom Guarantee may be released in certain circumstances. 3. Credit Facility Guarantee is a full and unconditional guarantee of all amounts payable under the terms of the Credit Facility and is a senior obligation of eircom. The Credit Facility and the Credit Facility Guarantee is be secured by a pledge of the shares of eircom and a fixed and floating charge over the assets (subject to some exceptions) of Valentia, eircom and Irish Telecommunications Investments Limited, or ITI. The New Credit Facility is also guaranteed by certain companies in the group. 4. The Subordinated Holdings Guarantee is a full and unconditional guarantee of all amounts payable under the Senior Subordinated Notes and ranks junior in right of payment to all other existing and future indebtedness of Valentia Holdings (except any such indebtedness that expressly provides by its terms that it will rank equally in right of payment with the Subordinated Holdings Guarantee).

Eircom ⎪ January 2006
148 European High Yield Research
Bond Covenant Bond description EUR 550mn 7.25% Senior Notes 2013
Issuing entity Valentia Telecommunications Ltd (private)
Ranking Senior notes
Position vs. bank debt Pari passu
Position vs. other bonds Structurally and contractually subordinated
Security/Guarantees Senior guarantees from Eircom Group Plc Notes are senior, unsecured obligation of Eircom Group Plc
Optional redemption
! Make Whole � prior to 15 March 2008 at bunds+50bp
! Equity Claw � prior to 15 August 2006 max 35% of issue at 107.25+accrued and unpaid interest
! Call Schedule:
15 August 2008 � 103.625% 15 August 2009 � 102.417% 15 August 2010 � 101.208% 15 August 2011 � 100.000%
Change of control Put at 101, 50% + of voting power
Tax redemption Yes � at par
Negative pledge Yes
Cross default Yes
Fall away covenants Yes
Anti-layering No
Asset sales
The company will not permit any Asset disposition unless: ! The company receives consideration al least equal to fair market value as determined
in good faith by the board of directors;
! Equal to 100% of the net available cash from such asset disposition.
Debt limit
Debt is permitted up to 5x consolidated leverage or in the case of an Incurrence of Senior Debt, then senior leverage ratio for the company + subsidiaries less than 3.5x. Carve outs: ! Credit facility and refinancing Indebtedness can not exceed �1.4 billion less;
! Hedging: interest rates, currency or commodities;
! CLOs, PMO obligations up to �150mn and 3.75% of Total assets;
! General basket up to �100mn and 2.5% of Total.
Restricted payments
If company can raise �1.00 of debt then 50% net income less 100% net loss. Carve outs: ! Payments of dividends following the covenant �Debt Limit�.
! Repurchase of stock from employees up to �5mn in any calendar year � in any event up to a total of �10mn a year.
! Dividends in any calendar year, up to 6% of aggregate net cash proceeds, from all public offerings.
! Dividends, loans and advances to any parent up to �200,000.
! General basket up to �75mn.
Transactions with affiliates
The company will not permit any transaction with affiliates company unless: ! Terms of the transaction taken as a whole are not materially less favourable to the
company or its subsidiaries;
! If the transaction involves an aggregate amount in excess of �10mn, and has been approved by the majority of the board of directors;
! If the transaction involves an aggregate amount in excess of �20mn, and has received an independent opinion from a third party (professional) and that this transaction is fair from a financial standpoint.
Limitation on liens No carve out
Source � BNP Paribas, Eircom

Eircom ⎪ January 2006
149 European High Yield Research
Bond Covenants EUR 285mn + USD 250mn 8.25% Senior Sub Notes 2013
Bond description EUR Notes USD Notes
Issuing entity Eircom Funding (Private) Ranking Senior Subordinated notes Position vs. bank debt Structurally subordinated Position vs. other bonds Contractually subordinated
Security/Guarantees Senior subordinated guarantees from Valentia and Eircom Subordinated guarantee from Valentia Holdings (parent)
Optional Redemption
! Make Whole � prior to 15 August 2008 at bunds+50bp
! Equity Claw � prior to 15 August 2006 max 35% of issue at 108.25% + accrued and unpaid interest + additional amounts
! Call Schedule: 15 August 2008 � 104.125% 15 August 2009 � 102.750% 15 August 2010 � 101.375% 15 August 2011 � 100.000%
Make Whole � prior to 15 August 2008 at treasuries+50bp
Tax redemption Yes � at par + accrued interest + additional amount Negative pledge Yes Cross default Yes Fall away covenants Yes Anti-layering Yes Change of control Put at 101, 50%+ of voting power
Asset sales Yes - Must be fair market value; at least 75% of consideration in cash or cash equivalents for 365 days, proceeds may be used: to repay senior indebtedness, to make investments/capex
Debt limit
Debt is permitted up to 5x pro forma consolidated leverage or 3.5x senior leverage if it is in a case of Senior Debt issuance. Carve outs: ! Credit facility and refinancing Indebtedness can not exceed �1.4bn less.
! Hedging: interest rates, currency or commodities.
! CLOs, PMO obligations up to �150mn and 3.75% of Total assets.
! General basket up to �100mn and 2.5% of Total assets.
Restricted payments
If company can raise �1.00 of debt then 50% net income less 100% net loss. Carve outs: • Payments of dividends following the covenant �Debt Limit�. • Repurchase of stock from employees up to �5mn in any calendar year � in any event
up to a total of �10mn a year. • Dividends in any calendar year, up to 6% of aggregate net cash proceeds, from all
public offerings. • Dividends, loans and advances to any parent up to �200,000. • General basket up to �75mn.
Transactions with affiliates
Limitation on affiliate transactions unless: ! Transaction is not less favourable to the company or such restricted subsidiaries;
! transaction involves an aggregate consideration in excess of �10mn, majority of the board of director is required;
! transaction involves an aggregate consideration in excess of �20mn, fairness opinion is needed.
Limitation on liens Liens securing Indebtedness incurred pursuant to any Credit Facility, liens existing on the Issue Date, liens with respect to obligations that do not exceed �5mn.
Source � BNP Paribas, Eircom

Eircom ⎪ January 2006
150 European High Yield Research
Eircom, Financial Model FYE 31 March Historic Historic Historic Historic Historic Historic Historic Historic Historic Historic Proj�d Proj�d EUR mn FY 02 FY 03 FY 04 Q1 05 Q2 05 Q3 05 Q4 05 FY 05 Q1 06 Q2 06 FY 06 FY 07 PROFIT & LOSS Revenue 1,645 1,682 1,628 402 400 401 399 1,602 399 403 1,618 1,642 COGS -508 -499 -410 -97 -94 -93 -94 -378 -264 -268 -485 -493 Gross profit 1,137 1,183 1,218 305 306 308 305 1,224 135 135 1,133 1,150 SG&A -674 -648 -632 -201 -163 -160 -100 -624 0 0 -566 -567 EBITDA 463 535 586 104 143 148 205 600 135 135 566 583 P&L Interest -59 -134 -157 -33 -32 -32 -31 -128 -35 -30 -165 -185 Revenue growth y/y 2.2% -3.2% -2.0% -3.6% -0.2% -0.5% -1.6% -0.7% 0.8% 1.0% 1.5% Gross margin 69.1% 70.3% 74.8% 75.9% 76.5% 76.8% 76.4% 76.4% 33.8% 33.5% 70.0% 70.0% SG&A / sales 41.0% 38.5% 38.8% 50.0% 40.8% 39.9% 25.1% 39.0% 0.0% 0.0% 35.0% 34.5% EBITDA margin 28.1% 31.8% 36.0% 25.9% 35.8% 36.9% 51.4% 37.5% 33.8% 33.5% 35.0% 35.5% CASH FLOW Cash Interest -9 -137 -142 -10 -54 -13 -48 -125 -9 0 -149 -165 Change in working capital 51 19 -24 -28 -14 47 1 6 0 0 -25 -25 Cash from Operating Activities 328 497 490 114 107 180 142 543 146 106 486 519 Capex -276 -239 -227 6 -134 53 -47 -122 -59 -56 -250 -250 Acquisitions/Disposals 237 185 -1 0 0 0 0 0 0 0 Equity dividend paid -66 0 -400 0 0 -32 32 0 0 0 Cash from Investing Activities -14 -190 -920 -1 -189 -69 -91 -350 -66 13 Debt Repayment -87 -181 -2,230 0 0 0 0 0 0 0 Issue of Senior & subordinated notes 0 0 1,060 0 0 0 2 2 0 0 Additions to loan capital 0 0 1,250 0 0 0 0 0 0 0 Cash from Financing Activities -135 -182 342 -92 -3 -4 -1 -100 0 -110 Net Change in Cash 179 125 -88 21 -85 107 50 93 80 9 31 46 BALANCE SHEET Cash & Equivalents 316 440 422 380 320 396 389 389 468 477 420 466 Bank Debt 2,548 1,055 1,049 998 1,000 1,045 1,003 1,242 1,250 1,204 1,190 1,065 Bonds- HY 1,282 1,263 1,266 1,266 1,266 1,266 1,027 1,019 1,027 1,015 1,015 7.25% �550m Sr Nts 2013 550 550 550 550 550 550 534 534 534 534 534 8.25% �285m Sr Sub Nts 2013 285 285 285 281 281 281 281 281 281 281 281 8.25% $250m Sr Sub Nts 2013 218 225 225 229 229 229 1 1 0 200 200 8.25% $250m Sr Sub Nts 2013 (calc�d) 229 203 206 206 206 206 211 203 212 2,205 2,080 Total Debt 2,548 2,337 2,312 2,264 2,266 2,311 2,269 2,269 2,269 2,231 1,785 1,614 Net Debt 2,232 1,897 1,890 1,884 1,946 1,915 1,880 1,880 1,801 1,754 420 466 RATIOS Leverage Bank Leverage (gross) 2.4x 2.2x 2.2x 2.3x 2.3x 2.1x 2.1x 2.0x 1.1x 2.1x 1.8x Senior Notes Leverage (gross) 3.4x 3.1x 3.2x 3.3x 3.4x 3.0x 3.0x 2.8x 1.6x 3.0x 2.7x Total leverage (gross) 4.4x 3.9x 4.1x 4.2x 4.3x 3.8x 3.8x 3.6x 2.1x 3.9x 3.6x Total leverage (net) 3.5x 3.2x 3.4x 3.6x 3.5x 3.1x 3.1x 2.9x 1.6x 3.2x 2.8x
Source � BNP Paribas Estimates, Eircom

Eircom ⎪ January 2006
151 European High Yield Research
This page has been left blank intentionally

EMI ⎪ January 2006
152 European High Yield Research
EMI Bond Description & Market Data, as of 05 January 2006
Next Call Issuer Credit Trend: Negative
Description Amount (o/s) Ratings Date Price Price YTW STW
8.25 % Nts due 2008 GBP 325mn Ba1/BB+ NC NC 108 1/5 5.90% 128 bp 8.375 % Nts due 2009 USD 500mn Ba1/BB+ NC NC 105 8/9 6.53% 176 bp 8.625 % Sr Nts due 2013 EUR 425mn Ba1/BB+ 15-Oct-08 104.313 113 3/4 4.74% 179 bp Source � BNP Paribas
Company Profile EMI is one the 3 major recorded music and music publishing companies with revenues of £2,016mn and EBITDA of £240mn for the 12 months ended 30 September 2005. At that time, the company had net leverage of 3.6x (gross leverage of 5.3x). The company's business is split into two segments, Recorded Music and Music Publishing. EMI's Recorded Music segment is the third largest in the world, based on turnover and has one of the world�s most extensive catalogues of recordings, with over three million individual tracks. Its record labels include EMI, Virgin, Capitol, Parlophone, Chrysalis, Mute, Blue Note and EMI Classics which are home to a diverse roster of over 1,300 artists, encompassing a wide range of musical genres. The company's Music Publishing business is the world�s largest music publisher in terms of turnover, with rights to over one million copyrights in musical compositions.
Investment Recommendation We remain HOLD on EMI, with NEGATIVE underlying credit trend. Recent results affirm our view that the company�s operating performance will continue to fluctuate between neutral and negative, with periodic disappointment in record sales. We are not of the view that the record industry is entering a cyclical upturn as we believe the underlying pressure from the digitalisation of products presents deeper and longer term consequences than have currently surfaced. As such we expect the company to remain within non-investment grade territory for several years.
Debt Profile
The company's debt comprises bond debt including notes issued by Capitol Records, EMI Group PC and EMI Group Finance and long term bank facilities. We believe that EMI's bank and bond debt generally bear similar protection, from a seniority and guarantee perspective, by virtue of both upstream and downstream guarantees in the respective Capitol Records and EMI plc bond indentures. Capitol Records Notes Capitol Records, Inc. has issued USD 500mn aggregate principal amount of indebtedness under its 8.375% Guaranteed Notes due 2009. The 8.375% notes are direct, unsecured and unsubordinated indebtedness. The 8.375% notes are not secured by any of the company assets. EMI Group Finance Ltd Notes In September 2003, EMI Group Finance (Jersey) Limited, a wholly owned subsidiary of EMI Group Plc, issued $243mn aggregate principal amount of 5.25% guaranteed convertible bonds due 2010. These convertible bonds are direct, unsecured and unsubordinated indebtedness. EMI Plc Bonds EMI Group plc initially issued £250mn 8.25% Bonds due 2008, then one month later issued an additional £75mn under the same indenture. These 8.25% bonds are direct, unconditional, unsecured and unsubordinated indebtedness. In September 2003, the company issued �425mn 8.625% notes due 2013 from EMI Group Plc, the same issuer of the 8.25% notes and the company's bank facility. These notes were issued as high yield bonds and bear a standard high yield covenant package, as well as 5 years of call protection. Revolving Credit Facility The company agreed in September 2003, to enter into a new £250mn senior revolving credit facility. We estimate that there was £60mn outstanding under this facility as of September 2005.
Aizaz Shaikh +44 20 7595 8607 [email protected]

EMI ⎪ January 2006
153 European High Yield Research
EMI Structure
�243.8 millionConvertibleBonds due 2010
EMI Group plc
EMI Group Finance plcVirgin Music Group
Limited
EMI GroupHoldings (UK) Limited
Virgin Records Limited
VRL I Limited EMI Limited
EMI Group Finance plc(Jersey) Limited
EMI GroupWorldwide Limited
EMI Group InternationalHoldings Limited
EMI Records Limited EMI MusicPublishing Limited
EMI Music InternationalServices Limited
EMI GroupHoldings BV
EMI GroupInternational BV
EMI GroupNorth Ame ricaHoldings Inc.
Capital RecordsInc.
£325 millionBonds due 2008
�425 millionSenior Notes due 2013
�250 millionSenior Revolving Credit Facility
$500 millionGuaranteed Notes due 2009
Source � EMI

EMI ⎪ January 2006
154 European High Yield Research
Bond Covenants GBP 325mn 8.25% Senior Notes due 2008 EUR 425mn 8.625% Senior Notes due 2013
Bond description GBP Notes EUR Notes
Issuing entity EMI Group plc
Ranking Senior notes
Position vs. bank debt Pari passu with all senior indebtedness of EMI Group Plc/Structurally subordinated to the secured indebtedness of EMI subsidiaries.
Position vs. other bonds Pari passu
Security/Guarantees
The company�s obligations under the notes are guaranteed on a senior unsecured basis by the guarantors, the same subsidiaries that are expected to guarantee (EMI Group Finance plc, Capitol Records, Inc., Virgin Records Limited, EMI Music Publishing Limited, EMI Records Limited, EMI Music International Services Limited, VRL 1 Limited and EMI Group International Holdings Limited)
Optional redemption ! Equity Claw � prior to 20 May 2006
max 35% of issue at - % + coupon, if 65% of the notes remain outstanding
! Equity Claw � prior to 15 Oct 2006 max 35% of issue at 108.625% + coupon, if 65% of the notes remain outstanding
! Call Schedule:
15 Oct 2008 � 104.321% 15 Oct 2019 � 102.875% 15 Oct 2010 � 101.437% 15 Oct 2011 � 100.000%
Tax redemption Yes at par + accrued and unpaid interest
Negative pledge Yes
Cross default Yes
Fall away covenants Yes
Anti-layering Yes (Debt and Liens)
Change of control Put at 101%, 50.1% of voting share capital
Asset sales 75% cash or cash equivalents.
Issuer may incur Indebtedness (including Acquired Indebtedness) and restricted subs may incur Acquired Indebtedness or Non-Public Indebtedness if Fixed Charge Coverage Ratio for the Issuer's most recently ended four full fiscal quarters for which financials available ≥ 2.5 to 1 on a pro forma basis (as if incurred at beginning of such period)
Issuer may incur Indebtedness (including Acquired Indebtedness) and restricted subs may incur Acquired Indebtedness or Non-Public Indebtedness if Fixed Charge Coverage Ratio for the Issuer's most recently ended four full fiscal quarters for which financials available ≥ 2.5 to 1 on a pro forma basis (as if incurred at beginning of such period) + if indebtedness or disqualified stock or preferred stock had been issued at the beginning of the two semester period then Net Debt to Cash Flow Ratio ≥ 4.5 to 1.
Carve outs: ! CLOs incurred by the company to finance the purchase of lease or improvement
property in the limit of £15mn
Debt limit
Indebtedness of the group (general basket) can�t exceed £600mn at any time
Indebtedness of the group (general basket) can�t exceed £550mn at any time
Source � BNP Paribas, EMI

EMI ⎪ January 2006
155 European High Yield Research
Bond Covenants GBP 325mn 8.25% Senior Notes due 2008 EUR 425mn 8.625% Senior Notes due 2013
Restricted payments
Not to exceed the sum of: ! 50% (minus 100% of any deficit) of Consolidated Net Income
! 100% of the aggregate net cash proceeds or proceeds in the form of Cash Equivalents received by the Company since the Issue Date as a contribution to its ECM
! to the extent that any Restricted Investment that was made after the Issue Date is sold for cash or otherwise liquidated or repaid for cash
! 50% of any dividends received by the Company or a Guarantor
Transactions with affiliates
Not less favourable than arms length transaction; if in excess of £2mn but less than £15mn (CEO & CFO certificate), resolution of majority of non employee disinterested directors; if in excess of £25mn, resolution of the board of directors
Not less favourable than arms length transaction; if in excess of £2mn but less than £15mn (CEO & CFO certificate), resolution of majority of non employee disinterested directors; if in excess of £25mnn, resolution of the board of directors, over £50mn , fairness opinion
Source � BNP Paribas, EMI

EMI ⎪ January 2006
156 European High Yield Research
Bond Covenant USD 243mn 5.25% Guaranteed Convertible Bonds due 2010
Bond description USD Notes
Issuing entity EMI Group Finance Limited
Ranking Unsubordinated and unsecured
Position vs. bank debt Senior to all senior indebtedness of EMI Group Plc/Structurally subordinated to the secured indebtedness of EMI subsidiaries.
Position vs. other bonds Pari passu
Security/Guarantees The obligations of the Issuer under the Bonds and the Preference Shares will be unconditionally and irrevocably guaranteed on an unsubordinated and unsecured basis by the Guarantors
Optional redemption
! at any time on or after 16 October 2007, if the average of the Volume Weighted Average Price per Ordinary Share on at least 20 dealing days in any period of 30 consecutive dealing days ending on the fifth dealing day prior to the giving of the notice of redemption divided by the prevailing Exchange Price has been at least 1.3
! at any time if 85% or more of the aggregate principal amount of the Bonds originally issued shall have been previously purchased and cancelled, redeemed or converted
Issuer�s share settlement option
The Issuer may, and in lieu of redeeming the principal amount of the bonds in cash, deliver to the Bondholders one Preference Share of a paid-up value of US$1,000 per US$1,000 principal amount of such Bond, which Preference Shares will, in turn, be exchanged immediately for such number of Ordinary Shares of the Parent as is determined by dividing the paid-up value of the Preference Share (translated into pounds sterling at the fixed rate of US$1.5957 = £1.00) by the Exchange Price in effect on the due date for redemption and rounded down to the nearest whole number of Ordinary Shares, plus, if applicable, an amount in cash per Bond equal to the amount by which the principal amount payable on the redemption of such Bond exceeds the Market Value of the Ordinary Shares to be so delivered.
Tax redemption No Negative Pledge Yes
Cross default Yes
Fall away covenants Yes
Anti-layering No
Change of control Put at 101%, 50.1% of voting share capital
Asset sales No
Debt Limit No
Restricted payments No
Transactions with affiliates No
Source � BNP Paribas, EMI

EMI ⎪ January 2006
157 European High Yield Research
EMI, Financial Model FYE 31 March Historic Historic Historic Historic Historic Historic Historic Historic Historic Proj�d Proj�d GBP mn FY 02 FY 03 H1 04 H2 04 FY 04 H1 05 H2 05 FY 05 H1 06 FY 06 FY 07 PROFIT & LOSS Revenue 2,446 2,175 960 1,160 2,121 851 1,092 1,943 925 1,980 2,019 COGS -1,727 -1,377 -881 -524 -1,405 -771 -939 -1,710 -838 -1,235 -1,250 Gross profit 719 799 80 636 716 80 153 233 87 744 769 SG&A -836 -643 -676 -676 -542 -553 EBITDA -1 277 77 69 146 93 164 257 77 279 286 P&L Interest -83 -77 -42 -54 -96 -43 -49 -92 -32 -80 -80 Revenue growth y/y -8.5% -11.1% -2.5% -8.4% 8.6% 81.3% 3.9% Gross margin 29.4% 36.7% 8.3% 54.8% 33.8% 9.4% 14.0% 12.0% 9.4% 37.6% 38.1% SG&A / sales 34.2% 29.6% 0.0% 58.2% 31.9% 0.0% 0.0% 0.0% 0.0% 27.4% 27.4% EBITDA margin 0.0% 12.7% 8.0% 6.0% 6.9% 10.9% 15.0% 13.2% 8.3% 14.1% 14.2% CASH FLOW Change in working capital 89 -105 -15 75 60 -90 115 25 -151 -28 -28 Cash Interest -59 -5 -58 -38 -95 -63 -37 -100 -66 -80 -80 Cash from Operating Activities 128 68 -30 210 180 -115 203 87 -145 141 148 Capex -42 -41 17 6 23 -12 -24 -36 -50 -45 Acquisitions/Disposals -24 186 -82 -7 -89 -68 -5 -73 Cash from Investing Activities -192 116 -81 -48 -129 -96 -76 -171 -13 -125 -120 Debt Repayment -459 0 -79 0 0 -45 46 2 0 Cash from Financing Activities 6 -94 120 65 185 38 -35 3 105 0 0 Net Change in Cash -58 89 9 227 236 -173 91 -82 -53 16 28 BALANCE SHEET Cash & Equivalents 86 100 128 343 343 153 241 241 193 257 286 Bank Debt 359 203 198 85 85 106 60 60 60 60 0 Bonds- HY EMI Group Plc 8 5/8% �425m Sr Guar Nts 2013 0 0 0 282 282 287 283 283 283 283 283 EMI Group Plc 9 3/4% (8 1/4%) £325m Guar Nts due 2008 325 325 325 325 325 325 325 325 325 325 325 EMI Group Fin 5 1/4% $243m Guar Convert 2010 0 0 145 132 132 135 132 132 132 132 132 Notes (Junior/PIK) Cap Records 8 3/8% $500m Guar Nts due 2009 348 318 299 271 271 278 272 272 272 272 272 Private Placement - $180m 112 115 108 0 0 0 0 0 0 0 0 Total Debt 1,144 961 1,075 1,094 1,094 1,132 1,072 1,072 1,072 1,072 1,012 Net Debt 1,059 860 948 751 751 979 831 831 879 815 726 RATIOS Coverage Cash Interest Coverage 60.1x 1.3x 1.8x 1.5x 1.5x 4.4x 2.6x 1.2x 3.5x 3.6x Total Coverage 3.6x 1.8x 1.3x 1.5x 2.1x 3.4x 2.8x 2.4x 3.5x 3.6x EBITDA- Capex/Interest 51.3x 1.0x 1.7x 1.3x 1.3x 3.8x 2.2x 1.2x 2.9x 3.0x Leverage Bank Leverage (gross) 0.7x 0.7x 0.6x 0.6x 0.7x 0.2x 0.2x 0.2x 0.2x 0.0x Senior Notes Leverage (gross) 1.9x 2.4x 5.6x 5.6x 5.3x 3.1x 3.1x 3.3x 2.9x 2.6x Total leverage (gross) 3.5x 3.9x 7.5x 7.5x 7.0x 4.2x 4.2x 4.4x 3.8x 3.5x Total leverage (net) 3.1x 3.4x 5.1x 5.1x 6.1x 3.2x 3.2x 3.6x 2.9x 2.5x
Source � BNP Paribas Estimates, EMI

Escada ⎪ January 2006
158 European High Yield Research
Escada Bond Description & Market Data, as of 5 January 2006
Next Call Issuer Credit Trend:
Description Amount (o/s) Ratings Date Price Price YTW STW
7.50% Senior notes due 2012 EUR 200mn B2/BB- 01-Apr-09 103.75 106.25 6.16% 308bp Source – BNP Paribas
Company Profile Escada AG is a leading international manufacturer and marketer of ready-to-wear luxury brand apparel for women. The company operates two businesses, the ESCADA business and the PRIMERA group business. The former operates globally and focuses on the luxury brand apparel for women and the latter focuses on the mid-market apparel segment, particularly in Germany and Europe. In the ESCADA business, the company designs, manufactures and markets luxury brand apparel under the ESCADA brand for daytime, evening, business, sport and leisure activities, as well as for special occasions. The ESCADA apparel has a good reputation for quality, elegance, colour, fit and femininity. The apparel range is complimented by accessories, such as handbags, shoes and small leather goods. The company also grants licenses to produce and market fragrances, eyewear, scarves, ties, jewellery and kids wear for girls under the ESCADA brand. As of 31 January 2005, ESCADA business operated 196 own shops, franchised 284 shops and sold the brand through approximately 600 multi-brand retailers (in over 700 locations). In the PREMIRA Group business, the company designs, produces and sells apparel for women under the apriori, BiBa, cavita and Laurel brands for daytime, business, sport and leisure activities. Each of the aforementioned brands has a defined position in the so-called diffusion and bridge segments of the non-luxury brand apparel market. As of 31 January 2005, the PRIMERA Group business operated 241 own shops and franchised 232 shops. Escada is publicly listed in Germany and as of 31 January 2005, its largest shareholders included HMD Investment Partners LP with 27.3%, Schroder Investment Management Limited with 14.2% and Ley Beteiligungsverwaltungs GmbH (Mr. Wolfgang Ley is a controlling shareholder of this entity) with 10.4%. Escada’s leverage can be defined in two ways – based on the balance sheet indebtedness and on a lease-adjusted basis. We believe that both leverage measures are relevant. The company manufactures branded apparel and sells it both wholesale and via its own or franchised shops. Shops operated by Escada are leased and therefore we think that off-balance sheet operating lease obligations have to be considered as well. The company had net balance sheet leverage of 3.5x at the end of the third quarter of fiscal 2005 (quarter ended 31 July 2005). We also estimate that Escada will have lease-adjusted leverage of approximately 5.9x at the end of fiscal 2005.
Investment Recommendation We maintain our BUY/Positive Credit Trend recommendation for Escada’s 7.5% senior notes due 2012. We think that the company will continue to perform consistently during fiscal 2005/06. We also believe that Escada’s bonds have a solid technical support. In our view, this is due to relatively high agency ratings of the bonds - BB- (Stable Outlook) by S&P and B2 (Positive Outlook) by Moody’s, well-recognised brand name and some additional support from the domestic German investor base. We believe that Escada’s bonds are well-suited for crossover investors who would like to pick up some yield and spread, without being exposed to excessive levels of risk. Also, we think that the company’s notes will have favourable defensive characteristics during the next six months and should be attractive for those traditional high yield investors who are comfortable with the current yield on Escada’s bonds and seek an exposure to the relatively less risky consumer sector names.
We caution that while we believe that the company’s notes should be a relatively safe investment during the next six months, over the longer time horizon Escada’s bonds may become quite volatile. We believe that the company’s earnings can fluctuate significantly (you need go no further than 2003 for a good example). Escada’s profits can be adversely affected by a sudden drop in international travel, by weaker consumer sentiment or by changes in fashion. In addition, Escada’s earnings momentum may slow at some point in the future, following a strong performance in 2005. We note that the company is nearing completion of an extensive (and successful) cost savings programme. Therefore, further cost reductions may be far more difficult to achieve, should the top line deteriorate unexpectedly.
In terms of event risks, we believe that they should be positive, but not immediate. We think that Escada will eventually dispose of its PRIMERA Group brands, which should have a favourable effect on the company’s leverage. However, it will probably happen during the next few years, rather than in the near future.
Oleksiy Soroka, CFA +44 20 7595 4878 [email protected]

Escada ⎪ January 2006
159 European High Yield Research
Debt Profile
As of 31 October 2005, Escada had total balance sheet debt of €234bn, comprising high yield notes (face amount of €200mn) and other financial liabilities (including bank debt, etc.) On 2 March 2005, Escada entered into an unsecured €90.0mn multi-currency revolving credit facility with a syndicate of banks. The facility matures on 31 December 2008. It will be required to be prepaid and the commitment will be reduced if Escada divests all or parts for the PRIMERA Group business. Drawings under the facility will bear a fixed margin for overnight borrowings based on Euro Over Night Index Average (EONIA) and floating rate interest (based on EURIBOR and LIBOR). The syndicate of banks is entitled to request collateral if the banks’ risk assessment of the Escada changes negatively. The obligations under the facility rank pari passu with the high yield notes. In addition, as of 31 January 2005, Escada had available working capital and loan facilities in an aggregate amount of €47.9mn (€33.8mn of which were outstanding as of that date). Finally, as of 31 January 2005, €8.5mn was outstanding under a mortgage loan granted to Grupo ESCADA Espana S.A.
Escada Structure
ESCADA AG
PRIMERAHolding GmbH
PRIMERA AG
ESCADA UK Ltd
ESCADA (USA) Inc
ESCADA Asia Inc
BiBA Mode GmbH
BiBA & pariscopDaub GmbH
Laurèl GmbH
AprioriTextilvertriebsGmbH
PRIMERA(Far East) Ltd
CavitaFashion GmbH
PRIMERARetail GmbH
Guarantors following the 25% acquisition of BiBA GmbH
Guarantors upon registration of a domination agreement between PRIMERA Holding GmbH and PRIMERA AG
Guarantors on the issue date of the notes
€200mn Senior Notesdue 2012
€90mn Senior Credit Facility
Source – Escada

Escada ⎪ January 2006
160 European High Yield Research
Bond Covenant Bond description EUR 200mn 7.5% Senior Notes due 2012
Issuing entity Escada AG
Ranking The notes are senior unsecured obligations of the issuer
Position vs. bank debt Pari passu
Position vs. other bonds Not applicable
Security/Guarantees The notes benefit from an unconditional guarantee on a senior unsecured basis by the Subsidiary Guarantors.
Optional redemption
Make Whole – prior to 1 April 2009 at bunds + 50bp Equity Claw – prior to 1 April 2008 max 35% of issue at par + coupon (107.5%) Call Schedule:
01 July 2009 – 103.750% 01 July 2010 – 101.875% 01 July 2011 – 100.000%
Tax redemption Yes at par + accrued and unpaid interest
Negative pledge Yes – limitation on liens
Cross default Yes, the principal amount of indebtedness in default at maturity cannot exceed €20mn, or €15mn in case of final judgments.
Fall away covenants Yes
Anti-layering Yes
Change of control Put at 101%, 50% of voting power of the voting stock of the issuer
Asset sales
The Issuer cannot sell assets unless: The Issuer receives fair market value for them and at least 75% of the consideration is
in the form of cash or cash equivalents; 100% of the net cash available from the disposition is used within 365 days to prepay
or repay notes or other indebtedness or to invest in replacement assets; When excess proceeds exceed €10mn, the Issuer must make an offer to repurchase
the notes and other pari passu indebtedness at par with the excess proceeds.
Debt limit
Debt is permitted if, after giving pro forma effect thereto, the consolidated fixed charge coverage ratio is at least 2.50 to 1. Carve outs: Credit facility cannot exceed €90mn. CLOs or PMOs cannot exceed €15mn. Indebtedness of a restricted subsidiary to finance working capital requirements of up to
€5mn in aggregate. General basket of €30mn.
Restricted payments
If the company can raise €1.00 of debt then 50% of net income (less 100% net loss), plus 100% of equity and equity-like proceeds. Carve outs: Repurchase, redemption or defeasance of capital stock or subordinated indebtedness
financed by the sale of capital stock or refinancing indebtedness. Dividends in any calendar year, up to 50% of consolidated net income. General basket up to €20mn.
Transactions with affiliates
The terms of transactions with affiliates must be no less favourable than those that could be obtained in a comparable transaction in arm’s-length dealings with an unaffiliated party. Transactions involving an aggregate value of €5mn or greater must be approved by the Board of Directors. Transactions involving an aggregate value of €15mn also require a written fairness opinion from an independent financial advisor.
Source – BNP Paribas, Escada

Escada ⎪ January 2006
161 European High Yield Research
Escada, Financial Model BNPP BNPP BNPP Actual Actual Actual Actual Actual Actual Actual Actual Forecast Forecast ForecastEUR mn FY 02 FY 03 FY 04 Q1 05 Q2 05 Q3 05 Q4 05 FY 05 FY 06 FY 07 FY 08 FY end 31st October, IFRS 31-Oct-02 31-Oct-03 31-Oct-04 31-Jan-05 30-Apr-05 31-Jul-05 31-Oct-05 31-Oct-05 31-Oct-06 31-Oct-07 31-Oct-08 P&L SUMMARY Sales ESCADA 469.8 410.1 412.7 109.9 98.2 104.6 123.8 436.5 451.8 460.8 470.0 % change -12.7% 0.6% 9.7% -0.9% 5.0% 8.8% 5.8% 3.5% 2.0% 2.0% PRIMERA Group 209.5 200.6 205.8 49.8 54.3 45.4 62.0 211.5 215.7 217.9 220.1 % change -4.2% 2.6% 6.6% -5.1% 4.4% 6.2% 2.8% 2.0% 1.0% 1.0% Others 93.6 10.1 6.9 0.4 0.0 0.0 0.2 0.6 0.5 0.5 0.5 % change -89.2% -31.7% -66.7% -100.0% -100.0% -91.3% -91.3% -16.7% 0.0% 0.0%Sales 772.9 620.8 625.4 160.1 152.5 150.0 186.0 648.6 668.0 679.2 690.6 % change -19.7% 0.7% 8.1% -3.4% 3.5% 6.6% 3.7% 3.0% 1.7% 1.7%
EBITDA ESCADA 43.9 15.1 35.5 14.3 8.5 10.2 13.6 46.6 50.8 50.7 52.6 % of sales 9.3% 3.7% 8.6% 13.0% 8.7% 9.8% 11.0% 10.7% 11.3% 11.0% 11.2% PRIMERA Group 9.1 -4.6 13.3 7.6 4.6 1.8 4.3 18.3 19.2 19.1 19.3 % of sales 4.3% -2.3% 6.5% 15.3% 8.5% 4.0% 6.9% 8.7% 8.9% 8.8% 8.8% Others 2.1 -2.1 -1.5 -1.4 0.0 0.0 1.6 0.2 -0.2 -0.2 -0.2 % of sales 2.2% -20.8% -21.7% -350.0% nm nm nm nm nm nm nm EBITDA 55.1 8.4 47.3 20.5 13.1 12.0 19.5 65.1 69.8 69.6 71.7 % of sales 7.1% 1.4% 7.6% 12.8% 8.6% 8.0% 10.5% 10.0% 10.5% 10.2% 10.4% Rental expenses 75.2 72.6 70.6 70.5 71.6 75.1 78.6 EBITDAR 130.3 81.0 117.9 135.6 141.4 144.7 150.3 % of sales 16.9% 13.0% 18.9% 20.9% 21.2% 21.3% 21.8% CASH FLOW ITEMS EBITDA 55.1 8.4 47.3 20.5 13.1 12.0 19.5 65.1 69.8 69.6 71.7 Cash interest -16.8 -35.8 -13.3 -4.0 -5.1 -2.2 -5.3 -16.6 -15.7 -15.2 -14.6 Cash tax -4.0 32.2 -2.0 0.0 0.0 0.0 0.0 0.0 -11.8 -11.6 -12.2 Restructuring charges 0.0 -54.6 -5.4 0.0 0.0 0.0 0.0 0.0 0.0 0.0 0.0 Cash effect from changes in working capital 10.0 27.9 -11.8 -11.2 21.1 -4.0 5.8 11.7 -5.0 5.0 -3.0 Other operating cash items -5.2 20.9 -1.8 -18.9 -0.7 -3.9 0.0 -23.5 0.0 0.0 0.0 Cash flow from operations 39.2 -0.9 13.0 -13.6 28.4 1.9 20.0 36.7 37.4 47.9 41.9 Capex -22.5 -22.7 -18.7 -2.3 -3.6 -4.2 -13.9 -24.0 -22.5 -22.5 -22.5 Free cash flow 16.7 -23.6 -5.7 -15.9 24.8 -2.3 6.1 12.7 14.9 25.4 19.4 BALANCE SHEET ITEMS Cash and cash equivalents 11.1 14.4 25.6 21.9 20.7 20.1 26.2 26.2 31.3 39.2 41.1 Total debt 175.8 104.4 234.3 246.9 223.1 227.3 234.0 234.0 229.0 219.0 208.8 Net debt 164.7 90.0 208.8 225.0 202.4 207.2 207.8 207.8 197.7 179.8 167.7 CREDIT RATIOS Net debt/EBITDA 3.0x 10.7x 4.4x 4.2x 3.6x 3.5x 3.2x 3.2x 2.8x 2.6x 2.3x EBITDA/Net interest expense 3.3x 0.2x 3.5x 3.6x 3.2x 3.7x 3.9x 3.9x 4.4x 4.6x 4.9x Net lease-adjusted debt (x8)/EBITDAR 5.9x 8.3x 6.6x 5.7x 5.4x 5.4x 5.3x EBITDAR/(Net interst + rental expenses) 1.4x 0.7x 1.4x 1.6x 1.6x 1.6x 1.6x Source – BNP Paribas Estimates, Escada Leverage and Coverage are based on the last 12 months’ results. Some of the ratios are adjusted for the effects of acquisitions and disposals. In addition, these 2 measures are usually calculated based on EBITDA adjusted for exceptional or non-recurring items. Leverage is defined as net lease-adjusted debt (x8 operating leases)-to-EBITDAR. Coverage is defined as EBITDAR-to-(net interest+rental expenses).

Fage Dairy ⎪ January 2006
162 European High Yield Research
Fage Dairy Bond Description & Market Data, as of 5 January 2006
Next Call Issuer Credit Trend: Negative
Description Amount (o/s) Ratings Date Price Price YTW STW
7.50% Senior Notes due 2015 EUR 130mn B1/B 15-Jan-10 103.75 88.00 9.51% 636bp
Source – BNP Paribas
Company Profile
Fage Dairy (Fage) is the leading dairy company in Greece and the second largest Greek food company. The company manufactures and distributes a wide range of branded dairy products, including yogurt and dairy desserts, milk and milk cream, and packaged cheese. These products are sold under the FAGE, Total and other company trademarks, which are among the most recognised trademarks in Greece. In its domestic market, Fage holds leading market positions in branded yogurt, packaged cheese and refrigerated milk. The company also distributes and sells fruit juices and refrigerated snacks, which are produced by other parties. Fage has a comprehensive distribution platform in Greece and also exports some of its products abroad, including the US. For the twelve months ended 30 September 2005, Fage had turnover of €347.6mn and EBITDA of €19.6mn. At the end of third quarter 2005, the company had leverage of 6.6x.
Investment Recommendation We maintain our BUY/Negative Credit Trend recommendation for Fage’s high yield bonds. We note that Fage’s bonds have taken two consecutive hits in the past six months following announcements of the two weak quarterly results. Therefore, we now believe that further short-term downside risk is limited from the current levels. We feel that further weakening of the bonds would have to be driven by concerns about the company’s liquidity, which we do not anticipate as being a problem in 2006. We think that Fage still has a couple of weak quarters ahead of it. However, we anticipate that things will eventually stabilize and we believe that the company should achieve a modest year-on-year improvement in the second quarter of 2006, relative to a very weak prior-year quarter affected by the product recall. (In our forecasts, we assume that Fage’s shareholders will abstain from getting paid by the company until things improve operationally, as they had themselves indicated). We also note that the rating agencies have had a chance to speak their minds following the announcement of the poor third quarter 2005 results and we now expect that they will not be reviewing the company’s ratings in the near future. We continue to view Fage as a rather weak credit and we continue to dislike the way the company’s business is intertwined with the interests of the shareholders. We also note that if, contrary to our expectations, Fage’s performance fails to recover in 2006, the company’s leverage will increase further from the current levels, especially given a planned large capital investment project in the US. In that case we expect that Fage’s ratings will come under pressure again. Finally, a current absence of a traditional term bank facility in the company’s capital structure is both a blessing (as there is no debt ahead of the bonds) and a concern, given that the company may have to rely on short-term bank lines to finance any liquidity shortfall. Overall, we caution that Fage’s bonds have a highly speculative profile. We also fear that the company may do an add-on to the bonds as soon as things improve operationally, which may dilute an upside potential for the notes.
Debt Profile At the end of third quarter 2005, Fage’s indebtedness consisted of the 7.5% senior notes due 2015 (€130.0mn outstanding), short-term bank lines of €17.3mn and vendor loans of €1.7mn. At the same point, the company had €31.3mn available on a short-term basis under various lines of credit maintained with several banks.
Oleksiy Soroka, CFA +44 20 7595 4878 [email protected]

Fage Dairy ⎪ January 2006
163 European High Yield Research
Fage Dairy Structure
Fage Dairy Industry S.A.
(the “Company”)
€130 million Senior Notes
Fage USA CORP.(1)
(the “Guarantor”)
Guarantee
Non-Guarantor Subsidiaries(2)
Fage Dairy Industry S.A.
(the “Company”)
€130 million Senior Notes
Fage USA CORP.(1)
(the “Guarantor”)
Guarantee
Non-Guarantor Subsidiaries(2)
Source – Fage Dairy
1. The Company anticipates that it will restructure its U.S. operations in connection with the establishment of its planned production facility in the U.S. Any U.S. subsidiaries created for this purpose will be required to also become guarantors.
2. Includes entities formed under the laws of Greece and Italy, not all of which are wholly-owned. Following the Company’s acquisition of its distributor in the U.K., this entity has become a non-guarantor Subsidiary.

Fage Dairy ⎪ January 2006
164 European High Yield Research
Bond Covenant Bond description EUR 130mn 7.5% Senior Notes due 2015
Issuing entity Fage Dairy Industry SA
Ranking Senior Notes are general unsecured senior obligations of Fage Dairy Industry SA
Position vs. bank debt Structurally subordinated
Position vs. other bonds Not applicable
Security/Guarantees Fage USA Corp. will provide a guarantee on a senior basis.
Optional redemption
Equity Claw – prior to 15 January 2008 (35%) at 107.50
Call Schedule:
15 January 2010 – 103.75% 15 January 2011 – 102.50% 15 January 2012 – 101.25% 15 January 2013 – 100.00%
Tax redemption Yes – at par
Negative pledge Yes – limitation on liens
Cross default Yes – on over €5mn of other debt
Fall away covenants No
Anti-layering No
Change of control Put at 101%, 50% of voting share capital
Asset sales
The company cannot sell assets unless: The company receives fair market value for them and at least 75% of the
consideration is in the form of cash or cash equivalents. 100% of the net cash available from the disposition is used within 360 days to (i)
repay indebtedness under a bank credit agreement, (ii) invest in a permitted business, (iii) repay indebtedness incurred prior to such asset sale for a permitted investment made in contemplation of the asset sale.
When excess proceeds exceed €5mn, the company must make an offer within 75 calendar days to repurchase the notes at par with the excess proceeds.
Debt limit
The company may not incur debt unless pro forma coverage exceeds 2.0x.
Carve outs: Bank debt not to exceed 80% of the net book value of accounts receivables and 50% of
the net book value of inventory, of the company and its subsidiaries on a consolidated basis.
CLOs and purchase money Indebtedness not to exceed €10mn.
General basket up to €20mn.
Restricted payments
If company can raise €1.00 of debt then 50% net income (less 100% net loss), plus 100% of equity and equity-like proceeds. Carve outs: The retirement of any capital stock of the company. The retirement of indebtedness subordinate in right of payment to the senior notes. Permitted shareholder compensation payments.
Transactions with affiliates
All transactions with affiliates should be made in good faith and on an arm’s-length basis. Transactions involving an aggregate value of €2m or greater must be approved by the majority of the disinterested members of the Board of Directors. Transactions involving an aggregate value of €10m or greater also require a fairness opinion from an independent financial advisor.
Source – BNP Paribas, Fage Dairy

Fage Dairy ⎪ January 2006
165 European High Yield Research
Bond Covenant Bond description EUR 130mn 7.5% Senior Notes due 2015
Limitation on sale-leaseback transaction
Neither the company nor any of its subsidiaries may enter, renew or extend any sale-leaseback transaction unless : Case 1: After such sale-leaseback transaction the company remains in compliance with
the limitation on liens covenant and can incur Indebtedness pursuant the limitation on additional indebtedness covenant. In addition, the sale price in such sale-leaseback transaction is at least equal to the fair market value of such property.
Case 2: The lease is between the company and a subsidiary of the company or between subsidiaries of the company.
Limitation on investments, loans and advances
The company cannot, and cannot permit any of its subsidiaries to, make any capital contributions, advances or loans to, or investments in or purchases of capital stock or other securities of any person, except: If the company reinvested the proceeds of obsolete equipment for which the company
received FMV directly in assets useful for the company business, or transfer to subsidiaries of the company not to exceed €1mn in any fiscal year.
Advances to employees against future compensation made in the ordinary course of business consistent with past practices of the company and not exceeding €500k at any one time outstanding.
Investment in joint ventures, partnerships or persons that are not subsidiaries of the company, such that the aggregate amount of such investments made after the issue date, less any amounts received as a return of capital or income, would not exceed €20mn.
Source – BNP Paribas, Fage Dairy

Fage Dairy ⎪ January 2006
166 European High Yield Research
Fage Dairy, Financial Model BNPP BNPP BNPP BNPP BNPP FYE 31 March Actual Actual Actual Actual Actual Actual F'cast F'cast F'cast F'cast F'cast EUR mn 2002 2003 2004 Q1 05 Q2 05 Q3 05 Q4 05 2005 2006 2007 2008 P&L SUMMARY Net Sales 331.3 349.5 360.2 82.9 81.8 90.4 85.0 340.0 346.8 361.3 374.2 % change 9.1% 5.5% 3.1% 1.5% -14.4% -5.7% -2.5% -5.6% 2.0% 4.2% 3.6% 342.2 Cost of sales -207.3 -220.3 -223.4 -49.8 -53.8 -60.6 -55.3 -219.4 -217.6 -225.8 -233.9 Gross Profit 124.0 129.2 136.8 33.1 28.0 29.8 29.8 120.6 129.2 135.5 140.3 gross margin 37.4% 37.0% 38.0% 39.9% 34.2% 33.0% 35.0% 35.5% 37.3% 37.5% 37.5% SG&A -95.8 -109.7 -119.9 -24.5 -30.3 -28.7 -26.4 -109.8 -115.3 -119.2 -123.5 % of sales 28.9% 31.4% 33.3% 29.6% 37.0% 31.8% 31.0% 32.3% 33.3% 33.0% 33.0% Impairment loss 0.0 0.0 0.0 0.0 0.0 0.0 0.0 0.0 0.0 0.0 0.0 Other Income 1.2 0.8 0.8 0.3 0.2 0.3 0.3 1.1 0.8 0.8 0.8 Other expenses -0.2 -0.5 -0.2 0.0 -0.3 -0.2 -0.2 -0.7 -0.5 -0.5 -0.5 Profit from operations 29.2 19.8 17.4 8.8 -2.4 1.2 3.5 11.1 14.2 16.6 17.1 operating margin 8.8% 5.7% 4.8% 10.6% -2.9% 1.3% 4.1% 3.3% 4.1% 4.6% 4.6% Financial income/expenses, net -10.3 -7.7 -7.5 -4.3 -2.3 -2.7 -3.0 -12.3 -10.3 -10.1 -10.1 FX gains/lossess, net 18.4 14.4 4.6 -2.4 0.2 0.0 0.0 -2.1 0.0 0.0 0.0 Share of profit/losses of assoicates -1.2 -0.7 -0.1 0.0 0.1 0.0 0.0 0.1 0.0 0.0 0.0 Profit before income taxes & minority interests 36.2 25.8 14.5 2.1 -4.4 -1.5 0.5 -3.2 3.9 6.4 7.0 Income taxes -13.6 -10.7 -1.7 5.5 0.4 -1.0 -0.1 4.7 -1.1 -1.6 -1.8 effective tax rate 37.6% 41.4% 12.1% -259.1% 8.5% -65.9% 30.0% 146.5% 29.0% 25.0% 25.0% Minority interests 0.1 0.0 0.0 0.0 0.0 0.0 0.0 0.0 0.0 0.0 0.0 Net Profit 22.7 15.1 12.7 7.6 -4.0 -2.4 0.3 1.5 2.8 4.8 5.3 Net Profit/Loss 22.7 15.1 12.7 7.6 -4.0 -2.4 0.3 1.5 2.8 4.8 5.3 Income taxes 13.6 10.7 1.7 -5.5 -0.4 1.0 0.1 -4.7 1.1 1.6 1.8 Financial Income/expenses, net 10.3 7.7 7.5 4.3 2.3 2.7 3.0 12.3 10.3 10.1 10.1 Depreciation and amortisation 8.7 10.2 11.0 2.7 2.8 1.6 2.0 9.1 11.5 12.0 12.5 Period-end existing Nts remeasurement gain/loss -16.3 -14.6 -4.8 0.0 0.0 0.0 0.0 0.0 0.0 0.0 0.0 EBITDA 38.9 29.1 28.2 9.1 0.7 2.9 5.5 18.2 25.7 28.6 29.6 % of sales 11.7% 8.3% 7.8% 10.9% 0.9% 3.2% 6.5% 5.3% 7.4% 7.9% 7.9% Olympic games sponsorship expense 2.1 2.8 1.5 19.6 Adj EBITDA 41.0 31.9 29.7 % of sales 12.4% 9.1% 8.3% Shareholder payments 7.3 14.0 11.9 Adj EBITDA before shareholder payments 48.4 45.9 41.6 % of sales 14.6% 13.1% 11.6% CASH FLOW ITEMS Profit before income taxes and minority interest 36.2 25.8 14.5 2.1 -4.4 -1.5 0.5 -3.2 3.9 6.4 7.0 D&A 8.7 10.2 11.0 2.7 2.8 1.6 2.0 9.1 11.5 12.0 12.5 Other adjustments -3.7 -5.8 3.6 4.9 2.3 2.9 2.5 12.6 10.3 10.1 10.1 Cash EBITDA 41.2 30.2 29.0 9.7 0.7 3.1 5.0 18.5 25.7 28.6 29.6 Net cash interest expense -10.8 -7.8 -7.2 -3.8 0.0 -4.9 0.0 -8.7 -10.3 -10.1 -10.1 Cash income taxes -2.7 -6.5 -4.6 -0.8 -0.2 -0.7 -0.1 -1.8 -1.1 -1.6 -1.8 Cash effect from changes in working capital 8.1 -7.1 -17.2 -16.2 -1.7 -0.5 13.0 -5.5 -10.0 -8.0 -5.0 Other operating cash items -0.5 -0.3 -1.8 -0.6 -0.5 -0.8 0.0 -1.9 0.0 0.0 0.0 Net cash from operating activities 35.2 8.6 -1.7 -11.7 -1.9 -3.8 17.8 0.5 4.3 8.8 12.8 Capex -19.0 -18.4 -19.9 -1.4 -2.5 0.2 -1.4 -5.0 -29.1 -22.8 -10.0 Free cash flow 16.2 -9.9 -21.6 -13.1 -4.4 -3.5 16.4 -4.5 -24.9 -13.9 2.8 Proceeds from PP&E 2.1 1.0 0.7 0.1 0.7 -0.5 0.0 0.3 0.0 0.0 0.0 Interest and other related income received 0.3 0.1 0.2 0.0 0.0 0.0 0.0 0.1 0.0 0.0 0.0 Investment in associates 0.0 -0.1 -0.1 0.0 -5.1 5.1 0.0 0.0 0.0 0.0 0.0 Acquisition of minority interest -2.8 0.0 -0.6 0.0 0.0 0.0 0.0 0.0 0.0 0.0 0.0 Net change in restricted cash 15.3 0.0 0.0 0.0 0.0 0.0 0.0 0.0 0.0 0.0 0.0 Purchase of available for sale financial assets 0.0 0.0 0.0 0.0 0.0 -5.1 0.0 -5.1 0.0 0.0 0.0 Net change in ST borrowings -24.8 3.1 24.0 -32.5 0.0 17.3 0.0 -15.2 0.0 5.0 0.0 Repayment of LT debt -1.2 0.0 0.0 -70.9 0.0 0.0 0.0 -70.9 0.0 0.0 0.0 Proceeds from LT loans 0.0 0.0 0.0 130.0 0.0 0.0 0.0 130.0 0.0 0.0 0.0 Increase in share capital 0.0 0.0 0.0 0.0 0.0 0.0 0.0 0.0 0.0 0.0 0.0 Dividends paid 0.0 0.0 -3.3 0.0 0.0 0.0 0.0 0.0 0.0 0.0 0.0 FX effect 0.0 0.1 0.1 0.0 0.0 0.0 0.0 0.0 0.0 0.0 0.0 Net change in cash 5.0 -5.7 -0.5 13.6 -8.8 13.3 16.4 34.6 -24.9 -8.9 2.8 BALANCE SHEET ITEMS Cash and cash equivalent 7.9 2.2 2.6 16.2 7.4 20.7 37.1 37.1 12.3 3.3 6.1 Vendor loans 3.1 2.6 2.0 2.0 1.8 1.7 1.7 1.7 1.7 1.7 1.7 Bank debt 94.7 82.7 101.4 0.0 0.0 17.3 17.3 17.3 17.3 22.3 22.3 High yield notes 0.0 0.0 0.0 130.0 130.0 130.0 130.0 130.0 130.0 130.0 130.0 Total Debt 94.7 82.7 101.4 132.0 131.8 149.0 149.0 149.0 149.0 154.0 154.0 Net Debt 86.8 80.5 98.9 115.8 124.4 128.4 111.9 111.9 136.8 150.7 148.0 Reserve for staff retirement indemenities 1.4 1.7 2.0 2.1 2.2 2.0 CREDIT RATIOS Net debt/EBITDA 2.2x 2.8x 3.5x 3.9x 5.4x 6.6x 6.2x 6.2x 5.3x 5.3x 5.0x EBITDA/Net interest expense 3.8x 3.8x 3.8x 1.5x 2.5x 2.8x 2.9x
Source – BNP Paribas Estimates, Fage Dairy Leverage and Coverage are based on the last 12 months’ results. Some of the ratios are adjusted for the effects of acquisitions and disposals. In addition, these 2 measures are usually calculated based on EBITDA adjusted for exceptional or non-recurring items. Leverage is defined as net lease-adjusted debt (x8 operating leases)-to-EBITDAR. Coverage is defined as EBITDAR-to-(net interest+rental expenses).

Fage Dairy ⎪ January 2006
167 European High Yield Research
This page has been left blank intentionally

FKI ⎪ January 2006
168 European High Yield Research
FKI Bond Description & Market Data, as of 16 December 2005
Next Call Issuer Credit Trend: Negative
Description Amount (o/s) Ratings Date Price Price YTW STW
FKI 6.625% Senior Notes due 2010 EUR 600mn Ba1/BB NC NC 107.35 4.640 167.6
Source – BNP Paribas
Company Profile Despite its relatively small size (the company generated sales of £1.3bn and operating profit of £96mn in 2004/2005, year-end March), FKI has a well-diversified business profile: FKI Logistex – automated sorting and material handling. Acquisitions have benefited this unit, e.g. Stearns Airport
Equipment Co., Dator A/S and Skoda Electrical Machines in 2001, although DeWind (bought in 2002) was sold in mid-2005 after a poor performance.
Lifting Products and Services – used in industries ranging from construction to fishing. FKI Energy Technology – electric motors, generators, measurement and control devices. Hardware – e.g. window and door fittings, castors, retail hardware items.
FKI’s geographic mix leaves it highly exposed to the weak USD. The company generated 48% of sales and 67% of operating profit in North America in FY04/05 (year-end March). The exposure to North America increased mainly as a result of acquisitions completed in the Logistex and Energy Technology divisions. The remaining operations are concentrated in the UK (24% of sales, 24% of operating profit) and the rest of Europe (19% of sales, 11% of operating profit). Only 3% of sales and 4% of operating profit is generated in the rest of the world. While the hardware division mainly operates in the US, the other three divisions have operations broadly split between North America and Western Europe.
Investment Recommendation: REDUCE We maintain a Reduce recommendation on FKI, based on a number of factors including the company’s exposure to
cyclicality and the US$ and its high gearing, although we note that some improvement in operating performance was seen in the H1 2005/2006 results and the strategic review announced in January 2004 is well underway which may aid future performance to some extent.
The company’s high gearing, particularly adjusted for operating leases and pension underfunding is furthermore compounded by the fact that free cash flow was boosted by cuts in capex and dividends as well as some asset sales for several years, particularly in FY03/04, while operating cash flow has been on a declining trend for several years now. Finally, the company’s exposure to the USD and raw material price hikes has impacted margins, and may constrain any rebound in profits. Nonetheless, we do note that despite order intake and closing order books having been in decline over the past few years, some improvement was seen in H1 05/06 with a 13% increase in order books from year-end levels.
Both agencies have downgraded the credit several times over the course of the last few years after having initially assigned A3/BBB+ senior unsecured ratings in 2000, meaning the credit is now rated Ba1/BB (each agency assigns a Stable outlook, however). The downgrades have come as a result of the company’s poor performance and what was viewed as a structural decline in the group’s key businesses and markets.
Since assigning our Reduce recommendation on FKI’s 2010 bond, at which time spreads over swaps were at around 110bps, spreads have widened significantly as the credit has been downgraded twice, and currently trades at around 162bps over swaps. However, we have seen times when a high of 481bps over swaps has been seen (March 2003) – this highlights the volatility of the credit spreads, and means that despite the widening, we maintain a Reduce recommendation for now. However, with the marginal improvement seen in the H1 2005 results, we could see any substantial widening potentially as a buying opportunity provided that the group backs up the moderate upturn with further improvement.
Frances Hutt +44 20 7595 8869 [email protected]

FKI ⎪ January 2006
169 European High Yield Research
Debt Profile FKI plc Notes 6.625% Notes due 2010 FKI issued €600mn aggregate principal amount of indebtedness in the form of 6.625% Notes in February 2000, due 22 February 2010. The 6.625% notes are direct, unconditional, unsecured (subject to the negative pledge clause) and unsubordinated – they rank pari passu with all other outstanding unsecured and unsubordinated obligations, present and future. On 12 December 2005, the bond had €175mn outstandings. The bond was issued at 125bp over the 2010 bund and the proceeds were designed to be used for general corporate purposes as well as the refinancing of some debt.
Other Debt FKI also has outstanding USD fixed rate guaranteed senior notes (private placements, maturing between April 2006 and 2016), of which there was £98.2mn outstanding as at year-end 2004/2005. The group also signed a 4-year £175mn floating-rate RCF in June 2003 which matures in June 2007, although the facility amount was subsequently reduced to £150mn. This RCF replaced a €175mn quasi-‘bridging’ facility originally signed in 2002 (which itself was a refinancing of a £315mn RCF signed in 1990) which was to mature in July 2007. Although the £150mn facility had £48mn of outstandings as at year-end 2004/2005, it has now been paid down and there are currently no outstandings. FKI has only a minimal amount of other loans aside the facilities specified above.
All debt is held at the FKI plc level bar $183.5mn of US private placements, which are held at the FKI Industries Inc. operating subsidiary (~£100mn). S&P had previously had concerns about structural subordination of the 2010 bonds, given that these were issued at the parent company level – however, the agency drew the conclusion that sufficient mitigants were in place to offset the structure. These included the existence of upstream guarantees (including those from FKI Engineering Ltd. and FKI Industries Inc.), as well as the diversity of group operating subsidiaries, and downstream intercompany loans. The guarantees effectively leave bondholders pari passu with holders of the FKI Industries Inc. private placements.
FKI Debt Maturity as at year-end 2005 (March)
0
50
100
150
200
250
300
350
400
450
2006 2007 2008-2011 2012+
Finance LeasesOtherBank Loans & Overdrafts
Source – FKI plc, BNP Paribas

FKI ⎪ January 2006
170 European High Yield Research
FKI Structure
FKI plc
FKI LogistexGroup
Lifting Products & Services
Hardware Group
Energy Technology
GroupOther
FKI Logistex North America Inc.
FKI Logistex A/S (Denmark)
FKI LogistexLimited
Industry General Corporation (USA)
Acco Chain & Lifting Products (USA)
Bridon International Limited
Bridon New Zealand Limited
Bridon American Corp (USA)
BTS Drahtseile GmbH
CERTEX Denmark A/S
CERTEX Finland Oy
CERTEX Norge A/S
CERTEX Svenska AB
Crosby Canada
N.V. Crosby Europe (Belgium)
Parsons Chain Company
The Crosby Group Inc (USA)
The Harris Waste Management Group Inc.
(USA)
Welland Forge (Canada)
BelwithInternational
Limited (USA)
Faultless Caster (USA)
Keeler Brass Company (USA)
Rhombus Casters Malaysia Bhd
Rhombus RollenHolding GmbH
Truth Hardware Corporation (USA)
Weber-Knapp Company (USA)
Wright Products (USA)
Bristol Babcock Inc (USA)
Brush Electrical Machines Limited
Brush HMA B.V. (Netherlands)
Brush SEM s.r.o. (Czech Republic)
Brush Traction
Brush Transformers
Limited
Froude Consine
Hawker SiddeleySwitchgear Limited
Marelli Motori SpA(Italy)
Whipp & Bourne
FKI Engineering Limited
FKI Industries Canada Limited
FKI Industries Inc (USA)
West House Insurance Limited
(Guernsey)
Source – FKI plc, BNP Paribas
Bond Covenant Bond Description EUR 600mn 6.625% due 2010
Issuing entity FKI plc
Ranking Senior unsecured debt
Position vs. bank debt Pari Passu with all other outstanding unsecured and unsubordinated obligations, present and future of the Issuer.
Position vs. other bonds Pari Passu with all other outstanding unsecured and unsubordinated obligations, present and future of the Issuer.
Security/Guarantees Unconditionally and irrevocably guaranteed by FKI Engineering plc and FKI Industries Inc. on a joint and severally liable basis.
Optional Redemption No
Tax redemption If there is a change in the laws or regulations in UK or any political subdivision thereof, or in the application of practices by authorities therein, bonds can be redeemed at principal amount together with interest accrued up to but excluding the date of redemption (6(b))
Negative pledge Yes
Cross default Yes
Fall away covenants No
Anti-layering No
Change of control No
Asset sales No
Debt limit No
Restricted payments No
Transactions with affiliates No
Source – FKI plc, BNP Paribas

FKI ⎪ January 2006
171 European High Yield Research
FKI, Historical Financials
£mn Financial Year Ended March Half Year Ended
September
2000 2001 2002 2003 2004 2005 2003 2004 2005
Income Statement
Net Sales 1,333 1,742 1,610 1,453 1,345 1,291 677 578 632
EBITDA 253 318 224 153 141 132 57 68 67
Depreciation 56 79 82 79 74 63 25 20 17
Operating Profit 197 239 142 74 67 69 31 48 50
Net Interest Expenses (Income) 24 45 38 31 23 24 12 12 14
Earnings bef. Tax, minority and except. Items 173 194 104 48 37 44 16 36 36
Net income 108 101 71 11 -21 -80 2 -37 26
Cash Flow Statement
Funds from Operations 172 193 153 101 76 55 51 36 28
Change in Working Capital -8 -3 -21 20 -13 -29 -22 -53 -38
Net Operating Cash Flow 164 191 132 121 63 26 30 -18 -11
Net Capital Expenditures -51 -56 -27 -16 -4 -14 -9 -9 -4
Dividends -27 -21 -109 -57 -11 -26 0 0 0
Free Cash Flow 86 114 -3 47 49 -14 21 -27 -14
Balance Sheet
Short Term Debt 31 5 20 51 50 7 20 57 46
Long Term Debt 677 649 626 561 455 500 547 464 516
Total Debt 708 654 646 612 504 507 568 521 562
Cash & Equivalent 167 169 113 113 155 156 145 144 130
Net Debt (Cash Position) 541 485 533 498 349 351 422 377 412*
Shareholders' Equity 405 482 476 285 239 144 284 206 189
Key Ratios
EBITDA Margin 19.0% 18.2% 13.9% 10.6% 10.5% 10.3% 8.3% 11.7% 10.6%
Operating Margin 14.8% 13.7% 8.8% 5.1% 5.0% 5.4% 4.6% 8.3% 7.9%
Total Debt / Equity 175% 136% 136% 215% 211% 351% 200% 253% 297%
Net Debt / Equity 134% 101% 112% 175% 146% 243% 149% 183% 228%
Adjusted Net Debt / Equity 137% 104% 159% 297% 262% 420% -- -- --
FFO/Net Debt (%) 32% 40% 29% 20% 22% 16% 12% 9% 6%
FFO/Adjusted Net Debt (%) 32% 39% 20% 12% 13% 9% -- -- --
Total Debt/EBITDA 2.8x 2.1x 2.9x 4.0x 3.6x 3.8x 5.0x 3.8x 4.2x
Net Debt/ EBITDA 2.1x 1.5x 2.4x 3.2x 2.5x 2.6x 7.5x 5.6x 6.5x
EBITDA/Net Interest Expenses 10.5x 7.1x 5.9x 4.9x 6.1x 5.6x 4.7x 5.6x 4.7x
EBIT/Net Interest Expenses 8.2x 5.3x 3.8x 2.4x 2.9x 2.9x 2.6x 4.0x 3.5x
Capex/Depreciation 129% 119% 68% 40% 56% 67% 117% 61% 82%
Source – BNP Paribas, FKI * Including derivative financial instruments

Focus ⎪ January 2006
172 European High Yield Research
Focus Bond Description & Market Data, as of 5 January 2006
Next Call Issuer Credit Trend: Negative
Description Amount (o/s) Ratings Date Price Price YTW STW
9.375% Mezzanine notes due 2015 GBP 100mn Caa1/CCC+ 03-Mar-10 104.6875 76.50 14.01% 953bp
Source – BNP Paribas
Company Profile
Focus is one of the leading do-it-yourself (DIY) retailers in the United Kingdom. The company sells a wide range of DIY and gardening products, targeting individual consumers aiming to undertake light home improvement and maintenance projects. As of 31 July 2005, the company operated 252 DIY stores scattered across the UK. The average store selling space is approximately 32,000 square feet. The majority of the company’s stores are located in market towns (with populations of between 20,000 and 80,000) and edge-of-town urban locations. Focus shareholders include Duke Street Capital (42.7%), Apax Partners (29.6%), Bill Archer, the founder of the company, (11.5%), Parcom Ventures (5.8%) and others. In the twelve months ended 31 July 2005, Focus had turnover of £737mn and adjusted EBITDA of £58mn. At the end of the period, Focus had lease-adjusted leverage of 6.5x and lease-adjusted coverage of 1.3x.
Investment Recommendation
We maintain our SELL/Negative Credit Trend recommendation for Focus’ 9.375% Mezzanine Notes due 2015. We believe that the company will have another difficult year in 2006, given that we do not anticipate that the UK DIY market will recover until the latter part of next year. As we understand, Focus still has not finished renegotiating bank covenants under its senior bank facility. This is somewhat worrying, given that the company itself had earlier hoped for a much shorter negotiation period. We expect that the covenants will ultimately be adjusted and the company will secure sufficient liquidity to get them through 2006. We think that the bonds will firm up slightly after the agreement is finally announced. However, we believe that subsequently the bonds will continue to be under pressure as Focus’ results will continue to be weak throughout next year. An upside to our negative recommendation for Focus’ notes would be a scenario when a third party takes over the company. We cannot identify any potential suitor who would dare at this stage. However, given that the company’s notes are currently well below par, any sale or transaction that would trigger a take-out of the bonds (be it under the Change of Control provision or under the Exit Event Optional Redemption clause) would be highly beneficial for the bondholders.
Oleksiy Soroka, CFA +44 20 7595 4878 [email protected]

Focus ⎪ January 2006
173 European High Yield Research
Debt Profile Focus’ indebtedness includes the mezzanine note (nominal value of £100mn), senior credit agreement (original aggregate face amount of £285mn) and some finance leases. As of 31 July 2005, in addition to the mezzanine notes, the company had approximately £194mn outstanding under its senior credit agreement and approximately £3mn of finance leases. Senior Credit Agreement At the time of its signing on 16 February 2005, the senior credit agreement consisted of: one £96mn tranche (‘‘Tranche A’’); two separate tranches of £57mn (‘‘Tranche B’’ and ‘‘Tranche C’’, respectively), and a revolving credit facility of up to £75mn. The amounts outstanding under the senior credit agreement are guaranteed by Focus’ operating subsidiaries and are secured by a first ranking fixed and floating charge over all the assets of those subsidiaries, including the shares owned by each subsidiary guarantor. The senior credit agreement has a number of covenants, which Focus was negotiating to modify as of mid-December 2005. Mezzanine Notes
A special feature of Focus’ bonds is an option given to the issuer to redeem the notes at a predetermined price in case of an Exit Event (during a 360-day period following such an event). An “Exit Event” is defined as: 1) A public equity offering; 2) Any sale, merger or other transaction when a third party becomes an owner of more then 50% of the voting stock of the issuer’s parent company; or 3) Sale of all or substantially all of the properties and assets of the company. The predetermined redemption price is as follows (valid for the twelve-month period beginning on 3 March of the years indicated below):
Year Percentage of Par Value 2006 103.0% 2007 102.0% 2008 101.0% 2009 and thereafter 100.0% Source - Bond Offering Memorandum
In addition, the note contains a traditional call option provision, independent of an Exit Event, which kicks in during 2010. In turn, bondholders benefit from a customary Change of Control provision (101%).
Focus’ 9.375% Mezzanine Notes due 2015 (the issuing entity is Focus (Finance) PLC, a holding company) benefit from both parent and subsidiary guarantees. The bonds are guaranteed on an unsecured senior basis by a number of parent holding companies and on a secured senior subordinated basis by all of the subsidiaries of the issuing entity which are borrowers and guarantors under the Senior Credit Facility. The subsidiary guarantees are secured by a second ranking fixed and floating charge over all of the assets, including shares owned by each subsidiary guarantor in its subsidiaries, which secure the borrowings under the Senior Credit Facility.
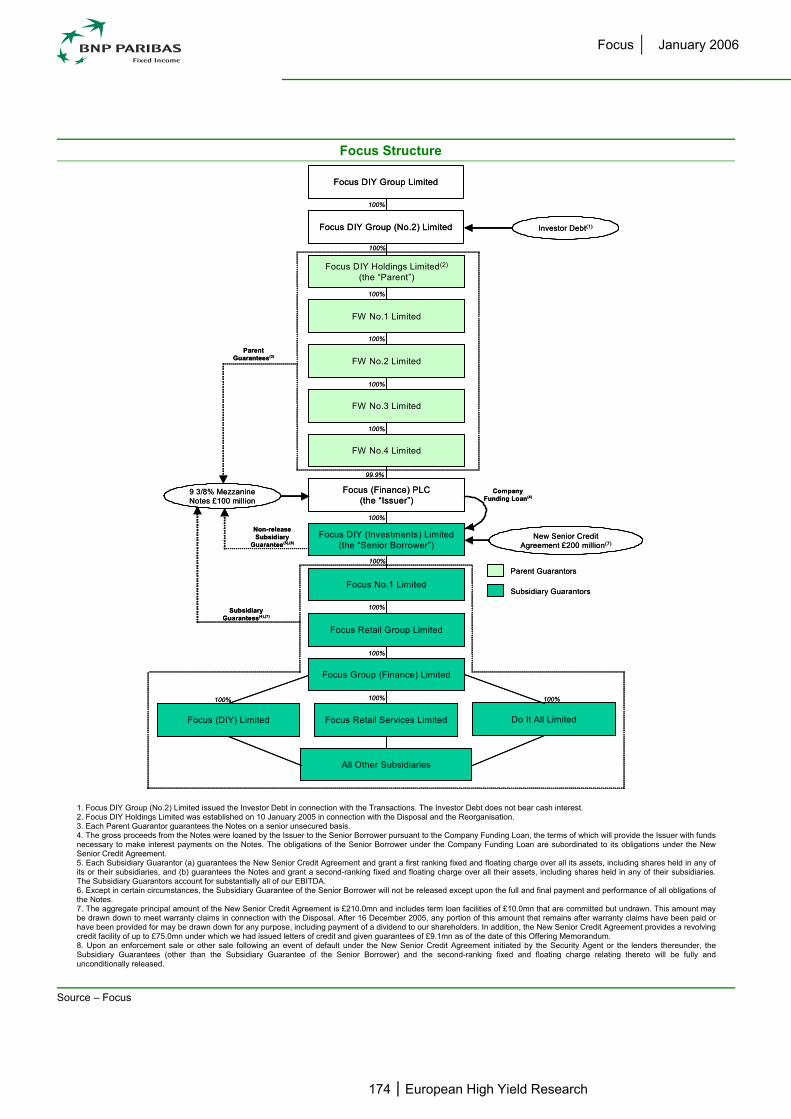
Focus ⎪ January 2006
174 European High Yield Research
Focus Structure
Focus DIY Group (No.2) Limited
Focus DIY Group Limited
Focus DIY Holdings Limited(2)
(the “Parent”)
Investor Debt(1)
FW No.1 Limited
FW No.2 Limited
FW No.3 Limited
FW No.4 Limited
Focus (Finance) PLC(the “Issuer”)
Focus DIY (Investments) Limited(the “Senior Borrower”)
100%
100%
100%
100%
100%
100%
99.9%
Focus No.1 Limited
Focus Retail Group Limited
Focus Retail Services Limited
Focus Group (Finance) Limited
All Other Subsidiaries
100%
100%
100%
100%
100%
Do It All LimitedFocus (DIY) Limited
100% 100%
Parent Guarantors
Subsidiary Guarantors
New Senior Credit Agreement £200 million(7)
Company Funding Loan(4)
9 3/8% Mezzanine Notes £100 million
Parent Guarantees(3)
Non-release Subsidiary
Guarantee(5),(6)
Subsidiary Guarantees(4),(7)
Source – Focus
1. Focus DIY Group (No.2) Limited issued the Investor Debt in connection with the Transactions. The Investor Debt does not bear cash interest. 2. Focus DIY Holdings Limited was established on 10 January 2005 in connection with the Disposal and the Reorganisation. 3. Each Parent Guarantor guarantees the Notes on a senior unsecured basis. 4. The gross proceeds from the Notes were loaned by the Issuer to the Senior Borrower pursuant to the Company Funding Loan, the terms of which will provide the Issuer with funds necessary to make interest payments on the Notes. The obligations of the Senior Borrower under the Company Funding Loan are subordinated to its obligations under the New Senior Credit Agreement. 5. Each Subsidiary Guarantor (a) guarantees the New Senior Credit Agreement and grant a first ranking fixed and floating charge over all its assets, including shares held in any of its or their subsidiaries, and (b) guarantees the Notes and grant a second-ranking fixed and floating charge over all their assets, including shares held in any of their subsidiaries. The Subsidiary Guarantors account for substantially all of our EBITDA. 6. Except in certain circumstances, the Subsidiary Guarantee of the Senior Borrower will not be released except upon the full and final payment and performance of all obligations of the Notes. 7. The aggregate principal amount of the New Senior Credit Agreement is £210.0mn and includes term loan facilities of £10.0mn that are committed but undrawn. This amount may be drawn down to meet warranty claims in connection with the Disposal. After 16 December 2005, any portion of this amount that remains after warranty claims have been paid or have been provided for may be drawn down for any purpose, including payment of a dividend to our shareholders. In addition, the New Senior Credit Agreement provides a revolving credit facility of up to £75.0mn under which we had issued letters of credit and given guarantees of £9.1mn as of the date of this Offering Memorandum. 8. Upon an enforcement sale or other sale following an event of default under the New Senior Credit Agreement initiated by the Security Agent or the lenders thereunder, the Subsidiary Guarantees (other than the Subsidiary Guarantee of the Senior Borrower) and the second-ranking fixed and floating charge relating thereto will be fully and unconditionally released.

Focus ⎪ January 2006
175 European High Yield Research
Bond Covenant Bond description GBP 100mn 9.375% Mezzanine Notes due 2015
Issuing entity Focus (Finance) Plc
Ranking Senior Unsecured Notes
Position vs. bank debt Structurally and contractually subordinated
Position vs. other bonds Not applicable
Security/Guarantees
The Notes are guaranteed on an unsecured senior basis by Focus DIY Holdings Limited, FW No.1 Limited, FW No.2 Limited, FW No.3 Limited and FW No.4 Limited. The Notes are guaranteed on a secured senior subordinated basis by all of the subsidiaries of the Issuer which are borrowers or guarantors under the New Senior Credit Agreement. The Subsidiary Guarantees are secured by a second ranking fixed and floating charge over all of the assets, including shares owned by each Subsidiary Guarantor in its subsidiaries that secure the borrowings under the company’s New Senior Credit Agreement.
Optional redemption
When No Exit Event
No redemption before 3 March 2010. Call Schedule:
3 March 2010 – 104.6875% 3 March 2011 – 103.1250% 3 March 2012 – 101.5625% 3 March 2013 – 100.0000%
Upon Exit Event
No redemption before 3 March 2006. Call Schedule:
3 March 2006 – 103.000% 3 March 2007 – 102.000% 3 March 2008 – 101.000% 3 March 2009 – 100.000%
Tax redemption Yes – at par
Negative pledge Yes – limitation on liens
Cross default Yes, if the total amount of the unpaid indebtedness is greater than £10mn.
Fall away covenants No
Anti-layering Yes
Change of control Put at 101, 50%+ of voting power
Asset sales
The company will not sell assets unless: The company receives a fair market value for them, as determined in good faith by the
Board of Directors; At least 75% of the consideration received in the asset sale is in the form of cash or
cash equivalents. Net proceeds must be applied within 365 days to: (i) permanently prepay, repay, purchase or redeem senior debt of a subsidiary guarantor, (ii) to acquire another permitted business that becomes a restricted subsidiary, (iii) make a capital expenditure, (iv) acquire other long-term assets that are useful in a permitted business, (v) to buy-out or release up to £5mn of lease obligations on existing retail stores. For any net proceeds exceeding £7.5mn not applied as per the above, which constitute Excess Proceeds, the issuer must make an offer to the holders of the notes and all pari passu indebtedness at par.
Debt limit
Debt is permitted if, after giving pro forma effect thereto, the consolidated fixed charge coverage ratio is greater than 2.50 to 1.00. Carve outs: Indebtedness under credit facilities up to £285mn. CLOs or PMOs up to £10mn. General basket up to £5mn.
Source – BNP Paribas, Focus

Focus ⎪ January 2006
176 European High Yield Research
Bond Covenant Bond description GBP 100mn 9.375% Mezzanine Notes due 2015
Restricted payments
If company can raise €1.00 of debt then 50% net income (less 100% net loss), plus 100% of equity or equity-like proceeds, plus 50% of any dividends received from an unrestricted subsidiary, plus the fair market value of an investment in an unrestricted subsidiary that is redesignated as a restricted subsidiary. Carve outs: Payments of dividends. Repurchase of subordinated indebtedness of the issuer or any guarantor. Dividend payment by a restricted subsidiary of the parent to any holders of equity
interests. Repurchase of equity interest of the parent in the limit of £1mn. General basket up to £30mn if the consolidated net leverage ratio is less than 3.75x.
Transactions with affiliates All transactions with affiliates should be made in good faith and on an arm’s-length basis. Transactions involving an aggregate value of £2.5m or greater must be approved by the Board of Directors. Transactions involving an aggregate value of £10mn require a written fairness opinion from an independent financial advisor.
Source – BNP Paribas, Focus

Focus ⎪ January 2006
177 European High Yield Research
Focus, Financial Model Pro forma
Actual Actual Actual Actual Actual Actual Actual BNPP F'cast
BNPP F'cast
BNPP F'cast
BNPP F'cast
Financial Year ends last Sunday October 2002 2003 2004 2004 Q1 2005 Q2 2005 Q3 2005 Q4 2005 2005 2006 2007 GBPmn, UK GAAP 52w 52w 53w 53w 13w 30/01 13w 01/05 13w 31/07 52w 52w 52w
P&L SUMMARY Turnover 865.4 852.7 828.0 828.0 167.5 163.6 202.1 192.1 725.3 687.5 706.6 % change -1.5% -2.9% -2.9% -7.7% -23.2% -5.8% -5.9% -12.4% -5.2% 2.8% like-for-like % change 0.9% 3.2% 1.2% 1.2% -3.2% -11.7% -9.3% -9.4% -8.5% -6.0% 2.0% Cost of sales -630.7 -635.5 -599.4 -599.4 -127.3 -119.1 -145.5 -134.0 -525.9 -499.8 -513.0 Gross profit 234.7 217.2 228.6 228.6 40.2 44.5 56.6 58.1 199.4 187.7 193.6 gross margin 27.1% 25.5% 27.6% 27.6% 24.0% 27.2% 28.0% 30.3% 27.5% 27.3% 27.4% Distribution costs -156.3 -148.8 -143.9 -143.9 -36.0 -31.0 -34.4 -37.0 -138.4 -132.0 -134.3 % of turnover 18.1% 17.5% 17.4% 17.4% 21.5% 18.9% 17.0% 19.3% 19.1% 19.2% 19.0% Administrative costs -57.5 -52.2 -44.9 -50.2 -10.8 -10.3 -11.7 -18.2 -51.0 -48.1 -49.5 % of turnover 6.6% 6.1% 5.4% 6.1% 6.4% 6.3% 5.8% 9.5% 7.0% 7.0% 7.0% Other operating income/expenses -0.5 -0.5 -4.9 -4.9 -1.2 1.8 -0.7 0.0 -0.1 0.0 0.0 Operating profit 20.4 15.7 34.9 29.6 -7.8 5.0 9.8 2.9 9.9 7.6 9.9 % of turnover 2.4% 1.8% 4.2% 3.6% -4.7% 3.1% 4.8% 1.5% 1.4% 1.1% 1.4% Depreciation 16.6 18.1 18.8 18.8 4.2 3.6 4.0 4.5 16.3 16.2 16.1 Amortisation 12.2 12.2 12.2 17.4 3.0 3.7 4.5 4.5 15.7 15.8 15.8 EBITDA 49.2 46.0 65.9 65.8 -0.6 12.3 18.4 11.9 42.0 39.5 41.7 % of turnover 5.7% 5.4% 8.0% 7.9% -0.4% 7.5% 9.1% 6.2% 5.8% 5.7% 5.9% Exceptional items 21.9 19.1 5.1 5.1 0.0 0.5 3.1 0.0 3.6 0.0 0.0 Closure costs 0.5 -1.3 4.9 4.9 1.2 -1.8 0.7 0.0 0.1 0.0 0.0 Adjusted EBITDA 71.6 63.8 75.9 75.8 0.6 11.0 22.3 11.9 45.8 39.5 41.7 % of turnover 8.3% 7.5% 9.2% 9.2% 0.4% 6.7% 11.0% 6.2% 6.3% 5.7% 5.9% Net rental expense 83.4 79.9 78.4 78.4 19.6 19.7 19.6 19.6 78.5 80.9 83.3 Adjusted EBITDAR 155.0 143.7 154.3 154.2 20.2 30.7 41.9 31.5 124.3 120.4 125.0 % of turnover 17.9% 16.9% 18.6% 18.6% 12.1% 18.8% 20.7% 16.4% 17.1% 17.5% 17.7% 20.3 31.4 Net interest -28.7 0.0 -4.6 -7.0 -7.1 -28.0 -27.6 -27.6 Profit before taxation 0.9 -7.8 0.4 2.8 -4.2 -18.1 -20.0 -17.7 Taxation -0.3 -0.1 -0.1 0.2 0.0 6.6 5.8 effective tax rate 33.3% 0.0% 25.0% 3.6% 5.0% 0.0% 33.0% 33.0% Profit for the period 0.6 -7.8 0.3 2.7 -18.1 -13.4 -11.9 CASH FLOW ITEMS Cash flow from operations -8.6 73.6 14.5 -0.3 79.2 16.4 -1.4 Capital expenditure -22.3 -15.8 -19.9 -19.9 -4.4 -4.8 -4.7 -4.1 -18.0 -20.0 -20.0 Free cash flow 7.2 -13.0 68.8 9.8 -4.4 61.2 -3.6 -21.4 BALANCE SHEET ITEMS Cash at bank and in hand 21.5 6.6 23.5 19.1 19.1 15.6 -5.8 Total debt 302.8 285.1 285.4 285.4 285.4 285.4 285.4 Net debt 281.3 278.5 261.9 266.3 266.3 269.8 291.2 Contractual operating lease obligations 1,113.2 1,053.1 1,037.9 1,037.9 1,037.9 1,037.9 1,037.9 1,037.9 CREDIT RATIOS Net debt/Adjusted EBITDA 3.7x 5.8x 6.8x 7.0x Adjusted EBITDA/Net interest 2.6x 1.6x 1.4x 1.5x Net lease-adjusted debt/EBITDAR 5.9x 6.5x 6.5x 7.2x 7.2x 7.6x 7.7x EBITDAR/(Net interest + net rentals) 1.4x 1.3x 1.3x 1.2x 1.2x 1.1x 1.1x
Source – BNP Paribas Estimates, Focus Leverage and Coverage are based on the last 12 months’ results. Some of the ratios are adjusted for the effects of acquisitions and disposals. In addition, these 2 measures are usually calculated based on EBITDA adjusted for exceptional or non-recurring items. Leverage is defined as net lease-adjusted debt (x8 operating leases)-to-EBITDAR. Coverage is defined as EBITDAR-to-(net interest+rental expenses).

Gildemeister AG ⎪ January 2006
178 European High Yield Research
Gildemeister AG Bond Description & Market Data, as of 5 January 2006
Next Call
Description Amount (o/s) Ratings Date Price Price YTW STW
9.75% Sr Sub Nts due 2011 EUR 175mn B2/B- 19-Jul-08 104.875 113 5.95% 302bp
Source – BNP Paribas
Company Profile German-based Gildemeister is one of the leading suppliers of metal-cutting machine tools worldwide. The group operates eleven production and assembly facilities in Germany, Italy, Poland and China. It has 5,200 employees and over 3,000 customers. Germany represents 48% of 2004 sales.
Gildemeister operations are divided into the Machine Tools and Services segments. The Machine Tools segment (71% of 2004 group sales) develops and produces turning, milling and ultrasonic/laser machine tools. The Services segment (29% of group sales) provides spare parts, training, maintenance and software products. In September 2004, Gildemeister issued a €175mn high yield bond to refinance its debt. For the 12 months ended 30 September 2005, the group generated revenues of €1,109mn and EBITDA of €81mn. Gildemeister is listed on the German Stock Exchange.
Debt Profile As of 30 September 2005, the Gildemeister group had €349mn of debt. The group main borrowings are as follows:
€141mn Syndicated Credit Facility It is secured by guarantees provided by certain subsidiaries. The final maturity of the amounts drawn or drawable is 30 June 2007:
Tranche A: revolving line of credit of up to €40mn; Tranche B: letter of credit, guarantee and current account overdraft facility totalling €60mn; Tranche C: non renewable line of credit.
Bilateral Bank Facilities Some of which are secured by real estate assets.
€175mn of Senior Subordinated Notes The notes are due 2011 and are issued by Gildemeister AG. As of 31 December 2004, Gildemeister had pension provisions of €28mn.
Tran Dang, CFA +44 20 7595 8291 [email protected]

Gildemeister AG ⎪ January 2006
179 European High Yield Research
Gildemeister AG Structure
GILDEMEISTER AGIssuer of
9.75% Senior SubordinatedNotes due 2011
Non-Guarantor SubsidiariesOf GILDEMEISTER AG
Guarantors
DECKEL MAHO Pfronten GmbHDECKEL MAHO Geretsried GmbHDECKEL MAHO Seebach GmbH
GILDEMEISTER Drehmaschinen GmbHGILDEMEISTER Beteiligungen
AktiengesellschaftDMG Vertriebs und Service GmbHDECKEL MAHO GILDEMEISTERGILDEMEISTER Italiana S.p.A.
FAMOT Pleszew S.A.Leasing Entities
Subsidiaries of the Guarantors
Source – Gildemeister AG

Gildemeister AG ⎪ January 2006
180 European High Yield Research
Bond Covenant Bond description EUR 175mn 9.75% Senior Subordinated Notes due 2011
Issuing entity Gildemeister AG
Ranking Senior Subordinated
Position vs. bank debt Structurally and contractually subordinated
Position vs. other bonds Not applicable
Security/Guarantees
Senior subordinated guarantees from DECKEL MAHO Pfronten GmbH, DECKEL MAHO Geretsried GmbH, DECKEL MAHO Seebach GmbH, GILDEMEISTER Drehmaschinen GmbH, GILDEMEISTER Beteiligungen Aktiengesellschaft, DMG Vertriebs und Service GmbH DECKEL MAHO GILDEMEISTER, GILDEMEISTER Italiana S.p.A. and FAMOT Pleszew S.A. Notes will be secured by second-ranking security over the capital stock of the guarantors.
Optional redemption
Make Whole: Prior to 19 July 2008 at T+50bps
Equity Claw: Prior to 19 July 2007, 35% at 109.75 from proceeds of an equity offering
Call Schedule: 19 July 2008: 104.875
19 July 2009: 102.438
19 July 2010: 100
Tax redemption Yes – at par
Negative pledge Limitations on liens
Cross default Yes
Fall away covenants Yes – If Notes are assigned an Investment Grade Rating
Anti-layering Yes
Change of control Put at 101 if any person becomes owner of >50% of voting power or sale of substantially all of the assets
Asset sales Fair market value and >75% in cash or cash equivalents. Within 360 days reinvest in similar business or pay down debt. Any proceeds remaining (subject to €10mn minimum) must be used to tender the bonds at par.
Debt limit
Consolidated coverage ratio must exceed 2.5:1
Carve outs include: incurrence by Gildmeister AG of additional indebtedness, letters of credit and bills
of exchange at any one time outstanding not to exceed €288mn;
Sales and Leaseback, Capital lease, letter of credit and similar up to €33mn;
additional indebtedness secured by mortgages on real property up to €39mn;
receivables programme;
general carve out of €10mn,
Restricted payments
Subject to being able to incur €1 of additional debt then: 50% of consolidated income less 100% of net loss plus proceeds from equity.
Carve outs include: Repurchase of equity interest for the purpose of making share grants to employee up
to €1.5mn per year;
General basket up to €15mn.
Transactions with affiliates Must not be less favourable than if executed in an arms length transaction. If greater than €5mn requires a board certificate and if greater than €15mn requires a fairness certificate from an external financial advisor.
Source – BNP Paribas, Gildemeister AG

Gildemeister AG ⎪ January 2006
181 European High Yield Research
Gildemeister AG, Financial Model IFRS IFRS IFRS IFRS IFRS IFRS IFRS IFRS IFRS IFRS FYE 31 December Actual Actual Actual Actual Actual Actual Actual Actual Actual Actual EUR mn FY 02 FY 03 Q1 04 Q2 04 Q3 04 Q4 04 FY 04 Q1 05 Q2 05 Q3 05 PROFIT & LOSS
Sales Revenues 1,033 978 223 268 245 316 1,052 240 278 275 Increase in finished goods and work-in-progress 14 18 20 -14 11 -15 2 21 2 8 Total Work Done 1,047 996 243 254 255 301 1,053 260 280 283 Cost of materials -570 -525 -133 -127 -140 -154 -554 -139 -148 -154 Personnel costs -270 -271 -68 -72 -68 -75 -283 -73 -75 -70 Other operating income and expenses -152 -129 -30 -34 -37 -44 -146 -35 -36 -40 Depreciation of assets -38 -36 -7 -8 -7 -7 -29 -7 -8 -7 Financial result -25 -24 -6 -6 -10 -8 -30 -8 -8 -8 EBT -8 10 -2 7 -6 14 12 -2 6 4 Taxes on profit -11 -14 0 -4 8 -10 -6 -1 -1 -2 Annual profit -19 -3 -2 3 2 3 6 -3 4 2
EBITDA 55 71 12 20 11 28 71 13 21 19
Revenue growth y/y -9.8% -5.3% 7.5% 7.6% 3.9% 12.3% EBITDA margin 5.3% 7.3% 5.2% 7.6% 4.4% 9.0% 6.8% 5.4% 7.6% 6.7%
CASH FLOW
Change in working capital 20 7 -17 -32 -6 36 -18 -51 -5 2 Cash from Operating Activities 48 29 -7 -22 5 37 13 -49 6 13
Capex -53 -36 -5 -6 -5 -5 -21 -6 -5 -5 Acquisitions/Disposals -19 4 0 -1 1 0 0 0 1 0 Cash from Investing Activities -72 -32 -5 -6 -4 -5 -20 -5 -4 -5
Change in debt 46 -2 14 -28 21 -10 -3 20 -18 -4 Cash from Financing Activities 28 -2 14 32 21 -10 57 20 -18 -4
FX -1 -1 -1 3 -1 -3 -1 1 2 -1 Net Change in Cash 2 -6 2 7 21 19 49 -34 -14 4
BALANCE SHEET
Cash & Equivalents 18 11 13 17 39 60 60 26 12 16
Syndicated Credit Facility / Bank loans 166 157 157 207 187 181 €175mn Sr Sub Notes due 2011 168 168 168 168 168 168 Gross Debt 324 322 336 308 334 324 324 375 355 349
Net Debt 306 311 323 292 295 264 264 348 343 333
LTM RATIOS
Coverage 2.2 2.9 2.4 2.0 2.2 2.6 (EBITDA-Capex)/Interest 0.1 1.4 1.7 1.3 1.6 1.9
Gross leverage 5.9 4.5 4.6 6.1 4.8 4.3 Net leverage 5.6 4.4 3.7 5.6 4.7 4.1
Source – BNP Paribas, Gildemeister AG

GM/GMAC ⎪ January 2006
182 European High Yield Research
GM/GMAC Bond Description & Market Data, as of 6 January 2006
Next Call Issuer Credit Trend: Negative
Description Amount (o/s) Ratings Date Price Price YTW STW
GM (GMAC) 6% 3 July 2008 1,500 BB/Ba1 NC NC 94.7 8.41% 532 GM (GMAC) 5.75% 27 Sept 2010 1,000 BB/Ba1 NC NC 93.2 7.49% 430 GM 7.25% 3 July 2013 1,000 B/B1 NC NC 69.5 14.1% 1073 GM 8.375% 5 July 2033 1,500 B/B1 NC NC 67.0 12.7% 888
Source � BNP Paribas
Company Profile General Motors Corporation, headquartered in Detroit, Michigan is the world�s largest auto manufacturer, with unit sales of approximately 8.6 million vehicles (14.7% of worldwide vehicle sales). GM operates under the following brand names: Buick, Cadillac, Chevrolet, GMC, Hummer, Pontiac, Saturn, Opel, Vauxhall, Holden and Saab. GM�s automotive sector reports in four segments: GM North America (GMNA), GM Europe (GME), GM Asia Pacific (GMAP), and GM Latin America/Africa/Middle East (GMLAAM). In addition, GM benefits from its extensive sales finance business, which is conducted through wholly-owned General Motors Acceptance Corp. (GMAC). GMAC also operates a highly profitable mortgage and insurance business.
Investment Recommendation On 12 October, we changed our investment recommendation on GMAC from REDUCE from HOLD, while reaffirming our REDUCE on GM. GM remains under significant pressure in its US operations and although its latest restructuring programme is a step in the right direction for a sustainable turnaround in the longer term, short-term risks far offset longer term positives. Key risks for 2006 relate to: i) a potential protracted strike at Delphi (or a costly bailout by GM of Delphi workers), ii) a failure to sell a controlling stake in GMAC; and iii) a failure in taking advantage from its new range of full-size SUVs and pickup trucks (launched from Q1 2006).
Debt Profile As of end-2004, total consolidated debt totalled $300.3bn, of which $267.8bn in the financial services and insurance operations and $32.5bn in the automotive operations. Debt payable beyond one year in �Automotive and Other Operations� totalled $30.5bn, of which $27.7bn beyond 2010. At the same date, debt payable beyond one year in financing and insurance operations amounted to $177bn.
Structure General Motors Corp is the parent company of the GM group, encompassing both automotive and financial services operations. GM owns 100% of GMAC, through which it conducts its financial services business. Rescap is a wholly-owned subsidiary of GMAC and acts as the parent company of GMAC�s two residential real estate finance subsidiaries, Residential Funding Corp. (RFC) and GMAC Mortgage Corp. GMAC also operates in commercial mortgage lending through a 40% stake in GMAC Commercial Holding Corp (60% stake sold to private equity firms in 2005) (Source: GM).
BNP Paribas has currently a participation in the share capital of General Motors Corp of more than 1%. BNP Paribas had managed a public offering of securities for GMAC International Finance BV. within the past twelve months.
Cyril Benayoun +44 20 7595 8642 [email protected]

GM/GMAC ⎪ January 2006
183 European High Yield Research
Bond Covenant Bond description GM 4.375% 31 Oct 2007
Issuing entity GMAC International Finance BV
Ranking Senior unsecured Notes.
Position vs. bank debt The Notes rank equally with other current or future unsecured senior indebtedness of the Issuer in right of payment.
Position vs. other bonds The Notes rank equally with other current or future unsecured senior indebtedness of the Issuer in right of payment.
Security/Guarantees Guaranteed on a senior unsecured basis by GMAC.
Optional redemption No
Tax redemption Yes – the Issuer may redeem the Notes in whole but not in part at any time if changes in law impose certain withholding taxes on amounts payable on the Notes. Redemption amount is the principal amount of the Notes plus accrued interest and other amounts.
Negative pledge Yes
Cross default No
Limitation on liens Yes. No carve-out
Fall away covenants Yes – if the Notes achieve investment-grade status, and no EoD has occurred and is continuing.
Anti-layering No
Change of control No
Asset sales None
Debt -limit None
Restricted payments None
Transactions with affiliates Not Applicable
Source – BNP Paribas, GMAC

GM/GMAC ⎪ January 2006
184 European High Yield Research
Summary Financials: General Motors USD mn 2001 2002 2003 2004
Income Statement (1) Net Revenues 151,491 159,737 159,737 160,270 Adj. EBITDA (4) 7,900 10,025 10,456 11,238 D&A 7,051 7,346 7,346 8,739 Adj. Operating Profit (4) 849 2,679 3,110 2,499 Net Financial Expenses 751 789 789 2,490 Adj. Profit before Tax (4) (337) 1,594 2,025 (217) Net income (4) (259) 1,575 1,575 1,450 Net Income – Consolidated (incl. inance serv)
1,475 3,457 3,457 3,899
Net Income incl. One-off items (Consolidated) 502 1,689 1,689 4,074
Cash Flow Statement (1) Net Operating Cash Flow (NOCF) 5,885 8,470 8,470 13,400 Net Capex (8,611) (6,986) (6,986) (6,700) Dividends (1,201) (1,167) (1,167) (1,127) Free Cash Flow (FCF) (3,927) 317 317 5,573
Balance Sheet (1) Total Consolidated Assets 323,969 368,996 368,996 462,445 Total Consolidated Debt 166,314 201,940 201,940 284,071 Total Automotive Debt (Cash) (2) (3) 10,500 15,000 15,000 32,605 Net Automotive Debt (Cash) (2) (3) (1,000) (2,300) (2,300) 8,152 Underfunded Status – pension plans (overfunding)
12,671 19,300 19,300 n.a.
Total Shareholders’ Funds 20,453 7,648 7,648 28,237
Key Ratios (1) Adj. EBITDA Margin 5.2% 6.3% 6.5% 7.0% Adj. Operating Margin 0.6% 1.7% 1.9% 1.6% Adj. Pre-tax Margin -0.2% 1.0% 1.3% -0.1% Adjusted Net Margin -0.2% 1.0% 1.0% 0.9% Adjusted Net Margin – consolidated 0.8% 1.9% 1.2% 2.0% NOCF/ Sales 3.9% 5.3% 5.3% 8.4% EBITDA Net Interest Coverage 10.5 12.7 13.3 4.5 Automotive NOCF/ Total Automotive Debt (5) 56% 56% 56% 41% Total Automotive Debt/ Cons. Equity 51% 196% 196% 115% Capex/Depreciation 122% 95% 95% 77%
Source – Company Reports, BNP Paribas (1) Excl. Financial services, unless otherwise stated (2) Excl. Hughes (3) Incl. VEBA (4) Before one-offs (5) Annualised

GM/GMAC ⎪ January 2006
185 European High Yield Research
This page has been left blank intentionally

Grohe ⎪ January 2006
186 European High Yield Research
Grohe Bond Description & Market Data, as of 5 January 2006
Next Call Issuer Credit Trend: Negative
Description Amount (o/s) Ratings Date Price Price YTW STW
8.625% Senior Notes due 2014 EUR 335mn B3/CCC+ 1-Oct-09 104.312 92 10.02% 690bp
Source – BNP Paribas
Company Profile Grohe is Europe’s largest manufacturer of sanitary fittings in terms of both value and volume, offering a broad range of products for handling water in bathrooms and kitchens. The company focuses on the medium and high-end segments of the sanitary fittings markets and holds leading market positions in Germany, France and the Benelux countries. Grohe’s products consist primarily of faucets, showerheads and other sanitary fittings, plus related bathroom equipment – such as shower systems. Grohe sells in over 100 countries and is headquartered in Germany. For the 12 months ended 30 September 2005, the company generated revenues of €876.7mn and EBITDA of €166mn.
Investment Recommendation Following its secondary buyout in 2004, Grohe has struggled operationally. The company had relatively stagnant revenues in 2000-2004 and in 2005 has seen revenues decline significantly. The revenue decline was broadly based across the company’s regional markets and was volume-led. At the time of the bond deal, Grohe was expecting revenue growth to be fuelled by expanding sales in North America and margin expansion to come from cost cutting. Given that revenue growth has not materialised and has in fact turned negative the cost cutting plans are now essential. We were sceptical of Grohe’s original €90mn cost savings plan given the Company’s previous private equity owners and the lack of any specific detail regarding the plans. We were, therefore, even more sceptical of the additional €60mn of cost savings announced in August 2005. Notwithstanding the above, Grohe has significant liquidity from its cash on balance sheet and under its recently committed €70mn restructuring facility. Furthermore, Grohe has recently renegotiated its covenant package for 2006 to allow the Company additional flexibility to pursue its cost savings plans. While retaining our scepticism over the long term success of the cost savings plans, the current level of the bonds offers one of the widest spreads within the high yield market and coupled with Grohe’s available liquidity leads us to a HOLD recommendation.
Debt Profile Following the secondary buyout by TPG and CSFB, the company’s debt structure comprises the following main elements:
Senior Credit Facility – Final Maturity July 2013
The facility is comprised of a tranche A of €225mn maturing July 2011, tranche B €287.5mn maturing July 2012, tranche C €287.5mn maturing July 2013 and a revolving credit facility of €100mn maturing July 2011. In addition, there is an uncommitted tranche D of up to €200mn. In August 2005, €100mn of the tranche D facility was converted into a committed facility that could be used to fund restructuring expenses. This was subsequently reduced to €70mn. The remaining tranche D, if funded, will be used to fund joint ventures and certain acquisitions.
The Senior Credit facility is structurally senior to the high yield bonds and benefits from guarantees from certain subsidiaries, security over substantially all of the assets of such guarantors and a first ranking security interest over the collateral securing the notes.
8.625% Senior Notes
These have been issued by Grohe Holding GmbH. They are guaranteed on a senior subordinated basis by Grohe Zweite and, subject to certain exceptions, each obligor or guarantor of the senior credit facility.
Other Debt
Additionally, there is a small amount of subsidiary indebtedness and a residual balance of €6mn of the company’s old 11.5% 2010 notes that were left outstanding post the tender.
Adam Harnetty, ACA +44 20 7595 8831 [email protected]

Grohe ⎪ January 2006
187 European High Yield Research
Grohe Structure
TPG Partners IV, L.P. DLJ Merchant Banking Funds
50% 50%
Subsidiary Guarantors
Glacier ZweiteBeteiligungs GmbH
Grohe Water Technology Verwaltungs AG
Grohe Water Technology AG & Co. KG
Grohe Holding GmbH (the “Issuer”)
8 5/8 Senior Notes due 2014 €335 million
Senior Credit Facilities
€800 million term loans
€70m Restructuring Facility
€100m Uncommitted Term D Facility
€100 million revolving credit facility
Additional Subsidiary Guarantors
Non-guarantor subsidiaries
Source – Grohe

Grohe ⎪ January 2006
188 European High Yield Research
Bond Covenant Bond description 8.625% Senior Notes due 2014
Issuing entity Grohe Holding GmbH
Ranking Senior
Position vs. bank debt Subordinated
Position vs. other bonds NA
Security/guarantees Subsidiary subordinated guarantees
Optional redemption
Make whole: Before 1 October 2009 at T+50bp
Equity Claw: Prior to 1 October 2007, 40% at 108.625% with proceeds from an Equity offering
Call Schedule:
1 October 2009 - 104.312%
1 October 2010 – 102.875%
1 October 2011 – 101.437%
1 October 2012 – 100%
Tax redemption Yes at par
Negative pledge Limitation on liens but carve outs (major one is for €900mn of Credit Facilities)
Cross default Yes
Fall away covenants No
Anti-layering Yes
Change of control Put at 101 – 50% of voting power or substantial sale of assets
Asset sales Fair market value and >75% proceeds in cash or equivalents. Within 365 days reinvest in similar business or repay debt. Any proceeds remaining (subject to €15mn minimum) must be used to tender for bonds at par.
Debt limit
Consolidated coverage ratio must exceed 2:1.
Carve outs: Credit facilities up to €900mn (as reduced by any pay down from asset sales);
Capital leases & similar up to €50mn;
General carve out up to the greater of €40mn and 6% of tangible assets.
Restricted payments
Subject to being able to incur €1 of additional debt then: 50% consolidated net income;
6% p.a. of the net proceeds received from a public offering;
€10mn to repurchase employee stock;
€30mn general basket.
Transactions with affiliates Must not be less favourable than if executed in an arms length transaction. If greater than €5mn requires a board certificate and if greater than €20mn requires a fairness certificate from an external advisor.
Source – BNP Paribas, Grohe

Grohe ⎪ January 2006
189 European High Yield Research
Grohe, Financial Model FYE 31 December * PF PF PF PF Actual PF Actual Actual Actual ForecastEUR mn 2002 2003 Q1 04 Q2 04 Q3 04 Q4 04 2004 Q1 05 Q2 05 Q3 05 2005
PROFIT & LOSS Sales 898 889 222 242 224 224 911 221 223 209 867 Cost of Sales -517 -515 -129 -140 -133 -144 -546 -138 -140 -131 Gross Profit 381 374 92 102 92 79 366 83 83 78 SG&A -279 -224 -56.0 -60.0 -59.0 -57.0 -232.0 -56.0 -56.0 -53 Other operating net 0 -116 -121 -29 -29 -38 -217 -34 -74 -44 Operating income 102 34 -85 13 4 -16 -83 -7 -47 -19 Associates/other 15 1 0 0 0 0 1 0 0 1 Net interest -67 -85 -20 -20 -20 -20 -80 -20 -20 -20 Tax -26 -6 1 -4 0 34 31 6 19 10 Net Income 24 -56 -104 -11 -17 -2 -131 -21 -48 -28 D&A 74 149 41 47 38 29 155 38 38 38 Restructure costs 10 -10 4 22 26 10 51 19 Other adjustments 81 2 2 7 92 1 1 1 EBITDA 176 183 47 53 47 43 189 41 43 39 161
Revenue growth y/y 1.9% 2.5% -0.2% -7.9% -6.7% -4.9% Gross margin 42.4% 42.1% 41.7% 42.3% 40.8% 35.5% 40.1% 37.6% 37.1% 37.3% EBITDA margin 19.6% 20.6% 21.0% 21.9% 21.0% 19.1% 20.8% 18.6% 19.1% 18.7% 18.6%
CASHFLOW
EBITDA 176 183 41 43 39 Cash Interest -49 -58 -33 6 -34 Cash tax -30 -30 0 Other 0 -2 -12 -62 -23 Change in working capital 46 -5 -41 49 30 Cash from Operating Activities 143 88 -45 36 12 Gross Capex (PP&E) -37 -31 -40 -3 -6 -10 Net debt repayment -80 -28 10 -4 6 Other -5 -44 0 1 -3 Change in cash 21 -15 -38 27 5
BALANCE SHEET Cash 16 63 25 51 56 Bank Debt 800 817 810 805 804 Subsidiary Indebtedness & other 12 0 12 20 12 Old Notes 6 6 6 6 6 8.625% 2014 Notes 335 335 335 335 335 Gross Debt 1,153 1,158 1,163 1,166 1,157 Net Debt 1,137 1,095 1,138 1,115 1,101
LTM RATIOS Coverage 2.1 2.3 2.2 2.1 2.1 EBITDA-Capex/Interest 1.6 1.8 1.7 1.6 1.6 Gross leverage 6.5 6.2 6.4 6.8 7.0 Net leverage 6.4 5.9 6.3 6.5 6.6
Source – BNP Paribas, Grohe * Predecessor

Head NV ⎪ January 2006
190 European High Yield Research
Head Bond Description & Market Data, as of 5 January 2006
Next Call Issuer Credit Trend: Stable
Description Amount (o/s) Ratings Date Price Price YTW STW
8.50 % Sr Nts due 2014 EUR 135mn B3/B- 01-Feb-09 104.25 95.00 9.40% 629bp
Source – BNP Paribas
Company Profile Head is a leading global manufacturer and marketer of branded skiing, tennis and diving sports equipment. The company owns a portfolio of premium brands, which includes Head (alpine skis, ski boots and snowboard products, tennis, racquetball and squash racquets, athletic and outdoor footwear and apparel), Tyrolia (ski bindings), Penn (tennis balls and racquetballs) and Mares and Dacor (diving equipment). Head targets high-end segments of its markets by developing value-added innovative products sold at premium prices and holds leading market positions in all three of its product categories: Winter Sports, Racquet Sports and Diving Equipment. The company also derives revenues from licensing agreements, which leverage the company’s brands outside the core product categories. In the twelve months ended 30 September 2005, Head had sales of $470mn and adjusted EBITDA of $37mn. At the end of the period, the company had leverage of 4.1x and coverage of 2.1x.
Investment Recommendation We maintain our BUY/Stable Credit Trend recommendation for Head’s 8.5% senior notes due 2014. We feel that the bonds offer an attractive opportunity for a carry trade, but we stop short of endorsing the notes as a good long-term investment supported by sound fundamentals. We believe that the company’s bond prices have stabilised after being quite volatile for the best part of the year. Given that the notes are still well below par and offer a fairly substantial spread, we think that further downside risk should be limited during the subsequent six months. The company has already given a fairly specific guidance in respect of the fourth quarter earnings and, therefore, an element of surprise in the numbers should be limited. More specifically, Head stated in conjunction with the third quarter 2005 earnings release that it expected its full-year operating profit (after planned restructuring costs and gains on sale of property) would be in line with that achieved in 2004. We note here that, based on our interpretation of the guidance, the company expects that the fourth quarter 2005 operating profit will actually be lower year-on-year following year-on-year increases in the second and third quarter of the year. Given that the market has already had a chance to “digest” this information, we believe that if the actual results are no worse that this modest guidance, the company’s notes should not weaken. We would also like to point out that Head’s first quarter 2005 results were quite poor, creating a favourable comparable base for the first quarter 2006 results. To recap, we think that Head’s bonds should remain stable through the next two quarterly results reports, providing an opportunity to capture an attractive current yield. Longer-term, we maintain our cautious view regarding the fundamentals of the credit. We note that our recommendation is speculative and the bonds have proved to be very volatile. We are concerned that the company may lack a critical mass to survive independently longer-term and recognize that Head’s performance is often dependent on factors outside of the company’s control (such as weather conditions at the main ski resorts, level of international travel, popularity of tennis as a leisure activity, fluctuations in the EUR/USD exchange rate, etc.). We believe that the company owns good brands in each of its segments – winter sports, tennis equipment and diving. We think that the quickest and most economically effective way to crystallize the value of those brands would be to sell them to other entities. However, given that we feel that the company is already small as it is, a sale of one of the major brands on its own is not acceptable for shareholders as the scale would be reduced even further. Therefore, finding an attractive suitor for the company may not be as easy as it appears. Conversely, we do not believe that Head has enough firepower to expand its brand portfolio at the current stage and any potential acquisitions will most likely be dilutive for the company’s bondholders. Finally, we note that it is difficult to get a good visibility for the company’s performance in between the earnings announcements, which exposes the bonds to the above average volatility related to the earnings announcements.
Debt Profile As of 30 September 2005, Head had total debt of $193mn, comprising $134mn of senior high yield notes (equivalent of approximately €111mn outstanding), $34mn of short-term borrowings and non-bond long-term debt of $26mn. The majority of the non-bond debt is represented by the amounts outstanding under the company’s two bank lines. The first one is a credit line with Austrian banks of up to €15mn in the context of Austrian export promotion programmes administered by Oesterreichische Kontrollbank Aktiengesellschaft. The amounts owed under these facilities are secured by bills of exchange and by all Austrian trade receivables. Another bank facility is in Japan (the borrower is the company’s Japanese subsidiary).
Oleksiy Soroka, CFA +44 20 7595 4878 [email protected]
BNP Paribas has currently a participation in the share capital of HEAD NV of more than 1%.

Head NV ⎪ January 2006
191 European High Yield Research
Head NV Structure
Head N.V.
Head HoldingUnternehmensbeteiligung GmbH(1)
HTM Sport- und Freizeitgerbe AG(2)
Guaranteesof
Notes
€125,000,000 Senior Notesdue 2014
SubsidiaryGuarantors(3)
SubsidiaryNon-Guarantors(4)
Inventories, Accounts Receivable and Certain Other Assets(4) Other Subsidiary
Non-Guarantors(5)
Guarantees of Notes
1. Holding company. 2. Operating company. 3. The notes are guaranteed by each of the following Subsidiary Guarantors: Head Sport AG, Head International GmbH, HTM Sport S.p.A., Head USA Inc., Penn Racquet Sports Inc., Head Sport s.r.o. and Head/Tyrolia Sports Canada Inc. All Subsidiary Guarantors are operating companies. 4. As a result of its cost reduction program, the company expects the inventories, accounts receivable and certain property, plant and equipment of certain non-guarantor subsidiaries to be transferred or shifted to the Subsidiary Guarantors identified in (3) above. These non-guarantor subsidiaries are: O U HTM Sport Eesti, Head Tyrolia GmbH, Head Germany GmbH, Head Tyrolia Sports S.A., Head Switzerland, Head UK Ltd., Penn Racquet Sports Co., Penn Racquet Sports Holding Ltd. and Penn (Ireland) Unlimited. 5. None of the following subsidiaries guarantees the notes: Head Technology GmbH, Tyrolia Technology GmbH, HTM Sports Japan KK, HTM Head Tyrolia Mares Iberica S.L., Head Bulgaria EOOD, HTM USA Holdings Inc. and the following dormant companies: Mares America Corp., Dacor Corp., Head Sports Inc. and Penn Sub, Inc.
Source – Head NV

Head NV ⎪ January 2006
192 European High Yield Research
Bond Covenant Bond description EUR 135mn 8.5 % Senior Notes due 2014
Issuing entity HTM Sport- und Friezeitgerate AG
Ranking Senior unsecured
Position vs. Bank debt Limited amount of secured debt at the HTM level.
Position vs. Other bonds Not applicable
Security/guarantees Senior unsecured guarantees from Head N.V., Head Holding, Head Sport AG, Head International GmbH, HTM Sport S.p.A., Head USA Inc., Penn Racquet Sports Inc. and Head/Tyrolia Sports Canada Inc.
Optional redemption
Equity Clawback – 35% at 108.5% before 1 February 2007 Call Schedule: - during the twelve-month period beginning
1 February 2009 – 104.250% 1 February 2010 – 102.830% 1 February 2011 – 101.417% 1 February 2012 and thereafter – 100.000%
Change of control Put at 101%
Tax redemption Yes – at par
Negative pledge Yes
Cross default Yes – on other debt of over €5mn
Fall away covenants No
Anti-layering No
Debt limit
Up to Consolidated Fixed Charge Coverage Ratio of 2.0x. Carve outs: Credit Facility Indebtedness not to exceed the greater of (a) €100mn and (b) the sum of (x)
85% of the total book value of accounts receivable and (y) 50% of the total book value of inventory less (z) €100mn;
Capital Lease Obligations and Purchase Money Obligations incurred in the ordinary course of business of up to €15mn;
Acquired indebtedness of up to €5mn; Guarantees constituting an investment in the Sporting Industry (as defined), provided that
following such investment the Consolidated Fixed Charge Coverage Ration is less than 2.0x;
General basket of up to €20mn.
Restricted payments
50% net income less 100% net loss plus 100% cash from equity, plus the amount of conversion of debt into equity contributionsyt, plus 100% payments from Unrestricted Subsidiaries (such as interest on indebtedness, dividends, etc.), plus a fair market value of an Unrestricted when it is redesignated as a Restricted Subsidiary. Carve outs: Purchase of capital stock from the management of the company of up to €1mn; Payments or distributions in respect of the company’s stock of up to €3mn in any calendar
year (with unused amounts in any calendar year being carried over to succeeding calendar years);
General basket of up to €8.5mn.
Transactions with affiliates Transaction with fair market value over €2mn require approval of the majority of the disinterested members of the Board of Directors and evidenced by a Board Resolution; In addition, for transactions with fair market value of over €5mn, a fairness opinion of an Independent Financial Advisor with experience in appraising similar transactions needs to be obtained.
Asset sales
At least 75% of consideration is received in the form of cash or cash equivalent, in assets used in the business of the company, assumed indebtedness of the issuer or a restricted subsidiary. Within 365 calendar days the company must use the proceeds to: Repay secured indebtedness of the company or the Guarantors or if it is an asset sale of a
Restricted Subsidiary which is not a Guarantor, to repay indebtedness of such subsidiary; To invest in Permitted Related Investment To repurchase Notes in the open market.
After using the portion of the proceeds from an asset sale for one of the above, the Excess Proceeds of over €10mn must be used to make an offer to purchase the outstanding Notes and other pari passu debt.
Source – BNP Paribas, Head NV

Head NV ⎪ January 2006
193 European High Yield Research
Head NV, Financial Model BNPP BNPP BNPP BNPP BNPP FYE 31 December Actual Actual Actual Actual Actual Actual F’cast F’cast F’cast F’cast F’cast USD ‘000 2002 2003 2004 Q1 05 Q2 05 Q3 05 Q4 05 2005 2006 2007 2008 P&L SUMMARY Winter Sports 144,667 188,768 223,211 21,220 12,882 71,506 121,145 226,753 229,149 235,916 240,634 % change 6.8% 30.5% 18.2% -3.9% 76.0% 3.8% -3.0% 1.6% 1.1% 3.0% 2.0% Racquet Sports 168,822 166,416 168,036 42,380 47,652 42,528 34,471 167,031 167,904 170,393 172,097 % change -6.3% -1.4% 1.0% -14.4% 1.6% 8.7% 6.0% -0.6% 0.5% 1.5% 1.0% Diving 65,600 66,321 75,453 19,078 22,369 9,652 12,915 64,014 60,938 62,043 63,905 % change -4.2% 1.1% 13.8% -4.2% -13.9% -24.2% -23.3% -15.2% -4.8% 1.8% 3.0% Licencing and Other 9,644 11,095 11,059 3,049 4,510 1,975 3,692 13,226 14,086 14,790 15,530 % change 20.4% 15.1% -0.3% 5.5% 49.8% 2.3% 2.3% 19.6% 6.5% 5.0% 5.0% Total Revenues 388,733 432,602 477,759 85,727 87,413 125,661 172,223 471,024 472,077 483,142 492,166 % change -0.8% 11.3% 10.4% -9.2% 5.1% 2.4% -3.2% -1.4% 0.2% 2.3% 1.9% Cost of sales -233,402 -266,022 -294,360 -52,276 -46,757 -76,005 -106,527 -281,565 -282,028 -289,089 -294,952 Gross profit 155,330 166,580 172,654 31,343 39,215 46,850 61,496 178,904 178,802 182,508 185,426 % of revenues 40.0% 38.5% 37.0% 37.5% 45.6% 38.1% 36.6% 38.9% 38.8% 38.7% 38.6% Selling and marketing expense -103,865 -118,465 -118,511 -30,933 -27,511 -24,197 -41,166 -123,807 -125,576 -129,689 -132,104 % of revenues 26.7% 27.4% 25.4% 37.0% 32.0% 19.7% 24.5% 26.9% 27.3% 27.5% 27.5% General and administrative expense -32,524 -38,848 -41,883 -9,325 -10,390 -8,771 -11,500 -39,986 -40,092 -41,029 -41,793 (excl non-cash comp exp & restructuringcharge) % of revenues 8.4% 9.0% 9.0% 11.2% 12.1% 7.1% 6.8% 8.7% 8.7% 8.7% 8.7% Non-cash compensation expense -1,632 -654 -555 -106 -106 -176 -175 -563 -565 -565 -565 Gain on sale of property -443 0 5,650 0 7,246 0 0 7,246 0 0 0 Restructuring costs 0 -8,368 -2,347 0 -2,959 -1,996 -500 -5,455 0 0 0 Operating income 17,753 245 15,008 -9,021 5,495 11,711 8,156 16,340 12,569 11,225 10,964 operating margin 4.6% 0.1% 3.2% -10.8% 6.4% 9.5% 4.9% 3.5% 2.7% 2.4% 2.3% Depreciation and amortisation 15,946 19,239 19,261 5,341 5,194 4,344 4,350 19,229 19,250 19,250 19,250 Adjusted EBITDA 32,606 26,712 30,966 -3,680 6,402 18,050 13,006 33,778 31,819 30,475 30,214 Adjusted EBITDA margin 8.4% 6.2% 6.6% -4.4% 7.4% 14.7% 7.7% 7.3% 6.9% 6.5% 6.3% Interest expense -11,677 -13,999 -25,699 -4,465 -4,086 -3,797 -3,564 -15,912 -13,593 -13,523 -13,448 Interest income 940 1,050 2,121 297 1,669 272 300 2,538 1,225 1,278 1,348 Net interest expense -10,737 -12,950 -23,578 -4,168 -2,417 -3,525 -3,264 -13,374 -12,368 -12,245 -12,100 CASH FLOW ITEMS Operating Cash Flow 22,186 17,342 7,789 39,313 -12,443 -11,443 13,174 28,601 19,401 18,485 18,398 Capex -18,641 -16,656 -15,268 -2,581 -5,139 3,047 -4,000 -8,673 -12,500 -12,500 -12,500 Free Cash Flow 3,545 686 -7,479 36,732 -17,582 -8,396 9,174 19,928 6,901 5,985 5,898 BALANCE SHEET ITEMS Cash Position (including restricted cash) 36,505 43,020 66,018 78,201 48,290 41,218 68,086 68,086 72,156 75,235 78,289 Short-term borrowings 58,773 37,490 39,883 36,182 34,644 33,838 33,931 33,931 33,931 33,931 33,931 Current portion of long-term debt 2,349 3,392 3,305 3,596 2,744 2,738 2,831 2,831 2,905 2,844 2,348 Total short-term borrowings 61,122 40,882 43,188 39,778 37,388 36,576 36,762 36,762 36,836 36,775 36,279 Senior notes 68,900 82,900 160,700 151,000 157,400 133,700 133,700 133,700 133,700 133,700 133,700 Other long-term debt 24,871 61,051 38,820 25,383 580 23,061 40,662 40,662 37,831 34,926 32,082 Total long-term borrowings 93,771 143,951 199,520 176,383 157,980 156,761 174,362 174,362 171,531 168,626 165,782 Total Debt 154,893 184,833 242,708 216,161 195,368 193,337 211,124 211,124 208,367 205,401 202,061 Net Debt 118,388 141,813 176,689 137,960 147,078 152,119 143,038 143,038 136,211 130,166 123,772 CREDIT RATIOS Adjusted EBITDA / Net Interest Expense 3.0x 2.1x 1.8x 1.4x 1.3x 2.1x 2.5x 2.5x 2.6x 2.5x 2.5x Total Debt / Adjusted EBITDA 4.8x 6.9x 7.8x 8.1x 5.7x 5.2x 6.3x 6.3x 6.5x 6.7x 6.7x Net Debt / Adjsuted EBITDA 3.6x 5.3x 5.7x 5.2x 4.3x 4.1x 4.2x 4.2x 4.3x 4.3x 4.1x
Source – BNP Paribas Estimates, Head NV Leverage and Coverage are based on the last 12 months’ results. Some of the ratios are adjusted for the effects of acquisitions and disposals. In addition, these 2 measures are usually calculated based on EBITDA adjusted for exceptional or non-recurring items. Leverage is defined as net lease-adjusted debt (x8 operating leases)-to-EBITDAR. Coverage is defined as EBITDAR-to-(net interest+rental expenses).

Heckler & Koch ⎪ January 2006
194 European High Yield Research
Heckler & Koch Bond Description & Market Data, as of 5 January 06
Next Call
Description Amount (o/s) Ratings Date Price Price YTW STW
9.25% Sr Secured due 2011 EUR 120mn B1/B 15-Jul-08 104.625 114.25 4.91% 195bp
Source – BNP Paribas
Company Profile Germany-based Heckler & Koch is a leading defence contractor in the small arms sector of the European NATO defence market. It designs, produces and distributes rifles, side arms, fully automatic weapons and grenade launchers. Heckler & Koch is notably the sole supplier of assault rifles to the German, British and Spanish armed forces. In 2004, 76% of sales came from Europe and 14% from the US, where the group plans to expand. Heckler & Koch has one manufacturing plant in Oberndorf, Germany and recently acquired a facility in Columbus, Georgia, USA. During the 12 months ended 30 September 2005, Heckler & Koch generated revenues of €160mn and EBITDA of €31mn. The group employs approximately 680 people and is privately owned by Messrs Heeschen and Halsey.
Debt Profile As of 30 September 2005, Heckler & Koch’s debt only comprised €120mn of high yield bonds maturing in 2011. The notes were issued in 2004 to pay back a shareholder loan and fund certain planned capex and working capital for its US expansion. The group does not maintain committed bank facilities. As of 31 December 2004 the group had €35mn of pension liabilities under German GAAP.
Tran Dang, CFA +44 20 7595 8291 [email protected]

Heckler & Koch ⎪ January 2006
195 European High Yield Research
Heckler & Koch Structure
Heckler & Koch GmbH(Oberndorf, Germany)(1)
HKH(United States)
HKH(Germany)
Shareholders
100%
100%
NSAF(United Kingdom)
100%
SAG(United States)
100%
HKD(United States)
100%
€120,000,000 Notes
Pledge of shares of Heckler & Koch GmbH
Intercompany loan of €30 million pledged to noteholders
Restricted Group
100%
Guarantors
Source – Heckler & Koch

Heckler & Koch ⎪ January 2006
196 European High Yield Research
Bond Covenant Bond description EUR 120mn 9.25% Senior Secured Notes due 2011
Issuing entity Heckler & Koch GmbH, the main operating company of the group
Ranking Senior Secured
Position vs. bank debt NA
Position vs. other bonds NA
Security/Guarantees Secured by a first priority security interest over the capital stock of the issuer and the intercompany loan to its US subsidiary HKD – Senior guaranteed by all subsidiaries
Optional redemption
Make whole: Prior to 15 July 2008 at T+50bp
Equity Claw: Prior to 15 July 2007, 35% at 109.25 with proceeds from IPO
Call Schedule: 15 July 2008: 104.625
15 July 2009: 102.313
15 July 2010: 100
15 July 2011: 100
Tax redemption Yes at par
Negative pledge Limitation on liens
Cross default Yes
Fall away covenants Yes if Notes receive Investment Grade rating at S&P or Moody’s
Anti-layering No
Change of control Yes – Put at 101% if Change of Control (ie if Permitted holders < 50% of voting power or a person has >35% after Public Equity Offering) and downgrade in ratings
Asset sales Fair Market Value and > 75% of proceeds in cash and cash equivalents. Within 360 days reinvest in similar business or repay debt. Any proceeds remaining (subject to €5mn minimum) must be used to tender the bonds (at par) and any pari passu debt.
Debt limit
Consolidated Fixed Charge Coverage Ratio must exceed 2.5:1
Carve outs include: €15mn of debt under credit facilities
€5mn general basket
Restricted payments
Subject to being able to incur €1 of additional debt then 50% of consolidated net income less 100% of net loss plus proceeds from equity
Carve outs include: €2.5mn general basket
Transactions with affiliates Must not be less favourable than if executed in an arms length transaction. If greater than €1mn requires an officers’ certificate. If greater than €5mn, requires a resolution from supervisory board. If greater than €7.5mn requires fairness opinion from an investment bank
Source – BNP Paribas, Heckler & Koch

Heckler & Koch ⎪ January 2006
197 European High Yield Research
Heckler & Koch, Financial Model German
GAAP German GAAP
German GAAP
German GAAP
German GAAP
German GAAP
German GAAP
German GAAP
German GAAP
German GAAP
FYE 31 December Proforma Proforma Actual Actual Actual Actual Actual Actual Actual Actual EUR mn FY 02 FY 03 Q1 04 Q2 04 Q3 04 Q4 04 FY 04 Q1 05 Q2 05 Q3 05 PROFIT & LOSS
Net Sales 112 145 33 41 30 49 153 32 48 31 Unrealised profit elimination -2 -2 2 0 0 1 2 0 -1 1 Cost of materials/chg in inventories/capitalised costs -37 -53 -13 -16 -9 -22 -60 -11 -19 -15 Personnel expenses -34 -37 -10 -9 -10 -10 -39 -10 -11 -10 Other operating income/expenses -22 -23 -5 -7 -7 -6 -24 -5 -7 -4 Depreciation and amortisation -24 -24 -6 -6 -6 -5 -23 -6 -6 -6 Operating profit (loss) -7 6 3 2 -2 6 9 1 5 -3 Net interest 2 3 0 0 -2 -3 -4 -3 -2 -3 Write down of financial assets 0 -3 0 0 0 0 0 0 0 0 Extraordinary income 0 0 0 -4 -3 -1 -8 0 0 0 Taxes -5 -11 -3 -1 1 -3 -7 -1 -3 -1 Net income -10 -6 0 -3 -6 -1 -10 -3 -1 -6
EBITDA 17 30 9 8 4 11 32 6 11 4
Revenue growth y/y 26.3% 29.6% 5.2% -4.2% 18.7% 4.0% EBITDA margin 15.2% 20.7% 26.0% 19.5% 14.0% 22.2% 20.7% 20.2% 22.0% 11.3%
CASH FLOW
Change in working capital 7 1 -1 3 -7 1 -5 -6 -10 -3 Cash from Operating Activities 30 26 8 11 -4 7 22 -2 -1 -2
Capex -6 -8 -1 -2 -2 -3 -9 -1 -2 -2 Acquisitions/Disposals -62 39 -14 3 4 -4 -11 -8 0 3 Cash from Investing Activities -68 32 -3 1 1 -7 -8 -9 -2 6
Change in debt 0 0 0 0 113 -1 113 0 0 0 Cash from Financing Activities 0 -45 0 -11 43 2 34 0 0 0
Net Change in Cash -38 13 4 0 41 2 47 -11 -2 3
BALANCE SHEET
Cash & Equivalents 3 13 18 18 59 61 61 50 48 51
Bank debt 3 0 0 0 0 0 0 0 0 0 9.25% Sr Sec Notes due 2011 0 0 0 0 120 120 120 120 120 120 Gross Debt 3 0 0 0 120 120 120 120 120 120
Net Debt 0 -13 -18 -18 61 59 59 70 72 69
LTM RATIOS
Coverage -10.0 -11.1 7.2 4.0 3.2 3.0 (EBITDA-Capex)/Interest -6.3 -8.2 5.1 2.8 2.4 2.2
Gross leverage 0.1 0.0 3.8 4.1 3.7 3.8 Net leverage 0.0 -0.4 1.9 2.4 2.2 2.2
Source – BNP Paribas, Heckler & Koch

Hornbach Baumarkt AG ⎪ January 2006
198 European High Yield Research
Hornbach Baumarkt AG Bond Description & Market Data, as of 5 January 2006
Next Call Issuer Credit Trend: Stable
Description Amount (o/s) Ratings Date Price Price YTW STW
6.125% Senior Notes due 2014 EUR 250mn Ba3/BB- 15-Nov-09 103.06 100.25 6.09% 281bp
Source – BNP Paribas
Company Profile Horbach Baumarkt AG (Hornbach) is a leading operator in the German DIY retail sector with a growing presence in other European countries. The company has national coverage in Germany with its large “Megastore” retail formats. Such megastores have average sales area of over 10,000 square meters and have similar store layouts and product portfolios. The company believes that it has the highest average store size among the European DIY operators. As of 31 August 2005, Hornbach currently operated 121 DIY stores and garden centres with a total sales area of 1,262,000 square meters. Of those stores, 90 were in Germany and 31 were abroad (including 11 in Austria, 8 in the Netherlands, 4 in the Czech Republic, 3 in Switzerland, 2 in Sweden, 2 in Slovakia and 1 in Luxembourg). The company consistently applies an effective every day low prices (EDLP) pricing model. The family-controlled Hornbach Holding AG owns 80% of Hornbach-Baumarkt-AG. The Hornbach family owns 75% in Hornbach Holding AG, with the remainder belonging to Kingfisher. Hornbach has an operating tie-up with Kingfisher. In the twelve months ended 31 August 2005, Hornbach Baumarkt had sales of €2,171mn and EBITDA of €136mn. As of that date, Hornbach Baumarkt had lease-adjusted leverage of 4.7x and a lease-adjusted coverage of 1.9x.
Investment Recommendation We maintain our BUY/Stable Credit Trend recommendation. Hornbach is a competent DIY retailer with a successful business concept. We also like the company’s management and its good positioning in the overcrowded German DIY retail market. Hornbach has endured difficult first three quarters of fiscal 2005/06. The company’s earnings deteriorated due to the continued high competitive pressure, weak retail environment in Hornbach’s domestic German market and a relatively high prior year comparative base. We are encouraged by the relative resilience in the company’s like-for-like sales in Germany and by good underlying growth in Hornbach’s international business. However, we recognize that Hornbach had to sacrifice its gross margin (and consequently its operating margin), in order to maintain its sales dynamic in positive territory. We forecast that earnings will fully stabilize and will regain a positive momentum during fiscal 2006/07 (and possibly even sooner, in the fourth quarter of the current fiscal year). A recovery in the German consumer sentiment would represent an upside scenario relative to our current expectations. We caution that the notes have a somewhat risky profile due to (i) a very competitive nature of the German DIY market; (ii) Hornbach’s high leverage measures (in particular, relative to the bond’s current ratings); and (iii) our expectation that an ongoing heavy expansionary capital investment programme will lead to negative free cash flow generation during the next couple of years. We reckon that, due to their tight levels, the bonds are not particularly attractive for the mainstream high yield investors, but might be of interest for crossover or high grade investors, who would like to enhance their yield by migrating a little down the curve. In this respect, Hornbach’s notes are rated in the double-B category (Ba3/BB-) and have traditionally exhibited lower degree of volatility relative to other high yield retail issuers.
Debt Profile As of 30 November 2005, Hornbach had a total debt of €519mn, including €105mn of short-term debt and €414mn of long-term debt. Hornbach’s liabilities include high yield bonds (€250mn of nominal amount outstanding), mortgage loans, bank credit lines and other financing arrangements. As of 28 February 2005, for which the latest more detailed debt breakdown is available, the company had total debt of €542mn, comprising the high yield bonds, bank debt of €295mn, finance leases of €4mn and other liabilities of €3mn. As of that date, Hornbach had mortgage loans of approximately €246mn. In addition, at that point, the company had access to credit lines and other financing agreements of short-term nature of €220mn, of which €218mn was available. Finally, the company had credit lines for letters of credit in the amount of $15mn (of which approximately $10mn was utilized).
Oleksiy Soroka, CFA +44 20 7595 4878 [email protected]

Hornbach Baumarkt AG ⎪ January 2006
199 European High Yield Research
Hornbach Corporate Structure
Source – Hornbach
€250.0 million 61/8 Senior
Notes due 2014
HORNBACH-Baumarkt-Aktiengesellschaft
Non-guarantors Guarantors Senior Guarantees

Hornbach Baumarkt AG ⎪ January 2006
200 European High Yield Research
Bond Covenant Bond description EUR 250mn Senior Notes due 2014
Issuing entity HORNBACH-Baumarkt-Aktiengesellschaft
Ranking Senior unsecured
Position vs. bank debt Bank debt is secured by mortgages on the real estate property.
Position vs. other bonds Not applicable
Security/Guarantees Senior unsecured guarantees from subsidiaries (99.9% of net sales and EBITDA and 82.4% of consolidated tangible assets). The Notes and the Guarantees are structurally subordinated to all obligation of the Company’s subsidiaries that do not guarantee the Notes.
Optional redemption
Make Whole – Bunds+50bp before 15 November 2009 Equity Clawback – 35% at 106.125% before 15 November 2007 Call Schedule: - during the twelve-month period beginning
15 November 2009 – 103.063% 15 November 2010 – 102.042% 15 November 2011 – 101.021% 15 November 2012 and thereafter – 100.000%.
Tax redemption Yes – at par.
Negative pledge Yes – limitation on liens
Cross default Yes – on €15mn or more of other debt.
Fall away covenants Yes.
Anti-layering No.
Change of control Put at 101% (upon occurrence of a Change of Control Triggering Event, which includes a Change of Control and a resulting Rating Decline (by one or two notches)).
Asset sales
The Issuer cannot sell assets unless: The issuer receives a fair market value for them; At least 75% of the consideration is in cash or equivalent; 100% of the Net Available Cash from the Asset Disposition will have to be used within
360 days from the date of the sale or from the day of the receipt of the cash proceeds to (a) permanently repay indebtedness; (b) to the extent extra proceeds are left after (a) to invest in additional assets.
Net proceeds from an Asset Sale not used for the above will constitute Excess Proceeds an when the aggregate amount exceeds €10mn the Issuer shall make a pro rata offer for the portion of the bonds outstanding in accordance to the Asset Sale Offer.
Debt limit
Pro forma Consolidated Coverage Ratio of at least 2.25x. Carve outs: Indebtedness which is expressly subordinated to the prior payment in cash of all
obligations with respect to the notes; Indebtedness of a Restricted Subsidiary acquired by the Issuer provided the Issuer is
able to incur €1.00 of additional indebtedness; Capital Lease Obligations, mortgage financings, Attributable Indebtedness and
purchase money obligations incurred in the course of business in an aggregate amount not to exceed €5mn;
General basket of up to €10mn.
Restricted payments
If company can raise €1.00 of debt then 50% of accumulated net income less 100% accumulated net loss plus 100% of equity or equity-like proceeds Carve outs: Provided no default and the company can incur €1.00 more debt, annual dividend to
the holders of ordinary shares with respect to the fiscal years ended 28 February 2005 and 28 February 2006, which dividend shall be no greater than the dividend paid by the company in respect to the financial year ended 29 February 2004;
General basket of up to €5mn.
Transactions with affiliates
Transactions of over €2mn have to be on an arm’s-length basis and need to be approved by a majority of members of the Management Board with no personal stakes in the transaction; in addition, for transactions of over €10mn the Company needs to receive a written opinion from an independent investment banking, accounting or appraisal first of internationally recognized standing that such transaction is on an arm’s-length basis.
Source – BNP Paribas, Hornbach

Hornbach Baumarkt AG ⎪ January 2006
201 European High Yield Research
Hornbach Baumarkt AG, Financial Model FYE ends February BNPP BNPP BNPP BNPP BNPP IFRS Actual Actual Actual Actual Actual Actual Actual F'cast F'cast F'cast F'cast F'cast EUR mn 2001/02 2002/03 2003/04 2004/05 Q1 2005/06 Q2 05/06 Q3 05/06 Q4 05/06 2005/06 2006/07 2007/08 2008/09
P&L SUMMARY Total sales in Germany 1,141.5 1,227.7 1,347.6 1,406.8 405.1 384.7 361.4 305.2 1,456.4 1,550.1 1,645.0 1,743.0 % change 7.6% 9.8% 4.4% 1.7% 3.5% 4.4% 5.0% 3.5% 6.4% 6.1% 6.0% like-for-like growth in sales in Germany -0.3% 1.8% 4.4% 1.3% -1.3% 0.7% -0.2% 0.5% -0.1% 1.0% 2.0% 2.0% Total sales outside of Germany 317.4 423.5 611.3 687.6 211.6 216.1 200.2 168.1 796.0 914.4 1,043.1 1,182.8 % change 33.4% 44.3% 12.5% 13.3% 17.8% 16.3% 15.8% 15.8% 14.9% 14.1% 13.4% like-for-like growth in sales outside of Germany 7.9% 0.4% 7.7% 6.2% 1.2% 5.0% 5.7% 5.5% 4.3% 5.5% 5.5% 5.5% Consolidation -19.9 -23.7 -35.9 Total Sales 1,439.0 1,627.5 1,923.0 2,094.4 616.7 600.8 561.6 473.2 2,252.3 2,464.5 2,688.0 2,925.8 % change 13.1% 18.2% 8.9% 5.4% 7.0% 8.4% 8.6% 7.5% 9.4% 9.1% 8.8% like-for-like change in sales 1.4% 1.5% 5.2% 2.3% -0.5% 2.1% 1.9% 2.3% 1.4% 2.7% 3.4% 3.4% Comparable EBIT 63.1 44.3 64.6 91.0 32.4 33.4 9.2 -9.0 66.0 80.3 84.9 85.2 % of sales 4.4% 2.7% 3.4% 4.3% 5.3% 5.6% 1.6% -1.9% 2.9% 3.3% 3.2% 2.9% Depreciation and amortisation 53.5 57.1 62.3 61.3 14.4 15.6 17.2 17.5 64.7 66.8 68.6 70.3 Comparable EBITDA 116.6 101.4 126.9 152.3 46.8 49.0 26.4 8.5 130.7 147.1 153.4 155.5 % of sales 8.1% 6.2% 6.6% 7.3% 7.6% 8.2% 4.7% 1.8% 5.8% 6.0% 5.7% 5.3% LTM EBITDA 139.9 136.1 133.4 130.7 130.7 147.1 153.4 155.5 Rental Expenses 60.1 70.7 82.3 93.0 34.4 25.4 26.3 18.9 105.0 112.5 119.5 126.8 Comparable EBITDAR 176.7 172.1 209.2 245.3 81.2 74.4 52.7 27.4 235.7 259.5 272.9 282.3 % of sales 12.3% 10.6% 10.9% 11.7% 13.2% 12.4% 9.4% 5.8% 10.5% 10.5% 10.2% 9.6% LTM EBITDAR 236.0 235.3 235.3 235.7 235.7 259.5 272.9 282.3 CASH FLOW ITEMS Cash earnings 83.0 77.2 109.6 125.2 27.0 34.0 16.2 23.6 100.8 127.3 131.4 133.5 Change in inventories, accounts receiveable and other assets -46.0 -38.0 -70.2 -33.0 -26.0 15.0 -29.0 -15.0 -55.0 -40.0 -40.0 -40.0 Change in accounts payable and other liabilities 26.1 6.6 5.3 18.0 78.0 -21.0 0.0 -20.0 37.0 30.0 25.0 25.0 Cash effect from changes in working capital -19.9 -31.4 -64.9 -15.0 52.0 -6.0 -29.0 -35.0 -18.0 -10.0 -15.0 -15.0 Other income/expenses with no cash effect -1.5 -8.8 0.0 15.0 1.0 -1.0 0.0 0.0 0.0 0.0 0.0 0.0 Receipts/payments of exeptional items 0.0 -0.8 1.7 0.0 0.0 0.0 0.0 0.0 0.0 0.0 0.0 0.0 Cashflow from operating activities 61.6 36.2 46.4 125.2 80.0 27.0 -12.8 -11.4 82.8 117.3 116.4 118.5 Capital expenditures -112.7 -128.4 -71.4 -115.0 -31.0 -45.0 -48.0 -36.0 -160.0 -160.0 -150.0 -150.0 Proceeds from disposal of fixed assets 81.5 1.9 38.9 12.0 38.0 22.0 4.0 25.0 89.0 30.0 30.0 30.0 Cashflow from investing activities -31.2 -126.5 -32.5 -103.0 7.0 -23.0 -44.0 -11.0 -71.0 -130.0 -120.0 -120.0 Free cash flow 30.4 -90.3 13.9 22.2 87.0 4.0 -56.8 -22.4 11.8 -12.7 -3.6 -1.5 Dividends paid to shareholders -13.1 -13.1 -13.1 -13.0 0.0 0.0 -13.1 0.0 -13.1 -13.2 -13.2 -13.2 Net change in short-term and long-term financial liabilities 3.5 57.8 -2.0 142.0 -12.0 -1.0 -11.0 0.0 -24.0 -40.0 15.0 15.0 Receipts from group financial activities -0.9 19.0 26.8 -72.0 2.0 0.0 0.0 0.0 2.0 0.0 0.0 0.0 Cashflow from financing activities -10.5 63.7 11.7 57.0 -10.0 -1.0 -24.1 0.0 -35.1 -53.2 1.8 1.8 Change in cash and cash equivalents 19.9 -26.6 25.6 79.2 77.0 3.0 -80.9 -22.4 -23.3 -65.9 -1.8 0.3 BALANCE SHEET ITEMS Cash and cash equivalents at the end of the period 49.6 23.1 48.6 143.2 220.2 223.2 142.3 119.9 119.9 54.0 52.2 52.5 Convertible bonds 0.2 0.2 0.2 0.2 0.2 0.2 0.2 0.2 0.2 0.2 High yield bonds 0.0 239.4 250.0 250.0 250.0 250.0 250.0 250.0 250.0 250.0 Bank debt 407.6 295.0 272.2 272.8 261.8 261.8 261.8 221.8 236.8 251.8 Finance leases 4.5 3.8 3.8 3.8 3.8 3.8 3.8 3.8 3.8 3.8 Debt in connection with derivatives 3.2 3.3 3.3 3.3 3.3 3.3 3.3 3.3 3.3 3.3 Financial liabilities 355.3 416.5 415.5 541.7 529.5 530.1 519.1 519.1 519.1 479.1 494.1 509.1 Net financial liabilities 305.7 393.4 366.9 398.4 309.3 306.9 376.8 399.2 399.2 425.1 441.9 456.6 CREDIT RATIOS Net debt/Comparable EBITDA 3.0x 4.1x 3.3x 3.6x 2.2x 2.3x 2.8x 4.0x 4.0x 3.3x 3.2x 3.3x Comprable EBITDA/Net financial expenses 6.3x 4.9x 6.1x 7.3x 5.6x 5.5x 5.4x 5.1x 5.1x 5.9x 6.0x 6.1x Net lease-adjusted debt (x8)/Comparable EBITDAR 4.5x 5.6x 4.9x 4.7x 4.6x 4.7x 5.1x 5.3x 5.3x 5.1x 5.1x 5.2x Comparable EBITDAR/(Net financial + rental expenses) 2.2x 1.9x 2.0x 2.1x 2.0x 1.9x 1.9x 1.8x 1.8x 1.9x 1.9x 1.9x Source – BNP Paribas Estimates, Hornbach Baumarkt AG Leverage and Coverage are based on the last 12 months’ results. Some of the ratios are adjusted for the effects of acquisitions and disposals. In addition, these 2 measures are usually calculated based on EBITDA adjusted for exceptional or non-recurring items. Leverage is defined as net lease-adjusted debt (x8 operating leases)-to-EBITDAR. Coverage is defined as EBITDAR-to-(net interest+rental expenses).

Impress ⎪ January 2006
202 European High Yield Research
Impress Bond Description & Market Data, as of 06 January 2006
Next Call
Description Amount (o/s) Ratings Date Price Price YTW STW
10.500% Sr Nts due 2007 EUR 150mn B2/B- 25-May-06 105.250 105.5 2.71% 15bp 9.875% Sr Sub Nts due 2007 EUR 102mn B3/CCC+ Today +30 101.650 98.00 11.45% 893bp
Source � BNP Paribas
Company Profile Impress is a global provider of metal packaging solutions to customers operating in consumer product markets, which has net sales of �1,320.6mn and an EBITDA of �157.9mn for the last twelve months ending September 2005. Its key area of expertise is the production of high value-added, differentiated metal packaging, with features such as high-quality graphic designs, a wide range of shapes and special convenience features, such as easy open ends and peelable lids, which require a higher degree of design capabilities, metallurgical know-how and quality control than for more standardised products. The company primary markets are the world-wide market for metal packaging for seafood; the European market for cans for decorative and protective finishes; the European market for cans for specialised consumer products, such as recloseable cans for powdered food products and aerosol cans for personal care and household products; and the European market for cans for shelf stable heat-processed foods. Its manufacturing capacity, supported by a strong research and development capability, is well suited to areas of the market that require a high degree of customisation and special convenience features.
Debt Profile Senior Credit Facilities The Senior Credit Facilities comprise: tranche A, C and E EUR term loan facilities, tranche G USD term loan facility and tranche B and F EUR revolving credit facilities. The facilities bear interest at LIBOR +1.75�3.25%. The bank debt is guaranteed by the parent company Impress Holdings BV and by certain of its operating subsidiaries. Security has been granted over substantially all the company�s assets at its subsidiaries and a pledge of shares of the Issuer, Impress Netherlands BV, Impress BV, Impress Metal Packaging Strojobal BV, Impress Belgium NV, Impress UK Limited, Impress Metal Packaging IOM, Impress Metal Packaging Limited, Impress Holding GmbH, Impress Verwaltungsgesellschaft mbH, SIA Handels GmbH, Impress SA, Impress Metal Packaging SA, Impress Production SAS, Impress SpA, Impress American Samoa Inc, Impress Packaging Puerto Rico, Inc. and Impress USA, Inc. In addition, the credit facilities have a security interest in certain loans made to the subsidiaries. The guarantees may be released, including upon the sale of all or substantially all of the assets of a subsidiary guarantor pursuant to enforcement of such security.
Senior Notes The new �150mn senior notes mature on 25 May 2007, the same maturity date as the older senior subordinated notes. The new notes are issued at a holding company that is structurally subordinated to the bank debt and structurally senior to the existing senior subordinated notes. In addition, the notes benefit from senior guarantees from the parent holding company of the issuer and issuer of the existing notes, Impress Holdings BV, and also from senior guarantees from subsidiary guarantors.
Senior Subordinated Notes The old �102mn (DEM200mn) senior subordinated notes. The senior subordinated Notes are not guaranteed by any subsidiaries; the limitation on liens for the senior subordinated notes does not extend to the guarantor subsidiaries. The senior subordinated notes are structurally subordinated to both the senior notes and the bank debt.
Junior Subordinated Note In connection with the acquisitions of the metal packaging operations of Schmalbach-Lubeca AG, Impress Holdings BV issued a �35.8mn junior subordinated note to Schmalbach-Lubeca in May 1997, interest on which accrues daily at a rate of 6% per year. The notes mature after 10 years but should be obligatorily repaid upon certain events including a stock exchange listing, change in more than 50% of stockholder control, disposal of substantially all assets and liquidation. On 31 March 2005, the Junior Subordinated Note was cancelled by agreement with its holder and replaced by newly issued Special Preference Shares B, which have the same redemption value and substantially similar accretion and repayment rights. This transaction resulted in the conversion of debt to equity.
Rick Deutsch +44 20 7595 8840 [email protected]

Impress ⎪ January 2006
203 European High Yield Research
Impress Structure
Vendor
Existing BondHolders
New BondHolders
ImpressHoldings B.V.
�102.3m existing Senior Subordinated Notesdue 2007(3)
�43.3m existing JuniorSubordinated
Note(9)
ImpressGroup B.V.
ExistingIntercompany
loans(8)
ImpressSubsidiaries
�150m new Senior GuaranteedNotes due 2007(1)
Parent Guarantee(4)
Lenders
(10) Senior Guarantees(5)
Existing Credit Facility Debt(2)
Refinancing(7)
BondProceeds(6)
Source � Impress, BNP Paribas
1. The �150mn Senior Guaranteed Notes offered hereby was issued by Impress Group B.V. 2. As of March 31, 2003 the Credit Facilities consisted of approximately �338.4mn of term loans and �80.0mn of revolving credit facilities (of which approximately �70.0mn was drawn at March 31, 2003). Following the application of the proceeds of the Offering as described in ��Use of Proceeds,�� the Credit Facilities consists on a pro forma basis of approximately �208.4mn of term loans, with no change to the Company�s ability to make drawings under the revolving credit facilities, as of March 31, 2003. Impress Group B.V. and Impress Holdings B.V. are also obligors under the Credit Facilities. 3. Consists of approximately �102.3mn aggregate principal amount of Impress Holdings B.V.�s 97Ú8% Senior Subordinated Notes due 2007. 4. Impress Holdings B.V. will guarantee the Notes on a senior basis. 5. Certain subsidiaries of Impress Group B.V. that are borrowers or guarantors under the existing Credit Facilities will guarantee the Notes on a senior basis. The Senior Guarantees will, however, be subject to a standstill period in favour of the lenders under the Credit Facilities, and may be released in certain circumstances. The subsidiaries providing guarantees are Impress GmbH & Co. oHG, Impress Holding GmbH, Impress Verwaltungsgesellschaft mbH (Germany); Impress USA, Inc. (U.S.); Impress S.p.A. (Italy); Impress UK Limited, Impress Metal Packaging Limited; and Impress Europe B.V., Impress B.V., and Impress Netherlands B.V. (the Netherlands). Significant future borrowersor guarantors under the Credit Facilities will also become subsidiary guarantors. For the year ended December 31, 2002, the subsidiary guarantors represented, on a consolidated basis, approximately 68% of total sales, 68% of total assets and 57% of Adjusted EBITDA of Impress Holdings B.V. and its consolidated subsidiaries. 6. �130mn of the proceeds of the Offering will be downstreamed to Impress Group B.V.�s subsidiaries by means of intercompany loans. These loans and certain other intercompany loans will be subordinated to payment of amounts outstanding under the Credit Facilities. 7. �130mn of the proceeds of the Offering pay down term debt under the existing Credit Facilities. 8. Consists of an existing intercompany loan in the principal amount of �51.1mn from Impress Holdings B.V. to Impress Group B.V. and existing intercompany loans in the principal amount of �90.0mn from Impress Holdings B.V. to certain subsidiaries of Impress Group B.V. Impress Holdings B.V. enters into an Intercompany Loan Priority Agreement, pursuant to which, subject to the prior rights of the lenders under the Credit Facilities in relation to intercompany loans, Impress Holdings B.V. turns over to the Trustee of the Notes payments received on intercompany loans in certain circumstances. 9. Impress Holdings B.V. is the obligor on a Junior Subordinated Note held by a minority shareholder. This note was issued with an initial principal amount of �35.8mn, on which no principal or cash interest may be paid until May 28, 2007 (or earlier in certain circumstances), and which is subordinated by its terms to all of the senior debt of Impress Holdings B.V. (which will include the Parent Guarantee). The total of principal and accrued interest as at March 31, 2003 of �50.3mn (2002: �49.6mn) has been reflected in the Company�s balance sheet on a net present value basis at a carrying value of A43.3mn (2002: �42.3mn). Impress Holdings B.V. has issued Cumulative Preference Shares, which are redeemable on the sale of the Company or in certain other circumstances. The redemption amount as at March 31, 2003 was �187.4mn. Redemption of the Cumulative Preference Shares is conditional on the repayment of all of the senior debt of Impress Holdings B.V. (which will include the Parent Guarantee). The Company has also issued Special Preference Shares with an accreted value of �65.0mn as at March 31, 2003, which are redeemable on the sale of the Company or in certain other circumstances and had an aggregate redemption value of �75.5mn as at March 31, 2003. Redemption of the Special Preference Shares is conditional on the repayment of all senior debt of Impress Holdings B.V. (which will include the Parent Guarantee). 10. As part of the process of amending the Credit Facilities to allow for the issuance of the Notes, we have agreed to take steps after the closing of the Offering to improve the security position of the lenders under the Credit Facilities, which steps would consist of inserting a new intermediate holding company directly under Impress Group B.V. and transferring to it the ownership of all or most of the Impress subsidiaries. The shares of the new holding company would be pledged in favour of the lenders under the Credit Facilities.

Impress ⎪ January 2006
204 European High Yield Research
Bond Covenants Bond description EUR 150mn 10.5% Senior Notes 2007
Issuing entity Impress Group BV
Ranking Senior Notes
Position vs. bank debt Structurally subordinated
Position vs. other bonds Structurally senior
Security/guarantees Senior guarantee from parent holdco Impress Holdings BV and senior guarantees from subsidiaries Impress GmbH & Co oHG, Impress Holding GmbH, Impress Verwaltungsgesellschaft mbH, Impress USA Inc, Impress SpA, Impress UK Ltd, Impress Metal Packaging Ltd, Impress Europe BV, Impress Netherlands BV and Impress BV.
Optional redemption
! Make Whole � none
! Equity Claw � expired
! Call Schedule:
25 May 2006 � 102.625
Tax redemption Yes � at par Negative pledge Yes Cross default Yes � at least �20mn Fall away covenants � Anti-layering �
Change of control Put at 101 � 35% of voting power and Permitted Holders have less
Asset sales
Company can not sell assets unless: ! it receives at least fair market value; ! at least 75% of consideration in cash; ! must use proceeds within a year to pay down debt or acquire assets. Carve out: ! �2.6mn per year up to an aggregate amount of �17.9mn.
Debt limit
Pro forma Consolidated Coverage of at least 2.75x Carve outs: ! bank debt under credit facilities plus other bank debt up to �25mn; ! CLOs up to �13mn(so long as aforementioned bank debt and CLOs does not exceed �375mn; ! junior subordinated notes; ! debt used to finance capital expenditure up to �10mn; ! general basket up to �10mn; ! permitted receivables financing; ! non-speculative interest rate and currency hedging; ! acquisition debt in the form of additional notes not to exceed �50mn.
Restricted payments
If company can raise �1 of debt then 50% net income less 100% net loss plus 100% of equity proceeds plus �20mn Carve outs: ! dividends as allowed by the indentures (i.e. must count as restricted payments); ! refinancing of subordinated obligations provided that the amount is excluded in the calculation of
restricted payment; ! redemption of subordinated obligations or stock from concurrent sale of stock; ! redemption of senior subordinated notes from concurrent sale of debt provided that the maturity is
lengthened and the refinancing debt is no more senior; ! permitted JV transactions up to �10mn.
Transactions with affiliates
On an arm�s length basis and: ! over �525,000 the terms must be set forth in writing; ! in excess of �2.6mn, terms must be set forth in writing and a Board majority needed (including a
majority of the disinterested members); ! in excess of �13mn, terms must be set forth in writing and company must obtain a fairness
appraisal from an independent appraiser, except for transactions concerning the purchase of aluminium, steel or coating materials.
Source � BNP Paribas, Impress

Impress ⎪ January 2006
205 European High Yield Research
Impress, Financial Model FYE 31 December Historic Historic Historic Historic Historic Historic Historic Historic Historic Historic ProFormaEUR mn FY 02 FY 03 Q1 04 Q2 04 Q3 04 Q4 04 FY 04 Q1 05 Q2 05 Q3 05 LTM PROFIT & LOSS Group revenue 1,306.4 1,245.7 304.0 314.8 345.2 303.8 1,267.8 313.3 336.1 367.4 1,320.6 COGS -1,116.5 -1,076.9 -263.8 -266.0 -287.7 -259.2 -1,076.7 -256.0 -275.8 -306.2 -1,097.2 Gross profit 189.9 168.8 40.2 48.8 57.5 44.6 191.1 57.3 60.3 61.2 223.4 SG&A -62.1 -59.1 -14.4 -14.8 -14.9 -20.0 -64.1 -16.8 -11.9 -13.0 -61.7 EBITDA 121.5 95.0 24.6 32.9 40.3 24.0 121.8 39.6 47.0 47.3 157.9 Net interest expense -42.2 -41.8 -10.5 -10.9 -10.4 -9.9 -41.7 -9.5 -9.6 -9.9 -38.9 Revenue growth y/y -4.6% 2.5% -0.3% -2.2% 8.4% 1.8% 3.1% 6.8% 6.4% Gross margin 14.5% 13.6% 13.2% 15.5% 16.7% 14.7% 15.1% 18.3% 17.9% 16.7% 16.9% SG&A / sales 4.8% 4.7% 4.7% 4.7% 4.3% 6.6% 5.1% 5.4% 3.5% 3.5% 4.7% EBITDA margin 9.3% 7.6% 8.1% 10.5% 11.7% 7.9% 9.6% 12.6% 14.0% 12.9% 12.0% CASH FLOW Cash interest -40.5 -43.5 -0.5 -17.6 -0.5 -22.6 -41.2 -1.1 -17.8 -2.0 -43.5 Change in working capital -8.5 6.9 -15.1 -16.9 -22.7 92.1 37.4 -73.7 5.5 -12.8 11.1 Cash from Operating Activities 58.4 55.6 7.4 4.2 19.4 84.9 115.9 -17.7 23.6 20.6 111.4 Capex -43.6 -42.5 -7.0 -7.4 -9.3 -13.8 -37.5 -6.2 -9.1 -10.3 -39.4 Acquisitions/Disposals 0.0 -5.8 0.0 4.5 0.1 4.7 9.3 -8.7 -7.7 -39.3 -51.0 Cash from Investing Activities -43.6 -48.3 -7.0 -2.9 -9.2 -9.1 -28.2 -14.9 -16.8 -49.6 -90.4 Net change in borrowings -23.4 53.8 -15.1 -10.9 -19.2 -56.2 -101.4 20.3 -28.1 1.9 -62.1 Cash from Financing Activities -26.4 44.1 -15.7 -11.3 -19.6 -56.9 -103.5 19.6 -28.7 35.9 -30.1 Effect of exchange rate on cash & equivalents -2.0 -4.3 0.6 0.2 -0.2 -0.4 0.2 0.5 0.8 -0.1 0.8 Net Change in Cash -13.6 47.1 -14.7 -9.8 -9.6 18.5 -15.6 -12.5 -21.1 6.8 -8.3 BALANCE SHEET Cash & Equivalents 27.6 74.7 60.0 50.3 40.7 59.1 59.1 46.6 25.5 32.3 32.3 Bank Debt 353.9 233.4 220.9 211.0 189.8 127.5 127.5 151.4 130.8 130.8 130.8 Bonds- HY 0.0 150.0 150.0 150.0 150.0 150.0 150.0 150.0 150.0 150.0 150.0 Financial leases, Sub-Notes and other 111.2 108.2 107.6 107.3 106.7 106.1 106.1 106.5 106.8 145.6 145.6 Total Senior Debt 465.1 491.6 478.5 468.3 446.5 383.6 383.6 407.9 387.6 426.4 426.4 Net Senior Debt 437.5 416.9 418.5 418.0 405.8 324.5 324.5 361.3 362.1 394.1 394.1 Shareholders' loans/ Junior Subordinated note 42.3 46.5 47.6 48.7 49.9 51.1 51.1 0.0 0.0 0.0 0.0 Total Debt 507.4 538.1 526.1 517.0 496.4 434.7 434.7 407.9 387.6 426.4 426.4 Net Debt 479.8 463.4 466.1 466.7 455.7 375.6 375.6 361.3 362.1 394.1 394.1 RATIOS Coverage Cash Interest Coverage 3.0x 2.2x 49.2x 1.9x 80.6x 1.1x 3.0x 36.0x 2.6x 23.7x 3.6x Total Coverage 2.9x 2.3x 2.3x 3.0x 3.9x 2.4x 2.9x 4.2x 4.9x 4.8x 4.1x EBITDA- Capex/Interest 1.9x 1.2x 35.2x 1.4x 62.0x 0.5x 2.0x 30.4x 2.1x 18.5x 2.7x Leverage Bank Leverage (gross) 2.9x 2.5x 2.3x 2.1x 1.8x 1.0x 1.0x 1.1x 0.9x 0.8x 0.8x Senior Notes Leverage (gross) 0.0x 1.6x 1.6x 1.5x 1.4x 1.2x 1.2x 1.1x 1.0x 0.9x 0.9x Total leverage (gross) 4.2x 5.7x 5.5x 5.3x 4.7x 3.6x 3.6x 3.0x 2.6x 2.7x 2.7x Total leverage (net) 3.9x 4.9x 4.9x 4.7x 4.3x 3.1x 3.1x 2.6x 2.4x 2.5x 2.5x
Source � BNP Paribas, Impress

Ineos Vinyls ⎪ January 2006
206 European High Yield Research
Ineos Vinyls Bond Description & Market Data, as of 5 January 2006
Next Call Issuer Credit Trend: Stable
Description Amount (o/s) Ratings Date Price Price YTW STW
9.125% Sr Nts due 2011 EURb160mn B3/B- 1-Dec-06 109.125 102 8.51% 559bp
Source � BNP Paribas
Company Profile Ineos Vinyls (�Vinyls�) is a vertically integrated producer of polyvinyl chloride (PVC) products. The company is the largest PVC resin manufacturer in Europe and the fifth largest worldwide. Vinyls has manufacturing sites in Germany, Italy, the UK, Switzerland and India with combined capacity of 1.1mT of vinyl chloride monomer (VCM), 1.4mT in PVC resins and 360kt in PVC films and compounds. Vinyls is a portfolio company of INEOS Capital.
Vinyls conducts its business through two segments. The upstream Polymers segment (87% of LTM 30 September 2005 EBITDA) is the market leader in producing VCM, the monomer for PVC, as well as PVC resins including suspension, emulsion and co-polymer PVCs (S-PVC, E-PVC and C-PVC). End uses include drain pipes, window frames, flooring, wire and cable sheathing and automotive parts amongst others. About 13% of resin production is consumed internally downstream by the Compounds and Film segment (13% of LTM 30 September EBITDA). This segment manufactures a range of rigid films and foils for end markets including pharmaceutical packaging, magnetic cards, furniture laminates and office stationary. In addition, it manufactures compounds used for piping, cables, clothing and footwear applications.
Investment Recommendation Vinyls operates in a low growing commoditised business. Its EBITDA margins are low (LTM 30 September 2005 4.6%) and consequently any margin pressure can have a major impact on EBITDA. However, capex is falling and a number of one-off expenses in Q4 2004 should not repeat in Q4 2005 offsetting any raw material induced margin squeeze. Although we think a bank covenant breach is still possible, the new Hawkslease facility can be drawn to repay bank debt to meet covenants (the drawings under the Hawkslease facility are not treated as debt for the bank covenants). We still have longer term concerns as to the ability of Vinyls to meaningfully delever but we now believe that the bonds are fairly pricing in those concerns and hence have a HOLD recommendation.
Adam Harnetty, ACA +44 20 7595 8831 [email protected]

Ineos Vinyls ⎪ January 2006
207 European High Yield Research
Debt Profile Credit Facility Vinyls entered into a �124mn credit facility at the time of the offering. The facility provides for: ! a seven-year, �30mn amortising term loan facility, ! a seven-year, �67mn bullet repayment term loan facility and, ! a seven-year �27mn revolver, including bank guarantees, letters of credit and other ancillary facilities. The credit facility is secured, to the extent legally permissible, by substantially all the assets, fixed and floating, of Vinyls� UK, German, Italian and other subsidiaries. In addition, senior guarantees have been granted from the Parent Guarantor (EVC International). Interest under the �27mn revolver and �30mn amortising loan are at EURIBOR or LIBOR +2.5% and under the bullet loan at EURIBOR +3.5% and may reduce going forward given improving credit ratios. As at 30 September 2005, the facility was fully drawn at �120.6mn.
Italian Government Loan Facility The loan facility agreement is for a maximum aggregate amount of approximately �2.3mn, with a final repayment date of 1 July 2010. As of 30 September 2005, �2.1mn was outstanding.
Loan for construction of Schkopau Plant Vinyls took out a 5-year loan supporting construction of, and secured on, a PVC plant at Schkopau, Germany. As of 30 September 2005, there was no balance outstanding.
Capital Leases Vinyls has �5.8mn of finance leases outstanding as at 30 September 2005.
High Yield Bonds Vinyls issued �160mn of bonds in November 2003 to refinance debt incurred in the acquisition of EVC International.
Hawkslease Finance Company Ltd. �65mn Facility In Q3 2005, Hawkslease Finance Company (an Ineos Capital company) agreed to provide a �65mn loan facility due 2011 to the company. The facility is to be used for general corporate purposes (�50mn) and to repay the minority shareholders in the new liquidated EVC International NV (�15mn). Interest is charged at 8% but is rolled up until final maturity in December 2011. The facility is subordinated to the bank debt but ranks pari passu with the high yield bonds and is currently undrawn.
Ineos Vinyls Structure
INEOS
Ineos Vinyls Newco Ltd
100%
�124m CreditFacility
SeniorGuarantees
Senior SubordinatedGuarantees
Non-GuarantorSubsidiaries
SubsidiaryGuarantors95% assets
94% turnover
INEOS VinylsFinance plc
�160mSenior Notes
Senior SubordinatedGuarantees
Senior SubordinatedFunding Loan
Security & SeniorGuarantees
Source � Ineos Vinyls

Ineos Vinyls ⎪ January 2006
208 European High Yield Research
Bond Covenant Bond description EUR 160mn 9.125% Senior Notes Due 2011 Issuing entity INEOS Vinyls Finance plc
Ranking Unsecured, Senior Subordinated Notes
Position vs. bank debt Contractually subordinated
Position vs. other bonds Not applicable
Security/guarantees Senior subordinated guarantees from certain subsidiaries who are guarantors under the new credit facility
Optional redemption
! Make Whole � prior to 1 December 2006 at bunds+50bp
! Equity Claw � prior to 1 December 2006 max 35% of issue at par+coupon following an IPO.
! Call Schedule:
1 December 2006 � 109.125% 1 December 2007 � 104.562% 1 December 2008 � 102.281% 1 December 2009 � 100.000%
Tax redemption Yes � at par
Negative pledge Limitation on liens
Cross default Yes
Fall away covenants No
Anti-layering Yes
Change of control Put at 101%, 50%+ of voting power
Debt limit
Debt is permitted up to 2x pro forma coverage. Carve outs: ! Credit facility up to the greater of a) 80% of receivables and 60% of inventories and b)
�125mn (as reduced by the pay down from any asset sales)
! Leases and similar up to �20mn
! Letters of credit up to �10mn
! Local credit facilities up to �15mn
! Loan stock in connection with repurchasing stock up to �6mn
! General basket up to �10mn
Restricted payments If company can raise �1 of debt then: ! 50% of consolidated net income
Transactions with affiliates ! Greater than �5mn, than certification from disinterested Directors of the board of
directors.
! Grater than �15mn, than certification from an international Investment Bank.
Asset sales ! At least 75% of the consideration received need to be in cash or equivalents
! Within 365 reinvest in similar business or repay debt. Any proceeds remaining (subject to �15mn miniumum) must be used to tender for bonds at par.
Source � BNP Paribas, Ineos Vinyls

Ineos Vinyls ⎪ January 2006
209 European High Yield Research
Ineos Vinyls, Financial Model FYE 31 December IFRS IFRS IFRS IFRS IFRS IFRS IFRS F�cast EUR mn 2002 2003 Q1 04 Q2 04 Q3 04 Q4 04 2004 Q1 05 Q2 05 Q3 05 2005
PROFIT & LOSS Net turnover 1,053.8 1,032.2 309.0 306.2 287.0 319.8 1,222.0 309.1 319.9 294.1 Cost of turnover -996.6 -994.0 -290.6 -279.4 -277.9 -328.8 -1,176.7 -286.2 -309.8 -282.6 Gross margin 57.2 38.2 18.4 26.8 9.1 -9.0 45.3 22.9 10.1 11.5 Operating expenses -59.1 -41.8 -13.1 -15.5 -11.7 -22.5 -62.8 -11.1 -9.4 -15.9 Operating profit before exceptionals -1.9 -3.6 5.3 11.3 -2.6 -31.5 -17.5 11.8 0.7 -4.4 Exceptionals -11.8 0.0 0.0 0.0 0.0 0.0 0.0 0.0 0.0 0.0 Operating profit after exceptionals -13.7 -3.6 5.3 11.3 -2.6 -31.5 -17.5 11.8 0.7 -4.4 Net financial -16.3 -17.6 -5.7 -5.1 -5.3 -4.7 -20.8 -5.0 -5.4 -5.4 Loss before tax -30.0 -21.2 -0.4 6.2 -7.9 -36.2 -38.3 6.8 -4.7 -9.8 -20.5
D&A 61.6 51.9 9.8 10.2 11.5 48.5 80.0 10.8 12.5 10.4 Exceptionals 14.6 -5.9 0.0 -6.1 -0.2 -2.6 -8.9 -0.3 0.8 0.3 EBITDA 62.5 42.4 15.1 15.4 8.7 14.4 53.6 22.3 14.0 6.3 62.0
Revenue Growth y/y -1.7% -2.0% 18.4% 0.0% 4.5% 2.5% Gross Margin 5.4% 3.7% 6.0% 8.8% 3.2% -2.8% 3.7% 7.4% 3.2% 3.9% EBITDA Margin 5.9% 4.1% 4.9% 5.0% 3.0% 4.5% 4.4% 7.2% 4.4% 2.1%
CASHFLOW
Total working capital movement -19.4 -10.1 -2.3 -1.7 -7.8 30.8 19 -41.8 16.7 9.9 Net cash provided by operating activities
9.2 21.8 11.9 9.4 -0.3 40.0 61.0 -20.1 20.1 14.4
Capex -36.6 -37.9 -8.9 -12.0 -16.0 -9.4 -46.3 -4.2 -8.1 -7.9 -25 Net cash used in investing activities -36.2 -36.9 -8.9 -11.9 -16.0 -9.3 -46.1 -6.0 -8.0 -7.9
Net cash used in financing activities -9.5 36.4 -0.1 -5.4 -0.3 -3.4 -9.2 1.5 11.1 -5.2
Net cashflow -36.5 21.3 2.9 -7.9 -16.6 27.3 5.7 -24.6 23.2 1.3
BALANCE SHEET
Cash 55.8 60.3 52.0 34.8 60.8 60.8 37.6 62.7 63.3
Bank debt 97.5 97.5 97.5 97.5 95.4 95.4 105.4 120.7 120.6 Other 21.3 22.4 16.3 15.8 14.9 14.9 13.8 14.3 8.3 HY Notes 160.0 160.0 160.0 160.0 160.0 160.0 160.0 160.0 160.0 Total Debt 278.8 279.9 273.8 273.3 270.3 270.3 279.2 295.0 288.9
Net Debt 223.0 219.6 221.8 238.5 209.5 209.5 241.6 232.3 225.6
LTM RATIOS
Coverage 2.4 2.6 3.0 2.9 2.8 EBITDA-Capex/Interest 0.3 0.4 1.0 1.1 1.3 Gross Leverage 6.6 5.0 4.6 5.0 5.1 Net Leverage 5.3 3.9 4.0 3.9 4.0
Source � BNP Paribas Estimates, Ineos Vinyls
The High Yield Handbook ⎪ 09 January 2006
417 European High Yield Research
European Credit Research � Contacts
Rick Deutsch: Head of European Credit Research +44 20 7595 8840
High Yield Credit Research
Aizaz Shaikh, Head of High Yield Research TMT/Utilities London +44 20 7595 8607 [email protected]
Cyril Benayoun, Senior Credit Analyst Autos London +44 20 7595 8642 [email protected]
Olivier Casasoprana, Junior Credit Analyst High Yield London +44 20 7595 8218 [email protected]
Tran Toan Dang, CFA, Credit Analyst High Yield London +44 20 7595 8291 [email protected]
Rick Deutsch, Senior Credit Analyst Packaging London +44 20 7595 8840 [email protected]
Adam Harnetty, ACA, Senior Credit Analyst Industrials/Chemicals London +44 20 7595 8831 [email protected]
Hunter Martin, Junior Credit Analyst High Yield London +44 20 7595 8491 [email protected]
Oleksiy Soroka, CFA, Senior Credit Analyst Food/Consumer/Retail/Transport London +44 20 7595 8077 [email protected]
Investment Grade Credit Research
Rick Deutsch, Senior Credit Analyst European Telecoms/Media/Technology London +44 20 7595 8840 [email protected]
Oliver Burrows, Junior Credit Analyst Banks/Insurance London +44 20 7595 8395 [email protected]
Cyril Benayoun, Senior Credit Analyst Autos/Industrials London +44 20 7595 8642 [email protected]
Jean-Yves Coupin, CFA, Senior Credit Analyst Consumer/Retail/Services London +44 20 7595 8360 [email protected]
Otto Dichtl, Senior Credit Analyst Banks London +44 20 7595 8192 [email protected]
Jean-Yves Guibert, Senior Credit Analyst European Telecoms/Media/Technology London +44 20 7595 8308 [email protected]
Frances Hutt, Credit Analyst Utilities/Industrials/Autos London +44 20 7595 8869 [email protected]
Ricardo Kleinbaum, Senior Credit Analyst Banks/SSA New York +1 212 841 2047 [email protected]
Heiko Langer, Senior Credit Analyst Covered Bonds London +44 20 7595 8569 [email protected]
Oleg Ledovskoy, Junior Credit Analyst Utilities London +44 20 7595 8445 [email protected]
Marie-Charlotte Masy, Credit Analyst Consumer/Retail/Services London +44 20 7595 8299 [email protected]
Tiago Parente, Senior Credit Analyst Banks London +44 20 7595 8591 [email protected]
Michel Ramon, Junior Credit Analyst European Telecoms/Media/Technology London +44 20 7595 8186 [email protected]
Rafael Villarreal, Senior Credit Analyst Insurance London +44 20 7595 8918 [email protected]
Marc Watton, Senior Credit Analyst Utilities/Aerospace/Defence London +44 20 7595 8185 [email protected]
Credit Portfolio Strategy
Vivek Tawadey, Head of Credit Portfolio Strategy London +44 20 7595 8894 [email protected]
Simon Ballard, Senior Credit Strategist London +44 20 7595 8201 [email protected]
Mehernosh Engineer, Senior Credit Strategist London +44 20 7595 8338 [email protected]
Luc Hardy, Junior Credit Strategist London +44 20 7595 3575 [email protected]
Hans Peter Lorenzen, Credit Strategist London +44 20 7595 8296 [email protected]
Rajeev Shah, Credit Strategist London +44 20 7595 8175 [email protected]
Production
Murielle Clarke, Publishing/Editing London +44 20 7595 8336 [email protected]
Sharon Francis, Publishing London +44 20 7595 8357 [email protected]
Barbara Hickling, Publishing London +44 20 7595 8599 [email protected]
Fiona Morrison, Credit Research Editor London +44 20 7595 8806 [email protected]
Sally-Jo Yolland, Publishing/Editing London +44 20 7595 8983 [email protected]

The High Yield Handbook ⎪ 09 January 2006
418 European High Yield Research
IMPORTANT DISCLOSURES: Recommendation System: Type Terminology Horizon Credit Trend (1) Positive/Stable/Negative 6 months Relative Value (2) Outperform/Market Perform/Underperform 1 month Investment Recommendation (3) Buy/Hold/Reduce/Sell (*) Up to 6 months (1) Credit Trend is based on underlying Credit fundamentals, business environment and industry trends; (2) Relative Value is based on expected market performance relative to sector; (3) Investment Recommendation is based on BNPP Credit Trend and Relative Value opinions; (*) Buy: Overweight exposure within industry sector, based on strong financial profile, conservative risk and/or solid relative
value considerations, outperforming or demonstrating average performance within peer group; Hold: Exhibits solid to strong credit fundamentals, but average total return characteristics within peer group; Reduce: Credit exposure should be pared down based on weakening fundamentals and/or below average relative value characteristics within peer group; Sell: Sell exposure largely based on deteriorating credit fundamentals and/or negative headline or event risk.
The information and opinions contained in this report have been obtained from public sources believed to be reliable, but no representation or warranty, express or implied, is made that such information is accurate or complete and it should not be relied upon as such. This report does not constitute a prospectus or other offering document or an offer or solicitation to buy any securities or other investment. Information and opinions contained in the report are published for the assistance of recipients, but are not to be relied upon as authoritative or taken in substitution for the exercise of judgement by any recipient, they are subject to change without notice and not intended to provide the sole basis of any evaluation of the instruments discussed herein. Any reference to past performance should not be taken as an indication of future performance. No BNP Paribas Group Company accepts any liability whatsoever for any direct or consequential loss arising from any use of material contained in this report. All estimates and opinions included in this report constitute our judgements as of the date of this report. BNP Paribas and their affiliates (collectively �BNP Paribas�) may make a market in, or may, as principal or agent, buy or sell securities of the issuers mentioned in this report or derivatives thereon. BNP Paribas may have a financial interest in the issuers mentioned in this report, including a long or short position in their securities, and or options, futures or other derivative instruments based thereon. BNP Paribas, including its officers and employees may serve or have served as an officer, director or in an advisory capacity for any issuer mentioned in this report. BNP Paribas may, from time to time, solicit, perform or have performed investment banking, underwriting or other services (including acting as adviser, manager, underwriter or lender) within the last 12 months for any issuer referred to in this report. BNP Paribas, may to the extent permitted by law, have acted upon or used the information contained herein, or the research or analysis on which it was based, before its publication. BNP Paribas may receive or intend to seek compensation for investment banking services in the next three months from an issuer mentioned in this report. Any issuer mentioned in this report may have been provided with sections of this report prior to its publication in order to verify its factual accuracy. BNP Paribas is incorporated in France with Limited Liability. Registered Office 16 boulevard des Italiens, 75009 Paris. This report was produced by a BNP Paribas Group Company. This report is for the use of intended recipients and may not be reproduced (in whole or in part) or delivered or transmitted to any other person without the prior written consent of BNP Paribas. By accepting this document you agree to be bound by the foregoing limitations. Analyst Certification: Each analyst responsible for the preparation of this report certifies that (i) all views expressed in this report accurately reflect the analyst�s personal views about any and all of the issuers and securities named in this report, and (ii) no part of the analyst�s compensation was, is, or will be, directly or indirectly, related to the specific recommendations or views expressed herein. United States: This report is being distributed to US persons by BNP Paribas Securities Corp., or by a subsidiary or affiliate of BNP Paribas that is not registered as a US broker-dealer to US major institutional investors only. BNP Paribas Securities Corp., a subsidiary of BNP Paribas, is a broker-dealer registered with the Securities and Exchange Commission and a member of the National Association of Securities Dealers, the New York Stock Exchange and other principal exchanges. BNP Paribas Securities Corp. accepts responsibility for the content of a report prepared by another non-US affiliate only when distributed to US persons by BNP Paribas Securities Corp. United Kingdom: This report has been approved for publication in the United Kingdom by BNP Paribas London Branch, a branch of BNP Paribas whose head office is in Paris, France. BNP Paribas London Branch, 10 Harewood Avenue, London NW1 6AA is authorised by CECEI & AMF and the Financial Services Authority, and is regulated by the Financial Services Authority for the conduct of its investment business in the United Kingdom. BNP Paribas London Branch is registered in England & Wales under No. FC13447. This report is prepared for professional investors and is not intended for Private Customers in the United Kingdom as defined in FSA rules and should not be passed on to any such persons. Japan: This report is being distributed to Japanese based firms by BNP Paribas Securities (Japan) Limited, Tokyo Branch, or by a subsidiary or affiliate of BNP Paribas not registered as a securities firm in Japan, to certain financial institutions defined by article 2, item 1 of the Cabinet Order concerning Foreign Securities Firms. BNP Paribas Securities (Japan) Limited, Tokyo Branch, a subsidiary of BNP Paribas, is a securities firm registered according to the Securities & Exchange Law of Japan and a member of the Japan Securities Dealers Association. BNP Paribas Securities (Japan) Limited, Tokyo Branch accepts responsibility for the content of a report prepared by another non-Japan affiliate only when distributed to Japanese based firms by BNP Paribas Securities (Japan) Limited, Tokyo Branch. Some of the foreign securities stated on this report are not disclosed according to the Securities & Exchange Law of Japan. Hong Kong: This report is being distributed in Hong Kong by BNP Paribas Hong Kong Branch, a branch of BNP Paribas whose head office is in Paris, France. BNP Paribas Hong Kong Branch is regulated as a Licensed Bank by Hong Kong Monetary Authority and is deemed as a Registered Institution by the Securities and Futures Commission for the conduct of Advising on Securities [Regulated Activity Type 4] under the Securities and Futures Ordinance Transitional Arrangements. © BNP Paribas (2006). All rights reserved.


![Fast Fourier Transform for Option Pricing: Improved ...quantlabs.net/academy/download/free_quant... · is the use of transform techniques such as Laplace transform [DHC 04] and fast](https://static.fdocuments.in/doc/165x107/5e7ad8089b6c870ffa3151d2/fast-fourier-transform-for-option-pricing-improved-is-the-use-of-transform.jpg)