The Hi Distribution of the Milky Way
37
The Hi Distribution of the Milky Way Peter M.W. Kalberla and J¨ urgen Kerp Argelander-Institut f ¨ ur Astronomie, Universit ¨ at Bonn, D-53012 Bonn, Germany; email: [email protected], [email protected] Annu. Rev. Astron. Astrophys. 2009. 47:27–61 The Annual Review of Astronomy and Astrophysics is online at astro.annualreviews.org This article’s doi: 10.1146/annurev-astro-082708-101823 Copyright c 2009 by Annual Reviews. All rights reserved 0066-4146/09/0922-0027$20.00 Key Words 21-cm line surveys, disk, halo, Galactic structure, interstellar medium Abstract Neutral atomic hydrogen (Hi) traces the interstellar medium (ISM) over a broad range of physical conditions. Its 21-cm emission line is a key probe of the structure and dynamics of the Milky Way Galaxy. About 50 years after the first detection of the 21-cm line the exploration of the Hi distribution of the Milky Way has undergone a true renaissance. This was triggered by several large-scale 21-cm surveys that became available within the past decade. New all-sky surveys unravel the shape and volume density distribu- tion of the gaseous disk up to its borders. High-resolution Galactic plane surveys disclose a wealth of shells, filaments, and spurs that bear witness to the recycling of matter between stars and the ISM. All these observational re- sults indicate that the Hi gas traces a dynamical Galactic ISM with structures on all scales, from tens of astronomical units to kiloparsecs. The Galaxy can be considered to be a violent, breathing disk surrounded by highly turbulent extra-planar gas. 27 Annu. Rev. Astro. Astrophys. 2009.47:27-61. Downloaded from www.annualreviews.org by University of Hawaii at Manoa Library on 01/02/12. For personal use only.
Transcript of The Hi Distribution of the Milky Way
ANRV385-AA47-02 ARI 15 July 2009 4:24
The Hi Distributionof the Milky WayPeter M.W. Kalberla and Jurgen KerpArgelander-Institut fur Astronomie, Universitat Bonn, D-53012 Bonn, Germany;email: [email protected], [email protected]
Annu. Rev. Astron. Astrophys. 2009. 47:27–61
The Annual Review of Astronomy and Astrophysics isonline at astro.annualreviews.org
This article’s doi:10.1146/annurev-astro-082708-101823
Copyright c© 2009 by Annual Reviews.All rights reserved
0066-4146/09/0922-0027$20.00
Key Words
21-cm line surveys, disk, halo, Galactic structure, interstellar medium
AbstractNeutral atomic hydrogen (Hi) traces the interstellar medium (ISM) over abroad range of physical conditions. Its 21-cm emission line is a key probe ofthe structure and dynamics of the Milky Way Galaxy. About 50 years afterthe first detection of the 21-cm line the exploration of the Hi distributionof the Milky Way has undergone a true renaissance. This was triggeredby several large-scale 21-cm surveys that became available within the pastdecade. New all-sky surveys unravel the shape and volume density distribu-tion of the gaseous disk up to its borders. High-resolution Galactic planesurveys disclose a wealth of shells, filaments, and spurs that bear witness tothe recycling of matter between stars and the ISM. All these observational re-sults indicate that the Hi gas traces a dynamical Galactic ISM with structureson all scales, from tens of astronomical units to kiloparsecs. The Galaxy canbe considered to be a violent, breathing disk surrounded by highly turbulentextra-planar gas.
27
Ann
u. R
ev. A
stro
. Ast
roph
ys. 2
009.
47:2
7-61
. Dow
nloa
ded
from
ww
w.a
nnua
lrev
iew
s.or
gby
Uni
vers
ity o
f H
awai
i at M
anoa
Lib
rary
on
01/0
2/12
. For
per
sona
l use
onl
y.

ANRV385-AA47-02 ARI 15 July 2009 4:24
ISM: interstellarmedium
1. INTRODUCTION
To characterize the Hi distribution of the Milky Way one needs to cover many different aspectsand it is nearly impossible to compile a comprehensive view within a single review. Excellentreviews have been written by Kulkarni & Heiles (1987, 1988), Burton (1976, 1988, 1992), Dickey& Lockman (1990), and Dickey (2002). We do not try to compile all the fundamental aspectspublished there but want to provide a comprehensive overview on observational improvements andmajor results of the past decade. This review does not intend to give an encyclopedic bibliographyon the earlier science. The reader will find these references in earlier reviews and other papersmentioned here.
Several major surveys have been released during the past decade and the data are accessiblefor public use. All surveys provide unbiased databases across large coherent regions. Significantefforts went into improvements in sensitivity, dynamic range, velocity coverage and data quality(reducing the imprint of systematic effects). All-sky surveys like the Leiden-Dwingeloo survey(LDS, Hartmann & Burton 1997), the Instituto Argentino de Radioastronomıa survey (IAR,Bajaja et al. 2005), and the combined Leiden-Argentine-Bonn survey (LAB, Kalberla et al. 2005)provide general-purpose databases, particularly suitable for the analysis of large-scale phenomena.Their major limitation is due to the beam-by-beam grid with an angular resolution of ∼36 arcmin.Interferometric Galactic plane surveys like the Canadian Galactic Plane Survey (CGPS, Tayloret al. 2003), the Southern Galactic Plane Survey (SGPS, McClure-Griffiths et al. 2005), and theVLA Galactic Plane Survey (VGPS, Stil et al. 2006b) offer much higher angular resolution of about1 arcmin, but are restricted to a few degrees in Galactic latitude only. Their modest sensitivityof a few Kelvin (one or two orders of magnitude worse than single-dish work) implies, for manyof the scientific problems focused upon in this manuscript, that the single-dish data are moreappropriate.
Multifeed arrays in foci of large single-dish telescopes reduce the survey duration proportionalto the number of feeds used. Today it is feasible to perform all-sky surveys with excellent sensitivityon a fully sampled angular grid within about two years of observations. The Arecibo GalacticALFA survey aims to cover both the Galactic plane and the high-latitude sky with a 3.4 arcminresolution, in total about 30% of the whole sky (GALFA-Hi; Stanimirovic et al. 2006). TheParkes Galactic All-Sky Survey (GASS) covers the whole Southern Hemisphere with 16 arcminresolution (McClure-Griffiths et al. 2009). The Effelsberg-Bonn Hi Survey (EBHIS, Winkel et al.2008) will complement the northern sky with an angular resolution of 9 arcmin. Parallel to thedevelopment of multifeed front-ends, a revolution took place for spectrometer backends. Field-Programmable-Gate-Array (FPGA) spectrometers offer large bandwidths, high-dynamic ranges,and spectra–storage times of less than a second. The latter is of high importance to mitigatethe Radio-Frequency-Interference (RFI) signals that pollute the line emission even within theprotected 21-cm line band.
We focus on scientific research areas that benefit from this technological progress:
� The global picture of the Hi distribution in the Milky Way (a quasi-static view, large scales),� The violent interstellar medium (ISM) (a dynamical view, small scales), and� Hi as part of the multiphase structure of the ISM (the physical state of the Hi distribution).
Properties of the large-scale Hi distribution in the Milky Way can be derived best from theLAB survey. We discuss this first with the caveat that most of the derived parameters depend onthe adopted Galactic rotation curve. At present, there appears to exist a general consensus that aflat rotation curve with vrot ∼ 220 km s−1 is most likely, so we use this approximation. A derivationof the gas distribution inside the solar circle is ambiguous, but for Galactocentric radii R � R�one gets on average an exponential distribution of the Hi surface density with a radial scale length
28 Kalberla · Kerp
Ann
u. R
ev. A
stro
. Ast
roph
ys. 2
009.
47:2
7-61
. Dow
nloa
ded
from
ww
w.a
nnua
lrev
iew
s.or
gby
Uni
vers
ity o
f H
awai
i at M
anoa
Lib
rary
on
01/0
2/12
. For
per
sona
l use
onl
y.

ANRV385-AA47-02 ARI 15 July 2009 4:24
CNM: cold neutralmedium
WNM: warm neutralmedium
HISA: Hi
self-absorption
of Rs = 3.75 kpc. The gaseous disk is strongly warped, up to ∼5 kpc in the north, but the bendingof the mid-plane is well defined with three basic Fourier modes for R � 40 kpc.
The gaseous disk flares strongly. The scale height of the Hi gas layer increases exponentiallywith R; at the same time the mid-plane volume density and the surface density fall off exponentially.There is a tight correlation between surface density, mid-plane volume density, and scale heightfor R � 35 kpc. Spiral structures are observable to the same distance; they cause fluctuations indensity and scale height. This suggests that the Hi disk of the Milky Way is well defined out toR ∼ 35 kpc. At larger radial distances the Milky Way is surrounded by a faint, patchy, and highlyturbulent Hi distribution that has been traced out to R ∼ 60 kpc (Kalberla & Dedes 2008).
The global Hi density distribution suggests that in total about 10% of the Hi gas is “anomalous”in the sense that it stands out from the main gas layer. Many aspects of this anomalous populationcan be reproduced by modeling a distribution of clumps with a turbulent velocity dispersion ofσ ∼ 74 km s−1. This Hi gas floats around at large z distances, up to several scale heights above thedisk. This extraplanar gas layer appears to be approximately corotating with the disk, but somewhatlagging behind. The vertical gradient in the rotation velocity appears to depend predominantlyon the scale height of individual gas components. A large fraction of this gas is cold and clumpyon parsec scales, probing the conditions in the lower Galactic halo.
The Hi disk shows small-scale structure on all scales. Hi filaments may reach altitudes ofseveral kiloparsecs. The Galactic plane surveys, in particular, disclose a wealth of shells, spurs, andchimneys. These structures are the most prominent tracers of the Galactic “ecosystem.” Shellsare found to be concentrated at mid-plane, and 50% of them at z � 500 pc. About 5% of the diskvolume appears to be occupied by shells. The radial distribution has an exponential scale length ofσs hell = 3+2
−1 kpc, which is comparable to the scale length of the stellar disk. Individual supernovaetrigger violent interactions that throw the ISM locally out of balance. At the same time, collectiveeffects lead to a dynamical equilibrium between the different phases of the ISM.
The Hi gas has a two-phase structure, characterized by the cold neutral medium (CNM),which has a cloudy structure, and the warm neutral medium (WNM) with a diffuse distribution.In the classical two-phase picture, both phases exist in pressure equilibrium with stable phasesfor temperatures of T � 300 K (CNM) and T � 5000 K (WNM) embedded in a hot ionizedphase (McKee & Ostriker 1977). Gas at intermediate temperatures is considered to be transient.We discuss the properties of these Hi phases in detail, in particular, characteristic timescales forboth phases, which differ by two orders of magnitude. The typical cooling time for the CNM is∼1.4 × 10⁵ years, in comparison to ∼5 × 10⁷ years for the WNM. In the presence of a highlydynamical ISM, this implies severe constraints for any equilibrium considerations. Shocks dueto supernovae are expected to occur every ∼5 × 10⁶ years; in such cases, the WNM has hardlysufficient time to relax.
Investigations by Wolfire et al. (2003) predict for the Hi gas two phases in the disk out toR � 18 kpc, but also gas injected into the halo by a Galactic fountain may have this structureup to heights of several kiloparsecs above the disk. Numerical simulations of thermal instabilitiesin a turbulent flow suggest that turbulence can enhance phase transitions over a broad rangeof temperatures, consistent with the finding that 50% of the gas in the disk is observed in theunstable range 300 � T � 5000 K (Gazol et al. 2001). Turbulence is also found to generatedensity perturbations on small scales, enhancing thermal instabilities in this way.
Cold Hi structures have been observed on scales of parsecs down to tens of astronomicalunits against continuum background sources. Predominantly within the Galactic plane Hi self-absorption (HISA) features against the extended line background of the WNM have been found.CNM clouds have typical temperatures in the range of 40 to 100 K, with a median tempera-ture of about 60 K. Turbulence may also explain why a large fraction of the extraplanar gas is
www.annualreviews.org • HI in the Milky Way 29
Ann
u. R
ev. A
stro
. Ast
roph
ys. 2
009.
47:2
7-61
. Dow
nloa
ded
from
ww
w.a
nnua
lrev
iew
s.or
gby
Uni
vers
ity o
f H
awai
i at M
anoa
Lib
rary
on
01/0
2/12
. For
per
sona
l use
onl
y.

ANRV385-AA47-02 ARI 15 July 2009 4:24
HVC: high-velocitycloud
HIM: hot ionizedmedium
cold and clumpy. The same argument may apply to high-velocity clouds (HVCs). Their specificturbulent-energy densities are an order of magnitude larger than that of comparable disk material.Accordingly it is no surprise that most of the HVC complexes show two phases in Hi. There ismounting evidence that Hi HVCs are embedded in a hot ionized medium (HIM, 106.15 K) andsurrounded by a highly ionized interface. Because the HIM is bound to the Milky Way, this mayimply that many, if not most, of the HVCs are associated with the Milky Way.
2. INSTRUMENTS, OBSERVATIONS, AND STRATEGIES
2.1. Surveys
About 90% of the Hi mass is localized within a rather well-defined thin disk; a detailed discussionof its properties is given in Section 3. The Sun is embedded within this disk in such a way thatthere is no single line of sight across the whole sky without Hi gas emission. The observed columndensities vary across the sky by a factor of about 100. Hi in the Galactic plane shows up withcolumn density fluctuations of an order of magnitude on angular scales of a few arcmin. The fullwidth at half maximum (FWHM) line width of Hi clouds can be, in extreme cases, as narrowas 1 km s−1, indicating gas temperatures of 20 K (Knapp & Verschuur 1972). But such narrowstructures are rarely observed toward the high Galactic latitude sky and are associated with theinfrared cirrus (Low et al. 1984). At high latitudes most of the Hi 21-cm emission lines at lowvelocities are broad, indicating a high degree of turbulence and gas temperatures in excess of afew thousand Kelvin.
We need accordingly different observing strategies to investigate the physical conditions of theISM traced by the Hi 21-cm line. Toward the Galactic plane, observations with high angular andspectral resolution are required; interferometers are ideally suited to resolve the spatial structurebut they are today still limited by the number of spectral channels and sensitivity. At present,the on-board processing power of the correlator constrains the number of spectral channels andthe usable bandwidth of the observations. Moreover, radio interferometers are inherently non-sensitive for the associated faint and diffusely distributed emission of the WNM. This obviouslimitation can be overcome by adding the “missing short spacings” from single-dish observations(Section 2.2.3).
Toward high Galactic latitudes we can study most of the gas properties with moderate angularresolution but high sensitivity. For these purposes, single-dish telescopes are ideally suited becausethey offer moderate angular, highest spectral resolution and high sensitivity to reach brightnesstemperature limits down to a few mK. However, to quantify such faint emission the single-dishdata have to be corrected for several systematic effects. Most important are RFI rejection and thecorrection for the so-called stray radiation (Section 2.2.2).
In the following we discuss briefly large-scale surveys performed with single-dish telescopesand radio interferometers available today; Figure 1 shows the sky coverages of these surveys.
2.1.1. Full-sky surveys. As a general-purpose database the LAB survey (Kalberla et al. 2005) withan angular resolution of 36 arcmin sampled on a beam-by-beam grid and a velocity resolution of1 km s−1 is available. This survey combines the IAR southern sky survey (Bajaja et al. 2005) with aversion of the LDS (Hartmann & Burton 1997) to which a refined stray radiation correction hadbeen applied. This refinement was possible when the IAR data became available to augment theinput sky necessary for modeling the correction, including also corrections for reflections from theground, and led to improvement of the correction originally applied by Hartmann et al. (1996).Currently, this is the most sensitive Milky Way 21-cm line survey with the most extensive coverage
30 Kalberla · Kerp
Ann
u. R
ev. A
stro
. Ast
roph
ys. 2
009.
47:2
7-61
. Dow
nloa
ded
from
ww
w.a
nnua
lrev
iew
s.or
gby
Uni
vers
ity o
f H
awai
i at M
anoa
Lib
rary
on
01/0
2/12
. For
per
sona
l use
onl
y.

ANRV385-AA47-02 ARI 15 July 2009 4:24
Gal
acti
c la
titu
de (˚
)
Galactic longitude (˚)
90
60
30
0
–30
–60
–90360 300 240 180 120 60 0
logN
HI [cm
–2]
22
21
20
EBHIS
GALFA
LDS
IAR
SGPSCGPS VGPS
SGPS
GASS
180˚
240˚
120˚
60˚
0˚
300˚-60˚-30˚
0˚
30˚
60˚
Figure 1Overview of the sky coverage of different surveys. The Leiden-Argentine-Bonn (LAB) survey merges theLeiden-Dwingeloo Survey and Instituto Argentino de Radioastronomıa surveys at δ = −27.5◦ ± 2.5◦ (redline). The Galactic All-Sky Survey and Effelsberg-Bonn Hi Survey cover the northern and southern sky,separated by the black line. The Arecibo Galactic ALFA survey coverage is −2◦ < δ < +38◦ (yellow lines).The Galactic plane survey consists of Southern Galactic Plane Survey, Canadian Galactic Plane Survey, andVLA Galactic Plane Survey. The background image displays the total volume density of the 21-cm lineemission from the LAB survey. This figure was kindly provided by B. Winkel.
both spatially and kinematically (−450 � vl s r � 400 km s−1). The sensitivity reaches the 70- to90-mK level, and remaining baseline uncertainties are at a level of 20 to 40 mK. 3-D data cubesare available at CDS, and an easy to use interface to access individual spectra and column densitiesis provided by http://www.astro.uni-bonn.de/∼webrai/english/tools labsurvey.php.
2.1.2. Radio Interferometer Galactic Plane Surveys. The International Galactic Plane Survey(IGPS) comprises many radio telescope surveys to map the ISM in the Galactic plane at variouswavelengths. Contributions at the 21-cm line are from the CGPS by Taylor et al. (2003), the SGPSby McClure-Griffiths et al. (2005), and the VGPS by Stil et al. (2006b). These surveys provide21-cm line data with an angular resolution of 1–3.3 arcmin. Unfortunately, the sensitivity is limited(∼2 K). The IGPS is still an ongoing project; for data access and detailed information on all ofthese surveys we refer to http://www.ras.ucalgary.ca/IGPS/.
2.1.3. Multifeed single-dish surveys. The LAB all-sky survey provides data with excellent sen-sitivity; but for those parts of the Galactic sky without interferometric data, the angular resolutionis seriously limited. The IGPS, however, is rather restricted in Galactic latitude coverage and sen-sitivity. With the advent of multifeed receivers, it became possible to use the world’s largest single-dish telescopes to perform all-sky surveys in a very efficient way, providing data with improvedsensitivity and resolution; it was an important improvement over currently available single-dishor interferometer surveys.
The Parkes telescope, equipped with 13 feeds, was used to map the Hi in the southernsky with a sensitivity of 60 mK (McClure-Griffiths et al. 2009) and the angular resolution
www.annualreviews.org • HI in the Milky Way 31
Ann
u. R
ev. A
stro
. Ast
roph
ys. 2
009.
47:2
7-61
. Dow
nloa
ded
from
ww
w.a
nnua
lrev
iew
s.or
gby
Uni
vers
ity o
f H
awai
i at M
anoa
Lib
rary
on
01/0
2/12
. For
per
sona
l use
onl
y.

ANRV385-AA47-02 ARI 15 July 2009 4:24
was 16 arcmin. The first release of a stray-radiation-corrected version is expected for 2009(http://www.atnf.csiro.au/research/GASS/).
The Arecibo telescope, equipped with a seven-beam Arecibo L-band Feed Array (ALFA), iscurrently used for Galactic studies for the declination range −2◦ < δ < +38◦. Focusing on theMilky Way radiation, the GALFA-HI survey aims to cover both the Galactic plane and highlatitudes with an excellent angular resolution of 3.4 arcmin [see http://www.naic.edu/alfa/galfa;see also Stanimirovic et al. 2006 (GALFA-HI)].
A complete survey of the northern sky commenced in autumn 2008 with the seven-beamreceiver of the 100-m telescope (EBHIS). The sky north of declination δ = 0◦ will be mappedon a fully sampled grid with an angular resolution of 9 arcmin (Winkel et al. 2008). Using state-of-the art FPGA spectrometers (Section 2.2.4), it is feasible to observe the Milky Way emissionwith velocity resolution of ∼1.3 km s−1 and external galaxies with redshifts of z ≤ 0.07 at the sametime.
2.2. New Observational Techniques
2.2.1. Multifeed receiver systems. Already about thirty years ago, large full steerable radiotelescopes approached technological limits in size and weight. The special design of the GreenBank telescope with an unblocked aperture led to some additional improvements, but a majorinnovation came from multifeed receiver systems. For single-dish telescopes multifeed receiversoffer the opportunity to improve the survey speed by up to an order of magnitude.
The Parkes Telescope was the first with a 13-feed array at 1.4 GHz (Staveley-Smith 1997),followed by the Arecibo 300-m dish, which is now equipped with a seven-beam receiver system.Using this device, several international research collaborations were successfully established toperform unique observations on the highest signal-to-noise ratio in the Galactic (GALFA-HI,Stanimirovic et al. 2006), extragalactic (EALFA, Giovanelli 2008), and pulsar (PALFA, Cordes et al.2006) research. Also in 2008, the Effelsberg 100-m dish got equipped with a seven-beam receiversystem. With these receivers, all these telescopes realized a major leap in observing efficiency.
Current multifeed systems undersample the focal plane. Focal-plane phased-arrays will over-come this limitation in the near future. Single-dish telescopes would benefit from another majorincrease of the survey speed (Giovanelli 2008) and interferometers from a significant enlargementof the instantaneous field of view (Verheijen et al. 2008). Current activities at CSIRO and DRAOare summarized by Johnston et al. (2007).
2.2.2. Stray radiation mitigation strategies. Up to 50% of the Hi emission lines observed atregions of low total Hi flux with single-dish telescopes may be spurious, picked up by far-offantenna side-lobes from the bright Galactic plane (e.g., figure 14 of Hartmann et al. 1996). Thisstray radiation problem is caused by reflections within the telescope, mainly at the feed supportlegs, but also at the rim of the reflector, the spill-over region. Even reflections from the ground arepresent. Stray radiation is most serious in regions with faint Hi emission received by the main beam,but also for Hi observations of the Galactic plane, stray radiation cannot be neglected entirely ifwe are interested in faint lines associated with large velocity dispersion. For an accurate evaluationof the faint and extended emission toward high latitudes, a correction of all these spurious effectsis necessary (Kalberla, Mebold & Reich 1980).
Stray radiation is not entirely avoidable. The Robert C. Byrd Green Bank Telescope (GBT) is aprime example of a new telescope design with an unblocked aperture. This improves the apertureefficiency and minimizes baseline ripples caused by standing waves. Most of the stray radiation ismitigated, in particular that from the support legs (Dickey & Lockman 1990), but the spillover may
32 Kalberla · Kerp
Ann
u. R
ev. A
stro
. Ast
roph
ys. 2
009.
47:2
7-61
. Dow
nloa
ded
from
ww
w.a
nnua
lrev
iew
s.or
gby
Uni
vers
ity o
f H
awai
i at M
anoa
Lib
rary
on
01/0
2/12
. For
per
sona
l use
onl
y.

ANRV385-AA47-02 ARI 15 July 2009 4:24
still cause problems (Lockman & Condon 2005). A correction without the knowledge of the beampattern requires bootstrapping from a database that is unaffected by stray radiation (Lockman,Jahoda & McCammon 1986); the LAB survey can be used for this purpose.
Alternatively, it is feasible to calculate the bias introduced by stray radiation. In this case, it isnecessary to measure or model the antenna diagram as accurately as possible. The stray radiationcan be removed by convolving the observed all-sky 21-cm line emission (i.e., LAB survey) withthe antenna diagram. This became a standard procedure for the Effelsberg 100-m telescope andhas been successfully applied to the full sky (Higgs & Tapping 2000, Kalberla et al. 2005). Thecorrected data reveal a quality that is equivalent to a main beam efficiency of 99%.
2.2.3. Short-spacing correction. Radio interferometers are insensitive to extended structuresbecause they do not receive emission from spatial frequencies shorter than the smallest separationof two telescopes of the telescope array. For observations of the Galactic Hi emission, this propertycauses serious problems because a significant fraction of the Hi emission is extended on scales oftens of arcminutes, corresponding to the shortest interferometer spacings. As a result, the totalflux is undefined, most of the WNM remains unobservable, and even some parts of the CNM mayget suppressed in interferometer maps. Restoration methods like CLEAN (see Hogbom 1974) failbecause the Galactic Hi can in general not be approximated by a superposition of point sources.The missing information needs to be filled in and this is possible if one uses a single-dish telescopewith a diameter of at least 1.5 times the shortest interferometer baseline. This procedure is calledshort-spacing correction; the resulting data are equivalent to observations with a virtual single-dishtelescope having a diameter of 500 m or more.
There are different methods available. For a comparison and useful recipes we refer toStanimirovic (2002). The application of such a correction is not an easy job, but taking vari-ous caveats into account, all of the methods can produce comparable results. It is important tonote that the CGPS, SGPS, and VGPS surveys have been corrected for the missing short-spacingdata. The data quality is excellent, as shown by Stil et al. (2006b) who made a few data checks andintercomparisons.
2.2.4. Field-programmable-gate-array spectrometer. With the advent of field-programmable-gate-arrays (FPGAs) and fast analog-digital converters (ADCs), new radioastronomical spectrometers became accessible within the past few years. FPGA spectrometerscombine large bandwidths (up to gigahertz), high dynamic ranges (8 to 14 bits), fast readout,high stability, and a high number of spectral channels with an affordable price (Mock 2004; Benzet al. 2005; Stanko, Klein & Kerp 2005). The technological leap in radio spectrometers wasfeasible; because the ADC sampling rate increased up to 4 GHz, further progress is expected.Considering that the transformation of a temporal continuous but band-pass-limited signal by anADC produces a series of discrete spectra, this provides the possibility of digital undersampling(or Super-Nyquist sampling). Using a bandpass filter in front of the ADC allows us to select theNyquist band of interest. Because of the digital undersampling, the Nyquist band of interest isdetectable in the baseband (ranging from 0 Hz to the bandwidth limit).
Because of the rapid technological development of ADCs and the “programmable hardware” ofFPGAs, FPGA spectrometry has the potential to replace, in the near future, auto-correlators andfilter-band spectrometers entirely. They are the key for future instrumentation with respect to theincreasing demand on bandwidth, spectral channels, and number of feeds. The ADC determinesthe bandwidth and the dynamic range, while the number of logical elements implemented withinthe FPGA determines the number of spectral channels. Using Fast-Fourier Transformation orPoly-phased Filter codes written in Very High Speed Integrated Circuit Hardware Description
www.annualreviews.org • HI in the Milky Way 33
Ann
u. R
ev. A
stro
. Ast
roph
ys. 2
009.
47:2
7-61
. Dow
nloa
ded
from
ww
w.a
nnua
lrev
iew
s.or
gby
Uni
vers
ity o
f H
awai
i at M
anoa
Lib
rary
on
01/0
2/12
. For
per
sona
l use
onl
y.
ANRV385-AA47-02 ARI 15 July 2009 4:24
Language, it is feasible to realize data storage times (dump times) of less than a second, which isvery favorable for RFI mitigation strategies.
2.2.5. Radio frequency interference mitigation. RFI causes severe limitations on the sensitivityof radio telescopes in general. Even within the protected Hi 21-cm line, band irradiation of RFIsignals is common. The sources of the RFI are as manyfold as the number of electronic devices usedtoday. In particular, digitally operating devices pollute a broad frequency range because of theirextremely sharp defined band-passes. These sharp “frequency edges” produce high harmonics atdifferent power levels that degrade the observational data. Also, aging of electronic componentsmay alter the performance of the electronic circuits, thus causing RFI. Moreover, the pollutionof the astronomical signals by RFI is getting more serious because of the increasing sensitivityof radio astronomical receivers and the scientific interest in even fainter emission lines. RFIis received not only by the main antenna beam but also by the side lobes and even from thebackside of the dish. Strong RFI signals are orders of magnitude more intense than the radioastronomical signal of interest. Because of the limited dynamic range of auto-correlators, strongRFI signals may saturate them. The high dynamic range of FPGA-spectrometry allows us toovercome this limitation. The faint RFI signals are, however, the most problematic ones. Theycannot be identified within a single spectrum and may change their intensity, frequency, andpolarization properties on timescales shorter than the integration time. This leads to a degradationof the Hi spectrum, which is extremely difficult to identify (Winkel et al. 2007).
With respect to 21-cm emission lines, high temporal resolution is an extremely valuable prop-erty of FPGA-spectrometers because it allows us to distinguish between astronomical and RFIsignals. Most of the RFI signals can be identified by frequency variations, intensity modulations,and changes of their polarization properties. The variability of these properties clearly distin-guishes RFI signals from the Hi 21-cm line emission of astronomical sources. Using high-speedpersonal computers, it is feasible to perform an off-line search for temporal variable signals withinthe Hi spectra to mitigate the degradation of the astronomical data by man-made radio noise.
For a recent overview of different RFI mitigation strategies see, e.g., Ekers & Bell (2001),Winkel et al. (2007), and Fridman (2008).
3. HI ON THE GALACTIC SCALE
3.1. The Disk
Observations of spiral galaxies teach us, in general that many Hi disks have typically three times theextent of their stellar distribution. According to this, Hi is considered to be an extremely sensitivetracer of the Galactic mass distribution and of the dynamics of Galactic systems as a whole. Weintend to discuss first global aspects of the Hi distribution in the Milky Way, in particular thevertical and radial extension of the Hi disk. We use Galactocentric cylindrical coordinates R, z,and φ; the Sun is at azimuth φ = 180◦.
3.1.1. Rotation curve. Brightness temperatures TB(l, b, v) observed in Galactic coordinates withlongitude l and latitude b need to be converted into volume densities n(R, z) (Burton & te LintelHekkert 1986, Diplas & Savage 1991). Assuming that most of the gas follows an axisymmetriccircular rotation yields the well-known relation for the differential rotation velocity (e.g., Burton1988)
v(R, z) =[
R�R
�(R, z) − ��
]sin l · cos b . (1)
34 Kalberla · Kerp
Ann
u. R
ev. A
stro
. Ast
roph
ys. 2
009.
47:2
7-61
. Dow
nloa
ded
from
ww
w.a
nnua
lrev
iew
s.or
gby
Uni
vers
ity o
f H
awai
i at M
anoa
Lib
rary
on
01/0
2/12
. For
per
sona
l use
onl
y.

ANRV385-AA47-02 ARI 15 July 2009 4:24
0
50
100
150
200
250
0 10 20 30 40 50 60
Midplane
v c (km
s–1
)
R (kpc)
Figure 2Mean axisymmetric Milky Way rotation curve according to Kalberla et al. (2007). The upper blue curverepresents the rotation curve at midplane. The case v = 220 km s−1 is plotted for comparison. The curvesbelow (red ) show the circular streaming velocities for gas layers offset from midplane at the position of theSun by |z| = 1 to 5 kpc. The lags are caused by gravitational effects only. Noncircular motions affect rotationvelocities significantly for R < 5 kpc (thin lines); these data are not used.
v denotes the radial velocity along the line of sight, while �(z) denotes the tangential velocity ata certain radius R. In the inner Galaxy, for R < R�, distances are ambiguous, except for terminalvelocities. To solve this equation for R > R�, one needs to know the Galactic constants R� and��, but also the rotation curve �(R, z). Here we use R� = 8.5 kpc and �� = 220 km s−1. Afurther uncertainty is caused by noncircular motions owing to the central bar (Burton & Liszt1993). The rotation is also poorly known in the outer Galaxy because it is particularly difficultto determine accurate distances there. Systematic biases can seriously degrade the derivation ofthe rotation curve (Binney & Dehnen 1997). Within the past decade a general consensus on theflatness of the outer rotation curve is accepted [e.g., Fich, Blitz & Stark (1989) and applications byLevine, Blitz & Heiles (2006a,b)]. Attempts to solve the combined Poisson-Boltzmann equationto describe the Hi flaring in a self-consistent way result in a rotation curve that is approximatelyflat within 5 � R � 27 kpc (Kalberla et al. 2007). In the following, we use this rotation curveshown in Figure 2. This yields results that are compatible with those derived previously for a flatrotation curve. Major differences, however, may be caused by the fact that we abandon a cylindricalrotation law. At distances |z| > 0 we use a lagging rotation (for details see Section 3.2.5).
The derivation of such a rotation depends inherently on the baryonic and nonbaryonic matterdistribution of the Milky Way Galaxy. A Galactic mass model can be formulated in a self-consistentfashion if one drops the assumption of a dark matter (DM)–free Galactic disk (Kuijken & Gilmore1989). The best fit mass model can be characterized by a thick self-gravitating DM disk with M =1.8 × 10¹¹ M� and a ring-like component with M ∼ 2.3 × 10¹⁰ M� located at 13 < R < 18.5 kpc.It remains an open question whether such a DM distribution can result from accretion events(Read et al. 2008). For the Kalberla et al. (2007) model the total mass within R � 60 kpc is M =4.6 × 10¹¹ M�. Baryons provide M = 9.5 × 10¹⁰ M� with a gas fraction of 13%. The Hi massis M = 8 × 10⁹ M�, the warm ionized medium contributes M = 2 × 10⁹ M�, and moleculargas is M = 2.5 × 10⁹ M�.
www.annualreviews.org • HI in the Milky Way 35
Ann
u. R
ev. A
stro
. Ast
roph
ys. 2
009.
47:2
7-61
. Dow
nloa
ded
from
ww
w.a
nnua
lrev
iew
s.or
gby
Uni
vers
ity o
f H
awai
i at M
anoa
Lib
rary
on
01/0
2/12
. For
per
sona
l use
onl
y.

ANRV385-AA47-02 ARI 15 July 2009 4:24
–40–20
020
40–40
–20
0
20
40
–20
0
SunSunSun
20
Warp (kpc)
5
x (kpc)
z (k
pc)
5.5
4.5
4
3.5
3
2.5
2
1.5
1
0.5
0
–0.5
–1
–1.5
–2y (kpc)
Figure 3The warped Galactic plane; average midplane positions as derived from the Leiden-Argentine-Bonn 21-cmline survey by fitting three basic modes. Isophotes are from z0 = −2 to 5.5 kpc in steps of 0.5 kpc. The z =0 plane is inclined by 60◦ and viewed from φ = 15◦. The location of the Sun is indicated by the yellow dot.The blue dashed lines mark quadrants in azimuth and distances R = 10, 20, 30, and 40 kpc, respectively.
Unfortunately, the straightforward solution of Equation 1 yields large north/south asymmetriesin the column density distribution of the outer disk, which leads to vital debates on their origins(e.g., Kerr 1962, Blitz & Spergel 1991, Kuijken & Tremaine 1994). Levine, Blitz & Heiles (2006a)solved the asymmetries by assuming elliptical gas orbits. Large-scale mass asymmetries are foundto be consistent with this empirical approach (Kalberla et al. 2007); deviations can amount to∼15 km s−1 at R ∼ 25 kpc.
3.1.2. The warp. For a description of the global properties of the Hi distribution in the MilkyWay it is necessary to consider the bending of the Galactic plane (Henderson, Jackson & Kerr1982), noticeable at R � 9 kpc in Hi but also in CO clouds, in stars, in Hii regions, and inother tracers (Wouterloot et al. 1990). The reliability of the LAB database makes it possible toextend the determination of the Hi warp parameters out to large Galactocentric radii, wherethe Hi emission lines show up as faint profile wings at large velocities. Levine, Blitz & Heiles(2006a) identified three basic warp modes for R � 30 kpc. Kalberla et al. (2007) extended theiranalyses and found that these warp modes remain surprisingly well defined even out to R ∼ 40 kpc.Figure 3 displays a perspective view of the warped plane z0(R, φ) looking approximately acrossthe center in a direction toward the Sun.
3.1.3. Midplane and surface density distribution. Taking the warp into account it is possibleto derive the average Hi volume density n0(R) at midplane (Figure 4). The radial distribution isapproximately exponential for 7 � R � 35 kpc; n(R, z0) ∼ n0 · e−(R−R�)/Rn with n0 = 0.9 cm−3
and Rn = 3.15 kpc. There are systematic differences between the northern and southern parts ofthe disk in the azimuth ranges of 0◦ < φ < 180◦ and 180◦ < φ < 360◦, which has been knownfor a long time (e.g., Kerr 1962). For radii in excess of R = 15 kpc, the dominant fraction of theneutral gas is located in the Southern Hemisphere. A similar trend n(R) ≈ e−0.3R was found byStrasser & Taylor (2004) from CGPS data with R � 20 kpc.
36 Kalberla · Kerp
Ann
u. R
ev. A
stro
. Ast
roph
ys. 2
009.
47:2
7-61
. Dow
nloa
ded
from
ww
w.a
nnua
lrev
iew
s.or
gby
Uni
vers
ity o
f H
awai
i at M
anoa
Lib
rary
on
01/0
2/12
. For
per
sona
l use
onl
y.

ANRV385-AA47-02 ARI 15 July 2009 4:24
10–4
10–3
10–2
10–1
100
0 5 10 15 20 25 30 35 40
R (kpc)
NorthTotal diskSouthExponential fit
Mid
plan
e de
nsit
y (c
m–3
)
Figure 4Average midplane volume densities as a function of R. The red line marks the total average, the dotted blueline the northern, and the purple dashed line the southern part separately. The black line shows theexponential fit with a scale length Rn = 3.15 kpc (from Kalberla & Dedes 2008).
101
102
103
0 5 10 15 20 25 30 35 40
10–1
100
101
(Mo pc
–2)
R (kpc)
North
Total disk
South
Exponential fit
W90
Wolfire
BM98
Surf
ace
dens
ity
(1018
cm–2
)
Figure 5Average surface density distribution as a function of R. The red line marks the total average, the dotted blueline the northern, and the purple dashed line the southern part separately. The black line shows theexponential fit with a scale length Rs = 3.75 kpc (Kalberla & Dedes 2008). The dotted gray line reproducesthe distribution published by Wouterloot et al. (1990, W90), the thick yellow line reproduces data used byWolfire et al. (2003), and the dashed yellow line reproduces the distribution published by Binney &Merrifield (1998, figure 9.19, BM98).
The average surface density distribution is plotted in Figure 5 and can be approximated by�(R) ∼ s0 · e−(R−R�)/Rs with s0 = 30 M� pc−2 and Rs = 3.75 kpc. There are similar systematicdifferences between the northern and southern sky as there are for the midplane densities (seeFigure 4). For large radial distances the derived distribution is in good agreement with previousinvestigations (e.g., Wouterloot et al. 1990, Diplas & Savage 1991), but there are some degradations
www.annualreviews.org • HI in the Milky Way 37
Ann
u. R
ev. A
stro
. Ast
roph
ys. 2
009.
47:2
7-61
. Dow
nloa
ded
from
ww
w.a
nnua
lrev
iew
s.or
gby
Uni
vers
ity o
f H
awai
i at M
anoa
Lib
rary
on
01/0
2/12
. For
per
sona
l use
onl
y.
ANRV385-AA47-02 ARI 15 July 2009 4:24
for R � 12.5 kpc. The surface densities saturate at approximately �inner ∼ 10M� pc−2. Toovercome this limitation, it is common to use the value � = 5M� pc−2 (Dickey & Lockman1990). The average surface densities according to Binney & Merrifield (1998, figure 9.19) areeven lower but may be affected by a systematic bias (Lockman 2002a). Wolfire et al. (2003) useda slightly larger estimate with a local maximum at R ∼ 13 kpc. For comparison, we show thesesurface densities in Figure 5.
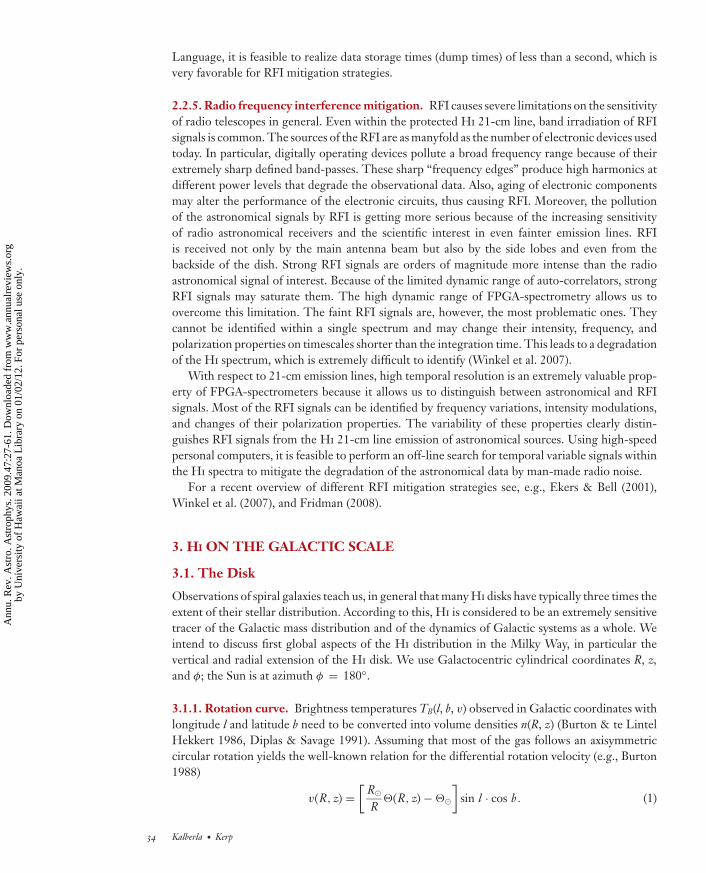
3.1.4. HI scale height. The average scale height hz(R) of the Hi disk depends on the balance be-tween gravitational forces and the pressure constituents. Analogous to planetary atmospheres, onemay approximate this situation as a “Galactic atmosphere” by a hydrostatic equilibrium approach.This, however, implies a very global approach because on scales up to at least hundreds of parsecsthe pressure and density of the ISM may be highly variable and far from equilibrium. Dynamicalaspects, turbulence, and phase transitions are discussed later. Here we assume that the global Hi
distribution in the Milky Way disk can be considered on these large scales as in a steady state. Theaverage thickness hz(R) (half width at half maximum, HWHM) of the Hi disk shows a pronouncedflaring (Figure 6) that can be approximated by an exponential relation hR = h0 e (R−R�)/R0 kpc withh0 = 0.15 kpc and R0 = 9.8 kpc for 5 � R � 35 kpc.
Flaring may be induced by changes of the gravitational potential in the z direction or byvariations in the heating/cooling balance of the Hi gas. Observing the Hi gas in our own Galaxy hasthe advantage that we are able to resolve the emission lines of individual regions. The situation inour own Galaxy is luckily very different from that in external systems, because only for our Galaxydo we really know the viewing inclination and the position of the line of nodes. For externalsystems, the observational data are highly distorted, implying that the Milky Way is the primeexample for such an analysis. There are no indications that turbulence or multiphase propertiesof the Hi gas depend significantly on radial distance R. The flaring may therefore be used toprobe DM models (e.g., Narayan, Saha & Jog 2005; Sanchez-Salcedo, Saha & Narayan 2008). A
0
0.5
1.0
1.5
2.0
2.5
3.0
0 5 10 15 20 25 30 35 40
Flar
ing
HW
HM
(kpc
)
R (kpc)
NorthAverageSouthExponential fitMass model
Figure 6Average flaring of the Hi gas layer as a function of R (from Kalberla & Dedes 2008). The observations can beapproximated very well by an exponential relation (black dashed line) or by fitting a mass model to anisothermal Hi gas distribution (Kalberla et al. 2007).
38 Kalberla · Kerp
Ann
u. R
ev. A
stro
. Ast
roph
ys. 2
009.
47:2
7-61
. Dow
nloa
ded
from
ww
w.a
nnua
lrev
iew
s.or
gby
Uni
vers
ity o
f H
awai
i at M
anoa
Lib
rary
on
01/0
2/12
. For
per
sona
l use
onl
y.

ANRV385-AA47-02 ARI 15 July 2009 4:24
self-consistent solution of the Poisson-Boltzmann equation implies a disk-like DM distributionand a flat rotation curve (Kalberla et al. 2007).
3.1.5. The exponential disk. Figures 4 through 6 show that within the uncertainties the globalproperties of the Hi gas in the disk can be well approximated by exponential distributions. Acorrelation between these parameters is expected because on average the surface density, themidplane density, and the scale height are related according to 〈�(R)〉 ≈ 〈n0(R)〉 · 〈hz(R)〉. Inthe outer part of the Milky Way disk, this approximation remains valid up to R ∼ 35 kpc, thisradius apparently defines the outer edge of the Galactic disk. From the mass model this distancedistinguishes the transition from the inner oblate gravitational potential to a prolate one. Clearlythe disk approximation breaks down at this radius. This limit is approximately three times theradius R25 of the stellar disk. For spiral galaxies such a ratio is frequently observed; we concludethat the Milky Way may be quite normal in this respect.
3.1.6. Optical depth effects. A closer look to the exponential relations, comparing the scalelengths in detail, shows a small but significant deviation from the exponential disk approximation.Our discussion of the global distributions �(R), n0(R), and hz(R) assumed that the Hi gas is opticallythin.
Optical depth effects have been discussed by Burton (1976). The more recent CGPS data showthat optical depth biases increase with increasing observed column density (Strasser & Taylor2004); for Strasser & Taylor’s sample the emission traces only 75% of the Hi gas. A similar resultfor the SGPS was given by Dickey et al. (2003). Kolpak et al. (2002) derive a general trend ofincreasing optical depth with decreasing R as well as a strong correlation with the molecular gascontent. Unfortunately, their analysis is restricted to low Galactic latitudes only, b � 0◦.7. Allthese investigations show common trends and serious biases for R � 12 kpc (see Figure 5), butare unfortunately insufficient for a statistical correction of optical depth as a function of R.
3.1.7. Spiral structure. The driver for early investigations of the Hi distribution in the MilkyWay was a quest to determine the spiral structure but the data were largely over interpreted.Aiming to derive a more detailed picture from actual Hi survey data leads to frustrating results.Large-scale maps of the Hi surface density distribution do not give clear evidence for a spiralstructure. Major problems are distortions due to turbulent streaming motions along the line ofsight that are confusing the velocity-distance transformation. Also, flow patterns revealing an armare governed by the nonlinear density wave theory, so that the Hi does not appear at the mass locusof the arm. However, some spiral structure may be disclosed as perturbations in the surface densitydistribution. Levine, Blitz & Heiles (2006b), using surface densities for R < 25 kpc from the LABsurvey, derived parameters for four nonaxisymmetric logarithmic spirals with pitch angles of 20◦
to 25◦. They have shown also that overdensities in the surface density distribution are coincidentwith regions of a reduced thickness of the gas layer. Each of the arms has already been detectedpreviously, including the prominent one in the fourth quadrant, which was studied in detail byMcClure-Griffiths et al. (2004). SGPS data disclose an extension over 70◦; over most of its length,the arm is 1–2 kpc thick.
A systematic depression in the scale height of the gas may be interpreted as an indication forassociated enhancements in the mass distribution. Kalberla et al. (2007) compared observed Hi
scale heights with average scale heights from an axisymmetric mass model. They could trace thespiral arms suggested by Levine, Blitz & Heiles (2006b) up R ∼ 30 kpc; for the best defined armthey could trace it even up to R ∼ 35 kpc. The mass model implies that spiral arms trace massenhancements by a factor of 3 to 6 with respect to the average axisymmetric density.
www.annualreviews.org • HI in the Milky Way 39
Ann
u. R
ev. A
stro
. Ast
roph
ys. 2
009.
47:2
7-61
. Dow
nloa
ded
from
ww
w.a
nnua
lrev
iew
s.or
gby
Uni
vers
ity o
f H
awai
i at M
anoa
Lib
rary
on
01/0
2/12
. For
per
sona
l use
onl
y.

ANRV385-AA47-02 ARI 15 July 2009 4:24
IVC: intermediate-velocity cloud
3.2. The Disk-Halo Interface
Pictures of the Hi distribution show numerous filaments extending to high Galactic latitudes(e.g., Hartmann & Burton 1997). Individual clouds and coherent cloud assemblies (or complexes)can be easily distinguished from the Galactic disk emission because of their deviation velocities(Wakker 1991). They are denoted as intermediate- and high-velocity clouds, respectively (IVCsand HVCs); excellent reviews are available from Wakker & van Woerden (1997) and the collectionof chapters in the book edited by van Woerden et al. (2004).
In addition to these two populations of halo clouds there have long been indications for a thirdpopulation, an “envelope of Hi surrounding the spiral structure” (Shane 1967), reported for thefirst time by Oort (1962). First observations date back to Prata (1964) and Simonson (1971); suchclouds are obvious in the LDS data.
3.2.1. Halo clumps. Lockman (2002b) was the first to study this population at high resolution.Using the GBT, he searched the first Galactic quadrant and used the terminal velocity methodto determine distances of individual clouds. In many cases the clumps are embedded in faint dif-fuse filaments that are connected to the disk. Other clumps appear to be spatially associated withthe disk, but their velocities are high and unexpected. The clouds are found at z distances up to1.5 kpc. Clouds that reach high z distances need large vertical velocities to overcome the gravita-tional attraction of the Galactic disk. In the median, the clouds have diameters of ∼20 pc, peakcolumn densities of a few times 1019 cm−2, Hi densities of a few tens cm−3, and Hi masses of50 M�. Some of the lines are narrow, indicating gas at temperatures of less than 1000 K. Thespectra also show evidence for a core-halo velocity structure. Lockman (2002b) concluded that asmuch as half the mass of the neutral halo could be contained in clouds.
In the meantime, Stil et al. (2006a) identified fast moving clumps within the plane of the Galacticdisk. The current interpretation is that both ensembles of clouds belong to the same population.Ongoing searches with the Parkes telescope in the fourth quadrant by Ford et al. (2008), withArecibo (Stanimirovic et al. 2006), and the Effelsberg telescope (Dedes 2008) in regions evenbeyond the Solar circle indicate that this population is probably widespread throughout the wholeMilky Way. The approximate average detection rate for these telescopes is one cloud per twosquare degrees. The apparent distribution of this cloud ensemble in Galactic coordinates, hencethe detectability, is influenced by projection effects (Kalberla & Dedes 2008).
The LAB survey does not allow us to resolve the individual clumps, but provides statisticalevidence that about 10% of the Hi gas is located outside the disk. Figure 7 shows the average Hi
emission in the direction toward both Galactic poles for latitudes |b | > 20◦. We use a logarithmicbrightness temperature scale to display the huge dynamic range in TB. The peak emission closeto v1sr = 0 km s−1 is associated with faint but extremely broad wings. In the south, for b < −20◦
(blue in Figure 7), the wing at positive velocities is dominated by emission from the Magellanicstream. IVCs lead to enhanced emission at v1sr ∼ −50 km s−1, but elsewhere one observes aremarkable symmetric distribution for both negative and positive velocities. These wings, firstpublished by Stark et al. (1992, their figure 10), are highly suggestive of stray radiation but it canbe shown that they are real (Verschuur 2004, Haud & Kalberla 2006, Kalberla & Dedes 2008).Adopting the interpretation that the local neutral ISM is supported in the Galactic gravitationalpotential primarily by turbulence (Dickey & Lockman 1990, Lockman & Gehman 1991) implieshigh random velocities for individual clouds.
The Hi spectra can be fitted by a population of unresolved clouds with a velocity dispersionof σ ∼ 74 km s−1 (Kalberla & Dedes 2008). This is more than a factor of three larger than thetypical velocity dispersion of Hi gas, implying that this gas component exceeds the kinetic energy
40 Kalberla · Kerp
Ann
u. R
ev. A
stro
. Ast
roph
ys. 2
009.
47:2
7-61
. Dow
nloa
ded
from
ww
w.a
nnua
lrev
iew
s.or
gby
Uni
vers
ity o
f H
awai
i at M
anoa
Lib
rary
on
01/0
2/12
. For
per
sona
l use
onl
y.

ANRV385-AA47-02 ARI 15 July 2009 4:24
–3.0
–2.5
–2.0
–1.5
–1.0
–0.5
0
0.5
1.0
1.5
–200 –150 –100 –50 0 50 100 150 200
LAB, b > +20LAB, b < –20Model
vlsr (km s–1)
log
T b (K
)
Figure 7Average 21-cm Hi line emission for latitudes |b | > 20◦ from the LAB survey as a function of radial velocityv1sr. The red line marks the north polar cap and the dotted blue line the southern part. The dashed blackline represents the model (Kalberla & Dedes 2008).
of the disk gas by an order of magnitude. Such fast clouds can reach z distances of 4 kpc near theSun. Including flaring in our considerations, this is consistent with heights observed by Lockman(2002b) and Ford et al. (2008) for the Hi clumps in the inner part of the Milky Way.
3.2.2. The halo. The definition of the halo is quite a problem. We have a smooth transitionof temperature, volume density, and pressure with increasing altitude. Assuming a hydrostaticequilibrium approximation on a Galactic scale, we can deduce from the LAB survey a verticalscale height at the location of the Sun for the CNM of 150 pc, for the WNM of 400 pc, andfor a very faint halo gas component of 4 kpc (see Kalberla 2003, his table 1). The correspondingmidplane volume densities (for CNM, 0.3 cm−3; WNM, 0.1 cm−3; and halo gas, 0.001 cm−3)decrease roughly linearly proportional to the vertical scale height of the gas component. There areionized as well as neutral gas structures at kiloparsec distances from the Galactic plane; the MilkyWay Galaxy is enclosed within a gaseous “atmosphere”. Tidal gas streams as well as “classical”HVCs and complexes at distances of tens of kiloparsecs may be embedded within this atmosphere.Considering the radial velocities of the HVC complexes, a few 100 km s−1, moderate to strongshocks are expected to be observed in the disk-halo interface. HVCs are prominent because theyare part of large and massive complexes that are forming coherent structures.
Observational evidence for an extended gaseous halo is also given by the fact that most of theHVC complexes show a pronounced multiphase structure (Kalberla & Haud 2006). Gas pressurefrom the confining gaseous halo supports phase transitions (Wolfire et al. 1995b). HVCs haveturbulent energy densities that are an order of magnitude larger than that of comparable clumpsin the Galactic disk.
3.2.3. Asymmetries. The average Hi distribution has significant north-south asymmetries, obvi-ous since the very first Hi observations. The differences are most pronounced for 20 � R � 30 kpc.The Hi scale heights are lower in the south, implying local enhancements in the gravitational po-tential caused by asymmetries in the DM distribution. As a response, the circular velocities are
www.annualreviews.org • HI in the Milky Way 41
Ann
u. R
ev. A
stro
. Ast
roph
ys. 2
009.
47:2
7-61
. Dow
nloa
ded
from
ww
w.a
nnua
lrev
iew
s.or
gby
Uni
vers
ity o
f H
awai
i at M
anoa
Lib
rary
on
01/0
2/12
. For
per
sona
l use
onl
y.

ANRV385-AA47-02 ARI 15 July 2009 4:24
estimated to increase up to 15 km s−1 (Kalberla et al. 2007), consistent with the empirical epicyclicstreamline correction by Levine, Blitz & Heiles (2006a).
3.2.4. The outskirts. Toward the outskirts of the Milky Way, for R � 35 kpc, the averageHi distribution does not fade off exponentially. Figures 4 and 5 imply for R � 35 kpc a faintdistribution of Hi gas that encloses the exponential Hi disk. We display in Figure 8 a moredetailed comparison. Surface densities, calculated for several azimuthal sectors with −15 < z <
20 kpc deviate for R � 35 kpc significantly from the exponential disk distribution. Asymmetriesare less pronounced than for R � 35 kpc (Section 3.1.3, Figures 4 and 5).
The parameters of the highly turbulent Hi phase, which were found to fit the extended profilewings observed toward the polar caps, have also been used to model Hi emission for all distancesR < 60 kpc. A radial exponential scale length of Rh = 7.5 kpc (Kalberla 2003), twice the disk scalelength Rs, discussed in Section 3.1.3, was used. The resulting component is plotted with a red lineand compares well with the observational data. It is remarkable that parameters that were derivedto explain local emission features in the direction to the poles (Section 3.2.1) are useful also atR > 35 kpc.
Comparing this finding with the distribution of the anomalous gas phase in a few other galaxies(e.g., Fraternali 2008, Fraternali & Binney 2008), it would be consistent if the Milky Way CNMand WNM disks are also surrounded by a patchy and highly turbulent halo medium. About 10%of the total Hi gas may be in this phase (Kalberla & Dedes 2008).
100
101
102
20 25 30 35 40 45 50 55 60
10–2
10–1
100
Surf
ace
dens
ity
(1018
cm
–2)
R (kpc)
M o pc
–2
50˚ < φ < 70˚
70˚ < φ < 90˚
90˚ < φ < 110˚
110˚ < φ < 130˚
250˚ < φ < 270˚
270˚ < φ < 290˚
290˚ < φ < 310˚
Disk phase
σ = 74 km s–1
Figure 8Average surface densities as a function of R for 20◦-wide radial sectors in the outskirts of the Milky Way. Forcomparison, the fitted distribution for the disk gas (solid black line) as well as for a turbulent halo mediumwith σ ∼ 74 km s−1 (solid red line) is given (Kalberla & Dedes 2008).
42 Kalberla · Kerp
Ann
u. R
ev. A
stro
. Ast
roph
ys. 2
009.
47:2
7-61
. Dow
nloa
ded
from
ww
w.a
nnua
lrev
iew
s.or
gby
Uni
vers
ity o
f H
awai
i at M
anoa
Lib
rary
on
01/0
2/12
. For
per
sona
l use
onl
y.

ANRV385-AA47-02 ARI 15 July 2009 4:24
3.2.5. The corotation problem. For a steady-state gas in an axisymmetric gravitational potential,the average azimuthal streaming velocity vφ(z) can be derived from Euler’s equation
(�v · ∇)�v = −∇ pρ
− ∇�, (2)
where ρ is the volume density and p is the pressure of the gas; in the isothermal case p ∝ ρσ 2.� denotes the gravitational potential and �v the velocity vector. Equation 2 excludes magnetic andviscosity terms. For an ideal gas with an isotropic velocity dispersion, which can be described by abarotropic equation of state p = f (ρ), York et al. (1982) have shown that the extraplanar gas mustbe corotating with the disk.
A multiphase medium violates the barotropic condition, a fact that is often disregarded; coro-tation may therefore not be taken for granted. To quantify how far rotation is affected by thegravitational potential �, we set ∇ p/ρ = 0. With increasing |z| distance, the gravitational forcesacting on the gas decrease, implying a lower average streaming velocity. The expected velocitydeviation v(R, z) = vφ(R, z) − vφ(R, 0) depends on the mass model; at constant z distancesv(R, z) depends strongly on R (Figure 2). Fortunately, the situation is simplified considerably ifthe gravitational forces within a Galactic disk are dominated by a massive exponential disk. In thiscase, the vertical gradient in the rotation speed v(R, zh) is approximately constant for constantnormalized distances zh(R) = z(R)/hz(R) (Kalberla 2003). Flaring gas layers share a similar lag ifwe evaluate z distances of the layers normalized to scale height hz(R).
In Figure 9 we estimate v(R, zh) for a Milky Way mass distribution as advocated by Kalberlaet al. (2007). For CNM/WNM gas located one exponential scale height above midplane, we getv � −1.3 km s−1/scale height (red line). Previously, Hi observations were interpreted such thatin the inner part of the Milky Way corotation is present up to a z distance of 1 kpc (e.g., Dickey &Lockman 1990). Recent analyses of the VGPS and SGPS by Levine, Heiles & Blitz (2008) showa radically different picture. For 3 < R < 8 kpc, the vertical falloff in the rotation curve within
–100
–80
–60
–40
–20
0
2 4 8 16 32R (kpc)
CNM/WNM layerWIM layer: 1, 2 kpcHALO layer: 3, 4, 5 kpcLevine et al. (2008)Heald et al. (2007)Pidopryhora et al. (2007)Oosterloo et al. (2007)
v lag
(km
s–1
sca
le h
eigh
t–1)
Figure 9Vertical gradient in rotation velocity normalized to the vertical scale height. Red, gradient expected for theMilky Way Hi layer consisting of CNM/WNM gas compared with results by Levine, Heiles & Blitz (2008).Purple, gradient for the warm ionized medium at a local scale height of 1 and 2 kpc and observational resultsby Heald et al. (2007) from external galaxies. Blue, gradient for the halo layer at a local scale height of 3 to4 kpc. The data are derived from Pidopryhora et al. (2007) and Oosterloo, Fraternali & Sancisi (2007).
www.annualreviews.org • HI in the Milky Way 43
Ann
u. R
ev. A
stro
. Ast
roph
ys. 2
009.
47:2
7-61
. Dow
nloa
ded
from
ww
w.a
nnua
lrev
iew
s.or
gby
Uni
vers
ity o
f H
awai
i at M
anoa
Lib
rary
on
01/0
2/12
. For
per
sona
l use
onl
y.

ANRV385-AA47-02 ARI 15 July 2009 4:24
WIM: warm ionizedmedium
100 pc of the Galactic midplane is after all −22 ± 6 km s−1 kpc−1. For hz(R) ∼ 100 pc, this givesv ∼ 2.2 km s−1/scale height, a noticeable lag and within the uncertainties consistent with themodel.
Figure 9 includes estimates of v(R, zh) for the warm ionized medium (WIM) with scaleheights of 1 or 2 kpc ( purple). Measurements within the Milky Way are missing but Heald et al.(2007) derived v = 15 to 25 km s−1/scale height for the extraplanar diffuse ionized gas (EDIG)emission in three edge-on spiral galaxies. This value matches, within the uncertainties, the ex-pectations for a WIM scale height of hz(R�) ∼ 2 kpc, close to the most recent determination ofhz(R�) = 1830+120
−250 pc by Gaensler et al. (2008).Estimates for a lagging halo are included in Figure 9 for hz(R�) = 3, 4, and 5 kpc, respectively
(blue). We add, for comparison, v = 27 km s−1/scale height from Pidopryhora et al. (2007),assuming that the tip of the Ophiuchus superbubble with a distance of 3.4 kpc above the Galacticplane is located in the halo. The blue box in Figure 9 represents an estimate of the lagging halorotation in NGC 891 according to Oosterloo et al. (2007). These results are consistent with alocal halo scale height of hz ∼ 4 kpc for the halo Hi.
Disregarding the lagging halo rotation may lead to serious biases in the derived volume densitydistribution for the disk-halo interface (Kalberla et al. 2007, their figures 10–13). The currentlyavailable data are within the uncertainties consistent with the assumption that the vertical gradientin rotation velocity per unit scale height is dominated by gradients in the gravitational field ofthe Galactic disk. Influences from pressure gradients, magnetic fields, and viscosity terms appearnegligible, but it should be taken into account that the observational determination of v(R, zh)is difficult because rotational velocities and scale heights need to be determined independently.Useful data became available only very recently, and further improvements are needed for a moresophisticated treatment of the lagging halo problem.
4. THE GALACTIC ECOSYSTEM
Up to now we considered mostly global properties of the Milky Way Hi gas distribution, assuminga steady state with a hydrostatic equilibrium situation that depends predominantly on distance R.Such an equilibrium situation is characterized by the fact that the typical turbulent pressure ofthe gas is considerably larger than the thermal pressure, at the position of the Sun by about afactor of ten. Supernova explosions are predominantly responsible for the excess kinetic energy.Shock fronts trigger phase transitions of the gas phase and determine velocities and densities ofindividual cloud fragments. But the structure of the ISM affects also the evolution of the supernovaremnants. The interplay between supernovae and gas phase leads to feedback processes, eventuallyaffecting the generation of giant molecular cloud complexes and subsequent star formation. Herewe consider observational evidence for these highly dynamical processes.
4.1. Shells and Spurs
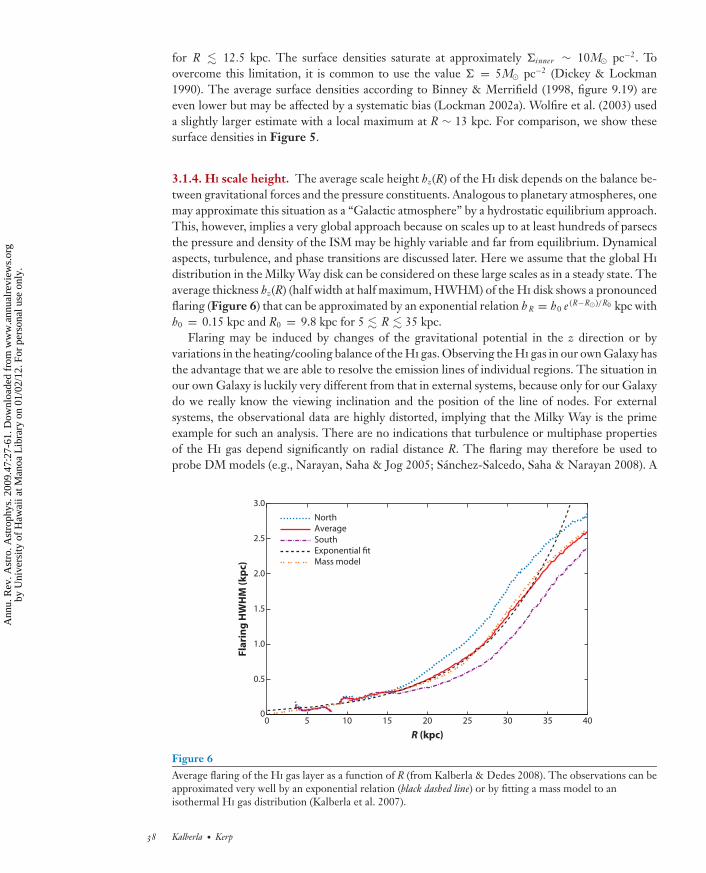
Figure 10 shows the volume density distribution along the Galactic plane at a constant distanceR = 15 kpc from the Galactic center derived from the LAB survey. For comparison see figure 2of Burton & te Lintel Hekkert (1986). Density concentrations at midplane and the Galactic warpare obvious. We used the first moment of the density distribution to define midplane and thesecond moment to determine the average dispersion of the gas in z direction; the white contoursenclose the flaring disk at a 3-σ level. This plot was derived from the LAB survey and includesHi gas at intermediate latitudes of −15◦ < b < 20◦. It would be highly desirable to have a betterspatial resolution for the derived density distribution, but numerous shells, spurs, and filamentsare recognizable even at this moderate resolution. The plot shows that huge density contrasts
44 Kalberla · Kerp
Ann
u. R
ev. A
stro
. Ast
roph
ys. 2
009.
47:2
7-61
. Dow
nloa
ded
from
ww
w.a
nnua
lrev
iew
s.or
gby
Uni
vers
ity o
f H
awai
i at M
anoa
Lib
rary
on
01/0
2/12
. For
per
sona
l use
onl
y.
ANRV385-AA47-02 ARI 15 July 2009 4:24
R = 15 kpc
z
100 0
Azimuth–100
6
4
2
0
–2
–4
–6
Figure 10Hi volume density distribution as a function of azimuth φ and distance z for R = 15 kpc. A logarithmictransfer function was chosen for n � 0.5 cm−3 to enhance low-density regions. The white curves indicatethe average scale height of the Hi gas layer at a 3-σ level and enclose the warped disk. Note that azimuthranges of −30◦ � φ � 30◦ are affected by the central bar; there are also ambiguities in the anticenter for150◦ � φ � 210◦.
can be associated with filaments. We have chosen a logarithmic transfer function to emphasizelow-level emission reaching up to distances of z ∼ 2 kpc.
The derivation of Figure 10 needs a sophisticated translation from observed brightness tem-peratures Tb (l, b, v) to densities n(R, z, φ), but Hi shells are also observable in l, b, v data cubes. Aninitial search for Hi shells in the northern sky was undertaken by Heiles (1979, 1984), and resultedin a compilation of 106 objects. Using LDS data for an automatic search, Ehlerova & Palous(2005) found nearly 600 shell structures and derived statistical properties for 300 shells in the sec-ond quadrant. Searches toward the southern sky are missing so far, except for the range coveredby the SGPS, where 19 new Hi shells have been detected by McClure-Griffiths et al. (2002).
Search criteria for shells are usually that there needs to be a local minimum in the emissionsurrounded by a dense thin wall that is expanding and approximately spherical. Shells are foundto be concentrated at midplane, 50% of them at |z| � 500 pc and they appear to be preferentiallylocated on the trailing edges of the spiral arms. The radial distribution can be approximated byan exponential law with a radial scale length of σs hell = 3+2
−1 kpc (Ehlerova & Palous 2005). This issomewhat larger than the scale length of the stellar disk, but note that it is easier to find shells inthe outer Galaxy than in the inner. The size distribution follows a power-law dN (rs h) = r−α
s h drs h
with α = 2.1 ± 0.4. About 5% of the volume is occupied by shells. It is believed that shells arecaused by supernovae and stellar winds that input 1051–1053 ergs of energy into the ISM.
Supernovae in the Milky Way occur at a frequency of 1.9 ( ± 1.1) events per century (Diehlet al. 2006). For a lifetime of ∼106 years, one expects ∼2 × 10⁴ remnants but far fewer areobserved. Koo, Kang & Salter (2006) argue that the missing shells remain undetected becauseof selection criteria and suggest that faint velocity wings seen in 21-cm line surveys at highforbidden velocities could be indicative of these objects. These are the wings that were discussedin Section 3.2.1 as caused by a population of fast moving clouds. Koo, Kang & Salter (2006),searching for identifications of the wings, were able to prove in one case that the high-velocitywing was due to gas blown off from the disk by a supernova. Subsequently, Kang & Koo (2007)studied 87 faint velocity wings and found coincidences with SNR in six additional cases, but for85% of the sources no identification could be derived.
www.annualreviews.org • HI in the Milky Way 45
Ann
u. R
ev. A
stro
. Ast
roph
ys. 2
009.
47:2
7-61
. Dow
nloa
ded
from
ww
w.a
nnua
lrev
iew
s.or
gby
Uni
vers
ity o
f H
awai
i at M
anoa
Lib
rary
on
01/0
2/12
. For
per
sona
l use
onl
y.

ANRV385-AA47-02 ARI 15 July 2009 4:24
Daigle, Joncas & Parizeau (2007) used neuronal networks to search for dynamical signatures ofexpanding bubbles in the CGPS. They got 7100 detections with a radial distribution as expectedfor an exponential disk but concluded that at most 23% of these objects could be associated withstellar progenitors. It is obvious that the detection rate is greatly enhanced if high-resolutionsurveys can be used but turbulence in the ISM is strong enough to cause serious confusion.
4.2. Dynamical Equilibrium
Supernovae trigger violent interactions that locally throw the ISM out of balance. However,observations suggest that supernova events happen frequently enough to support, on scales ofseveral kiloparsecs, a dynamical equilibrium. The question arises whether the Galactic ecosystemitself, considering all phases and the stellar component in interaction and in feedback, may beresponsible for this kind of equilibrium.
High-resolution 3D hydrodynamical simulations of the gas in the Milky Way, accounting forthe collective effects of supernovae on the structure of the ISM, have been performed for thefirst time by de Avillez (2000) and de Avillez & Berry (2001). The model considers explicitly theinput of energy and mass by isolated and correlated supernovae in the disk. Once disrupted bythe explosions, the disk never returns to its initial state. A dynamical equilibrium in the gas inclose agreement with the observations is reached after 80 Myear. The stability of the disk and thedisk-halo interface are directly related to the supernova rate. The model results in scale heightsand volume filling factors for the individual phases of the ISM that are in good agreement withthe observations. Filaments and spurs reaching z distances of several kiloparsecs do not contradictan equilibrium situation but are part of the ecosystem.
We plot in Figure 11 the local volume filling factors from a fit of the interstellar mediumby Kalberla & Dedes (2008), taking the average emission at both polar caps into account. Thefilling factors are derived for a medium that is assumed to be, on average, in turbulent pressureequilibrium. The distribution contains CNM and WNM, supplemented by a neutral halo medium
0
0.1
0.2
0.3
0.4
0.5
0.6
0.7
0.8
0 0.5 1.0 1.5 2.0 2.5
Vol
ume
fillin
g fa
ctor
z (kpc)
HIMNHMWIMWNMCNM
Figure 11Volume filling factors for the local interstellar medium as a function of z distance derived from a hydrostaticmodel fit (Kalberla & Dedes 2008).
46 Kalberla · Kerp
Ann
u. R
ev. A
stro
. Ast
roph
ys. 2
009.
47:2
7-61
. Dow
nloa
ded
from
ww
w.a
nnua
lrev
iew
s.or
gby
Uni
vers
ity o
f H
awai
i at M
anoa
Lib
rary
on
01/0
2/12
. For
per
sona
l use
onl
y.

ANRV385-AA47-02 ARI 15 July 2009 4:24
MM: molecularmedium
(NHM) embedded in the diffuse WIM and the hot 106 K plasma component (HIM) that dominatesthe halo at large z distances. Figure 11 is in good agreement with figure 5 of de Avillez (2000) butleads to some adjustments of the first calculations by McKee & Ostriker (1977). Filling factorsmay vary; the hydrodynamical simulations show a time dependence and, in general, we need toassume that there is some additional (unknown) dependence on R.
5. HI IN DIFFERENT PHASES
Neutral atomic hydrogen is an excellent tracer for the overall physical conditions within theGalactic ISM. Its abundance warrants that collisions are sufficiently frequent to populate theexcited level.
From the observational point of view, the neutral gas traced by the Hi 21-cm line comprises verydifferent temperature and density regimes. Using the temperature as a measure for the physicalstate of the gaseous phase, we “classically” differentiate between the molecular medium (MM;around 10 K), the CNM (up to 100 K), the WNM (a few thousand K), the WIM (104 K), andthe HIM (106 K). Also considering, the fact that a snapshot will reveal all these gaseous phasesobservable at the same time along many arbitrary lines of sight may suggest that there is someequilibrium arrangement. Pressure equilibrium appears essential, but we need to take into accountthat in addition to the well-known thermal gas pressure pth, magnetic pmag and cosmic-ray pressurepcr contributions are significant. The turbulent pressure pturb. may even be dominating in mostcases.
Each of these pressure components varies appreciably across the Milky Way disk and physicalconditions of the gas may change considerably. Studying neutral atomic hydrogen means first fo-cusing on the thermal pressure. If all the different gaseous phases are in equilibrium, the balance ofthe thermal pressure pth/k � nT [K cm−3] implies that the temperature T is inversely proportionalto the volume density n.
5.1. Milky Way Gas within Different Environments
Focusing on the neutral hydrogen only, we have empirical evidence that, for column densitiesin excess of NHI = 4 · 1020 cm−2, the transition from atomic to MM may happen (Reach, Koo& Heiles 1994; Heithausen et al. 2001). Toward these denser Hi clouds molecules of abundantspecies like 12CO and NH3 are observed. Molecular gas is also detectable toward much lower Hi
column densities (Richter, Sembach & Howk 2003), but not as a stable gas phase; it is most likelyproduced by temporal density and temperature fluctuations, far from equilibrium. As one of thegeneral characteristics of the cold gas phase, we mention volume densities of n > 101 cm−3, T <
100 K, and a local exponential vertical scale height above the Galactic plane of hz(R�) ∼ 150 pc.Temperature and density are strongly coupled in equilibrium considerations via the thermal gaspressure, which is about 2000 K cm−3 in the case of the CNM.
Depending on the ionizing stellar radiation field and the environmental conditions within theplane, the CNM clouds are embedded within warm, ionized and perhaps coronal gas. Verticallythe WNM is detectable across the whole sky with a 100% area filling factor. The WNM doesnot have a distinct internal cloud structure; it is diffuse and can be well approximated by agas layer. The local scale height is hz(R�) ∼ 400 pc. The WIM shows in the Wisconsin H-Alpha Mapper survey (Haffner et al. 2003) some distinct sources, but these are also super-posed on a diffuse background. In addition, dispersion measures from pulsar surveys clearlyprovide evidence for an “atmosphere” consisting of free electrons. The broadly used NE2001model (http://www.astro.cornell.edu/∼cordes/NE2001/) adopts a vertical scale height of about
www.annualreviews.org • HI in the Milky Way 47
Ann
u. R
ev. A
stro
. Ast
roph
ys. 2
009.
47:2
7-61
. Dow
nloa
ded
from
ww
w.a
nnua
lrev
iew
s.or
gby
Uni
vers
ity o
f H
awai
i at M
anoa
Lib
rary
on
01/0
2/12
. For
per
sona
l use
onl
y.

ANRV385-AA47-02 ARI 15 July 2009 4:24
1 kpc, but Gaensler et al. (2008) claim that this value is biased. Sight lines at low Galactic latitudesare contaminated by Hii regions and spiral arms. Disregarding such data, they revise the WIMscale height to hz(R�) = 1830+120
−250 pc.Finally, the HIM occupies the very neighborhood of active star-forming regions and a different
phase fills the Galactic halo. Within the Galactic halo we find an associated neutral hydrogen gasphase at a low filling factor. This neutral hydrogen is in dynamical equilibrium with the hot gasbut has to be considered as clumpy, a temporal phenomenon within the hot plasma (Pietz et al.1998, Kalberla 2003).
5.2. Heating and Cooling, and Static Equilibrium
The classical differentiation of the gaseous phases relies on a physical background that is de-termined by the heating and cooling processes within the ISM. The relevant physical heatingprocesses of the ISM are:
1. heating by low-energy cosmic rays (dense MM)2. photoelectric heating by grains (CNM to MM)3. photoelectric heating by photoionization of atoms and molecules (Hii regions)4. photoelectric heating by soft X-rays (WIM, WNM, CNM)5. chemical heating (dense MM)6. grain-gas thermal exchange (dense MM)7. hydrodynamic and magnetohydrodynamic heating (WNM, CNM)8. interstellar shocks (WNM, CNM, MM).
The list of heating processes compiled above indicates two important issues; first, the heating ofthe ISM is a function of position within the ISM and the properties of the ionizing source. Second,the efficiency of the heating depends on the physical and chemical conditions of the gas phase.Henceforward, we focus our discussion on the CNM and WNM, traced by the Hi emission line.
The discussion of cooling of the neutral hydrogen gas is much briefer. Because of the low volumedensities, we have to consider predominantly fine structure lines. These lines are observable in thefar infrared regime, with the most important cooling line of singly ionized carbon at λ 157.7 μm.Owing to its low ionization potential below 13.6 eV and its high abundance, carbon dominates thecooling of neutral gas traced by the Hi 21-cm line. Neutral oxygen is a coolant of less importancethan carbon for the warm neutral gas because of its lower abundance. Its contribution is significantwithin the Galactic plane.
For the atomic phase of the neutral ISM an equilibrium equation between heating and coolingcan be set up:
�pe + �X-ray = e, CII + H, CI + Lyα. (3)
Here �pe denotes the photoelectric heating by dust grains, �X-ray heating by soft X-rays, e,CII
fine structure-line cooling by collisions between electrons and ionized carbon ions, and H,CI
cooling by collisions between neutral hydrogen and neutral carbon atoms. Depending on thedepletion factor of carbon on dust grains, the cooling efficiency is a function of environmentalconditions.
In low volume density environments, n < 101 cm−3, typical for many CNM clouds, and theheating from the photoelectric effect on dust surfaces dominates over the X-ray heating by nearlyan order of magnitude. Its absolute value ranges around �pe ∼ 2×10⁻²⁶ ergs s−1 H−1 and increasesproportional to the volume density n. The heating by soft X-rays drops according to σ ∝ E− 8
3 cm3
with increasing n.
48 Kalberla · Kerp
Ann
u. R
ev. A
stro
. Ast
roph
ys. 2
009.
47:2
7-61
. Dow
nloa
ded
from
ww
w.a
nnua
lrev
iew
s.or
gby
Uni
vers
ity o
f H
awai
i at M
anoa
Lib
rary
on
01/0
2/12
. For
per
sona
l use
onl
y.

ANRV385-AA47-02 ARI 15 July 2009 4:24
At low volume densities, n < 1 cm−3; like toward high Galactic altitudes, cooling by Lyα photonsand the corresponding metastable transitions is important Lyα . In addition to this, the thin gascan be cooled by recombination of free electrons on dust surfaces. Both processes have nearlythe same cooling efficiency, ∼ 7 × 10⁻²⁷ ergs s−1 H−1. Above n = 1 cm−3, cooling by neutraloxygen and ionized carbon are of the same strengths and orders of magnitude more efficient thanLyα or recombination of electrons onto the dust surfaces. The cooling power of ionized carbonincreases with increasing n, while neutral oxygen drops rapidly with n. Neutral oxygen reachesa pronounced cooling peak around n = 1 cm−3 with OI ∼ 1 × 10⁻²⁶ ergs s−1 H−1 and dropsby an order of magnitude for n � 10 cm−3. Please note that all values are calculated assumingpressure equilibrium between all gaseous phases. According to this approach, density, pressure,and temperature are interrelated. The relevance of the different atomic species for cooling dependson the excitation potential (temperature) of the gas atoms.
Evaluating the different heating and cooling processes as a function of the volume density n,we find the characteristic tilted S-shape curve between pressure and volume density (Figure 12)(e.g., Wolfire et al. 1995a, their figures 4–7). This curve allows in low-pressure environments, forP/k ≤ 1000 K cm−3, only a single warm (low volume density) gas phase. A single gaseous phase isalso observable toward high pressure regions, P/k ≥ 8000 K cm−3. In between, we find pressureequilibrium between warm and cold gas. Stable phases can exist only for dP/dn > 0, and this impliesT � 300 K for the CNM and T � 5000 K for the WNM. For dP/dn < 0, or at intermediatetemperatures, the gas is considered to be unstable or transient. We denote this as the two-phasestructure of the interstellar medium, which is considered to be typical for clouds up to distancesof R � 18 kpc from the Galactic center and a few tens of kiloparsecs above the disk (Wolfire et al.1995a, 1995b, 2003). At larger radial distances the gas pressure decreases and one would expectthat the CNM ceases. Surprisingly this is not observed. From CGPS, SGPS, and VGPS data it canbe shown that the ratio of the emission to the absorption stays approximately constant with radiusto R ∼ 25 kpc (Dickey et al. 2009). This implies that the CNM to WNM mixture can be consideredas constant throughout the Galaxy. We have to stress here that the model considerations aboverepresent mostly a static view of the ISM, neglecting dynamical processes. Static models fail toexplain CNM gas far out in the Galactic disk.
Within the Galactic disk the pressure is higher, and we observe predominantly neutral cloudsthat are arranged within filamentary and sheet-like structures (Heiles & Troland 2003, Meyeret al. 2006). Toward volume densities in excess of n = 102 cm−3 photoionization of neutralcarbon exceeds the heating by soft X-rays and its efficiency increases constantly. However, thephotoelectric effect is more than an order of magnitude more efficient than the neutral carbonexcitation. On the cooling side of the equilibrium equation, the fine-structure transitions of neutralcarbon at λλ 609 μm and 370 μm become important but are about an order of magnitude lessefficient than the λ 157.7 λm transition.
5.3. Physical Conditions of the Neutral Interstellar MediumTraced by HI Observations
Starting from the comprehensive analyses of the LAB survey, we use the Haud & Kalberla (2007)plots to estimate the overall temperature and pressure distribution of the ISM. Their analysisprovides observational evidence for two phases of the neutral atomic hydrogen: a cold one witha velocity dispersion v = 4 km s−1 and a warm one with v � 24 km s−1. Heiles & Troland(2003) found a larger value for the CNM and a smaller one for the WNM, focusing on the Hi inthe Solar Neighborhood.
www.annualreviews.org • HI in the Milky Way 49
Ann
u. R
ev. A
stro
. Ast
roph
ys. 2
009.
47:2
7-61
. Dow
nloa
ded
from
ww
w.a
nnua
lrev
iew
s.or
gby
Uni
vers
ity o
f H
awai
i at M
anoa
Lib
rary
on
01/0
2/12
. For
per
sona
l use
onl
y.

ANRV385-AA47-02 ARI 15 July 2009 4:24
In the following, we will use the Haud & Kalberla (2007) values, which represents the wholeaccessible sky without biasing too much to local effects. Using the equation,
Tkin ≤ mHv
8 k ln 2, (4)
we can estimate the upper limit for the kinetic temperature to 300 K for the CNM and 10,000 K forthe WNM. Both phases are frequently observed simultaneously across the whole sky, but do theytrace coherent physical structures? The answer is certainly yes for high Galactic altitude clouds,IVCs, and HVC complexes, but for low altitudes this answer has to be reconsidered critically.
First, we estimate the so-called size-linewidth relation to estimate the linear size of the gaseousphases. The size-linewidth relation assumes that, proportional to the length of the line of sightthrough a gas layer, the Hi emission line grows in line width. To apply this relation we haveto use a “normalization factor” denoted as σ (1) in literature. Following Wolfire et al. (2003),σCNM(1) = 1.2 km s−1, σWNM(1) = 1.4 km s−1, and
d =(
σ
σ (1)
) 1q, (5)
where σ denotes the FWHM of the Gaussian line that approximates the observed Hi emissionline. This gives σCNM = 4 km s−1
2√
2 ln 2� 1.6 km s−1 and σWNM = 9.4 km s−1. q = 0.33 (Larson 1981) is
a frequently used parameter over a length range from 1 to 1000 pc (see Wolfire et al. 2003). Wefind as a rough estimate for the relevant linear extent dCNM ∼ 3 pc for the CNM and dWNM ∼660 pc for the WNM. In the case of the CNM, we can safely denote coherent structures inposition, velocity, and temperatures as “clouds”, whereas the WNM structures appear to coverlinear scales comparable to the scale height of the warm gas distribution (see Section 3.2.2). Towardlow Galactic latitudes and, in particular, toward the inner Galaxy the line of sight passes multipleWNM cells, whereas toward high Galactic latitudes the number of WNM turbulence cells is lowand local effects dominate.
We conclude that within the plane of the Milky Way CNM clouds are mostly embedded withina bath of WNM gas. This picture has two important implications. The CNM has a much lowervolume and area filling factor than the WNM, and the density contrast between the spiral-armand interarm regions is low because of the large size of the WNM structures in comparison totheir separation.
Now we focus on cooling time and volume densities. Theoretically, we can estimate the coolingtime of both gaseous phases by:
tcool = 52
1.1 nkTn2
, (6)
where n is the volume density of all hydrogen species n = nHI + nH+ + 2nH2 . Considering lowGalactic altitude clouds with neutral hydrogen column densities of NHI ≤ 1 · 1020 cm−2, we cansafely assume that n � nHI. Inserting = 6 ·10−26 ergs s−1 cm−3 ×( T
10.000 K
)0.8 (Wolfire et al. 2003)yields
tcool � 460 yrT[K]
n[cm−3]. (7)
With
nCNM = NHI(CNM)dCNM
� 1 · 1020 cm−3
dCNM= 5.4 cm−3 (8)
and TCNM = 300 K, we find tcool(CNM) = 1.4 · 105 year. For the WNM we find with NHI =2 · 1020 cm−2 an average volume density of nWNM = 0.1 cm−3. This yields a cooling time oftcool(WNM) = 4.6 · 107 year. Obviously, the CNM cools quickly, whereas the WNM needs about
50 Kalberla · Kerp
Ann
u. R
ev. A
stro
. Ast
roph
ys. 2
009.
47:2
7-61
. Dow
nloa
ded
from
ww
w.a
nnua
lrev
iew
s.or
gby
Uni
vers
ity o
f H
awai
i at M
anoa
Lib
rary
on
01/0
2/12
. For
per
sona
l use
onl
y.

ANRV385-AA47-02 ARI 15 July 2009 4:24
two orders of magnitudes longer. The sound crossing time for the CNM, ts(C NM ) � 2 · 106 yearand WNM ts(C NM ) � 7 · 107 year differ also by an order of magnitude. So the CNM relaxesmuch more quickly than the WNM.
These internal timescales should be compared with those that are relevant for heating on largescales, which can mainly be attributed to the frequency of supernova events within the plane of theMilky Way. Wolfire et al. (2003) estimated the temporal separation between subsequent shocksto tshock � 5.3 · 106 year. Thus, the WNM close to the stellar disk is not expected to be observedin any kind of equilibrium, while the CNM may reach quickly a pressure equilibrium with itsenvironment. This implies that we observe frequently CNM gas embedded within WNM gas.Pressure distortions within the WNM will lead to density fluctuations that may form on timescalesof a few 105 years CNM cores within the WNM cell.
Using the numbers above for the volume densities and the upper limits for the kinetic temper-ature of the gas, we can estimate the thermal pressure of the CNM to PCNM/k � 1600 cm−3 Kand for the WNM PWNM/k � 1000 cm−3 K. Both are rough estimates but differ by less thana factor of two. Jenkins & Tripp (2007) determined a very accurate value of 2700 cm−3 Kfor the thermal pressure by studying the fine-structure level population of carbon. Consistentwith the discussion above, Jenkins & Tripp (2007) pointed out that changes in thermal pres-sure occur on small scales. Using the carbon data, they constrain the size of the cooling coresto about 50 AU. The cooling occurs on timescales much shorter than the thermal equilibriumtimescale.
In summary, the often assumed thermal pressure equilibrium is an oversimplification of theobserved situation. The physical conditions within the clouds are very different but it is likely,because of the very different cooling timescales, we can observe CNM filaments and sheets asso-ciated with WNM gas with comparable bulk velocities. The CNM filaments or CNM cores areformed within the WNM because of density distortions. The cooling occurs first on linear scalesof a few tens of astronomical units forming multiple cores. When cooling, these cores assembleto filaments or sheets on scales of a few parsecs and timescales of 105 years. Accordingly, CNMclouds can be considered to be in pressure equilibrium within the ambient WNM.
The gaseous WNM structures have typical sizes of about 600 pc, comparable to the observedscale height of the gas layer. The large extent of these WNM cells and, more important, thelong cooling time [tcool.(WNM) ∼ 10 × tshock(SNR)] imply for the WNM a small volume densitycontrast between spiral arms and interarm regions. Here, we assume four spiral arms and shockexcitation of the WNM by density waves every ∼108 years, which is 2 × tcool. (WNM).
5.4. Two HI Phases in a Turbulent Flow
Following the discussion above, it is common to assume some kind of equilibrium, mostlydominated by thermal effects. This allows the determination of column densities and the thermalpressure. Within a limited range of pressure Pmax < 3 × Pmin, with Pmin � 2000 K cm−3 (Heiles2007), a two phase cloudy structure is formed consisting of a cold core and an envelope of warmneutral gas. At first glance, this picture appears to describe the observed situation well, consistentwith the best values of the relevant physical parameters for heating and cooling (Wolfire et al.1995a, 1995b, 2003). However, Hi-line data show increasing evidence that this picture needs to berevised.
Accurate temperatures and volume densities of Hi clouds need to be determined by absorptionmeasurements (Dickey & Lockman 1990). Using a sufficiently strong background source beyondthe Hi cloud, the excitation temperature can be derived from on-source absorption profiles incomparison with off-source positions that define the expected background emission. In the most
www.annualreviews.org • HI in the Milky Way 51
Ann
u. R
ev. A
stro
. Ast
roph
ys. 2
009.
47:2
7-61
. Dow
nloa
ded
from
ww
w.a
nnua
lrev
iew
s.or
gby
Uni
vers
ity o
f H
awai
i at M
anoa
Lib
rary
on
01/0
2/12
. For
per
sona
l use
onl
y.

ANRV385-AA47-02 ARI 15 July 2009 4:24
simple two-component case we observe
TB = TS(1 − e−τ ) + Tbge−τ . (9)
Here, TS is the spin temperature of the cloud with an optical depth τ . Tbg is the backgroundtemperature, which is observable without the cloud in the foreground, and we neglect additionalforeground Hi emission. To resolve cloud structures, high sensitivity and high resolution areneeded. A combination of an interferometer with a large single-dish is most appropriate to separatethe clumpy CNM from the diffuse background (Kalberla, Schwarz & Goss 1985). From suchanalyses, the evidence emerged that there is not the expected separation in a cold and warm phase.The most recent observations with the Arecibo telescope (Heiles 2001, Heiles & Troland 2003)show unambiguously that 50% of the gas is located in the “unstable region” of the phase diagram.
Numerical investigations incorporating turbulence and other nonthermal effects suggest that,in agreement with these observational findings, a considerable fraction of the Hi gas is transient(Vazquez-Semadeni, Gazol & Scalo 2000; Gazol et al. 2001). The nonlinear development of athermal instability generates turbulence, which in turn affects the initial flow. The two phases getstrongly mixed, and the turbulent motions induce transitions of the gas to the unstable range.These effects get more pronounced for stronger turbulence. Transitions into the unstable range,driving, in particular, gas into the cold phase, should be important whenever the kinetic energyexceeds the thermal energy. Perhaps turbulence can explain the findings of Dickey et al. (2009)that the CNM/WNM mixture remains nearly constant to R ∼ 25 kpc.
5.4.1. Warm and cold gas at high galactic altitudes. Outside the plane of the disk, forz > 100 pc, the composition of the neutral hydrogen gas is different. Far from the stellar disk,the metalicity of the dominant WNM gas and the dust content is lower. The low metalicitieslower the cooling efficiency of the gas, while the lower dust content lowers the heating efficiency.High Galactic altitude clouds are exposed to the extragalactic radiation field and the radiation ofthe Galactic X-ray halo (Pietz et al. 1998, Kerp et al. 1999), which itself ionizes very efficientlythe low volume density regions by their soft X-ray radiation. This is because the photoelectricabsorption cross section σ of the ISM is a strong function of the photon energy with σ ∝ E− 8
3
(Wilms et al. 2000). The Milky Way halo gas with a plasma temperature around T � 106.15 K ion-izes the neutral gas much more efficiently than the steep power-law spectrum of the extragalacticX-ray background. Above photon energies of 280 eV, metals dominate the photoelectric ab-sorption, whereas below this carbon K-shell ionization level hydrogen and helium are the mainphotoelectric absorbers (Wilms et al. 2000).
5.4.2. Column density structure of high galactic altitude clouds. Neutral clouds within thedisk-halo interface (z ∼ 1-2 kpc) show up with cold cores and warm enveloping gas. This two-phasestructure is observed toward all IVCs and the bulk of the HVCs (Kalberla & Haud 2006, Haud2008). Cores have on average larger infall velocities than envelopes. HVCs, in comparison toIVCs, not only have higher velocities but are also smaller and have fainter cores. Their envelopesshow also a larger velocity dispersion (Haud 2008).
The gaseous disk-halo interface differs from the two-phase structure discussed in the previousSection. The “rims” of the HVCs with distances of at least a few kiloparsecs are not characterizedby sharp cut-offs of the column density distribution at a certain column density threshold, asshown, e.g., by Bruns et al. (2005) for the Magellanic Stream and Leading Arm. This is consistentwith the finding that the average X-ray photon spectrum rises steeply with increasing X-ray photonenergy (Gilli, Comastri & Hasinger 2007). The steep rise of the extragalactic X-ray spectrum tohigh X-ray photon energies yields a deficit of soft X-ray photons. These are, however, the most
52 Kalberla · Kerp
Ann
u. R
ev. A
stro
. Ast
roph
ys. 2
009.
47:2
7-61
. Dow
nloa
ded
from
ww
w.a
nnua
lrev
iew
s.or
gby
Uni
vers
ity o
f H
awai
i at M
anoa
Lib
rary
on
01/0
2/12
. For
per
sona
l use
onl
y.
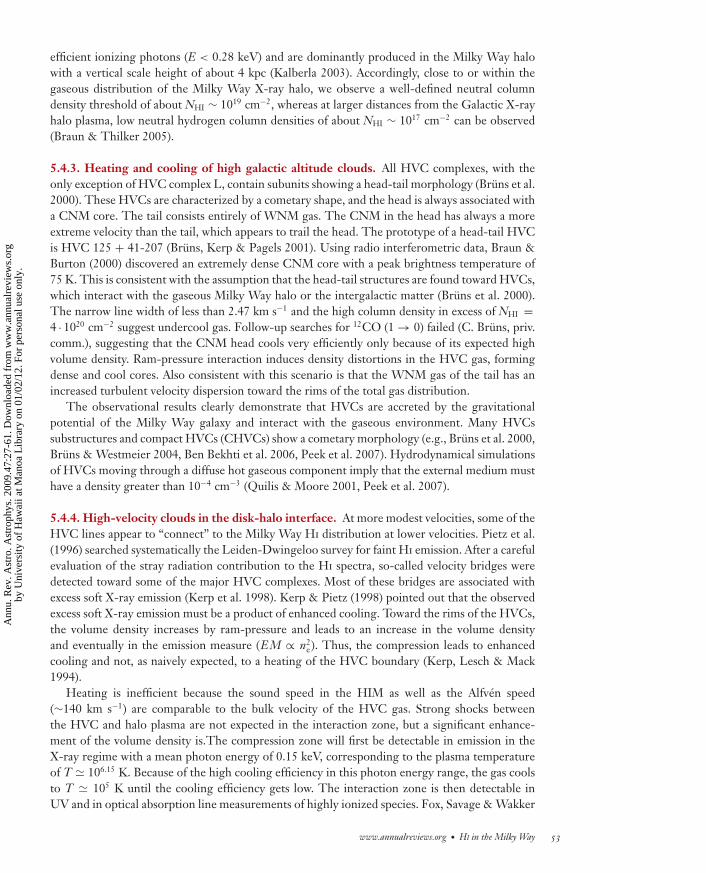
ANRV385-AA47-02 ARI 15 July 2009 4:24
efficient ionizing photons (E < 0.28 keV) and are dominantly produced in the Milky Way halowith a vertical scale height of about 4 kpc (Kalberla 2003). Accordingly, close to or within thegaseous distribution of the Milky Way X-ray halo, we observe a well-defined neutral columndensity threshold of about NHI ∼ 1019 cm−2, whereas at larger distances from the Galactic X-rayhalo plasma, low neutral hydrogen column densities of about NHI ∼ 1017 cm−2 can be observed(Braun & Thilker 2005).
5.4.3. Heating and cooling of high galactic altitude clouds. All HVC complexes, with theonly exception of HVC complex L, contain subunits showing a head-tail morphology (Bruns et al.2000). These HVCs are characterized by a cometary shape, and the head is always associated witha CNM core. The tail consists entirely of WNM gas. The CNM in the head has always a moreextreme velocity than the tail, which appears to trail the head. The prototype of a head-tail HVCis HVC 125 + 41-207 (Bruns, Kerp & Pagels 2001). Using radio interferometric data, Braun &Burton (2000) discovered an extremely dense CNM core with a peak brightness temperature of75 K. This is consistent with the assumption that the head-tail structures are found toward HVCs,which interact with the gaseous Milky Way halo or the intergalactic matter (Bruns et al. 2000).The narrow line width of less than 2.47 km s−1 and the high column density in excess of NHI =4 · 1020 cm−2 suggest undercool gas. Follow-up searches for 12CO (1 → 0) failed (C. Bruns, priv.comm.), suggesting that the CNM head cools very efficiently only because of its expected highvolume density. Ram-pressure interaction induces density distortions in the HVC gas, formingdense and cool cores. Also consistent with this scenario is that the WNM gas of the tail has anincreased turbulent velocity dispersion toward the rims of the total gas distribution.
The observational results clearly demonstrate that HVCs are accreted by the gravitationalpotential of the Milky Way galaxy and interact with the gaseous environment. Many HVCssubstructures and compact HVCs (CHVCs) show a cometary morphology (e.g., Bruns et al. 2000,Bruns & Westmeier 2004, Ben Bekhti et al. 2006, Peek et al. 2007). Hydrodynamical simulationsof HVCs moving through a diffuse hot gaseous component imply that the external medium musthave a density greater than 10−4 cm−3 (Quilis & Moore 2001, Peek et al. 2007).
5.4.4. High-velocity clouds in the disk-halo interface. At more modest velocities, some of theHVC lines appear to “connect” to the Milky Way Hi distribution at lower velocities. Pietz et al.(1996) searched systematically the Leiden-Dwingeloo survey for faint Hi emission. After a carefulevaluation of the stray radiation contribution to the Hi spectra, so-called velocity bridges weredetected toward some of the major HVC complexes. Most of these bridges are associated withexcess soft X-ray emission (Kerp et al. 1998). Kerp & Pietz (1998) pointed out that the observedexcess soft X-ray emission must be a product of enhanced cooling. Toward the rims of the HVCs,the volume density increases by ram-pressure and leads to an increase in the volume densityand eventually in the emission measure (E M ∝ n2
e). Thus, the compression leads to enhancedcooling and not, as naively expected, to a heating of the HVC boundary (Kerp, Lesch & Mack1994).
Heating is inefficient because the sound speed in the HIM as well as the Alfven speed(∼140 km s−1) are comparable to the bulk velocity of the HVC gas. Strong shocks betweenthe HVC and halo plasma are not expected in the interaction zone, but a significant enhance-ment of the volume density is.The compression zone will first be detectable in emission in theX-ray regime with a mean photon energy of 0.15 keV, corresponding to the plasma temperatureof T � 106.15 K. Because of the high cooling efficiency in this photon energy range, the gas coolsto T � 105 K until the cooling efficiency gets low. The interaction zone is then detectable inUV and in optical absorption line measurements of highly ionized species. Fox, Savage & Wakker
www.annualreviews.org • HI in the Milky Way 53
Ann
u. R
ev. A
stro
. Ast
roph
ys. 2
009.
47:2
7-61
. Dow
nloa
ded
from
ww
w.a
nnua
lrev
iew
s.or
gby
Uni
vers
ity o
f H
awai
i at M
anoa
Lib
rary
on
01/0
2/12
. For
per
sona
l use
onl
y.

ANRV385-AA47-02 ARI 15 July 2009 4:24
(2006) find, from the analysis of 63 extragalactic lines of sight, evidence for a spatial displacementbetween the neutral HVC gas and the highly ionized species. They suggest that the Hi of theHVCs exists in a separate lower temperature phase than the observed Ovi gas. Depending on thelocal conditions of the compression zone (mainly determined by the volume density), the interfaceregion between the HVC and the HIM is expected to appear very patchy.
5.4.5. Thermal equilibrium of HI clumps in the disk-halo interface. Two regions with haloclumps in the outer part of the Milky Way have been mapped at high resolution (Dedes 2008).These clumps belong to a larger sample with properties typical for the clump population dis-cussed in Section 3.2.1. Distances were estimated from the rotation curve to 13 � R � 15 kpc and2.5 � |z| � 4 kpc. Effelsberg spectra show in both cases a pronounced two-phase structure with acold Hi core and an extended warm envelope, but at 9 arcmin resolution the clumps appear to be un-resolved. At high angular resolution, obtained by VLA and WSRT observations, the cores fragmentinto a number of clumps with typical sizes of 2–5 pc. These cores are found to have pressures thatare close to the pressures estimated for the Hi envelopes. From the Bonn halo model (Pietz et al.1998, Kalberla & Dedes 2008) there is, in addition, a pressure equilibrium with a surrounding HIM.
Individual clumps appear to be arranged in groups with a filamentary structure. Within sucha group the center velocities of individual clumps differ by no more than the mean FWHMlinewidths. The pressures of individual clumps show random fluctuations of 25% to 40%, butthis is close to the expected observational uncertainties. Figure 12 shows the location of clumpsand cores within the Wolfire et al. (2003) phase diagram. The clumps have temperatures of150 � Tkin � 700 K, indicating that they are transient. The Hi envelope protects the clumps fromevaporation but the lifetime of the clumps is in the range of 0.4 to 0.8 Myears.
102
103
104
10–1 100 101 102 103
5 kpc
8.5 kpc
11 kpc
15 kpc
17 kpc
18 kpc
VLA
WSRT -68
WSRT -84
Env WSRT
Env VLA
P k–1
[Kcm
–3]
n [cm–3]
Figure 12Pressure versus volume density for Hi halo clumps and envelopes (Env) at 13 � R � 15 kpc and 2.5 �|z| � 4 kpc (Dedes 2008). The kinetic temperatures of the clumps are in the range of 150 � Tkin � 700 K.The Figure was kindly provided by L. Dedes.
54 Kalberla · Kerp
Ann
u. R
ev. A
stro
. Ast
roph
ys. 2
009.
47:2
7-61
. Dow
nloa
ded
from
ww
w.a
nnua
lrev
iew
s.or
gby
Uni
vers
ity o
f H
awai
i at M
anoa
Lib
rary
on
01/0
2/12
. For
per
sona
l use
onl
y.
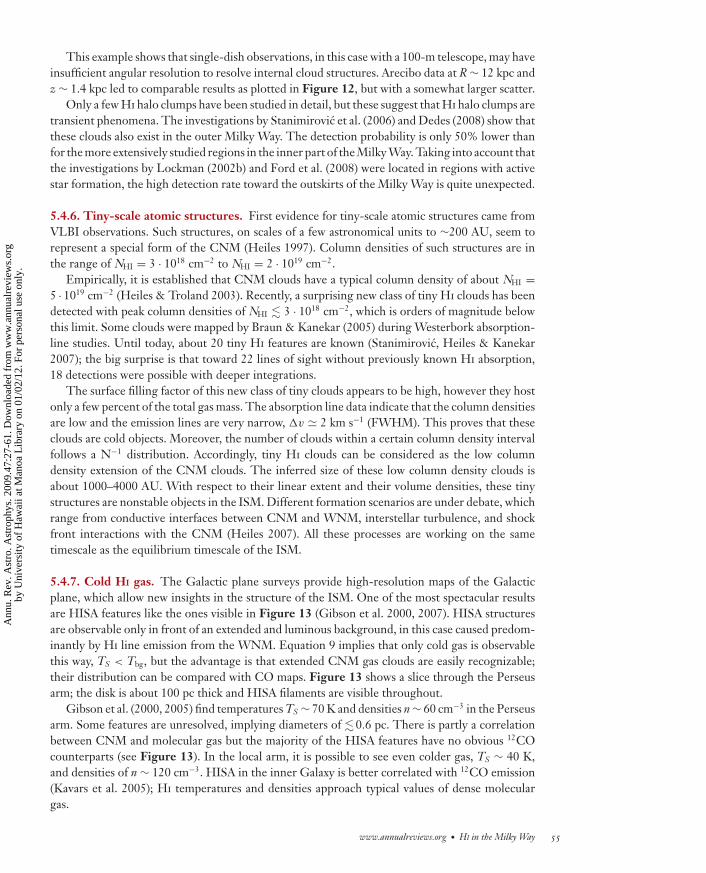
ANRV385-AA47-02 ARI 15 July 2009 4:24
This example shows that single-dish observations, in this case with a 100-m telescope, may haveinsufficient angular resolution to resolve internal cloud structures. Arecibo data at R ∼ 12 kpc andz ∼ 1.4 kpc led to comparable results as plotted in Figure 12, but with a somewhat larger scatter.
Only a few Hi halo clumps have been studied in detail, but these suggest that Hi halo clumps aretransient phenomena. The investigations by Stanimirovic et al. (2006) and Dedes (2008) show thatthese clouds also exist in the outer Milky Way. The detection probability is only 50% lower thanfor the more extensively studied regions in the inner part of the Milky Way. Taking into account thatthe investigations by Lockman (2002b) and Ford et al. (2008) were located in regions with activestar formation, the high detection rate toward the outskirts of the Milky Way is quite unexpected.
5.4.6. Tiny-scale atomic structures. First evidence for tiny-scale atomic structures came fromVLBI observations. Such structures, on scales of a few astronomical units to ∼200 AU, seem torepresent a special form of the CNM (Heiles 1997). Column densities of such structures are inthe range of NHI = 3 · 1018 cm−2 to NHI = 2 · 1019 cm−2.
Empirically, it is established that CNM clouds have a typical column density of about NHI =5 · 1019 cm−2 (Heiles & Troland 2003). Recently, a surprising new class of tiny Hi clouds has beendetected with peak column densities of NHI � 3 · 1018 cm−2, which is orders of magnitude belowthis limit. Some clouds were mapped by Braun & Kanekar (2005) during Westerbork absorption-line studies. Until today, about 20 tiny Hi features are known (Stanimirovic, Heiles & Kanekar2007); the big surprise is that toward 22 lines of sight without previously known Hi absorption,18 detections were possible with deeper integrations.
The surface filling factor of this new class of tiny clouds appears to be high, however they hostonly a few percent of the total gas mass. The absorption line data indicate that the column densitiesare low and the emission lines are very narrow, v � 2 km s−1 (FWHM). This proves that theseclouds are cold objects. Moreover, the number of clouds within a certain column density intervalfollows a N−1 distribution. Accordingly, tiny Hi clouds can be considered as the low columndensity extension of the CNM clouds. The inferred size of these low column density clouds isabout 1000–4000 AU. With respect to their linear extent and their volume densities, these tinystructures are nonstable objects in the ISM. Different formation scenarios are under debate, whichrange from conductive interfaces between CNM and WNM, interstellar turbulence, and shockfront interactions with the CNM (Heiles 2007). All these processes are working on the sametimescale as the equilibrium timescale of the ISM.
5.4.7. Cold HI gas. The Galactic plane surveys provide high-resolution maps of the Galacticplane, which allow new insights in the structure of the ISM. One of the most spectacular resultsare HISA features like the ones visible in Figure 13 (Gibson et al. 2000, 2007). HISA structuresare observable only in front of an extended and luminous background, in this case caused predom-inantly by Hi line emission from the WNM. Equation 9 implies that only cold gas is observablethis way, TS < Tbg, but the advantage is that extended CNM gas clouds are easily recognizable;their distribution can be compared with CO maps. Figure 13 shows a slice through the Perseusarm; the disk is about 100 pc thick and HISA filaments are visible throughout.
Gibson et al. (2000, 2005) find temperatures TS ∼ 70 K and densities n ∼ 60 cm−3 in the Perseusarm. Some features are unresolved, implying diameters of �0.6 pc. There is partly a correlationbetween CNM and molecular gas but the majority of the HISA features have no obvious 12COcounterparts (see Figure 13). In the local arm, it is possible to see even colder gas, TS ∼ 40 K,and densities of n ∼ 120 cm−3. HISA in the inner Galaxy is better correlated with 12CO emission(Kavars et al. 2005); Hi temperatures and densities approach typical values of dense moleculargas.
www.annualreviews.org • HI in the Milky Way 55
Ann
u. R
ev. A
stro
. Ast
roph
ys. 2
009.
47:2
7-61
. Dow
nloa
ded
from
ww
w.a
nnua
lrev
iew
s.or
gby
Uni
vers
ity o
f H
awai
i at M
anoa
Lib
rary
on
01/0
2/12
. For
per
sona
l use
onl
y.

ANRV385-AA47-02 ARI 15 July 2009 4:24
Galactic longitude
Gal
acti
c la
titu
de
Brightness temperature (K)
Velocity: –40.21 km s–1
141˚ 140˚ 139˚ 138˚ 137˚
120
100
80
60
40
+3˚
+2˚
+1˚
0˚
–1˚
Figure 13Sample of Hi self-absorption features within the Galactic plane from the Canadian Galactic Plane Survey(Gibson et al. 2000, 2007). Cold Hi gas shows up in absorption against the extended WNM background.Superposed are yellow contours for CO emission (Heyer et al. 1998). The gas is located at a distance of∼2 kpc and belongs to the Perseus spiral arm. The Figure was kindly provided by S. Gibson.
Evidence for cold CNM gas was reported also by Dickey et al. (2003) from the SGPS. Theyfind a median temperature of 65 K. Clouds at temperatures of 40 K are common, but most of theCNM is warmer (40–100 K). Heiles & Troland (2003), using the Arecibo telescope for absorptionmeasurements against continuum sources, find a similar result. Their CNM temperature diagrampeaks at 40 K with a median at 48 K. This sample includes continuum sources at high Galacticlatitudes. They find that the local CNM gas for |b | > 10◦ does not show significant differencesfrom gas located in the plane of the disk. In summary, the high-resolution survey work within thepast decade has shown that very cold Hi gas (Knapp & Verschuur 1972) is not that exceptional, aswas believed before.
6. SUMMARY AND OUTLOOK
We live in a marvelous era for 21-cm astronomy. Within the past decade new surveys and newinstruments provided a rich wealth of data with unprecedented quality. These are single-dish
56 Kalberla · Kerp
Ann
u. R
ev. A
stro
. Ast
roph
ys. 2
009.
47:2
7-61
. Dow
nloa
ded
from
ww
w.a
nnua
lrev
iew
s.or
gby
Uni
vers
ity o
f H
awai
i at M
anoa
Lib
rary
on
01/0
2/12
. For
per
sona
l use
onl
y.

ANRV385-AA47-02 ARI 15 July 2009 4:24
all-sky surveys (LAB: LDS and IAR) as well as interferometer surveys in the Galactic plane (GPS:CGPS, SGPS, and VGPS). As important as the surveys are, it’s the sophisticated data processingprocedures that led to major improvements in precision and reliability of the available databases.It is a symbiosis of hardware and software that led to major improvements, not to mention manypeople who dedicated their work to survey projects!
In the near future, even better single-dish surveys will become available. In the first place wemention the Parkes Galactic All Sky Survey (GASS), observed with a 13-beam receiver, coveringdeclinations δ � 0◦ with a resolution of 16 arcmin. The first release is expected early in 2009.A significantly better resolution of 3.4 arcmin is provided by the Arecibo telescope (GALFA-HIsurvey) for −2◦ < δ < +38◦; observations are still in progress. Last, and not least, the Effelsbergtelescope will survey the northern sky δ > 0◦ with a 7-beam receiver at a resolution of 9 arcmin(EBHIS). The new all-sky surveys will allow significant improvements in sensitivity and resolution,but it needs to be pointed out that older databases like the LAB survey do not get obsolete. RFIcontamination or other systematic errors may be detectable only by cross checking differentdatabases. It is essential to have independent databases for comparison!
The major scientific achievements of these fully-sampled Hi surveys will be manyfold. Theywill provide the databases that are necessary to compile complete and consistent physical models ofthe Hi in the ISM. Because Hi is a unique tracer for the physical conditions of all gaseous phases, itis the key to studying the evolution of the ISM in the Milky Way as a whole. Today, we are still facedwith inconsistencies concerning the multiphase structure of the ISM. There is increasing evidencethat a significant portion of the interstellar gas is not in a stable equilibrium. The cooler the gas,the quicker it can reach a pressure equilibrium with its environment. However, as demonstratedin Section 5.3, the overall distributed WNM appears to be out of equilibrium almost everywhereacross the Milky Way. According to this, observing two or more phases along similar lines ofsight at comparable bulk velocities with similar properties does not imply necessarily a physicalequilibrium of the observed gaseous phases.
Applying such a dynamical view of the interstellar gas to HVCs, IVCs, and the gas in theGalactic plane appears to be an attractive and physically supported alternative to some of thepresent-day models of the ISM. The disadvantage of the dynamical view of the ISM is its com-plexity when focusing on the astronomical unit and parsec scale. Here, dynamical processes areexpected to dominate. Only on the largest scales may we average across a variety of physicalconditions to derive global equilibrium parameters like temperature, pressure, density, and scaleheight.
The new Milky Way Hi surveys will open for X-ray astronomers a window to the early universe.Future X-ray observatories will have a significant fraction of their detection power in the softX-ray energy range below 1 keV. The emission of active Galactic nuclei at high redshifts (z ∼ 10)or the faint emission of clusters of galaxies at moderate redshifts (3 � z � 5) is shifted to this softX-ray band. It is not possible to analyze the X-ray data quantitatively without knowing in detailthe distribution of the Galactic ISM. This is because of the large photoelectric absorption crosssection of the ISM that follows σ ∝ E− 8
3 . The softer the X-ray radiation of interest, the larger theattenuation of the X-rays by the Galactic ISM.
We need to overcome the present situation in which X-ray astronomy is focused predomi-nantly on two low-Hi column density windows of the Milky Way. For a better census and toovercome the “cosmic conspiracy,” it is necessary to open the whole high Galactic latitude skyto X-ray astronomy. The Parkes and Effelsberg surveys will provide ideal databases to determinequantitatively the distribution of the WNM, which determines mainly the opacity of the ISM forsoft X-rays. Only for high Galactic latitude CNM clouds is higher angular resolution necessaryto correct for the additional photoelectric absorption.
www.annualreviews.org • HI in the Milky Way 57
Ann
u. R
ev. A
stro
. Ast
roph
ys. 2
009.
47:2
7-61
. Dow
nloa
ded
from
ww
w.a
nnua
lrev
iew
s.or
gby
Uni
vers
ity o
f H
awai
i at M
anoa
Lib
rary
on
01/0
2/12
. For
per
sona
l use
onl
y.

ANRV385-AA47-02 ARI 15 July 2009 4:24
The detailed knowledge of the column density distribution of the neutral atomic hydrogen ofthe Milky Way is also essential to disclose the distribution of the dominant fraction of the baryonicmatter in the Universe. Following the CDM cosmological model, the bulk of the local baryonsis so far undetected. These baryons are expected to belong to the warm-hot intergalactic medium(WHIM) with temperatures of a few 106 K. The emission of this thin hot plasma is detectableonly in the very soft X-ray range below 0.2 keV. Here, photoelectric absorption by the Milky WayISM absorbs up to 90% of the incident radiation. Only the accurate knowledge of Hi columndensities allows to correct for this absorption to unravel the distribution of the WHIM plasma,which illuminates the “spider-web” structures connecting the individual clusters of galaxies in thelocal Universe.
The mapping of the Galactic plane with interferometers is still in progress. Future technologicalprogress is expected from new correlator techniques and focal-plane phased arrays may eventuallylead to a major increase of the survey speed. In any case the Square Kilometer Array (SKA) will bea major leap forward, allowing at the same time high resolution and high sensitivity. The technicalchallenges of present-day radio astronomy make it necessary to establish mitigation strategies withthe aim to overcome the pollution of the cosmic signals by RFI. Modern surveys already use someof the technology that is needed in the near future by the SKA.
What are the scientific benefits of these achievements? Improved sensitivity and reliability donot need to be discussed but major breakthroughs are to be expected from increases in spatialresolution. Mapping of the CNM, but also of cloud features located in the Galactic halo, needhigh spatial resolution. This is also essential if we like to correlate 21-cm maps with optical orinfrared observations. Space-based parallax surveys (GAIA) will measure distances out to tensof kiloparsecs, enabling improved distance determinations within the Milky Way for a betterunderstanding of the Hi distribution in the Milky Way.
DISCLOSURE STATEMENT
The authors are not aware of any affiliations, memberships, funding, or financial holdings thatmight be perceived as affecting the objectivity of this review.
ACKNOWLEDGMENTS
P.K. acknowledges support from Deutsche Forschungsgemeinschaft, grant KA1265/5, J.K. fromgrant KE757/7. We thank Leonidas Dedes, Steve Gibson, and Benjamin Winkel for preparingfigures for this review, and Butler Burton, Ralf-Jurgen Dettmar, John Dickey, Steve Gibson, CarlHeiles, Snezana Stanimirovic, and Tobias Westmeier for a careful reading of the manuscript andconstructive criticism.
LITERATURE CITED
Bajaja E, Arnal EM, Larrarte JJ, Morras R, Poppel WGL, Kalberla PMW. 2005. Astron. Astrophys. 440:767Ben Bekhti N, Bruns C, Kerp J, Westmeier T. 2006. Astron. Astrophys. 457:917Benz AO, Grigis PC, Hungerbuhler V, Meyer H, Monstein C, et al. 2005. Astron. Astrophys. 442:767Binney J, Dehnen W. 1997. MNRAS 287:L5Binney J, Merrifield M. 1998. Galactic Astronomy. Princeton, NJ: Princeton Univ. PressBlitz L, Spergel DN. 1991. Astrophys. J. 370:205Braun R, Burton WB. 2000. Astron. Astrophys. 354:853Braun R, Kanekar N. 2005. Astron. Astrophys. 436:L53Braun R, Thilker DA. 2005. In Extra-Planar Gas, ed. R Braun, p. 121. ASP Conf. Proc. 331
58 Kalberla · Kerp
Ann
u. R
ev. A
stro
. Ast
roph
ys. 2
009.
47:2
7-61
. Dow
nloa
ded
from
ww
w.a
nnua
lrev
iew
s.or
gby
Uni
vers
ity o
f H
awai
i at M
anoa
Lib
rary
on
01/0
2/12
. For
per
sona
l use
onl
y.

ANRV385-AA47-02 ARI 15 July 2009 4:24
Breitschwerdt D, Freyberg MJ, Truemper J, eds. 1998. The Local Bubble and Beyond. Lect. Notes Phys. 506Bruns C, Kerp J, Kalberla PMW, Mebold U. 2000. Astron. Astrophys. 357:120Bruns C, Kerp J, Pagels A. 2001. Astron. Astrophys. 370:L26Bruns C, Kerp J, Staveley-Smith L, Mebold U, Putman ME, et al. 2005. Astron. Astrophys. 432:45Bruns C, Westmeier T. 2004. Astron. Astrophys. 426:L9Burton WB. 1976. Annu. Rev. Astron. Astrophys. 14:275Burton WB. 1988. See Verschuur & Kellermann 1988, p. 295Burton WB. 1992. In The Galactic Interstellar Medium, Saas-Fee Advance Course 21, ed. D Pfenniger, P Bartholdi,
p. 1. Berlin: Springer-VerlagBurton WB, Liszt HS. 1993. Astron. Astrophys. 274:765Burton WB, te Lintel Hekkert P. 1986. Astron. Astrophys. Suppl. 65:427Cordes JM, Freire PCC, Lorimer DR, Camilo F, Champion DJ, et al. 2006. Astrophys. J. 637:446Daigle A, Joncas G, Parizeau M. 2007. Astrophys. J. 661:285de Avillez MA. 2000. MNRAS 315:479de Avillez MA, Berry DL. 2001. MNRAS 328:708Dedes L. 2008. The cloudy HI halo of the Milky Way. PhD thesis. Univ. Bonn. Available at http://hss.ulb.
uni-bonn.de/diss online/math nat fak/2008/dedes leonidasDickey JM. 2002. In Single-Dish Radio Astronomy: Techniques and Applications, ed. S Stanimirovic, D Altschuler,
P Goldsmith, C Salter, p. 209. ASP Conf. Proc. 278Dickey JM, Lockman FJ. 1990. Annu. Rev. Astron. Astrophys. 28:215Dickey JM, McClure-Griffiths NM, Gaensler BM, Green AJ. 2003. Astrophys. J. 585:801Dickey JM, Strasser S, Gaensler BM, Haverkorn M, Kavars D, et al. 2009. Astrophys. J. 693:1250Diehl R, Halloin H, Kretshmer K, Licht GG, Schonfeld V, et al. 2006. Nature 439:45Diplas A, Savage BD. 1991. Astrophys. J. 377:126Ehlerova S, Palous J. 2005. Astron. Astrophys. 437:101Ekers RD, Bell JF. 2001. In Proc. IAU Symp. 196: Preserving the Astronomical Sky, July 1999, Vienna, ed.
RJ Cohen, WT Sullivan, p. 199Fich M, Blitz L, Stark AA. 1989. Astrophys. J. 342:272Ford HA, McClure-Griffiths NM, Lockman FJ, Bailin J, Calabretta MR, et al. 2008. Astrophys. J. 688:290Fox AJ, Savage BD, Wakker BP. 2006. Astrophys. J. Suppl. 165:229Fraternali F. 2009. In Proc. IAU Symp. 254: The Galaxy Disk in Cosmological Context, ed. J Anderson,
J Bland-Hawthorn, B Nordstrom, p. 255Fraternali F, Binney JJ. 2008. MNRAS 386:935Fridman PA. 2008. Astron. J. 135:1810Gaensler BM, Madsen GJ, Chatterjee S, Mao SA. 2008. Publ. Astron. Soc. Aust. 25:184Gazol A, Vazquez-Semadeni E, Sanchez-Salcedo FJ, Scalo J. 2001. Astrophys. J. Lett. 557:L121Gibson SJ, Taylor AR, Higgs LA, Brunt CM, Dewdney PE. 2005. Astrophys. J. 626:195Gibson SJ, Taylor AR, Higgs LA, Dewdney PE. 2000. Astrophys. J. 540:851Gibson SJ, Taylor AR, Stil JM, Brunt CM, Kavars DW, Dickey JM. 2007. In IAU Symp. 237: Triggered Star
Formation in a Turbulent ISM, Prague, 2006, ed. J Palous, BG Elmegreen, p. 363Gilli R, Comastri A, Hasinger G. 2007. Astron. Astrophys. 463:79Giovanelli R. 2008. See Minchin & Momjian 2008, p. 328Haffner LM, Reynolds RJ, Tufte SL, Madsen GJ, Jaehnig KP, Percival JW. 2003. Astrophys. J. Suppl. 149:405Hartmann D, Burton WB. 1997. Atlas of Galactic Neutral Hydrogen. Cambridge, UK: Cambridge Univ. PressHartmann D, Kalberla PMW, Burton WB, Mebold U. 1996. Astron. Astrophys. Suppl. 119:115Haud U. 2008. Astron. Astrophys. 483:461Haud U, Kalberla PMW. 2006. Baltic Astron. 15:413Haud U, Kalberla PMW. 2007. Astron. Astrophys. 466:555Haverkorn M, Goss WM. 2007. SINS—Small Ionized and Neutral Structures in the Diffuse Interstellar Medium.
San Francisco: ASPHeald GH, Rand RJ, Benjamin RA, Bershady MA. 2007. Astrophys. J. 663:933Heiles C. 1979. Astrophys. J. 229:533
www.annualreviews.org • HI in the Milky Way 59
Ann
u. R
ev. A
stro
. Ast
roph
ys. 2
009.
47:2
7-61
. Dow
nloa
ded
from
ww
w.a
nnua
lrev
iew
s.or
gby
Uni
vers
ity o
f H
awai
i at M
anoa
Lib
rary
on
01/0
2/12
. For
per
sona
l use
onl
y.

ANRV385-AA47-02 ARI 15 July 2009 4:24
Heiles C. 1984. Astrophys. J. Suppl. 55:585Heiles C. 1997. Astrophys. J. 481:193Heiles C. 2001. Astrophys. J. Lett. 551:L105Heiles C. 2007. See Haverkorn & Goss 2007, p. 3Heiles C, Troland TH. 2003. Astrophys. J. 586:1067Heithausen A, Bruns C, Kerp J, Weiss A. 2001. In The Promise of the Herschel Space Observatory, ed. GL Pilbratt,
J Cernicharo, AM Heras, T Prusti, R Harris, ESA-SP 460, p. 431Henderson AP, Jackson PD, Kerr FJ. 1982. Astrophys. J. 263:116Heyer MH, Brunt C, Snell RL, Howe JE, Schloerb FP, Carpenter JM. 1998. Astrophys. J. Suppl. 115:241Higgs LA, Tapping KF. 2000. Astron. J. 120:2471Hogbom JA. 1974. Astron. Astrophys. Suppl. 417(15):426Jenkins EB, Tripp TM. 2007. See Haverkorn & Goss 2007, p. 3Johnston S, Bailes M, Bartel N, Baugh C, Bietenholz M, et al. 2007. Publ. Astron. Soc. Aust. 24:174Kalberla PMW. 2003. Astrophys. J. 588:805Kalberla PMW, Burton WB, Hartmann D, Arnal EM, Bajaja E, et al. 2005. Astron. Astrophys. 440:775Kalberla PMW, Dedes L. 2008. Astron. Astrophys. 487:951Kalberla PMW, Dedes L, Kerp J, Haud U. 2007. Astron. Astrophys. 469:511Kalberla PMW, Haud U. 2006. Astron. Astrophys. 455:481Kalberla PMW, Mebold U, Reich W. 1980. Astron. Astrophys. 82:275Kalberla PMW, Schwarz UJ, Goss WM. 1985. Astron. Astrophys. 144:27Kang J-h, Koo B-C. 2007. Astrophys. J. Suppl. 173:85Kavars DW, Dickey JM, McClure-Griffiths NM, Gaensler BM, Green AJ. 2005. Astrophys. J. 626:887Kerp J, Burton WB, Egger R, Freyberg MJ, Hartmann D, et al. 1999. Astron. Astrophys. 342:213Kerp J, Lesch H, Mack K-H. 1994. Astron. Astrophys. 286:L13Kerp J, Pietz J. 1998. See Breitschwerdt, Freyberg & Truemper 1998, p. 337Kerp J, Pietz J, Kalberla PMW, Burton WB, Egger R, et al. 1998. See Breitschwerdt, Freyberg & Truemper
1998, p. 457Kerr FJ. 1962. MNRAS 123:327Knapp GR, Verschuur GL. 1972. Astron. J. 77:717Kolpak MA, Jackson JM, Bania TM, Dickey JM. 2002. Astrophys. J. 578:868Koo B-C, Kang J-h, Salter CJ. 2006. Astrophys. J. Lett. 643:L49Kuijken K, Gilmore G. 1989. MNRAS 239:651Kuijken K, Tremaine S. 1994. Astrophys. J. 421:178Kulkarni SR, Heiles C. 1987. In Interstellar Processes, ed. DJ Hollenbach, HA Thronson, p. 87. Dordrecht:
ReidelKulkarni SR, Heiles C. 1988. See Verschuur & Kellermann 1988, p. 95Larson RB. 1981. MNRAS 194:809Levine ES, Blitz L, Heiles C. 2006a. Astrophys. J. 643:881Levine ES, Blitz L, Heiles C. 2006b. Science 312:1773Levine ES, Heiles C, Blitz L. 2008. Astrophys. J. 679:1288Lockman FJ. 2002a. In Seeing Through the Dust: The Detection of HI and the Exploration of the ISM in Galaxies,
ed. AR Taylor, TL Landecker, AG Willis, p. 107. ASP Conf. Ser. 276Lockman FJ. 2002b. Astrophys. J. Lett. 580:L47Lockman FJ, Condon JJ. 2005. Astron. J. 129:1968Lockman FJ, Gehman CS. 1991. Astrophys. J. 382:182Lockman FJ, Jahoda K, McCammon D. 1986. Astrophys. J. 302:432Low FJ, Beintema DA, Gautier TN, Gillett FC, Beichman CA, et al. 1984. Astrophys. J. Lett. 278:L19McClure-Griffiths NM, Dickey JM, Gaensler BM, Green AJ. 2002. Astrophys. J. 578:176McClure-Griffiths NM, Dickey JM, Gaensler BM, Green AJ. 2004. Astrophys. J. Lett. 607:L127McClure-Griffiths NM, Dickey JM, Gaensler BM, Green AJ, Haverkorn M, Strasser S. 2005. Astrophys.
J. Suppl. 158:178McClure-Griffiths NM, Pisano DJ, Calabretta MR, Ford HA, Lockman FJ, et al. 2009. Ap. J. Suppl. 181:398McKee CF, Ostriker JP. 1977. Astrophys. J. 218:148
60 Kalberla · Kerp
Ann
u. R
ev. A
stro
. Ast
roph
ys. 2
009.
47:2
7-61
. Dow
nloa
ded
from
ww
w.a
nnua
lrev
iew
s.or
gby
Uni
vers
ity o
f H
awai
i at M
anoa
Lib
rary
on
01/0
2/12
. For
per
sona
l use
onl
y.
ANRV385-AA47-02 ARI 15 July 2009 4:24
Meyer DM, Lauroesch JT, Heiles C, Peek JEG, Engelhorn K. 2006. Astrophys. J. 650:L67Minchin R, Momjian E, eds. 2008. The Evolution of Galaxies through the Neutral Hydrogen Window. AIP Conf.
Ser. 1035Mock J. 2004. General GALFA Spectrometer Doc. Available at http://www.naic.edu/alfa/galfa/galfa docs.
shtmlNarayan CA, Saha K, Jog CJ. 2005. Astron. Astrophys. 440:523Oort JH. 1962. In The Distribution and Motion of Interstellar Matter in Galaxies, ed. L Woltjer, p. 71. New York:
BenjaminOosterloo T, Fraternali F, Sancisi R. 2007. Astron. J. 134:1019Peek JEG, Putman ME, McKee CF, Heiles C, Stanimirovic S. 2007. Astrophys. J. 656:907Pidopryhora Y, Lockman FJ, Shields JC. 2007. Astrophys. J. 656:928Pietz J, Kerp J, Kalberla PMW, Burton WB, Hartmann D, Mebold U. 1998. Astron. Astrophys. 332:55Pietz J, Kerp J, Kalberla PMW, Mebold U, Burton WB, Hartmann D. 1996. Astron. Astrophys. 308:L37Prata SW. 1964. Bull. Astron. Inst. Neth. 17:511Quilis V, Moore B. 2001. Astrophys. J. Lett. 555:L95Reach WT, Koo B-C, Heiles C. 1994. Astrophys. J. 429:672Read JI, Lake G, Agertz O, Debattista VP. 2008. MNRAS 892:1041Richter P, Sembach KR, Howk JC. 2003. Astron. Astrophys. 405:1013Sanchez-Salcedo FJ, Saha K, Narayan CA. 2008. MNRAS 385:1585Shane WW. 1967. In IAU Symp. 31: Radio Astronomy and the Galactic System, ed. H van Woerden, p. 177.
London: AcademicSimonson SC. 1971. Astron. Astrophys. 12:136Stanimirovic S. 2002. In Single-Dish Radio Astronomy: Techniques and Applications, ed. S Stanimirovic,
D Altschuler, P Goldsmith, C Salter, p. 375. San Francisco: ASPStanimirovic S, Heiles C, Kanekar N. 2007. See Haverkorn & Goss 2007, p. 22Stanimirovic S, Putman M, Heiles C, Peek JEG, Goldsmith PF, et al. 2006. Astrophys. J. 653:1210Stanko S, Klein B, Kerp J. 2005. Astron. Astrophys. 436:391Stark AA, Gammie CF, Wilson RW, Bally J, Linke RA, et al. 1992. Astrophys. J. Suppl. 79:77Staveley-Smith L. 1997. Publ. Astron. Soc. Aust. 14:111Stil JM, Lockman FJ, Taylor AR, Dickey JM, Kavars DW, et al. 2006a. Astrophys. J. 637:366Stil JM, Taylor AR, Dickey JM, Kavars DW, Martin PG, et al. 2006b. Astron. J. 132:1158Strasser S, Taylor AR. 2004. Astrophys. J. 603:560Taylor AR, Gibson SJ, Peracaula M, Martin PG, Landecker TL, et al. 2003. Astron. J. 125:3145van Woerden H, Wakker BP, Schwarz UJ, de Boer KS. 2004. High Velocity Clouds, ed. H van Woerden,
BP Wakker, UJ Schwarz, KS de Boer, Astrophys. Space Sci. Libr., Vol. 312. Dordrecht: Kluwer Acad.Vazquez-Semadeni E, Gazol A, Scalo J. 2000. Astrophys. J. 540:271Verheijen MAW, Oosterloo TA, van Cappellen WA, Bakker L, Ivashina MV, et al. 2008. See Minchin &
Momjian 2008, p. 265Verschuur GL. 2004. Astron. J. 127:394Verschuur GL, Kellermann KI, eds. 1988. Galactic and Extragalactic Radio Astronomy. Berlin/New York:
Springer-VerlagWakker BP. 1991. Astron. Astrophys. 250:499Wakker BP, van Woerden H. 1997. Annu. Rev. Astron. Astrophys. 35:217Wilms J, Allen A, McCray R. 2000. Astrophys. J. 542:914Winkel B, Kerp J, Kalberla PMW, Keller R. 2008. See Minchin & Momjian 2008, p. 259Winkel B, Kerp J, Stanko S. 2007. Astron. Nachr. 328:68Wolfire MG, Hollenbach D, McKee CF, Tielens AGGM, Bakes ELO. 1995a. Astrophys. J. 443:152Wolfire MG, McKee CF, Hollenbach D, Tielens AGGM. 1995b. Astrophys. J. 453:673Wolfire MG, McKee CF, Hollenbach D, Tielens AGGM. 2003. Astrophys. J. 587:278Wouterloot JGA, Brand J, Burton WB, Kwee KK. 1990. Astron. Astrophys. 230:21York DG, Songaila A, Blades JC, Cowie LL, Morton DC, Wu C-C. 1982. Astrophys. J. 255:467
www.annualreviews.org • HI in the Milky Way 61
Ann
u. R
ev. A
stro
. Ast
roph
ys. 2
009.
47:2
7-61
. Dow
nloa
ded
from
ww
w.a
nnua
lrev
iew
s.or
gby
Uni
vers
ity o
f H
awai
i at M
anoa
Lib
rary
on
01/0
2/12
. For
per
sona
l use
onl
y.

AR385-FM ARI 26 July 2009 13:0
Annual Review ofAstronomy andAstrophysics
Volume 47, 2009Contents
An Astronomical Life Salted by Pure ChanceRobert P. Kraft � � � � � � � � � � � � � � � � � � � � � � � � � � � � � � � � � � � � � � � � � � � � � � � � � � � � � � � � � � � � � � � � � � � � � � � � � � � � � � � � � � 1
The Hi Distribution of the Milky WayPeter M.W. Kalberla and Jürgen Kerp � � � � � � � � � � � � � � � � � � � � � � � � � � � � � � � � � � � � � � � � � � � � � � � � � � � � � � �27
Progenitors of Core-Collapse SupernovaeStephen J. Smartt � � � � � � � � � � � � � � � � � � � � � � � � � � � � � � � � � � � � � � � � � � � � � � � � � � � � � � � � � � � � � � � � � � � � � � � � � � � � �63
Gravitational Waves from Merging Compact BinariesScott A. Hughes � � � � � � � � � � � � � � � � � � � � � � � � � � � � � � � � � � � � � � � � � � � � � � � � � � � � � � � � � � � � � � � � � � � � � � � � � � � � � � 107
Physical Properties and Environments of Nearby GalaxiesMichael R. Blanton and John Moustakas � � � � � � � � � � � � � � � � � � � � � � � � � � � � � � � � � � � � � � � � � � � � � � � � � � 159
Hot Subdwarf StarsUlrich Heber � � � � � � � � � � � � � � � � � � � � � � � � � � � � � � � � � � � � � � � � � � � � � � � � � � � � � � � � � � � � � � � � � � � � � � � � � � � � � � � � � 211
High-Contrast Observations in Optical and Infrared AstronomyBen R. Oppenheimer and Sasha Hinkley � � � � � � � � � � � � � � � � � � � � � � � � � � � � � � � � � � � � � � � � � � � � � � � � � � � 253
Magnetic Reconnection in Astrophysical and Laboratory PlasmasEllen G. Zweibel and Masaaki Yamada � � � � � � � � � � � � � � � � � � � � � � � � � � � � � � � � � � � � � � � � � � � � � � � � � � � � 291
Magnetic Fields of Nondegenerate StarsJ.-F. Donati and J.D. Landstreet � � � � � � � � � � � � � � � � � � � � � � � � � � � � � � � � � � � � � � � � � � � � � � � � � � � � � � � � � � � 333
Star-Formation Histories, Abundances, and Kinematics of DwarfGalaxies in the Local GroupEline Tolstoy, Vanessa Hill, and Monica Tosi � � � � � � � � � � � � � � � � � � � � � � � � � � � � � � � � � � � � � � � � � � � � � � � 371
Complex Organic Interstellar MoleculesEric Herbst and Ewine F. van Dishoeck � � � � � � � � � � � � � � � � � � � � � � � � � � � � � � � � � � � � � � � � � � � � � � � � � � � � 427
The Chemical Composition of the SunMartin Asplund, Nicolas Grevesse, A. Jacques Sauval, and Pat Scott � � � � � � � � � � � � � � � � � � � � 481
Teraelectronvolt AstronomyJ.A. Hinton and W. Hofmann � � � � � � � � � � � � � � � � � � � � � � � � � � � � � � � � � � � � � � � � � � � � � � � � � � � � � � � � � � � � � � 523
vii
Ann
u. R
ev. A
stro
. Ast
roph
ys. 2
009.
47:2
7-61
. Dow
nloa
ded
from
ww
w.a
nnua
lrev
iew
s.or
gby
Uni
vers
ity o
f H
awai
i at M
anoa
Lib
rary
on
01/0
2/12
. For
per
sona
l use
onl
y.

AR385-FM ARI 26 July 2009 13:0
Gamma-Ray Bursts in the Swift EraN. Gehrels, E. Ramirez-Ruiz, and D.B. Fox � � � � � � � � � � � � � � � � � � � � � � � � � � � � � � � � � � � � � � � � � � � � � � 567
Indexes
Cumulative Index of Contributing Authors, Volumes 36–47 � � � � � � � � � � � � � � � � � � � � � � � � � � � 619
Cumulative Index of Chapter Titles, Volumes 36–47 � � � � � � � � � � � � � � � � � � � � � � � � � � � � � � � � � � � � 622
Errata
An online log of corrections to Annual Review of Astronomy and Astrophysics articles maybe found at http://astro.annualreviews.org/errata.shtml
viii Contents
Ann
u. R
ev. A
stro
. Ast
roph
ys. 2
009.
47:2
7-61
. Dow
nloa
ded
from
ww
w.a
nnua
lrev
iew
s.or
gby
Uni
vers
ity o
f H
awai
i at M
anoa
Lib
rary
on
01/0
2/12
. For
per
sona
l use
onl
y.


![The Distribution of the Milky Way ISM as revealed by the [CII] 158um line.](https://static.fdocuments.in/doc/165x107/568164e5550346895dd7499c/the-distribution-of-the-milky-way-ism-as-revealed-by-the-cii-158um-line-56ccdd8e3585e.jpg)