The greenwashing machine: Is CSR more than … these two sections, ... derives a higher indirect...
41
The greenwashing machine: Is CSR more than communication? * Rémi BAZILLIER † and Julien VAUDAY ‡ May 13, 2011 Abstract Corporate Social Responsibility (CSR) and advertising are strategic complements. How- ever, it could be that communicating on CSR represents by itself a good strategy. If the claim about the environmental or social benefits of the product is unsubstantiated or mis- leading, this practice is known under the name of greenwashing (GW). If consumers do not discover there is no CSR, they may be attracted by a so-called CSR product because of the advertising. The model clearly identifies some “usual suspects” that will prefer GW over CSR. We then conduct an empirical analysis using data on CSR, economic data of the 500 largest European firms to test the predictions. Several instruments are used in order to estimate the propensity to prefer GW. We show that “hard greenwashing”, i.e active com- munication with no CSR at all, is not a credible strategy and therefore propose the concept of “light greenwashing” that is empirically verified. J.E.L: M14, M37, L15, D83 Key-words: Corporate Social Responsibility, Greenwashing, Communication. * Acknowledgments: We would like to thank Vigeo which provided us the data on the level of Corporate Social Responsability for European firms. We are grateful to Oliver Bonnet and Manon Jolivet for their help concerning the use of these data. A Partnership convention which includes the present paper has been signed between VIGEO, the University Paris 1 Pantheon Sorbonne and CNRS. The research on which is based this paper has been partly conducted while Julien Vauday was affiliated to the Department of Economics at the Ecole Polytechnique which is therefore greatly acknowledged. In particular, we would like to thank Patricia Crifo and Jean-Pierre Ponssard. We finally thank seminar participants at Lille I and Paris XIII. † LEO - CNRS (UMR 6221) - Université d’Orléans. [email protected] ‡ Université Paris 13 - CEPN and CNRS. [email protected] 1
Transcript of The greenwashing machine: Is CSR more than … these two sections, ... derives a higher indirect...

The greenwashing machine: Is CSR more than
communication? ∗
Rémi BAZILLIER† and Julien VAUDAY ‡
May 13, 2011
Abstract
Corporate Social Responsibility (CSR) and advertising are strategic complements. How-ever, it could be that communicating on CSR represents by itself a good strategy. If theclaim about the environmental or social benefits of the product is unsubstantiated or mis-leading, this practice is known under the name of greenwashing (GW). If consumers do notdiscover there is no CSR, they may be attracted by a so-called CSR product because of theadvertising. The model clearly identifies some “usual suspects” that will prefer GW overCSR. We then conduct an empirical analysis using data on CSR, economic data of the 500largest European firms to test the predictions. Several instruments are used in order toestimate the propensity to prefer GW. We show that “hard greenwashing”, i.e active com-munication with no CSR at all, is not a credible strategy and therefore propose the conceptof “light greenwashing” that is empirically verified.
J.E.L: M14, M37, L15, D83Key-words: Corporate Social Responsibility, Greenwashing, Communication.
∗Acknowledgments: We would like to thank Vigeo which provided us the data on the level of CorporateSocial Responsability for European firms. We are grateful to Oliver Bonnet and Manon Jolivet for their helpconcerning the use of these data. A Partnership convention which includes the present paper has been signedbetween VIGEO, the University Paris 1 Pantheon Sorbonne and CNRS. The research on which is based thispaper has been partly conducted while Julien Vauday was affiliated to the Department of Economics at the EcolePolytechnique which is therefore greatly acknowledged. In particular, we would like to thank Patricia Crifo andJean-Pierre Ponssard. We finally thank seminar participants at Lille I and Paris XIII.†LEO - CNRS (UMR 6221) - Université d’Orléans. [email protected]‡Université Paris 13 - CEPN and CNRS. [email protected]
1

1 Introduction
More and more firms launched some initiatives related to their social and environmental respon-
sibilities. If the debate over the responsibility of the firm within society is far from being new, the
fears created by the globalization and the huge challenge raised by climate change may explain a
rising concern by the consumers and thus a new interest from the firms themselves. The Corpo-
rate Social Responsibility (CSR) is a notion that is not well defined and the verifiability of the
real commitment of firms in CSR is weak. The picture is therefore quite clear. The consumers
want more CSR and may be willing to pay for that. Firms are aware of that demand for CSR
and may find it profitable to invest in CSR if the demand is high enough. However, CSR is
costly, so firms may be tempted to communicate over a non-existent or overestimated effort in
CSR.
Of course, the development of CSR raises different issues or problems. The first one is the
famous critic raised by Friedman (1962) who considers that the only social responsibility of the
firm is to make profits. This is the instrumental view of CSR, or strategic CSR (Baron, 2001):
firms will engage in CSR only if they have an economic interest to do so (Mitchell, Agle, and
Wood, 1997; Odgen and Watson, 1999). In other words, firms will be “responsible” if and only
if it is a way to maximize their profits or their market share. May be because of this argument,
another group (Jones, 1996; Gendron, Lapointe, and Turcotte, 2004)1 criticizes CSR for the
same reason. Nevertheless this group has come to opposite conclusions. CSR is seen as a way
to substitute “soft laws” to “hard laws”. For this group of people, CSR is a way to weaken the
welfare state and to put the maximization of the profit at the top of the collective priorities.
One of the key aspect of these critics is the skepticism towards the social and environmental
commitments of the firms: “The image of multinational companies working hard to make the
world a better place is often just that - an image”, said a report of the British NGO ChristianAid
(2004) who called for “new laws to make businesses responsible for protecting human rights and
the environment wherever they work”. This skepticism may be reinforced by the “greenwashing”1Lots of NGOs or trade unions also share this opinion (Tassi, Collomb, and Saincy, 2009).
2

behavior. This notion of greenwashing has been used in the eighties and is defined by Greenpeace
as “the act of misleading consumers regarding the environmental2 practices of a company or the
environmental benefits of a product or service”. TerraChoice Environmental Marketing Inc.
conducted a survey of six category-leading big box stores. Through these surveys, they identified
1,018 consumer products bearing 1,753 environmental claims. Of the 1,018 products examined,
all but one made “claims that are demonstrably false or that risk misleading intended audiences.”
For the skeptical, CSR cannot be seen as a new model of development or regulation because
of the large scale of greenwashing. The responsibility of firms in ecological disasters and their
inability to foresee and anticipate their consequences probably reinforce this skepticism.
The denunciation of greenwashing does not mean that firms do not have to communicate
around social or environmental considerations. In most cases, CSR and communication will
be seen as strategic complements under the instrumental view of CSR. Nevertheless, if both
CSR and communication have a significant cost, the firm may decide to choose the relative
proportion of CSR and communication according to a trade-off between the reality of the social
and environmental commitments and the need for the firm to use these commitments in a broader
communication strategy.
This paper investigates the extent to which firms use “green” communication and advertising
as a substitute or complement to CSR. We model the communication between consumers and
firms and determine under what conditions it is profitable for the firm to invest (relatively) more
in communication or in CSR. The core structure of the framework relies on Dewatripont and
Tirole (2005). This model involves two agents, a sender and a receiver. They exchange some
hard and/or soft information (issue-relevant and cue messages, respectively), the former being
verifiable information on the CSR investment whereas the latter only gives non verifiable infor-
mation aimed at increasing the credibility of the sender. We identify some “usual suspects” that
will have a higher probability to prefer the communication to investment in CSR, relatively. This
preference corresponds to a strategy of “light greenwashing” that involves some CSR investment2In this paper, we will enlarge the definition of greenwashing with the inclusion of social practices. The concept
of socialwashing is sometimes evoked.
3

but less than otherwise without access to cue communication. We then test empirically some
implications of the model, using an original database on CSR level for the biggest 595 Euro-
pean firms and on the level of reporting that will be used as a proxy of “green” communication.
This trade-off will mainly depend on the consumers’ confidence, on the firms’ credibility and the
intrinsic characteristics of the product.
The literature largely studied the determinants of CSR. Garriga and Melé (2004) distinguish
four families of theories explaining the development of CSR: the instrumental theories, the po-
litical theories, the integrative theories and the ethic theories. But this framework does not
allow a distinction between an effective level of CSR and a possible strategy of greenwashing.
After having introduced the distinction between search good and experience good (Nelson, 1970),
Nelson (1974) showed that advertising strategy depends on the nature of the good itself. The
search goods is a category of product whose quality can be revealed before purchase. Concerning
experience goods, the only way to have an estimate of their quality is to taste it. CSR would be
more developed for this last category of goods. McWilliams and Siegel (2001) showed a positive
correlation between experience goods and advertising. Siegel and Vitalino (2007) investigates
empirically the determinants of CSR and confirm that CSR tends to be more important for
experience goods.
Baron (2001) shows that CSR can be motivated by profit maximization, altruism or threat by
an activist. The threat comes from a possible boycott if the firm rejects the claims of the activist.
Baron and Diermeier (2007) study how activist’ campaigns may change practices of firms and
Baron (2009b) highlight how the quality of activists may affect the type of firms targetted: firms
practicing morally motivated CSR or firms practicing CSR induced by social pressure. Baron
(2009a) shows empirically that social pressure tends to increase corporate social performance.3
Our analysis makes a number of contributions to the literature. To the best of our knowl-
edge, it is one of the first economic analysis of greenwashing. One noticeable exception is the3Baron (2010a) distinguishes between corporate social responsability (CSR) and corporate social performance
(CSP). CSP pertains to social activity that satisfy two conditions: (1) there are beyond the requirement of thelaw and (2) they involve the private provision of a public good. CSR implies CSP but also involves a “moral dutyto undertake social activities.”
4

work of Lyon and Maxwell (2010) that presents a theoretical paper using a persuasion game in
order to model the greenwashing strategy. In this paper, we first propose a theoretical frame-
work explaining when communication and CSR are strategic complements and when they are
substitutes in order to determine what is greenwashing. Our basic framework is quite close
to the example of a more general self-regulation model presented in Baron (2010b). We focus
on communication strategies whereas Baron (2010b) focuses on self-regulation motivations due
to moral preferences. It is worth noticing that there are some common conclusions from both
models despite mechanisms are totally different. Second, some of the theoretical implications
are tested empirically. We propose an original estimation of the level of CSR reporting for the
595 biggest European firms and a new index of their effective level of CSR built from VIGEO
data. We define different level of commitments, from the simple communication in CSR reports
(the “cues” communication in Dewatripont and Tirole (2005)) to the publication of performance
indicators (the “issue-relevant” communication in Dewatripont and Tirole (2005)).
The paper is organized as follow. In section 2, we present the basic framework, based on
Dewatripont and Tirole (2005). In section 3, we study when it is “strategic” for the firm to use
greenwashing, using the framework presented in section 2. We see how cues and hard information
may influence these strategies. From these two sections, we derive some empirical predictions.
In section 4, we present the three sets of data we use in the paper: (1) the effective level of CSR,
approximated by an original index built from VIGEO data, (2) the level of CSR communication,
approximated by various indexes of reporting, (3) the extent to which the Global Reporting
Initiative (GRI) guidelines have been applied in sustainability reporting. In section 5, we show
empirically when CSR and communication are substitutes or complements. Finally, we conclude
in section 6.
2 Basic framework
Dewatripont and Tirole (2005) (D & T 05 hereafter) provides a simple framework for the study
of modes of communication. They introduce two types of relations between a sender, S, and a
5

receiver, R. Either their relation is governed by a Supervisory Decision Making (SDM) or by an
Executive Decision Making (EDM). Under the former, the information the communication may
convey helps the receiver to decide whether she chooses action A or the status quo. Under the
latter, without any communication, the receiver would never choose to take action A.
2.1 Representative consumer and firm
The action A we consider in this paper is buying a more expansive product or not. We assume
the payoff of R under the status quo is 0. The consumer (receiver) would then choose action A if
the product contains CSR. Therefore, there is an implicit utility function such that the consumer
derives a higher indirect utility for consuming a good that contains CSR, despite the price is
higher.4
The theoretical approach in this paper is thus quite different from Lyon and Maxwell (2010).
In their paper, a greenwasher is a firm that selectively discloses good news while she retains bad
news. While in this paper, the fact the information is verifiable or not is the key aspect. As a
consequence, a greenwasher in this paper is a priori a firm that has sent some soft information
in order to reduce the level of hard information that she sends. Moreover in Lyon and Maxwell
(2010), an activist punishes a firm that greenwashes and therefore they study the optimal reaction
of a firm facing such an activist’s behavior. Our paper is more about studying a reputation effect
and the relationship between the firm and a consumer doubtful about the CSR incorporated in
the product.
Several types of consumer may exist that differ according to their degree of risk aversion.
For instance, a suspicious one considers that without any information, there is no CSR in a
product. Consequently, its decision is similar to the EDM. Whereas a risk neutral consumer
assumes there is a probability the product contains CSR. Hence, her action corresponds to SDM.4This hypothesis is common in the analysis of CSR. It is confirmed by surveys conducted by the Marymount
University: consumers claimed to be willing to pay as much as one dollar or 5 percent more for apparel notmanufactured in sweatshops (Dickson, 2001). Pelsmacker, Driesen, and Rayp (2001) showed that the averageprice premium that the Belgian consumers were willing to pay for a fair-trade label was 10%. Another studyrevealed that, on average, 46% of European consumers also claimed to be willing to pay substantially more forethical products (MORI, 2000).
6

This distinction is close to the one of Gabaix and Laibson (2006) that also introduces two types
of consumers, the sophisticated and the unsophisticated ones. The first of them being aware of
the existence of high add-ons price, contrary to the second, that are myopic with respect to that
aspect.
Therefore, the suspicious consumer attributes a nil ex-ante probability that taking action
A will generate a positive revenue (or an indirect utility increase). A risk neutral consumer
establishes an ex-ante probability that is non nil. Similarly to D & T 05, this ex-ante probability
is such that the lowest probability above which the consumer expects a positive revenue from
taking action A is
α∗ =−rL
rH − rL
(1)
where rL (rH) is the low (high) revenue. The revenue here is to be considered as the difference
between the relative prices of both products and the indirect utility the consumer derives from
the extent of CSR contained in the product. Therefore, buying a product that contains no CSR
at all yields an unambiguously negative revenue as the product that may contain CSR is more
expansive than the standard product. With pH (pL) the price charged for a (non) CSR product,
rL = E[U(CSR = 0)] − pH < 0, rH = E[U(CSR > 0)] − pH > 0. If the consumer does not
choose A, it gets E[U(CSR = 0)] − pL = 0. E[U(.)] means that the consumer is not able to
verify if the product indeed contains CSR. He however knows that if it does, this would yield
him a higher utility. We consider that firms know how consumers value the CSR content.
This echoes the distinction between “search goods” and “experience goods” proposed by Nel-
son (1970) and the “credence good” introduced by Darby and Karni (1973). These goods are
commonly known as goods for which the consumer can hardly guess the utility it derives from
it even after it has consumed it. In Dulleck, Kerschbamer, and Sutter (2010), they propose a
slightly different definition. The consumer is able to measure the utility of the good after it has
consumed it but it is not able to guess the quality or the type of the good. This implies that the
7

utility the consumer derives from the good does not depend on the quality.5
We use a very general utility function. The consumer could have a preference for goods
containing CSR either because CSR represents a kind of a “quality” dimension or because the
consumer has some moral preferences. These preferences could be altruistic or warm glow (An-
dreoni, 1990). If this is about quality, then we should refer to the first definition of credence
good evoked just above. If this is about moral preferences, then the second definition should
be retained as CSR is not a part of the good itself but rather a complement. Consequently
the utility consumers derive for consuming the good is known. This is how this consumption
contributes to its moral preferences that is unknown.
2.2 Communication
We focus on the more general model developed in D & T 05 that involves cue communication. We
first briefly present an overview of the model in order to make clear the differences we introduce
in the remaining of the paper. These “cues” convey no hard information on the CSR content but
may convey information on the type of the sender, the firm. A “better news” is expected to raise
the congruence between the consumer and the firm. This congruence has to be understood here
as an a priori convergence of interest. The “a priori ” is important as this allows us to make
the parallel between cues and advertising. Of course, suspicious consumers who need some hard
information on the CSR content would not be influenced by this ads. This corresponds then
to the EDM case, for which only hard information communication may trigger the action A.
Otherwise, a consumer that is more or less gullible corresponds to various SDM situations. This
interpretation will be more pertinent once we will have introduced an endogenized level of cue
communication.
In order to modify the ex-ante decision that depends on the ex-ante probability, both actors,
the sender and the receiver, may also make an effort in order to communicate and assimilate
hard information. These efforts, labeled x and y for the sender and the receiver, respectively, are5A good example they propose is the taxi ride in an unknown city. The consumer’s utility depends on reaching
point B from point A, no matter the way the taxi driver has chosen.
8
costly. Their costs S(x) and R(y) are increasing and differentiable. As in D & T 05, we assume
the communication efforts of the consumer and the firm are strategic complements.6
The effort of the firm to communicate hard information is therefore comparable to a verifiable
certification of the CSR content of the firm, by an independent agency for instance.7 For the
consumer, it may be spending some time searching and verifying information.
We next focus on a case that is not developed in D & T 05: when cues coexist with the
fact that the sender knows the receiver payoffs.8 We first present the two basic cases, which
either involves only cues or only hard information communication. Next, we turn to the model
that involves both. Then we introduce costly cues because advertising is not free and finally we
introduce a continuous choice of CSR content in the last subsection of the next section.
3 Cues and hard information: when is it strategic to prac-
tice greenwashing?
3.1 Firms know the consumer payoff: hard information communication
This set-up is developed in D & T 05 so we just recall the main results. It is obvious that the firm
has no incentive to send any information if she knows r = rL. So in that case, a firm that has
not invested in CSR will not communicate. The ex-ante probability of the consumer determines
whether he buys or not the product. As one will see, it may be the case that no communication
occurs when r = rH , precisely when the congruence (α) is high. So this is not an absurd decision
of the consumer.
Consider now that r = rH . For a low congruence, α < α∗, the consumer does not choose A
without any communication. Hence, the equilibrium values of communication effort are given6Strategic complements are decisions of two or more players which mutually reinforce each other (Bulow,
Geanakoplos, and Klemperer, 1985).7See section 4 for discussion.8In their article, they consider that the sender ignores the receiver payoffs when cue coexists with hard
information.
9
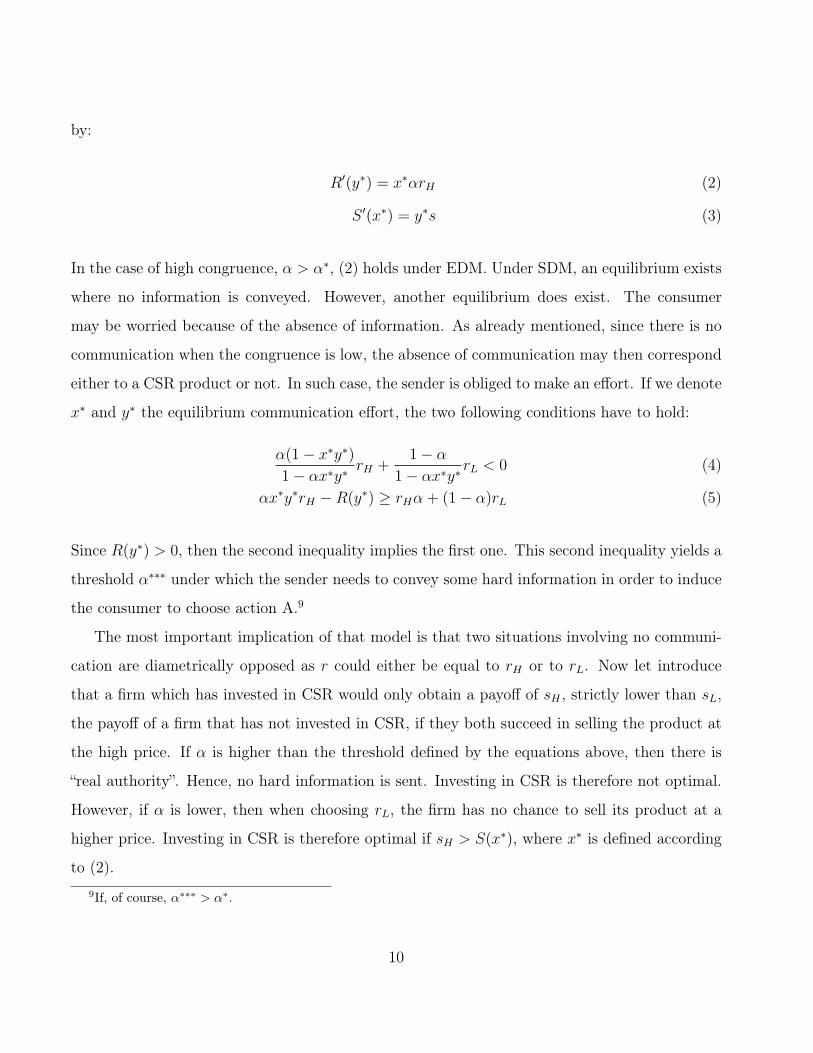
by:
R′(y∗) = x∗αrH (2)
S ′(x∗) = y∗s (3)
In the case of high congruence, α > α∗, (2) holds under EDM. Under SDM, an equilibrium exists
where no information is conveyed. However, another equilibrium does exist. The consumer
may be worried because of the absence of information. As already mentioned, since there is no
communication when the congruence is low, the absence of communication may then correspond
either to a CSR product or not. In such case, the sender is obliged to make an effort. If we denote
x∗ and y∗ the equilibrium communication effort, the two following conditions have to hold:
α(1− x∗y∗)1− αx∗y∗
rH +1− α
1− αx∗y∗rL < 0 (4)
αx∗y∗rH −R(y∗) ≥ rHα + (1− α)rL (5)
Since R(y∗) > 0, then the second inequality implies the first one. This second inequality yields a
threshold α∗∗∗ under which the sender needs to convey some hard information in order to induce
the consumer to choose action A.9
The most important implication of that model is that two situations involving no communi-
cation are diametrically opposed as r could either be equal to rH or to rL. Now let introduce
that a firm which has invested in CSR would only obtain a payoff of sH , strictly lower than sL,
the payoff of a firm that has not invested in CSR, if they both succeed in selling the product at
the high price. If α is higher than the threshold defined by the equations above, then there is
“real authority”. Hence, no hard information is sent. Investing in CSR is therefore not optimal.
However, if α is lower, then when choosing rL, the firm has no chance to sell its product at a
higher price. Investing in CSR is therefore optimal if sH > S(x∗), where x∗ is defined according
to (2).9If, of course, α∗∗∗ > α∗.
10

Result 1 When only hard information can be sent. It is optimal to practice CSR iif
α < α∗∗∗
sH > S(x∗)
3.2 Firms know the payoffs: cues
To begin with cues, we again follow the D & T 05’s framework. We assume communicating cues
is not costly (or negligible compared to the communication of hard information). The effort the
firm makes in communicating cue allows to signal an a priori congruence that is either low, α,
or high, α.
Given that sH < sL, a firm has never the incentive to invest in CSR in that case since she
will bear the same (possibly negligible) cost of signaling for an absolutely identical outcome–A
is chosen–but that would only yield a payoff of sH if she had invested in CSR.
Result 2 When only cues can be sent, it is never optimal to invest in CSR.
3.3 Hard information and cues
The most important aspect when both communication types are mixed is that if equation (4) is
not verified10, the optimal solution is to choose r = rL and to send a cue such that α > α∗∗∗, if
and only if the cost of communicating a cue is not too high. We will refine this below. For now,
we focus on the most simple case. The firm can either signal α, or α, with α = γα + (1 − γ)α,
where γ is the associated probability of α. Hence, this means consumers form expectations over
the probability the firm will be good or not.
Under EDM, there is no equilibrium No-CSR/Cue since cues convey no hard information on
the CSR content of the product. As a consequence, greenwashing is impossible when consumers10If the inequalities are reversed then, as before (5) implied (4), now (4) implies (5).
11

are suspicious. So we will mainly focus on the SDM case. It is worth to note that EDM
corresponds to an a priori congruence equal to zero.
Suppose first that firms are not able to signal more than α < α∗. This could be interpreted
as a world of rather suspicious consumers.
If the firm knows that r = rL, she has no incentive to communicate hard information, so
she does not send a cue. If she knows r = rH , therefore she sends a cue and the equilibrium
communication efforts (xc, yc) are given by
R′(yc) = xcαrH (6)
S ′(xc) = ycs (7)
Here, the optimal communication efforts are both lower for the consumer and the firm, compared
to a situation without cue, for α < α∗ which is assumed here.11
Now, firms can send α > α. First, assume firms can signal α > α∗∗∗. In that case, firms send
the cue and the consumer rubber-stamps the action without any additional communication of
hard information. So if the consumers are very gullible, the optimal action for the firm is to send
cue without investing in CSR. This is a “real authority” situation.
If α ∈ [α∗, α∗∗∗] and the firm knows r = rL, she knows she will not send any hard information,
but she is obliged to, since the consumer doubts about the CSR content of the product if no cue
is sent such that the firm should send some hard information. So the firm will neither send a
cue nor any hard information.
Obviously, if r = rH , then both types of information are sent. The hard information commu-
nication efforts are given by (2) and (3), where α replaces α, under EDM and SDM and under the
condition, for SDM, that equation (5) holds.12 To the contrary, when r = rL, no communication
takes place.
All in all, when r = rL, the consumer would consider buying the product if and only if the
congruence that can be revealed is high enough. When r = rH , the consumer will always consider11Both types of communication are therefore substitutes.12Both types of communication are then complements.
12

buying the product.
Proposition 1 (Hard greenwashing) When cues and hard information communication coex-
ist, if α > α∗∗∗, then the optimal solution is No-CSR/Cue, that is hard (or full) greenwashing.
If α < α∗∗∗, practicing CSR is the only way to sell the product (at a higher price). The
optimal choice depends on the gains the firm obtains relatively to the cost of communicating hard
information.
A cue is always sent by a CSR firm if the ex ante probability, with no communication at all,
is nil.
If, as it will be studied in a next subsection, the sent level of cues is an endogenous choice of
the firm, then the positive probability of hard greenwashing may be dissolved when consumers
revise their preferences.
3.4 Costly cues
Several additional hypotheses are necessary in order to represent more correctly the situation of
the tradeoff between practicing CSR or not and (not) sending soft or hard information about its
content. Assume now that the firm’s cost of cue communication is a function of α, and further
assume that this function has the same properties than the cost function of hard communication
efforts, except for convexity. For the consumer, if there is cue communication, the utility function
is
U = UC = xyαrH −R(y)−Rc (8)
and for the firm
U = UF = xyαsH − S(x)− Sc(α) if CSR is practiced (9)
U = UF = xyαsL − S(x)− Sc(α) otherwise (10)
13

Whereas, if no cue is sent, the terms indexed with c have to be removed.
The cost of the cue is equal to Sc(α) for firms and is constant and negligible for the consumer.
Since we interpret cue communication as ads, it seems rather intuitive to set the cost of assimi-
lating the cue at a very low level for consumers. Consumers are not tracking for advertising, the
probability they see one depends on the effort of firms.
3.4.1 Consumers
The consumer chooses action A under the following conditions. First, if α > α∗∗∗, the consumer
chooses A if and only if rH − rL > Rc since there is no hard information communication. If
α < α∗∗∗, then she chooses A if and only if rH − rL > Rc +R(y).
Recall that action A corresponds to paying the price pH in order to obtain a product that may
contain some CSR. If action A is not taken, then the price is pL and we have that E[U(CSR =
0)]− pL = 0. Otherwise, we have that E[U(CSR = 0)]− pH < 0 if the product does not contain
any CSR and E[U(CSR)] − pH > 0 if it does. It is then possible to write that rH − rL =
E[U(CSR > 0)] − E[U(CSR = 0)]. Moreover, if the hard information is assimilated, the
consumer then chooses A (otherwise, neither the consumer nor the firm would have the incentive
to make a communication effort).
3.4.2 Firm
Either she has not invested in CSR and the lowest cue level she would send is α∗∗∗.13 Under
CSR, the lowest sent level of cue is lower and then the cue is cheaper, but the firm only earns
sH . Conversely, under No-CSR, the lowest level is higher so sending a cue is more expensive but
the reward is higher.
As for the notation, recall that α (and all the upper bar αs) indicates the value the firm has
set, α indicates the ex-ante value. Of course, the firm will have an incentive to send the cue if
and only if the cue signals a probability higher than α.13Here, we still consider that the decision of investing in CSR has already been taken.
14

Result 3 If r = rL, then α = α∗∗∗, if feasible.
Otherwise, no cue is sent.
This result is trivial as once the level α∗∗∗ is reached, the consumer rubber-stamps action A.
Setting a higher α would then be a pure waste of resources. From a more pragmatical point of
view, this would mean that a very good communication plan should be enough to convince a
consumer that a firm is practicing CSR.
Consider now that r = rH . In a cost analysis, the firm will prefer α = α∗∗∗ to α = α∗ if and
only if S[x(α∗)] > Sc(α∗∗∗)− Sc(α
∗), that is if the cost of sending a better cue is lower than the
cost of sending hard information as a complement of the cue. This is true if α∗∗∗ > α∗. However,
as one will see, now that the cue has a cost, only firms having r = rL will have an incentive to
send a very high cue (as is α∗∗∗) in most cases. Such a situation would then be problematic for
rL-firms since they would be the only ones to send such a high cue.
Similarly, the firm prefers an intermediate level α∗∗ ∈ [α∗, α∗∗∗] if and only if S[x(α∗∗)] −
S[x(α∗)] > Sc(α∗)− Sc(α
∗∗).
Lemma 1 If r = rH , then α = α∗∗∗ iif
S[x(α∗)] > Sc(α∗∗∗)− Sc(α
∗) (11)
and α = α∗∗ > α∗ iif
S[x(α∗∗)]− S[(α∗)] > Sc(α∗)− Sc(α
∗∗) (12)
and α = α∗ otherwise.
If the rewards are both large and if the consumer can set a high effort for a quite low cost, then
the higher α, the higher x∗.
Hence, if cues are cheap, both types of communication are substitutes and sending high cues
is preferred to sending hard information. This is true for the moment because sending α∗∗∗ is
feasible. Otherwise, there is a complementarity as both types of information are sent. Two
15

effects are at work. As one or both rewards increase, this tends to increase the positive effect
of α over x∗, so the complementarity is stronger. But increasing the spending on α increases
x∗ and the corresponding spending. Consequently, the complementarity is stronger when both
cost functions have the same properties, such that α∗∗ would be preferred to α∗. Under these
conditions, α∗∗ is preferred and dominates as it corresponds to a higher α and a higher x∗ so the
probability is increased as well as the utility. When x and α are rather substitutes, the situation
is less clear and we need to compare utility levels.
3.4.3 What situation dominates?
If α = α∗, for a given s, the utility is U∗F = x∗y∗α∗s− S[x(α∗)]− Sc(α∗). The equation is similar
for α = α∗∗. When α = α∗∗∗, then the utility is equal to U∗∗∗F = s− Sc(α∗∗∗).
We assume that the utility of a firm that has not practiced CSR is such that U∗∗∗F,L = sL −
Sc(α∗∗∗) > 0. Hence, the GW is profitable. Since sL > sH , No-CSR/Cue dominates CSR/Cue
if α∗∗∗ = α is affordable.
The α∗∗-CSR/Cue dominates No-CSR/Cue if and only if
Sc(α∗∗∗)− Sc(α
∗∗) > sL − x∗y∗sH + S[x(α∗∗)] (13)
First, we can study the necessary condition (since sL > sH):
Sc(α∗∗∗)− Sc(α
∗∗) > sH − x∗y∗α∗∗sH + S[x(α∗∗)] (14)
The necessary condition corresponds to the choice of a firm that has decided to practice CSR
and that has to decide whether to set α equal to α∗∗ or α∗∗∗. If it does not hold, hence the
unique equilibrium would be No-CSR/Cue since a firm that practices CSR prefers to set α to
α∗∗∗ which is dominated by not practicing CSR and sending the same cue.
16

Result 4 If
Sc(α∗∗∗)− Sc(α
∗∗) < sH(1− x∗y∗α∗∗) + S[x(α∗∗)] (15)
the unique equilibrium is hard greenwashing if a firm is aware of this condition when choosing
whether she invests in CSR or not.
Interestingly, if the firm has already taken its decision of investing in CSR, then both types of
firms may be merged (i.e a CSR firm and a no-CSR firm may have set the cue to α∗∗∗).
In the case of substitutability, if the cost of the cue is relatively higher than the cost of sending
hard information, an increase in sH that would yield an increase in α and therefore a decrease
in x∗ would simultaneously decrease the gap between Sc(α∗∗∗) and Sc(α
∗∗), and would decrease
S[x∗(α∗∗)]. If the cost function of cue is steeper than the one of the hard information, an increase
in sH could increase the incentive of practicing greenwashing.
This result is important as it highlights that an increase in the reward of practicing CSR does
not necessarily coincide with a reduction of GW. The reason is that an increase of sH simply
raises the reward the firm is certain to obtain if no hard information is sent. Consequently, a firm
that is more productive in CSR is not necessarily inclined in communicating hard information
and hence in practicing CSR. Therefore, if one extrapolates, a firm that is used to invest in R
& D in order to improve CSR may reach a level which for she will not practice CSR anymore.
Moreover, the reputation she may enjoy because of her history as an investor in R & D should
help her doing this.
Proposition 2 According to the relative elasticities of x, y with respect to sH , of the elasticities
of the cost functions to an increase of x and α, an increase in sH may or may not increases
the incentive to practice CSR.
17

3.5 Continuous choice of the level of CSR
In order to have more practicable empirical predictions, we extend the model to a continuous
choice of CSR level. The timing of events is as follows:
i The firm chooses the CSR level
ii The firm (S) decides the cue and the communication of hard information
iii The consumer (R) receives the cue and the effort to assimilate the hard information
iv Consumer decides to take action A or not.
We assume the firm has a technology such that in order to produce a good that contains a level
rH of CSR, she spends s(rH). Therefore, we have sH = sL − s(rH).
First, several remarks. One could think it is optimal to set a very low level of CSR rH in
order to be credible to the consumer’s eyes. However, if firm communicates on a higher rH , the
level of α that is needed in order to signal a high congruence is lower.
Therefore, the firm has an interest in increasing rH since the cue that corresponds to the rH
announced is lower. That is, a firm that announces a low cue (compared to what is expected
by the consumer) signals a higher content of CSR. However, this could ease the greenwashing
strategy. Indeed, α∗∗∗ also decreases. As we have shown, the “bad” firm has no incentives to
announce a cue other than α = α∗∗∗. Hence, a firm that has a high content in CSR can send a
lower cue without being assimilated to a “bad” firm. As a consequence,
Testable Implication 1 The higher the level of CSR the firm chooses, the lower the cue com-
munication.
With a higher rH , it is possible to set a lower α in order to enter a path with increasing commu-
nication efforts. This result therefore underlines that improving CSR is not done only because
of the consumer taste for CSR but also to facilitate the communication strategy of the firm.
18

3.5.1 Continuous CSR without cue
What does generate an incentive to increase CSR? In order to compare both situations we focus
on the following situation: the firm has to commit to invest the level announced. In other words,
we assume that the announced rH is indeed the one the consumer gets, if firm has practiced CSR.
However in such a case, a firm has an incentive to announce a r∗H such that the ex ante probability
exceeds α∗∗∗. If so, then no firm would invest in CSR, except under EDM. Therefore, we introduce
an important function such that we have rH = ρ(rH)r∗H , where ρ(rH) measures the degree of
trust (or gullibility) of the consumer. It is decreasing and concave in rH , ρ(0) = 1 and ρ(∞) = 0
in order to avoid the possibility for firms to announce r∗H =∞. Firms know the existence of this
characteristic but may not know exactly the function. So now α measures precisely the “quality”
of the communication. The introduction of this parameter allows also a SDM case to become
an EDM or a “quasi-EDM”, that is when α ' 1. Under reasonable assumptions, one could think
that communication costs are such that it is prohibitive to communicate when α is close to one.
From the previous results, we know that a firm that has sent α∗∗∗ = α is necessarily a firm
that has not practiced CSR. The consumer would therefore never buy a product in such case.
Result 5 Without ρ(rH), hard greenwashing is ruled out because confusion between pure green-
washer and CSR firms is impossible. This being due to the fact that no firm that has invested in
CSR would send α ≥ α∗∗∗.
However, ρ(rH) reintroduces the possibility of hard greenwashing because a possible misper-
ception of this function by the firm.
This result is comparable to the one of Baron (2010b) that shows that under unconditional
altruism, adverse selection prevents sorting. The misperception reintroduces adverse selection
that prevents “green consumers” from interacting with “green firms”. Contrary to what Baron
(2010b) finds, here this is the fact firms know exactly the consumers they face that prevents the
hard greenwashing strategy because consumers revise their preferences.
So the gullibility has two effects. It makes the consumers harder to convince but it increases
the communication limit above which the consumer is certain that there is greenwashing. So
19

an important question that will be let for future research is the aggregation problem the firm is
facing. If each consumer exhibits a different function ρi(rH), then a firm will have to differentiate
the communication according to the public, if possible. Otherwise, a given strategy will neces-
sarily oblige the firm to renounce to a share of consumers, those that are the most suspicious.
This has to be taken into account for assessing the greenwashing strategy empirically.
3.5.2 Cues and CSR versus CSR alone
Hence, if a firm fears to face many suspicious consumers, she will not send a high level of cue.
As it has been already shown, the incentive to send a cue depends on rH . Except through
announcing rH = ∞, α < 1 and an incentive to send a cue remains, this is guaranteed by the
function ρ(rH). If it is much more expansive to send a cue, it is preferable to invest in CSR and
vice versa.14
The very important question is to know whether the possibility to send a cue reduces the
optimal level of CSR the firm chooses. Let compare models in which firms can commit to r∗Hif CSR is practiced and we consider the relative incentives of firms willing to practice CSR. As
argued, the possibility of revealing rH does not suppress all incentives to send cues. Moreover,
if cues are relatively cheap compared to the investment in CSR, the firm may prefer a quite
low level of r∗H and sending a high cue. Hence, the possibility of sending a cue, everything else
equal, helps to sell its product with a lower level of CSR. In equation (6), α and rH increases
the effort in hard information communication. However, in that case, a larger cue may increase
communication efforts as a larger rH does it if cues are sendable.
Two opposed effects are at work when the possibility of sending cues is introduced. According
to the effect that dominates, this will increase or decrease the optimal investment in CSR of the
firm. Cues and CSR may either be some complements or substitutes. In case of substitution, we
call this light greenwashing and this is the strategy we will seek to identify empirically.
Proposition 3 (Light greenwashing) If rH is continuous and endogenous, and if firms can14The cue and “announcing rH before” are almost substitutes. Without the function ρ(rH), announcing a
very large rH would always be preferable to sending a cue since it is free. This however allows to introduce thedistinction between the gullibility of the consumers and the reputation through communication of firms.
20

ex ante commit to a level of r∗H they pretend to have invested in, then the presence of cues reduces
the optimal level of CSR.
Proof. We start with the following lemma that states that under No-Cue, an increase of rH has
two opposed effects but that the overall effect is positive:
Lemma 2 For ρ(rH) = ρ, an increase of rH decreases α and increases directly R′(y), the overall
effect is equal to
∂R′
∂rH
= x∗(
rL
ρrH − rL
)2
> 0 (16)
and
∂2R′
∂2rH
= x∗(−2ρrL
(rH − rL)2
) (rL
rH − rL
)< 0 (17)
so the positive effect is decreasing in rH .
If ρ(rH) is not constant, then the first order derivative is equal to
∂R′
∂rH
= x∗r2L + rLr
2Hρ
′(rH)
(ρrH − rL)2 > 0 (18)
Then, consider first what happens if a firm announces ¯rH when no cue can be sent. In that case,
she spends a cost s( ¯rH). In parallel, from lemma 1, an increase in rH increases the communication
effort of the consumer; and an increase in s( ¯rH) reduces the communication effort of the firm.
Now consider a firm that announces rH < ¯rH . From above, the cost in investing in CSR is
lower, so the effort the firm will make will be higher for the hard information. She will however
send a cue. A lower rH means a higher α∗. The effect on the effort of the consumer when passing
from rH to ¯rH generates a positive but small effect from lemma 2.
As a consequence, the firm that can use a cue saves s( ¯rH)− s(rH). She spends Sc(α) more.
The effect on both efforts are ambiguous. Switching from ¯rH to rH implies that the firm effort
is higher because of a higher reward and that the effort of the consumer is lower because of the
21

smaller reward. Then, the difference between the two probabilities ultimately depends on the
elasticity of investing in CSR. The higher it is, the higher the probability under rH .
Therefore, if the cost of sending a cue is not too high, the firm choosing rH may achieve the
same utility under cue than a firm choosing ¯rH under No-Cue.
We call this light greenwashing because firms keep investing in CSR, yet less than without
cues. Several effects are at work. The cost functions are very important. Another very impor-
tant effect passes through ρ(rH). Indeed, the effect on α is not monotonic by assumption. As a
consequence, sending a high r∗H may actually induce an increase of α∗. We have assumed this is
not the case from now on. If it is the case, this would mean that firms face another problem that
obliges them not to announce a too high level of CSR (and then not to invest in a high level of
CSR).
This would switch the relationship presented above between the level of CSR and the cue com-
munication. We have however seen that firms may want to send a cue larger than α∗, so this
additional effect would not be of a great interest.
To conclude on the theoretical model, we propose a framework that encompasses both equi-
libria with an investment in CSR and light greenwashing. The main prediction of the model is
the dual effect of an increase in the level of CSR. It increases the reward for the consumer and the
probability she will buy the product but it also raises incentives to practice light greenwashing.
As the next section will underline, finding some variables in order to measure, even imper-
fectly, the propensity to be a greenwasher, is a complicated task. The theoretical model provides
clearcut conclusions on the CSR and greenwashing: yes CSR is more than communication, how-
ever greenwashing is a serious issue. First, there is always at least a minimum level of investment
in CSR. Second, greenwashing could reduce investment in CSR. Consequently, we will test em-
pirically the key relationships among our three main variables (CSR, soft and hard information).
We can draw several testable implications. First, CSR and communication may be strategic
complements if the level of CSR is high enough and the trust of consumers is sufficient. We
will then expect a non-linear relationship between CSR and communication. Second, the cost of
sending a hard information will be relatively lower if effective level of CSR is high. We expect
22

a positive and linear relationship between CSR and the probability to send a hard information.
Next sections of this paper are therefore an attempt to identify empirically and quantify green-
washing. Soft and hard information communications are therefore first order complements and
second order substitutes. That is, we expect both to present positive, but given that both types
of information are sent, we expect either to observe a lot of hard information communication
relatively to the soft information communication or inversely.
4 Data
In order to test empirically some implications of the theoretical model presented in the previous
sections, we will use different data approximating the level of CSR and the level of communication
related to CSR. According to the model, we need three sets of information (i) the effective level
of social responsibility for the firms, (ii) the “hard information” which is a reliable certification
provided by the firm in order to give a clear assessment of the level of CSR to the consumers,
(iii) the “cues” which is here the non-verifiable information or communication related to CSR
provided by the firm, which can also be seen as advertising.
4.1 CSR, cues and hard information
The level of CSR will be approximated by the extra-financial rating provided by VIGEO for
European firms. The use of these data are in our view the most reliable estimation of the effective
23

level of CSR.15 Igalens and Gond (2005) showed the relevancy of VIGEO-ARESE16 data: “a proxy
that is particularly suitable for Corporate Social Performance, at least from a theoretical point of
view”17. One should notice that the VIGEO ranking is not public and therefore cannot be used
by firms as a way to increase the congruence between firms and consumers, as advertisement or
cue messages. Furthermore, Vigeo ranks all firms included in the Dow Jones Stoxx 600 index,
and not only voluntary firms. This excludes the risk of a possible selection bias. Consumers do
not know the Vigeo ranking for each firm, they can only observe their level of “soft” and “hard
information”.
The most difficult challenge is to find an acceptable proxy of greenwashing and communication
related to CSR. Unfortunately, firms do not have a specific budget for “CSR advertising”. We
could take the general advertising budget but this strategy won’t be satisfying as we cannot
distinguish the firms with a specific strategy linked to social or environmental considerations.
That is why we propose to use the general level of sustainable development reporting as a proxy
of the general level of CSR communication.
In parallel with the rise of social and environmental concerns, the number of extra-financial
reports has exploded in the last years. These reports take various forms. To the contrary of
the financial reports which are compulsory for the firms quoted in the stock-exchange, these
extra-financial reports are not homogenized and are purely voluntary.18
15Cochran and Wood (1984) argued there are two generally accepted measures of CSR: the reputation index(Moskowitz, 1975) or content analysis (such as the data we use here). They found benefits and drawbacks for bothmethods. Tsoutsoura (2004) critized the reputation indexes stating that “it is unclear exactly what these indicatorsmeasure”. Igalens and Gond (2005) add three other measures: the measurements based on analysis of the contentof annual report, the pollution indices, the perceptual measurements derived from questionnaire based survey.Waddock and Graves (1997) drew upon the Kinder Lydenberg Domini (KLD) rating system and used these datato measure CSR. Tsoutsoura (2004) or Siegel and Vitalino (2007) used these measurements. VIGEO can beconsidered as the European counterpart of KLD with comparable methods. Igalens and Gond (2005) comparedKLD and VIGEO-ARESE data and noted some distinctions explained mainly by different cultural sensitivities.Methodologically, they found that the scoring-quality proxy is always more favorable to the VIGEO-ARESE data(see Mattingly and Greening (1999) for a detailed analysis of KLD data.). More recently, authors proposed newtools for measuring corporate contribution to sustainability: the sustainable value-added (Figge and Hann, 2001)but there is no consensus on the relevance of such measurement (Korhonen, 2003)
16The analysis was done on the French extra-financial rating agency ARESE that has merged with VIGEO in2002. We assume former ARESE data and VIGEO data are similar as the same methodology applies.
17However, they insist on the nuances introduced by the observation of the different sub-components of theindex.
18We should notice the development of different laws at the European level concerning social and environmental
24
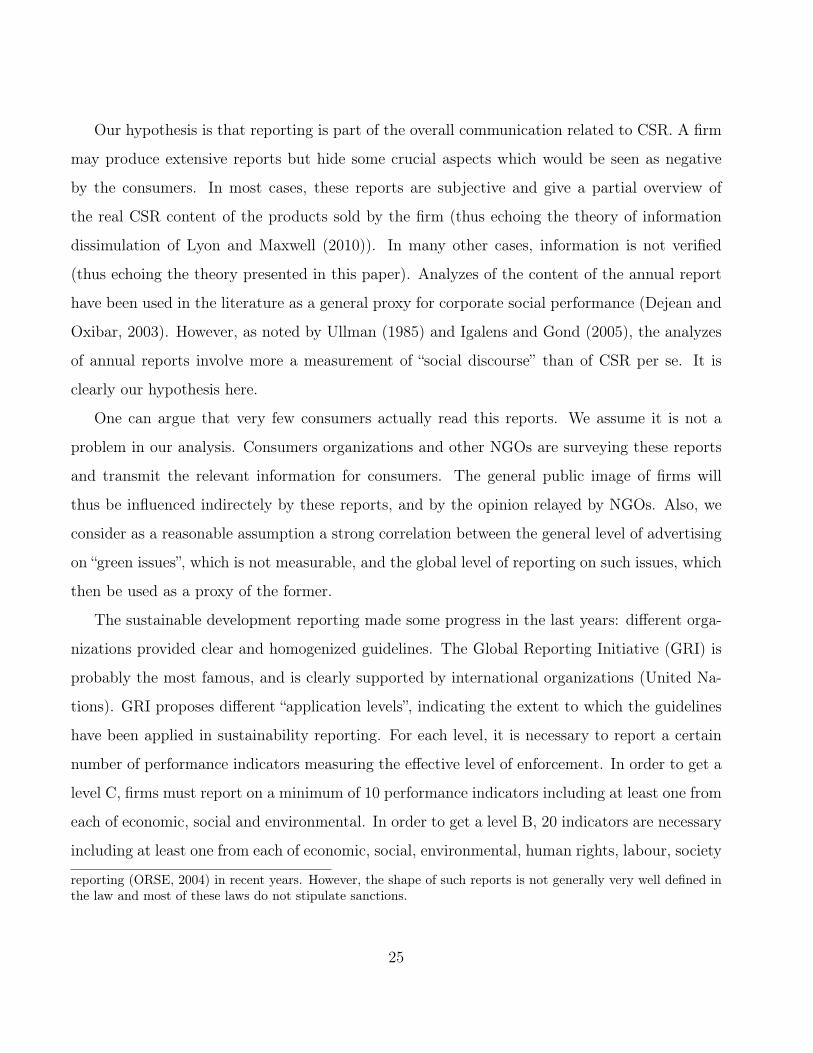
Our hypothesis is that reporting is part of the overall communication related to CSR. A firm
may produce extensive reports but hide some crucial aspects which would be seen as negative
by the consumers. In most cases, these reports are subjective and give a partial overview of
the real CSR content of the products sold by the firm (thus echoing the theory of information
dissimulation of Lyon and Maxwell (2010)). In many other cases, information is not verified
(thus echoing the theory presented in this paper). Analyzes of the content of the annual report
have been used in the literature as a general proxy for corporate social performance (Dejean and
Oxibar, 2003). However, as noted by Ullman (1985) and Igalens and Gond (2005), the analyzes
of annual reports involve more a measurement of “social discourse” than of CSR per se. It is
clearly our hypothesis here.
One can argue that very few consumers actually read this reports. We assume it is not a
problem in our analysis. Consumers organizations and other NGOs are surveying these reports
and transmit the relevant information for consumers. The general public image of firms will
thus be influenced indirectely by these reports, and by the opinion relayed by NGOs. Also, we
consider as a reasonable assumption a strong correlation between the general level of advertising
on “green issues”, which is not measurable, and the global level of reporting on such issues, which
then be used as a proxy of the former.
The sustainable development reporting made some progress in the last years: different orga-
nizations provided clear and homogenized guidelines. The Global Reporting Initiative (GRI) is
probably the most famous, and is clearly supported by international organizations (United Na-
tions). GRI proposes different “application levels”, indicating the extent to which the guidelines
have been applied in sustainability reporting. For each level, it is necessary to report a certain
number of performance indicators measuring the effective level of enforcement. In order to get a
level C, firms must report on a minimum of 10 performance indicators including at least one from
each of economic, social and environmental. In order to get a level B, 20 indicators are necessary
including at least one from each of economic, social, environmental, human rights, labour, society
reporting (ORSE, 2004) in recent years. However, the shape of such reports is not generally very well defined inthe law and most of these laws do not stipulate sanctions.
25

and product responsibility. In addition, a management approach disclosure is needed for each
category. And to get a level A, a management approach disclosure is also necessary and firms
must report on each indicators mentioned in the GRI guidelines.
We then propose an empirical distinction between “soft information” and “hard information”.
Soft information will be measured by the general level of reporting. Hard information will
be surrogated by following the GRI guidelines and thus by reporting on a certain number of
performance indicators. The use of performance indicators cannot be used by greenwashers
because it will reveal their poor performances in terms of CSR. But they can publish sustainable
development reports (without using performance indicators) which will be seen as a specific form
of communication (a “cue message”in D&T).
However as firms are free to focus on specific dimensions of CSR in their report, performance
indicators will also focus on those aspects. This is a major difference with the Vigeo ranking
where firms are evaluated on all dimensions and not only the ones included in the sustainable
development report. The Vigeo ranking which is the basis of the overall CSR measurement, and
the measure of hard information (“Does the firm follow the GRI guidelines and does she report
on performance indicators”) are thus very different. “Sending a hard information” is revealing
that the information contained in the sustainable development report (the “soft information”) is
a “issue-relevant information” and not only a cue message. It is measurable, thanks to the use
of indicators and consumers can have a precise idea of the effective level of firms’ involvement
on the aspects covered by the indicators proposed. On contrary, the VIGEO ranking is a global
information based on the evaluation of all dimensions of CSR and not only the ones covered by
the performance indicators chosen by the firm.
4.2 Index of Corporate Social Responsability
We create an original index of the effective level of CSR based on Vigeo data. Vigeo is a
European extra-financial rating company. Their ratings are used by SRI funds in order to
choose the firms that meet given ethical criteria. From these standards, Vigeo proposes different
CSR principles of universal application translated into action steps for management. They
26

propose 6 evaluations fields and 37 criteria. These fields are: (1) Human Rights, (2) Human
Ressources, (3) Environment, (4) Business Behaviour, (5) Community Involvement, and (6)
Corporate Governance. These objectives are evaluated on the basis of about 200 action steps.
As Vigeo ranking is not public, this value is unknown for consumers.
Vigeo provided detailed data on 595 European firms19. These firms are included in the Dow
Jones Stoxx 600 index, which includes the 600 biggest capitalizations at the European level.20
Out of these 595 firms, 171 are from the United Kingdom, 88 are French and 52 are German.
The banking and insurance sectors are the most represented in the sample, with respectively 64
and 35 firms.21
The main goal of the analysis is to see whether we can observe global patterns of behavior
regarding different CSR aspects and to give an assessment of the global level of CSR according
to the different items. Data analysis is a very useful methodology to reach these two main
objectives. Igalens and Gond (2005) propose to use data analysis to evaluate the quality of the
scoring. We will then use the same methodology to get global estimates of the general level of
CSR using Principal Component Analysis (PCA).22
The first axis can be interpreted as a proxy of the general level of CSR. We make this
hypothesis considering the high correlation between each of the Vigeo items and the coordinates
on the first axis. The correlation between the coordinates on the first axis and the performance
in terms of Human Resources, Human Rights, Business Behavior, and Environment is very
high (over 0,80). This correlation is lower with community involvement (0.73) and corporate
governance (0.46).23 The more positive is the coordinate on the first axis, the better is the CSR
performance for the firm. In order to facilitate the interpretation of the index, we will transform19Vigeo is extending the coverage of the database to American and Asiatic firms. However, the coverage is not
yet significant. We then limit our analysis to European firms.20We don’t have exactly 600 firms in the database because of the exit or entry of some firms during the period.21See Bazillier and Vauday (2009) for a more detailed description of the Vigeo data.22See Bazillier and Vauday (2009) for a more detailed presentation of the PCA results.23This lower influence of community involvement and corporate government is consistent with the definition of
corporate social responsibility. Corporate governance can be considered as a broader concept than CSR itself andcommunity involvement relates to activities not directly linked to the main activity of the firm, which is beyondthe goal of CSR.
27

the coordinates on the first axis into an index included between 0 (the worst performance in
terms of CSR) and 1 (the best performance in terms of CSR). We call this variable RSENORM.
According to this interpretation of the first axis, the best performances in terms of CSR
are observed in Norway (0,59), in the Netherlands (0,55) and in France (0,54). The worst
performances are observed in Iceland (0,14), Ireland (0,26) and Greece (0,29). In terms of
sectors, the best performances are observed in the sector of waste and water utilities (0,61),
in the chemical sector (0,60) and in the energetic sector (0,60). On the other side, the food
sector (0,35), and the mechanical component sector (0,41) have the worst marks in terms of CSR
performance.
4.3 An estimation of the CSR-related communication: the level of
CSR-reporting
We collected for each firm of our sample different information on their CSR reports. For this,
we use Corporateregister.com which is a global directory of CSR resources, including a CSR
report directory. Thanks to this directory, it is possible to determine whether or not the firms
have already produced a report, how many reports were produced, how many pages each reports
contain, the type of report and if the firm was member of Global Compact, GRI or AA1100.
Of course, having numerous, extensive, reports does not mean as such that the company has
a global strategy of greenwashing. However, thanks to the comparison with our first index
of CSR, we are able to detect some “usual suspect” that have the specificity to have a huge
reporting/communicating activity but a very low level of CSR.
From these data, we will build two measures of CSR-communication: communication ex-
perience (measured by the total number of reports) and the communication effort which is
a combination of (1) number of reports per year and (2) the number of pages for the last report.
We assume to retain only a quantitative measure of CSR-related communication. We are
not interested here in a content-analysis to evaluate the quality of such reports. Here, what
we need is an evaluation of the quantity of “cue messages” sent by firms in order to raise the
28

congruence between them and consumers. If the information is verified by an external source, it
becomes an “issue relevant information” (a hard information). The real level of CSR is unknown
by consumers (it is typically a credence good) and is proxied by the CSR index built from VIGEO
data.
Table 1 presents descriptive statistics for these variables.
Table 1: Descritive statistics: CSR reportsVariables Mean Std. Dev. Min Max
Number of Reports 4.82 4.95 0 29Year of the first report 2001 4.03 1975 2008
Number of Pages (last report) 47.81 60.71 0 436Number of Reports (per year) 0.58 0.62 0 2.4
Variable Yes (%) No (%)Report 70.66% 29.34%
GRI 31.42% 68.58%GRI: level C 9.81%GRI: level B 8.29%GRI: level A 9.3%
Global compact 12.94% 87.06%AA1000 3.53% 96.47%
Source: Corporateregister.com, data collected by the authors
5 Empirical specification and results: who are the usual
suspects?
In this section, we test empirically some of the model’s implications. First, we propose an
estimate of the determinants of CSR measured by our index RSENORM in order to see if the
communication behavior has an influence on the level of CSR. Second, we estimate empirically
the determinants of the GRI application level (proxy of the “hard information”).
5.1 Determinants of the level of CSR and influence of communication
According to the theoretical model, we should observe a non-linear relationship between the
effort of communication and CSR: if the communication effort is very high, it may be explained
29
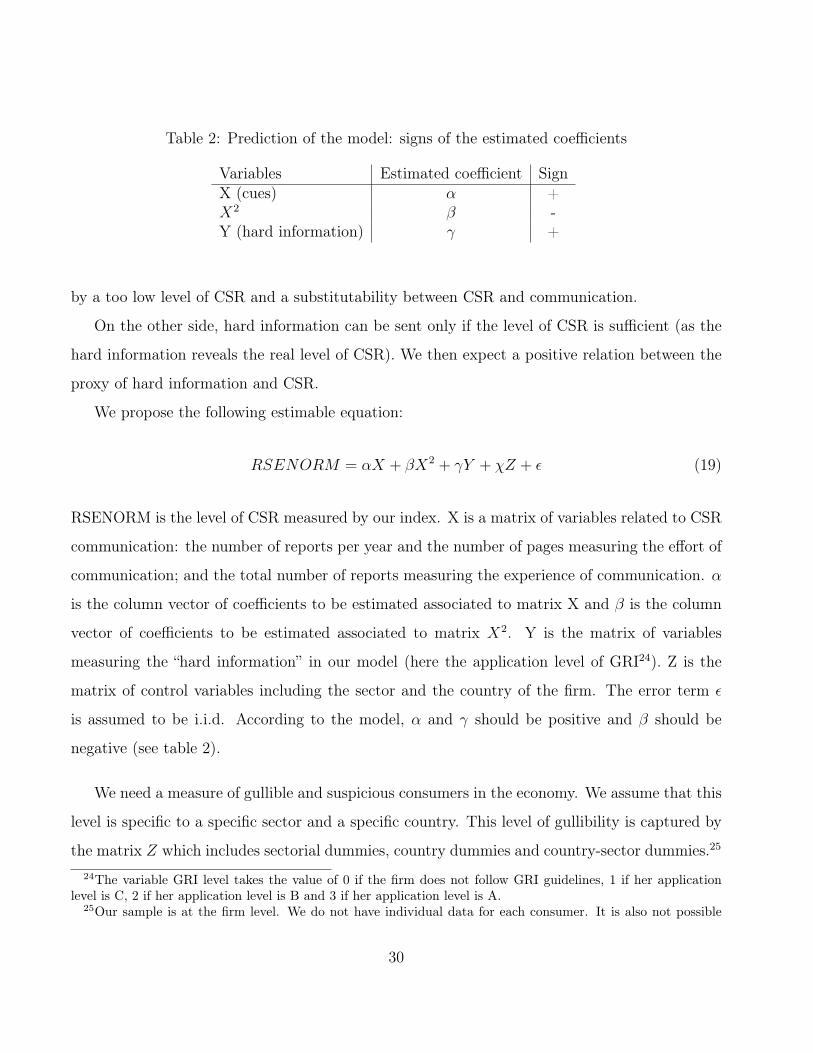
Table 2: Prediction of the model: signs of the estimated coefficients
Variables Estimated coefficient SignX (cues) α +X2 β -Y (hard information) γ +
by a too low level of CSR and a substitutability between CSR and communication.
On the other side, hard information can be sent only if the level of CSR is sufficient (as the
hard information reveals the real level of CSR). We then expect a positive relation between the
proxy of hard information and CSR.
We propose the following estimable equation:
RSENORM = αX + βX2 + γY + χZ + ε (19)
RSENORM is the level of CSR measured by our index. X is a matrix of variables related to CSR
communication: the number of reports per year and the number of pages measuring the effort of
communication; and the total number of reports measuring the experience of communication. α
is the column vector of coefficients to be estimated associated to matrix X and β is the column
vector of coefficients to be estimated associated to matrix X2. Y is the matrix of variables
measuring the “hard information” in our model (here the application level of GRI24). Z is the
matrix of control variables including the sector and the country of the firm. The error term ε
is assumed to be i.i.d. According to the model, α and γ should be positive and β should be
negative (see table 2).
We need a measure of gullible and suspicious consumers in the economy. We assume that this
level is specific to a specific sector and a specific country. This level of gullibility is captured by
the matrix Z which includes sectorial dummies, country dummies and country-sector dummies.25
24The variable GRI level takes the value of 0 if the firm does not follow GRI guidelines, 1 if her applicationlevel is C, 2 if her application level is B and 3 if her application level is A.
25Our sample is at the firm level. We do not have individual data for each consumer. It is also not possible
30

The sectorial dummies would capture the general level of credibility of a specific sector, all over
Europe. For example, if the chemical sector has to face a higher level of public scrutinity, it
will affect the relationship between communication and CSR that would be captured by this
dummy. Country dummies will capture national characteristics. And country-sector dummies
would capture the different sensibilities of consumers from different countries among sectors. For
instance, if British consumers are more concerned by social responsibility of banks than other
countries, it would be captured by this specific dummy.
One other concern is the one of endogeneity. If for instance large firms have a cost advantage
in new technology and in advertising, they could invest more in what VIGEO labels as green
while also filing more reports in general, just because they are larger. We assume it is not an issue
here, due to the strong homogeneity of firms included in our sample. This sample includes the
600 largest firms at the European level quoted at the Stock exchange. These firms are relatively
homogeneous within a specific sector in terms of number of employees, and access to technology.
It may exist large disparities among firms but most of this heterogeneity would be captured by
our sectorial dummies, country dummies and country-sector dummies. One can also consider
that the structure of firm ownership may affect both communication strategy, and CSR. Once
again, as we focus only firms quoted on the stock exchange, this heterogeneity is mostly limited.
We propose three estimates using our alternative proxies of soft information (the total number
of report, the number of pages for the last report and the number of report per year).26 We
first includes only country and sector dummies and then country, sector and country-sector
dummies.27 Results are presented in table 3.
The results (table 3) are consistent with the theoretical framework. We observe a non-linear
to find a specific measure of credibility for each firm of our sample. Our strategy to capture at the country andsector level is in our view the most appropriate here.
26Due to a high correlation between alternative proxies of soft information (confirmed by the calculation of theVariance Inflation Factor), we cannot include all these proxies simultaneously. One should notice however thatour results are still valid when country dummies and sector dummies are used. When including all dummies,some variables loose their significance level due to a too high level of multicollinearity.
27Due to a high correlation between country dummies, sector dummies and country-sector dummies, a lot ofthese dummies are dropped in the estimation when we include all dummies simultaneously. We thus test toestimate the model using only country-sector dummies. Results are unchanged.
31

relation between the effort of communication and the level of CSR. The application level of GRI
is positively correlated with the level of CSR. An interesting result is that all our three measures
of CSR take the expected sign. Concerning the proxy of CSR efforts, it can be explained by the
fact that firms with very low level of CSR have an incentive either to not invest in communication
or to invest a lot in communication (greenwashing). This latter case is represented in our results
by the decreasing relation between CSR level and CSR communication beyond a certain turning
point of communication. After this threshold, the lowest is the CSR, the highest will be the
investment in communication.
Concerning the proxy of communication experience, this can be linked to one intuition of
the model related to the respective level of CSR productivity and CSR. Our model suggests the
intuition that a firm will have an incentive to decrease her level of CSR if her level of credibility
is high enough. This increased credibility is explained by two aspects. The first one is an effect
of “CSR efficiency”. The past investments in CSR will increase the efficiency of the current
investment. The second one, not directly suggested by the model but relatively obvious here, is
an effect of reputation.
Lind and Mehlum (2007) consider that a significant quadratic term is a too weak criteria
to confirm the existence of an inverted U-shape curve. They propose to check if the turning
point is in the data interval and to test the slope on the interval’s beginning and ending. They
also propose to use a test developed by Sasabuchi (1980) which measures the significance of the
inverted-U shape curve. Table 4 presents the result of these tests.28 The Sasabuchi test confirms
the existence of an inverted U-shape for our three variables of communication. The estimated
turning point is always included in the interval. The slope of the curve takes the expected sign
in all cases.28We only present results obtained using country and sector fixed effects. Results are similar when using also
country-sector dummies.
32

Table 3: OLS estimates of CSR(1) (2) (3) (4) (5) (6)
Dep. Var. RSENORM RSENORM RSENORM RSENORM RSENORM RSENORMNumber of Pages (last report) 0.00280*** 0.00253***
(9.004) (5.345)[Number of Pages (last report)]2 -6.12e-06*** -6.71e-06***
(-5.200) (-3.786)Number of Reports (Total) 0.0404*** 0.0368***
(9.690) (6.919)[Number of Reports (Total)]2 -0.00132*** -0.00113***
(-4.983) (-3.821)Number of Reports (per year) 0.166*** 0.139***
(8.852) (5.755)[Number of Reports (per year)]2 -0.00937*** -0.00767***
(-8.321) (-5.379)GRI application level 0.0414*** 0.0350*** 0.0495*** 0.0408*** 0.0302*** 0.0482***
(5.271) (4.631) (6.191) (3.236) (2.606) (3.974)Constant 0.442*** 0.402*** 0.0461 -0.222*** -0.419*** -0.408**
(4.628) (3.578) (0.902) (-4.278) (-11.48) (-2.226)Observations 582 587 591 582 587 591R-squared 0.529 0.578 0.538 0.720 0.751 0.726Country-specific fixed effects Yes Yes Yes Yes Yes YesSector fixed effects Yes Yes Yes Yes Yes YesCountry-sector fixed effects No No No Yes Yes YesRobust t-statistics in parentheses*** p<0.01, ** p<0.05, * p<0.1
Table 4: Test for U-shaped (Lind and Mehlum, 2007)
Var. Number of pages Number of reports Number of reports(last report) (per year)
Interval. [0,436] [0,29] [0,16]Slope at lower bound .0028019 *** .0404302*** .1656424 ***Slope at upper bound -.002537*** -.0359247*** -.1342939***
Sasabuchi Test for inverse U-shaped 3.33*** 3.10*** 6.93***Turning Point 228.82 15.36 8.84
95% confidence interval for extreme point [192.53022; 302.11962] [12.841414; 20.847268] [8.1865497; 9.602791](Fieller method)
Note : With ***, ** and * respectively denoting significance at the 1%, 5% and 10% levels
33

5.2 The probability to send a “hard information”: interactions between
the level of CSR and communication
“Hard information” in our model is approximated by the application level of GRI. This application
level takes a value included between 0 (the firm does not follow GRI guidelines) and 3 (the firm
has an application level A). We start with a latent regression where GRI∗ is unobserved.
GRI∗ = λRSENORM + ϕX + ηX.RSENORM + γZ + ε (20)
RSENORM is our index of CSR and λ the estimated coefficient associated to RSENORM.
X is the matrix of variables related to CSR communication and ϕ the column vector associated
to the matrix X. Z is a set of control variables (including the sector and the country of the
firm). The interaction term X.RSENORM measures a possible crossed effect of CSR and
communication on the probability to send a hard information. To come back to the model, if
we look to equations (16) and (17), we can see that rH affects negatively the effect of α on the
optimal effort of hard information. This can be observed empirically by the inclusion of this
term of interaction. More precisely, we suppose that the CSR level has an heterogeneous effect
on the probability of sending a hard information. This heterogeneity can be modeled through
random coefficient models but we choose a more simple hypothesis. Here, we suppose that the
heterogeneity is a function of the level of CSR communication (X). Thus, the final effect of
CSR on the probability of sending a hard information will also depend on the respective level of
communication.
If GRI∗ is unobserved, what we do observe is:
GRI = 0 if GRI∗ ≤ 0,
GRI = 1 if 0 ≤ GRI∗ ≤ µ1,
GRI = 2 if µ1 ≤ GRI∗ ≤ µ2,
GRI = 3 if µ2 ≤ GRI∗
34

Table 5: Ordered Probit estimates of hard information (GRI)(1) (2) (3) (4) (5) (6)
Dependant Variable GRI level GRI level GRI level GRI level GRI level GRI levelCSR 4.030*** 4.828*** 2.610*** 5.098*** 8.041*** 3.302***
(7.733) (5.872) (4.721) (5.921) (5.954) (3.048)Number of Pages (last report) 0.0147*** 0.0153**
(4.186) (2.569)CSR x Number of Pages -0.0145*** -0.0142
(-2.697) (-1.522)Number of Reports (per year) 1.600*** 3.542***
(4.045) (4.694)CSR x Number of Reports per year -1.743** -4.459***
(-2.383) (-3.899)Total number of Reports 0.112** 0.331***
(2.475) (3.595)CSR x Number of Reports 0.0108 -0.164
(0.154) (-1.212)Country-specific fixed effects Yes Yes Yes Yes Yes YesSector fixed effects Yes Yes Yes Yes Yes YesCountry-sector fixed effects No No No Yes Yes YesObservations 582 591 591 582 591 591Pseudo R2 0.2837 0.2798 0.2966 0.5117 0.5137 0.5399Robust z-statistics in parentheses*** p<0.01, ** p<0.05, * p<0.1
The µi are unknown parameters to be estimated with φ, ϕ, η and γ. We assume that ε is
normally distributed across observations. We use a robust ordered probit estimator. Results are
presented in table 5.
Both communication and CSR are positively correlated with the probability to send a higher
level of hard information. The interaction term is negative for the number of pages and the
number of report per year (our two proxies of communication effort). However, the estimated
coefficient of the interaction term should be interpreted cautiously. As shown by Ai and Norton
(2003), the magnitude of the interaction effect in non-linear models does not equal the marginal
effect of the interaction term and can be of opposite sign. We thus use the methodology used by
Ai and Norton (2003) to estimate correctly the magnitude and standard errors of the interaction
effect. Our main result is confirmed. For the two significant interaction effects (CSR x Number
of Pages and CSR x Number of Reports per year), the correct interaction effect is negative for
almost all observations in the sample.
If a firm makes CSR and communicates, increasing her level of CSR will decrease the cost of
sending the optimal cue. In the model, this reduces the effort of communication from the con-
35

sumers. At the equilibrium, this will also reduce the effort of communication (hard information)
from the firm. The probability to send the hard information will thus be reduced.
6 Conclusions
The study of the greenwashing phenomenon is new in economics, and this paper provides some
elements in order to characterize it both theoretically and empirically. We acknowledge that
some of the assumptions, be they empirical or theoretical, may seem not exhaustive or even
misleading. We however argue that there is a convergence between theoretical and empirical
approaches towards the same conclusions. Some typical behaviors of greenwashers have indeed
been identified.
The non-linearity between CSR and communication is theoretically predicted and empirically
verified, confirming the light greenwashing strategy highlighted by the theory. The main predic-
tion of the model is indeed the dual effect of an increase in the level of CSR. It increases the
reward for the consumer and the probability it will buy the product but it also raises incentives
to practice light greenwashing.
The CSR level is showed to affect positively the probability of sending “hard information” in
order to convince sceptical consumers. However, the interaction variable between CSR and com-
munication is negative. Theoretically, if a firm both invests in CSR and communicates and if
this firm decides to increase her level of CSR, this reduces the cost of sending the optimal cue
and then reduce the effort of communication. At the equilibrium, this also reduces the incentive
for the firm to send a hard information.
The greenwashing strategy may indeed represent a serious issue for the development of CSR
practices. Active consumers lobbies represent a solution in order to increase the transmission of
the hard information and to decrease the cost of sending it for firms. Public regulation should
also help reducing this phenomenon, as it appears that sectors under strong public scrutiny are
not those that are tempted by greenwashing. So the trust of decision makers is as important
as the one of consumers. A particular concern is that firms that used to be active in CSR may
36

gain in credibility such that they will be in position to practice greenwashing easily. Hence, it is
highly important that following important efforts in CSR, regulations are set in order to avoid
these firms to become too “lazy”.
This last point is echoing one of the results of Baron (2010b). He indeed shows that from a nor-
mative point of view, public regulation is increasing in the quality of self-regulation. We draw
the same conclusion because one needs to prevent firms from reducing their CSR investment once
they have reached a high level of credibility. So the higher the quality of the effort in CSR, the
higher should be the publicly regulated threshold. He also shows that from a positive point of
view a high level of self regulation should reduce the political support for public regulation. We
suggest that because of greenwashing this could not be the case as the higher the effort in CSR,
the higher the probability a firm will greenwash. Despite there are no dynamics in our model,
there is indeed a strong presumption that former investments in CSR increase the credibility of
a firm everything else being equal, thus increasing the opportunity of greenwashing.
We believe that putting the light on the greenwashing behaviour and highlighting how to detect
it is the best way to circumvent it.
References
Ai, C., and E. C. Norton (2003): “Interaction terms in logit and probit models,” Economics
Letters, 80(1), 123–129. 35
Andreoni, J. (1990): “Impure Altruism and Donations to Public Goods: A Theory of Warm
Glow Giving,” The Economic Journal, 100(401), 464–477. 8
Baron, D. P. (2001): “Private Politics, Corporate Social Responsibility and integrated strat-
egy,” Journal of Economics & Management Strategy, 10(1), 7–45. 2, 4
(2009a): “The Economics and Politics of Corporate Social Performance,” Stanford
Graduate School of Business Research Paper No. 1993R. 4
37

(2009b): “A Positive Theory of Moral Management, Social Pressure, and Corporate
Social Performance,” Journal of Economics & Management Strategy, 18(1), 7–43. 4
(2010a): Business and its environment, 6th ed.Upper Saddle River, New Jersey: Pearson
Prentice Hall. 4
(2010b): “Morally-Motivated Self-Regulation,” American Economic Review, Forthcom-
ing, –. 5, 19, 37
Baron, D. P., and D. Diermeier (2007): “Strategic Activism and Nonmarket Strategy,”
Journal of Economics & Management Strategy, 16(3), 599–634. 4
Bazillier, R., and J. Vauday (2009): “The Greenwashing machine: is CSR more than com-
munication?,” Document de Recherche du LEO, 2009-10. 27
Bulow, J., J. Geanakoplos, and P. Klemperer (1985): “Multimarket oligopoly: strategic
substitutes and strategic complements,” Journal of Political Economy, 93, 488–511. 9
ChristianAid (2004): “The real face of corporate social responsibility,” Discussion paper, Chris-
tian Aid, UK. 2
Cochran, P., and R. Wood (1984): “Corporate Social Responsability and Financial Perfor-
mance,” The Academy of Management Journal, 27(1), 42–56. 24
Darby, M. R., and E. Karni (1973): “Free competition and the optimal amount of fraud,”
Journal of Law and Economics, 16, 67–88. 7
Dejean, and Oxibar (2003): “An Alternative Approach to Evaluate Corporate Social Perfor-
mance,” Paper Presented at European Accounting Association Congress, April, Sevilla. 25
Dewatripont, M., and J. Tirole (2005): “Modes of Communication,” Journal of Political
Economy, 113(6), 1217–1238. 3, 5
Dickson, M. (2001): “Utility of No Sweat Labels for Apparel Consumers: Profiling Label Users
and Predicting Their Purchases,” The Journal of Consumers Affairs, 35(1), 96–119. 6
38
Dulleck, U., R. Kerschbamer, and M. Sutter (2010): “The Economics of Credence
Goods: On the Role of Liability, Verifiability, Reputation and Competition,” American Eco-
nomic Review, Forthcoming, –. 7
Figge, F., and T. Hann (2001): “Sustainable value added - measuring corporate contributions
to sustainability,” The 2001 Business Strategy and the Environment Conference Proceedings.
ERP Environment: Shipley; 83-92. 24
Friedman, M. (1962): Capitalism and Freedom. Chicago: University of Chicago Press. 2
Gabaix, X., and D. Laibson (2006): “Shrouded Attributes, Consumer Myopa, and Information
Suppression in Competitive Markets,” The Quarterly Journal of Economics, 121(2), 505–540.
7
Garriga, E., and D. Melé (2004): “Corporate Social Responsability theories: Mapping the
territory,” Journal of Business Ethics, 53, 51–74. 4
Gendron, C., A. Lapointe, and M. Turcotte (2004): “Responsabilité sociale et régulation
de l’entreprise mondialisée,” Relations industrielles/industrial relations, 59(1), 71–100. 2
Igalens, J., and J. Gond (2005): “Measuring Corporate Social Performance in France: A
Critical and Empirical Analysis of ARESE Data,” Journal of Business Ethics, 56(2), 131–148.
24, 25, 27
Jones, M. (1996): “Corporate Social Responsability: Missing the forest for the trees,” Business
& Society, 35(1). 2
Korhonen, J. (2003): “Should we measure corporate social responsibility?,” Corporate Social
Responsibility and Environmental Management, 10(1), 25–39. 24
Lind, J. T., and H. Mehlum (2007): “With or Without U? - The appropriate test for a U
shaped relationship,” MPRA Paper 4823, University Library of Munich, Germany. 32, 33
39
Lyon, T. P., and J. W. Maxwell (2010): “Greenwash: Corporate Environmental Disclosure
under Threat of Audit,” Journal of Economic and Management Strategy, Forthcoming, –. 5,
6, 25
Mattingly, J. E., and D. W. Greening (1999): “Corporate Social Performance Orienta-
tions: An Exploratory Investigation of Dimensionality and Taxonomy Underlying the KLD
Company Profiles Database,” in Proceedings of the Thirteenth annual Meeting of the Inter-
national Association for Business and Society, ed. by D. Windsor, and S. A. Welcomer, pp.
96–99. 24
McWilliams, A., and D. Siegel (2001): “Corporate Social Responsability and Financial
Performance: a theory of the firm perspective,” Academy of Management Review, 26, 112–
127. 4
Mitchell, R., B. Agle, and D. Wood (1997): “Toward a theory of stakeholder identification
and salience: defining the principle of who and what really counts,” Academy of Management
Review, 11(4), 815–828. 2
MORI (2000): “European Attitudes towards Corporate Social Responsibility,” Research for CSR
Europe. London: MORI. 6
Moskowitz, M. (1975): “Profiles in corporate responsability,” Business and Society Review,
13, 29–42. 24
Nelson, P. (1970): “Information and consumer behavior,” Journal of Political Economy, 78,
311–329. 4, 7
Nelson, P. (1974): “Advertising as information,” Journal of political economy, 82, 729–754. 4
Odgen, S., and R. Watson (1999): “Corporate Performance and stakeholder management:
balancing shareholder and customer interests in the UK privatized water industry,” Academy
of Management Journal, 42(5), 536–538. 2
40

ORSE (2004): “Rapport remis au gouvernement sur le bilan critique de la loi NRE,” Discussion
paper, ORSE, Paris, France. 25
Pelsmacker, P., L. Driesen, and G. Rayp (2001): “Corporate Performance and stake-
holder management: balancing shareholder and customer interests in the UK privatized water
industry,” The Journal of Consumer Affairs, 39(2), 363–384. 6
Sasabuchi, S. (1980): “A test of a multivariate normal mean with composite hypotheses deter-
mined by linear inequalities,” Biometrika, 67, 429–39. 32
Siegel, D., and D. Vitalino (2007): “An empirical analysis of the strategic use of Corporate
Social Responsibility,” Journal of Economics and Management Strategy, 16(3), 773–792. 4, 24
Tassi, L., B. Collomb, and B. Saincy (2009): “Entreprise, syndicat, ONG : trois points de
vue sur la RSE,” Sociologies Pratiques, 18(1), 7–28. 2
Tsoutsoura, M. (2004): “Corporate Social Responsability and Financial Performance,” Uni-
versity of California, Berkeley, WP. 24
Ullman, A. (1985): “Data in Search of a Theory: A Critical Examination of the Relation-
ship Among Social Performance, Social Disclosure and Economic Performance of US firms,”
Academy of Management Review, 10, 540–557. 25
Waddock, S., and S. Graves (1997): “The corporate social performance / financial perfor-
mance link,” Strategic Management Journal, 18(4), 303–319. 24
41