
The Good, the Bad and the Muffled: the Impact of Different Degradations on Internet Speech Anna...
26
The Good, the Bad and the Muffled: the Impact of Different Degradations on Internet Speech Anna Watson and M. Angela Sasse Dept. of CS University College London, London, UK Proceedings of ACM Multimedia November 2000
-
date post
19-Dec-2015 -
Category
Documents
-
view
219 -
download
3
Transcript of The Good, the Bad and the Muffled: the Impact of Different Degradations on Internet Speech Anna...

The Good, the Bad and the Muffled: the Impact of Different Degradations on Internet Speech
Anna Watson and M. Angela Sasse
Dept. of CS
University College London, London, UK
Proceedings of ACM Multimedia
November 2000

Introduction
• Multimedia conference is a growing area
• Well-known that need good quality audio for conferencing to be successful
• Much research focused on improving delay, jitter, loss
• Many think bandwidth will fix– But bandwidth has been increasing exponentially
while quality not!

Motivation
• Large field trial from 1998-1999– 13 UK institutions
– 150 participants
• Recorded user Perceptual Quality
• Matched with objective network performance metrics
• Suggested that network was not primary influence on PQ!

Example: Missing Words Throughout
• But loss usually far less than 5%!
- 1 hourMeeting- UCL to Glasgow
Problems Cited
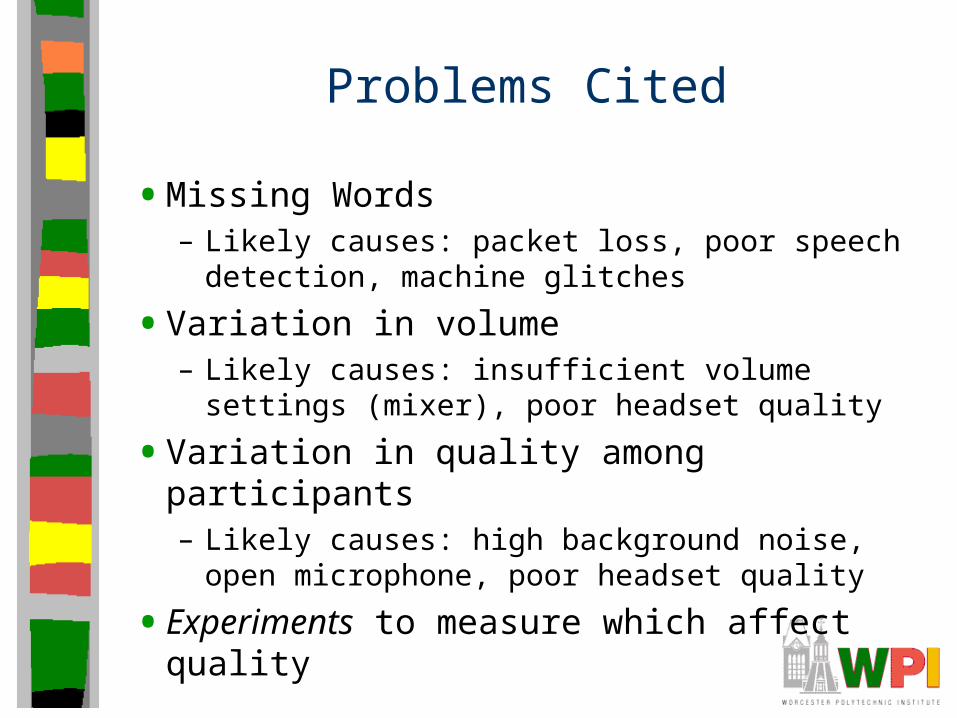
• Missing Words– Likely causes: packet loss, poor speech detection,
machine glitches
• Variation in volume– Likely causes: insufficient volume settings (mixer),
poor headset quality
• Variation in quality among participants– Likely causes: high background noise, open
microphone, poor headset quality
• Experiments to measure which affect quality

Outline
• Introduction
• Experiments• Results
• Conclusions

Audioconference Fixed Parameters
• Robust Audio Tool– Home brewed in UCL
– Limited repair of packet loss
• Coded in DVI
• 40 ms sample size
• Use “repetition” to repair lost packets

Audioconference Variables
• Packet loss rates– 5% (typical) and 20% (upper limit to tolerate)
• ‘Bad’ microphone– Hard to measure, but Altai A087F
• Volume differences– Quiet, normal, loud through “pilot studies”
• Echo– From open microphone

Measurement Methods: PQ
• Not ITU (see previous paper)
• Subjective through “slightly” labeled scale
• “Fully subscribe that … speech quality should not be treated as a unidimensional phenomenon…”• But …

Measurement Method: Physiological
• User “cost”– Fatigue, discomfort, physical strain
• Measure user stress– Using a sensor on the finger
• Blood Volume Pulse (BVP)– Decreases under stress
• Heart Rate (HR)– Increases under stress (“Fight” or “Flight)

Experimental Material
• Take script from ‘real’ audioconference
• Act-out by two males without regional accents
• Actors on Sun Ultra workstations on a LAN– Only audio recorded
– 16 bit samples
– Used RAT
– Used silence deletion (hey, proj1!)
• Vary volume and feedback (speakers to mic)
• Split into 2-minute files, 8Khz, 40 ms packets
• Repetition when loss
Experimental Conditions
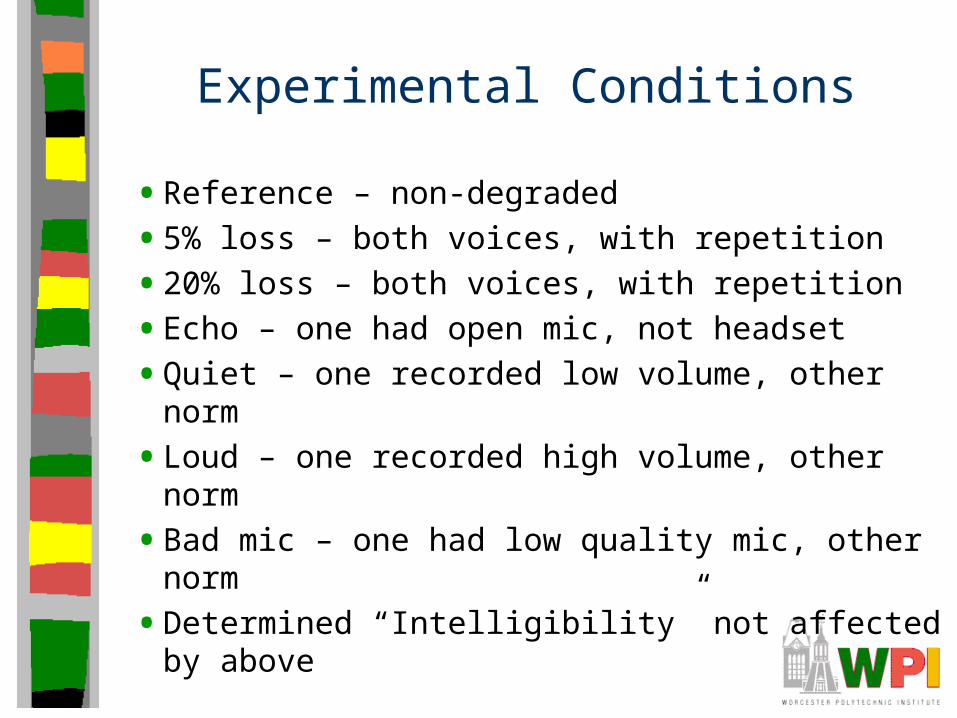
• Reference – non-degraded
• 5% loss – both voices, with repetition
• 20% loss – both voices, with repetition
• Echo – one had open mic, not headset
• Quiet – one recorded low volume, other norm
• Loud – one recorded high volume, other norm
• Bad mic – one had low quality mic, other norm
• Determined “Intelligibility” not affected by above

Subjects
• 24 subjects – 12 men
– 12 women
• All had good hearing
• Age 18 – 28
• None had previous experience in Internet audio or videoconferencing

Procedure• Each listened to seven 2-minute test files
twice– Played with audio tool
• First file had no degradations (“Perfect”)– Users adjusted volume– Were told it was “best”
• Randomized order of files – Except “perfect” was 1st and 8th
– So, 7 conditions heard once than another order
• Baseline physiological readings for 15 min
• When done, use 1-100 slider and explain rating (tape-recorded)

Outline
• Introduction
• Experiments
• Results• Conclusions
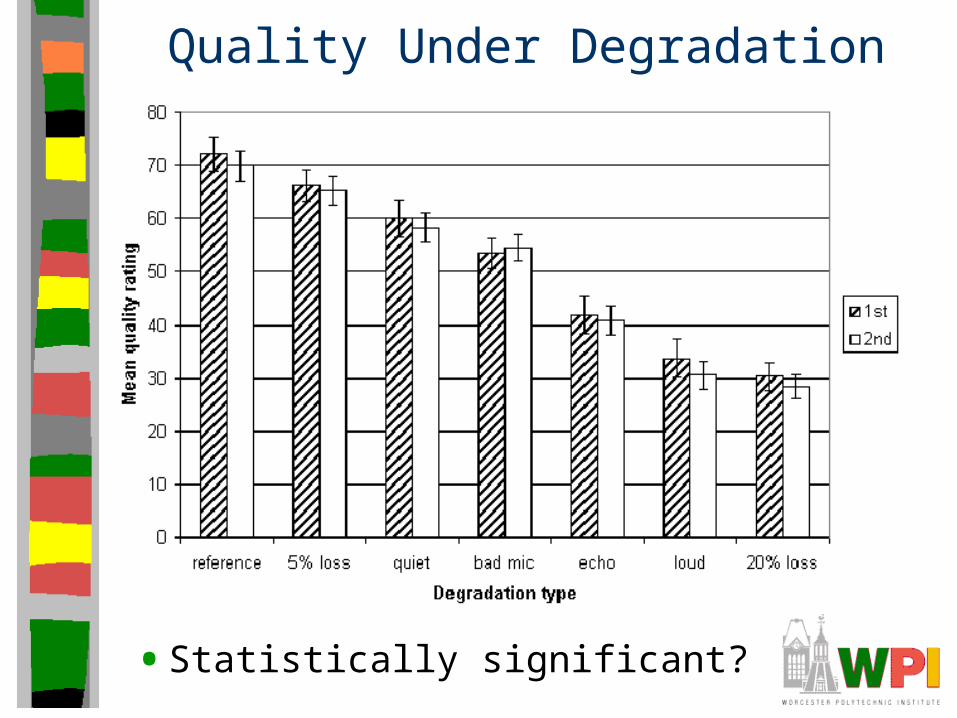
Quality Under Degradation
• Statistically significant?
Statistical Significance Tests
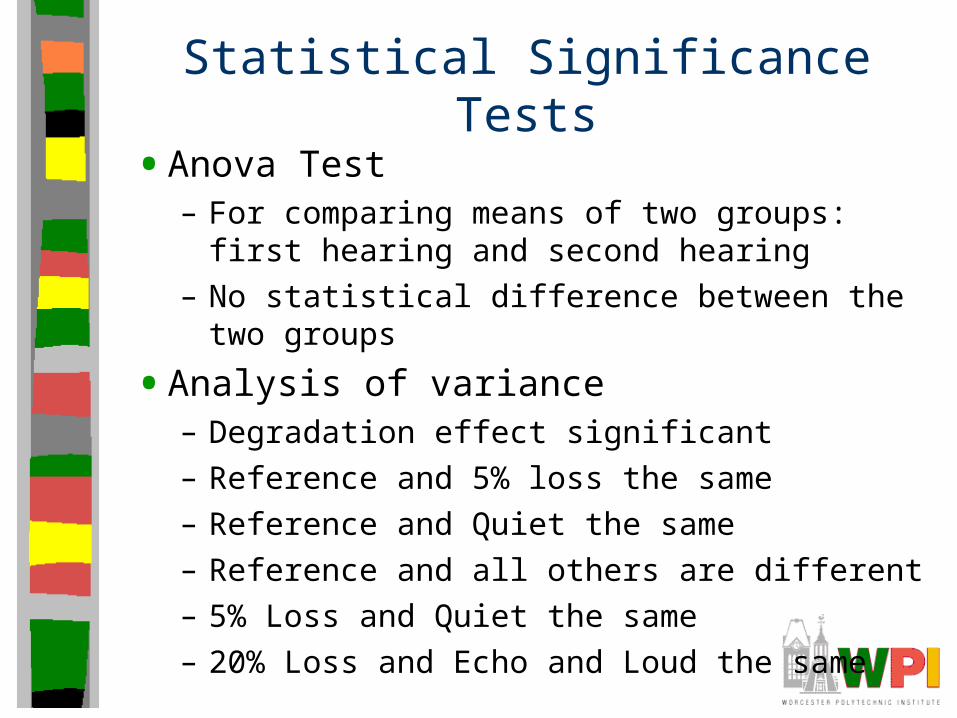
• Anova Test– For comparing means of two groups: first hearing
and second hearing
– No statistical difference between the two groups
• Analysis of variance– Degradation effect significant
– Reference and 5% loss the same
– Reference and Quiet the same
– Reference and all others are different
– 5% Loss and Quiet the same
– 20% Loss and Echo and Loud the same

Physiological Results: HR

Physiological Results: BVP
•Statistically significant?

Physiological Statistical Significance Tests
• Bad mic, loud and 20% loss all significantly more stressful than quiet and 5% loss
• Echo significantly more stressful than quiet in the HR data only
• Contrast to quality!– Mic worse than 20% loss
– Least stressful were quiet and 5% loss

Qualitative Results
• Asked subjects to describe why each rating
• Could clearly identify– quiet, loud and echo
• Bad mic– ‘distant’, ‘far away’ or ‘muffled’
– ‘on the telephone’, ‘walkie-talkie’ or ‘in a box’

Qualitative Results of Loss
• 5% loss– ‘fuzzy’ and ‘buzzy’ (13 of 24 times)
From waveform changing in the missing packet and not being in the repeated packet
– ‘robotic’, ‘metallic’, ‘electronic’ (7 times)
• 20% loss– ‘robotic’, ‘metallic’, ‘digital’, ‘electronic’ (15 times)
– ‘broken up’ and ‘cutting out’ (10 times)
– ‘fuzzy’ and ‘buzzy’ infrequently (2 times)
• 5 said ‘echo’, 10 described major volume changes– Not reliably see the cause of the degradation

Discussion
• 5% loss is different than reference condition (despite stats) because of descriptions– But subjects cannot identify it well
– Need a tool to identify impairments
• 20% loss is worse than bad mic based on quality, but is the same based on physiological results– need to combine physiological and subjective
• Methodology of field trials to design controlled experiments can help understand media quality issues

Conclusion
• Audio quality degradation not primarily from loss– Volume, mic and echo are worse
– And these are easy to fix! Educating users harder.
• By getting descriptions, should be easier to allow users to diagnose problems– Ex: ‘fuzzy’ or ‘buzzy’ to repetition for repair
• Volume changes harder– Could be reflected back to the user
– Could do expert system to make sure certain quality before being allowed in
Future Work
• Delay and jitter compared with other degradations
• Interactive environments rather than just listening– Ex: echo probably worse
• Combination effects– Ex: bad mic plus too loud

Evaluation of Science?
• Category of Paper
• Space devoted to Experiments?
• Good Science?– 1-10
– See if scale meshes with amount of experimental validation