The Garfield and Uley nontronites – An infrared ...eprints.qut.edu.au/1080/1/02_83AD6DD8.pdfusing...
28
1 The Garfield and Uley nontronites – An infrared spectroscopic comparison R. L. Frost • , J.T. Kloprogge Centre for Instrumental and Developmental Chemistry, Queensland University of Technology, 2 George Street, GPO Box 2434, Brisbane Queensland 4001, Australia. Frost, R.L., J.T. Kloprogge, and Z. Ding, The Garfield and Uley nontronites-an infrared spectroscopic comparison. Spectrochimica Acta, Part A: Molecular and Biomolecular Spectroscopy, 2002. 58A(9): p. 1881-1894 Copyright 2002 Elsevier -------------------------------------------------------------------------------------------- Abstract: FTIR and Infrared emission spectroscopy (IES) has been used to characterise the Uley (Australian) and Garfield nontronites. These clay minerals are characterised by a strong emission band at 3570 cm -1 attributed to the FeFeOH unit. Dehydroxylation is followed by the loss of intensity of this band as a function of temperature. Dehydroxylation is also followed by the loss of intensity of the FeFeOH deformation vibration at 843 cm -1 . IES shows that the dehydroxylation occurs as a continuous process in comparison to DTA/TGA studies where the dehydroxylation occurs abruptly at 425 °C. Water in these high iron bearing smectites have been observed through the stretching mode at 3430 cm -1 and the
Transcript of The Garfield and Uley nontronites – An infrared ...eprints.qut.edu.au/1080/1/02_83AD6DD8.pdfusing...

1
The Garfield and Uley nontronites – An infrared spectroscopic
comparison
R. L. Frost•, J.T. Kloprogge
Centre for Instrumental and Developmental Chemistry, Queensland University of
Technology, 2 George Street, GPO Box 2434, Brisbane Queensland 4001,
Australia.
Frost, R.L., J.T. Kloprogge, and Z. Ding, The Garfield and Uley nontronites-an infrared
spectroscopic comparison. Spectrochimica Acta, Part A: Molecular and Biomolecular
Spectroscopy, 2002. 58A(9): p. 1881-1894
Copyright 2002 Elsevier
--------------------------------------------------------------------------------------------
Abstract:
FTIR and Infrared emission spectroscopy (IES) has been used to characterise the
Uley (Australian) and Garfield nontronites. These clay minerals are characterised
by a strong emission band at 3570 cm-1 attributed to the FeFeOH unit.
Dehydroxylation is followed by the loss of intensity of this band as a function of
temperature. Dehydroxylation is also followed by the loss of intensity of the
FeFeOH deformation vibration at 843 cm-1. IES shows that the dehydroxylation
occurs as a continuous process in comparison to DTA/TGA studies where the
dehydroxylation occurs abruptly at 425 °C. Water in these high iron bearing
smectites have been observed through the stretching mode at 3430 cm-1 and the
2
bending mode at 1630 cm-1. Different types of water are identified in the
nontronite structure by the analysis of the band profile in the 1590 to 1680 cm-1
region. Low frequency vibrations show that the Uley green nontronite is similar
to the Garfield nontronite. The brown Uley nontronite is closer to the Hohen-
Hagen nontronite. The Uley nontronites may therefore be used spectroscopically
to replace other nontronites as a reference clay mineral.
Key words: dehydroxylation, FT-IR, infrared emission spectroscopy, montmorillonite,
nontronite, smectite.
• Author to whom correspondence should be addressed (email:[email protected])
3
1. Introduction
Smectites belong to the group of clay minerals, which expand upon
contact with water [1]. The presence of the water influences the physio-chemical
properties for example the rheology of the clays [2]. Smectites may be either
dioctahedral or trioctahedral, depending on whether the octahedral layer is filled
with 2 out of 3 positions with a trivalent cation or fully filled with a divalent
cation [3]. The dioctahedral smectites can be divided into two principal groups
(a) aluminian smectites and (b) the iron-rich varieties including ferruginous
smectites and nontronites. Two types of dioctahedral smectites exist depending
on the site of the layer charges: (a) montmorillonites where the charge arises
from divalent cations usually Mg replacing the M3+ cations in the octahedral sites
resulting in a diffuse layer charge, and (b) beidellites where the strongly localised
charge arises from the Al3+ substitution into the Si4+ tetrahedral sites [1,3] In
iron-rich (ferruginous) smectites and nontronites, some or all of the Al in the
octahedral layer is replaced with ferric iron (Fe3+). In the case of the ferruginous
smectites the theoretical structural formula can be given by
(M++x/2.nH2O)(Fe3+
4)(Si8-xAlx)O 20(OH)4 [1,4]. This clay formula as written is
the end member and is known as nontronite. Montmorillonites and beidellites
generally have Fe3+ <1% [5,6]. The term ferruginous smectites (or Ferrian
smectites) is used for dioctahedral smectites when when Fe3+ is >3% [1].
Ferruginous smectites have partial substitution of the aluminum by iron, whereas
nontronites have total replacement.
The ideal structural formula for aluminian smectites is

4
(Al3.15Mg0.85)(Si 8.0)O20(OH)4X0.85.nH2O. X in the formula is a monovalent
cation which counterbalances the layer charges. Structural formulae of clay
minerals may be used to characterise these minerals. However non-
monomineralic compositions may lead to distortion of these formulae [7].
Therefore to determine the structure a combination of chemical, diffraction and
spectroscopic methods should be used. Diffraction methods provide information
on the unit cell and long range ordering [8], yielding information on the average
structure but not of the composition. For poorly diffracting minerals such as the
nontronites, spectroscopic methods are much more useful. Methods such as
infrared spectroscopy, Raman spectroscopy and nuclear magnetic resonance
provide information about short range ordering and molecular structures.
Infrared spectroscopy has been used for a long period of time to study
clay minerals [9-11]. In particular, infrared absorption techniques have been
extensively used for the study of nontronites and other iron bearing clay minerals
[see for example references 12-17]. One of the difficulties of using infrared KBr
pellet absorption techniques is the possibility of exchange of the counter ions of
the smectites with the potassium of the KBr discs which are made under pressure.
Other absorption techniques such as self-supporting films and depsoits on
windows avoid this difficulty. Both the techniques of diffuse reflectance
(DRIFT) and infrared emission spectroscopy (IES) also avoid this difficulty.
Infrared emission spectroscopy allows the possibility of studying the
dehydroxylation and phase changes of minerals at elevated temperatures. The
technique of measurement of discrete vibrational frequencies emitted by
thermally excited molecules, known as Fourier transform Infrared Emission
5
Spectroscopy (FTIR ES), has not been widely used for the study of mineral
structures [see for example references 18-22]. The major advantages of IES are
that the samples are measured in situ at elevated temperatures and IES requires
no sample treatment other than making the smectite sample of submicron particle
size. Most of the smectite samples studied are of this size naturally. Further, the
technique removes the difficulties of heating the sample to dehydroxylation
temperatures and quenching before measurement, as IES measures the
dehydroxylation process as it is actually taking place. Here in this paper we report
the changes in the infrared spectrum upon thermal treatment of a series of
nontronites using the FTIR ES technique.
2. Materials and Methods
2.1 Nontronite Clay Minerals.
The clay minerals used are the wards Natural Science establishment: Garfield
nontronite from Whitman County, Washington, USA labelled as API-H33a, or
sometimes #33a [23], and Clay Mineral Society standard: the nontronite NG-1 from
Hohen-Hagen, Germany [24]. This latter nontronite is no longer obtainable and there
is a need for a nontronite clay to replace this standard. The two Australian samples
are from Uley Graphite Mine, Eyre Peninsula, South Australia. The calcium
exchanged, < 2 µm portions, were used [25]. Samples were analysed for purity by X-
ray diffraction. Infrared spectroscopy was also used to detect low levels of other
phases, particularly kaolinite and amorphous phases. The Uley green nontronite
(NAu-1) sample contained traces of kaolinite and the Uley brown nontronite (NAu-2)

6
contained calcite and ferrihydrite. The contaminants were at very low levels and were
not detected by XRD.
The Garfield nontronite has a formula (M+1.07)[Al0.23Fe3.71Mg0.03]
[Si7.03Al0.97]O20(OH)4 (Manceau et al., 2000a,b). The nontronite from Hohen Hagen,
Germany (CMR NG-1) has a structural formula:
(M+0.95)[Al0.86Fe3.08Mg0.05][Si7.12Al0.11Fe0.76]O20(OH)4. The Uley Green (NAu-1)
nontronite has a formula of [M+1.05][Al0.26Fe3.71Mg0.03][Si6.97Al1.03]O20(OH)4 and the
Uley brown (NAu-2) nontronite has a formula of [M+0.83] [Al0.42Fe3.43Mg0.04]
[Si7.52Al.06Fe.42] O20(OH)4. Nontronites contain Fe predominantly in the trivalent state
[26-29] The above analyses were based upon the results conducted on ignited, Ca-
saturated purified fractions (nominally <0.2 µm) of each nontronite.
2.2 Infrared Absorption Spectroscopy.
Absorption spectra were obtained using a Perkin-Elmer Fourier transform
infrared spectrometer (2000) equipped with a TGS detector. Spectra were recorded
by accumulating 1024 scans at 4 cm-1 resolution and a mirror velocity of 0.3 cm/sec in
the mid-IR.
2.3 Infrared Emission Spectroscopy.
FTIR emission spectroscopy was carried out on a Digilab FTS-60A
spectrometer equipped with a TGS detector, which was modified by replacing the IR
source with an emission cell. A description of the cell and principles of the emission
7
experiment have been published elsewhere [18]. Approximately 0.2 mg of dried
nontronite was spread as a thin layer (approximately 0.2 microns) on a 6 mm diameter
platinum surface and held in an inert atmosphere within a nitrogen-purged cell during
heating. The infrared emission cell consists of a modified atomic absorption graphite
rod furnace, which is driven by a thyristor-controlled AC power supply capable of
delivering up to 150 amps at 12 volts. A platinum disk acts as a hot plate to heat the
smectite sample and is placed on the graphite rod. An insulated 125-µm type R
thermocouple was embedded inside the platinum plate in such a way that the
thermocouple junction was <0.2 mm below the surface of the platinum. Temperature
control of ± 2°C at the operating temperature of the smectite sample was achieved by
using a Eurotherm Model 808 proportional temperature controller, coupled to the
thermocouple. The design of the IES facility is based on an off axis paraboloidal
mirror with a focal length of 25 mm mounted above the heater capturing the infrared
radiation and directing the radiation into the spectrometer. The assembly of the
heating block, and platinum hot plate is located such that the surface of the platinum
is slightly above the focal point of the off axis paraboloidal mirror. By this means the
geometry is such that approximately 3 mm diameter area is sampled by the
spectrometer. The spectrometer was modified by the removal of the source assembly
and mounting a gold-coated mirror, which was drilled through the centre to allow the
passage of the laser beam. The mirror was mounted at 45°, which enables the IR
radiation to be directed into the FTIR spectrometer.
In the normal course of events, three sets of spectra are obtained: firstly the
black body radiation over the temperature range selected at the various temperatures,
secondly the platinum plate radiation is obtained at the same temperatures and thirdly

8
the spectra from the platinum plate covered with the sample. Normally only one set
of black body and platinum radiation is required. The emittance spectrum at a
particular temperature was calculated by subtraction of the single beam spectrum of
the platinum backplate from that of the platinum + sample, and the result ratioed to
the single beam spectrum of an approximate blackbody (graphite). This spectral
manipulation is carried out after all the spectral data has been collected. The emission
spectra were collected at intervals of 50°C over the range 200 - 750 °C. The time
between scans (while the temperature was raised to the next hold point) was
approximately 100 seconds. It was considered that this was sufficient time for the
heating block and the powdered sample to reach temperature equilibrium. The
spectra were acquired by coaddition of 64 scans for the whole temperature range
(approximate scanning time 45 seconds), with a nominal resolution of 4 cm-1. Good
quality spectra can be obtained providing the sample thickness is not too large. If too
large a sample is used then the spectra become difficult to interpret because of the
presence of combination and overtone bands. Spectral manipulation such as baseline
adjustment, smoothing and normalisation was performed using the Spectracalc
software package (Galactic Industries Corporation, Salem, NH, USA).
2.4 DTA/TGA.
Differential thermal and thermogravimetric analyses of the <2 µ nontronites
were obtained using a Setaram DTA/TGA instrument operating at 1.0°C per minute
from ambient temperatures to 700°C.

9
3. Results and discussion
Two nontronites from Hohen-Hagen and Garfield have been extensively
used as reference clays [15] but are becoming very difficult to obtain. Recently,
two nontronites were discovered at the Uley Graphite mine near Port Lincoln,
South Australia, within heavily weathered granulite facies schist, gneiss and
amphibolite of Palaeoproterozoic age [25]. Geologic evidence indicates two
distinct nontronites are present: a green nontronite associated with weathered
biotite schist bands, and a brown nontronite filling joints and fractures within the
amphibolite composed of anorthite and highly altered alumino-ferro-hornblende
[25]. Preliminary mineralogical and chemical analyses support this finding and
indicate that the Uley green nontronite is similar in chemistry and structure to the
Garfield nontronite, whereas the Uley brown nontronite appears to be
significantly lower in aluminium and possibly contains tetrahedrally coordinated
iron [25]. This makes this nontronite closer to the Hohen-Hagen nontronite.
The minerals were selected to provide a range of total Fe3+ and Al contents.
The Fe contents (ignited, Fe2O3 basis) are: Uley green 36.49; Garfield 36.4; NG-1,
37.5%; Uley brown 38.1. The aluminium content of the Garfield nontronite 7.54 %
and NG-1 nontronite 6.06 %. The aluminium content of the Uley green nontronite
and of the Uley brown sample are 8.15 % and 3.02 %. It should be noted that NG-1
and the Uley brown nontronite each contains significant amounts of ferric iron in the
tetrahedral sheet. However each of the nontronites studied here contain most of the
iron as ferric iron in the octahedral sheet. Thus, based on chemical composition, the
Uley smectites are members of the smectite series in which the octahedral aluminium

10
has been replaced by octahedral ferric iron. It should be noted some of the Fe
(≈18%) is incorporated in the tetrahedral sheets. Nontronites contain Fe
predominantly in the trivalent state. Most of the layer charge originates from the
tetrahedral layer with negative 0.91 and –0.18 on the octahedral layer. The interlayer
charge is –1.09. For nontronite, the charges on the octahedral and tetrahedral layers
are -0.08 and -0.92 with an interlayer charge of –0.99. It is generally accepted that
nontronite contain Fe predominantly in the trivalent state [27]. The two minerals are
very similar in formulation, the major difference being in the iron content.
Infrared absorption spectroscopy of the hydroxyl-stretching region.
Figure 1 displays the infrared absorption spectra of the nontronites and the
results of the band component analyses are reported in Table 1. For the Garfield
nontronite bands are observed at 3575, 3424, 3251 and 3036 cm-1 with relative
intensities of 21.1, 34.9, 24.8 and 19.0 %. Some variation in both the band
position and intensities between the nontronites is observed. Infrared absorption
bands are observed for the Uley brown nontronite at 3572, 3430 and 3262 cm-1
with relative intensities of 22.3, 39.0 and 24.9% and for the Uley green nontronite
at 3567, 3426 and 3255 cm-1 with 21.9, 50.5 and 23.5 % relative intensity. For the
Hohen-Hagen nontronite, bands are observed at 3598, 3439 and 3221 cm-1 with
12.5, 55.8 and 29.9 % relative intensity. The infrared absorption spectra of the
Uley nontronites more closely follow that of the Garfield nontronite than that of
the Hohen-Hagen nontronite.
11
The bands at around 3560-3570 cm-1 in the spectra of the three nontronites
are assigned to the hydroxyl stretching vibration of the FeFeOH unit. The relative
intensity of this band is greatly influenced by the band at ~3420 cm-1 which is
attributed to the hydroxyl stretching frequency of water from the hydrated
calcium in the interlayer structure. Thus the relative intensity of the hydroxyl-
stretching band of the FeFeOH unit is effected by the amount of water in the
nontronites. The band at around 3240 cm-1 may be ascribed to the overtone of the
HOH water bending vibration observed at 1630 cm-1. In the spectra of the
hydroxyl-stretching region of ferruginous smectites a hydroxyl stretching
frequency at around 3590 cm-1 is observed which is attributed to the AlFeOH
unit. However because of the extremely low Al content of these three
nontronites, this band is not observed.
In the study of the vibrational spectra of kaolinites, the vibrations of the
hydroxyl units function cooperatively as in-phase and out of phase vibrations.
The question arises as to whether the FeFeOH and AlFeOH units cooperate as in-
phase and out of phase vibrations. The band at 3240 cm-1 may be interpreted as
the out of phase vibration of the in phase vibration at 3400 cm-1 rather than the
overtone of the water bending vibration at 1630 cm-1.
3.1 Infrared emission spectroscopy of the hydroxyl-stretching region.
The infrared emission spectra of the Garfield nontronite and the Uley green
and brown nontronites are shown in Figures 2-4. A comparison of the spectral
frequencies of the hydroxyl-stretching for the three nontronites is reported in Table 2.
12
The spectra show the presence of water vapour. This is observed by the
superimposition of the high frequency in the 1400 to 1700 and 3300 to 3900 cm-1
region. This water vapour is a result of the loss of the hydration water and is more
pronounced in the low temperature IES spectra at 200 and 250 °C. Bands observed in
the 2950 cm-1 region are due to the presence of organics. Three hydroxyl-stretching
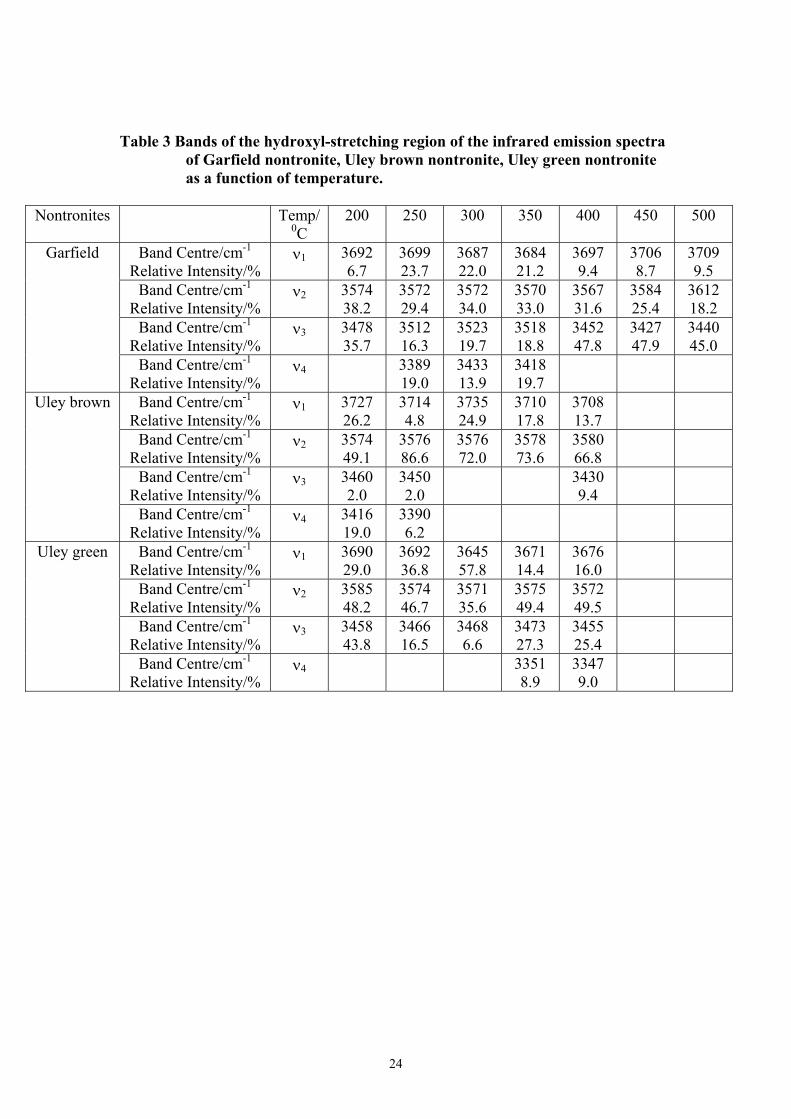
frequencies for the Garfield nontronite are observed in the 200 °C spectrum at 3692,
3574, and 3478 cm-1. The latter two bands may correspond with the two Raman
bands observed at 3574 and 3436 cm-1. However it is probable that these are two
different vibrational modes. The Uley brown nontronite shows three bands at 3727,
3574, and 3416 cm-1 in the 200 °C spectrum. For Uley green nontronite three bands
are observed at 3690, 3585, and 3458 cm-1. All three nontronites have a common
emission band at 3574 cm-1, which is assigned to the FeFeOH hydroxyl-stretching
vibration. The IES band at around 3700 cm-1 is also common to the nontronites and is
attributed to FeAlOH stretching vibrations. Another possibility for bands in this
position is the attribution to SiOH stretching vibrations. It is not uncommon to
observe SiOH vibrations in the 3700 to 3750 cm-1 region [18]. At the lower
temperatures for emission spectroscopy (200 and 250 °C), bands are also observed at
the 3440 and 3200 cm-1 positions. The spectra from and above 300 °C, do not show
bands in these positions.
The intensity of the 3560 cm-1 band decreases as a function of temperature and
mimics the dehydroxylation of nontronites as determined by thermal analysis
techniques. Dehydroxylation takes place between 400 and 450 °C, when no intensity
remains in the hydroxyl-stretching bands. Figure 5 displays the variation of relative
intensity of the three nontronites as a function of temperature. The loss of intensity of

13
the Uley green and Garfield nontronites as a function of temperature are similar. It
would appear that the loss of intensity is continuous rather than stepped as with a
TGA pattern. The TGA pattern for the three nontronites over the same temperature
range is shown in Figure 6. Little difference can be observed in the TGA patterns for
these three nontronites. A very small perceptible weight change may be observed for
the Uley brown nontronite at around 250 °C. It is thought that this weight change is
due to the presence of an impurity of ferrihydrite. The reason why there is a
difference between the intensity-temperature graphs and the TGA curves may be
attributed to the way in which the experiment is carried out. The IES experiment is a
step process in which the temperature is ramped to the next temperature and then
there is a time arrest before collecting the spectral data. The TGA experiment is a
continuous experiment with a constant increase in temperature with time.
Figure 7 reports the DTA patterns of the dehydroxylation of the nontronites
over the 200 to 600 °C temperature range. The DTA patterns are in good harmony
with both the TGA and the decrease in intensity patterns. The DTA patterns show a
second endotherm at around 580 °C. This endotherm is not related to the
dehydroxylation of the nontronites since no intensity remains in the infrared spectrum
of the hydroxyl stretching bands at this temperature. It is suggested that this
endotherm is related to a phase change of the dehydroxylated nontronites.
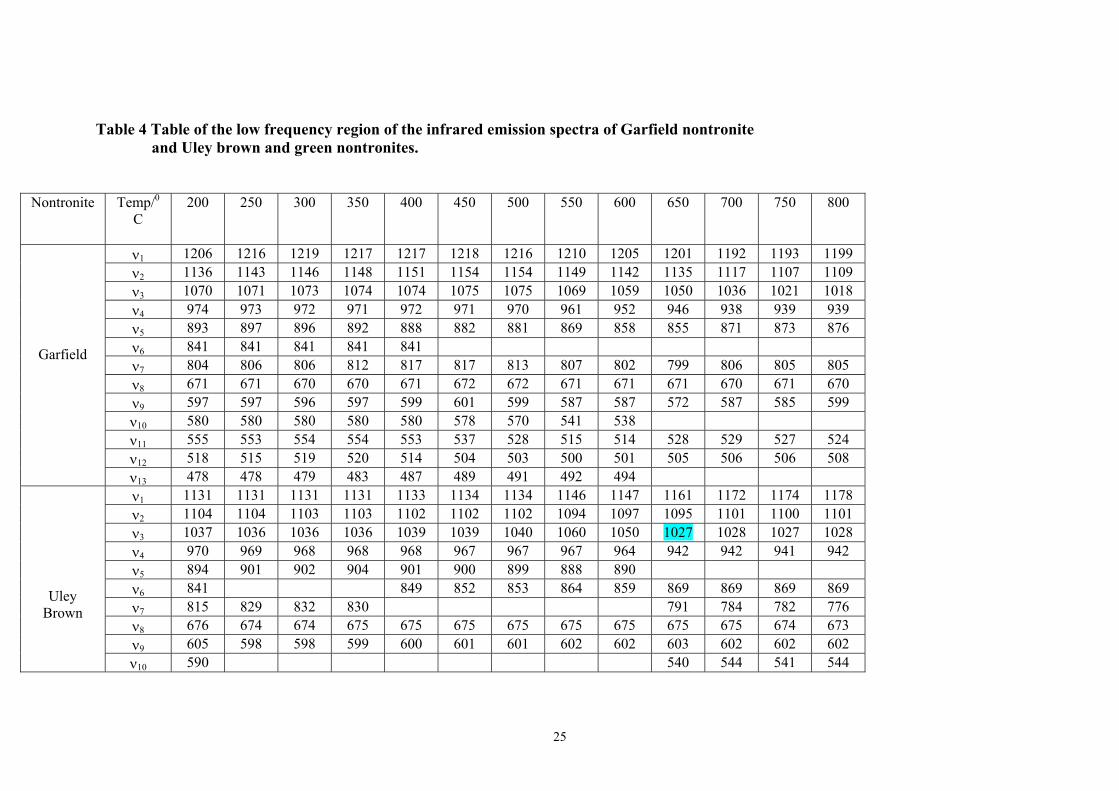
3.2 Infrared spectroscopy of the Low frequency region.
The results of the absorption spectra of the low frequency region are reported
in Table 2. Bands in this region may be attributed to (a) SiO stretching vibrations.
14
These vibrations are in the 900 to 1100 cm-1 region and are ascribed to FeSiO and SiO
units [14,27] (b) The 815-860 cm-1 region [27]. These bands are attributed to the
hydroxyl-deformation of the FeFeOH unit. (c) Bands in the 520 to 600 cm-1 region.
These bands are attributed to FeFeOH hydroxyl translational modes. (d) Bands
observed around 430 and 490 cm-1 are attributed to the SiOFe lattice flexing
vibrations. Bands which are observed at 780 and ~816 cm-1 are attributable to traces
of quartz impurities. Table 2 shows a comparison of the infrared absorption and low
frequency bands of nontronite. Figures 3-5 show the low frequency region of the
three nontronites and the results of the band component analysis are shown in Table 4.
The lower detection limit in the IES spectra is 450 cm-1. As a consequence bands
measured in the absorption spectra are not observed in the IES spectra. The
conclusion may be drawn that the spectra of the low frequency region are very
similar. Further the IES spectra show strong resemblance to the absorption spectra.
The analyses show bands are observed in similar positions for each of the nontronites.
The Uley nontronite shows a broad band at around 1450 cm-1. This band is attributed
to the presence of fine particles of calcite. The band starts to disappear at 400 °C and
no intensity remains at 600 °C.
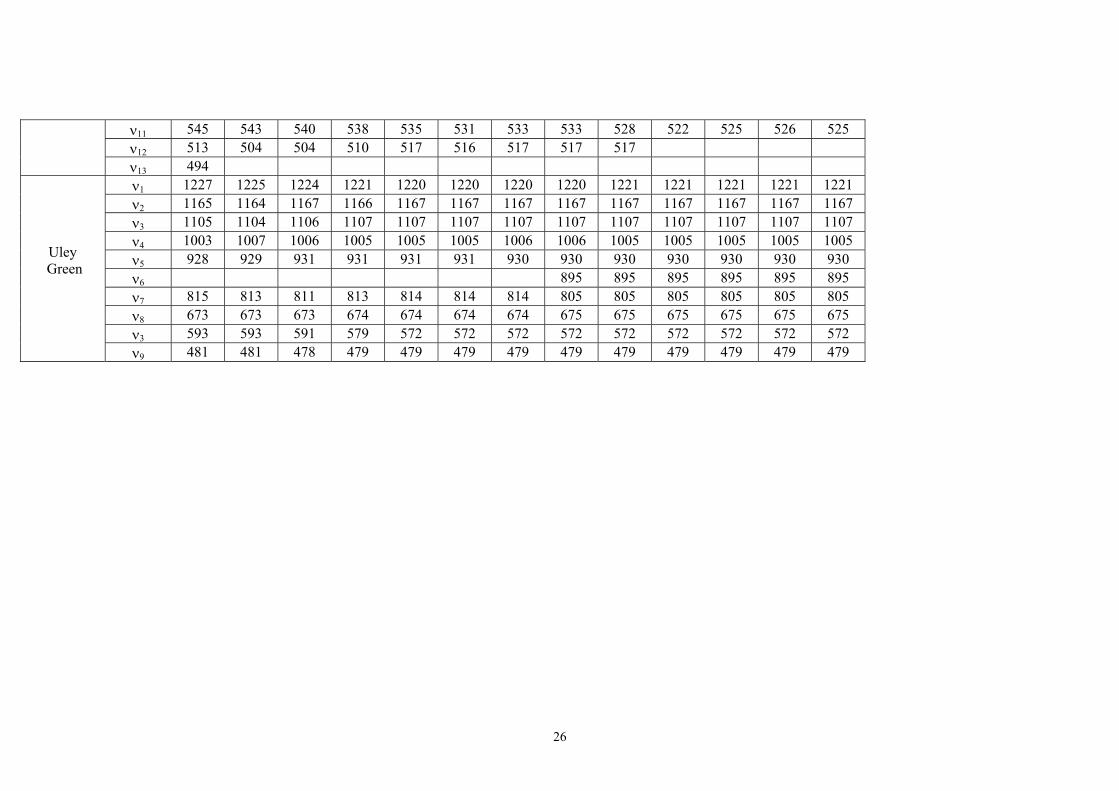
Of particular importance in the IES spectra, is the observation of bands in the
770 to 870 cm-1 region. This spectral region shows the hydroxyl deformation region
and the assignment of bands in this region characterises the chemistry and formulation
of the nontronites. The Garfield nontronite shows bands at 870, 844, 817 and 778
cm-1. The 870 cm-1 band is assigned to the hydroxyl deformation of the AlFeOH unit.
The two bands at 844 and 817 cm-1 are attributed to the FeFeOH hydroxyl
deformation. It is not known why two hydroxyl bands are observed for the FeFeOH

15
unit. One possibility is that some form of cis-trans isomerisation of this unit exists.
This band has disappeared by 350 °C. This observation fits well the decrease in
intensity of the hydroxyl stretching vibration at 3570 cm-1. Here the IES spectra
showed a continuous decease in intensity. The band at 778 cm-1 is attributed to the
MgFeOH deformation. The IES spectra of the Uley green nontronite shows bands at
870, 844, 819 and 777 cm-1. The attribution of the bands is the same for all the
nontronites. However the spectra clearly show intensity differences for the 844 and
819 cm-1 bands. The Uley brown nontronite IES spectra clearly show bands at 870,
840, 820 and 785 cm-1. Significantly for the Uley brown nontronite, the band at 785
cm-1 shows increased intensity compared with the other nontronites. This band is
attributed to the MgFeOH unit hydroxyl deformation. The increased intensity of this
band reflects the higher Mg content in the octahedral position. The Hohen-Hagen
nontronite spectra show bands at 870, 842, 820 and 788 cm-1. This nontronite also
shows intensity in the band at 785 cm-1 [28]. The reason why this band occurs at such
low frequencies is that the FeMg pairs sharing OH are preferentially along 010 plane
with the OH vector extending in the 100 towards the dioctahedral vacancy. The band
is present in both the Garfield and Uley green nontronites but is of very low intensity.
A band is observed in all the spectra at ~680 cm-1 and is attributed to the bending
vibration of the SiOFe unit.
The role of water in smectites often controls their physio-chemical behaviour
for example clay rheology. Infrared spectroscopy is one of the best methods for
determining the presence of water through the observation of the water HOH bending
mode at 1630 cm-1. Thermal analysis shows that water can be difficult to remove
from smectites and water coordinating to the interlayer cation may not come off until

16
~330 °C. Infrared absorption spectroscopy shows a broad band centred on 1630 cm-1
with a component at ~1675 cm-1. Two different types of water are identified by the
presence of these two bands namely hydrogen bonded water and water coordinated to
the interlayer cations. Table 5 reports the analysis of the water bending vibration in
the infrared emission spectra for the nontronites as a function of temperature. For
each of the nontronites three water bending vibrations are identified: a high frequency
band at around 1680 cm-1 attributed to water coordinated to the interlayer cation, a
normal frequency band at ~1650 cm-1 attributed to interlayer water and the low
frequency band at 1595 cm-1 assigned to non-hydrogen bonded water. The IES
spectra show the presence of water up to 400 °C. This water may arise from the water
in the hydration sphere of the interlayer cation and the water could also come from the
dehydroxylation of the nontronite itself. The frequencies of the water bending modes
move to higher wavenumbers with increasing temperature.
4. Conclusions
No difference was observed between the absorption and emission spectra of
the nontronites. The nontronites are characterised by three bands in the hydroxyl-
stretching region with the band at 3570 cm-1 assigned to the hydroxyl stretching
vibration of the FeFeOH unit. Dehydroxylation of nontronites has been determined
using both DTA/TGA methods and infrared emission spectroscopy. Infrared
emission spectroscopy shows that the dehydroxylation is a temperature-continuous
process with the significant loss of intensity of the hydroxyl stretching vibrations in
the 400 to 500°C temperature range.
17
Importantly the technique of infrared emission spectroscopy enables the
spectra of the nontronites at elevated temperatures to be determined. Further the IES
spectra of the Uley green nontronite are identical to that of the Garfield nontronite.
The Uley brown nontronite appears to be intermediate between the Garfield and
Hohen-Hagen nontronites in terms of spectroscopy. Thus it is concluded that the
Uley nontronites are worthwhile nontronite clay minerals, which might replace both
the Garfield and Hohen-Hagen nontronites, which are no longer available, at least
from a vibrational spectroscopy point of view.
Acknowledgments
The financial and infra-structure support of the Queensland University
of Technology Centre for Instrumental and Developmental Chemistry is gratefully
acknowledged.

18
References
[1] A.C.D. Newman (1987) Chemistry of Clays and Clay Minerals, Mineralogical
Society Monograph No. 6. Mineralogical Society, London. (Chapter 1 and 5)
[2] N. Guven and R.M. Pollastro (1992) Clay Minerals Society Workshop lectures
Vol.4, Clay-water interface and its rheological implications. The Clay Minerals
Society Boulder, Colarado, USA.
[3] A.R. Mermut (1993) Clay Minerals Society lectures Volume 6. Layer Charge
Characteristics of 2:1 silicate clay minerals. The Clay Minerals Society,
Boulder, Colarado, USA.
[4] G.W. Brindley (1980) Order and disorder in clay mineral structures. Ch 2 in
Crystal structures of Clay Minerals and their X-ray diffraction identification
(G.W. Brindley and G. Brown. Eds) Mineralogical Society, London.
[5] M.F. Briggati, Clay Miner. 18 (1983) 177.
[6] M.F. Briggati and L. Poppi, Clay Miner. 16 (1981) 81.
[7] J. Madejova, P. Komadel and B. Cicel, Clay Minerals 29 (1994) 319.
[8] G. Besson and V.A. Drits, Clays Clay Miner. 45 (1997) 158.
[9] Farmer V.C. (1974) The layer silicates, (V.C. Farmer, Editor), Infrared spectra
of minerals Monograph 4, The Mineralogical Society, London, pp 331-363.
[10] H. W. van der Marel and H. Beutelspacher, (1976) Atlas of the infrared spectra
of clay minerals and their admixtures Elsevier, Amsterdam.
[11] J.D. Russell (1987) Infrared methods in A Handbook of determinative methods
in clay mineralogy, (M.J. Wilson Editor) Chapman-Hall, New York.
[12] I. Rozenson and L. Heller-Kallai, Clays and Clay Minerals 24 (1976) 271.
[13] J.D. Russell and V.C. Farmer Clay Miner. Bull. 5 (1964) 443.

19
[14] J.D. Russell, Clay Minerals 14 (1979) 127.
[15] J.W. Stucki and C.B. Roth, Clays and Clay Minerals 24 (1976) 293.
[16] B.A. Goodman, J.D. Russell, A.R. Fraser and F.W.D. Woodhams Clays and
Clay Minerals 24 (1976) 53.
[17] K.J.D. Mackenzie and D.E. Rogers, Thermochimica Acta 18 (1977) 177.
[18] R.L. Frost and A. M. Vassallo Clays and Clay Minerals. 44 (1996) 635.
[19] R.L. Frost and S.M. Dutt, Journal of Colloid and Interface Science 198 (1998)
330.
[20] R.L. Frost, G.A. Cash and J.T. Kloprogge, Vibrational Spectroscopy 16 (1998)
173.
[21] J.T. Kloprogge, R.L. Frost and R. L. Fry, The Analyst, 124 (1999) 381.
[22] J.T. Kloprogge and R.L. Frost, Physical Chemistry and Chemical Physics, 1
(1999) 1641.
[23] P.F. Kerr, and J.L. Kulp, (1949) Reference Clay Localities - United States.
Preliminary Report No. 2. in PF Kerr, (ED). Reference Clay Minerals,
American Petroleum Institute Research Project 49. American Petroleum
Institute.
[24] P. Schneiderhorn Tschermaks Min.u. Petr. Mitt., Bd. 10, H. 1-4 (1965) 386.
[25] J. Keeling, M. Raven and W. Gates Clays Clay Miner. 48 (2000) 537.
[26] L. Heller-Kallai and I. Rozenson, Clays Clay Miner. 28 (1980) 355.
[27] P. Komadel, J. Madejova and J.W. Stucki, Clays Clay Miner. 43 (1995) 105.
[28] P. Komadel, P. R. Lear and J. W. Stucki, Clays Clay Miner. 38 (1990) 203.
[29] A. Manceau, D. Chateigner and W.P. Gates, Phys. Chem. Miner. 25 (1998)
347.

20

21
Infrared Absorbance
ν1 ν2 ν3 ν4
Nontronites Suggested Assignments Hydroxyl stretch of FeFeOH
unit
OH stretch of water
First overtone of the HOH bend of water
Possible difference
band
Hohen-Hagen
Band Centre/cm-1 Relative Intensity/%
3598 12.5
3439 55.8
3221 29.8
2935 1.7
Garfield Band Centre/cm-1 Relative Intensity/%
3575 21.1
3424 34.9
3251 24.9
3036 19.0
Uley brown Band Centre/cm-1 Relative Intensity/%
3572 21.9
3430 50.5
3262 23.5
3043 4.0
Uley green Band Centre/cm-1 Relative Intensity/%
3566 22.3
3426 39.0
3256 24.9
2998 13.7
Table 1 Infrared absorption bands of the hydroxyl-stretching region of
nontronite

22
Table 2 Infrared absorption and emission bands of nontronite
Infrared absorption spectroscopy
Infrared emission spectroscopy
(200 °C)
Suggested
Assignments
Garfield Nontronite
Uley Green
Uley Brown
Hohenhagen,
Germany 32.2% Fe
Garfield Nontronite
Uley Green
Uley Brown
Hohenhagen,
Germany 32.2% Fe
3575 3572 3572 3598 3573 3585 3574 3597 FeFeOH stretch
3478 3463 3460 3432 OH stretch of water
3424 3426 3430 3439 3430 3416 OH stretch of water
3251 3255 3262 3221 3232 First overtone of HOH bending
3036 3036 3036 3036 3067 3047 Combination band
1670 1630
1670 1630
1670 1630
1670 1630
1647 1580
1650 1590
1680 1642 1580
1628 HOH bending
1206 1226 1132 1131 1131 1136 1165 1131 SiO stretch 1093 1093 1093 1092 1070 1105 1104 1077 SiO stretch 1032 1333 1333 1032 1003 1037 1039 FeSiO stretch

23
973 972 972 972 974 928 970 SiO stretch 879 880 880 879 893 894 880 AlFeOH
deformation 841 841 FeFeOH
deformation 778 777 777 795 804 812 815 793 Quartz
impurity 755 755 755 788 MgFeOH
deformation 680 680 680 680 671 673 676 693 656 655 655 588 568 568 580 593 590 FeOSi bend 547 547 547 478 481 494 487 SiOFe bend 450 450 450 463 458 SiOSi bend
(463 is quartz impurity)
429 428 428 429 SiOFe bend Octahedral
Fe
24
Table 3 Bands of the hydroxyl-stretching region of the infrared emission spectra
of Garfield nontronite, Uley brown nontronite, Uley green nontronite as a function of temperature.
Nontronites Temp/
0C 200 250 300 350 400 450 500
Band Centre/cm-1 Relative Intensity/%
ν1 3692 6.7
3699 23.7
3687 22.0
3684 21.2
3697 9.4
3706 8.7
3709 9.5
Band Centre/cm-1 Relative Intensity/%
ν2 3574 38.2
3572 29.4
3572 34.0
3570 33.0
3567 31.6
3584 25.4
3612 18.2
Band Centre/cm-1 Relative Intensity/%
ν3 3478 35.7
3512 16.3
3523 19.7
3518 18.8
3452 47.8
3427 47.9
3440 45.0
Garfield
Band Centre/cm-1 Relative Intensity/%
ν4 3389 19.0
3433 13.9
3418 19.7
Band Centre/cm-1 Relative Intensity/%
ν1 3727 26.2
3714 4.8
3735 24.9
3710 17.8
3708 13.7
Band Centre/cm-1 Relative Intensity/%
ν2 3574 49.1
3576 86.6
3576 72.0
3578 73.6
3580 66.8
Band Centre/cm-1 Relative Intensity/%
ν3 3460 2.0
3450 2.0
3430 9.4
Uley brown
Band Centre/cm-1 Relative Intensity/%
ν4 3416 19.0
3390 6.2
Band Centre/cm-1 Relative Intensity/%
ν1 3690 29.0
3692 36.8
3645 57.8
3671 14.4
3676 16.0
Band Centre/cm-1 Relative Intensity/%
ν2 3585 48.2
3574 46.7
3571 35.6
3575 49.4
3572 49.5
Band Centre/cm-1 Relative Intensity/%
ν3 3458 43.8
3466 16.5
3468 6.6
3473 27.3
3455 25.4
Uley green
Band Centre/cm-1 Relative Intensity/%
ν4 3351 8.9
3347 9.0
25
Table 4 Table of the low frequency region of the infrared emission spectra of Garfield nontronite and Uley brown and green nontronites.
Nontronite Temp/0
C
200 250 300 350 400 450 500 550 600 650 700 750 800
ν1 1206 1216 1219 1217 1217 1218 1216 1210 1205 1201 1192 1193 1199 ν2 1136 1143 1146 1148 1151 1154 1154 1149 1142 1135 1117 1107 1109 ν3 1070 1071 1073 1074 1074 1075 1075 1069 1059 1050 1036 1021 1018 ν4 974 973 972 971 972 971 970 961 952 946 938 939 939 ν5 893 897 896 892 888 882 881 869 858 855 871 873 876 ν6 841 841 841 841 841 ν7 804 806 806 812 817 817 813 807 802 799 806 805 805 ν8 671 671 670 670 671 672 672 671 671 671 670 671 670 ν9 597 597 596 597 599 601 599 587 587 572 587 585 599 ν10 580 580 580 580 580 578 570 541 538 ν11 555 553 554 554 553 537 528 515 514 528 529 527 524 ν12 518 515 519 520 514 504 503 500 501 505 506 506 508
Garfield
ν13 478 478 479 483 487 489 491 492 494 ν1 1131 1131 1131 1131 1133 1134 1134 1146 1147 1161 1172 1174 1178 ν2 1104 1104 1103 1103 1102 1102 1102 1094 1097 1095 1101 1100 1101 ν3 1037 1036 1036 1036 1039 1039 1040 1060 1050 1027 1028 1027 1028 ν4 970 969 968 968 968 967 967 967 964 942 942 941 942 ν5 894 901 902 904 901 900 899 888 890 ν6 841 849 852 853 864 859 869 869 869 869 ν7 815 829 832 830 791 784 782 776 ν8 676 674 674 675 675 675 675 675 675 675 675 674 673 ν9 605 598 598 599 600 601 601 602 602 603 602 602 602
Uley Brown
ν10 590 540 544 541 544
26
ν11 545 543 540 538 535 531 533 533 528 522 525 526 525 ν12 513 504 504 510 517 516 517 517 517 ν13 494 ν1 1227 1225 1224 1221 1220 1220 1220 1220 1221 1221 1221 1221 1221 ν2 1165 1164 1167 1166 1167 1167 1167 1167 1167 1167 1167 1167 1167 ν3 1105 1104 1106 1107 1107 1107 1107 1107 1107 1107 1107 1107 1107 ν4 1003 1007 1006 1005 1005 1005 1006 1006 1005 1005 1005 1005 1005 ν5 928 929 931 931 931 931 930 930 930 930 930 930 930 ν6 895 895 895 895 895 895 ν7 815 813 811 813 814 814 814 805 805 805 805 805 805 ν8 673 673 673 674 674 674 674 675 675 675 675 675 675 ν3 593 593 591 579 572 572 572 572 572 572 572 572 572
Uley Green
ν9 481 481 478 479 479 479 479 479 479 479 479 479 479

27
Table 5 Bands of the water-bending region of the infrared absorption spectra of
nontronites from (a) Hohen-Hagen (b) Garfield (c) Uley brown (d) Uley green
Nontronites Temperature/0C
200 250 300 350 400
Band Centre/cm-1 Relative Intensity/%
ν1/cm-1 %
1666 45
1680 25
1690 13
1690 10
Band Centre/cm-1 Relative Intensity/%
ν2 1647 75
1647 10
1652 21
1650 20
Garfield
Band Centre/cm-1 Relative Intensity/%
ν3 1595 25
1595 55
1590 65
1575 66
1570 70
Band Centre/cm-1 Relative Intensity/%
ν1 1680 5
1684 12
1680 27
1690 7
1690 5
Band Centre/cm-1 Relative Intensity/%
ν2 1653 43
1643 51
1640 18
1638 45
1637 28
Band Centre/cm-1 Relative Intensity/%
ν3 1610 7
Uley brown
Band Centre/cm-1 Relative Intensity/%
ν4 1560 32
1567 18
1570 55
1565 41
1560 51
Band Centre/cm-1 Relative Intensity/%
ν1 1674 26
Band Centre/cm-1 Relative Intensity/%
ν2 1650 72
1653 79
1659 53
1632 11
Uley green
Band Centre/cm-1 Relative Intensity/%
ν3 1585 15
1570 21
1570 39
1567 6

28
LIST OF FIGURES
Figure 1 Infrared absorption spectra of the hydroxyl-stretching region of (a)
Garfield (b) Uley green and (c) Uley brown nontronites. Figure 2 Infrared emission spectra of Garfield nontronite from 200 to 800 °C at
50 °C intervals. Figure 3 Infrared emission spectra of Uley green nontronite from 200 to 800 °C
at 50 °C intervals. Figure 4 Infrared emission spectra of Uley brown nontronite from 200 to 800 °C
at 50 °C intervals. Figure 5 Variation in the relative intensity of the 3570 cm-1 band as a function of
temperature for (a) Garfield (b) Uley green (c) Uley brown nontronites. Figure 6 Thermogravimetric patterns for (a) Garfield (b) Uley green (c) Uley
brown nontronites. Figure 7 DTA patterns for (a) Garfield (b) Uley green (c) Uley brown
nontronites.
LIST OF TABLES Table 1 Infrared absorption bands of the hydroxyl-stretching region of
nontronite Table 2 Infrared absorption and emission bands of nontronite Table 3 Table of the hydroxyl-stretching region of the infrared emission spectra
of Garfield nontronite, Uley brown nontronite, Uley green nontronite as a function of temperature.
Table 4 Bands of the low frequency region of the infrared emission spectra of
Garfield nontronite and Uley brown and green nontronites, as a function of temperature.
Table 5 Bands of the water-bending region of the infrared absorption spectra of
nontronites from (a) Hohen-Hagen (b) Garfield (c) Uley brown (d) Uley green