The future of the Korean Economy Sehwa Lee, Taizo Suzuki, Wen-Ching Chuang.
26
The future of the Korean Economy Sehwa Lee, Taizo Suzuk i, Wen-Ching Chuang
-
Upload
maurice-harrison -
Category
Documents
-
view
226 -
download
0
Transcript of The future of the Korean Economy Sehwa Lee, Taizo Suzuki, Wen-Ching Chuang.
The future of the Korean Economy
Sehwa Lee, Taizo Suzuki, Wen-Ching Chuang
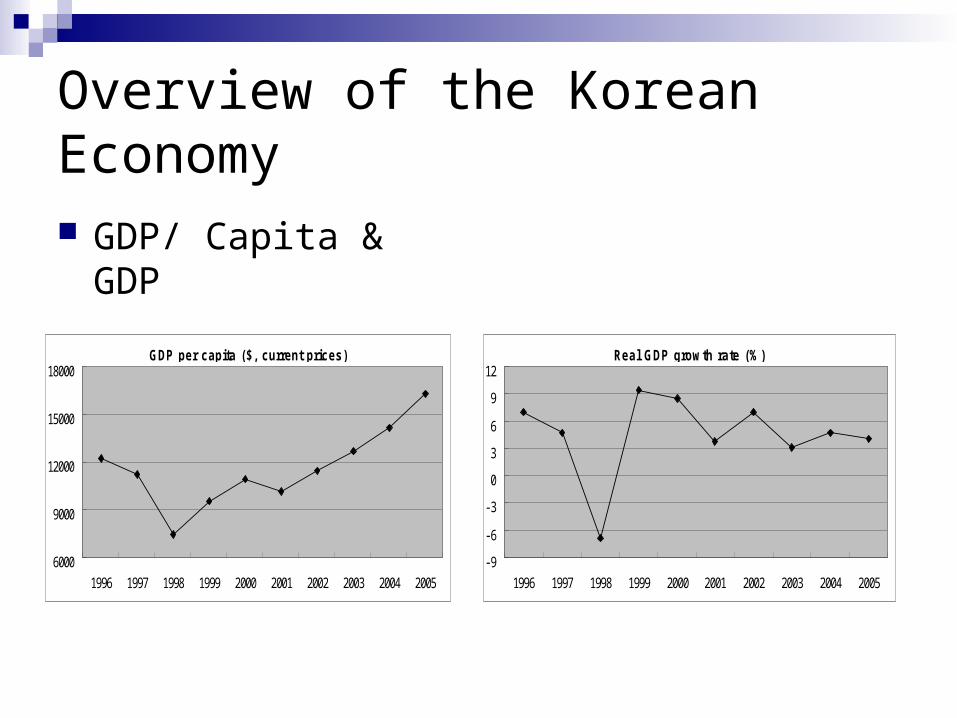
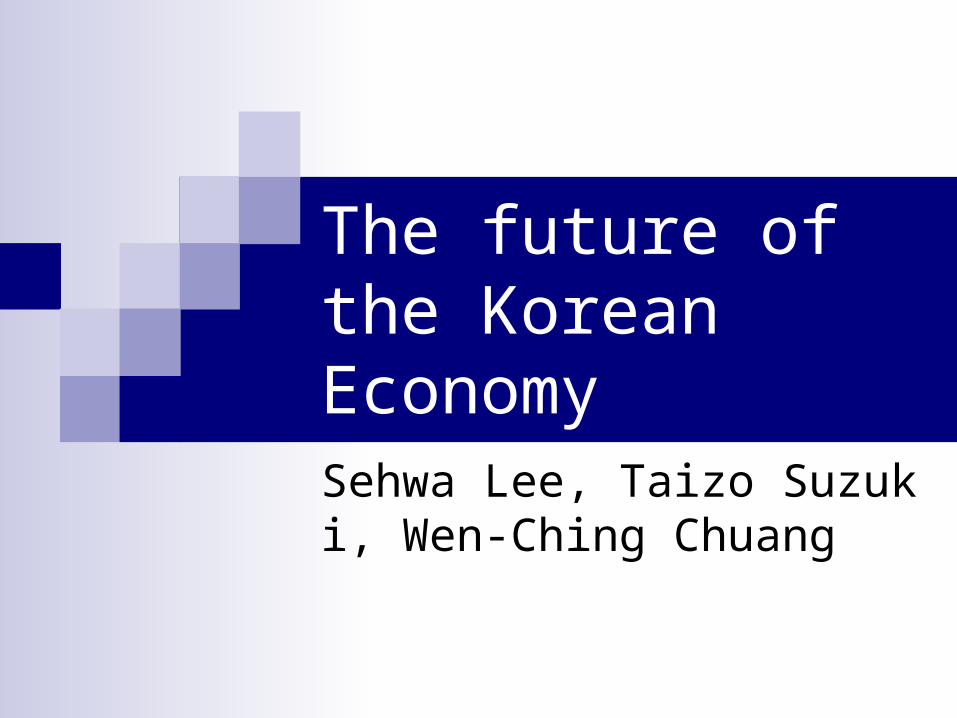
Overview of the Korean Economy
GDP/ Capita & GDP
GDP per capita ($, current prices)
6000
9000
12000
15000
18000
1996 1997 1998 1999 2000 2001 2002 2003 2004 2005
Real GDP growth rate (%)
-9
-6
-3
0
3
6
9
12
1996 1997 1998 1999 2000 2001 2002 2003 2004 2005
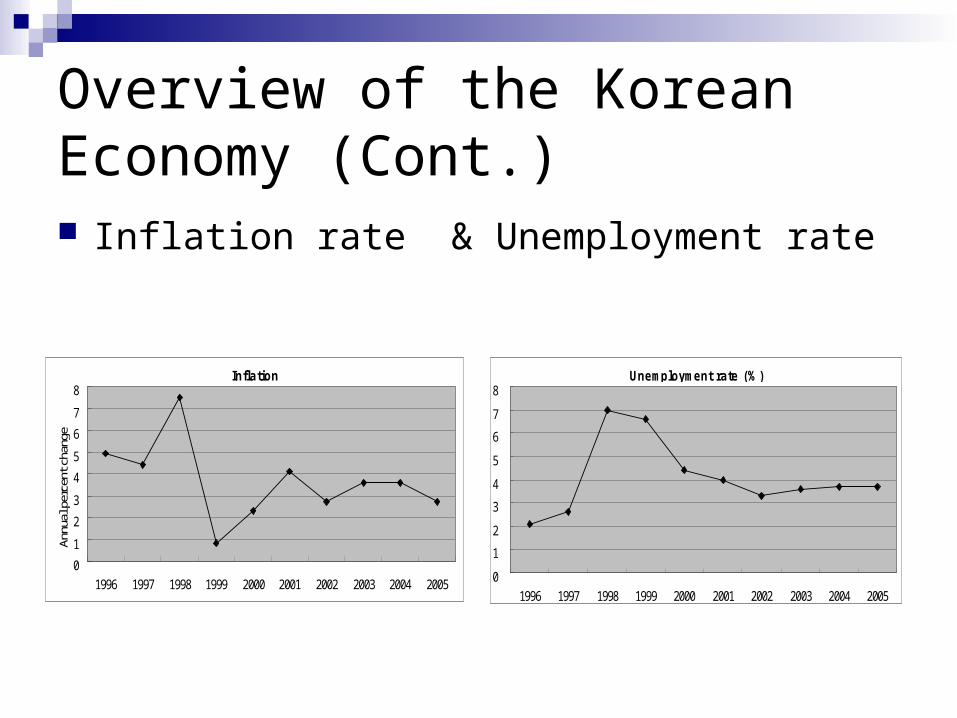
Overview of the Korean Economy (Cont.) Inflation rate & Unemployment rate
Inflation
0
1
2
3
4
5
6
7
8
1996 1997 1998 1999 2000 2001 2002 2003 2004 2005
Annu
al p
erce
nt c
hang
e
Unemployment rate (%)
0
1
2
3
4
5
6
7
8
1996 1997 1998 1999 2000 2001 2002 2003 2004 2005
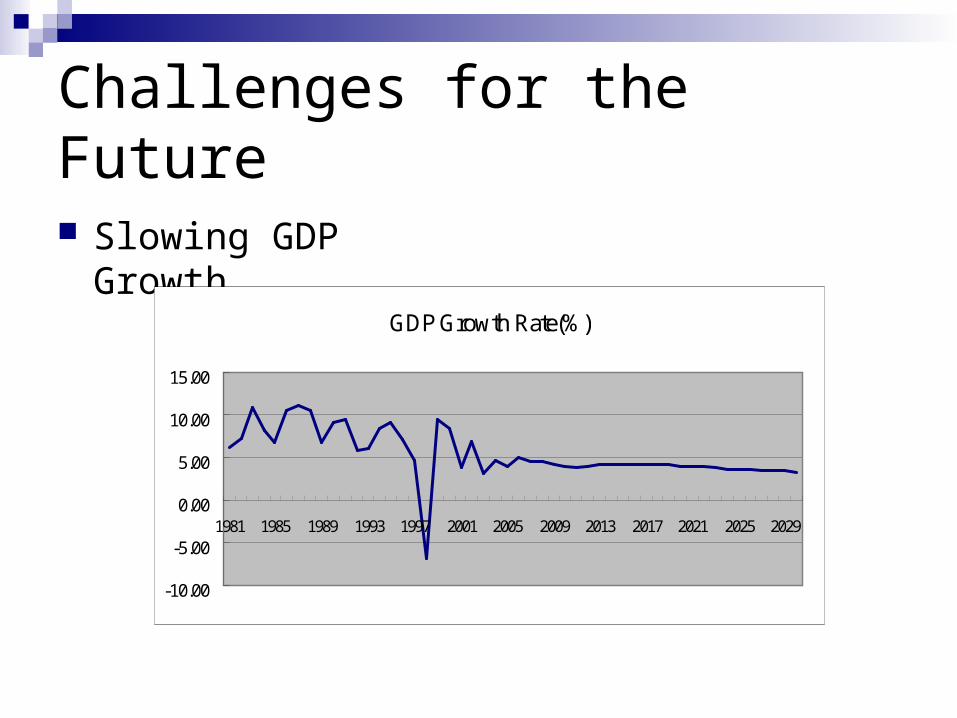
Challenges for the Future
Slowing GDP Growth
GDP Growth Rate(%)
-10.00
-5.00
0.00
5.00
10.00
15.00
1981 1985 1989 1993 1997 2001 2005 2009 2013 2017 2021 2025 2029
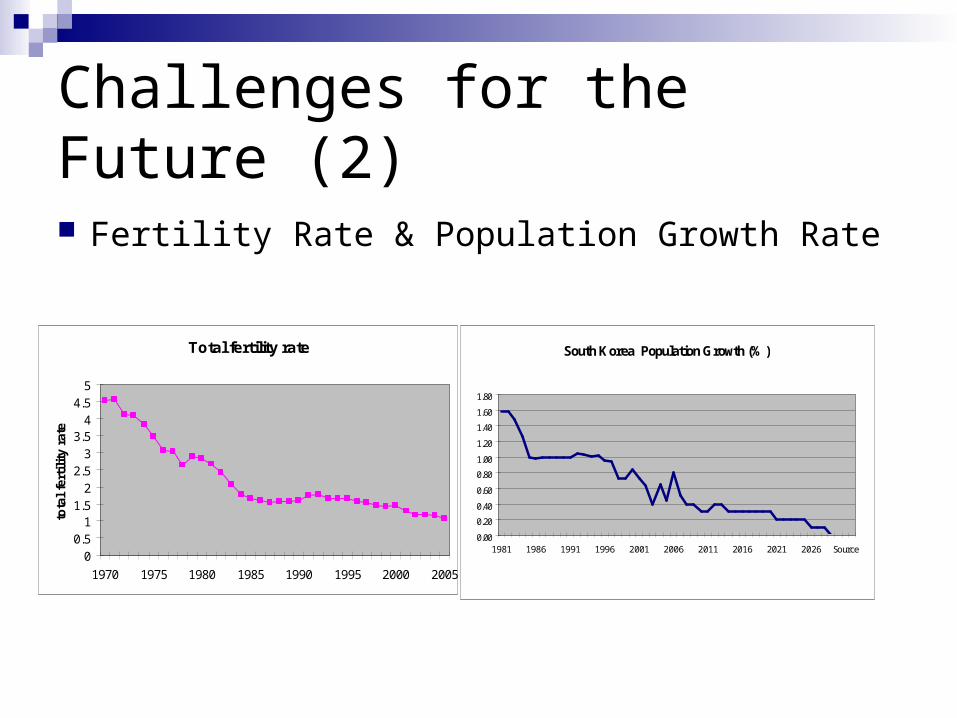
Challenges for the Future (2)
Fertility Rate & Population Growth Rate
Total fertility rate
00.5
11.5
22.5
33.5
44.5
5
1970 1975 1980 1985 1990 1995 2000 2005
tota
l fe
rtil
ity
rate
South Korea Population Growth (%)
0.00
0.20
0.40
0.60
0.80
1.00
1.20
1.40
1.60
1.80
1981 1986 1991 1996 2001 2006 2011 2016 2021 2026 Source
The impacts of the changes in population growth rates
1) The sustainable growth rate at the steady state level
2) The changes in capital accumulation and income per worker
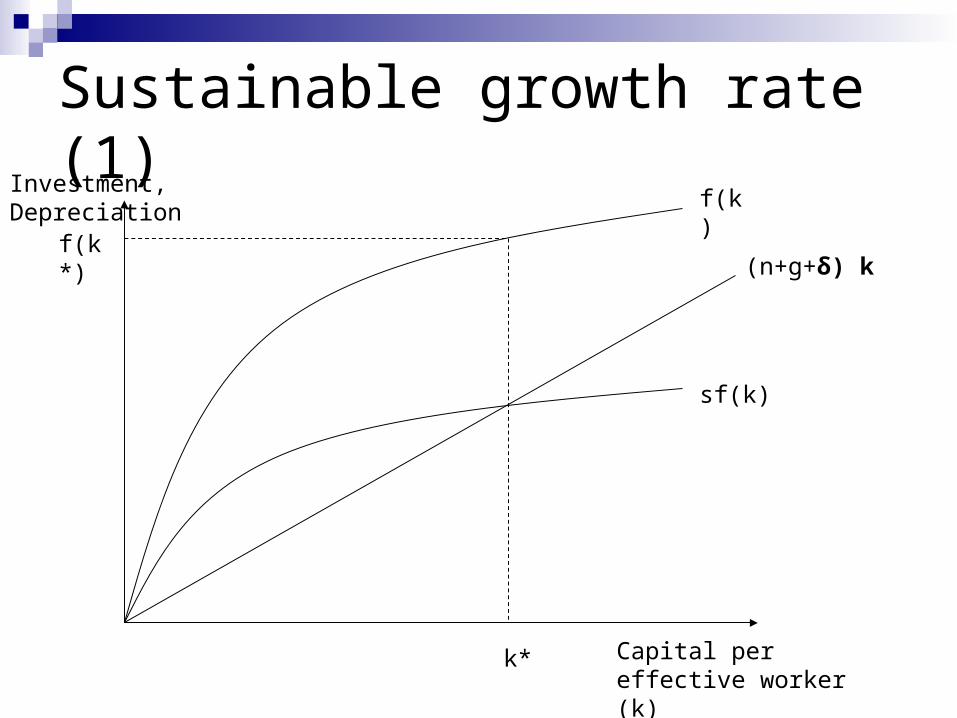
Sustainable growth rate (1)Investment, Depreciation
Capital per effective worker (k)
(n+g+δ) k
f(k)
sf(k)
k*
f(k*)
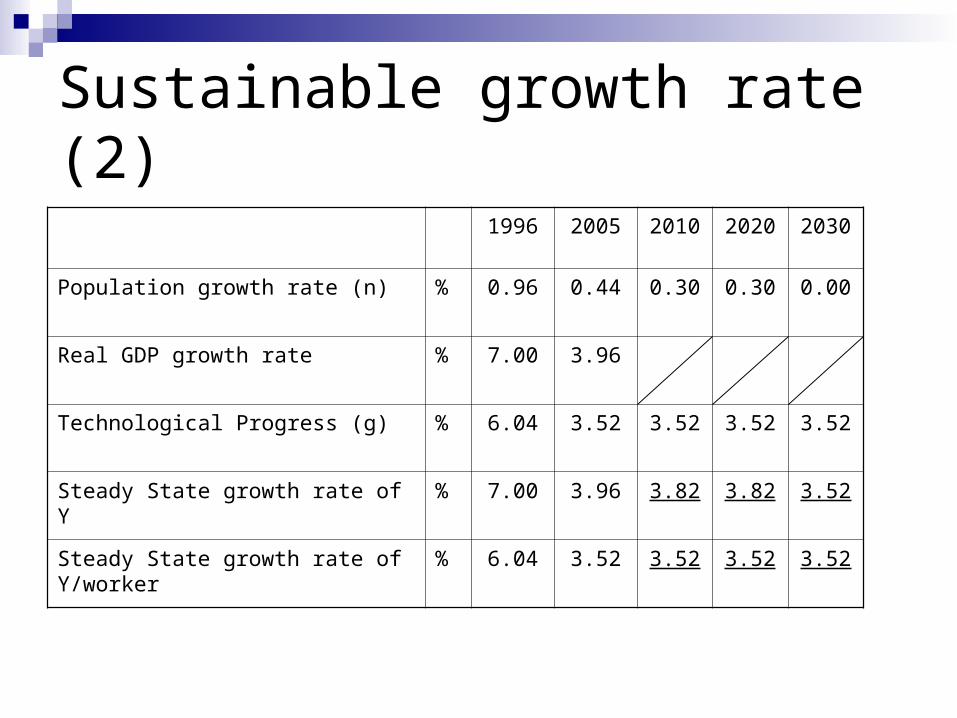
Sustainable growth rate (2)
1996 2005 2010 2020 2030
Population growth rate (n) % 0.96 0.44 0.30 0.30 0.00
Real GDP growth rate % 7.00 3.96
Technological Progress (g) % 6.04 3.52 3.52 3.52 3.52
Steady State growth rate of Y % 7.00 3.96 3.82 3.82 3.52
Steady State growth rate of Y/worker % 6.04 3.52 3.52 3.52 3.52
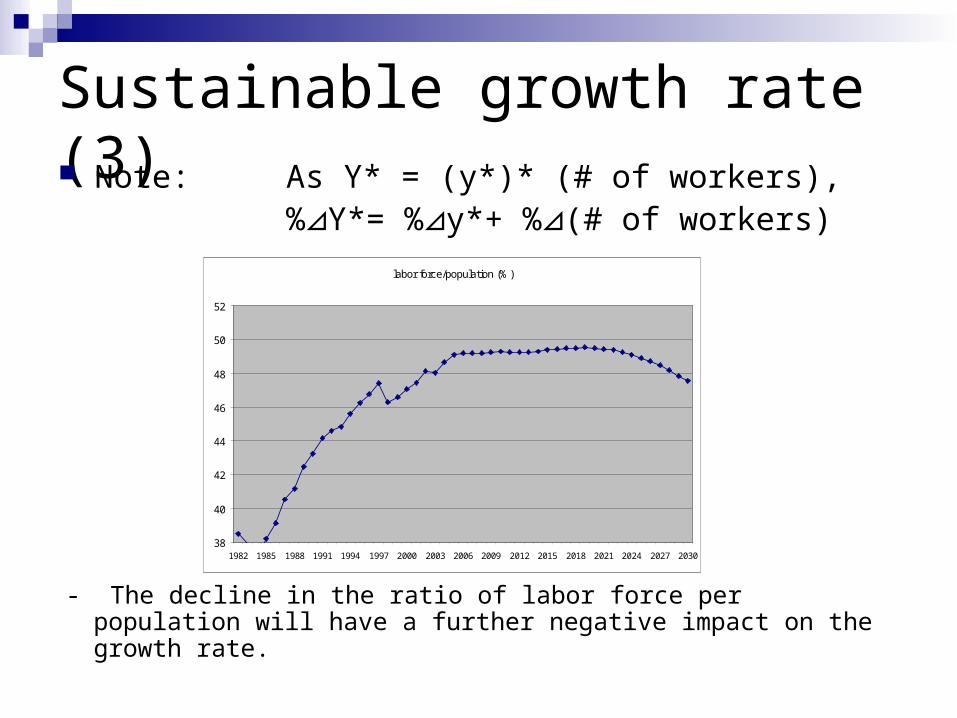
Sustainable growth rate (3) Note: As Y* = (y*)* (# of workers),
% Y*= % y*+ % (# of workers) ⊿ ⊿ ⊿labor force/population (%)
38
40
42
44
46
48
50
52
1982 1985 1988 1991 1994 1997 2000 2003 2006 2009 2012 2015 2018 2021 2024 2027 2030
- The decline in the ratio of labor force per population will have a further negative impact on the growth rate.
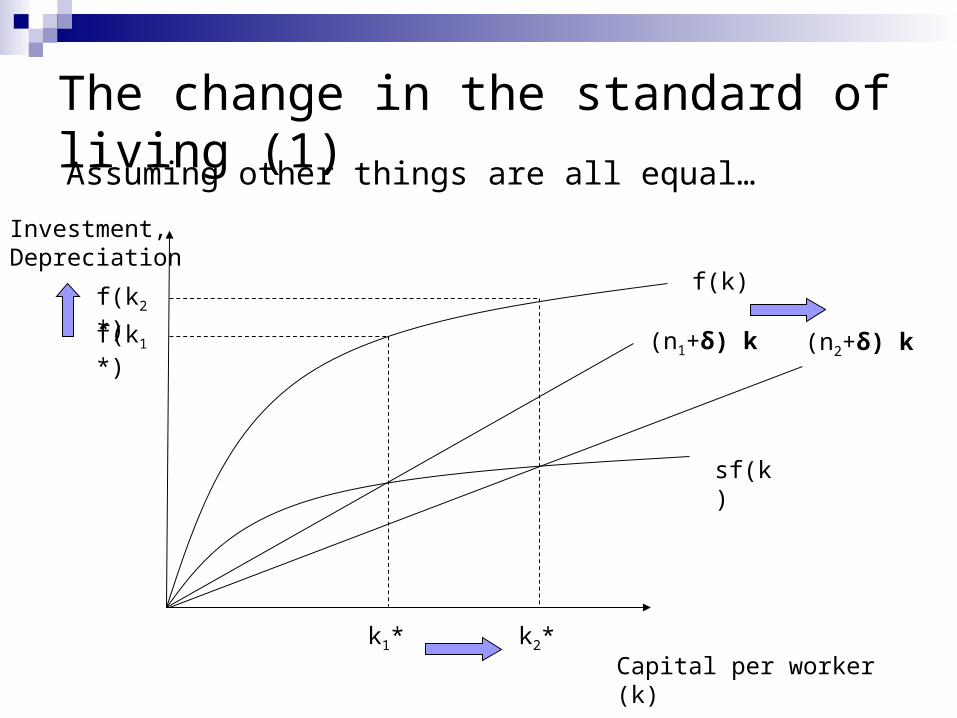
The change in the standard of living (1)Assuming other things are all equal…
(n2+δ) k
Capital per worker (k)
(n1+δ) k
f(k)
sf(k)
k1*
f(k1*)
k2*
f(k2*)
Investment, Depreciation
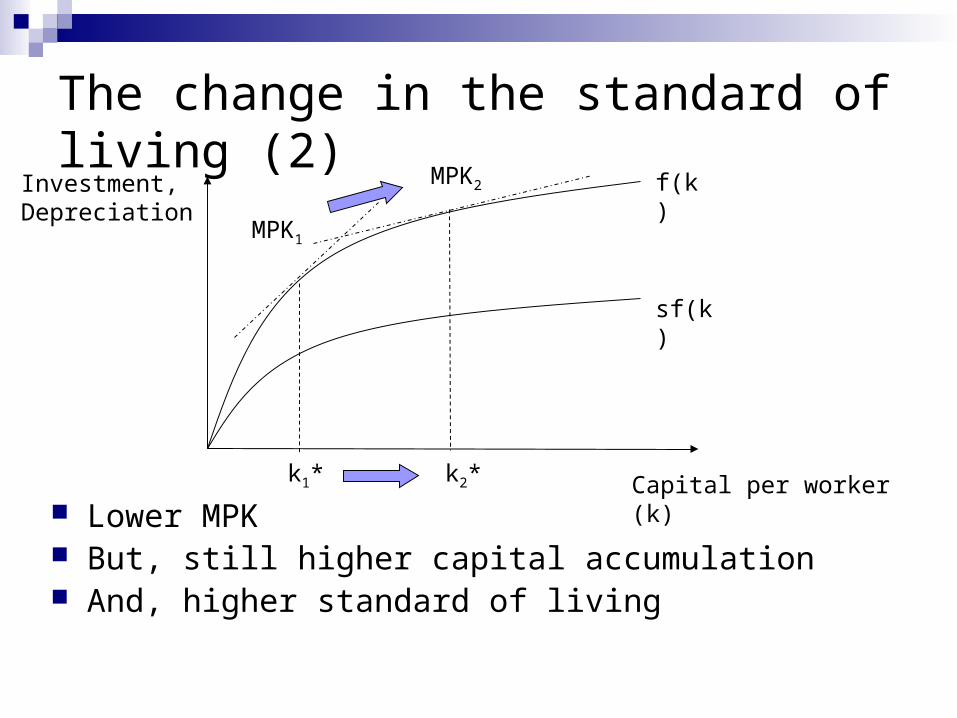
Lower MPK But, still higher capital accumulation And, higher standard of living
The change in the standard of living (2)
Capital per worker (k)k2*k1*
f(k)
sf(k)
MPK1
MPK2Investment, Depreciation
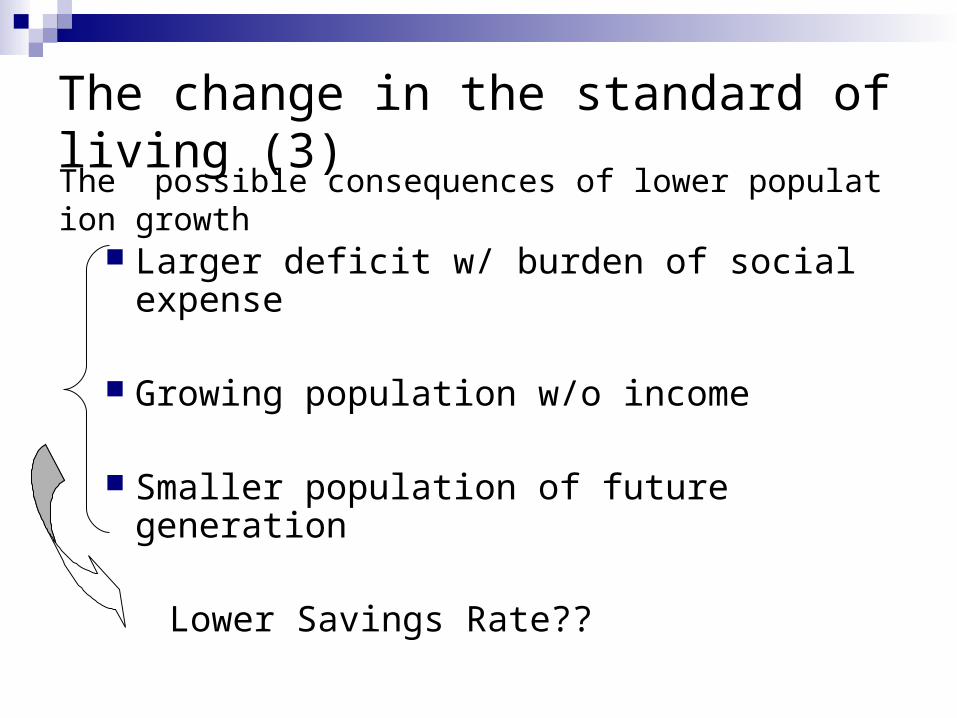
The change in the standard of living (3)
Larger deficit w/ burden of social expense
Growing population w/o income
Smaller population of future generation
Lower Savings Rate??
The possible consequences of lower population growth
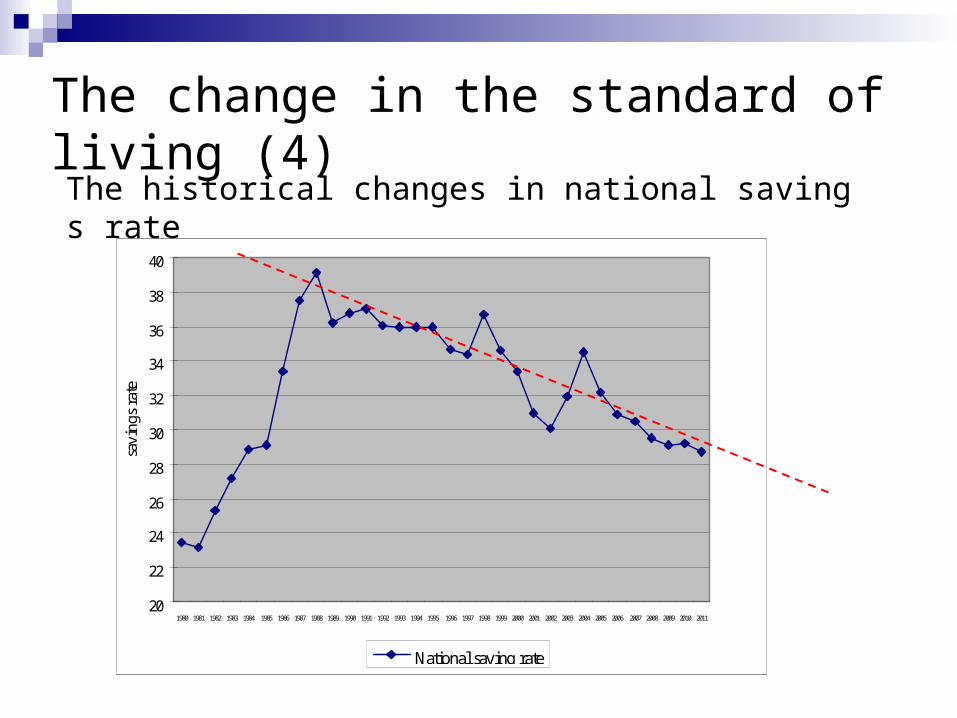
20
22
24
26
28
30
32
34
36
38
40
1980 1981 1982 1983 1984 1985 1986 1987 1988 1989 1990 1991 1992 1993 1994 1995 1996 1997 1998 1999 2000 2001 2002 2003 2004 2005 2006 2007 2008 2009 2010 2011
savi
ngs
rate
National saving rate
The change in the standard of living (4)The historical changes in national savings rate
28.00
30.00
32.00
34.00
36.00
38.00
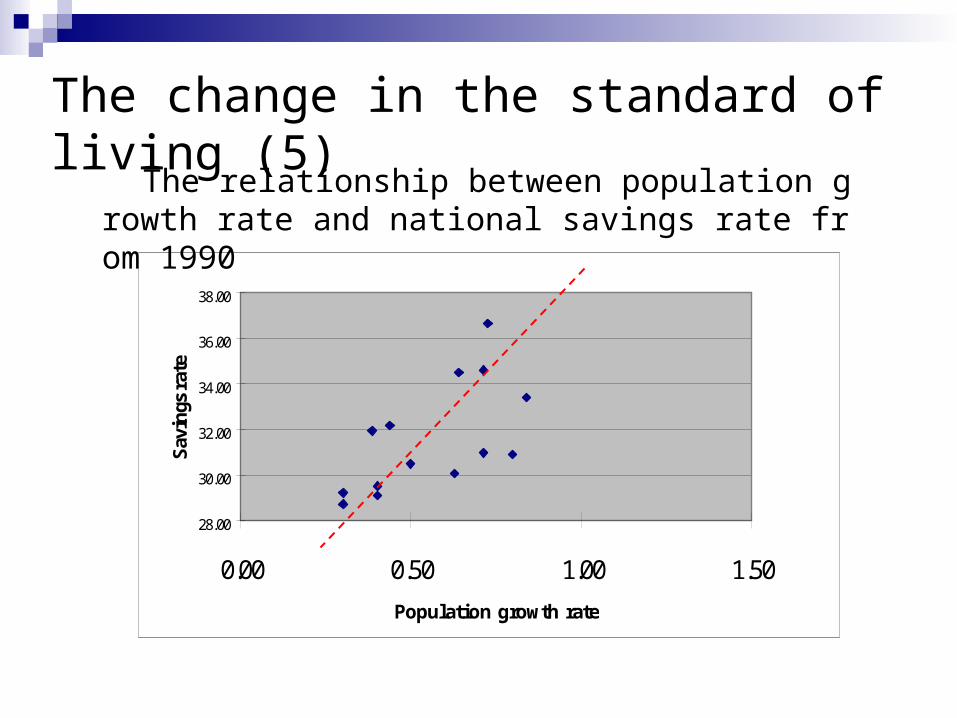
0.00 0.50 1.00 1.50
Population growth rate
Sav
ings
rat
e
The change in the standard of living (5) The relationship between population growth rate and
national savings rate from 1990
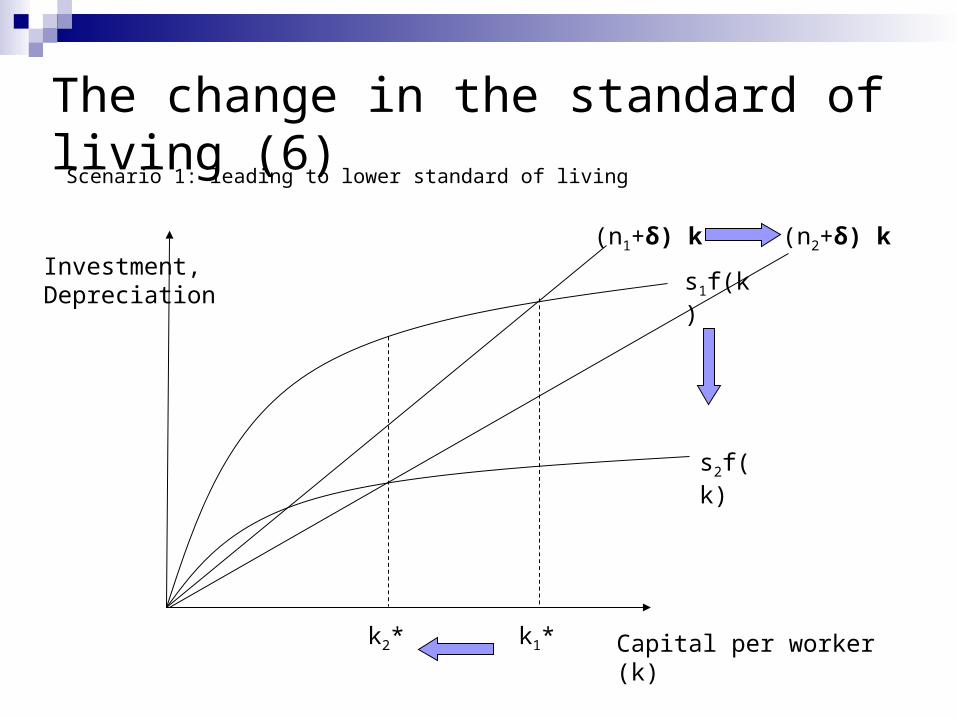
Scenario 1: leading to lower standard of living
The change in the standard of living (6)
Capital per worker (k)
(n2+δ) k(n1+δ) k
s1f(k)
s2f(k)
k2* k1*
Investment, Depreciation
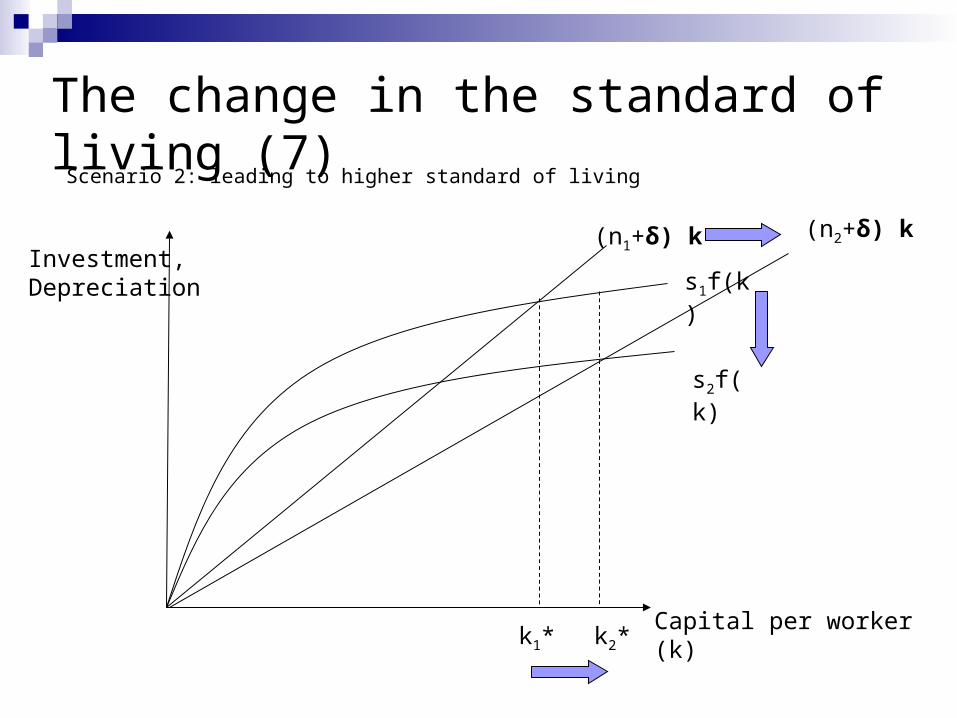
(n1+δ) k
s1f(k)
s2f(k)
k2*k1*
The change in the standard of living (7)
(n2+δ) k
Capital per worker (k)
Scenario 2: leading to higher standard of living
Investment, Depreciation
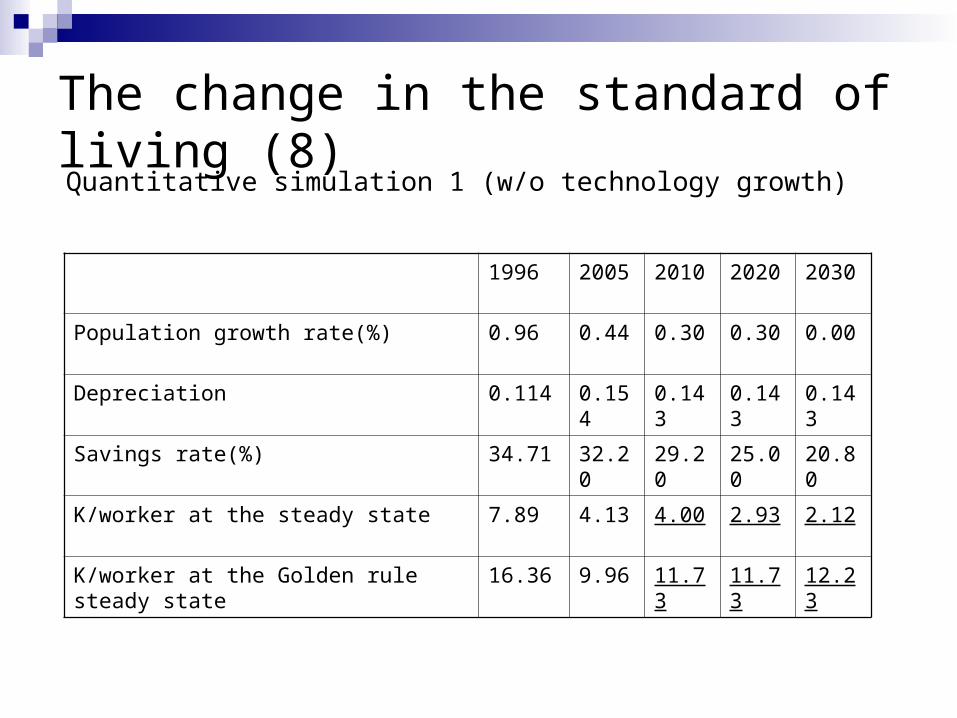
The change in the standard of living (8)Quantitative simulation 1 (w/o technology growth)
1996 2005 2010 2020 2030
Population growth rate(%) 0.96 0.44 0.30 0.30 0.00
Depreciation 0.114 0.154 0.143 0.143 0.143
Savings rate(%) 34.71 32.20 29.20 25.00 20.80
K/worker at the steady state 7.89 4.13 4.00 2.93 2.12
K/worker at the Golden rule steady state 16.36 9.96 11.73 11.73 12.23
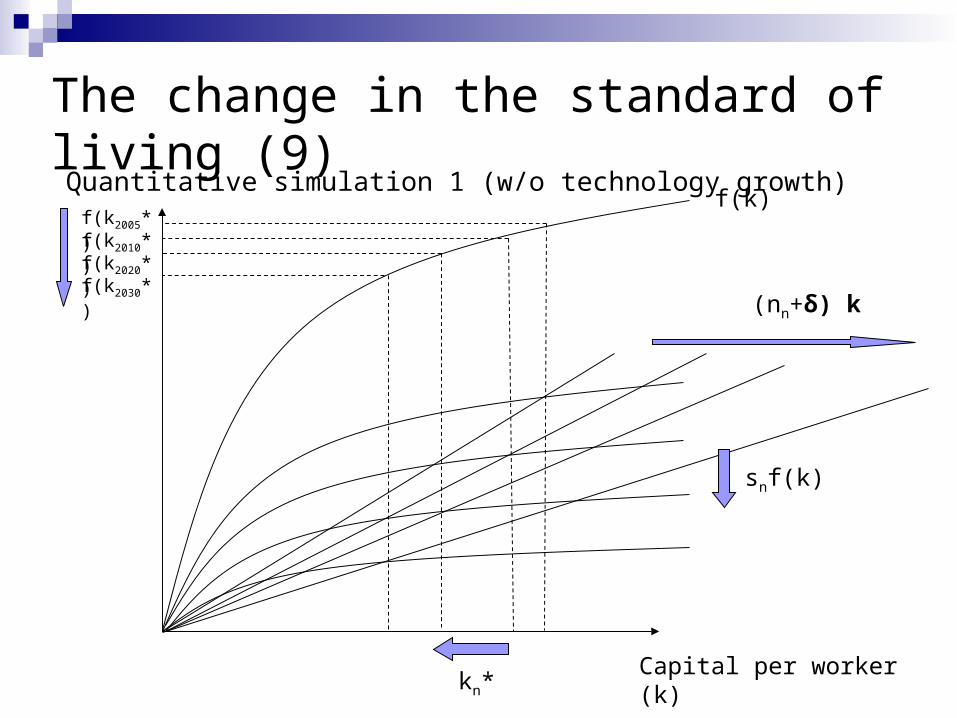
(nn+δ) k
The change in the standard of living (9)Quantitative simulation 1 (w/o technology growth)
snf(k)
kn*
f(k2005*)
Capital per worker (k)
f(k)
f(k2010*)f(k2020*)f(k2030*)
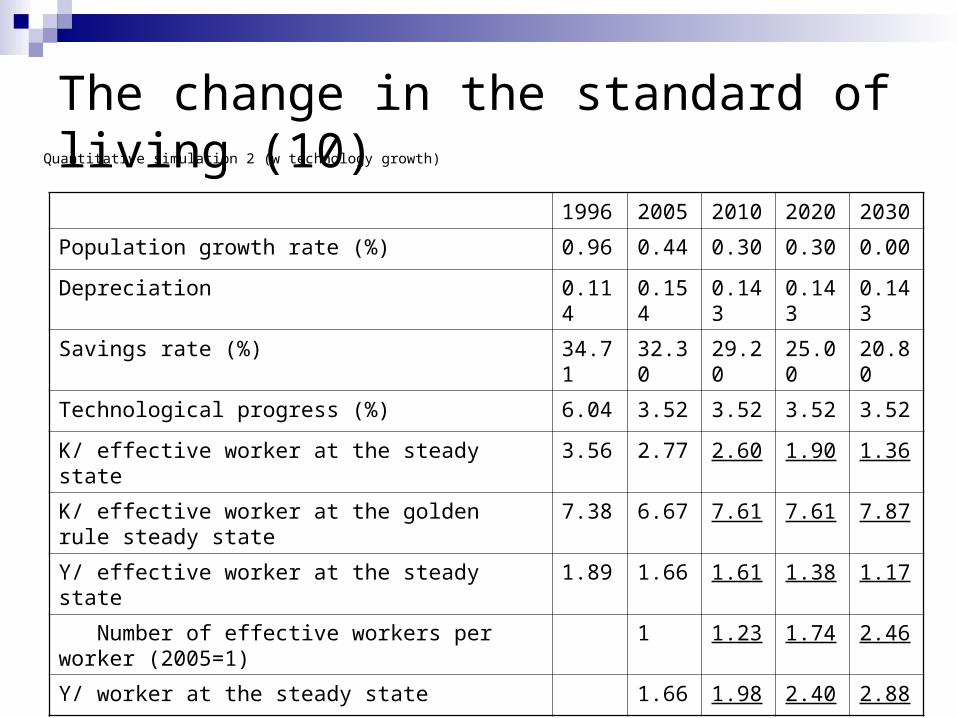
The change in the standard of living (10)Quantitative simulation 2 (w technology growth)
1996 2005 2010 2020 2030
Population growth rate (%) 0.96 0.44 0.30 0.30 0.00
Depreciation 0.114 0.154 0.143 0.143 0.143
Savings rate (%) 34.71 32.30 29.20 25.00 20.80
Technological progress (%) 6.04 3.52 3.52 3.52 3.52
K/ effective worker at the steady state 3.56 2.77 2.60 1.90 1.36
K/ effective worker at the golden rule steady state 7.38 6.67 7.61 7.61 7.87
Y/ effective worker at the steady state 1.89 1.66 1.61 1.38 1.17
Number of effective workers per worker (2005=1) 1 1.23 1.74 2.46
Y/ worker at the steady state 1.66 1.98 2.40 2.88
The implications of our analysis
A low population growth rate has an adverse impact on sustainable growth at the steady state level
A lowering population growth rate, accompanied with a decreasing savings rate, has an adverse effect on the level of the standard of living
What should the government do?
1. Increase population growth rate
2. Change the labor structure
3. Improve the pace of technological advancement
4. Increase savings rate
Increase population growth rate
Increase fertility rate subsidy to families with children laws friendly to working mothers tax reductions day-care system
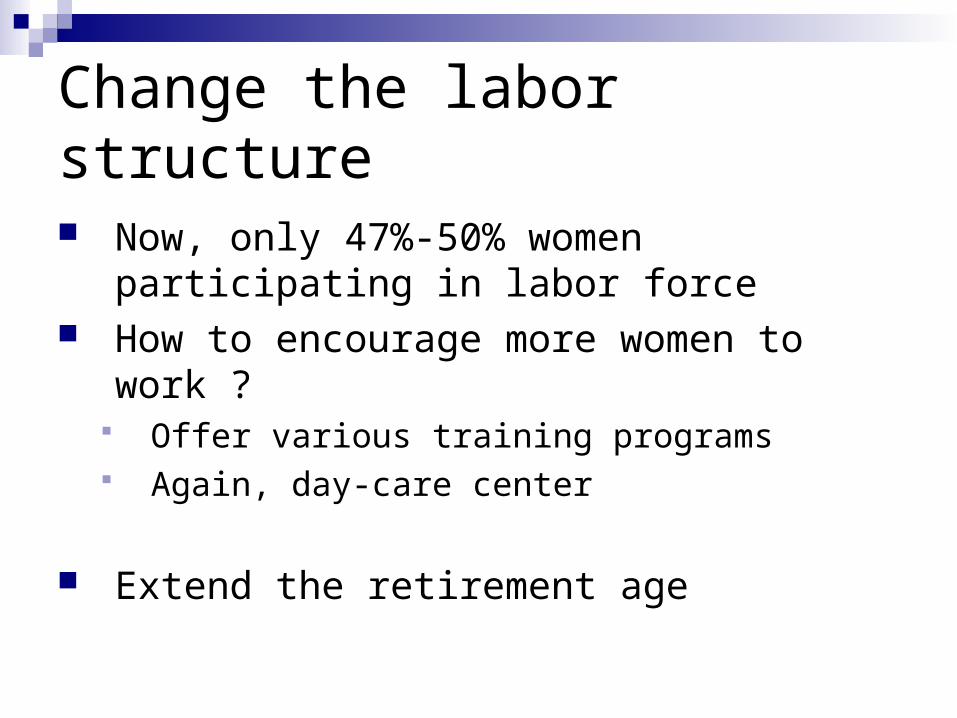
Change the labor structure
Now, only 47%-50% women participating in labor force
How to encourage more women to work ? Offer various training programs Again, day-care center
Extend the retirement age
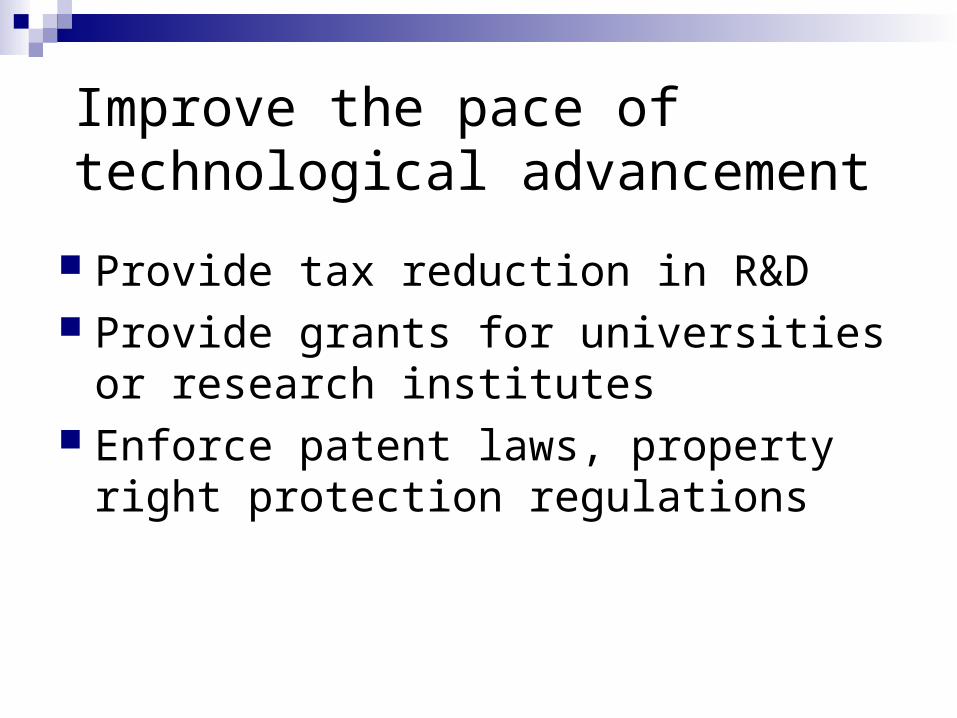
Improve the pace of technological advancement
Provide tax reduction in R&D Provide grants for universities or research
institutes Enforce patent laws, property right
protection regulations
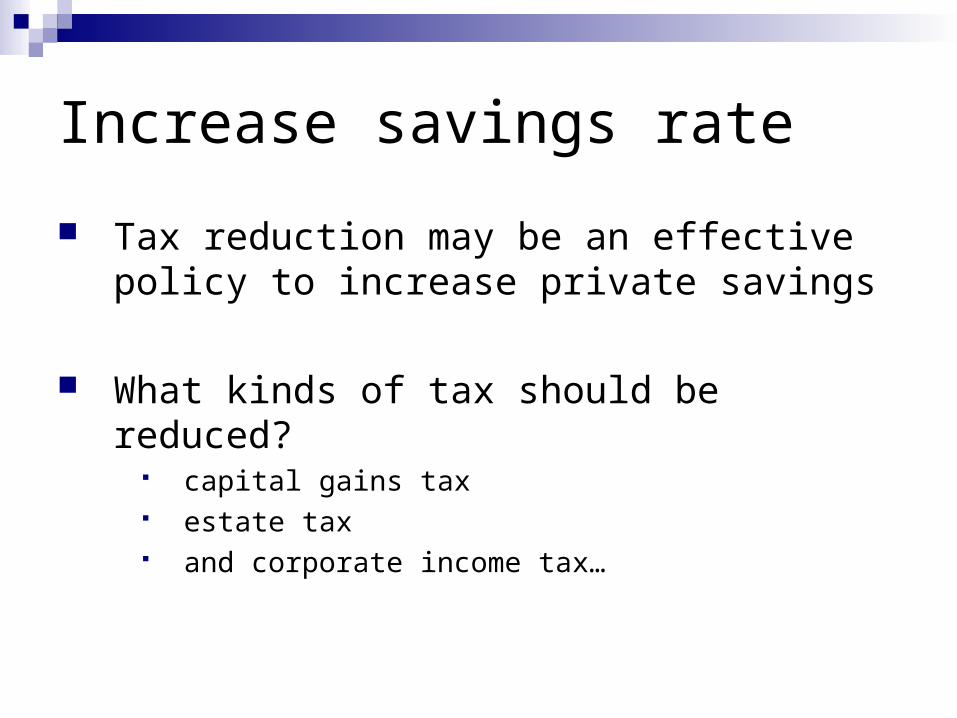
Increase savings rate
Tax reduction may be an effective policy to increase private savings
What kinds of tax should be reduced? capital gains tax estate tax and corporate income tax…
Questions?
Thank you