THE FOSCHINI GROUP LIMITED INTEGRATED ANNUAL REPORT 2016 -...
186
THE FOSCHINI GROUP LIMITED INTEGRATED ANNUAL REPORT 2016
Transcript of THE FOSCHINI GROUP LIMITED INTEGRATED ANNUAL REPORT 2016 -...

THE FOSCHINI GROUP LIMITEDINTEGRATED ANNUAL REPORT 2016

CONTENTS
INVESTMENT CASE IFCKey performance indicators and salient features 1
ABOUT THIS REPORT 2About this report 2
Chairman’s report 4
OUR PROFILE 8Our timeline 10
Our profile 13
Our business model 17
Our footprint 20
Our structure 22
Our brands 24
OUR OPERATING CONTEXT 34Our operating context 36
Our stakeholders 40
Our material matters 41
OUR STRATEGY AND PERFORMANCE 42Chief Executive Officer’s report 44
Chief Financial Officer’s report 50
Strategy performance report 56
Sustainability 68
10-year statistics 70
Performance review: Retail operations 72
Performance review: Credit 78
Performance review: Customer value-added products 80
OUR GOVERNANCE PROFILE 82Board of directors 84
Operating board 88
Our governance profile 90
Board audit committee report 98
Social and ethics committee report 104
Nomination committee report 109
Risk report 111
Remuneration report 114
SUMMARY CONSOLIDATED FINANCIALSTATEMENTS 134Summary consolidated statement of financial position 136
Summary consolidated income statement 137
Summary consolidated statement of comprehensive income 138
Summary consolidated statement of changes in equity 139
Summary consolidated cash flow statement 141
Summary consolidated segmental analysis 142
Selected explanatory notes to the summaryconsolidated financial statements 144
APPENDICES 150Appendix 1: Definitions 152
Appendix 2: Consolidated performance table 154
Appendix 3: Subsidiary companies 156
Appendix 4: Shareholdings of The Foschini Group Limited 157
Appendix 5: Exchange rate and share performance information 159
Appendix 6: Value-added statement 160
NOTICE OF ANNUAL GENERAL MEETING 162Important dates and times 164
Notice of annual general meeting 165
Application of participate electronically in the AGM 175
Form of proxy 177
ADMINISTRATION AND SHAREHOLDERS’CALENDAR IBC

TO BE THE LEADING FASHION LIFESTYLE RETAILER IN AFRICA WHILST GROWING OUR INTERNATIONAL FOOTPRINT
TFG HAS BEEN LISTED ON THE JSE FOR 75 YEARS, DELIVERING CONSISTENT GROWTH AND SHAREHOLDER RETURNS.
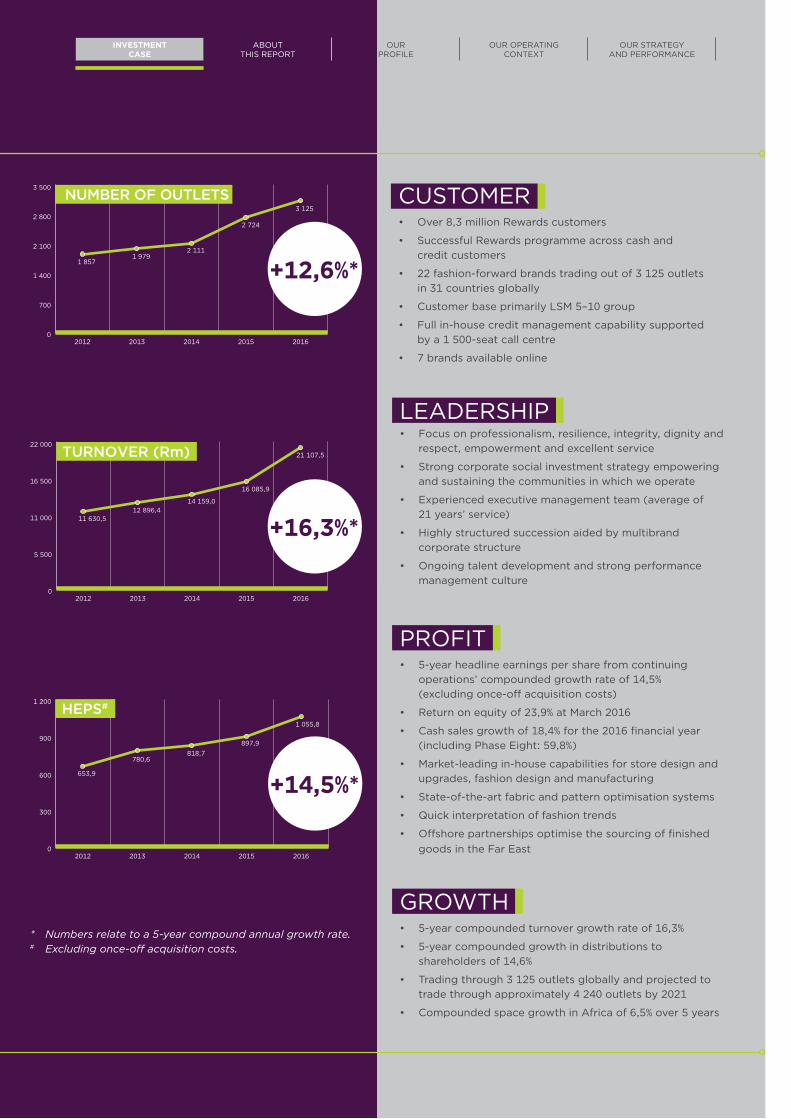
INVESTMENT CASE
0
700
1 400
2 100
2 800
3 500
20162015201420132012
NUMBER OF OUTLETS
1 8571 979
2 111
2 724
3 125
+12,6%*
0
300
600
900
1 200
20162015201420132012
HEPS#
653,9
780,6818,7
897,9
1 055,8
+14,5%*
0
5 500
11 000
16 500
22 000
20162015201420132012
TURNOVER (Rm)
11 630,512 896,4
14 159,0
16 085,9
21 107,5
+16,3%*
CUSTOMER• Over 8,3 million Rewards customers
• Successful Rewards programme across cash and credit customers
• 22 fashion-forward brands trading out of 3 125 outlets in 31 countries globally
• Customer base primarily LSM 5–10 group
• Full in-house credit management capability supported by a 1 500-seat call centre
• 7 brands available online
LEADERSHIP• Focus on professionalism, resilience, integrity, dignity and
respect, empowerment and excellent service
• Strong corporate social investment strategy empowering and sustaining the communities in which we operate
• Experienced executive management team (average of 21 years’ service)
• Highly structured succession aided by multibrand corporate structure
• Ongoing talent development and strong performance management culture
PROFIT• 5-year headline earnings per share from continuing
operations’ compounded growth rate of 14,5% (excluding once-off acquisition costs)
• Return on equity of 23,9% at March 2016
• Cash sales growth of 18,4% for the 2016 financial year (including Phase Eight: 59,8%)
• Market-leading in-house capabilities for store design and upgrades, fashion design and manufacturing
• State-of-the-art fabric and pattern optimisation systems
• Quick interpretation of fashion trends
• Offshore partnerships optimise the sourcing of finished goods in the Far East
GROWTH• 5-year compounded turnover growth rate of 16,3%
• 5-year compounded growth in distributions to shareholders of 14,6%
• Trading through 3 125 outlets globally and projected to trade through approximately 4 240 outlets by 2021
• Compounded space growth in Africa of 6,5% over 5 years
* Numbers relate to a 5-year compound annual growth rate. # Excluding once-off acquisition costs.
INVESTMENT CASE
ABOUTTHIS REPORT
OUR PROFILE
OUR OPERATINGCONTEXT
OUR STRATEGY AND PERFORMANCE

KEY PERFORMANCE INDICATORS AND SALIENT FEATURES
ONGOING FOCUS ON OUR KEY STRATEGIC OBJECTIVES ENABLED THE GROUP TOPRODUCE EARNINGS GROWTH WELL IN EXCESS OF THAT SUGGESTED BY THE CURRENT ECONOMIC CLIMATE
+31,2% +18,4% +57,2%Group turnover up 31,2% to R21,1 billion
(including Phase Eight)Strong cash sales growth of 18,4%
now representing 48,3% of turnover (excluding Phase Eight)
Total cash contribution (including Phase Eight)
+17,6% +18,5% +17,5%Headline earnings per share from continuing operations (excluding
once-off acquisition costs) up 17,6% to 1 055,8 cents
Final distribution of 385,0 cents per share – an 18,5% increase
Total distribution of 691,0 cents per share – a 17,5% increase
49,7% 17,0% 92,3%GROSS MARGIN OPERATING MARGIN EMPLOYMENT EQUITY
(TFG South Africa)
+6,6% 3 125 23,9%ANNUAL SPACE GROWTH TOTAL NUMBER OF OUTLETS RETURN ON EQUITY
(excluding international)
1
OUR GOVERNANCEPROFILE
SUMMARY CONSOLIDATED FINANCIAL STATEMENTS APPENDICES NOTICE OF ANNUAL
GENERAL MEETING ADMINISTRATION
ELEMENT AND PURPOSE WEBSITE LINK
Sustainability overview report detailing our sustainability strategy, focus areas and non-financial data relevant to a wide range of stakeholders
www.tfglimited.co.za/sustainability/sustainability overview
Detailed King III compliance checklist setting out TFG’s application of the governance principles and giving explanations of where these are not fully applied, aimed at shareholders
www.tfglimited.co.za/investor-relations/integrated reporting centre
Detailed index responding to each of the G4 criteria of the Global Reporting Initiative (GRI), aimed at a wide range of stakeholders
www.tfglimited.co.za/investor-relations/integrated reporting centre
The full set of annual financial statements for 2016 for the use of shareholders, investors and analysts
www.tfglimited.co.za/investor-relations/financial_results
TFG INTEGRATED ANNUAL REPORT 2016 www.tfglimited.co.za2
ABOUTTHIS REPORTWe take pleasure in presenting our shareholders, investors and wider stakeholder community with the 2016 integrated annual report for The Foschini Group Limited and its subsidiaries (collectively referred to as “TFG” or “the group”). The report covers the financial year from 1 April 2015 to 31 March 2016. It includes operations in South Africa, Botswana, Ghana, Lesotho, Namibia, Swaziland and Zambia, and globally in the UK, Ireland and 22 other international countries under the various TFG retail brands. 78% of turnover is contributed by South Africa, our home market. All data apply to the group, unless specifically indicated otherwise.
This report aligns with the following requirements:
• The King Code of Governance for South Africa (King III)
• The Companies Act of South Africa, No. 71 of 2008, as amended
• The International Integrated Reporting Council’s <IR> Framework (referred to as “the Framework”)
• The “core” reporting requirements of the G4 Sustainability Reporting Guidelines
In accordance with the stated objectives of integrated reporting, our report focuses on those matters that have a material impact on TFG’s ability to create and sustain value, and outlines how these matters were integrated and considered in our business strategy. Read more about the process we followed to determine these matters on page 41.
Although we further refined this report’s structure for 2016, all data which collectively provide a consolidated review of the group’s financial, social, economic and
environmental performance, remain comparable and consistent other than indicated below.
KEY EVENTS FOR 2016In reading the report and making assessments of our performance and prospects, readers should take the following key events into account as it may affect the comparability of financial and non-financial information:
• The full year’s results for Phase Eight are included for 2016, compared to only two months of trading that were included in the previous comparable year.
• Following the disposal of the RCS Group in August 2014, trading for three months was still included in the 2015 group financial results as a discontinued operation.
• TFG acquired 100% of Whistles, a British contemporary fashion brand, through its UK subsidiary, Phase Eight, in March 2016. As the acquisition was at the end of our financial year, these results do not include any trading related to Whistles for this financial year. However, their at-acquisition balance sheet has been consolidated as at 31 March 2016.
Read more about the impact and scope of these events in the Chief Financial Officer’s report on page 50.
OUR REPORTING SUITEGuided by the Framework, this report aims to be a concise communication, with content developed according to the principle of materiality. The investor centre on our website contains the full suite of financial reporting elements. Additional information, aimed at a wider audience, has been made available on our website and includes the following:
INVESTMENT CASE
ABOUTTHIS REPORT
OUR PROFILE
OUR OPERATINGCONTEXT
OUR STRATEGY AND PERFORMANCE

3
Feedback on the integrated annual report and requests for printed copies of the report can be addressed to the Company Secretary, whose contact details are on the inside back cover of this report.
Should you elect to receive regular investor-related electronic communication from TFG, kindly provide your email address by emailing our investor relations department at [email protected].
NAVIGATIONAL ICONSThe following icons are used throughout the report to improve ease of reference, highlight connectivity and direct readers to additional information:
AFRICA Information specific to our African operations, which includes South Africa, Botswana, Ghana, Lesotho, Namibia, Swaziland and Zambia
Page reference
Website (www.tfglimited.co.za unless otherwise specified)
DISCLAIMERThis report contains certain forward-looking statements regarding the results and operations of TFG, which by their nature involve risk and uncertainty because they relate to events and depend on circumstances that may or may not occur in the future.
These forward-looking statements have not been reviewed or reported on by the group’s external auditors.
INDEPENDENT ASSURANCEIn respect of the 2016 financial year, we obtained external assurance of the following aspects of our integrated annual report:
ELEMENTS ASSURED OUTPUT FROM ASSURANCE STATUS ASSURANCE PROVIDER
FinancialAnnual financial statements External audit report Audited KPMG Inc.EmpowermentBBBEE credentials BBBEE scorecard verified at level 4 Assured EmpowerdexHuman resourcesEmployee satisfaction Supaloud survey results reported on
in the sustainability overview reportIndependently verified
Pure Survey
The group has not commissioned additional external assurance of the non-financial information provided in this report other than what is indicated in the table above.
COMBINED ASSURANCEOur internal process to ensure the reliability and completeness of the information in the integrated annual report involves the following:
• Review of the draft report by TFG’s senior management and executives prior to submitting the report to our supervisory board for approval.
• Review of the effectiveness of our system of internal financial control by our internal auditors who formally report to the board audit committee.
APPROVALThe audit committee recommended the approval of the annual financial statements and the integrated annual report to the board. The board reviewed and assessed the content of the integrated annual report and believes that it addresses the material matters that impact the group and that it is a fair representation of TFG’s integrated performance.
The board approved the 2016 integrated annual report on 29 June 2016.
M Lewis A D Murray Chairman CEO
OUR GOVERNANCEPROFILE
SUMMARY CONSOLIDATED FINANCIAL STATEMENTS APPENDICES NOTICE OF ANNUAL
GENERAL MEETING ADMINISTRATION
CHAIRMAN’SREPORT
The financial year under review has witnessed significant developments in our group. There was continued and substantial investment in South Africa and Africa, new brands were added, further progress in respect to the integration of Phase Eight was made, and Whistles, a contemporary fashion brand based in the UK, was acquired. In addition, our omnichannel continued its successful roll-out.
Against this backdrop, I am pleased to introduce our 2016 integrated annual report.
INTEGRATED REPORTINGWe seek to continually improve our integrated reporting and, with this in mind, made some refinements to the structure of this year’s report. Our integrated report presents a holistic view of the group, its operations and the broader societal matters that impact our business. We strive to communicate through our report all the factors that materially affect our ability to create value for all our stakeholders over time.
We believe we provided sufficient context in our report to enable our stakeholders to understand the key socio-economic, governance and environmental trends that may affect the group and to appreciate, from a balanced perspective, the impact of our operations on the resources and relationships we rely on in order to create value for our stakeholders.
In reading the report, I would like to draw your attention to the fact that, while the geographical spread of our operations is far broader than in previous years, the commentary in this report remains focused on the African (and in particular South African) operating environment as this continues to be the most significant geographical region for the group. Furthermore, certain products and services such as credit and customer value-added products are not available internationally. Certain key performance indicators such as Broad-based Black Economic Empowerment (BBBEE) targets and sustainability initiatives like local supply chain development are also unique to our South African operating environment. To assist the reader, we will make use of the following icon to identify report content that pertains only to our African operations. This has also been included in the navigational icons on the previous page.
ECONOMY AND OPERATING ENVIRONMENTThe economic environment during the past financial year proved most challenging. The global economic outlook remained uncertain, dominated by many factors including the outcome of the British referendum and concerns about the Chinese economy, with their impact on global growth, commodity prices and currencies.
The domestic economy likewise faced headwinds. The outlook for consumer spending remains weak as consumers face rising inflation, interest rate hikes and high unemployment rates. As a result, consumer confidence is
TFG INTEGRATED ANNUAL REPORT 2016 www.tfglimited.co.za4
AFRICA
INVESTMENT CASE
ABOUTTHIS REPORT
OUR PROFILE
OUR OPERATINGCONTEXT
OUR STRATEGY AND PERFORMANCE
5
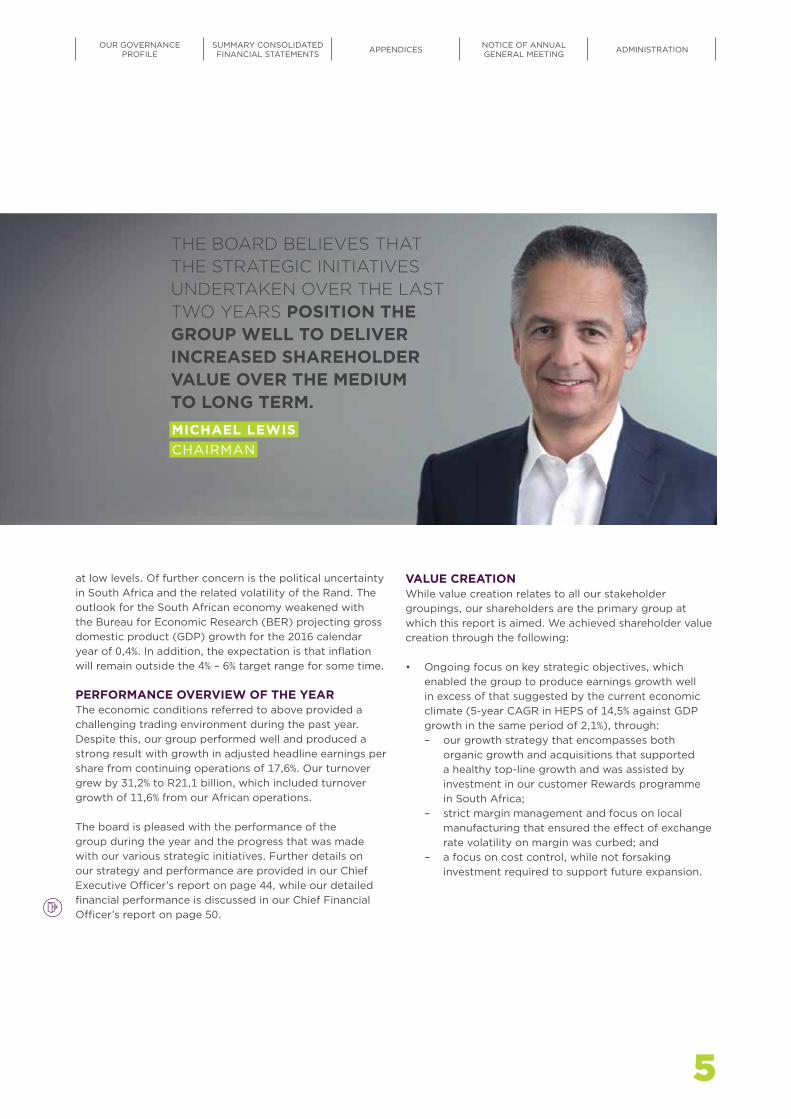
MICHAEL LEWISCHAIRMAN
THE BOARD BELIEVES THAT THE STRATEGIC INITIATIVES UNDERTAKEN OVER THE LAST TWO YEARS POSITION THE GROUP WELL TO DELIVER INCREASED SHAREHOLDER VALUE OVER THE MEDIUM TO LONG TERM.
at low levels. Of further concern is the political uncertainty in South Africa and the related volatility of the Rand. The outlook for the South African economy weakened with the Bureau for Economic Research (BER) projecting gross domestic product (GDP) growth for the 2016 calendar year of 0,4%. In addition, the expectation is that inflation will remain outside the 4% – 6% target range for some time.
PERFORMANCE OVERVIEW OF THE YEARThe economic conditions referred to above provided a challenging trading environment during the past year. Despite this, our group performed well and produced a strong result with growth in adjusted headline earnings per share from continuing operations of 17,6%. Our turnover grew by 31,2% to R21,1 billion, which included turnover growth of 11,6% from our African operations.
The board is pleased with the performance of the group during the year and the progress that was made with our various strategic initiatives. Further details on our strategy and performance are provided in our Chief Executive Officer’s report on page 44, while our detailed financial performance is discussed in our Chief Financial Officer’s report on page 50.
VALUE CREATIONWhile value creation relates to all our stakeholder groupings, our shareholders are the primary group at which this report is aimed. We achieved shareholder value creation through the following:
• Ongoing focus on key strategic objectives, which enabled the group to produce earnings growth well in excess of that suggested by the current economic climate (5-year CAGR in HEPS of 14,5% against GDP growth in the same period of 2,1%), through:– our growth strategy that encompasses both
organic growth and acquisitions that supported a healthy top-line growth and was assisted by investment in our customer Rewards programme in South Africa;
– strict margin management and focus on local manufacturing that ensured the effect of exchange rate volatility on margin was curbed; and
– a focus on cost control, while not forsaking investment required to support future expansion.
5
OUR GOVERNANCEPROFILE
SUMMARY CONSOLIDATED FINANCIAL STATEMENTS APPENDICES NOTICE OF ANNUAL
GENERAL MEETING ADMINISTRATION
• Key strategic decisions over the last few years, which fundamentally shifted the business from being purely South African based (albeit with an expanding African footprint) with an independent financial services business (in the form of the RCS Group) to a more focused retail business with a far broader geographical spread. In so doing:– the understanding of our business by investors as a
purely retail business rather than a combination of retail and financial services improved;
– the business diversified in terms of geographical spread, market segment (Phase Eight appeals to the upper market segment) and cash sales contribution; and
– the group, through the Phase Eight business, created a platform for further international expansion, a good example of which is the recent bolt on acquisition of Whistles.
The board believes that the strategic initiatives undertaken over the last two years position the group well to deliver increased shareholder value over the medium to long term.
GOVERNANCE AND LEADERSHIPTFG remains committed to high standards of corporate governance, with accountability and transparency being key guiding principles in all decision-making. As is outlined more fully in the corporate governance report, management and the board continue to be guided by the principles contained in the King III code and the Listings Requirements of the Johannesburg Stock Exchange (JSE). Our detailed compliance with the King III principles is available on our website and we remain abreast of developments in relation to the draft King IV.
In addition to its usual oversight of governance, the board placed particular focus this year on the integration of Phase Eight. While good progress was made, this will continue to receive focus next year as the Whistles operations are fully integrated.
As announced on SENS, we appointed Graham Davin as an independent non-executive director effective from 5 November 2015. Graham has extensive international
financial and broad business experience. We believe this experience will be particularly useful given the expanded geographical footprint of our business. We welcome him to the board and look forward to his contribution.
I would also like to take this opportunity to thank Dee Sheard, our previous Company Secretary, for her contribution to our group and the key role she played over many years. As was announced on SENS, Dee resigned as Company Secretary with effect from 22 May 2016 and Darwin van Rooyen has been appointed in this role from 23 May 2016.
PROSPECTSIt gives me great pleasure to note that this year marks the 75th year of TFG trading on the JSE. The business has weathered many storms in its history and despite the muted growth prospects for the South African economy in the year ahead, the board is firmly of the view that the group is well-poised for success in the future, with clear strategies in place under the direction of sound leadership.
APPRECIATIONOn behalf of the board I would like to thank:
• Doug Murray for his outstanding leadership of the group during the year;
• the senior executive team members for their skilled and professional management;
• all our employees for their excellent performance, commitment and hard work during the year;
• our customers for their continued loyal support;• our shareholders for their support and confidence in
the future of the group;• our suppliers, advisors and business associates for
their contribution to the growth of the business; and• my fellow directors for their insight, guidance and
valuable input.
Michael LewisChairman
29 June 2016
CHAIRMAN’S REPORT CONTINUED
TFG INTEGRATED ANNUAL REPORT 2016 www.tfglimited.co.za6
INVESTMENT CASE
ABOUTTHIS REPORT
OUR PROFILE
OUR OPERATINGCONTEXT
OUR STRATEGY AND PERFORMANCE

77
OUR GOVERNANCEPROFILE
SUMMARY CONSOLIDATED FINANCIAL STATEMENTS APPENDICES NOTICE OF ANNUAL
GENERAL MEETING ADMINISTRATION
OUR PROFILE
Our timeline 10
Our profile 13
Our business model 17
Our footprint 20
Our structure 22
Our brands 24
TFG INTEGRATED ANNUAL REPORT 2016 www.tfglimited.co.za8

9
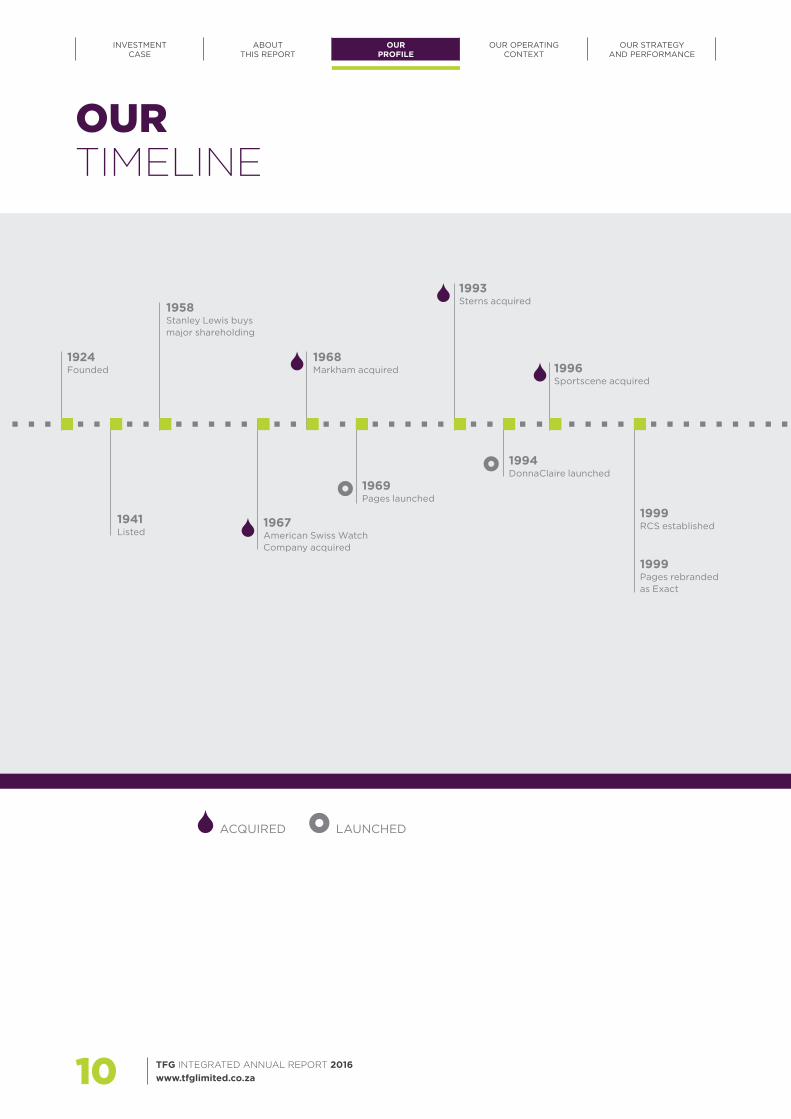
1924 Founded
1941 Listed
1958 Stanley Lewis buys major shareholding
1967 American Swiss Watch Company acquired
1968 Markham acquired
1969 Pages launched
1993 Sterns acquired
1994 DonnaClaire launched
1996 Sportscene acquired
1999 Pages rebranded as Exact
1999 RCS established
ACQUIRED LAUNCHED
TFG INTEGRATED ANNUAL REPORT 2016 www.tfglimited.co.za10
OURTIMELINE
INVESTMENT CASE
ABOUTTHIS REPORT
OUR PROFILE
OUR OPERATINGCONTEXT
OUR STRATEGY AND PERFORMANCE
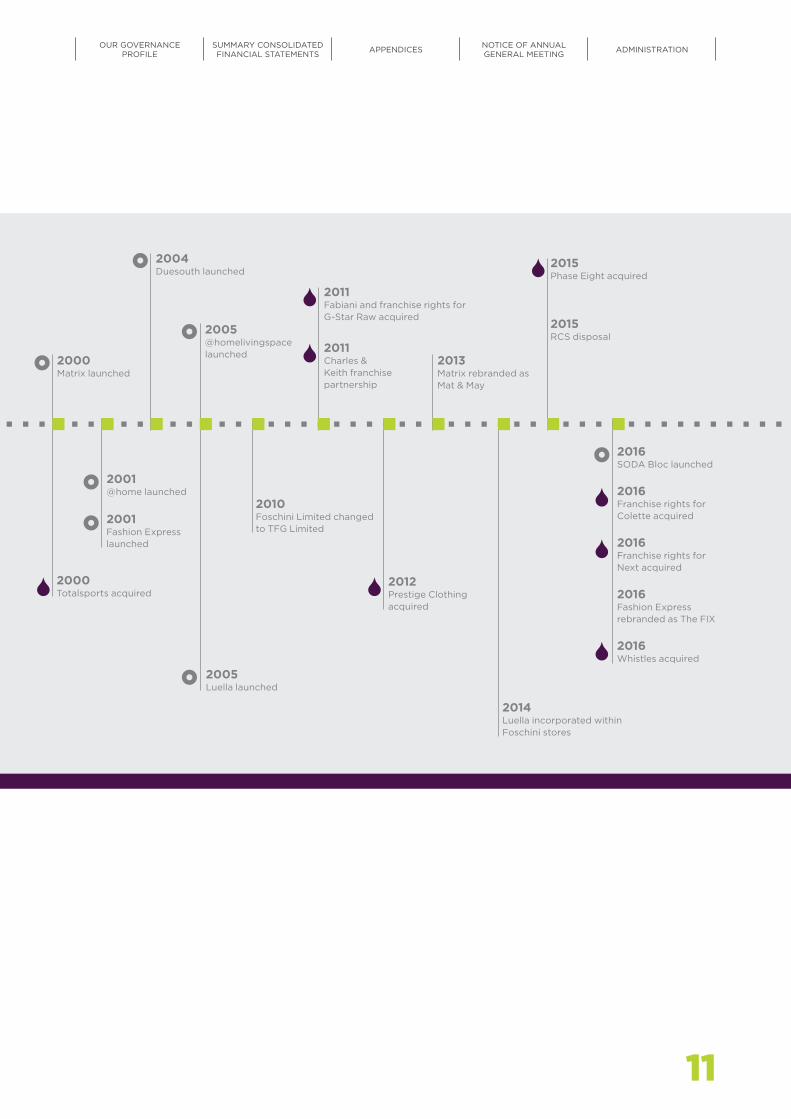
2000 Totalsports acquired
2000 Matrix launched
2001 Fashion Express launched
2001@home launched
2004 Duesouth launched
2005 Luella launched
2005@homelivingspace launched
2010 Foschini Limited changed to TFG Limited
2011 Charles & Keith franchise partnership
2011 Fabiani and franchise rights for G-Star Raw acquired
2016 Franchise rights for Colette acquired
2016 Fashion Express rebranded as The FIX
2016 Franchise rights for Next acquired
2016 Whistles acquired
2016 SODA Bloc launched
2012 Prestige Clothing acquired
2013 Matrix rebranded as Mat & May
2014 Luella incorporated within Foschini stores
2015 Phase Eight acquired
2015 RCS disposal
11
OUR GOVERNANCEPROFILE
SUMMARY CONSOLIDATED FINANCIAL STATEMENTS APPENDICES NOTICE OF ANNUAL
GENERAL MEETING ADMINISTRATION

12 TFG INTEGRATED ANNUAL REPORT 2016 www.tfglimited.co.za
INVESTMENT CASE
ABOUTTHIS REPORT
OUR PROFILE
OUR OPERATINGCONTEXT
OUR STRATEGY AND PERFORMANCE
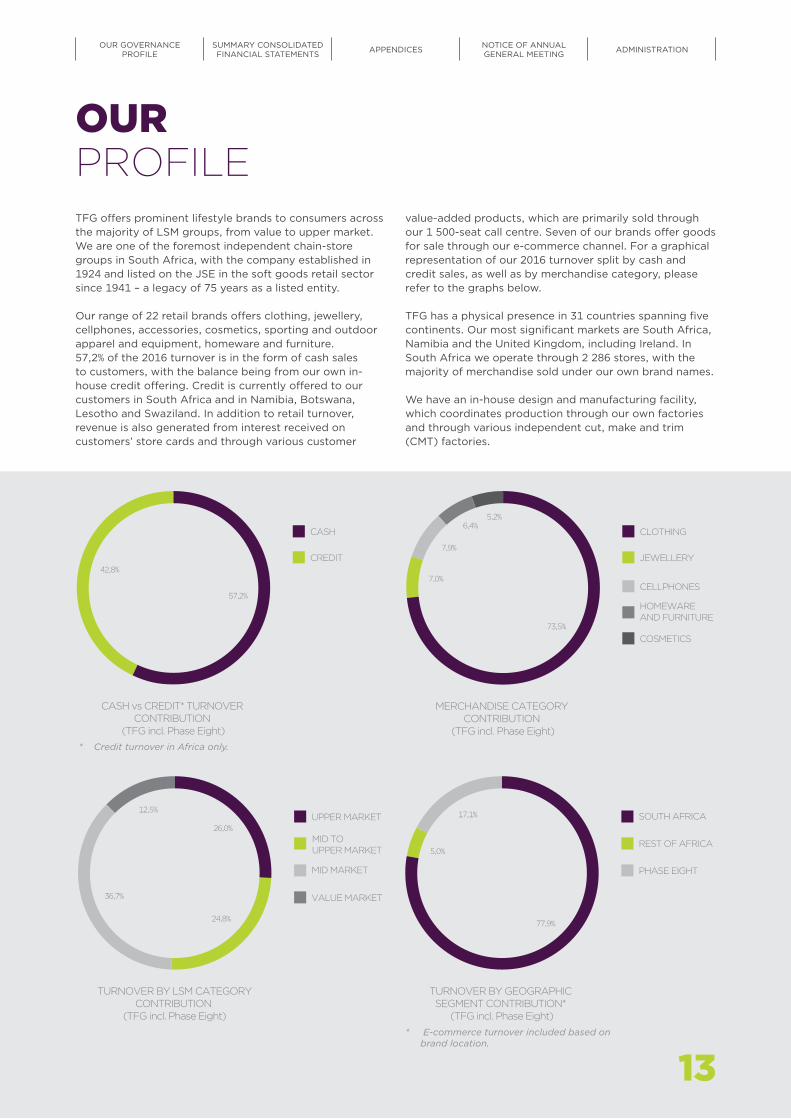
TFG offers prominent lifestyle brands to consumers across the majority of LSM groups, from value to upper market. We are one of the foremost independent chain-store groups in South Africa, with the company established in 1924 and listed on the JSE in the soft goods retail sector since 1941 – a legacy of 75 years as a listed entity.
Our range of 22 retail brands offers clothing, jewellery, cellphones, accessories, cosmetics, sporting and outdoor apparel and equipment, homeware and furniture. 57,2% of the 2016 turnover is in the form of cash sales to customers, with the balance being from our own in-house credit offering. Credit is currently offered to our customers in South Africa and in Namibia, Botswana, Lesotho and Swaziland. In addition to retail turnover, revenue is also generated from interest received on customers’ store cards and through various customer
CASH
CREDIT
CASH vs CREDIT* TURNOVER CONTRIBUTION
(TFG incl. Phase Eight)
42,8%
57,2%
MERCHANDISE CATEGORY CONTRIBUTION
(TFG incl. Phase Eight)
7,0%
7,9%
6,4%5,2%
73,5%
CLOTHING
CELLPHONES
JEWELLERY
HOMEWARE AND FURNITURE
COSMETICS
value-added products, which are primarily sold through our 1 500-seat call centre. Seven of our brands offer goods for sale through our e-commerce channel. For a graphical representation of our 2016 turnover split by cash and credit sales, as well as by merchandise category, please refer to the graphs below.
TFG has a physical presence in 31 countries spanning five continents. Our most significant markets are South Africa, Namibia and the United Kingdom, including Ireland. In South Africa we operate through 2 286 stores, with the majority of merchandise sold under our own brand names.
We have an in-house design and manufacturing facility, which coordinates production through our own factories and through various independent cut, make and trim (CMT) factories.
* Credit turnover in Africa only.
* E-commerce turnover included based on brand location.
TURNOVER BY GEOGRAPHIC SEGMENT CONTRIBUTION*
(TFG incl. Phase Eight)
5,0%
77,9%
17,1% SOUTH AFRICA
PHASE EIGHT
REST OF AFRICA
TURNOVER BY LSM CATEGORYCONTRIBUTION
(TFG incl. Phase Eight)
36,7%
12,5%
26,0%
24,8%
UPPER MARKET
MID MARKET
MID TO UPPER MARKET
VALUE MARKET
13
OURPROFILE
OUR GOVERNANCEPROFILE
SUMMARY CONSOLIDATED FINANCIAL STATEMENTS APPENDICES NOTICE OF ANNUAL
GENERAL MEETING ADMINISTRATION
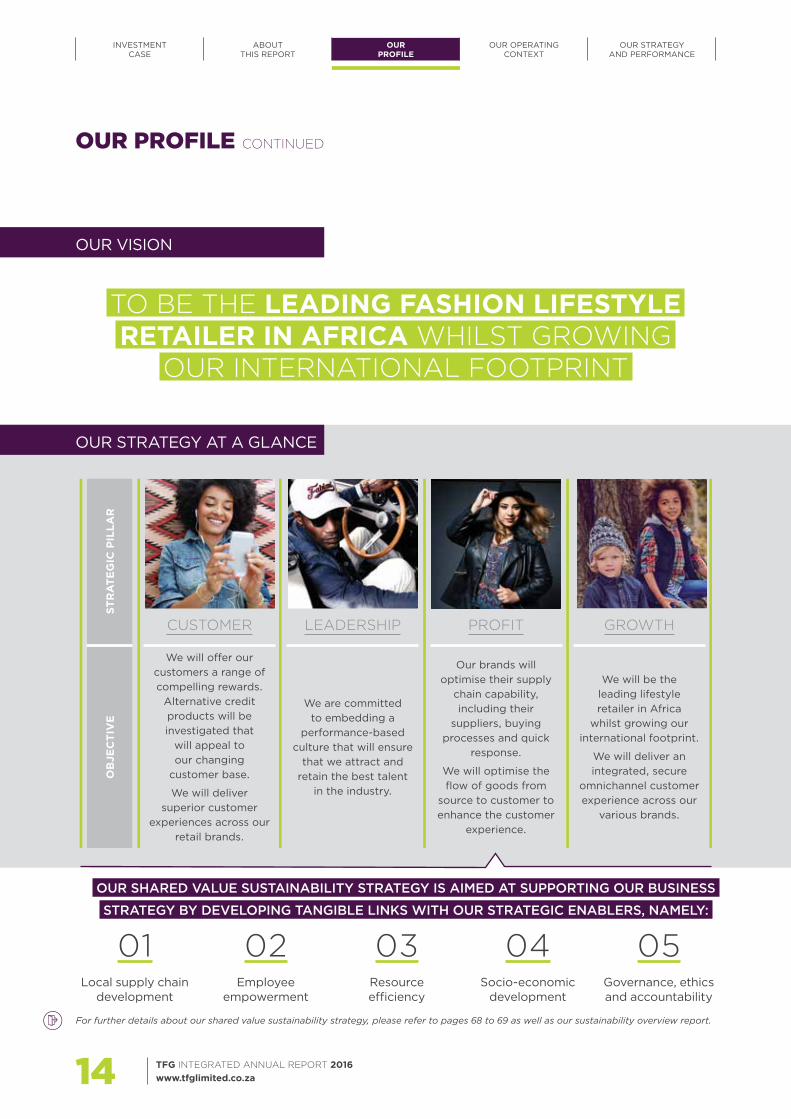
TO BE THE LEADING FASHION LIFESTYLE RETAILER IN AFRICA WHILST GROWING
OUR INTERNATIONAL FOOTPRINT
OUR VISION
OUR STRATEGY AT A GLANCE
OUR SHARED VALUE SUSTAINABILITY STRATEGY IS AIMED AT SUPPORTING OUR BUSINESS
STRATEGY BY DEVELOPING TANGIBLE LINKS WITH OUR STRATEGIC ENABLERS, NAMELY:
01Local supply chain
development
02Employee
empowerment
03Resource efficiency
04Socio-economic
development
05Governance, ethics and accountability
OUR PROFILE CONTINUED
For further details about our shared value sustainability strategy, please refer to pages 68 to 69 as well as our sustainability overview report.
STR
ATE
GIC
PIL
LAR
CUSTOMER LEADERSHIP PROFIT GROWTH
OB
JEC
TIV
E
We will offer our customers a range of compelling rewards.
Alternative credit products will be investigated that
will appeal to our changing
customer base.
We will deliver superior customer
experiences across our retail brands.
We are committed to embedding a
performance-based culture that will ensure
that we attract and retain the best talent
in the industry.
Our brands will optimise their supply
chain capability, including their
suppliers, buying processes and quick
response.
We will optimise the flow of goods from
source to customer to enhance the customer
experience.
We will be the leading lifestyle retailer in Africa
whilst growing our international footprint.
We will deliver an integrated, secure
omnichannel customer experience across our
various brands.
TFG INTEGRATED ANNUAL REPORT 2016 www.tfglimited.co.za14
INVESTMENT CASE
ABOUTTHIS REPORT
OUR PROFILE
OUR OPERATINGCONTEXT
OUR STRATEGY AND PERFORMANCE

15
OUR GOVERNANCEPROFILE
SUMMARY CONSOLIDATED FINANCIAL STATEMENTS APPENDICES NOTICE OF ANNUAL
GENERAL MEETING ADMINISTRATION

16 TFG INTEGRATED ANNUAL REPORT 2016 www.tfglimited.co.za
INVESTMENT CASE
ABOUTTHIS REPORT
OUR PROFILE
OUR OPERATINGCONTEXT
OUR STRATEGY AND PERFORMANCE
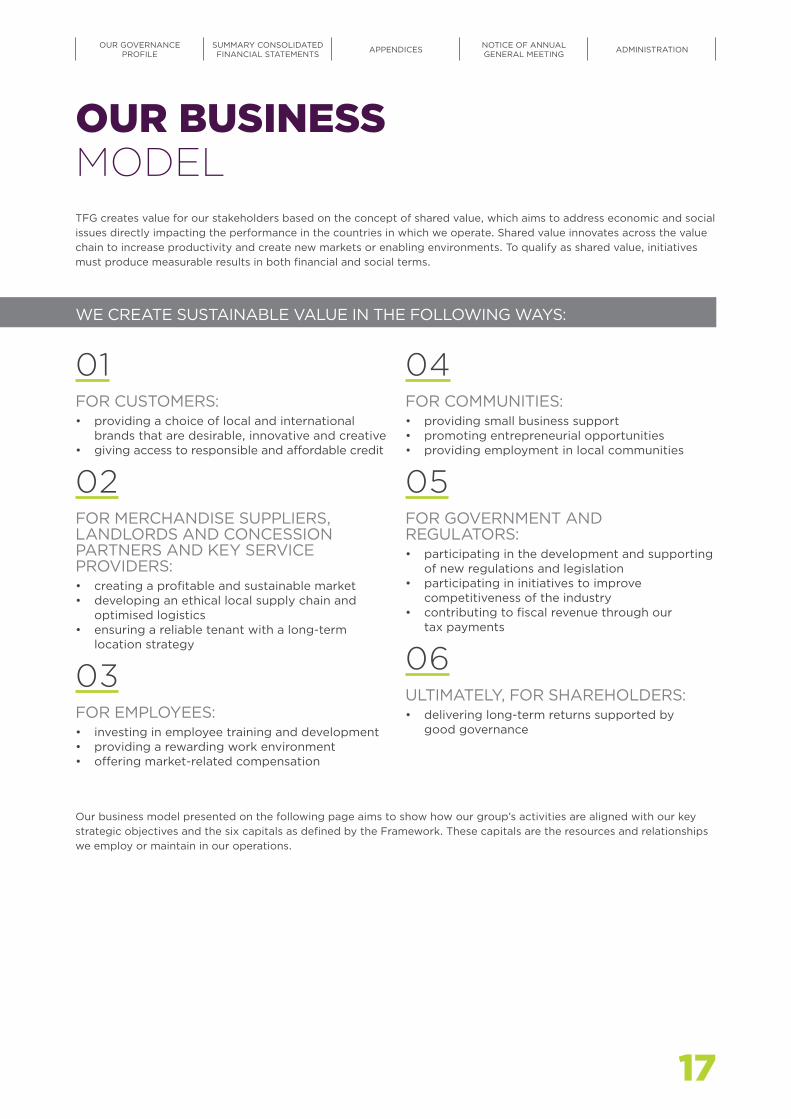
OUR BUSINESS MODELTFG creates value for our stakeholders based on the concept of shared value, which aims to address economic and social issues directly impacting the performance in the countries in which we operate. Shared value innovates across the value chain to increase productivity and create new markets or enabling environments. To qualify as shared value, initiatives must produce measurable results in both financial and social terms.
Our business model presented on the following page aims to show how our group’s activities are aligned with our key strategic objectives and the six capitals as defined by the Framework. These capitals are the resources and relationships we employ or maintain in our operations.
01FOR CUSTOMERS: • providing a choice of local and international
brands that are desirable, innovative and creative• giving access to responsible and affordable credit
02FOR MERCHANDISE SUPPLIERS, LANDLORDS AND CONCESSION PARTNERS AND KEY SERVICE PROVIDERS: • creating a profitable and sustainable market• developing an ethical local supply chain and
optimised logistics• ensuring a reliable tenant with a long-term
location strategy
03FOR EMPLOYEES:• investing in employee training and development• providing a rewarding work environment• offering market-related compensation
04FOR COMMUNITIES: • providing small business support• promoting entrepreneurial opportunities• providing employment in local communities
05FOR GOVERNMENT AND REGULATORS:• participating in the development and supporting
of new regulations and legislation• participating in initiatives to improve
competitiveness of the industry• contributing to fiscal revenue through our
tax payments
06ULTIMATELY, FOR SHAREHOLDERS:• delivering long-term returns supported by
good governance
WE CREATE SUSTAINABLE VALUE IN THE FOLLOWING WAYS:
17
OUR GOVERNANCEPROFILE
SUMMARY CONSOLIDATED FINANCIAL STATEMENTS APPENDICES NOTICE OF ANNUAL
GENERAL MEETING ADMINISTRATION
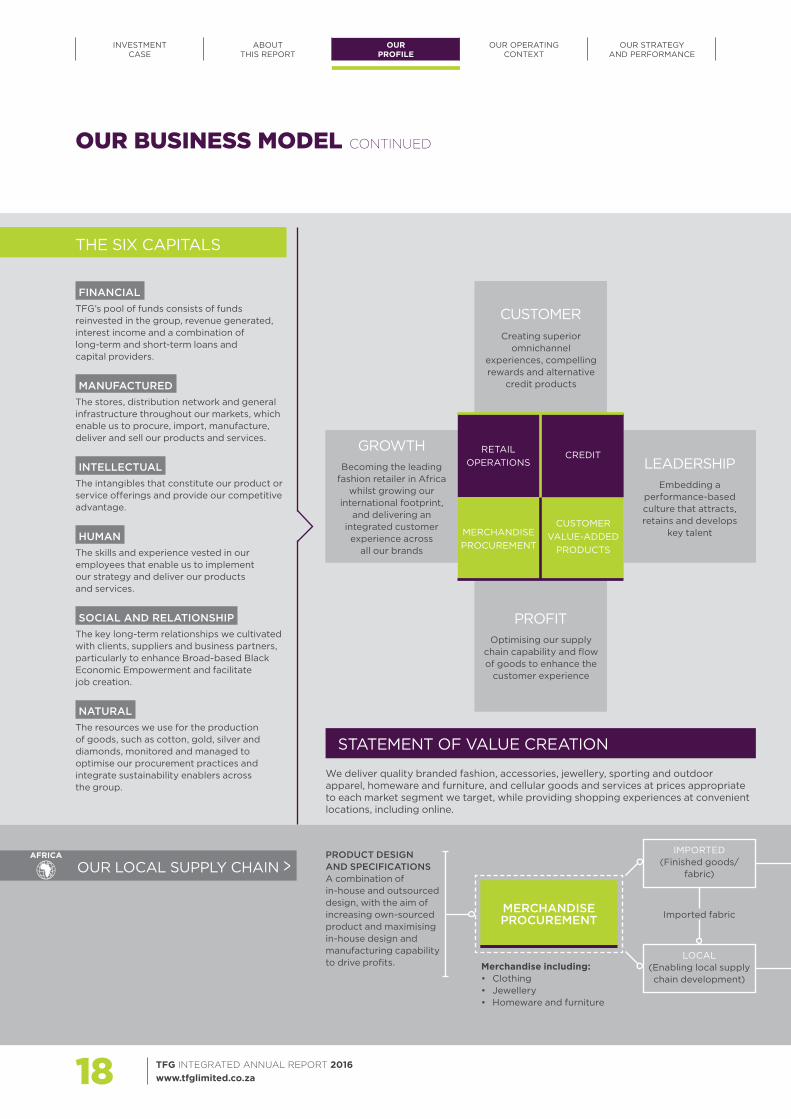
LEADERSHIPEmbedding a
performance-based culture that attracts, retains and develops
key talent
CUSTOMERCreating superior
omnichannel experiences, compelling rewards and alternative
credit products
GROWTHBecoming the leading
fashion retailer in Africa whilst growing our
international footprint, and delivering an
integrated customer experience across
all our brands
THE SIX CAPITALS
OUR LOCAL SUPPLY CHAIN >
FINANCIAL TFG’s pool of funds consists of funds reinvested in the group, revenue generated, interest income and a combination of long-term and short-term loans and capital providers.
MANUFACTURED The stores, distribution network and general infrastructure throughout our markets, which enable us to procure, import, manufacture, deliver and sell our products and services.
INTELLECTUAL The intangibles that constitute our product or service offerings and provide our competitive advantage.
HUMAN The skills and experience vested in our employees that enable us to implement our strategy and deliver our products and services.
SOCIAL AND RELATIONSHIP The key long-term relationships we cultivated with clients, suppliers and business partners, particularly to enhance Broad-based Black Economic Empowerment and facilitate job creation.
NATURAL The resources we use for the production of goods, such as cotton, gold, silver and diamonds, monitored and managed to optimise our procurement practices and integrate sustainability enablers across the group.
PRODUCT DESIGN AND SPECIFICATIONS A combination of in-house and outsourced design, with the aim of increasing own-sourced product and maximising in-house design and manufacturing capability to drive profits. Merchandise including:
• Clothing• Jewellery• Homeware and furniture
IMPORTED (Finished goods/
fabric)
LOCAL (Enabling local supply chain development)
MERCHANDISE PROCUREMENT Imported fabric
STATEMENT OF VALUE CREATION
We deliver quality branded fashion, accessories, jewellery, sporting and outdoor apparel, homeware and furniture, and cellular goods and services at prices appropriate to each market segment we target, while providing shopping experiences at convenient locations, including online.
PROFITOptimising our supply
chain capability and flow of goods to enhance the
customer experience
MERCHANDISE PROCUREMENT
CUSTOMER VALUE-ADDED
PRODUCTS
RETAIL OPERATIONS
CREDIT
TFG INTEGRATED ANNUAL REPORT 2016 www.tfglimited.co.za18
INVESTMENT CASE
ABOUTTHIS REPORT
OUR PROFILE
OUR OPERATINGCONTEXT
OUR STRATEGY AND PERFORMANCE
AFRICA
OUR BUSINESS MODEL CONTINUED

OUTPUTS OUTCOMES
CREATING VALUE FOR SHAREHOLDERS
As per our value-added statement (Appendix 6 to this report), R1,8 billion was reinvested in the group to finance future expansion and growth, with distributions to the value of R1,3 billion paid to shareholders.
LOCAL SUPPLY CHAIN DEVELOPMENT
By optimising our supply chain and boosting our in-house capacity, TFG is on track to reduce logistics and shipping costs and improve lead times. This will save time and money and leave us with more capacity to feed back into our business. This increases financial, manufactured, as well as social and relationship capital.
EMPLOYEE EMPOWERMENT Rewarding, training and incentivising our people ensures a skilled and motivated workforce dedicated to meeting customers’ needs. This increases human capital, generates revenue and contributes to a sustainable business. In 2016, R125 million was invested in training, with R3 210,8 million paid out as remuneration.
RESOURCE EFFICIENCY We safeguard the environment by integrating resource efficiency initiatives across the group. These efforts contribute to a decrease in natural capital and carbon emissions.
SOCIO-ECONOMIC DEVELOPMENT Through our in-house manufacturing, TFG created 191 jobs in South Africa, with further job creation at head office and store level. The TFG Foundation also donated goods to the value of R27,4 million to The Feel Good Store project and made donations of R7,0 million across 49 organisations. In this way communities benefit from job creation and income flow, contributing to public good and earning us the trust of the communities in which we operate.
GOVERNANCE We have a whistle-blowing facility supported by TFG’s anti-corruption policy, which encourages transparency, ethics and accountability among our leaders and employees. In 2016, we received 141 reports through our whistle-blowing facility.
INCREASED, DECREASED OR
TRANSFORMED CAPITALS
FINISHED GOODSDISTRIBUTION CENTRES (DC) (TFG Logistics)
IN-HOUSE MANUFACTURING (Key differentiator
that supports quick-response capability
to boost profit)
THE SOUTH AFRICAN
DCs DISTRIBUTED
60,5 MILLION UNITS
DURING THE YEAR
RETAIL OPERATIONS INCLUDE:• Sales (online and in-store)• Financial services/credit• Brand identity• Store design and roll-out• Promotions/rewards• In-store marketing
RETAIL STORES
Branded clothing, homeware and furniture, jewellery, cosmetics and cellphones
Branded outlets for our 22 retail brands
Services include credit, insurance, publishing, mobile airtime and a Rewards programme
Waste includes excess raw materials, rejects and customer returns, which are repurposed via The Feel Good Stores
PRODUCTS, SERVICES,
BY-PRODUCTS AND WASTE
OUTPUTS
19
OUR GOVERNANCEPROFILE
SUMMARY CONSOLIDATED FINANCIAL STATEMENTS APPENDICES NOTICE OF ANNUAL
GENERAL MEETING ADMINISTRATION

13
12
USA
175 Limpopo
Mpumalanga
KwaZulu-Natal
Eastern Cape
North West
Northern Cape
Free State
Western Cape
Gauteng
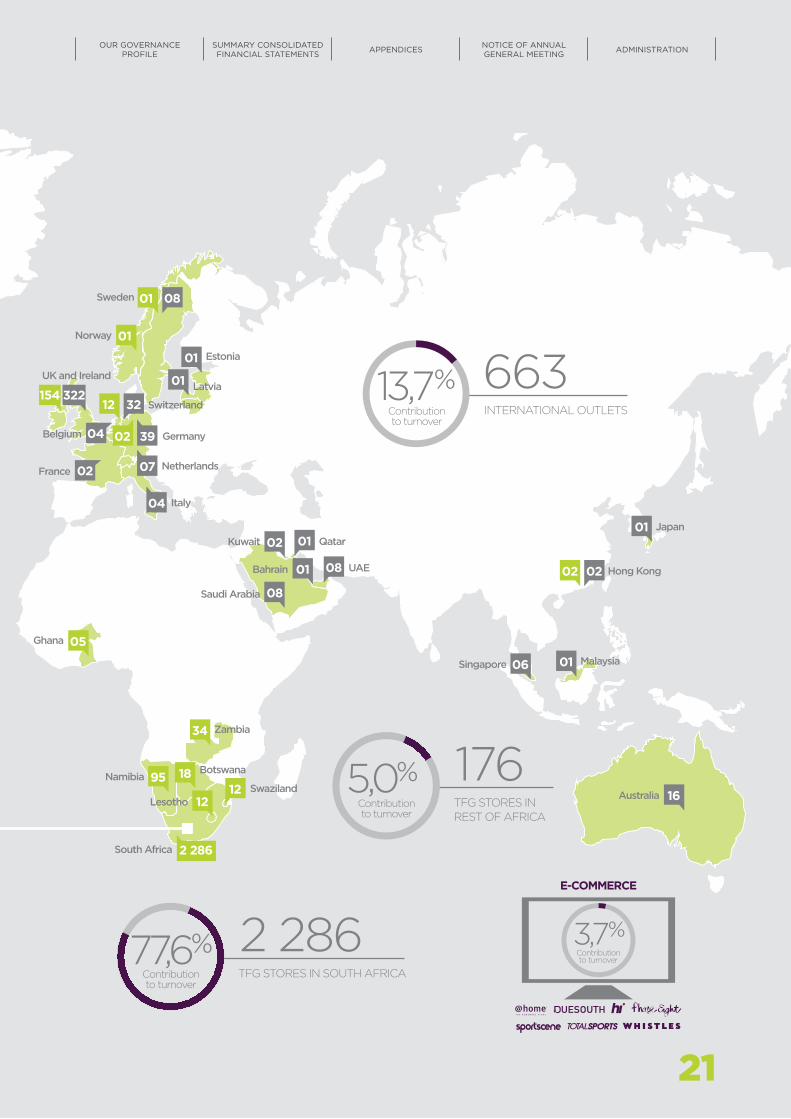
OUR FOOTPRINT
TFG TRADES THROUGH 3 125 OUTLETS IN 31 COUNTRIES,WITH A PORTFOLIO OF 22 FASHION LIFESTYLE BRANDS
172
267674
149
149
96
398206
TFG’s number of stores
TFG’s number of concessions
TFG’s footprint
Ghana
Mexico
TFG INTEGRATED ANNUAL REPORT 2016 www.tfglimited.co.za20
INVESTMENT CASE
ABOUTTHIS REPORT
OUR PROFILE
OUR OPERATINGCONTEXT
OUR STRATEGY AND PERFORMANCE
95
05
08
02
39
07
04
02
01
01322
04
02
01
12
02
01 08
32
02
154
01
08
06 01
16
01
01
18
34
12
2 286
12
663INTERNATIONAL OUTLETS
176TFG STORES INREST OF AFRICA
Contribution to turnover
5,0%
Qatar
Swaziland
South Africa
Lesotho
Hong Kong
Japan
Malaysia
UAEBahrain
Netherlands
Germany
Italy
Latvia
Estonia
Norway
UK and Ireland
Sweden
Switzerland
Kuwait
Saudi Arabia
Ghana
NamibiaBotswana
Australia
Singapore
2 286TFG STORES IN SOUTH AFRICAContribution
to turnover
77,6%
Belgium
France
Zambia
E-COMMERCE
Contribution to turnover
3,7%
13,7%Contribution to turnover
21
OUR GOVERNANCEPROFILE
SUMMARY CONSOLIDATED FINANCIAL STATEMENTS APPENDICES NOTICE OF ANNUAL
GENERAL MEETING ADMINISTRATION

OUR STRUCTURE
DIRECTORATETHE FOSCHINI GROUP LIMITED
(“supervisory board” or “board”)
CHIEF EXECUTIVE OFFICER
OPERATING BOARDTFG
CENTRALISED FUNCTIONS
THE RETAIL TRADING BRANDS ARE SUPPORTED BY A NUMBER OF CENTRALISED SERVICE FUNCTIONS
EMPLOYEES FACILITIES
TFG Human Resources TFG Services
ACCOUNTING AND
GOVERNANCE
SUPPLY CHAIN
SYSTEMS
TFG Finance & Advisory
TFG Internal Audit
Prestige Clothing
TFG Design
TFG Logistics
TFG Merchandise Procurement
TFG Infotec
MARKETING EXPANSION
TFG Marketing
E-commerce
TFG Africa
TFG Property
CREDITCUSTOMER
VALUE-ADDED PRODUCTS
FINANCIAL SERVICES
PROVIDE GROUP-WIDE CREDIT-RELATED PRODUCTS
AND SERVICES TO CUSTOMERS IN SOUTHERN AFRICA
INTERNATIONAL OPERATIONS
LOCAL MANAGEMENT STRUCTURE WITH THEIR OWN, INDEPENDENT,
CENTRALISED SUPPORT FUNCTIONS
TFG INTEGRATED ANNUAL REPORT 2016 www.tfglimited.co.za22
INVESTMENT CASE
ABOUTTHIS REPORT
OUR PROFILE
OUR OPERATINGCONTEXT
OUR STRATEGY AND PERFORMANCE
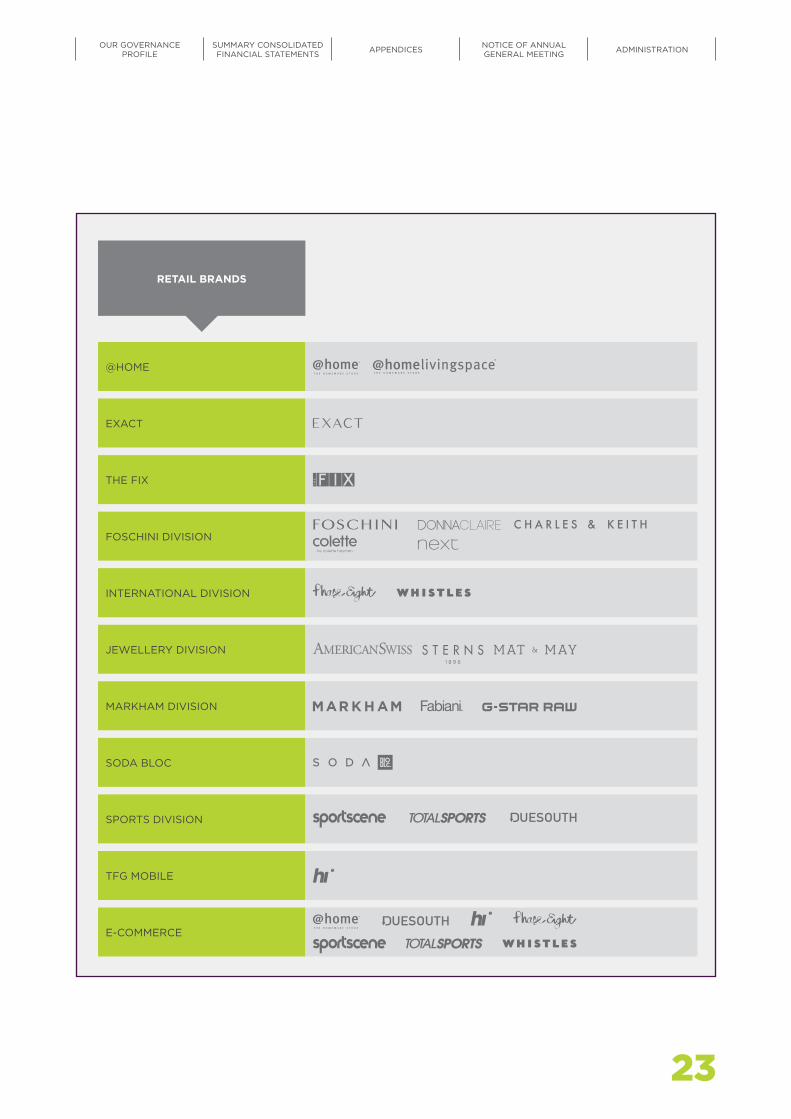
RETAIL BRANDS
@HOME
EXACT
THE FIX
FOSCHINI DIVISION
INTERNATIONAL DIVISION
JEWELLERY DIVISION
MARKHAM DIVISION
SODA BLOC
SPORTS DIVISION
TFG MOBILE
E-COMMERCE
23
OUR GOVERNANCEPROFILE
SUMMARY CONSOLIDATED FINANCIAL STATEMENTS APPENDICES NOTICE OF ANNUAL
GENERAL MEETING ADMINISTRATION

OURBRANDSThe majority of our 22 brands are own brands and it remains our intention to continually expand this range by strategic acquisitions and by developing new brands in-house. In 2016, we acquired Whistles and the franchise rights to Colette and Next, rebranded Fashion Express as The FIX and launched SODA Bloc.
OUR BRANDS OFFER FASHIONABILITY FROM RELATIVELY LOW-RISK TO HIGHER-RISK FASHION, AND APPEAL TO A BROAD CUSTOMER BASE ACROSS A RANGE OF LSM GROUPS:
* AMHI: Average monthly household income. Source: AMPS Individual Databases (2014B, 2015B).
UPPER MARKETLSM 9–10+
MID MARKETLSM 7–8
15,9% OF POPULATION | AMHI* OF R26,3K – R39K
22,2% OF POPULATION | AMHI* OF R13,3K – R19,4K
VALUE MARKETLSM 5–6
39,5% OF POPULATION | AMHI* OF R5,6K – R7,9K
TFG INTEGRATED ANNUAL REPORT 2016 www.tfglimited.co.za24
INVESTMENT CASE
ABOUTTHIS REPORT
OUR PROFILE
OUR OPERATINGCONTEXT
OUR STRATEGY AND PERFORMANCE
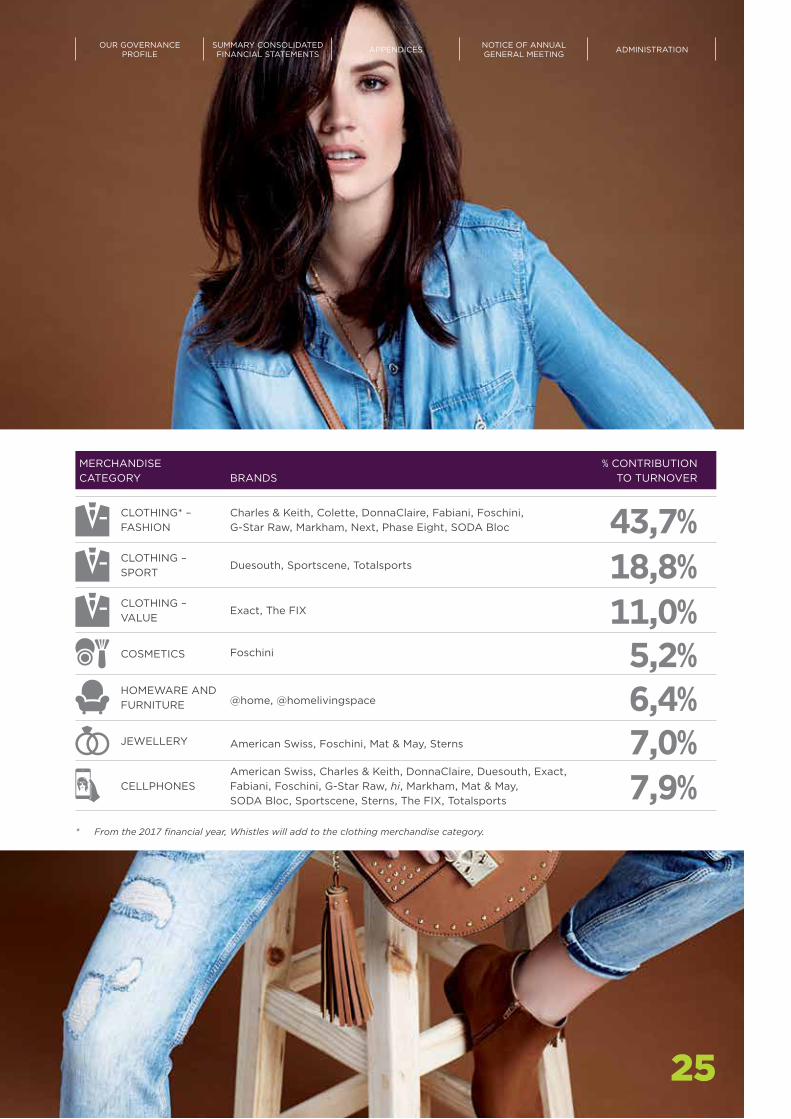
MERCHANDISE CATEGORY BRANDS
% CONTRIBUTION TO TURNOVER
CLOTHING* – FASHION
Charles & Keith, Colette, DonnaClaire, Fabiani, Foschini, G-Star Raw, Markham, Next, Phase Eight, SODA Bloc 43,7%
CLOTHING – SPORT
Duesouth, Sportscene, Totalsports 18,8%CLOTHING – VALUE
Exact, The FIX 11,0%COSMETICS Foschini 5,2%HOMEWARE AND FURNITURE @home, @homelivingspace 6,4%JEWELLERY American Swiss, Foschini, Mat & May, Sterns 7,0%CELLPHONES
American Swiss, Charles & Keith, DonnaClaire, Duesouth, Exact, Fabiani, Foschini, G-Star Raw, hi, Markham, Mat & May, SODA Bloc, Sportscene, Sterns, The FIX, Totalsports 7,9%
* From the 2017 financial year, Whistles will add to the clothing merchandise category.
25
OUR GOVERNANCEPROFILE
SUMMARY CONSOLIDATED FINANCIAL STATEMENTS APPENDICES NOTICE OF ANNUAL
GENERAL MEETING ADMINISTRATION
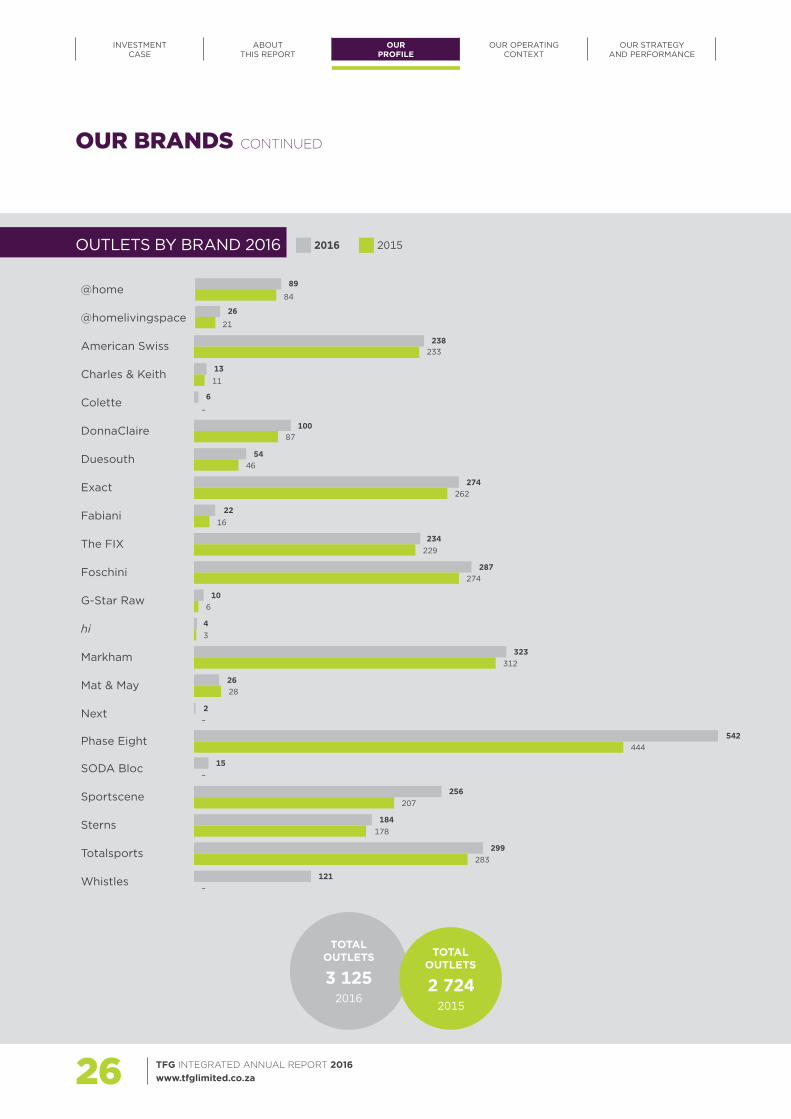
OUTLETS BY BRAND 2016
3 1252016
TOTAL OUTLETS
2 7242015
TOTAL OUTLETS
2016 2015
@home 89
84
@homelivingspace26
21
American Swiss 238233
Charles & Keith 1311
Colette 6
–
DonnaClaire 10087
Duesouth 5446
Exact 274262
Fabiani 2216
The FIX 234229
Foschini 287274
G-Star Raw 106
hi 43
Markham 323312
Mat & May 2628
Next 2–
Phase Eight 542444
SODA Bloc 15–
Sportscene 256207
Sterns 184178
Totalsports 299283
Whistles 121–
OUR BRANDS CONTINUED
TFG INTEGRATED ANNUAL REPORT 2016 www.tfglimited.co.za26
INVESTMENT CASE
ABOUTTHIS REPORT
OUR PROFILE
OUR OPERATINGCONTEXT
OUR STRATEGY AND PERFORMANCE
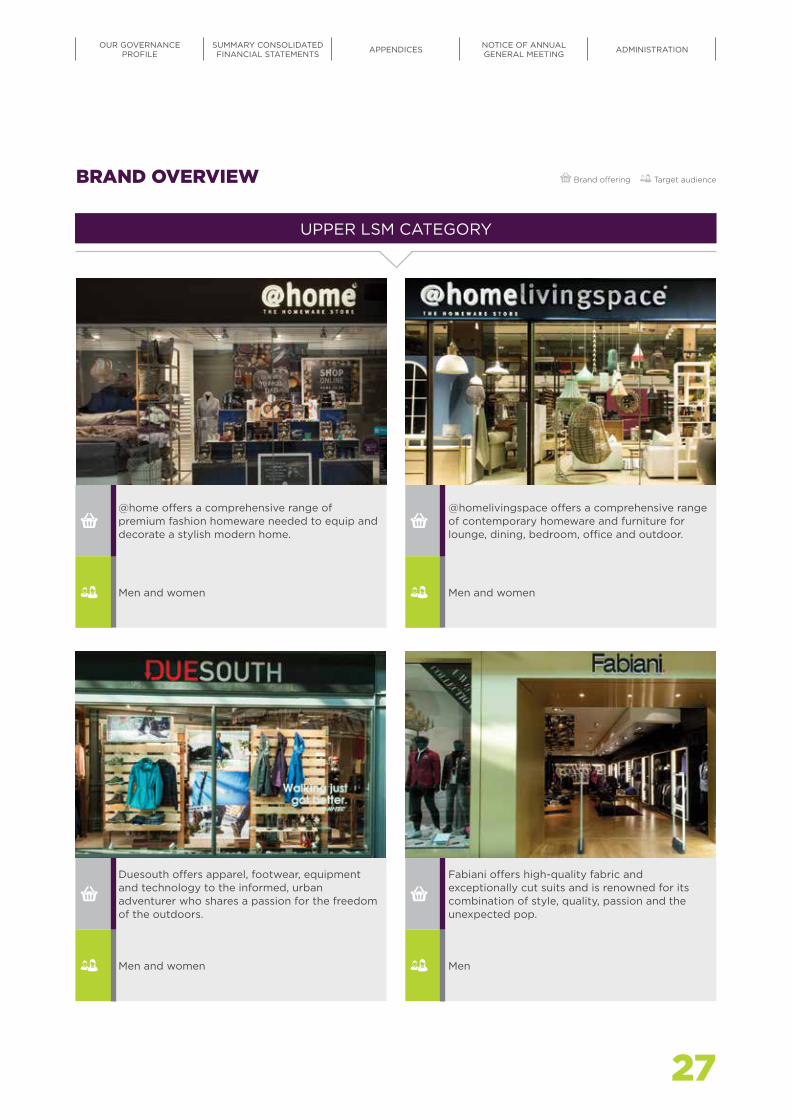
@home offers a comprehensive range of premium fashion homeware needed to equip and decorate a stylish modern home.
Men and women
Duesouth offers apparel, footwear, equipment and technology to the informed, urban adventurer who shares a passion for the freedom of the outdoors.
Men and women
@homelivingspace offers a comprehensive range of contemporary homeware and furniture for lounge, dining, bedroom, office and outdoor.
Men and women
Fabiani offers high-quality fabric and exceptionally cut suits and is renowned for its combination of style, quality, passion and the unexpected pop.
Men
BRAND OVERVIEW
UPPER LSM CATEGORY
Brand offering Target audience
27
OUR GOVERNANCEPROFILE
SUMMARY CONSOLIDATED FINANCIAL STATEMENTS APPENDICES NOTICE OF ANNUAL
GENERAL MEETING ADMINISTRATION
TFG INTEGRATED ANNUAL REPORT 2016 www.tfglimited.co.za28
UPPER LSM CATEGORY
BRAND OVERVIEW CONTINUED
OUR BRANDS CONTINUED
Brand offering Target audience
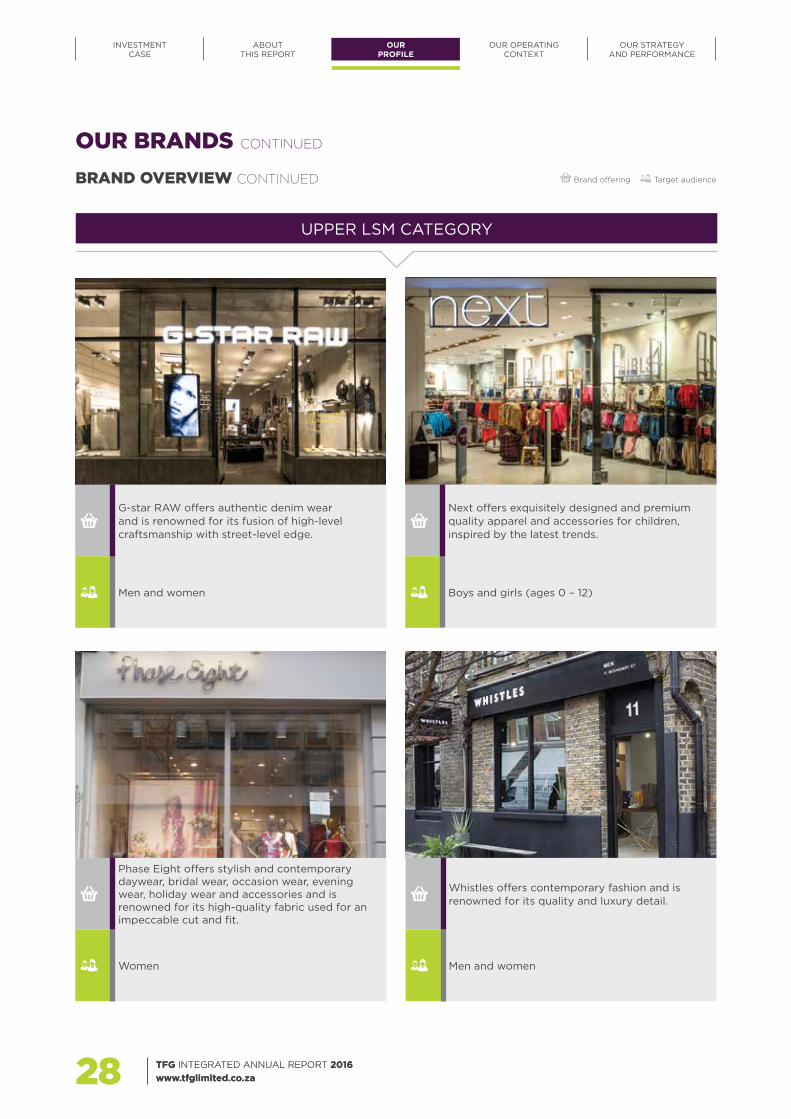
G-star RAW offers authentic denim wear and is renowned for its fusion of high-level craftsmanship with street-level edge.
Men and women
Phase Eight offers stylish and contemporary daywear, bridal wear, occasion wear, evening wear, holiday wear and accessories and is renowned for its high-quality fabric used for an impeccable cut and fit.
Women
Next offers exquisitely designed and premium quality apparel and accessories for children, inspired by the latest trends.
Boys and girls (ages 0 – 12)
Whistles offers contemporary fashion and is renowned for its quality and luxury detail.
Men and women
TFG INTEGRATED ANNUAL REPORT 2016 www.tfglimited.co.za28
INVESTMENT CASE
ABOUTTHIS REPORT
OUR PROFILE
OUR OPERATINGCONTEXT
OUR STRATEGY AND PERFORMANCE
29
MID TO UPPER LSM CATEGORY
Brand offering Target audience
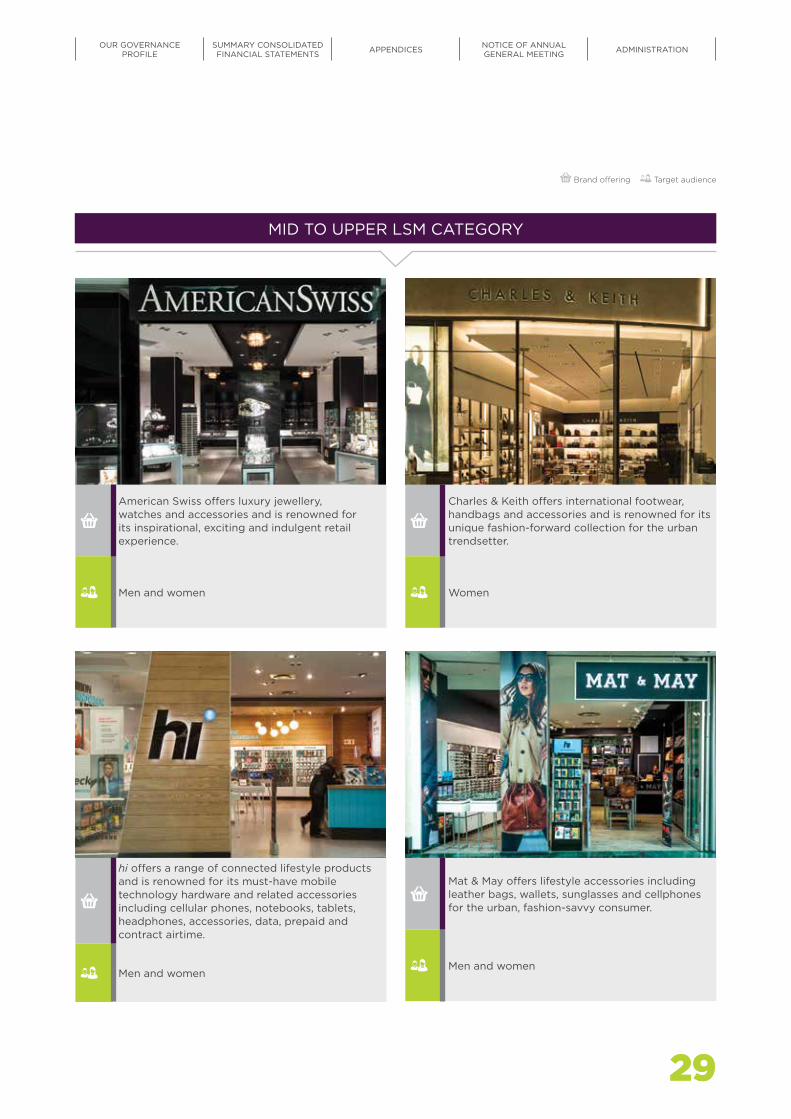
American Swiss offers luxury jewellery, watches and accessories and is renowned for its inspirational, exciting and indulgent retail experience.
Men and women
hi offers a range of connected lifestyle products and is renowned for its must-have mobile technology hardware and related accessories including cellular phones, notebooks, tablets, headphones, accessories, data, prepaid and contract airtime.
Men and women
Charles & Keith offers international footwear, handbags and accessories and is renowned for its unique fashion-forward collection for the urban trendsetter.
Women
Mat & May offers lifestyle accessories including leather bags, wallets, sunglasses and cellphones for the urban, fashion-savvy consumer.
Men and women
29
OUR GOVERNANCEPROFILE
SUMMARY CONSOLIDATED FINANCIAL STATEMENTS APPENDICES NOTICE OF ANNUAL
GENERAL MEETING ADMINISTRATION
MID TO UPPER LSM CATEGORY
BRAND OVERVIEW CONTINUED
OUR BRANDS CONTINUED
Brand offering Target audience
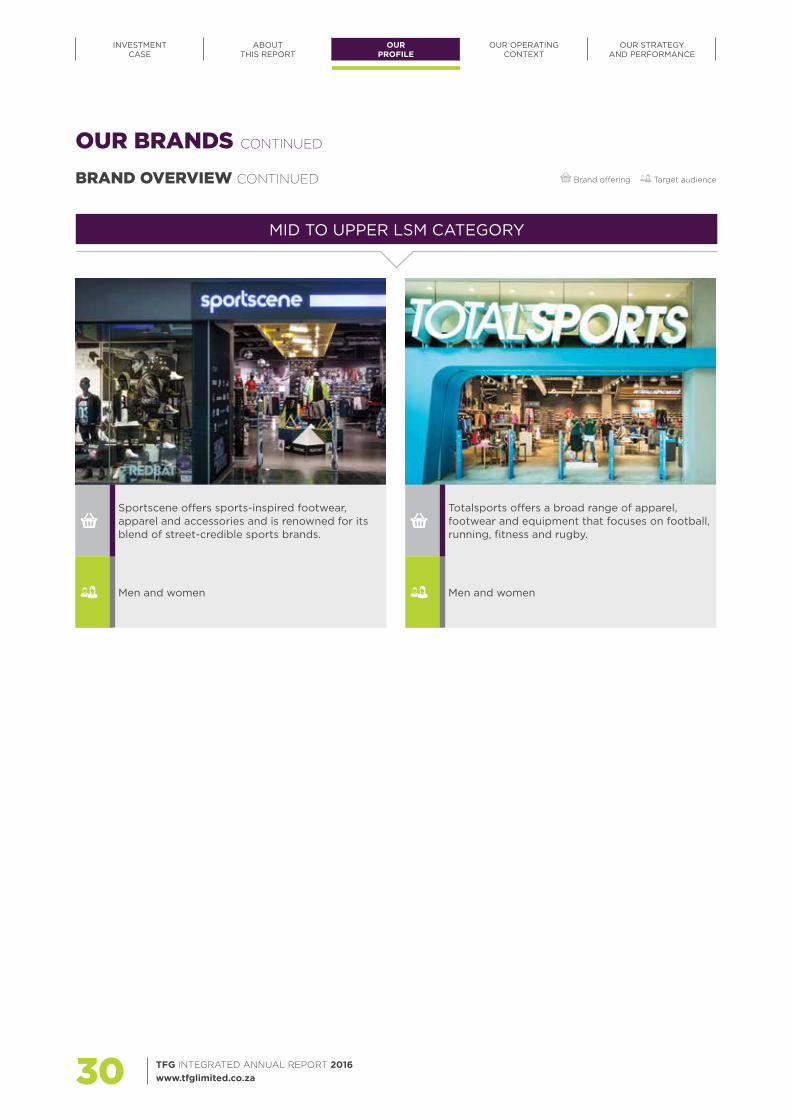
Sportscene offers sports-inspired footwear, apparel and accessories and is renowned for its blend of street-credible sports brands.
Men and women
Totalsports offers a broad range of apparel, footwear and equipment that focuses on football, running, fitness and rugby.
Men and women
TFG INTEGRATED ANNUAL REPORT 2016 www.tfglimited.co.za30
INVESTMENT CASE
ABOUTTHIS REPORT
OUR PROFILE
OUR OPERATINGCONTEXT
OUR STRATEGY AND PERFORMANCE
MID MARKET LSM CATEGORY
Brand offering Target audience
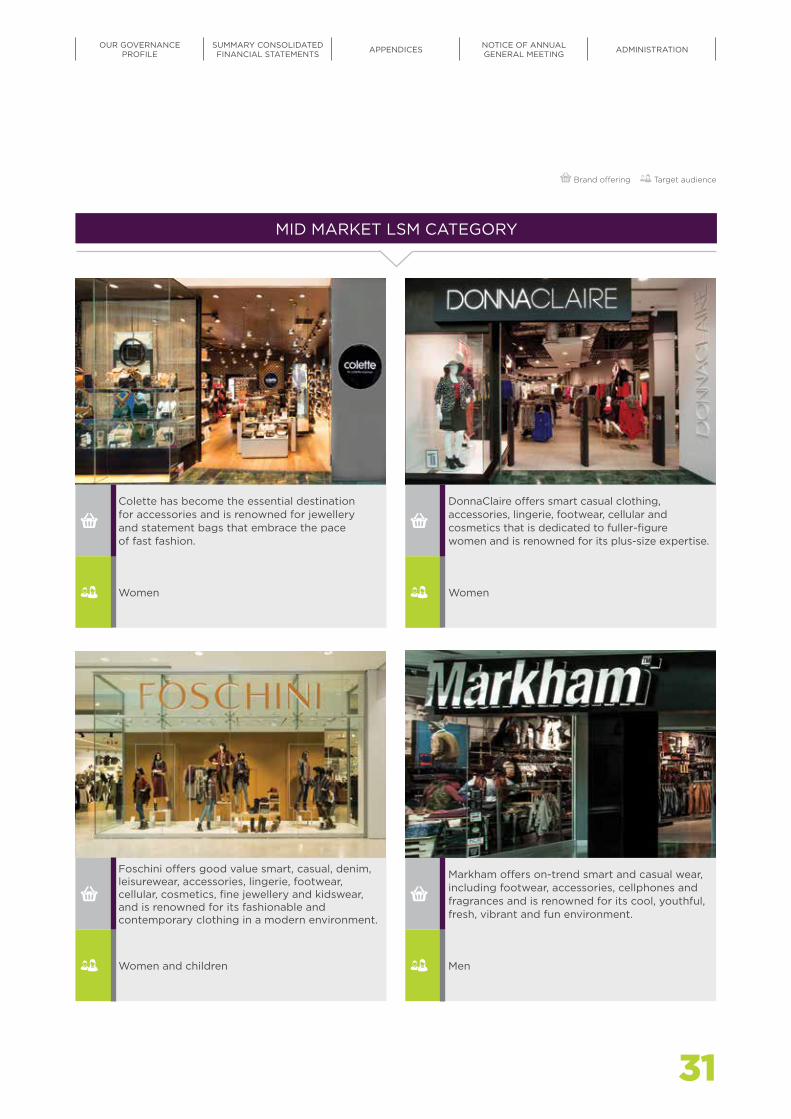
Colette has become the essential destination for accessories and is renowned for jewellery and statement bags that embrace the pace of fast fashion.
Women
Foschini offers good value smart, casual, denim, leisurewear, accessories, lingerie, footwear, cellular, cosmetics, fine jewellery and kidswear, and is renowned for its fashionable and contemporary clothing in a modern environment.
Women and children
DonnaClaire offers smart casual clothing, accessories, lingerie, footwear, cellular and cosmetics that is dedicated to fuller-figure women and is renowned for its plus-size expertise.
Women
Markham offers on-trend smart and casual wear, including footwear, accessories, cellphones and fragrances and is renowned for its cool, youthful, fresh, vibrant and fun environment.
Men
31
OUR GOVERNANCEPROFILE
SUMMARY CONSOLIDATED FINANCIAL STATEMENTS APPENDICES NOTICE OF ANNUAL
GENERAL MEETING ADMINISTRATION
MID MARKET LSM CATEGORY
BRAND OVERVIEW CONTINUED
OUR BRANDS CONTINUED
Brand offering Target audience
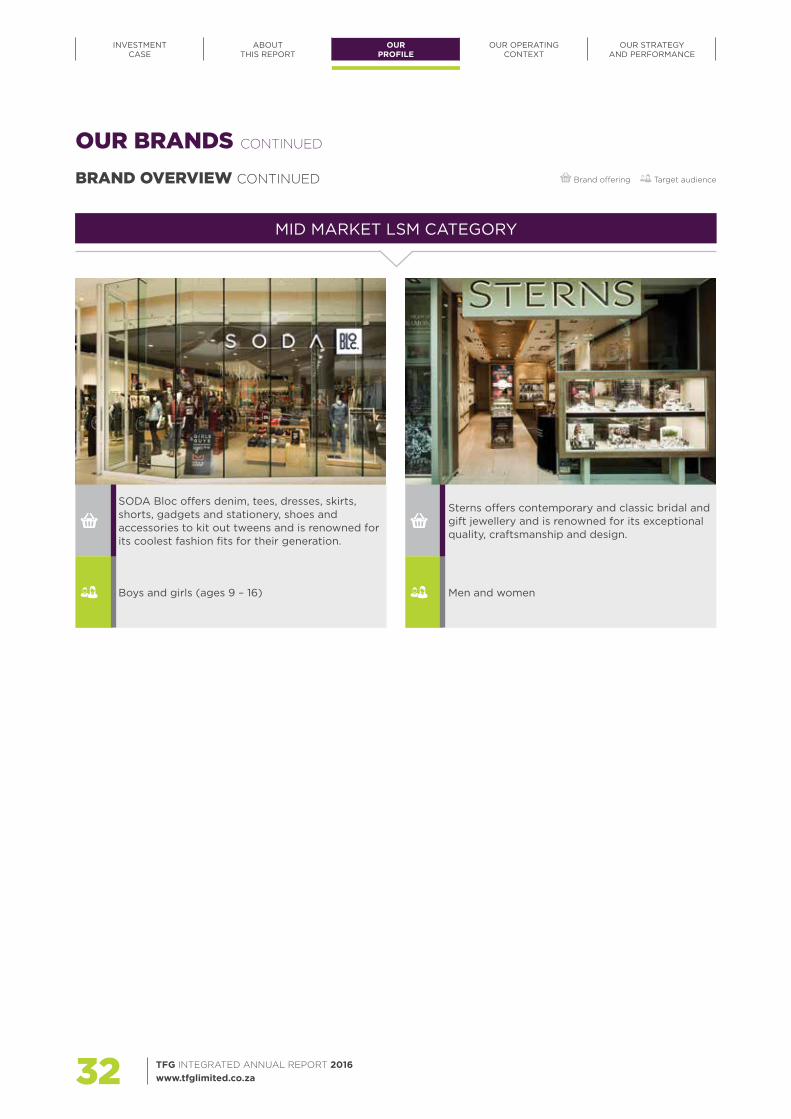
SODA Bloc offers denim, tees, dresses, skirts, shorts, gadgets and stationery, shoes and accessories to kit out tweens and is renowned for its coolest fashion fits for their generation.
Boys and girls (ages 9 – 16)
Sterns offers contemporary and classic bridal and gift jewellery and is renowned for its exceptional quality, craftsmanship and design.
Men and women
TFG INTEGRATED ANNUAL REPORT 2016 www.tfglimited.co.za32
INVESTMENT CASE
ABOUTTHIS REPORT
OUR PROFILE
OUR OPERATINGCONTEXT
OUR STRATEGY AND PERFORMANCE

VALUE LSM CATEGORY
Brand offering Target audience
Exact offers great value everyday essentials and is renowned for its trend-appropriate range of quality, well-priced contemporary fashion for the whole family.
Men, women and children
The FIX offers on-trend fashion, footwear and accessories and is renowned for its hot products at great prices.
Women
33
OUR GOVERNANCEPROFILE
SUMMARY CONSOLIDATED FINANCIAL STATEMENTS APPENDICES NOTICE OF ANNUAL
GENERAL MEETING ADMINISTRATION

OUR OPERATING CONTEXT
Our operating context 36
Our stakeholders 40
Our material matters 41
TFG INTEGRATED ANNUAL REPORT 2016 www.tfglimited.co.za34

35

OUR OPERATINGCONTEXTSOUTH AFRICAN CONTEXTGDP growth in the local market remains lacklustre and business confidence is at a five-year low. The upward interest rate cycle is gaining momentum, having increased by 200 bps over the past two years. In addition, unemployment and political uncertainty remain a concern.
According to the Bureau of Economic Research (BER), inflation is expected to average 6,6% in 2016 and 6,4% in 2017, while GDP is expected to slow even more in the next 12 months. Risks to inflation remain high, including rising food prices, potentially rising oil prices and continued exchange rate volatility. Underlying market conditions therefore remain unsupportive of any meaningful acceleration in consumer spending, and rising interest rates put pressure on credit consumers.
South Africa’s fiscal policy is tightening, but short-term expectations continue to be challenging, with growth forecast generally being downgraded.
Sustainability continue to receive focus and according to a recent PWC article, Make it your business: Engaging with the Sustainable Development Goals (A South African perspective – March 2016), businesses in South Africa are currently prioritising the following sustainable development goals:
• Inclusive and sustainable economic growth• Inclusive and equitable quality education and the
promotion of lifelong learning opportunities for all• Sustainable consumption and production patterns• Resilient infrastructure, inclusive and sustainable
industrialisation and innovation• Urgent action to combat climate change and
its impact
Clothing retailIn the South African retail sector, profitability remains under pressure due to sharp increases in purchase prices, which are being driven upward as a result of a weak and volatile Rand. Accelerated consumer price inflation is forecasted for the 2017 financial year. This places further emphasis on the need to drive local production and to continue to optimise supply chain and sourcing arrangements.
Growth in real consumer spending improved slightly after the mining strikes in 2015, but remains slow. Most retailers are reporting lower volumes, which is expected to continue and worsen as consumers experience subdued growth in disposable income. Low levels of consumer confidence will also dampen overall spending.
The semi-durable sector is particularly sensitive to interest rate hikes, credit growth and consumer confidence levels.
CreditThe pressure on credit customers from the upward interest rate cycle, together with the negative impact of the Affordability Regulations on new accounts, limit the ability of credit retailers to achieve meaningful growth in credit turnover.
Risks and opportunities Clothing retail and creditWhile current consumer debt levels inhibit credit sales, our Rewards programme is aimed at stimulating both cash and credit sales, with the latter improving card usage. In addition, our online strategy and focus on local production continue to benefit customers. As part of ongoing bad debt management, an internal review of available credit products was undertaken to ensure we attract accounts that are less vulnerable to debt. Credit applications are reviewed for fraud indicators and assessed against NCA-compliant scorecards, credit bureau scores and employment details.
EMERGING MARKET CONTEXTAt a macroeconomic level, Africa offers significant opportunities for economic growth and for retailers due to its large and relatively young population, continuing rapid urbanisation, and its wealth of natural resources.
However, optimism about the growth potential of sub-Saharan Africa’s consumer market is tempered by a combination of economic and political risk. Growth decelerated to roughly 3% in 2015, down from 4,5% in 2014. It is expected to hover around 3% in 2016. Currency depreciations raise the cost of imported goods, and difficulty in sourcing products due to small, local manufacturing sectors challenges the growth of retail markets. This is coupled with underdeveloped and poor connective infrastructure. Corruption, an often opaque regulatory landscape and the threat of government upheaval are further sources of political headwinds, with many countries carrying moderate to high political risk ratings.
Growing urban centres and a rising middle class do not necessarily translate into higher levels of economic growth and consumer spending. The vast majority of people are still exposed to poverty with high levels of unemployment. In most countries the focus will be on the fast-moving consumer goods (FMCG) segment, as most people are not able to afford durable or luxury goods.
TFG INTEGRATED ANNUAL REPORT 2016 www.tfglimited.co.za36
INVESTMENT CASE
ABOUTTHIS REPORT
OUR PROFILE
OUR OPERATINGCONTEXT
OUR STRATEGY AND PERFORMANCE

Risks and opportunitiesCareful consideration of the correct geographical location strategy in Africa and other emerging market territories is essential. We have demonstrated our ability to tailor the group’s risk management appetite to specific business activities and contexts. Our group operates in six African countries outside of South Africa, including Ghana and Zambia. These countries generally have well-established shopping cultures, a substantial middle class and developed infrastructure, and provide us with a solid foundation to expand into other countries at different stages of development. From countries with relative political and economic stability, the group can manage the scale of its expansion along Africa’s development curve in line with our risk appetite. Leveraging key partnerships and the ability to utilise the appropriate business model ensure that compliance risk is reduced.
DEVELOPED MARKET CONTEXT The outlook for growth in developed and advanced economies remains modest and uneven. Risks to global growth relate to the outcome of the British referendum and the slowdown in China, followed by geopolitical instability and debt defaults.
In the EU, the immigration crisis and the concomitant rise of right-wing populist parties create financial uncertainty, exacerbated by negative interest rates. The US is similarly challenged by politics and simmering conflict in the Middle East. Developed market growth slowed sharply at the end of 2015 as Japan contracted and the US and Europe gained only 1%. Since then, global manufacturing has been struggling, while inventories are building. At the same time, developed market household spending has slowed to its lowest level in three years as financial and geopolitical uncertainties counter the benefits of the energy price windfall.
Analysts believe that critical success factors for retailers in developed markets include improving existing supply chain, incorporating digital technology into the physical store experience and identifying innovative ways to leverage existing real estate.
Risks and opportunitiesOur expanding footprint into developed markets through the acquisition of well-established brands such as Phase Eight and Whistles provides opportunities for growth through diversification, while their unique business models facilitate further expansion. Key concession partnerships further support the expansion strategy. At the same time, the group is subject to the risk of customers, in most markets, being under pressure and the group potentially not being able to meet the demand for
their desired merchandise at the right price and the right time. We thus continue to focus on stimulating demand through creative communication campaigns, data analysis, modelling techniques and appropriate systems and processes.
In addition, our strategic focus on creating integrated, secure omnichannel experiences will enable us to meet customers’ expectations in developed markets.
GOVERNANCEAccording to the Corporate Governance Network in its article, Governance issues for boards to consider in 2016, the following themes are particularly relevant in the governance landscape:
• Cybersecurity: An increase in the number, cost and sophistication of attacks on business operations, which requires an understanding of data protection, storage and sharing requirements.
• Emerging technologies: Technological and digital developments are impacting the customer experience and the method of delivering products and services. This demands changing business processes, which brings complexity and new risks.
• Shareholder activism: Shareholders are increasingly influencing and impacting businesses through their compliance and communication demands.
• Corporate and integrated reporting: By issuing an integrated report, a company increases the trust and confidence of its stakeholders and the legitimacy of its operations. The use of and need for integrated reporting is growing fundamentally.
• Compensation: There is a growing demand for increasing disclosure on remuneration.
• Value creation and strategy: Successful strategy must be engaged, focused, results-oriented and disciplined with appropriate committee structures to support it.
• Risk oversight: A balanced risk approach is necessary to enable businesses to progress, develop and grow. The board’s risk appetite is critical.
• Crisis management: Strategic planning should ensure that crisis scenarios be anticipated or pre-empted, with the necessary assurance that the business has a robust response.
• Overlegislated and overregulated landscape: Legal compliance requirements are increasing and demand a strategic understanding to be able to integrate into business management and planning.
• Social media: As an effective stakeholder communication tool, social media can promote and inform, but needs to be appropriately managed to protect a company’s reputation.
• Sustainability: Maintaining a balance between the complex interplay of nature, society and business demands requires ongoing focus.
37
OUR GOVERNANCEPROFILE
SUMMARY CONSOLIDATED FINANCIAL STATEMENTS APPENDICES NOTICE OF ANNUAL
GENERAL MEETING ADMINISTRATION

As a result of this changing landscape, the business environment requires a matching and appropriate skill set from a board. Business will benefit from leadership that is diverse in its composition and able to drive progressive and forward thinking. With this in mind, we made changes to the board this year to supplement the existing skills to ensure the combined skill sets support our growing international presence. We have a diverse, dynamic and well-qualified board to lead our group responsibly towards our growth targets.
Our business continues to be affected by growing government policy changes and requirements. Similarly, our business is affected by numerous voluntary frameworks, directives, rules and guidelines, many of which focus on social, environmental and governance aspects.
Key regulatory and non-binding instruments affecting and influencing our South African business includes the following:
• Consumer protection legislation, such as the National Credit Act, Consumer Protection Act and the Protection of Personal Information Act (partly effective)
• Labour law legislation, such as the Labour Relations Act, Employment Equity Act, Basic Conditions of Employment Act and the Broad-based Black Economic Empowerment Act
• Tax legislation, such as the Income Tax Act, Value-added Tax Act and employment-related tax legislation;
• Legislation and instruments on companies and good corporate governance, such as the Companies Act, the JSE Listings Requirements and the King Code of Corporate Governance (King III and the draft King IV)
• Non-binding initiatives, such as the Carbon Disclosure Project, Water Disclosure Project, Kimberley Process and the Global Reporting Initiative (GR4)
Key regulatory and non-binding instruments affecting and influencing our African business includes the following:
• Consumer protection legislation, such as the Consumer Protection Act in Botswana, the draft Consumer Credit Bill in Swaziland and the Data Protection Act in Ghana;
• Labour law legislation, such as the Employment Services Act in Namibia
• Tax legislation and legislation on companies, such as the various Value-added Tax Acts, employment-related tax legislation and Companies Acts in the African countries in which our business trades
• Empowerment initiatives and legislation, such as the New Equitable Economic Empowerment Framework and the National Equitable Economic Empowerment Bill in Namibia and the Citizens Economic Empowerment Bill in Swaziland
• Voluntary charters to promote local procurement, such as the Namibian Retail Charter
Key regulatory and non-binding instruments affecting our international business includes the following:
• Data protection legislation– Data Protection Act – Phase Eight processes
customer and employee data which are processed fairly and stored for as long as required to fulfil the purpose for which it was gathered. Any loss/publication of personal data (whether of customers or employees) due to a cyber incident, negligence or failure to comply with the Data Protection Act could lead to negative press and fines.
– Payment Card Industry Data Security Standard (PCI DSS) – this is not a regulatory requirement; however, Phase Eight is categorised as a “Level 3” merchant due to credit card transaction numbers. As such, Barclaycard measures its compliance towards certification. PCI DSS gives customer confidence when making online purchases – the consequences of losses/fraud are reputational damage and fines.
• Consumer Rights Act – this governs statutory implied terms and remedies in consumer contracts for goods, enforcement of consumer protection law, clarified periods for repair, replacement and refunds for goods.
• Consumer Credit Act – Phase Eight is registered for limited permission because certain department store partners with whom there are concessions offer store credit cards, and Phase Eight staff may assist the stores by informing customers about the benefits of store credit cards and where to sign up; this may be deemed to be an introductory service and therefore a secondary broking activity. A lower standard of reporting and compliance with the Consumer Credit Act is required for limited permission.
• UK Companies Act – Phase Eight (Fashion & Designs), the UK operating company, and 12 of its subsidiaries are UK-registered companies and therefore subject to the provisions of the UK Companies Act on statutory filings and accounting, and a patchwork of legislation/regulations that apply to all UK companies (e.g. environmental, supply chain (Modern Slavery Act, etc.)).
• Employment legislation (Phase Eight has approximately 1 800 UK employees) – the introduction of The National Minimum Wage (Amendment) Regulations 2016 (since 1 April 2016) by law, means that all workers within the UK are now entitled to an increased national minimum wage per hour.
New legislative requirements have a cost implication on our business, as does new non-binding measures and policy instruments. Where our business is not directly affected by a new measure, it is often the case that it is indirectly affected because the measure may have the effect of reducing a consumer’s discretionary income, thereby potentially slowing consumer spending.
OUR OPERATING CONTEXT CONTINUED
TFG INTEGRATED ANNUAL REPORT 2016 www.tfglimited.co.za38
INVESTMENT CASE
ABOUTTHIS REPORT
OUR PROFILE
OUR OPERATINGCONTEXT
OUR STRATEGY AND PERFORMANCE

39
OUR GOVERNANCEPROFILE
SUMMARY CONSOLIDATED FINANCIAL STATEMENTS APPENDICES NOTICE OF ANNUAL
GENERAL MEETING ADMINISTRATION

The board is the ultimate custodian of the corporate reputation of TFG and its relationships with stakeholders. Therefore, we acknowledge the importance of proactive engagement.
Our stakeholder engagement approach is based on the principle of shared value. We want to create partnerships with a strong focus on public/private sector collaboration, knowing that our ability to succeed as a business is based on partnerships, including relationships with national employer bodies, trade unions, government ministries,
higher education and revenue services, and relationships with our various suppliers. By working effectively with these stakeholders, we will not only contribute towards improving the lives of our customers, but also enhance our supply chain and its ability to support the competitive advantage of our brands.
We believe that value creation depends on the interactions of many stakeholders and that value delivery must turn this into a virtuous cycle. Therefore, our intent in engaging with our primary stakeholders is summarised as follows:
STAKEHOLDER GROUP ENGAGEMENT INTENT
EMPLOYEES To maximise employee productivity, innovation and efficiency, and to minimise employee turnover by investing in training and development. We want to provide a rewarding work environment with market-related remuneration, attractive incentive schemes and supportive environments that contributes towards making us an employer of choice.
SHAREHOLDERS To maintain a positive relationship with current and potential investors through our transparent reporting, and by ensuring consistency in our trading performance.
CUSTOMERS To understand and respond to their preferences through a strong customer relationship management focus, our Rewards programme and online platforms. Customer insights allow us to grow our customer base and actively manage customer credit limits and account payments.
COMMUNITIES To strengthen and resurrect the South African clothing industry by investing in local procurement activities. We are committed to support the communities in the markets in which we operate.
GOVERNMENT AND REGULATORS
To maintain constructive relationships with key government departments, closely monitor policy developments and submit comments on new legislation, either directly, or through industry bodies.
MERCHANDISE SUPPLIERS To actively engage with suppliers to maximise buying efficiencies, improve speed to market and reduce potential external risks.
KEY SERVICE PROVIDERS To ensure consistency and reliability of supply.
LANDLORDS AND CONCESSION PARTNERS
To optimise our location strategy for our various brands in the markets in which we operate.
OURSTAKEHOLDERS
TFG INTEGRATED ANNUAL REPORT 2016 www.tfglimited.co.za40
INVESTMENT CASE
ABOUTTHIS REPORT
OUR PROFILE
OUR OPERATINGCONTEXT
OUR STRATEGY AND PERFORMANCE
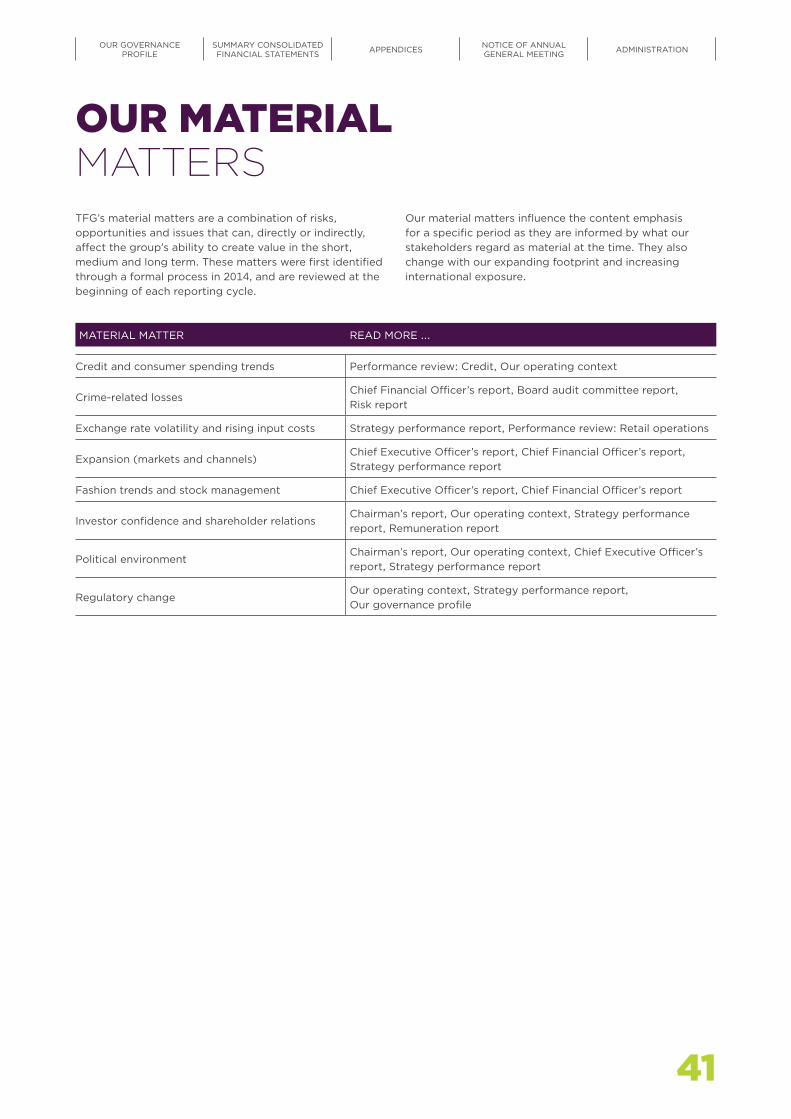
MATERIAL MATTER READ MORE ….
Credit and consumer spending trends Performance review: Credit, Our operating context
Crime-related lossesChief Financial Officer’s report, Board audit committee report, Risk report
Exchange rate volatility and rising input costs Strategy performance report, Performance review: Retail operations
Expansion (markets and channels)Chief Executive Officer’s report, Chief Financial Officer’s report, Strategy performance report
Fashion trends and stock management Chief Executive Officer’s report, Chief Financial Officer’s report
Investor confidence and shareholder relationsChairman’s report, Our operating context, Strategy performance report, Remuneration report
Political environmentChairman’s report, Our operating context, Chief Executive Officer’s report, Strategy performance report
Regulatory changeOur operating context, Strategy performance report, Our governance profile
TFG’s material matters are a combination of risks, opportunities and issues that can, directly or indirectly, affect the group’s ability to create value in the short, medium and long term. These matters were first identified through a formal process in 2014, and are reviewed at the beginning of each reporting cycle.
Our material matters influence the content emphasis for a specific period as they are informed by what our stakeholders regard as material at the time. They also change with our expanding footprint and increasing international exposure.
OUR MATERIALMATTERS
41
OUR GOVERNANCEPROFILE
SUMMARY CONSOLIDATED FINANCIAL STATEMENTS APPENDICES NOTICE OF ANNUAL
GENERAL MEETING ADMINISTRATION
OUR STRATEGY AND PERFORMANCE
Chief Executive Officer’s report 44
Chief Financial Officer’s report 50
Strategy performance report 56
Sustainability 68
10-year statistics 70
Performance review: Retail operations 72
Performance review: Credit 78
Performance review: Customer value-added products 80
TFG INTEGRATED ANNUAL REPORT 2016 www.tfglimited.co.za42

OUR STRATEGY AND PERFORMANCE
43

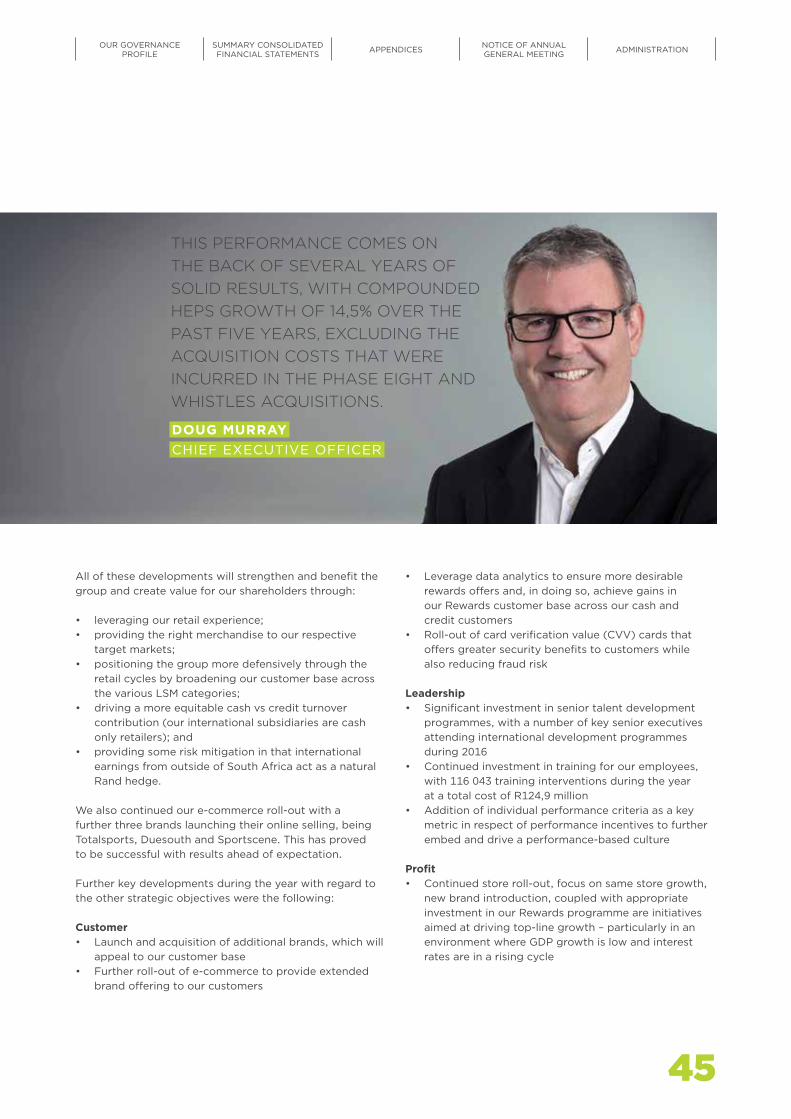
The group produced a good result for the year, coming in above management’s expectation. This is particularly pleasing against the background of the current macroeconomic environment in which we operate. This performance comes on the back of several years of solid results with compounded HEPS growth of 14,5% over the past five years, excluding the acquisition costs that were incurred in the Phase Eight and Whistles acquisitions.
The key features of our performance during the year were the following:
• Group turnover up 31,2% to R21,1 billion (excluding Phase Eight: 11,6%)
• Strong cash sales growth of 18,4% in our African operations
• Total cash sales including Phase Eight now represents 57,2% of total turnover
• Headline earnings per share from continuing operations (excluding once-off acquisition costs) up 17,6% to 1 055,8 cents
• A final distribution of 385,0 cents per share, which represents an increase of 18,5%
• A total distribution of 691,0 cents per share, a 17,5% increase compared to last year
Although the credit cycle remains tough, we achieved credit sales growth of 5,9% compared to growth of 4,3% in the previous year.
Further information on our financial results is provided in our Chief Financial Officer’s report on page 50.
VALUE ADDED DURING THE YEAR We declared two scrip distributions in the past financial year, both with a cash dividend alternative. The final distribution was 385,0 cents per share, an increase of 18,5%. Total distribution for the year amounted to 691,0 cents per share, an increase of 17,5% for the year. This distribution reflects the growth in the underlying continuing operations of the group.
At the year end, our share price was trading at R141,44, reflecting a historic price earnings ratio of 13,58 and a dividend yield of 4,9% (based on the year-end share price).
STRATEGIC DEVELOPMENTS DURING THE YEARThe 2016 financial year was a busy year for the group, especially in terms of our growth strategy.
Our ongoing store expansion resulted in space growth of 6,6% in Africa for the year through the opening of 209 stores across South Africa and the rest of Africa. A further net 98 Phase Eight outlets were added during the year.
In addition to this we also:
• launched SODA Bloc, our tweens brand;• acquired the franchise rights for Colette;• acquired the franchise rights for Next;• commenced the rebranding of Fashion Express to
The FIX; and• acquired Whistles, a UK fashion brand.
CHIEF EXECUTIVE OFFICER’S REPORT
TFG INTEGRATED ANNUAL REPORT 2016 www.tfglimited.co.za44
INVESTMENT CASE
ABOUTTHIS REPORT
OUR PROFILE
OUR OPERATINGCONTEXT
OUR STRATEGY AND PERFORMANCE
45
All of these developments will strengthen and benefit the group and create value for our shareholders through:
• leveraging our retail experience;• providing the right merchandise to our respective
target markets;• positioning the group more defensively through the
retail cycles by broadening our customer base across the various LSM categories;
• driving a more equitable cash vs credit turnover contribution (our international subsidiaries are cash only retailers); and
• providing some risk mitigation in that international earnings from outside of South Africa act as a natural Rand hedge.
We also continued our e-commerce roll-out with a further three brands launching their online selling, being Totalsports, Duesouth and Sportscene. This has proved to be successful with results ahead of expectation.
Further key developments during the year with regard to the other strategic objectives were the following:
Customer• Launch and acquisition of additional brands, which will
appeal to our customer base• Further roll-out of e-commerce to provide extended
brand offering to our customers
DOUG MURRAYCHIEF EXECUTIVE OFFICER
THIS PERFORMANCE COMES ON THE BACK OF SEVERAL YEARS OF SOLID RESULTS, WITH COMPOUNDED HEPS GROWTH OF 14,5% OVER THE PAST FIVE YEARS, EXCLUDING THE ACQUISITION COSTS THAT WERE INCURRED IN THE PHASE EIGHT AND WHISTLES ACQUISITIONS.
• Leverage data analytics to ensure more desirable rewards offers and, in doing so, achieve gains in our Rewards customer base across our cash and credit customers
• Roll-out of card verification value (CVV) cards that offers greater security benefits to customers while also reducing fraud risk
Leadership• Significant investment in senior talent development
programmes, with a number of key senior executives attending international development programmes during 2016
• Continued investment in training for our employees, with 116 043 training interventions during the year at a total cost of R124,9 million
• Addition of individual performance criteria as a key metric in respect of performance incentives to further embed and drive a performance-based culture
Profit• Continued store roll-out, focus on same store growth,
new brand introduction, coupled with appropriate investment in our Rewards programme are initiatives aimed at driving top-line growth – particularly in an environment where GDP growth is low and interest rates are in a rising cycle
45
OUR GOVERNANCEPROFILE
SUMMARY CONSOLIDATED FINANCIAL STATEMENTS APPENDICES NOTICE OF ANNUAL
GENERAL MEETING ADMINISTRATION

• Strict margin management is the lifeblood of our business and particularly important in an environment of volatile exchange rates– Our focus on local manufacturing assists in
reducing the impact of imported inflation and remains a priority
– Efforts include the construction of a new factory in Caledon which, combined with our facility in Maitland, will significantly increase our in-house manufacturing capability once complete
• While investment to drive future growth is a necessity, strict cost control remains a key focus
More details on our performance with regard to our strategic objectives are provided in our strategy performance report on page 56.
WHISTLES ACQUISITIONWe acquired, through Phase Eight, 100% of the shareholding of Whistles Holdings Limited at the end of our financial year. Whistles is a leading British contemporary fashion brand for men and women and was established in London in 1974. They currently operate through 121 outlets in the UK and internationally both through stand-alone stores as well as concessions in department stores such as Harrods and Bloomingdales, and have an online presence.
The acquisition was opportunistic, but supported by the following rationale:
• Their strong brand equity• Their unique product proposition• Clear growth opportunities• Obvious synergies with Phase Eight
During the 2017 financial year, the focus will be on realising synergies and economies of scale and on leveraging the existing Phase Eight management and business model to maximise returns. We believe that, through Whistles, we will further increase our international footprint by utilising the Phase Eight platform and we expect to extract efficiencies by replicating the Phase Eight business model, which is both capital light and low risk.
BRAND PERFORMANCEOur Sports division, in particular Sportscene, and our Exact division performed extremely well during the year. At the other end of the spectrum Fashion Express had a difficult year. With the transition of the Fashion Express brand into The FIX (now a brand aimed at a younger fashion-value customer), we foresee good growth for this division in ensuing years.
Homeware had a reasonable year with good furniture growth. However, the homeware category proved more difficult towards the end of the year against a backdrop of significant discounting within the industry.
Menswear, headed up by Markham, had a good year, with particularly strong growth in Fabiani and G-Star Raw.
Jewellery performed well in this competitive market segment.
The Foschini division trades in the most difficult area of fashion retail and we are pleased with the significant progress that was made in repositioning the brand and its product offering. While this is not fully reflected in their 2016 performance, we are confident that the brand is on the correct path and will produce good results on the back of this strategy in the short to medium term.
Cellphones had a difficult year mainly due to sporadic supply of desired handsets while cosmetics yet again had a solid result on the back of several similar performances in recent years.
Internationally, the performance of Phase Eight met our expectations and all our strategic targets that were set for the year were achieved.
CHIEF EXECUTIVE OFFICER’S REPORT CONTINUED
TFG INTEGRATED ANNUAL REPORT 2016 www.tfglimited.co.za46
INVESTMENT CASE
ABOUTTHIS REPORT
OUR PROFILE
OUR OPERATINGCONTEXT
OUR STRATEGY AND PERFORMANCE
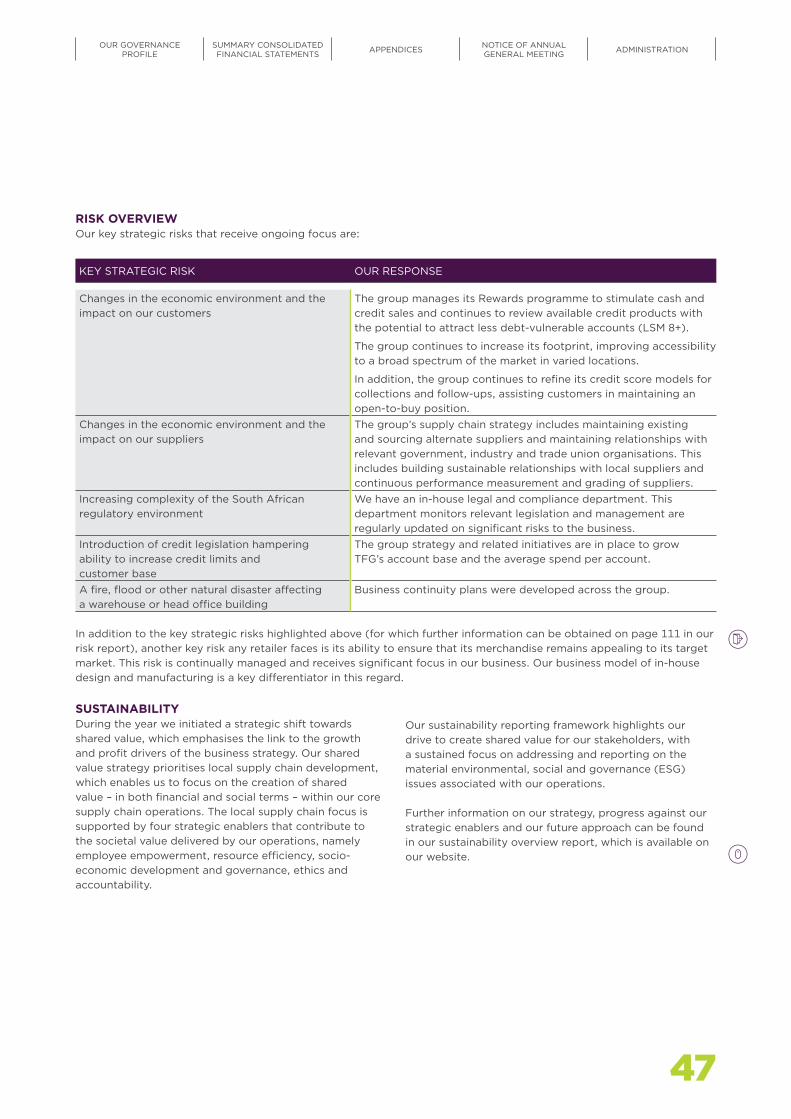
RISK OVERVIEWOur key strategic risks that receive ongoing focus are:
KEY STRATEGIC RISK OUR RESPONSE
Changes in the economic environment and the impact on our customers
The group manages its Rewards programme to stimulate cash and credit sales and continues to review available credit products with the potential to attract less debt-vulnerable accounts (LSM 8+).
The group continues to increase its footprint, improving accessibility to a broad spectrum of the market in varied locations.
In addition, the group continues to refine its credit score models for collections and follow-ups, assisting customers in maintaining an open-to-buy position.
Changes in the economic environment and the impact on our suppliers
The group’s supply chain strategy includes maintaining existing and sourcing alternate suppliers and maintaining relationships with relevant government, industry and trade union organisations. This includes building sustainable relationships with local suppliers and continuous performance measurement and grading of suppliers.
Increasing complexity of the South African regulatory environment
We have an in-house legal and compliance department. This department monitors relevant legislation and management are regularly updated on significant risks to the business.
Introduction of credit legislation hampering ability to increase credit limits and customer base
The group strategy and related initiatives are in place to grow TFG’s account base and the average spend per account.
A fire, flood or other natural disaster affecting a warehouse or head office building
Business continuity plans were developed across the group.
In addition to the key strategic risks highlighted above (for which further information can be obtained on page 111 in our risk report), another key risk any retailer faces is its ability to ensure that its merchandise remains appealing to its target market. This risk is continually managed and receives significant focus in our business. Our business model of in-house design and manufacturing is a key differentiator in this regard.
SUSTAINABILITYDuring the year we initiated a strategic shift towards shared value, which emphasises the link to the growth and profit drivers of the business strategy. Our shared value strategy prioritises local supply chain development, which enables us to focus on the creation of shared value – in both financial and social terms – within our core supply chain operations. The local supply chain focus is supported by four strategic enablers that contribute to the societal value delivered by our operations, namely employee empowerment, resource efficiency, socio-economic development and governance, ethics and accountability.
Our sustainability reporting framework highlights our drive to create shared value for our stakeholders, with a sustained focus on addressing and reporting on the material environmental, social and governance (ESG) issues associated with our operations.
Further information on our strategy, progress against our strategic enablers and our future approach can be found in our sustainability overview report, which is available on our website.
47
OUR GOVERNANCEPROFILE
SUMMARY CONSOLIDATED FINANCIAL STATEMENTS APPENDICES NOTICE OF ANNUAL
GENERAL MEETING ADMINISTRATION

PEOPLEOur performance this year would not have been possible without our more than 22 800 employees. Their talent and commitment to our group remain a key strength and a key differentiator.
To this end, we continued to invest in the development of our staff and spent the equivalent of 3,9% of our total payroll cost on training this year.
Employment equity and transformation remain a key focus in our group, with 92,25% of our South African staff, as at March 2016, being from designated groups.
We are also pleased to report that TFG was ranked third in the 2015 Business Report Top 100 Most Empowered Companies survey within the retail sector.
PROSPECTS The global economic environment remains uncertain with the outcome of the British referendum and concerns around the Chinese economy.
In South Africa, the current political uncertainty, coupled with muted growth prospects and the expected higher inflation and interest rates point to a potentially challenging year ahead. However, our strategic objectives are clear and we continue to remain focused on these strategies and investment to support future growth. We believe that continued commitment to our strategy will support our effort to achieve a reasonable result for the coming year in a difficult trading environment.
We plan to open in excess of 150 new stores in sub-Saharan Africa in the year ahead, which will increase our trading space by approximately 6%. Internationally, we plan to open in excess of 50 Phase Eight and 20 Whistles outlets. Our omnichannel roll-out will also continue with the launch of Foschini cosmetics, @home furniture, Markham and Fabiani.
APPRECIATIONI would like to thank our Chairman, Michael Lewis, for his invaluable input and contribution during his first year as Chairman of the group, and I look forward to working with him in the future.
I would also like to thank my colleagues on the supervisory board for their guidance and direction, and my colleagues on the operating board for their input and support during this past year.
To our employees, thank you for your contribution to our group this year. Without you, our performance and success would not have been possible.
Lastly, to our customers, shareholders and stakeholders, thank you for your support of our group this year. I trust your loyalty will continue to be rewarded.
Doug MurrayChief Executive Officer
29 June 2016
CHIEF EXECUTIVE OFFICER’S REPORT CONTINUED
TFG INTEGRATED ANNUAL REPORT 2016 www.tfglimited.co.za48
INVESTMENT CASE
ABOUTTHIS REPORT
OUR PROFILE
OUR OPERATINGCONTEXT
OUR STRATEGY AND PERFORMANCE

49
OUR GOVERNANCEPROFILE
SUMMARY CONSOLIDATED FINANCIAL STATEMENTS APPENDICES NOTICE OF ANNUAL
GENERAL MEETING ADMINISTRATION
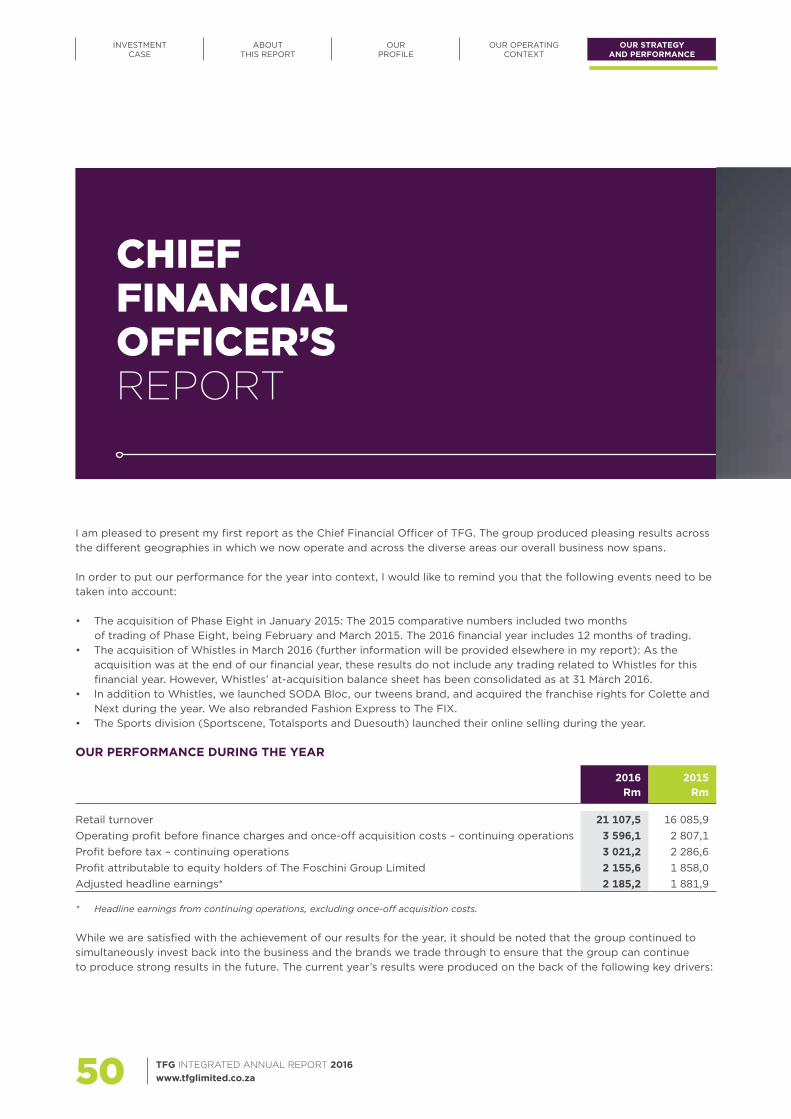
I am pleased to present my first report as the Chief Financial Officer of TFG. The group produced pleasing results across the different geographies in which we now operate and across the diverse areas our overall business now spans.
In order to put our performance for the year into context, I would like to remind you that the following events need to be taken into account:
• The acquisition of Phase Eight in January 2015: The 2015 comparative numbers included two months of trading of Phase Eight, being February and March 2015. The 2016 financial year includes 12 months of trading.
• The acquisition of Whistles in March 2016 (further information will be provided elsewhere in my report): As the acquisition was at the end of our financial year, these results do not include any trading related to Whistles for this financial year. However, Whistles’ at-acquisition balance sheet has been consolidated as at 31 March 2016.
• In addition to Whistles, we launched SODA Bloc, our tweens brand, and acquired the franchise rights for Colette and Next during the year. We also rebranded Fashion Express to The FIX.
• The Sports division (Sportscene, Totalsports and Duesouth) launched their online selling during the year.
OUR PERFORMANCE DURING THE YEAR
2016 Rm
2015 Rm
Retail turnover 21 107,5 16 085,9Operating profit before finance charges and once-off acquisition costs – continuing operations 3 596,1 2 807,1Profit before tax – continuing operations 3 021,2 2 286,6Profit attributable to equity holders of The Foschini Group Limited 2 155,6 1 858,0Adjusted headline earnings* 2 185,2 1 881,9
* Headline earnings from continuing operations, excluding once-off acquisition costs.
While we are satisfied with the achievement of our results for the year, it should be noted that the group continued to simultaneously invest back into the business and the brands we trade through to ensure that the group can continue to produce strong results in the future. The current year’s results were produced on the back of the following key drivers:
CHIEF FINANCIAL OFFICER’S REPORT
TFG INTEGRATED ANNUAL REPORT 2016 www.tfglimited.co.za50
INVESTMENT CASE
ABOUTTHIS REPORT
OUR PROFILE
OUR OPERATINGCONTEXT
OUR STRATEGY AND PERFORMANCE

ANTHONY THUNSTRÖMCHIEF FINANCIAL OFFICER
THE GROUP PRODUCED PLEASING RESULTS ACROSS THE DIFFERENT GEOGRAPHIES IN WHICH WE NOW OPERATE AND ACROSS THE DIVERSE AREAS OUR OVERALL BUSINESS NOW SPANS.
• Turnover growth: We had good turnover growth in South Africa, the rest of Africa and in our international operations through Phase Eight.
• Continued focus on costs: We continue to focus on cost control at all levels through the group, and costs are reviewed and, where required, challenged on an ongoing basis.
• Continued reinvestment: Our results achieved during the current year reflect the cumulative effect of the ongoing reinvestment in the business the group made over both the current and past years. During the current year alone, R2,7 billion was reinvested back into the business.
Reinvesting back into our group has, over the last few years, enabled us to deliver a continued, strong performance as illustrated below:
0
5 000
10 000
15 000
20 000
25 000
2016201520142013201220112010200920082007
Retail turnover (Rm)
Headline earnings per ordinary share from continuing operations excluding once o� acquisiton costs (cents)
Distribution declared per ordinary share (DPS) (cents)
0
240
480
720
960
1 200
Rm Cents
270,0
7 230,0
288,0
7 668,7
458,2
288,0
8 089,6
488,8
288,0
8 605,2
440,7 506,0
12 896,4
780,6
536,0
14 159,0
818,7
588,0
897,9
691,0
16 085,9
21 107,5
1 055,8
350,0
9 936,5
537,3
455,0
11 630,5
653,9
438,1
Further details on these key drivers and other current year material financial statement items now follow.
51
OUR GOVERNANCEPROFILE
SUMMARY CONSOLIDATED FINANCIAL STATEMENTS APPENDICES NOTICE OF ANNUAL
GENERAL MEETING ADMINISTRATION
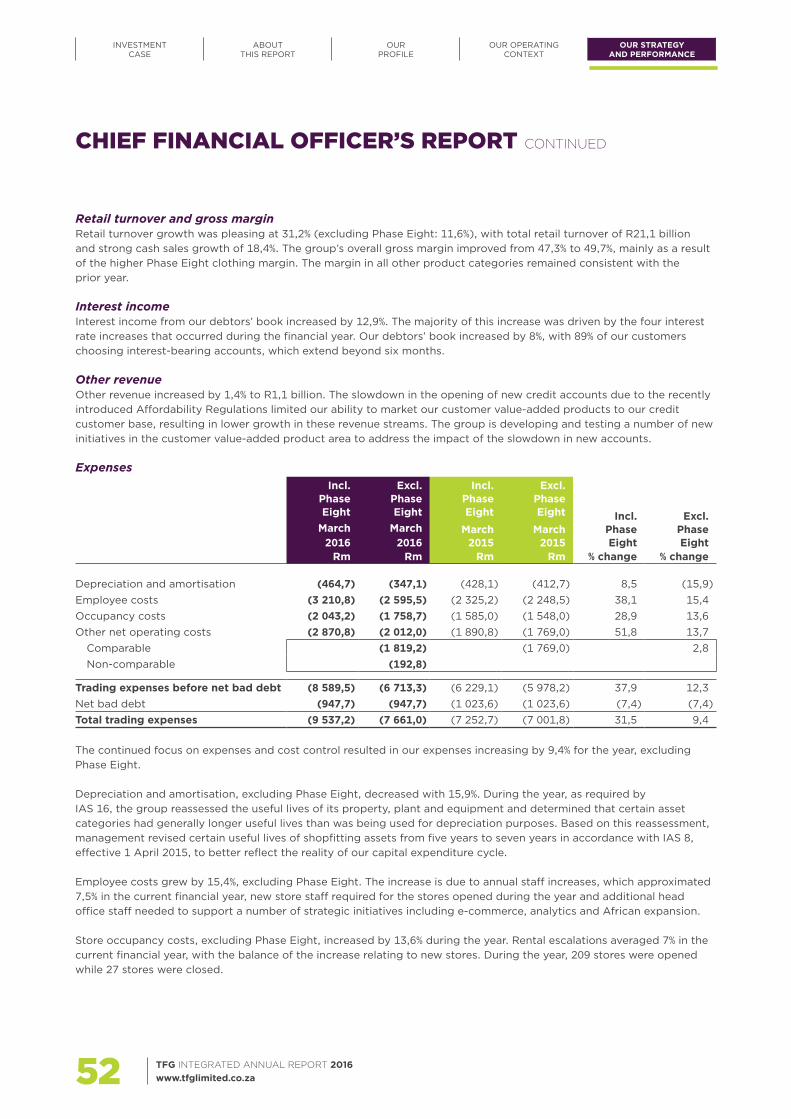
Retail turnover and gross marginRetail turnover growth was pleasing at 31,2% (excluding Phase Eight: 11,6%), with total retail turnover of R21,1 billion and strong cash sales growth of 18,4%. The group’s overall gross margin improved from 47,3% to 49,7%, mainly as a result of the higher Phase Eight clothing margin. The margin in all other product categories remained consistent with the prior year. Interest incomeInterest income from our debtors’ book increased by 12,9%. The majority of this increase was driven by the four interest rate increases that occurred during the financial year. Our debtors’ book increased by 8%, with 89% of our customers choosing interest-bearing accounts, which extend beyond six months.
Other revenueOther revenue increased by 1,4% to R1,1 billion. The slowdown in the opening of new credit accounts due to the recently introduced Affordability Regulations limited our ability to market our customer value-added products to our credit customer base, resulting in lower growth in these revenue streams. The group is developing and testing a number of new initiatives in the customer value-added product area to address the impact of the slowdown in new accounts.
ExpensesIncl.
Phase Eight
Excl. Phase Eight
Incl. Phase Eight
Excl. Phase Eight Incl.
Phase Eight
Excl. Phase Eight
March 2016
March 2016
March 2015
March 2015
Rm Rm Rm Rm % change % change
Depreciation and amortisation (464,7) (347,1) (428,1) (412,7) 8,5 (15,9)Employee costs (3 210,8) (2 595,5) (2 325,2) (2 248,5) 38,1 15,4Occupancy costs (2 043,2) (1 758,7) (1 585,0) (1 548,0) 28,9 13,6Other net operating costs (2 870,8) (2 012,0) (1 890,8) (1 769,0) 51,8 13,7
Comparable (1 819,2) (1 769,0) 2,8Non-comparable (192,8)
Trading expenses before net bad debt (8 589,5) (6 713,3) (6 229,1) (5 978,2) 37,9 12,3Net bad debt (947,7) (947,7) (1 023,6) (1 023,6) (7,4) (7,4)Total trading expenses (9 537,2) (7 661,0) (7 252,7) (7 001,8) 31,5 9,4
The continued focus on expenses and cost control resulted in our expenses increasing by 9,4% for the year, excluding Phase Eight.
Depreciation and amortisation, excluding Phase Eight, decreased with 15,9%. During the year, as required by IAS 16, the group reassessed the useful lives of its property, plant and equipment and determined that certain asset categories had generally longer useful lives than was being used for depreciation purposes. Based on this reassessment, management revised certain useful lives of shopfitting assets from five years to seven years in accordance with IAS 8, effective 1 April 2015, to better reflect the reality of our capital expenditure cycle.
Employee costs grew by 15,4%, excluding Phase Eight. The increase is due to annual staff increases, which approximated 7,5% in the current financial year, new store staff required for the stores opened during the year and additional head office staff needed to support a number of strategic initiatives including e-commerce, analytics and African expansion.
Store occupancy costs, excluding Phase Eight, increased by 13,6% during the year. Rental escalations averaged 7% in the current financial year, with the balance of the increase relating to new stores. During the year, 209 stores were opened while 27 stores were closed.
CHIEF FINANCIAL OFFICER’S REPORT CONTINUED
TFG INTEGRATED ANNUAL REPORT 2016 www.tfglimited.co.za52
INVESTMENT CASE
ABOUTTHIS REPORT
OUR PROFILE
OUR OPERATINGCONTEXT
OUR STRATEGY AND PERFORMANCE
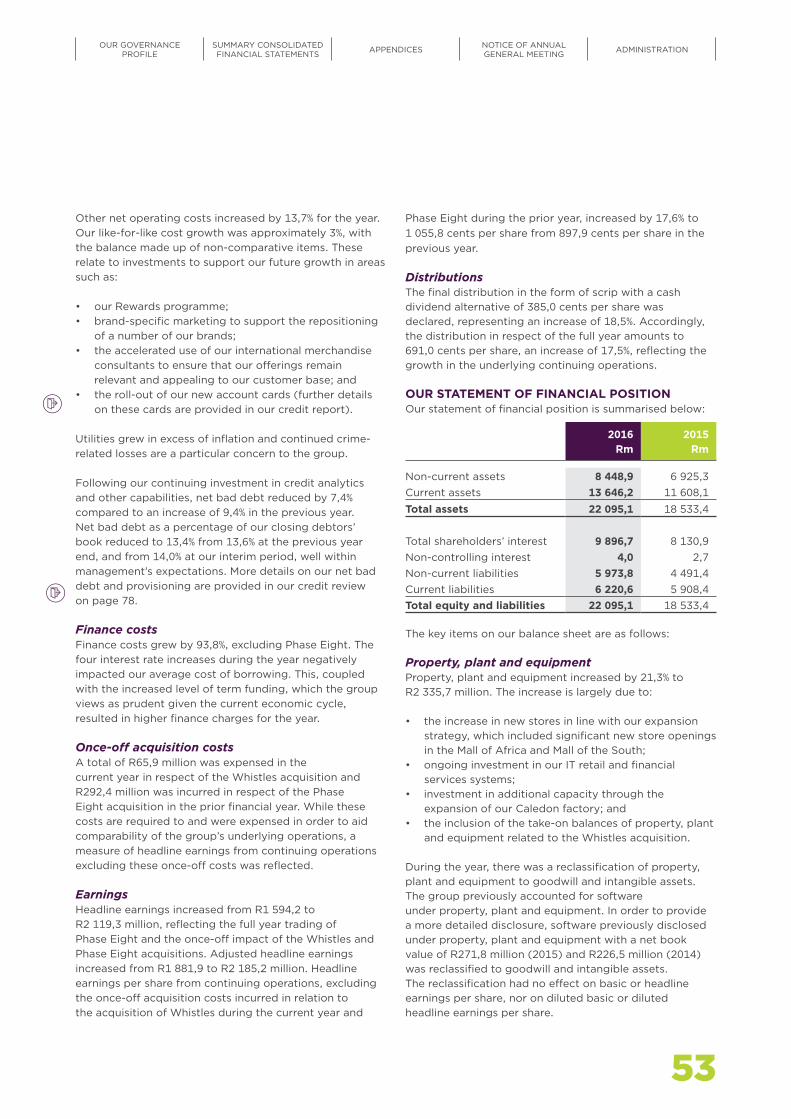
Other net operating costs increased by 13,7% for the year. Our like-for-like cost growth was approximately 3%, with the balance made up of non-comparative items. These relate to investments to support our future growth in areas such as:
• our Rewards programme;• brand-specific marketing to support the repositioning
of a number of our brands; • the accelerated use of our international merchandise
consultants to ensure that our offerings remain relevant and appealing to our customer base; and
• the roll-out of our new account cards (further details on these cards are provided in our credit report).
Utilities grew in excess of inflation and continued crime-related losses are a particular concern to the group.
Following our continuing investment in credit analytics and other capabilities, net bad debt reduced by 7,4% compared to an increase of 9,4% in the previous year. Net bad debt as a percentage of our closing debtors’ book reduced to 13,4% from 13,6% at the previous year end, and from 14,0% at our interim period, well within management’s expectations. More details on our net bad debt and provisioning are provided in our credit review on page 78.
Finance costsFinance costs grew by 93,8%, excluding Phase Eight. The four interest rate increases during the year negatively impacted our average cost of borrowing. This, coupled with the increased level of term funding, which the group views as prudent given the current economic cycle, resulted in higher finance charges for the year.
Once-off acquisition costsA total of R65,9 million was expensed in the current year in respect of the Whistles acquisition and R292,4 million was incurred in respect of the Phase Eight acquisition in the prior financial year. While these costs are required to and were expensed in order to aid comparability of the group’s underlying operations, a measure of headline earnings from continuing operations excluding these once-off costs was reflected.
EarningsHeadline earnings increased from R1 594,2 to R2 119,3 million, reflecting the full year trading of Phase Eight and the once-off impact of the Whistles and Phase Eight acquisitions. Adjusted headline earnings increased from R1 881,9 to R2 185,2 million. Headline earnings per share from continuing operations, excluding the once-off acquisition costs incurred in relation to the acquisition of Whistles during the current year and
Phase Eight during the prior year, increased by 17,6% to 1 055,8 cents per share from 897,9 cents per share in the previous year.
DistributionsThe final distribution in the form of scrip with a cash dividend alternative of 385,0 cents per share was declared, representing an increase of 18,5%. Accordingly, the distribution in respect of the full year amounts to 691,0 cents per share, an increase of 17,5%, reflecting the growth in the underlying continuing operations.
OUR STATEMENT OF FINANCIAL POSITIONOur statement of financial position is summarised below:
2016Rm
2015Rm
Non-current assets 8 448,9 6 925,3Current assets 13 646,2 11 608,1
Total assets 22 095,1 18 533,4
Total shareholders’ interest 9 896,7 8 130,9Non-controlling interest 4,0 2,7Non-current liabilities 5 973,8 4 491,4Current liabilities 6 220,6 5 908,4Total equity and liabilities 22 095,1 18 533,4
The key items on our balance sheet are as follows:
Property, plant and equipmentProperty, plant and equipment increased by 21,3% to R2 335,7 million. The increase is largely due to:
• the increase in new stores in line with our expansion strategy, which included significant new store openings in the Mall of Africa and Mall of the South;
• ongoing investment in our IT retail and financial services systems;
• investment in additional capacity through the expansion of our Caledon factory; and
• the inclusion of the take-on balances of property, plant and equipment related to the Whistles acquisition.
During the year, there was a reclassification of property, plant and equipment to goodwill and intangible assets. The group previously accounted for software under property, plant and equipment. In order to provide a more detailed disclosure, software previously disclosed under property, plant and equipment with a net book value of R271,8 million (2015) and R226,5 million (2014) was reclassified to goodwill and intangible assets. The reclassification had no effect on basic or headline earnings per share, nor on diluted basic or diluted headline earnings per share.
53
OUR GOVERNANCEPROFILE
SUMMARY CONSOLIDATED FINANCIAL STATEMENTS APPENDICES NOTICE OF ANNUAL
GENERAL MEETING ADMINISTRATION
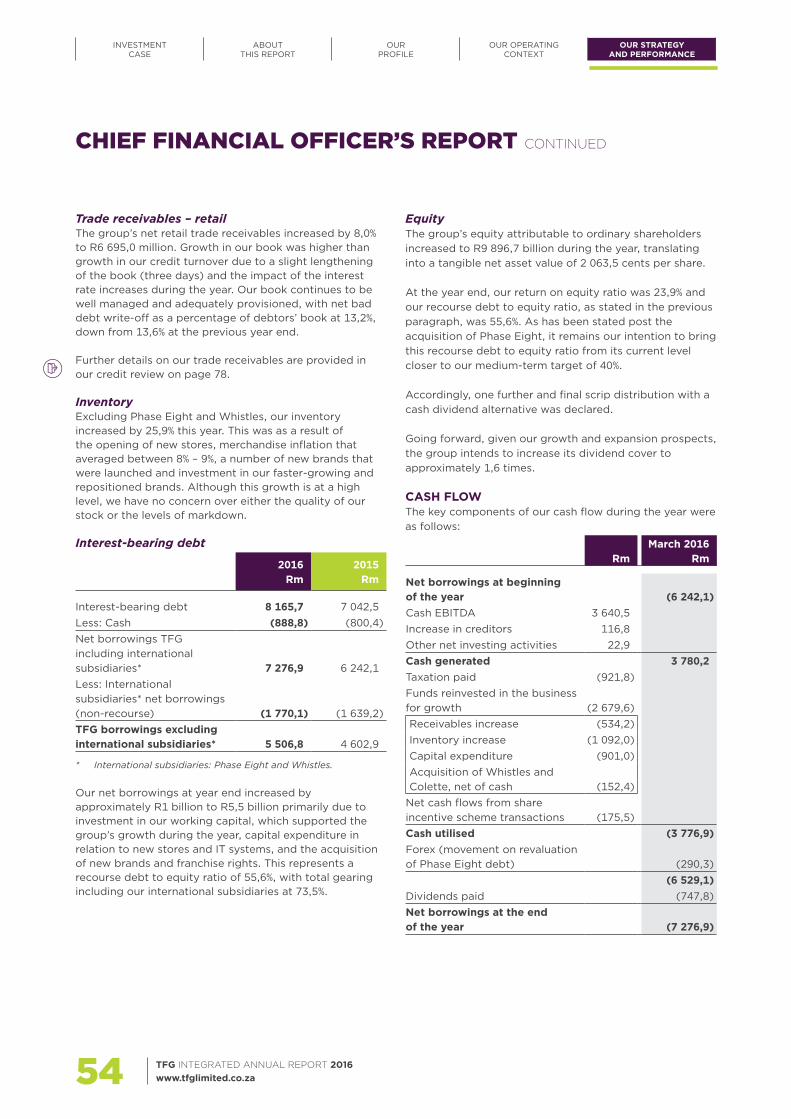
Trade receivables – retailThe group’s net retail trade receivables increased by 8,0% to R6 695,0 million. Growth in our book was higher than growth in our credit turnover due to a slight lengthening of the book (three days) and the impact of the interest rate increases during the year. Our book continues to be well managed and adequately provisioned, with net bad debt write-off as a percentage of debtors’ book at 13,2%, down from 13,6% at the previous year end.
Further details on our trade receivables are provided in our credit review on page 78.
InventoryExcluding Phase Eight and Whistles, our inventory increased by 25,9% this year. This was as a result of the opening of new stores, merchandise inflation that averaged between 8% – 9%, a number of new brands that were launched and investment in our faster-growing and repositioned brands. Although this growth is at a high level, we have no concern over either the quality of our stock or the levels of markdown.
Interest-bearing debt
2016Rm
2015Rm
Interest-bearing debt 8 165,7 7 042,5Less: Cash (888,8) (800,4)Net borrowings TFG including international subsidiaries* 7 276,9 6 242,1Less: International subsidiaries* net borrowings (non-recourse) (1 770,1) (1 639,2)TFG borrowings excluding international subsidiaries* 5 506,8 4 602,9
* International subsidiaries: Phase Eight and Whistles.
Our net borrowings at year end increased by approximately R1 billion to R5,5 billion primarily due to investment in our working capital, which supported the group’s growth during the year, capital expenditure in relation to new stores and IT systems, and the acquisition of new brands and franchise rights. This represents a recourse debt to equity ratio of 55,6%, with total gearing including our international subsidiaries at 73,5%.
EquityThe group’s equity attributable to ordinary shareholders increased to R9 896,7 billion during the year, translating into a tangible net asset value of 2 063,5 cents per share.
At the year end, our return on equity ratio was 23,9% and our recourse debt to equity ratio, as stated in the previous paragraph, was 55,6%. As has been stated post the acquisition of Phase Eight, it remains our intention to bring this recourse debt to equity ratio from its current level closer to our medium-term target of 40%.
Accordingly, one further and final scrip distribution with a cash dividend alternative was declared.
Going forward, given our growth and expansion prospects, the group intends to increase its dividend cover to approximately 1,6 times.
CASH FLOWThe key components of our cash flow during the year were as follows:
RmMarch 2016
Rm
Net borrowings at beginning of the year (6 242,1)Cash EBITDA 3 640,5Increase in creditors 116,8Other net investing activities 22,9Cash generated 3 780,2Taxation paid (921,8)Funds reinvested in the business for growth (2 679,6)Receivables increase (534,2)Inventory increase (1 092,0)Capital expenditure (901,0)Acquisition of Whistles and Colette, net of cash (152,4)
Net cash flows from share incentive scheme transactions (175,5)Cash utilised (3 776,9)Forex (movement on revaluation of Phase Eight debt) (290,3)
(6 529,1)Dividends paid (747,8)Net borrowings at the end of the year (7 276,9)
CHIEF FINANCIAL OFFICER’S REPORT CONTINUED
TFG INTEGRATED ANNUAL REPORT 2016 www.tfglimited.co.za54
INVESTMENT CASE
ABOUTTHIS REPORT
OUR PROFILE
OUR OPERATINGCONTEXT
OUR STRATEGY AND PERFORMANCE

We generated R3,6 billion worth of cash EBITDA in the current financial year, which is 27,8% higher than the R2,8 billion generated in the prior year. As referred to above, a total of R2,7 billion was reinvested back into the business for growth. This includes R0,5 billion invested to fund the growth in our book, which is key to our credit turnover, R1 billion invested in inventory to support the areas of our business where growth has accelerated, and R0,9 billion invested in capex to support future expansion. A total of R152,4 million was spent on the Whistles and Colette acquisitions, net of cash acquired.
WHISTLESAs referred to above, the group acquired 100% of Whistles Holdings Limited, which trades as Whistles. The acquisition was funded through cash resources and was at an enterprise value of GBP8,8 million (R191,1 million), with an equity value of GBP4,6 million (R100,8 million) after taking net debt into account. The acquisition was converted using a ZAR:GBP exchange rate of R21,78 being the ruling rate on the transaction date.
No goodwill has arisen from the acquisition and the Whistles brand, which is valued at GBP1,7 million (R35,9 million), was recognised as an intangible asset at acquisition. As indicated before, once-off acquisition costs of R65,9 million related to the acquisition were expensed in the current year. No profit or loss attributable to Whistles was included in the group’s results in the current financial year as the acquisition was at the end of our financial year.
FINANCIAL TARGETSFurther information on our financial targets are provided in our strategy and performance review on pages 56 to 67 of this report.
Anthony ThunströmChief Financial Officer
29 June 2016
OUR GOVERNANCEPROFILE
SUMMARY CONSOLIDATED FINANCIAL STATEMENTS APPENDICES NOTICE OF ANNUAL
GENERAL MEETING ADMINISTRATION
55
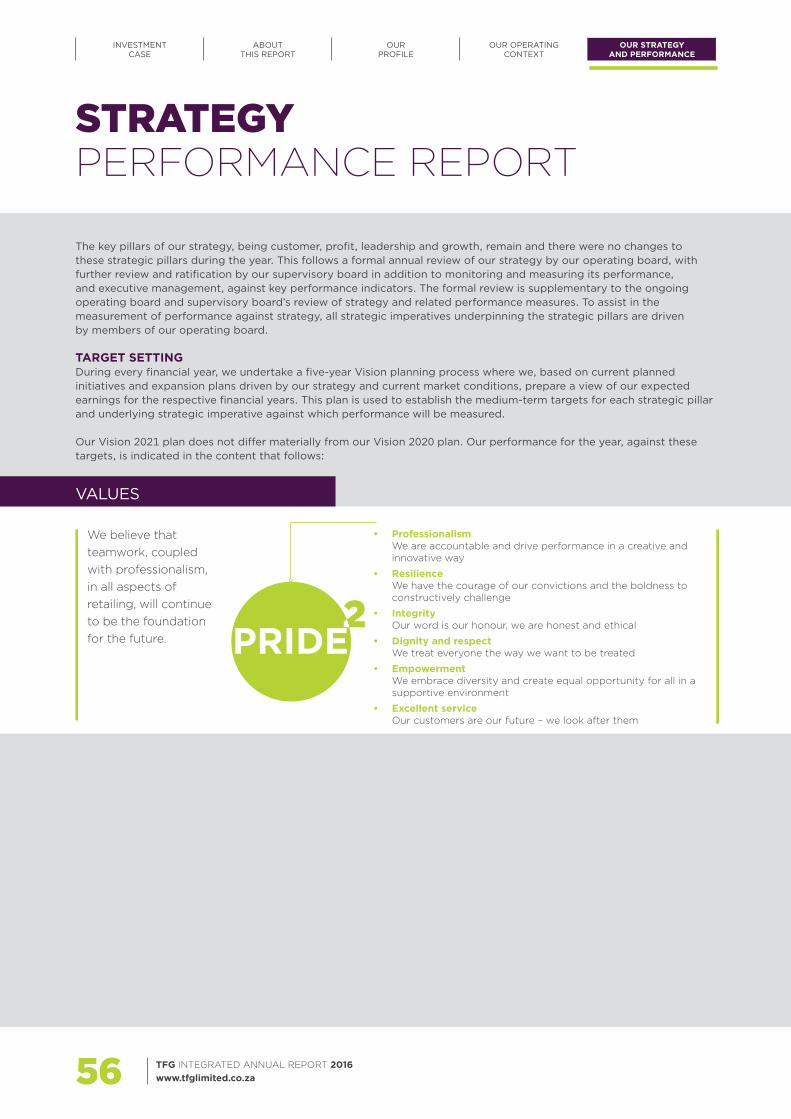
VALUES
We believe that teamwork, coupled with professionalism, in all aspects of retailing, will continue to be the foundation for the future.
STRATEGYPERFORMANCE REPORT
• Professionalism We are accountable and drive performance in a creative and
innovative way
• Resilience We have the courage of our convictions and the boldness to
constructively challenge
• Integrity Our word is our honour, we are honest and ethical
• Dignity and respect We treat everyone the way we want to be treated
• Empowerment We embrace diversity and create equal opportunity for all in a
supportive environment
• Excellent service Our customers are our future – we look after them
PRIDE
The key pillars of our strategy, being customer, profit, leadership and growth, remain and there were no changes to these strategic pillars during the year. This follows a formal annual review of our strategy by our operating board, with further review and ratification by our supervisory board in addition to monitoring and measuring its performance, and executive management, against key performance indicators. The formal review is supplementary to the ongoing operating board and supervisory board’s review of strategy and related performance measures. To assist in the measurement of performance against strategy, all strategic imperatives underpinning the strategic pillars are driven by members of our operating board.
TARGET SETTINGDuring every financial year, we undertake a five-year Vision planning process where we, based on current planned initiatives and expansion plans driven by our strategy and current market conditions, prepare a view of our expected earnings for the respective financial years. This plan is used to establish the medium-term targets for each strategic pillar and underlying strategic imperative against which performance will be measured.
Our Vision 2021 plan does not differ materially from our Vision 2020 plan. Our performance for the year, against these targets, is indicated in the content that follows:
TFG INTEGRATED ANNUAL REPORT 2016 www.tfglimited.co.za56
INVESTMENT CASE
ABOUTTHIS REPORT
OUR PROFILE
OUR OPERATINGCONTEXT
OUR STRATEGY AND PERFORMANCE
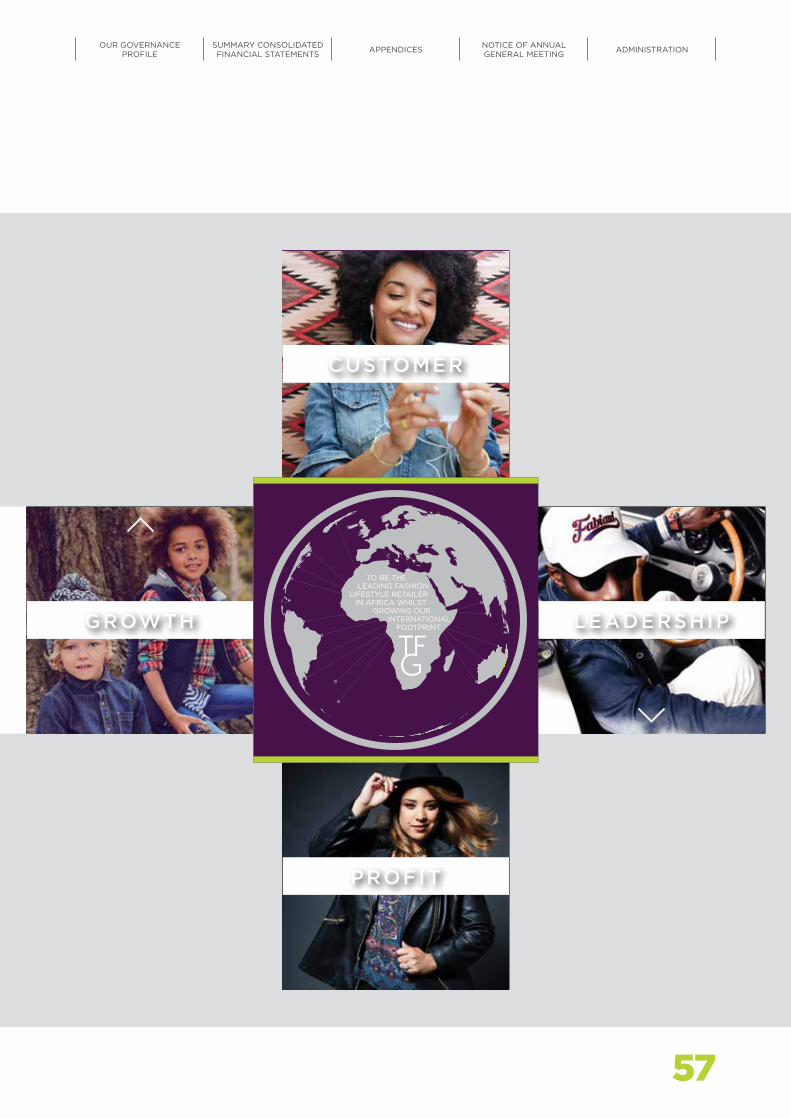
TO BE THE LEADING FASHION LIFESTYLE RETAILER IN AFRICA WHILST GROWING OUR INTERNATIONAL FOOTPRINT LEADERSHIP
CUSTOMER
GROWTH
PROFIT
57
OUR GOVERNANCEPROFILE
SUMMARY CONSOLIDATED FINANCIAL STATEMENTS APPENDICES NOTICE OF ANNUAL
GENERAL MEETING ADMINISTRATION

CUSTOMER
01Factors impacting customer experience during the year
• New brands introduced to South Africa:– SODA Bloc and Next mean customers have
access to more childrenswear brands– Colette gives female customers access to
a great accessories destination
• New international brands and ranges:– Acquisition of Whistles will complement the
Phase Eight business and give international customers a wider range of brands
– Introduction of new ranges such as Studio 8 within Phase Eight broadened the brand appeal for existing and new customers of Phase Eight
We will offer customers a range of compelling rewards as part of an integrated, secure omnichannel customer experience across our retail brands.
STRATEGIC OBJECTIVES AND TARGETS • 3,5 million active credit
customers by 2021
• 5,0 million active cash customers by 2021
BUSINESS IMPERATIVES• Ensure a more equitable split
of cash vs credit turnover contribution across all African territories
• Improve the take-up of reward offers
• Grow the basket size in excess of local inflation
CUSTOMERMEDIUM-TERM
TARGETMARCH
2016MARCH
2015%
CHANGE
Number of Rewards customers (million)
– Cash 5,0 5,4 3,6 50,0
– Credit 3,5 2,9 2,7 7,4
Net bad debt/closing debtors’ book (%) < 15,0 13,4 13,6 (1,5)
STRATEGIC INTENT AND POSITIONING STATEMENT
STRATEGY PERFORMANCE REPORT CONTINUED
TFG INTEGRATED ANNUAL REPORT 2016 www.tfglimited.co.za58
INVESTMENT CASE
ABOUTTHIS REPORT
OUR PROFILE
OUR OPERATINGCONTEXT
OUR STRATEGY AND PERFORMANCE

• Store expansion in existing and new territories means our brands are now more easily accessible to more customers
• More targeted cash and credit rewards offers in South Africa supported by better data analytics
• Online roll-out means our South African customers could access more of our brands online
• Launch of Phase Eight’s “One Stock” model resulted in UK customers having greater availability of our product range
• Introduction of Affordability Regulations in South Africa means account opening process required more supporting customer information than previously: – Since such information is personal in nature
(related to proof of income), it could have been negatively perceived by potential new customers
– Informally employed and self-employed potential new customers may have also found it more difficult to comply with proof of income requirement
– We rolled out extensive training to all our store and call centre staff to make this as secure and easy for our customers as possible, together with the development of a digital application process
02Risks and opportunities
• Risks: – Low GDP growth (in South Africa and other
African territories)– Interest rate increases in South Africa put
pressure on credit consumers– Introduction of Affordability Regulations
in South Africa impacted our ability to open new accounts at the same pace as previously
• Opportunities: – Better data analytics in South Africa means
more targeted rewards offers– Card verification value (CVV) card roll-out
in South Africa means better customer protection and reduced fraud risk
– Territories were identified where our brands are still under-represented – continued expansion opportunities in existing and new territories
03Performance indicators
• Number of cash customers in South Africa increased due to more targeted rewards (using better data analytics)
• Number of credit customers relatively stable – growth hampered initially by introduction of Affordability Regulations
• Net bad debt statistic improved:– Slowdown in gross write-offs and operational
improvements in collections’ efforts– Improvement in recoveries yield due to
system changes, which facilitated better management of post write-off recoveries
• Number of stores/space growth:– Increased due to targeted expansion strategy– Phase Eight expanding to new territories
04Focus areas for next year
• Continued online roll-out in South Africa with the launch of Foschini cosmetics, @home furniture, Markham and Fabiani
• Further planned initiatives in our Rewards programme in South Africa
• Greater focus on customer service with continued training provided through our Retail Academy
59
OUR GOVERNANCEPROFILE
SUMMARY CONSOLIDATED FINANCIAL STATEMENTS APPENDICES NOTICE OF ANNUAL
GENERAL MEETING ADMINISTRATION

LEADERSHIP
LEADERSHIPMEDIUM-TERM
TARGETMARCH
2016MARCH
2015 %
CHANGE
Staff turnover – permanent head office employees (%)* 12,0 – 18,0 9,0 7,3 23,3
Employment equity (% representation of previously disadvantaged groups among permanent employees) – South Africa only > 90,0 92,3 91,7 0,7
* March 2015 excluded Phase Eight as it was only acquired in January 2015.
01Factors impacting leadership during the year
• Ongoing succession planning with key senior changes this year:– Appointment of a new Chairman– Additional non-executive director with
international experience– Retirement of two senior executive directors– Appointment of new Chief Financial Officer
• Integration of new businesses/international acquisitions placed additional demands on leadership teams to ensure these businesses are properly integrated into the existing TFG business
We are committed to embedding a performance-based culture that will ensure that we attract and retain the best talent in the industry.
STRATEGIC OBJECTIVES AND TARGETS • The identification and
development of critical and key skills required for the future of our group
• Further development and enhancement of the pay for performance link
BUSINESS IMPERATIVES• Develop and grow diverse
talent to ensure the continuous supply of a capable, competent workforce
• Retain key talent through appropriate recognition and reward
• Prioritise the development of customer-facing employees through enhanced training programmes and performance-based incentives
STRATEGIC INTENT AND POSITIONING STATEMENT
STRATEGY PERFORMANCE REPORT CONTINUED
TFG INTEGRATED ANNUAL REPORT 2016 www.tfglimited.co.za60
INVESTMENT CASE
ABOUTTHIS REPORT
OUR PROFILE
OUR OPERATINGCONTEXT
OUR STRATEGY AND PERFORMANCE

• Ongoing talent development across the business – particularly at senior level where a number of executives attended international development programmes
• Ongoing focus on embedding a performance culture into the business, with individual performance criteria being measured and acting as moderator in the group annual bonus scheme incentive
02Risks and opportunities
• Risks: – Ability to attract and retain desirable talent
addressed through incentives and restraints
• Opportunities: – Unique group structure (multiple brands)
facilitates career opportunities for key talent and ensures succession planning is optimised
– Recent international acquisitions provide further opportunities for talent development
– New talent at senior levels provides an opportunity to bring fresh ideas into the business
03Context to performance indicators
• Head office staff turnover in Africa and internationally remains at similar level to last year – although low, provides opportunity to introduce new talent to the group
• Employment equity remains a focus in South Africa and is at similar levels to last year – Heads of business units are measured on the achievement of employment equity targets
04Focus areas for next year
• Integration of the Whistles business
• Continued senior executive talent development, with further executives earmarked to attend international programmes
• Employment equity and transformation remains a key focus in our group
61
OUR GOVERNANCEPROFILE
SUMMARY CONSOLIDATED FINANCIAL STATEMENTS APPENDICES NOTICE OF ANNUAL
GENERAL MEETING ADMINISTRATION

PROFIT
PROFITMEDIUM-TERM
TARGETMARCH
2016MARCH
2015%
CHANGE
In-house production (Rm) 400 390,0 362,6 7,6
Gross margin (%) 47 – 48 49,7 47,3 5,1
Operating margin (%) 17 – 19 17,0 17,5 (2,9)
01Factors impacting profit during the year
• Non-comparable items that had a positive impact on profit in 2016:– Acquisition of Phase Eight part-way through
2015 means 2016 profits included an additional 10 months of trading for Phase Eight
– 2016 profit improved due to non-recurrence of the once-off costs associated with the Phase Eight acquisition in 2015
• Part of the business is now in foreign currency, serving as a natural hedge against the continued Rand volatility
Our brands will optimise their supply chain capability – including their suppliers, buying process and quick responses – to enhance the customer experience.
STRATEGIC OBJECTIVES AND TARGETS • Lead time, stock turn and
clearance target reporting and focus
• Quick-response initiatives to continue
BUSINESS IMPERATIVES• Improve trading densities
• Manage gross margins
• Enhance quick-response capability through supply chain innovations
• Ensure ongoing focus on cost control
STRATEGIC INTENT AND POSITIONING STATEMENT
STRATEGY PERFORMANCE REPORT CONTINUED
TFG INTEGRATED ANNUAL REPORT 2016 www.tfglimited.co.za62
INVESTMENT CASE
ABOUTTHIS REPORT
OUR PROFILE
OUR OPERATINGCONTEXT
OUR STRATEGY AND PERFORMANCE

• The business achieved a healthy growth in profits:– Turnover growths pleasing despite the
difficult trading environment– Margins were protected– Continued cost control
02Risks and opportunities
• Risks: – The depreciation of the Rand puts pressure
on our input margins
• Opportunities:– Continue to take advantage of new brand
opportunities– Expansion into territories outside Africa
means more diversified business with better risk profile
– Diversified locations across both emerging and developed markets means growth of the business is not solely reliant on South African market dynamics or the UK market and GDP
– Localisation assists in the management of the impact of exchange rate volatility on price inflation
03Context to performance indicators
• Gross margin improved: – Careful management of product inflation
caused by exchange rate volatility by boosting localisation and ongoing international sourcing and supply chain initiatives
– Higher Phase Eight margin (which is now a greater proportion due to the inclusion of an additional 10 months’ trading)
• Operating margin in line with last year and target
04Focus areas for next year
• Continue to roll out new stores and seek out expansion opportunities locally and internationally
• Continue localisation efforts to offer protection from exchange rate volatility
• Continued focus on cost control
• Manage stock levels to ensure it is appropriate to the expansion and turnover growth requirements for each brand
63
OUR GOVERNANCEPROFILE
SUMMARY CONSOLIDATED FINANCIAL STATEMENTS APPENDICES NOTICE OF ANNUAL
GENERAL MEETING ADMINISTRATION
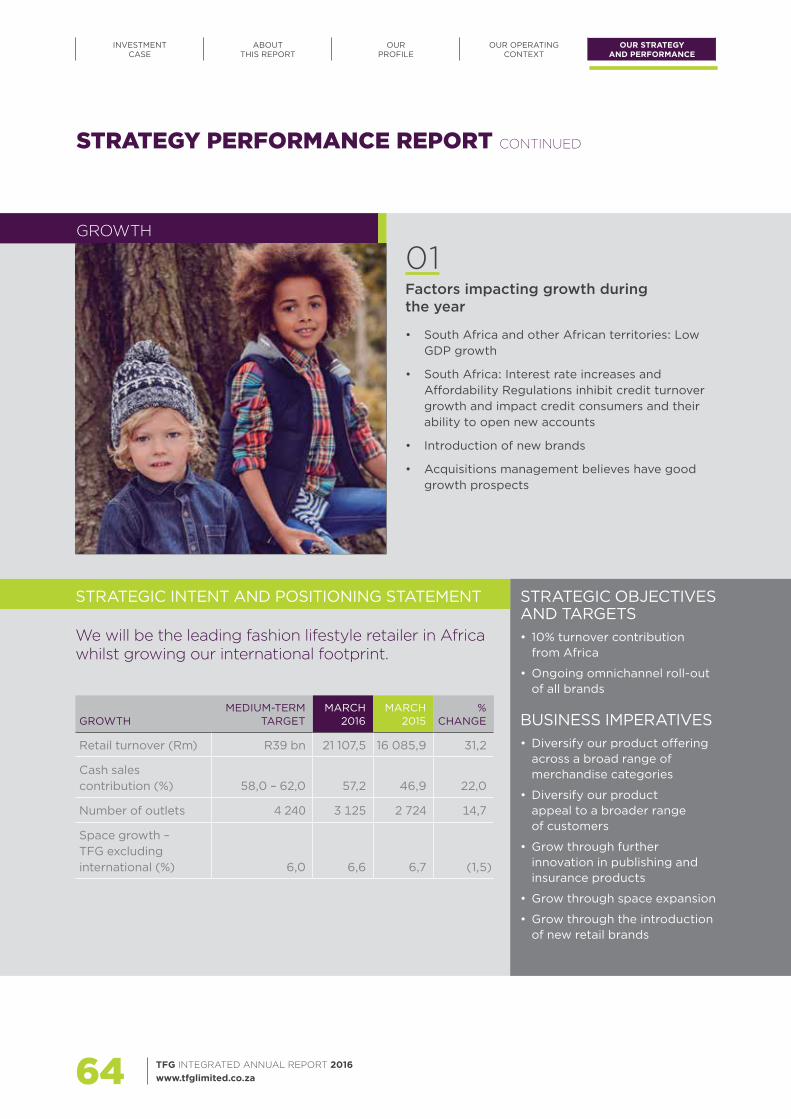
GROWTH
01Factors impacting growth during the year
• South Africa and other African territories: Low GDP growth
• South Africa: Interest rate increases and Affordability Regulations inhibit credit turnover growth and impact credit consumers and their ability to open new accounts
• Introduction of new brands
• Acquisitions management believes have good growth prospects
STRATEGIC OBJECTIVES AND TARGETS • 10% turnover contribution
from Africa
• Ongoing omnichannel roll-out of all brands
BUSINESS IMPERATIVES• Diversify our product offering
across a broad range of merchandise categories
• Diversify our product appeal to a broader range of customers
• Grow through further innovation in publishing and insurance products
• Grow through space expansion
• Grow through the introduction of new retail brands
STRATEGIC INTENT AND POSITIONING STATEMENT
We will be the leading fashion lifestyle retailer in Africa whilst growing our international footprint.
GROWTHMEDIUM-TERM
TARGETMARCH
2016MARCH
2015%
CHANGE
Retail turnover (Rm) R39 bn 21 107,5 16 085,9 31,2
Cash sales contribution (%) 58,0 – 62,0 57,2 46,9 22,0
Number of outlets 4 240 3 125 2 724 14,7
Space growth – TFG excluding international (%) 6,0 6,6 6,7 (1,5)
STRATEGY PERFORMANCE REPORT CONTINUED
TFG INTEGRATED ANNUAL REPORT 2016 www.tfglimited.co.za64
INVESTMENT CASE
ABOUTTHIS REPORT
OUR PROFILE
OUR OPERATINGCONTEXT
OUR STRATEGY AND PERFORMANCE

02Risks and opportunities
• Risks: – International competition:
0 New entrants into South Africa present limited risk as they compete directly with a very small part of our business
0 New entrants require retailers to remain abreast of international retailer trends
– The impact of the Affordability Regulations on new account openings in South Africa
– Local ownership legislation in Africa could hamper expansion plans
• Opportunities: – Continue to open new stores in territories
where we are under-represented – Continue to supplement existing brands
with additional brands we believe are complementary and have good future growth prospects
03Context to performance indicators
• Turnover growth of 31,2% (excluding Phase Eight: 11,6%) – very pleasing despite current trading environment
• Cash sales growth:– Rewards programme focus and Phase Eight
being a cash business resulted in greater proportion of sales being cash based, in line with our stated intention to ensure a more equitable split of cash vs credit to position the business well through the cycles
• Credit sales growth:– In line with expectation given difficult credit
environment
• Number of stores and concessions increased in line with expectation as we continued to roll out existing brands in territories where we are under-represented and new territories globally
• Space growth– In line with management’s expectation and
commensurate with new outlet openings
04Focus areas for next year
• Continue to expand existing brands and seek new brand opportunities
• Continue to seek out opportunities for trading in new territories
• Explore further acquisition opportunities that complement our strategy
• Continue to focus on Rewards programme in South Africa to drive both credit and cash sales
65
OUR GOVERNANCEPROFILE
SUMMARY CONSOLIDATED FINANCIAL STATEMENTS APPENDICES NOTICE OF ANNUAL
GENERAL MEETING ADMINISTRATION
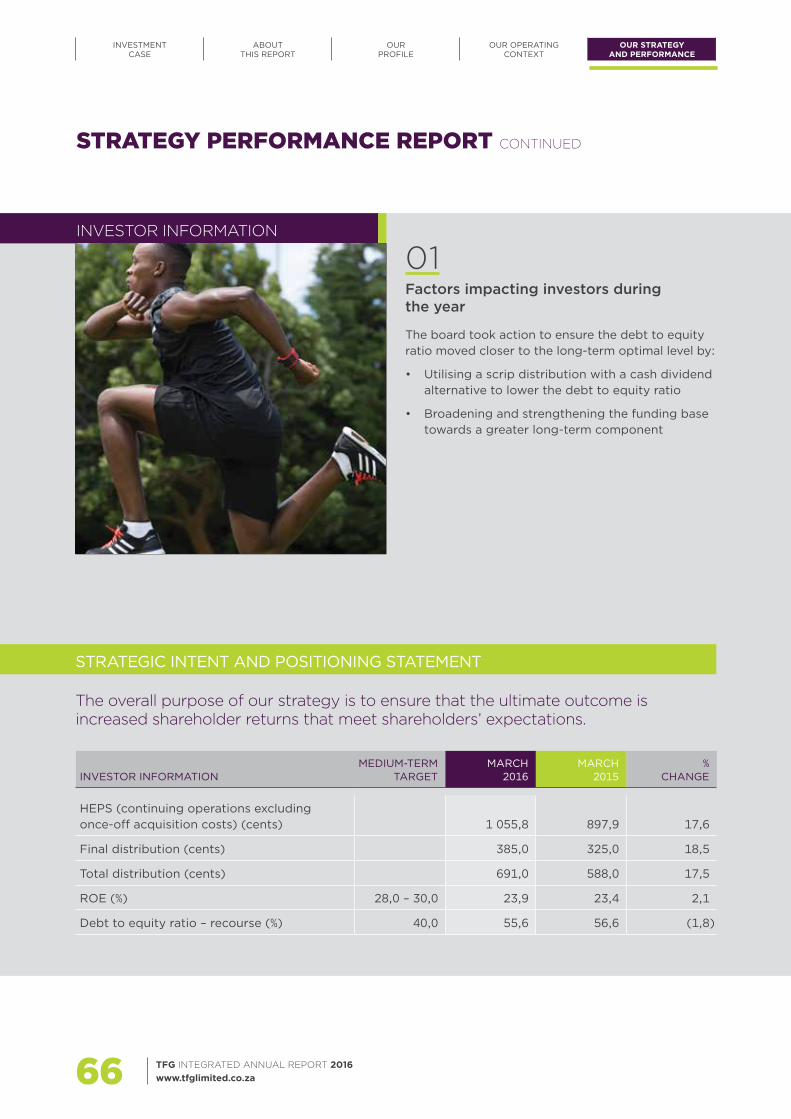
INVESTOR INFORMATION
01Factors impacting investors during the year
The board took action to ensure the debt to equity ratio moved closer to the long-term optimal level by:
• Utilising a scrip distribution with a cash dividend alternative to lower the debt to equity ratio
• Broadening and strengthening the funding base towards a greater long-term component
The overall purpose of our strategy is to ensure that the ultimate outcome is increased shareholder returns that meet shareholders’ expectations.
STRATEGIC INTENT AND POSITIONING STATEMENT
INVESTOR INFORMATIONMEDIUM-TERM
TARGETMARCH
2016MARCH
2015%
CHANGE
HEPS (continuing operations excluding once-off acquisition costs) (cents) 1 055,8 897,9 17,6
Final distribution (cents) 385,0 325,0 18,5
Total distribution (cents) 691,0 588,0 17,5
ROE (%) 28,0 – 30,0 23,9 23,4 2,1
Debt to equity ratio – recourse (%) 40,0 55,6 56,6 (1,8)
STRATEGY PERFORMANCE REPORT CONTINUED
TFG INTEGRATED ANNUAL REPORT 2016 www.tfglimited.co.za66
INVESTMENT CASE
ABOUTTHIS REPORT
OUR PROFILE
OUR OPERATINGCONTEXT
OUR STRATEGY AND PERFORMANCE
02Risks and opportunities
• Risk: – South African equity and debt markets are
subject to volatility as a result of fluctuating exchange rates, rising interest rates, political risk and the threat of a ratings downgrade
• Opportunities:– Further focus on debt mix and optimal capital
allocation and working capital management can improve the debt to equity ratio
03Context to performance indicators
• Recourse debt to equity improved to 55,6% in line with expectation as a result of the decision to offer scrip distributions (with a cash alternative) to bring the ratio closer to the medium-term target of 40%
• Total distribution to shareholders increased by 17,5% for the year in line with continuing HEPS growth, a pleasing return for shareholders
04Focus areas for next year
• Based on shareholder engagement, introduce a secondary performance criteria to our long-term incentive programme – this measurement, ROCE (return on capital employed), will be included in our performance criteria in future
• Continue to engage with shareholders and international investors (we undertook our first international roadshow in 2015)
• Strengthen the balance sheet by increasing the dividend cover to 1,6 times over a period of time – no intention to declare further scrip distributions
67
OUR GOVERNANCEPROFILE
SUMMARY CONSOLIDATED FINANCIAL STATEMENTS APPENDICES NOTICE OF ANNUAL
GENERAL MEETING ADMINISTRATION

STRATEGIC ENABLERS
1 How can our growth help the thousands of people across our value chain improve their lives?
2 Global supply chains remain in focus with issues arising such as ethics, human rights, worker health and safety, fair wage initiatives and environmental management.
3 Nationally, initiatives to support local supply chain development continue to be hampered by policy fragmentation.
4 The increasing number and complexity of compliance-related ESG initiatives places significant demand on the resources of the sustainability team, limiting the time available to drive more transformative and innovative initiatives.
5 South Africans face continued pressure on disposable household income.
01 02 03 04Employee
empowermentResource efficiency
Socio–economic development
Governance, ethics and accountability
In 2014 the group, together with its external advisers, undertook a comprehensive review of its original sustainability strategy, which was formulated in 2011.
During the year under review, we initiated a strategic shift towards shared value, which emphasises the link to the growth and profit drivers of the business strategy.
The shared value strategy prioritises local supply chain development, which enables us to focus on creating shared value – in both financial and social terms – within our core supply chain operations.
The local supply chain focus is supported by four strategic enablers that contribute to the societal value delivered by our operations, namely:
Local fashion retailers continue to face major sustainability challenges such as:
The sustainability reporting framework highlights TFG’s drive to create shared value for its stakeholders, with a sustained focus on addressing and reporting on the material environmental, social and governance (ESG) issues associated with its operations.
For further information on the strategy, progress against our strategic enablers and our future approach, we refer you to our sustainability overview report.
AFRICASUSTAINABILITY
TFG INTEGRATED ANNUAL REPORT 2016 www.tfglimited.co.za68
INVESTMENT CASE
ABOUTTHIS REPORT
OUR PROFILE
OUR OPERATINGCONTEXT
OUR STRATEGY AND PERFORMANCE
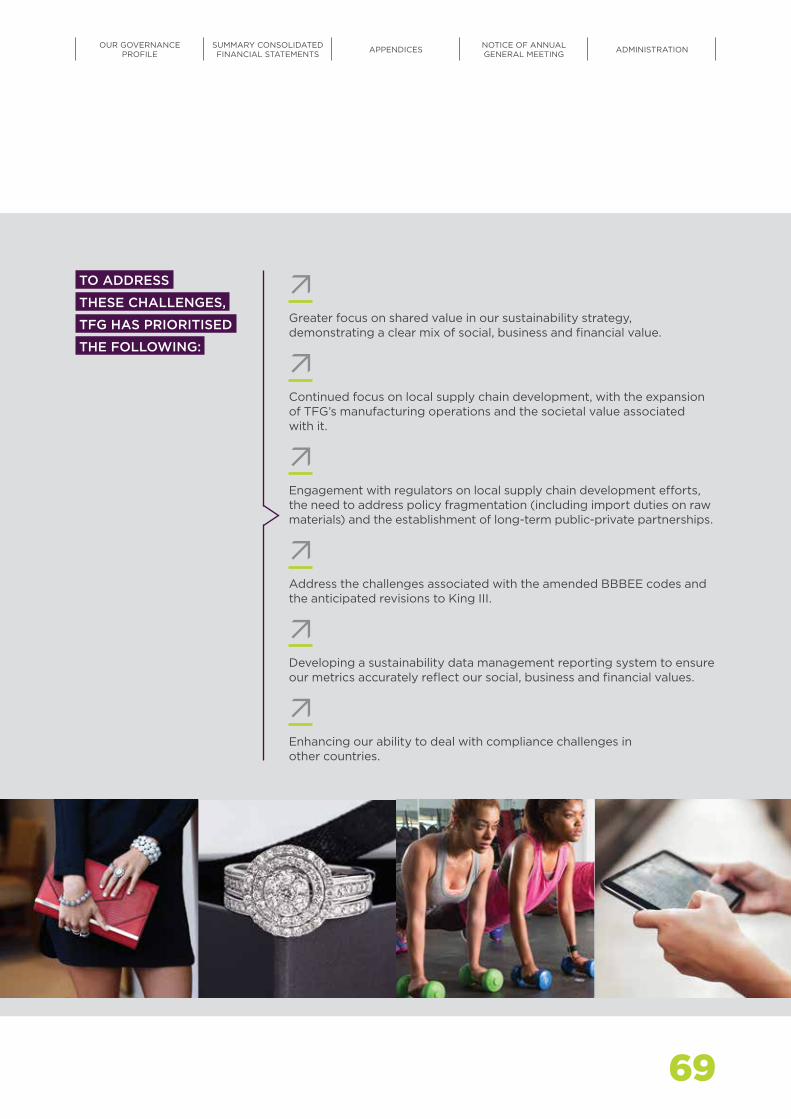
Greater focus on shared value in our sustainability strategy, demonstrating a clear mix of social, business and financial value.
Continued focus on local supply chain development, with the expansion of TFG’s manufacturing operations and the societal value associated with it.
Engagement with regulators on local supply chain development efforts, the need to address policy fragmentation (including import duties on raw materials) and the establishment of long-term public-private partnerships.
Address the challenges associated with the amended BBBEE codes and the anticipated revisions to King III.
Developing a sustainability data management reporting system to ensure our metrics accurately reflect our social, business and financial values.
Enhancing our ability to deal with compliance challenges in other countries.
TO ADDRESS
THESE CHALLENGES,
TFG HAS PRIORITISED
THE FOLLOWING:
69
OUR GOVERNANCEPROFILE
SUMMARY CONSOLIDATED FINANCIAL STATEMENTS APPENDICES NOTICE OF ANNUAL
GENERAL MEETING ADMINISTRATION

10-YEAR STATISTICS
NotesWhen an accounting policy changed, comparative figures were restated in accordance with the new policy.
2013 and prior years were restated where appropriate to reflect the RCS Group as a discontinued operation.
* Operating profit before finance charges excludes the impact of the once-off acquisition costs of the current year Whistles acquisition and the prior year Phase Eight acquisition.
** Adjusted headline earnings is calculated to remove the impact of the once-off acquisition costs of the current year Whistles acquisition and the prior year Phase Eight acquisition.
# Restated, as insurance cells are no longer consolidated and their cash flow is now included in working capital as part of the insurance receivables.
## In 2008, cash balances were restated to include an amount previously set off against interest-bearing debt.
YEARS ENDED 2016 2015 2014 2013 2012 2011 2010 2009 2008 2007
ProfitabilityRetail turnover (Rm) 21 107,5 16 08 5,9 14 159,0 12 896,4 11 630,5 9 936,5 8 605,2 8 089,6 7 668,7 7 230,0Operating profit before finance charges – continuing operations (Rm)* 3 596,1 2 807,1 2 536,9 2 407,3 2 232,6 1 845,1 1 559,3 1 686,4 1 521,5 1 478,5Profit before tax – continuing operations (Rm) 3 021,2 2 286,6 2 375,1 2 298,9 2 156,4 1 775,5 1 485,2 1 573,2 1 515,8 1 459,6Profit attributable to equity holders of The Foschini Group Limited (Rm) 2 155,6 1 858,0 1 859,6 1 792,0 1 582,1 1 301,8 1 085,6 1 145,8 1 128,4 1 119,2Adjusted headline earnings (Rm)** 2 185,2 1 881,9 1 872,3 1 796,6 1 584,2 1 305,6 1 085,6 1 145,8 1 128,4 1 119,2
Statement of financial positionNon-current assets (Rm) 8 448,9 6 925,3 2 120,5 1 883,1 1 623,8 1 353,1 1 380,5 1 363,3 1 284,4 1 204,7Current assets (Rm) 13 646,2 11 608,1 9 351,2 8 425,9 7 281,2 6 156,0 4 949,9 4 608,7 3 982,1 3 755,5Assets of disposal group (Rm) – – 5 631,5 4 985,4 3 912,9 3 164,3 2 883,7 2 679,7 1 897,7 1 823,5Total assets (Rm) 22 095,1 18 533,4 17 103,2 15 294,4 12 817,9 10 673,4 9 214,1 8 651,7 7 164,2 6 783,7
Total shareholders’ interest (Rm) 9 896,7 8 130,9 7 228,6 7 043,8 6 293,1 5 462,9 5 058,3 4 496,3 3 845,2 3 823,6Non-controlling interest (Rm) 4,0 2,7 861,3 705,5 571,1 485,6 427,0 359,2 290,9 181,3 Non-current liabilities (Rm) 5 973,8 4 491,4 2 016,0 1 392,4 1 048,4 1 251,7 1 226,4 1 301,6 1 036,7 1 282,4Current liabilities (Rm) 6 220,6 5 908,4 3 296,1 2 750,3 2 284,8 1 417,3 764,3 769,4 712,1 212,9 Liabilities of disposal group (Rm) – – 3 701,2 3 402,4 2 620,5 2 055,9 1 738,1 1 725,2 1 279,3 1 283,5Total equity and liabilities (Rm) 22 095,1 18 533,4 17 103,2 15 294,4 12 817,9 10 673,4 9 214,1 8 651,7 7 164,2 6 783,7
Cash flow statementCash flows from operating activities – continuing operations (Rm) 461,5 (61,7) 128,2 485,2 (77,9) 190,8 352,0 640,3 (47,8) 492,3 Cash flows from investing activities – continuing operations (Rm) (1 030,5) (1 779,6) (537,5) (557,0) (377,2) (353,9) (264,0) (517,1) (15,6) (98,2)Cash flows from financing activities – continuing operations (Rm) 585,1 2 328,5 339,5 121,4 666,9 179,4 (131,1) (17,2) 20,3 (386,6)Net increase (decrease) in cash (Rm) 16,1 487,2 (69,8) 49,6 211,8 16,3 (43,1) 106,0 (43,1) 7,5 Cash at the beginning of the year (Rm) 800,4 301,3 593,4 504,7# 338,5 284,0 296,2 169,5 202,3## 62,5 Cash at the end of the year – discontinued operations (Rm) – – (222,4) 39,0 160,5 38,2 30,9 20,7 10,3 1,1 Effect of exchange rate fluctuations on cash held (Rm) 72,3 11,9 0,1 0,1 0,1 – – – – –Cash at the end of the year – continuing operations (Rm) 888,8 800,4 301,3 593,4 710,9 338,5 284,0 296,2 169,5 71,1
Performance measures/ratiosTurnover growth (%) 31,2 13,6 9,8 10,9 17,0 15,5 6,4 5,5 6,1 12,4 Same store turnover growth (excluding Phase Eight) (%) 5,7 5,5 4,2 5,8 10,6 10,8 – – 2,2 8,0 Operating margin – continuing operations (%) 17,0 17,5 17,9 18,7 19,2 18,6 18,1 20,8 19,8 20,4 Debt to equity ratio – continuing operations (%) 73,5 76,8 36,8 22,3 20,7 20,1 14,4 20,1 26,5 9,5 Total liabilities to shareholders’ interest (times) 1,2 1,3 1,2 1,1 0,9 0,9 0,7 0,8 0,8 0,7 Total liabilities to shareholders’ interest – continuing operations (times) 1,2 1,3 0,7 0,6 0,5 0,5 0,5 0,6 0,5 0,4 Net retail borrowings (Rm) 7 276,9 6 242,2 2 659,1 1 567,4 726,1 237,6 (169,4) 18,7 253,7 (360,1)Current ratio – continuing operations (times) 2,2 2,0 2,8 3,1 3,2 4,3 6,5 5,9 5,5 17,8 Headline earnings per ordinary share (HEPS) – continuing operations** (cents) 1 055,8 897,9 818,7 780,6 653,9 537,3 440,7 488,8 458,2 438,1 Change in HEPS from continuing operations (%) 17,6 9,7 4,9 19,4 21,7 21,9 (9,8) 6,7 4,6 10,4 Distribution declared per ordinary share (DPS) (cents) 691,0 588,0 536,0 506,0 455,0 350,0 288,0 288,0 288,0 270,0 Tangible net asset value per ordinary share (cents) 2 063,5 1 701,0 3 396,3 3 205,0 2 918,9 2 598,3 2 316,7 2 075,3 1 809,5 1 751,5Market capitalisation (Rm) 30 459,2 38 101,2 23 787,8 25 774,6 29 744,8 20 480,8 16 113,4 10 567,5 9 261,6 16 618,4
StatisticsNumber of ordinary shares in issue (millions) 215,4 211,0 222,0 228,5 240,5 240,5 240,5 240,5 240,5 240,5 Number of ordinary shares on which headline earnings per share is calculated (millions) 207,0 204,3 206,0 209,3 205,2 206,5 208,2 204,8 206,3 209,5 Net number of ordinary shares on which net asset value per share is calculated (millions) 209,3 205,4 204,3 210,1 206,4 205,3 209,0 207,3 204,6 212,0 Closing share price (cents) 14 144 18 057 10 715 11 280 12 368 8 465 6 700 4 394 3 851 6 910Number of outlets 3 125 2 724 2 111 1 979 1 857 1 727 1 627 1 539 1 393 1 332Floor area (excluding Phase Eight) (gross square metres) 735 367 690 190 646 665 609 411 579 365 537 951 505 676 467 420 410 378 380 615
TFG INTEGRATED ANNUAL REPORT 2016 www.tfglimited.co.za70
INVESTMENT CASE
ABOUTTHIS REPORT
OUR PROFILE
OUR OPERATINGCONTEXT
OUR STRATEGY AND PERFORMANCE

NotesWhen an accounting policy changed, comparative figures were restated in accordance with the new policy.
2013 and prior years were restated where appropriate to reflect the RCS Group as a discontinued operation.
* Operating profit before finance charges excludes the impact of the once-off acquisition costs of the current year Whistles acquisition and the prior year Phase Eight acquisition.
** Adjusted headline earnings is calculated to remove the impact of the once-off acquisition costs of the current year Whistles acquisition and the prior year Phase Eight acquisition.
# Restated, as insurance cells are no longer consolidated and their cash flow is now included in working capital as part of the insurance receivables.
## In 2008, cash balances were restated to include an amount previously set off against interest-bearing debt.
YEARS ENDED 2016 2015 2014 2013 2012 2011 2010 2009 2008 2007
ProfitabilityRetail turnover (Rm) 21 107,5 16 08 5,9 14 159,0 12 896,4 11 630,5 9 936,5 8 605,2 8 089,6 7 668,7 7 230,0Operating profit before finance charges – continuing operations (Rm)* 3 596,1 2 807,1 2 536,9 2 407,3 2 232,6 1 845,1 1 559,3 1 686,4 1 521,5 1 478,5Profit before tax – continuing operations (Rm) 3 021,2 2 286,6 2 375,1 2 298,9 2 156,4 1 775,5 1 485,2 1 573,2 1 515,8 1 459,6Profit attributable to equity holders of The Foschini Group Limited (Rm) 2 155,6 1 858,0 1 859,6 1 792,0 1 582,1 1 301,8 1 085,6 1 145,8 1 128,4 1 119,2Adjusted headline earnings (Rm)** 2 185,2 1 881,9 1 872,3 1 796,6 1 584,2 1 305,6 1 085,6 1 145,8 1 128,4 1 119,2
Statement of financial positionNon-current assets (Rm) 8 448,9 6 925,3 2 120,5 1 883,1 1 623,8 1 353,1 1 380,5 1 363,3 1 284,4 1 204,7Current assets (Rm) 13 646,2 11 608,1 9 351,2 8 425,9 7 281,2 6 156,0 4 949,9 4 608,7 3 982,1 3 755,5Assets of disposal group (Rm) – – 5 631,5 4 985,4 3 912,9 3 164,3 2 883,7 2 679,7 1 897,7 1 823,5Total assets (Rm) 22 095,1 18 533,4 17 103,2 15 294,4 12 817,9 10 673,4 9 214,1 8 651,7 7 164,2 6 783,7
Total shareholders’ interest (Rm) 9 896,7 8 130,9 7 228,6 7 043,8 6 293,1 5 462,9 5 058,3 4 496,3 3 845,2 3 823,6Non-controlling interest (Rm) 4,0 2,7 861,3 705,5 571,1 485,6 427,0 359,2 290,9 181,3 Non-current liabilities (Rm) 5 973,8 4 491,4 2 016,0 1 392,4 1 048,4 1 251,7 1 226,4 1 301,6 1 036,7 1 282,4Current liabilities (Rm) 6 220,6 5 908,4 3 296,1 2 750,3 2 284,8 1 417,3 764,3 769,4 712,1 212,9 Liabilities of disposal group (Rm) – – 3 701,2 3 402,4 2 620,5 2 055,9 1 738,1 1 725,2 1 279,3 1 283,5Total equity and liabilities (Rm) 22 095,1 18 533,4 17 103,2 15 294,4 12 817,9 10 673,4 9 214,1 8 651,7 7 164,2 6 783,7
Cash flow statementCash flows from operating activities – continuing operations (Rm) 461,5 (61,7) 128,2 485,2 (77,9) 190,8 352,0 640,3 (47,8) 492,3 Cash flows from investing activities – continuing operations (Rm) (1 030,5) (1 779,6) (537,5) (557,0) (377,2) (353,9) (264,0) (517,1) (15,6) (98,2)Cash flows from financing activities – continuing operations (Rm) 585,1 2 328,5 339,5 121,4 666,9 179,4 (131,1) (17,2) 20,3 (386,6)Net increase (decrease) in cash (Rm) 16,1 487,2 (69,8) 49,6 211,8 16,3 (43,1) 106,0 (43,1) 7,5 Cash at the beginning of the year (Rm) 800,4 301,3 593,4 504,7# 338,5 284,0 296,2 169,5 202,3## 62,5 Cash at the end of the year – discontinued operations (Rm) – – (222,4) 39,0 160,5 38,2 30,9 20,7 10,3 1,1 Effect of exchange rate fluctuations on cash held (Rm) 72,3 11,9 0,1 0,1 0,1 – – – – –Cash at the end of the year – continuing operations (Rm) 888,8 800,4 301,3 593,4 710,9 338,5 284,0 296,2 169,5 71,1
Performance measures/ratiosTurnover growth (%) 31,2 13,6 9,8 10,9 17,0 15,5 6,4 5,5 6,1 12,4 Same store turnover growth (excluding Phase Eight) (%) 5,7 5,5 4,2 5,8 10,6 10,8 – – 2,2 8,0 Operating margin – continuing operations (%) 17,0 17,5 17,9 18,7 19,2 18,6 18,1 20,8 19,8 20,4 Debt to equity ratio – continuing operations (%) 73,5 76,8 36,8 22,3 20,7 20,1 14,4 20,1 26,5 9,5 Total liabilities to shareholders’ interest (times) 1,2 1,3 1,2 1,1 0,9 0,9 0,7 0,8 0,8 0,7 Total liabilities to shareholders’ interest – continuing operations (times) 1,2 1,3 0,7 0,6 0,5 0,5 0,5 0,6 0,5 0,4 Net retail borrowings (Rm) 7 276,9 6 242,2 2 659,1 1 567,4 726,1 237,6 (169,4) 18,7 253,7 (360,1)Current ratio – continuing operations (times) 2,2 2,0 2,8 3,1 3,2 4,3 6,5 5,9 5,5 17,8 Headline earnings per ordinary share (HEPS) – continuing operations** (cents) 1 055,8 897,9 818,7 780,6 653,9 537,3 440,7 488,8 458,2 438,1 Change in HEPS from continuing operations (%) 17,6 9,7 4,9 19,4 21,7 21,9 (9,8) 6,7 4,6 10,4 Distribution declared per ordinary share (DPS) (cents) 691,0 588,0 536,0 506,0 455,0 350,0 288,0 288,0 288,0 270,0 Tangible net asset value per ordinary share (cents) 2 063,5 1 701,0 3 396,3 3 205,0 2 918,9 2 598,3 2 316,7 2 075,3 1 809,5 1 751,5Market capitalisation (Rm) 30 459,2 38 101,2 23 787,8 25 774,6 29 744,8 20 480,8 16 113,4 10 567,5 9 261,6 16 618,4
StatisticsNumber of ordinary shares in issue (millions) 215,4 211,0 222,0 228,5 240,5 240,5 240,5 240,5 240,5 240,5 Number of ordinary shares on which headline earnings per share is calculated (millions) 207,0 204,3 206,0 209,3 205,2 206,5 208,2 204,8 206,3 209,5 Net number of ordinary shares on which net asset value per share is calculated (millions) 209,3 205,4 204,3 210,1 206,4 205,3 209,0 207,3 204,6 212,0 Closing share price (cents) 14 144 18 057 10 715 11 280 12 368 8 465 6 700 4 394 3 851 6 910Number of outlets 3 125 2 724 2 111 1 979 1 857 1 727 1 627 1 539 1 393 1 332Floor area (excluding Phase Eight) (gross square metres) 735 367 690 190 646 665 609 411 579 365 537 951 505 676 467 420 410 378 380 615
71
OUR GOVERNANCEPROFILE
SUMMARY CONSOLIDATED FINANCIAL STATEMENTS APPENDICES NOTICE OF ANNUAL
GENERAL MEETING ADMINISTRATION
PERFORMANCE REVIEW RETAIL OPERATIONS
The performance of TFG this year must be seen against the backdrop of the operating environment and actions taken in respect of strategy execution.
OPERATING ENVIRONMENTWhile some context is given to the operating environment in the operating context section on page 36 of this report, it is again noted that the review of operations should be seen against that backdrop. While the traditional TFG business was previously primarily based in South Africa with a growing African footprint, the geographical reach of the business now extends to many territories outside of the African continent (in developed and emerging market economies).
STRATEGY EXECUTIONAs mentioned in the strategy section on page 57, one of TFG’s four key strategies is growth and strides were made this year through:
• a combination of new store openings of existing brands (in existing territories and in new territories where we have not had a presence previously);
• the launch of a new in-house developed brand in South Africa in the form of SODA Bloc, which caters for the tween market;
• the acquisition of franchise rights for South Africa for the two international brands Colette (ladies accessories brand) and Next (international childrenswear brand); and
• the acquisition of a further international brand Whistles at the end of our 2016 financial year.
In relation to Phase Eight, it is again noted that any comparison of retail operations between 2015 and 2016 should take cognisance of the fact that 2015 includes two months of trading, whereas 2016 includes a full 12 months of trading for Phase Eight.
Furthermore, the acquisition of Phase Eight resulted in the following fundamental changes to the combined business:
• A business that was previously primarily based in South Africa (with a growing African footprint) now reaches across many international territories through the Phase Eight brand (and in future, Whistles).
• As Phase Eight (and in future, Whistles) are cash-based businesses, the overall contribution of cash vs credit turnover of the new combined business will shift over time. It remains TFG’s strategy to achieve an equitable cash vs credit split to provide a more defensive position through the credit cycle.
• The Phase Eight brand gave TFG greater representation in the upper market segment.
• As the reporting currency of the Phase Eight (and in future, Whistles) business is GBP, the business acts as a natural Rand hedge to the South African-based operations.
• Phase Eight’s unique operating model provides significant, low-risk expansion opportunities, which are not capital intensive in nature.
In light of this backdrop, the commentary on the performance of our retail operations for 2016 is as follows:
• As has been indicated in other sections of this report, the group reported good turnover growth of 31,2% this year. Excluding the impact of Phase Eight, the group achieved pleasing turnover growth of 11,6%, with comparable sales growth of 5,7%.
• Cash sales growth was strong at 18,4% (excluding Phase Eight) while credit turnover growth at 5,9% was in line with our expectation in the current economic climate.
• Cash sales now make up 57,2% of total group sales.
TFG INTEGRATED ANNUAL REPORT 2016 www.tfglimited.co.za72
INVESTMENT CASE
ABOUTTHIS REPORT
OUR PROFILE
OUR OPERATINGCONTEXT
OUR STRATEGY AND PERFORMANCE

0%
5%
10%
15%
20%
25%
30%
35%
Growth incl. Phase Eight
Growth excl. Phase Eight
Comparable turnover growthexcl. Phase Eight
2016201520142013201220112010200920082007
12,6%compound growth –
total turnover
10,5%compound
growth –turnover excl.
Phase Eight
5,3%average
comparableturnover
8,0%
12,4%
13,6%
31,2%
6,1%5,5%
6,4%
15,5%
17,0%
10,9%9,8%
10,8%11,6%
2,2% 0,0%
10,8% 10,6%
5,8%
4,2%
5,5% 5,7%
0,0%
10-YEAR TURNOVER GROWTH
MERCHANDISE CATEGORIESOur turnover growth in the various merchandise categories is as follows:
% TURNOVER GROWTH
(EXCLUDING PHASE EIGHT)
% SAME STORE TURNOVER
GROWTH (EXCLUDING
PHASE EIGHT)
% TURNOVERGROWTH
(INCLUDING PHASE EIGHT)
Clothing 13,0 6,9 41,8
Jewellery 7,0 3,4 7,0
Cellphones 7,4 3,5 7,4
Homeware and furniture 11,7 3,1 11,7
Cosmetics 9,2 6,6 9,2
73
OUR GOVERNANCEPROFILE
SUMMARY CONSOLIDATED FINANCIAL STATEMENTS APPENDICES NOTICE OF ANNUAL
GENERAL MEETING ADMINISTRATION
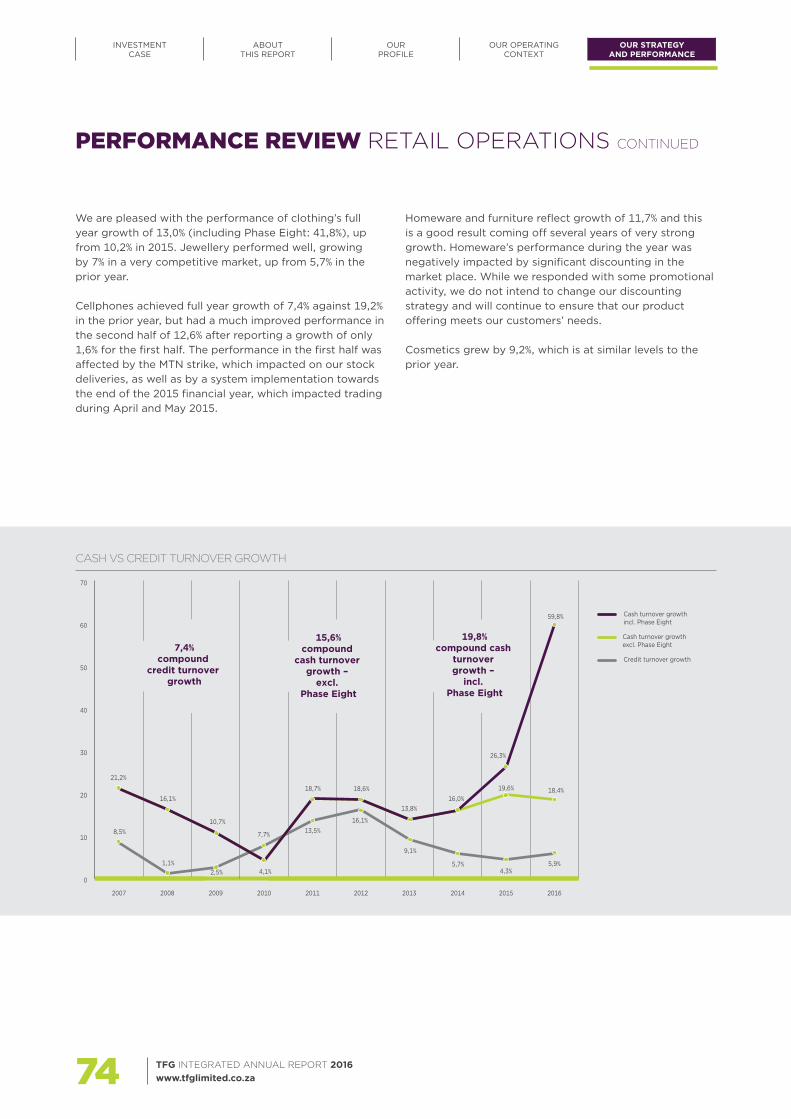
We are pleased with the performance of clothing’s full year growth of 13,0% (including Phase Eight: 41,8%), up from 10,2% in 2015. Jewellery performed well, growing by 7% in a very competitive market, up from 5,7% in the prior year.
Cellphones achieved full year growth of 7,4% against 19,2% in the prior year, but had a much improved performance in the second half of 12,6% after reporting a growth of only 1,6% for the first half. The performance in the first half was affected by the MTN strike, which impacted on our stock deliveries, as well as by a system implementation towards the end of the 2015 financial year, which impacted trading during April and May 2015.
Homeware and furniture reflect growth of 11,7% and this is a good result coming off several years of very strong growth. Homeware’s performance during the year was negatively impacted by significant discounting in the market place. While we responded with some promotional activity, we do not intend to change our discounting strategy and will continue to ensure that our product offering meets our customers’ needs.
Cosmetics grew by 9,2%, which is at similar levels to the prior year.
0
10
20
30
40
50
60
70
Cash turnover growth incl. Phase Eight
Cash turnover growth excl. Phase Eight
Credit turnover growth
2016201520142013201220112010200920082007
7,4%compound
credit turnover growth
15,6%compound
cash turnover growth –
excl. Phase Eight
19,8%compound cash
turnover growth –
incl. Phase Eight
8,5%
21,2%
26,3%
59,8%
16,1%
10,7%
7,7%
13,8%16,0%
19,6% 18,4%
1,1%4,1%
13,5%
18,7% 18,6%
16,1%
9,1%
5,7%4,3%
5,9%2,5%
CASH VS CREDIT TURNOVER GROWTH
PERFORMANCE REVIEW RETAIL OPERATIONS CONTINUED
TFG INTEGRATED ANNUAL REPORT 2016 www.tfglimited.co.za74
INVESTMENT CASE
ABOUTTHIS REPORT
OUR PROFILE
OUR OPERATINGCONTEXT
OUR STRATEGY AND PERFORMANCE
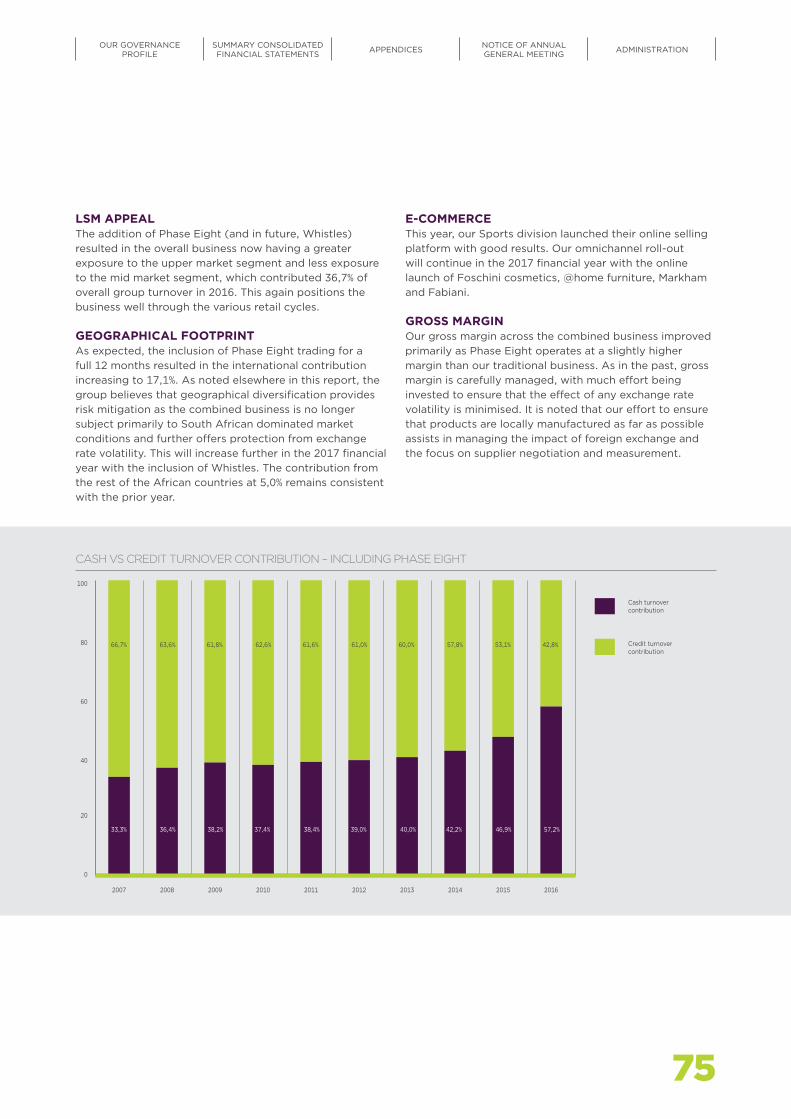
0
20
40
60
80
100
Credit turnover contribution
Cash turnover contribution
2016201520142013201220112010200920082007
33,3%
66,7% 53,1% 42,8%63,6% 61,8% 62,6% 61,6% 61,0% 60,0% 57,8%
36,4% 37,4% 38,4% 39,0% 40,0% 42,2% 46,9% 57,2%38,2%
CASH VS CREDIT TURNOVER CONTRIBUTION – INCLUDING PHASE EIGHT
LSM APPEALThe addition of Phase Eight (and in future, Whistles) resulted in the overall business now having a greater exposure to the upper market segment and less exposure to the mid market segment, which contributed 36,7% of overall group turnover in 2016. This again positions the business well through the various retail cycles.
GEOGRAPHICAL FOOTPRINTAs expected, the inclusion of Phase Eight trading for a full 12 months resulted in the international contribution increasing to 17,1%. As noted elsewhere in this report, the group believes that geographical diversification provides risk mitigation as the combined business is no longer subject primarily to South African dominated market conditions and further offers protection from exchange rate volatility. This will increase further in the 2017 financial year with the inclusion of Whistles. The contribution from the rest of the African countries at 5,0% remains consistent with the prior year.
E-COMMERCEThis year, our Sports division launched their online selling platform with good results. Our omnichannel roll-out will continue in the 2017 financial year with the online launch of Foschini cosmetics, @home furniture, Markham and Fabiani.
GROSS MARGINOur gross margin across the combined business improved primarily as Phase Eight operates at a slightly higher margin than our traditional business. As in the past, gross margin is carefully managed, with much effort being invested to ensure that the effect of any exchange rate volatility is minimised. It is noted that our effort to ensure that products are locally manufactured as far as possible assists in managing the impact of foreign exchange and the focus on supplier negotiation and measurement.
75
OUR GOVERNANCEPROFILE
SUMMARY CONSOLIDATED FINANCIAL STATEMENTS APPENDICES NOTICE OF ANNUAL
GENERAL MEETING ADMINISTRATION

CLOTHING
CELLPHONES
JEWELLERY
HOMEWARE AND FURNITURE
COSMETICS
TURNOVER BY MERCHANDISE CATEGORY CONTRIBUTION
20167,0%
7,9%
6,4%5,2%
73,5%
2016
UPPER MARKET
MID MARKET
MID TO UPPER MARKET
VALUE MARKET
TURNOVER BY LSM CATEGORY CONTRIBUTION
201636,7%
12,5%
26,0%
24,8%
2016
South Africa
International*
Rest of Africa
TURNOVER BY GEOGRAPHIC SEGMENT CONTRIBUTION
2016
5,0%
17,1%
77,9%
2016
CLOTHING
CELLPHONES
JEWELLERY
HOMEWARE AND FURNITURE
COSMETICS
TURNOVER BY MERCHANDISE CATEGORY CONTRIBUTION
20159,1%
9,7%
7,5%
6,2%
67,5%2015
UPPER MARKET
MID MARKET
MID TO UPPER MARKET
VALUE MARKET
TURNOVER BY LSM CATEGORY CONTRIBUTION
2015
45,4%
14,4% 12,6%
27,6%2015
TURNOVER BY GEOGRAPHIC SEGMENT CONTRIBUTION
2015
5,6%2,5%
91,9%
South Africa
International*
Rest of Africa
2015
TURNOVER BY MERCHANDISE CATEGORY CONTRIBUTION
TURNOVER BY LSM CATEGORY CONTRIBUTION
TURNOVER BY GEOGRAPHIC SEGMENT CONTRIBUTION
* International turnover for 2015 represents two months since the acquisition of Phase Eight (February – March 2015).
PERFORMANCE REVIEW RETAIL OPERATIONS CONTINUED
TFG INTEGRATED ANNUAL REPORT 2016 www.tfglimited.co.za76
INVESTMENT CASE
ABOUTTHIS REPORT
OUR PROFILE
OUR OPERATINGCONTEXT
OUR STRATEGY AND PERFORMANCE

77
OUR GOVERNANCEPROFILE
SUMMARY CONSOLIDATED FINANCIAL STATEMENTS APPENDICES NOTICE OF ANNUAL
GENERAL MEETING ADMINISTRATION

The credit environment remained challenging during the year under review. Significant changes to credit legislation were implemented during the course of the year, the most impactful being the implementation of the Affordability Regulations along with the practical complexity of proof of income requirements from a customer perspective. This necessitated major IT changes, a complete redesign of business processes, and a comprehensive training exercise that encompasses stores across the whole of South Africa. This is on top of a difficult macroeconomic environment where recent interest rate increases, higher levels of unemployment and inflationary impacts led to reduced disposable income and increased pressure on credit consumers.
Notwithstanding these pressures, consistent, deliberate and prudent risk management strategies, coupled with operational improvements in collections efforts, led to further positive movements in most key metrics and numbers, including bad debts.
Process refinement and workforce optimisation resulted in improvements in customer service measures, with reductions in average query handling times, abandonment rates and customer response rates.
CREDIT HIGHLIGHTS
PERFORMANCE OVERVIEW
CREDIT PERFORMANCE
The growth of interest income of 12,9% (2015: 18,3%) is reflective of a net book growth of 8,0% and interest rate increases during the course of the year. During the year, the average nominal rate in South Africa increased to 23,3% (2015: 22,5%), following repo rate increases in July 2015 (25 bps), November 2015 (25 bps), January 2016 (50 bps) and March 2016 (25 bps). The interest yield on the portfolio increased from 19,4% to 20,4%.
Net bad debt contracted by 7,4% (2015: +9,4%), which is a very pleasing result. This is due to a continued slowdown in the growth of gross write-offs and significant improvements in yields from post write-off recoveries. The investment in the prior financial year in a new recovery system and related processes enabled significant improvements in the agility and ability of data-driven strategies that were deployed this year.
Write-off, provisioning and re-age/restructure policies remain consistent with prior years. The ratio of overdue values to the book improved to 14,0% (2015: 14,6%).
Credit costs increased by 10,2% (2015: 19,2%), reflecting our continued efforts in running an optimised workforce, which is right-sized for our business needs, and our strategic investment in key capabilities. During the course of the year, and as part of our fraud prevention strategies, we rolled out new card verification value (CVV) cards to our entire credit base. This had the effect of reducing the value of our disputed fraud transactions by 67,3%. We also continued to invest in the evolution of our group analytics team to employ data analytics to optimise commercial decisions across the group.
PERFORMANCE REVIEW CREDIT
INTEREST INCOME
R1 510,7m(2015: R1 337,7m)
12,9% CHANGE
NET BAD DEBT
R947,7m(2015: R1 023,6m)
(7,4%) CHANGE
CREDIT COST
R242,9m(2015: R220,4m)
10,2% CHANGE
PROFIT BEFORE TAX
R320,1m(2015: R 93,7m)
241,6% CHANGE
AFRICA
TFG INTEGRATED ANNUAL REPORT 2016 www.tfglimited.co.za78
INVESTMENT CASE
ABOUTTHIS REPORT
OUR PROFILE
OUR OPERATINGCONTEXT
OUR STRATEGY AND PERFORMANCE

Key credit statistics 2016 2015 /
Number of active accounts (’000) 2 560,7 2 677,5
Credit sales as a percentage of total retail sales (excluding Phase Eight) 51,7 54,4
Net debtors’ book (Rm) 6 695,0 6 199,9
Overdue value as a percentage of debtors’ book (%) 14,0 14,6
Net bad debt write-off as a percentage of credit transactions (%) 8,0 8,0
Net bad debt write-off as a percentage of debtors’ book (%) 13,4 13,6
Doubtful debts provision as a percentage of debtors’ book (%) 13,2 13,6
Provision value (Rm) 1 015,0 976,3
Percentage able to purchase (%) 81,0 80,9
01Ease of opening new accounts, given the Affordability Regulations, remains a focus for the forthcoming financial year. In order to continuously improve our customer experience, we have expedited the deployment of our digital application channel, which enables customers to apply for an account online. This approach is aimed at improving the quality of application data submitted while reducing the turnaround time to respond to customers.
02Given the improvement in our collection and recoveries results, and enhancements in our ability to employ data and analytics when opening new accounts, we will look to test changes in our account acquisition strategies. In addition, we will focus on process efficiencies related to the opening of new accounts, leverage internal customer bases and focus on digital acquisition initiatives. This will enable us to continue to grow our credit sales in a responsible and sustainable manner.
03The advancement of credit rewards remains a key focus and we will continue to test various initiatives in this space. A number of ideas have been implemented during the financial year and we continue to actively monitor and evaluate these results to determine the optimal approach.
04Investment in group analytics remains a focus to assist the credit division and to provide analytics to drive our vision of being the leading fashion retailer in Africa whilst growing our international footprint through becoming a more customer-centric omnichannel retailer.
New regulations prescribing the affordability assessment that has to be undertaken when a consumer applies for credit were introduced by the Department of Trade and Industry (dti) and were effective from 13 September 2015 (the Regulations). These Regulations required all credit providers to undertake prescribed affordability assessments by, among others, verifying an applicant’s income by means of three months’ worth of payslips, bank statements or other acceptable proof of income, which had to be provided by the consumer at the time of opening the account.
These new requirements had a significant impact on the business and contributed to a drop in new account openings from 13 September 2015. The population most affected was consumers informally employed who could not readily provide acceptable proof of income (as per the Regulations) and were, as a consequence, denied credit.
As a result, the overall active account base contracted slightly, down by 4,4%. In spite of this contraction and a consistent risk appetite, credit sales increased by 5,9% (2015: 4,3%) over the financial year.
FUTURE FOCUS
79
OUR GOVERNANCEPROFILE
SUMMARY CONSOLIDATED FINANCIAL STATEMENTS APPENDICES NOTICE OF ANNUAL
GENERAL MEETING ADMINISTRATION
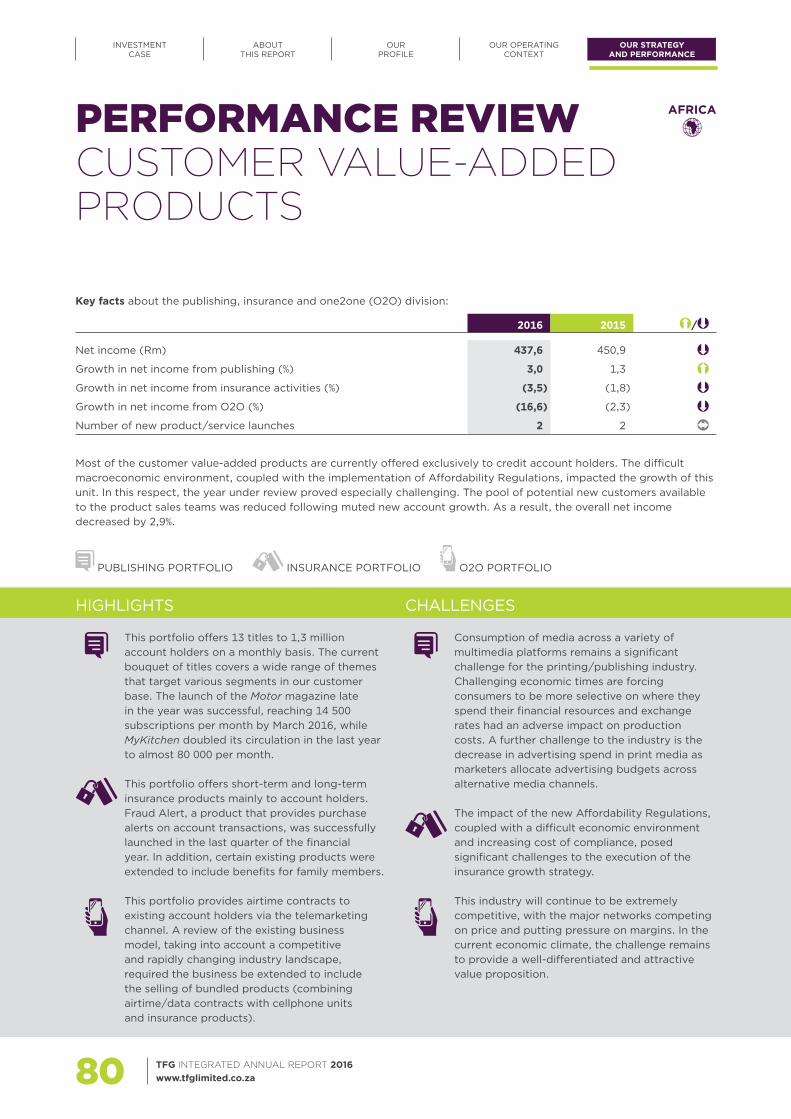
PERFORMANCE REVIEW CUSTOMER VALUE-ADDED PRODUCTS
Key facts about the publishing, insurance and one2one (O2O) division:
2016 2015 /
Net income (Rm) 437,6 450,9
Growth in net income from publishing (%) 3,0 1,3
Growth in net income from insurance activities (%) (3,5) (1,8)
Growth in net income from O2O (%) (16,6) (2,3)
Number of new product/service launches 2 2
Most of the customer value-added products are currently offered exclusively to credit account holders. The difficult macroeconomic environment, coupled with the implementation of Affordability Regulations, impacted the growth of this unit. In this respect, the year under review proved especially challenging. The pool of potential new customers available to the product sales teams was reduced following muted new account growth. As a result, the overall net income decreased by 2,9%.
This portfolio offers 13 titles to 1,3 million account holders on a monthly basis. The current bouquet of titles covers a wide range of themes that target various segments in our customer base. The launch of the Motor magazine late in the year was successful, reaching 14 500 subscriptions per month by March 2016, while MyKitchen doubled its circulation in the last year to almost 80 000 per month.
This portfolio offers short-term and long-term insurance products mainly to account holders. Fraud Alert, a product that provides purchase alerts on account transactions, was successfully launched in the last quarter of the financial year. In addition, certain existing products were extended to include benefits for family members.
This portfolio provides airtime contracts to existing account holders via the telemarketing channel. A review of the existing business model, taking into account a competitive and rapidly changing industry landscape, required the business be extended to include the selling of bundled products (combining airtime/data contracts with cellphone units and insurance products).
Consumption of media across a variety of multimedia platforms remains a significant challenge for the printing/publishing industry. Challenging economic times are forcing consumers to be more selective on where they spend their financial resources and exchange rates had an adverse impact on production costs. A further challenge to the industry is the decrease in advertising spend in print media as marketers allocate advertising budgets across alternative media channels.
The impact of the new Affordability Regulations, coupled with a difficult economic environment and increasing cost of compliance, posed significant challenges to the execution of the insurance growth strategy.
This industry will continue to be extremely competitive, with the major networks competing on price and putting pressure on margins. In the current economic climate, the challenge remains to provide a well-differentiated and attractive value proposition.
PUBLISHING PORTFOLIO INSURANCE PORTFOLIO O2O PORTFOLIO
HIGHLIGHTS CHALLENGES
AFRICA
TFG INTEGRATED ANNUAL REPORT 2016 www.tfglimited.co.za80
INVESTMENT CASE
ABOUTTHIS REPORT
OUR PROFILE
OUR OPERATINGCONTEXT
OUR STRATEGY AND PERFORMANCE

In spite of the aforementioned industry
conditions, the TFG publishing portfolio achieved a growth of 3% in net income. The business continues to retain its position as the market leader in the custom title space. Nine of the group’s 13 publications have the highest circulation in their respective categories. The total average monthly billed circulation of all publishing titles is 1,7 million.
Continued product innovation largely mitigated the challenging market conditions, resulting in a decline of 3,5% in net income.
Net income reduced by 16,6% as a result of pressure on margins and competitive industry pricing. Nevertheless, the business feels confident that the re-engineered business model will result in a greater contribution.
The focus will be on penetrating the cash market space and continuing the launch of magazine titles into the niche markets of our credit customer base. Furthermore, the strategy will evolve the current business model, with specific emphasis on playing a more inclusive role across a variety of multimedia platforms.
The focus for insurance will be on penetrating the cash market. The business also recognises the potential of a more pronounced store presence and strategies are being developed in this regard.
The bundled options previously mentioned will create further demand in our account base. A further strategy is to extend the sales channels into the TFG store environment.
PERFORMANCE FUTURE FOCUS
81
OUR GOVERNANCEPROFILE
SUMMARY CONSOLIDATED FINANCIAL STATEMENTS APPENDICES NOTICE OF ANNUAL
GENERAL MEETING ADMINISTRATION

OUR GOVERNANCE PROFILE
Board of directors 84
Operating board 88
Our governance profile 90
Board audit committee report 98
Social and ethics committee report 104
Nomination committee report 109
Risk report 111
Remuneration report 114
82 TFG INTEGRATED ANNUAL REPORT 2016 www.tfglimited.co.za

83
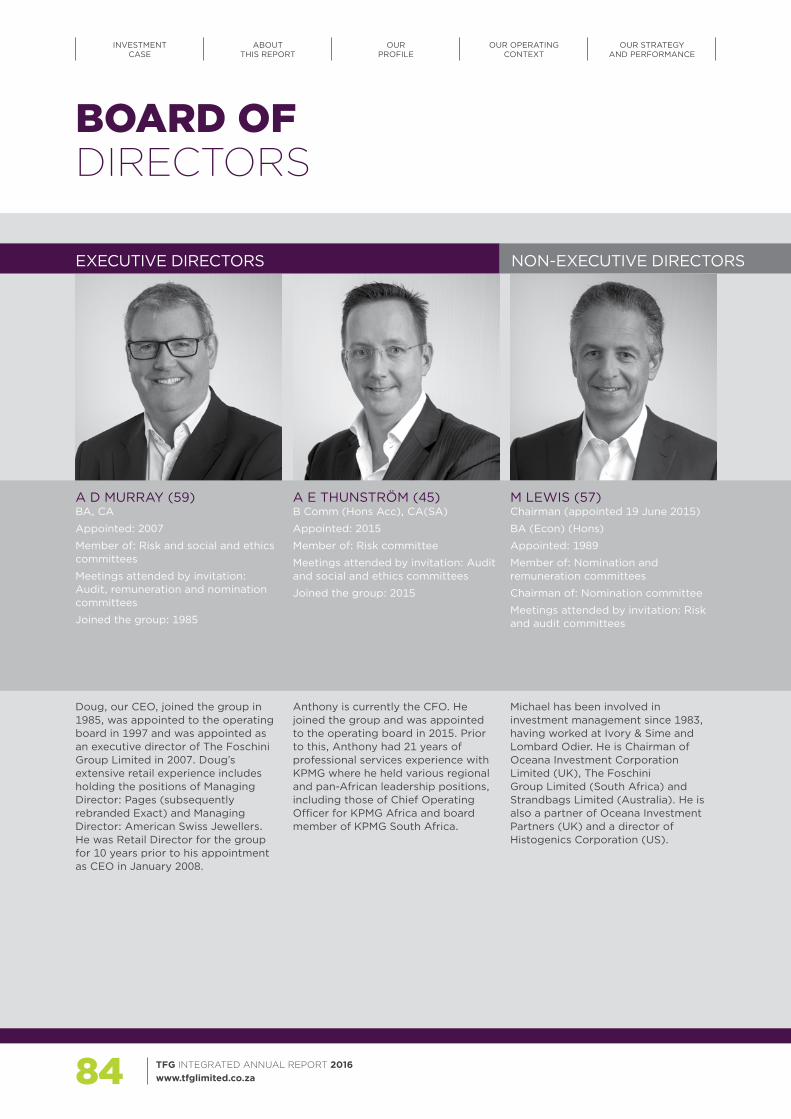
BOARD OFDIRECTORS
Doug, our CEO, joined the group in 1985, was appointed to the operating board in 1997 and was appointed as an executive director of The Foschini Group Limited in 2007. Doug’s extensive retail experience includes holding the positions of Managing Director: Pages (subsequently rebranded Exact) and Managing Director: American Swiss Jewellers. He was Retail Director for the group for 10 years prior to his appointment as CEO in January 2008.
Anthony is currently the CFO. He joined the group and was appointed to the operating board in 2015. Prior to this, Anthony had 21 years of professional services experience with KPMG where he held various regional and pan-African leadership positions, including those of Chief Operating Officer for KPMG Africa and board member of KPMG South Africa.
Michael has been involved in investment management since 1983, having worked at Ivory & Sime and Lombard Odier. He is Chairman of Oceana Investment Corporation Limited (UK), The Foschini Group Limited (South Africa) and Strandbags Limited (Australia). He is also a partner of Oceana Investment Partners (UK) and a director of Histogenics Corporation (US).
EXECUTIVE DIRECTORS NON-EXECUTIVE DIRECTORSNON-EXECUTIVE DIRECTORS
A D MURRAY (59)BA, CA
Appointed: 2007
Member of: Risk and social and ethics committees
Meetings attended by invitation: Audit, remuneration and nomination committees
Joined the group: 1985
A E THUNSTRÖM (45)B Comm (Hons Acc), CA(SA)
Appointed: 2015
Member of: Risk committee
Meetings attended by invitation: Audit and social and ethics committees
Joined the group: 2015
M LEWIS (57) Chairman (appointed 19 June 2015)
BA (Econ) (Hons)
Appointed: 1989
Member of: Nomination and remuneration committees
Chairman of: Nomination committee
Meetings attended by invitation: Risk and audit committees
TFG INTEGRATED ANNUAL REPORT 2016 www.tfglimited.co.za84
INVESTMENT CASE
ABOUTTHIS REPORT
OUR PROFILE
OUR OPERATINGCONTEXT
OUR STRATEGY AND PERFORMANCE
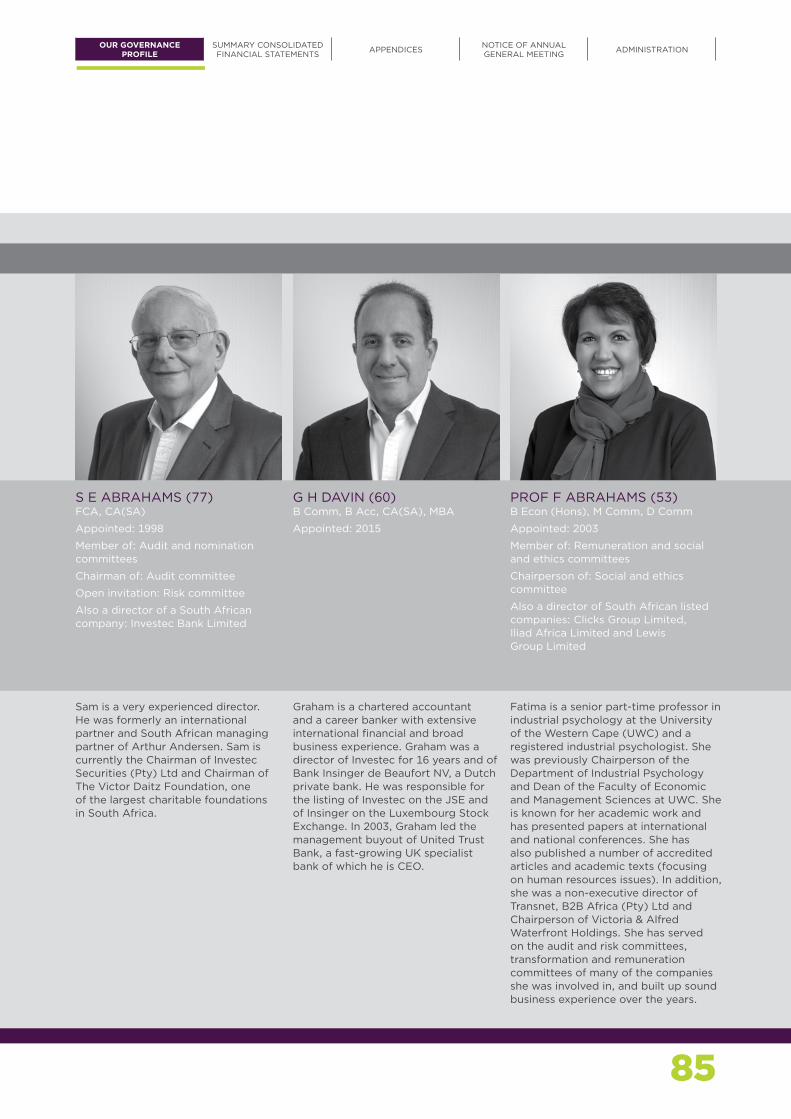
Sam is a very experienced director. He was formerly an international partner and South African managing partner of Arthur Andersen. Sam is currently the Chairman of Investec Securities (Pty) Ltd and Chairman of The Victor Daitz Foundation, one of the largest charitable foundations in South Africa.
Graham is a chartered accountant and a career banker with extensive international financial and broad business experience. Graham was a director of Investec for 16 years and of Bank Insinger de Beaufort NV, a Dutch private bank. He was responsible for the listing of Investec on the JSE and of Insinger on the Luxembourg Stock Exchange. In 2003, Graham led the management buyout of United Trust Bank, a fast-growing UK specialist bank of which he is CEO.
Fatima is a senior part-time professor in industrial psychology at the University of the Western Cape (UWC) and a registered industrial psychologist. She was previously Chairperson of the Department of Industrial Psychology and Dean of the Faculty of Economic and Management Sciences at UWC. She is known for her academic work and has presented papers at international and national conferences. She has also published a number of accredited articles and academic texts (focusing on human resources issues). In addition, she was a non-executive director of Transnet, B2B Africa (Pty) Ltd and Chairperson of Victoria & Alfred Waterfront Holdings. She has served on the audit and risk committees, transformation and remuneration committees of many of the companies she was involved in, and built up sound business experience over the years.
S E ABRAHAMS (77) FCA, CA(SA)
Appointed: 1998
Member of: Audit and nomination committees
Chairman of: Audit committee
Open invitation: Risk committee
Also a director of a South African company: Investec Bank Limited
G H DAVIN (60)B Comm, B Acc, CA(SA), MBA
Appointed: 2015
PROF F ABRAHAMS (53) B Econ (Hons), M Comm, D Comm
Appointed: 2003
Member of: Remuneration and social and ethics committees
Chairperson of: Social and ethics committee
Also a director of South African listed companies: Clicks Group Limited, Iliad Africa Limited and Lewis Group Limited
85
OUR GOVERNANCEPROFILE
SUMMARY CONSOLIDATED FINANCIAL STATEMENTS APPENDICES NOTICE OF ANNUAL
GENERAL MEETING ADMINISTRATION

NON-EXECUTIVE DIRECTORS
D FRIEDLAND (63) B Comm, Certificate in the Theory of Accountancy, CA(SA)
Appointed: 2013
Member of: Remuneration, audit and risk committees
Also a director of South African listed companies: Pick ’n Pay Stores Limited and Investec Limited
Also a director of a foreign listed company: Investec PLC
E OBLOWITZ (58) B Comm, CA(SA), CPA(Isr)
Appointed: 2010
Member of: Audit, remuneration and risk committees
Chairperson of: Remuneration and risk committees
Also a director of a South African listed company: Trencor Limited
B L M MAKGABO-FISKERSTRAND (42) Appointed: 2012
Member of: Audit and social and ethics committees
Also a director of a South African listed company: Sun International Limited
David is a chartered accountant with extensive audit experience of a broad range of retail listed companies. He served as international partner at Arthur Andersen from 1990 and was a partner at KPMG from 2002. David was Head of Audit and Risk at KPMG (Cape Town) and was the lead audit partner for several listed companies. In 2013, he retired as a partner at KPMG and was appointed to the boards of Investec Limited and Investec PLC in March 2013, serving as the group audit committee Chairman.
Eddy has considerable audit and business advisory experience, having spent 21 years in professional practice, most notably as a senior partner of the Cape Town, Durban and Port Elizabeth offices of Arthur Andersen. In addition, he served as a member of the firm’s worldwide Retail and Distribution Industry Team. He is currently the Executive Chairman of Stonehage Fleming South Africa, which provides multifamily office, wealth management and advisory services to an extensive local and international client base.
Tumi is founder and executive director of AfricaWorldwide Media and director of Tumi Makgabo Enterprises, focusing on enterprise development in South Africa and across the African continent. In addition, Tumi served for two years as the Vice Chairperson of the World Economic Forum’s Global Agenda Council for Women’s Empowerment and as a member of its Council on Africa. In 2008, she was nominated to the World Economic Forum’s Forum of Young Global Leaders, which is a multistakeholder community of exceptional leaders below the age of 40 selected from around the world. She also serves as a non-executive director of South African Tourism and was appointed a member of the Department of Arts and Culture’s reference group for Africa Month in 2015.
BOARD OF DIRECTORS CONTINUED
TFG INTEGRATED ANNUAL REPORT 2016 www.tfglimited.co.za86
INVESTMENT CASE
ABOUTTHIS REPORT
OUR PROFILE
OUR OPERATINGCONTEXT
OUR STRATEGY AND PERFORMANCE
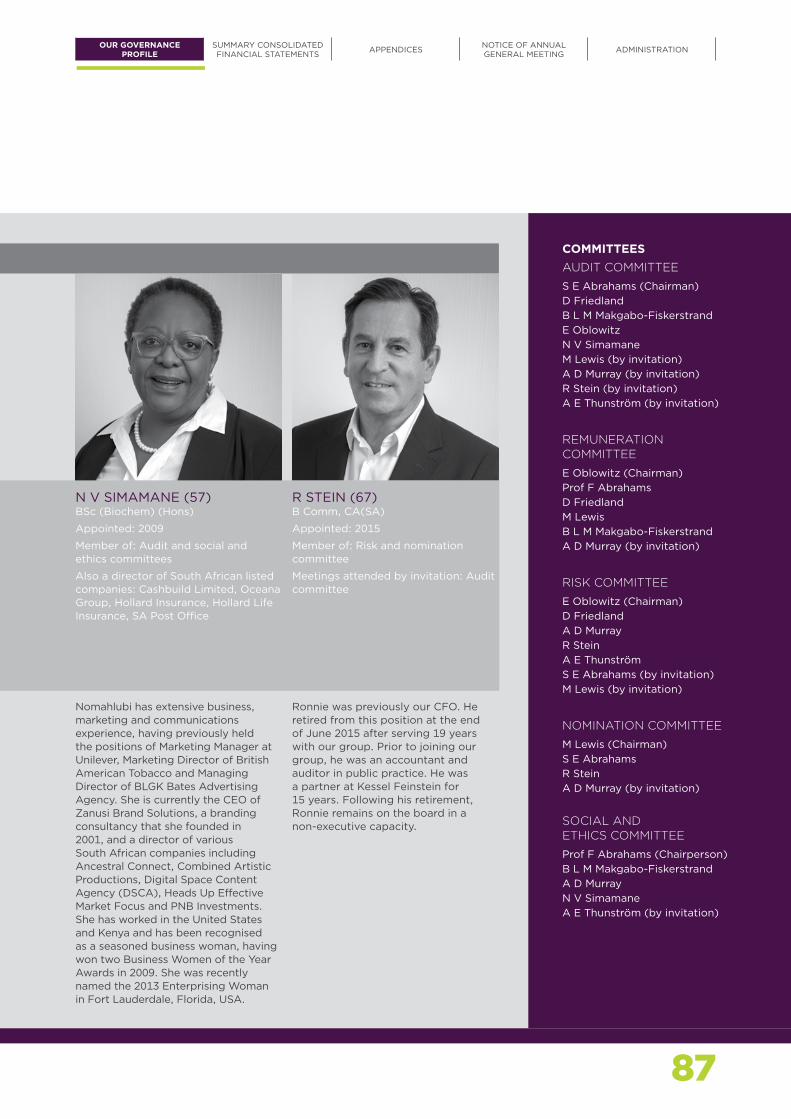
N V SIMAMANE (57)BSc (Biochem) (Hons)
Appointed: 2009
Member of: Audit and social and ethics committees
Also a director of South African listed companies: Cashbuild Limited, Oceana Group, Hollard Insurance, Hollard Life Insurance, SA Post Office
R STEIN (67)B Comm, CA(SA)
Appointed: 2015
Member of: Risk and nomination committee
Meetings attended by invitation: Audit committee
Nomahlubi has extensive business, marketing and communications experience, having previously held the positions of Marketing Manager at Unilever, Marketing Director of British American Tobacco and Managing Director of BLGK Bates Advertising Agency. She is currently the CEO of Zanusi Brand Solutions, a branding consultancy that she founded in 2001, and a director of various South African companies including Ancestral Connect, Combined Artistic Productions, Digital Space Content Agency (DSCA), Heads Up Effective Market Focus and PNB Investments. She has worked in the United States and Kenya and has been recognised as a seasoned business woman, having won two Business Women of the Year Awards in 2009. She was recently named the 2013 Enterprising Woman in Fort Lauderdale, Florida, USA.
Ronnie was previously our CFO. He retired from this position at the end of June 2015 after serving 19 years with our group. Prior to joining our group, he was an accountant and auditor in public practice. He was a partner at Kessel Feinstein for 15 years. Following his retirement, Ronnie remains on the board in a non-executive capacity.
COMMITTEESAUDIT COMMITTEE
S E Abrahams (Chairman)D Friedland B L M Makgabo-FiskerstrandE Oblowitz N V Simamane M Lewis (by invitation)A D Murray (by invitation) R Stein (by invitation)A E Thunström (by invitation)
REMUNERATION COMMITTEE
E Oblowitz (Chairman) Prof F AbrahamsD FriedlandM LewisB L M Makgabo-FiskerstrandA D Murray (by invitation)
RISK COMMITTEE
E Oblowitz (Chairman) D Friedland A D Murray R SteinA E ThunströmS E Abrahams (by invitation)M Lewis (by invitation)
NOMINATION COMMITTEE
M Lewis (Chairman)S E Abrahams R SteinA D Murray (by invitation)
SOCIAL AND ETHICS COMMITTEE
Prof F Abrahams (Chairperson)B L M Makgabo-FiskerstrandA D Murray N V SimamaneA E Thunström (by invitation)
87
OUR GOVERNANCEPROFILE
SUMMARY CONSOLIDATED FINANCIAL STATEMENTS APPENDICES NOTICE OF ANNUAL
GENERAL MEETING ADMINISTRATION
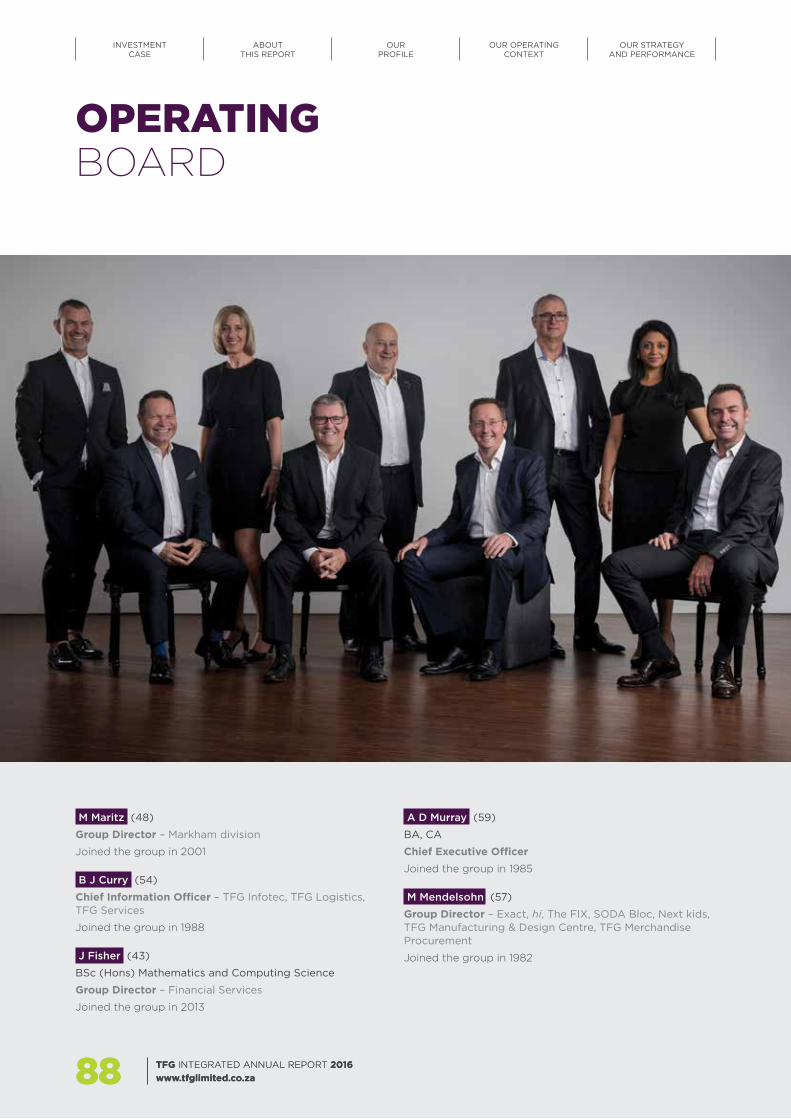
TFG INTEGRATED ANNUAL REPORT 2016 www.tfglimited.co.za88
M Maritz (48)
Group Director – Markham division
Joined the group in 2001
B J Curry (54)
Chief Information Officer – TFG Infotec, TFG Logistics, TFG Services
Joined the group in 1988
J Fisher (43)
BSc (Hons) Mathematics and Computing Science
Group Director – Financial Services
Joined the group in 2013
A D Murray (59)
BA, CA
Chief Executive OfficerJoined the group in 1985
M Mendelsohn (57)
Group Director – Exact, hi, The FIX, SODA Bloc, Next kids, TFG Manufacturing & Design Centre, TFG Merchandise Procurement
Joined the group in 1982
OPERATINGBOARD
TFG INTEGRATED ANNUAL REPORT 2016 www.tfglimited.co.za88
INVESTMENT CASE
ABOUTTHIS REPORT
OUR PROFILE
OUR OPERATINGCONTEXT
OUR STRATEGY AND PERFORMANCE

89
A E Thunström (45)
B Comm (Hons Acc), CA(SA)
Chief Financial Officer Additional areas of responsibility: Publishing & Insurance, TFG Finance & Advisory, TFG Internal Audit
Joined the group in 2015
D B Gedye (57)
Group Director – Sports division, TFG Property, TFG Store Development, TFG Marketing & e-commerce
Joined the group in 1979
G S Naidoo (48)
BSocSc (Hons), MA (Ind Psych)
Group Director – Jewellery division, @home division, TFG Human Resources
Joined the group in 2005
S A Baird (50)
Group Director – Foschini division
Joined the group in 1986
RESPONSIBILITY
The operating board is responsible for the group’s strategy formulation and the day-to-day management of all aspects of the operations of the trading and service divisions.
In addition, they are responsible for deliberating and taking decisions or recommendations on all matters affecting TFG’s strategy and operations including risk management, and the succession of executive and senior management. This includes all operational matters such as:
• merchandise sourcing, buying, planning, warehousing and distribution• store location, leasing, operations, design and architecture• human resource recruitment, training, development and remuneration• information systems acquisition, development and maintenance• credit management and customer relationship marketing and systems• financial management and administration• strategic plan formulation, development, execution and refinement• development, review and achievement of budgets in relation to sales,
operating expenses and capital expenditure• identification, assessment, mitigation and risk management• development and refinement of business philosophy and the value system• development, monitoring and audit of internal controls• development, review and implementation of the employment equity plan• development and monitoring of operational policies and procedures• development, implementation and monitoring of transformation strategy• approvement of transactions regarding investment, disinvestment, refinancing
and restructuring in accordance with parameters set by the supervisory board• adoption and implementation of corporate governance practices and meeting
standards set out in King III
89
OUR GOVERNANCEPROFILE
SUMMARY CONSOLIDATED FINANCIAL STATEMENTS APPENDICES NOTICE OF ANNUAL
GENERAL MEETING ADMINISTRATION

OUR GOVERNANCEPROFILETFG remains committed to the highest standards of corporate governance. Transparency and accountability remain the key principles on which all its business activities are conducted. TFG fully supports the governance principles contained in King III and the Listings Requirements of the JSE. Governance extends beyond regulatory compliance as management aims to create and maintain a culture of good governance throughout the group.
KING IIITFG continues to apply the King III principles in terms of the composition and functioning of its governance structures and the governance of its day-to-day activities. A register of all 75 King III principles is available on our website.
GOVERNANCE STRUCTURESThe non-executive board of TFG embraces the responsibilities imposed by King III and acknowledges that it is ultimately accountable for the strategy, direction, leadership, governance and performance of TFG. It also has oversight of the development, approval and updating of TFG’s purpose, value and mission statements, significant policies and goals related to economic, environmental and social impacts. The operating board is responsible for day-to-day management and operations.
The scope and functioning of the board and board committees are governed by board charters. These charters are reviewed and updated regularly. They outline the relevant authority, responsibilities, powers, composition and functioning of the board and its committees.
COMPOSITIONIn accordance with King III requirements, the board of directors of TFG mainly comprises non-executive directors, with the majority being independent. The board is committed to have a gender diverse board and will, as required by the Listings Requirements, adopt a policy on this in the next financial year. The nomination committee gives due consideration to succession planning for all main board directors and ensures that all committees are appropriately constituted and chaired. The current board structure comprises 11 directors, nine of whom are non-executive directors, of which eight are independent directors and one is not regarded as independent. The remaining two directors are executive directors, namely the Chief Executive Officer and the Chief Financial Officer, and are salaried employees of TFG.
Five committees assist the board in discharging its duties. These committees are the remuneration, risk, audit, social and ethics, and nomination committees. An overview of the functions of these committees appears later in this report. The composition of the board and its committees appears on page 87.
DIRECTORSThe non-executive directors come from diverse backgrounds in commerce and industry. Their collective experience enables them to provide sound, independent and objective judgement in decision-making that is in the best interests of TFG. They are ultimately responsible for the performance of TFG, its long-term sustainable growth and the enhancement of shareholder value. They review and ratify TFG’s strategy in addition to monitoring and measuring its performance and executive management against key performance indicators. They provide their opinion and advice regarding the group’s financial, audit, governance, legal compliance and risk management controls. In order to ensure sustainable leadership, they review transformation and succession planning at senior levels and give input on the remuneration process.
All directors exercise unfettered discretion in the fulfilment of their duties, resulting in constructive debate at meetings that continues to yield well-considered decisions. There exists a balance of power and authority among the directors of the board.
Detailed information on the directors and their credentials appears on pages 84 to 87.
Director appointment and inductionPotential new non-executive directors go through a thorough interview procedure until a suitable candidate is chosen and appointed. The process is contained in a policy detailing the appointment procedure and it ensures that appointments are a matter for the board of directors as a whole, assisted by the nomination committee. Newly appointed directors hold office only until the next annual general meeting at which time their original appointment is confirmed and they stand for re-election at that meeting. Each year, one third of the existing non-executive directors are subject to retirement by rotation. This is in line with King III and the memorandum of incorporation. The nomination committee recommends re-election by shareholders after due consideration is given to the director’s attendance at meetings and their performance. Non-executive directors have no fixed terms and the performance of all directors is subject to an annual peer review.
TFG INTEGRATED ANNUAL REPORT 2016 www.tfglimited.co.za90
INVESTMENT CASE
ABOUTTHIS REPORT
OUR PROFILE
OUR OPERATINGCONTEXT
OUR STRATEGY AND PERFORMANCE

REMUNERATION COMMITTEE
RISK COMMITTEE
NOMINATION COMMITTEE
AUDIT COMMITTEE
SOCIAL ANDETHICS
COMMITTEE
BOARD
91
OUR GOVERNANCEPROFILE
SUMMARY CONSOLIDATED FINANCIAL STATEMENTS APPENDICES NOTICE OF ANNUAL
GENERAL MEETING ADMINISTRATION
A formal induction programme for new non-executive directors is in place, with the objective of maximising their understanding of the group and enabling them to immediately provide input and make well-informed decisions.
Changes to the board and committees since the publication of the previous integrated annual report (dated 22 July 2015)
On 5 November 2015, Mr G H Davin was appointed to the board as an independent non-executive director. There were the following changes to committee composition:
• Ms B L M Makgabo-Fiskerstrand resigned from the remuneration committee on 1 October 2015.
• Mr R Stein was appointed, effective 1 October 2015, as a member of the nomination committee and the risk committee, and as an invitee to the audit committee.
• Mr E Oblowitz was appointed to the remuneration committee on 1 October 2015 and from this date also as Chairman of the committee.
• As from 1 April 2016, Mr D Friedland is a member of the audit committee as opposed to being an invitee.
Independence assessmentAll non-executive directors are annually required to complete an independence questionnaire to establish whether they meet the objective independence criteria in King III. Eight of the non-executive directors are independent according to the King III definition of independence.
Of the eight directors that satisfy the objective independence requirements, three have served a term in excess of nine years. The board reviewed the independence of Mr S E Abrahams, Mr M Lewis and Prof F Abrahams and after due consideration (during the relevant meeting the aforementioned directors recused themselves) concluded that the length of their association with the group in no way impaired their independence.
Remuneration and shareholdingThe remuneration paid to directors during the current year and details of direct and indirect shareholdings are disclosed in the remuneration report, which appears later in this report. Information regarding their participation in share incentive schemes (which is limited to executive directors) is also disclosed.
Dealing in sharesThe board complies with the Listings Requirements of the JSE in relation to restrictions on the trading of TFG’s shares by directors and employees during closed periods. Restrictions may also be placed on share dealings at other times if TFG is involved in corporate activity or sensitive negotiations.
There is a process in place in terms of the Listings Requirements of the JSE for directors to obtain prior clearance before dealing in TFG’s shares. All transactions are conducted at the ruling market price on the JSE.
Details of directors’ share dealings are disclosed on SENS.
Directors’ interests in contractsIn addition to a formal annual disclosure process, directors are required to make ongoing disclosures of any interests in contracts. During the year under review, the directors had no interest in contracts as contemplated in the Companies Act.
BOARD MEETINGSThe board typically meets quarterly in Cape Town and further meetings are held at short notice when necessary. Proceedings at meetings are directed by way of an agenda. The proposed agenda is circulated in advance of the meeting to allow board members the opportunity to request additional agenda items.
In addition, a comprehensive board pack is distributed to all members prior to meetings to ensure that they are properly informed and able to engage in meaningful discussions and effectively discharge their duties.
All directors have unrestricted access to the Company Secretary and all company records, as well as to independent professional advice at the company’s expense in appropriate circumstances.
During the current financial year, the board, inter alia, approved projections and results, approved scrip distributions, approved acquisitions, reviewed strategy at various levels, focused on current performance and considered report-backs from board committees.
OUR GOVERNANCE PROFILE CONTINUED
TFG INTEGRATED ANNUAL REPORT 2016 www.tfglimited.co.za92
INVESTMENT CASE
ABOUTTHIS REPORT
OUR PROFILE
OUR OPERATINGCONTEXT
OUR STRATEGY AND PERFORMANCE

BOARDREMUNERATION
COMMITTEERISK
COMMITTEEAUDIT
COMMITTEENOMINATION COMMITTEE
SOCIAL AND ETHICS
COMMITTEE
NUMBER OF MEETINGS 5 4 5 3 3 3
D M Nurek** 2 – 1 1# 1 –F Abrahams 5 4 – – – 3S E Abrahams 5 – 4# 3 3 –D Friedland 5 4 5 2# – –M Lewis 5 4 2# – 3 –B L M Makgabo-Fiskerstrand 4 1**** – 2***** – 3E Oblowitz 5 2***** 5 3 – –N V Simamane 5 – – 3 – 2G H Davin* 2 – – – – –A D Murray 5 4# 5 3# 3# 3R Stein 5 – 4 3# 1***** –P S Meiring^ 2 – – – – –A E Thunström*** 5 – 5 3# – 3#
* Appointed to the board on 5 November 2015.** Resigned from the board on 19 June 2015. *** Appointed to the board on 1 July 2015, any prior meetings attended as invitee.**** Resigned from the committee on 1 October 2015.***** Appointed to the committee on 1 October 2015.^ Retired from the board on 30 June 2015.# Invitee.
BOARD AND COMMITTEE ATTENDANCEThe attendance of the directors at board meetings and board committee meetings for the financial year was as follows:
BOARD EVALUATIONSAn annual evaluation of the board, its members and each of the committees is undertaken by way of comprehensive questionnaires sent to all board members. The results are collated and passed on to the Chairman who has a one-on-one interview session with each director to discuss his/her feedback and any areas of concern. The Chairman provides feedback to the full board on any actions arising from the evaluation process.
The annual evaluation is comprehensive, encompassing all aspects of the board’s responsibilities. It covers both individual member contributions and the effectiveness of the board and its committees as a whole. The evaluation in respect of the previous calendar year was completed towards the end of last year and all action items were attended to, which included ongoing training for non-executive directors, more board and management interaction, extended time for strategic discussions at board meetings and the appointment of an additional independent non-executive director, namely Mr G H Davin.
The next evaluation cycle will shift to a more suitable time later in the year. The process will commence in June and will be finalised by October, with feedback being given to the board at its November meeting. This year the process will be entirely conducted by secure electronic means.
COMPANY SECRETARYThe Company Secretary is accountable to the board and all directors have access to the Company Secretary’s advice and services. An arm’s length relationship with the board is maintained and the Company Secretary is not a director of the company. The Company Secretary is independent and functionally reports to the board on company secretarial matters.
The Company Secretary’s duties include but are not limited to those listed in section 88 of the Companies Act.
Every year, as part of the annual board evaluation process, the directors assess whether the Company Secretary has fulfilled the required obligations and duties. The annual
93
OUR GOVERNANCEPROFILE
SUMMARY CONSOLIDATED FINANCIAL STATEMENTS APPENDICES NOTICE OF ANNUAL
GENERAL MEETING ADMINISTRATION
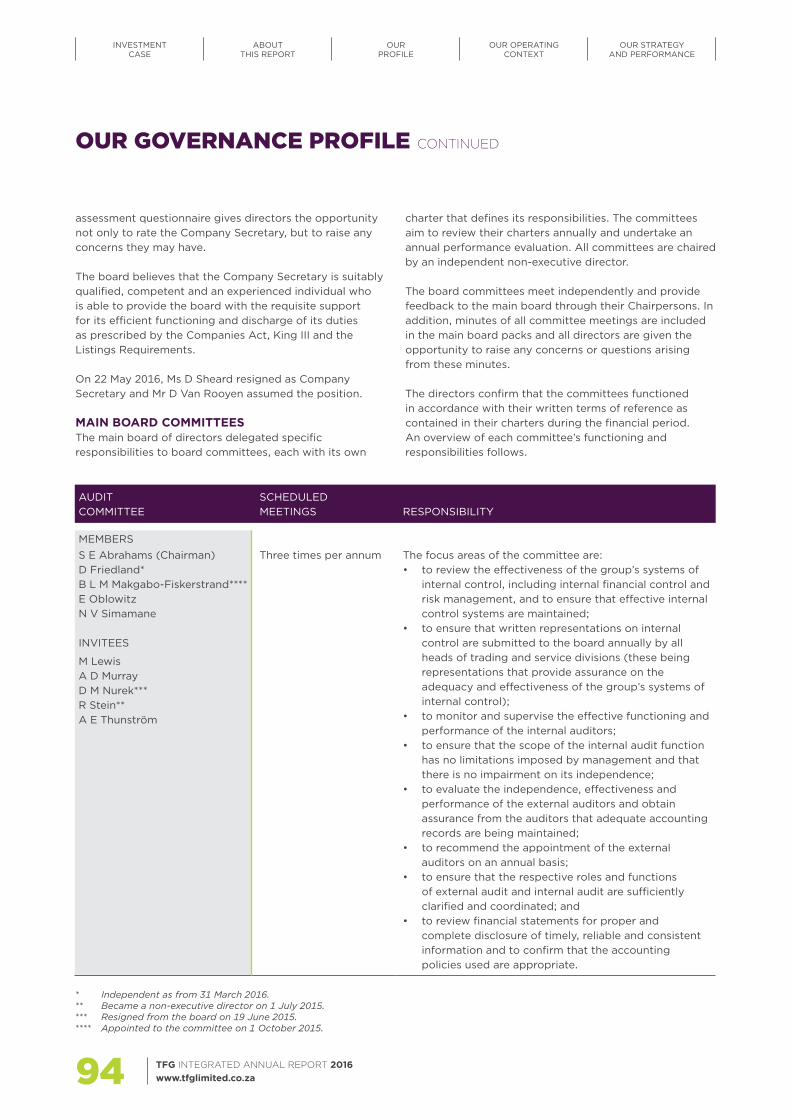
AUDIT COMMITTEE
SCHEDULED MEETINGS RESPONSIBILITY
MEMBERSS E Abrahams (Chairman) D Friedland* B L M Makgabo-Fiskerstrand****E Oblowitz N V Simamane
INVITEES
M LewisA D Murray D M Nurek*** R Stein** A E Thunström
Three times per annum The focus areas of the committee are:• to review the effectiveness of the group’s systems of
internal control, including internal financial control and risk management, and to ensure that effective internal control systems are maintained;
• to ensure that written representations on internal control are submitted to the board annually by all heads of trading and service divisions (these being representations that provide assurance on the adequacy and effectiveness of the group’s systems of internal control);
• to monitor and supervise the effective functioning and performance of the internal auditors;
• to ensure that the scope of the internal audit function has no limitations imposed by management and that there is no impairment on its independence;
• to evaluate the independence, effectiveness and performance of the external auditors and obtain assurance from the auditors that adequate accounting records are being maintained;
• to recommend the appointment of the external auditors on an annual basis;
• to ensure that the respective roles and functions of external audit and internal audit are sufficiently clarified and coordinated; and
• to review financial statements for proper and complete disclosure of timely, reliable and consistent information and to confirm that the accounting policies used are appropriate.
* Independent as from 31 March 2016.** Became a non-executive director on 1 July 2015.*** Resigned from the board on 19 June 2015.**** Appointed to the committee on 1 October 2015.
assessment questionnaire gives directors the opportunity not only to rate the Company Secretary, but to raise any concerns they may have.
The board believes that the Company Secretary is suitably qualified, competent and an experienced individual who is able to provide the board with the requisite support for its efficient functioning and discharge of its duties as prescribed by the Companies Act, King III and the Listings Requirements.
On 22 May 2016, Ms D Sheard resigned as Company Secretary and Mr D Van Rooyen assumed the position.
MAIN BOARD COMMITTEESThe main board of directors delegated specific responsibilities to board committees, each with its own
charter that defines its responsibilities. The committees aim to review their charters annually and undertake an annual performance evaluation. All committees are chaired by an independent non-executive director.
The board committees meet independently and provide feedback to the main board through their Chairpersons. In addition, minutes of all committee meetings are included in the main board packs and all directors are given the opportunity to raise any concerns or questions arising from these minutes.
The directors confirm that the committees functioned in accordance with their written terms of reference as contained in their charters during the financial period. An overview of each committee’s functioning and responsibilities follows.
OUR GOVERNANCE PROFILE CONTINUED
TFG INTEGRATED ANNUAL REPORT 2016 www.tfglimited.co.za94
INVESTMENT CASE
ABOUTTHIS REPORT
OUR PROFILE
OUR OPERATINGCONTEXT
OUR STRATEGY AND PERFORMANCE
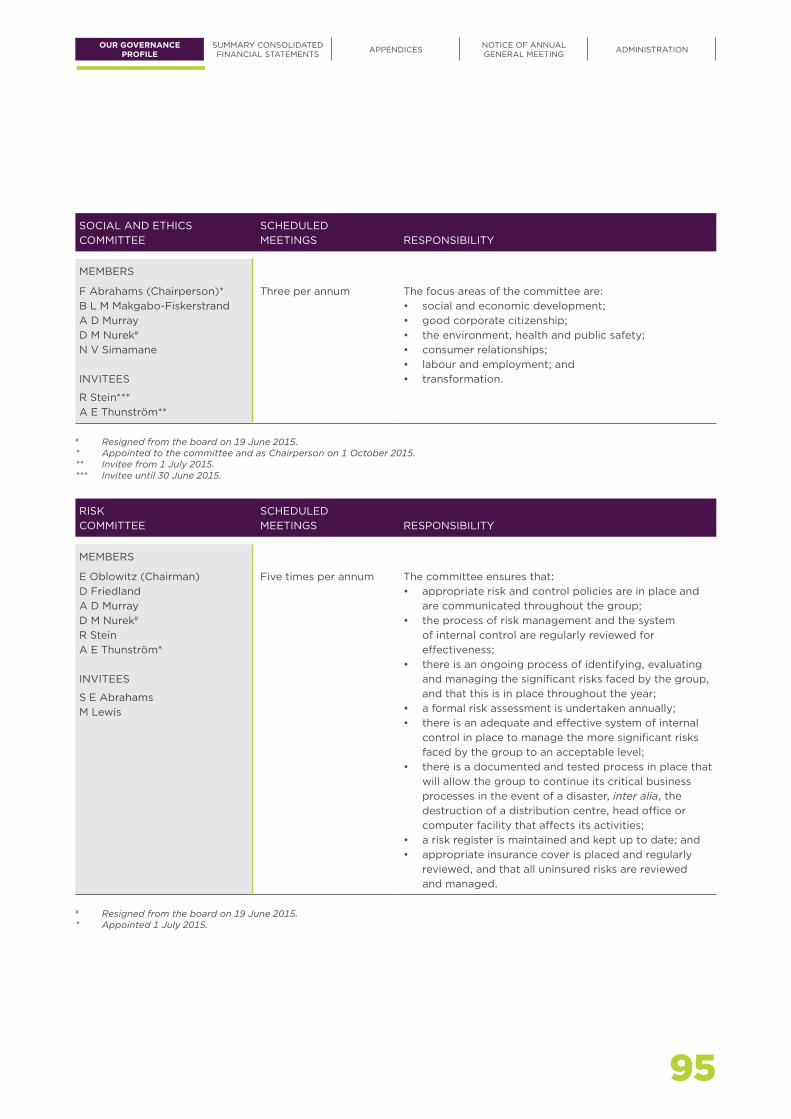
SOCIAL AND ETHICS COMMITTEE
SCHEDULED MEETINGS RESPONSIBILITY
MEMBERS
F Abrahams (Chairperson)*B L M Makgabo-FiskerstrandA D MurrayD M Nurek#
N V Simamane
INVITEES
R Stein*** A E Thunström**
Three per annum The focus areas of the committee are:• social and economic development;• good corporate citizenship;• the environment, health and public safety;• consumer relationships;• labour and employment; and• transformation.
# Resigned from the board on 19 June 2015.* Appointed to the committee and as Chairperson on 1 October 2015.** Invitee from 1 July 2015.*** Invitee until 30 June 2015.
RISK COMMITTEE
SCHEDULED MEETINGS RESPONSIBILITY
MEMBERS
E Oblowitz (Chairman)D FriedlandA D MurrayD M Nurek#
R SteinA E Thunström*
INVITEES
S E AbrahamsM Lewis
Five times per annum The committee ensures that:• appropriate risk and control policies are in place and
are communicated throughout the group;• the process of risk management and the system
of internal control are regularly reviewed for effectiveness;
• there is an ongoing process of identifying, evaluating and managing the significant risks faced by the group, and that this is in place throughout the year;
• a formal risk assessment is undertaken annually;• there is an adequate and effective system of internal
control in place to manage the more significant risks faced by the group to an acceptable level;
• there is a documented and tested process in place that will allow the group to continue its critical business processes in the event of a disaster, inter alia, the destruction of a distribution centre, head office or computer facility that affects its activities;
• a risk register is maintained and kept up to date; and• appropriate insurance cover is placed and regularly
reviewed, and that all uninsured risks are reviewed and managed.
# Resigned from the board on 19 June 2015.* Appointed 1 July 2015.
95
OUR GOVERNANCEPROFILE
SUMMARY CONSOLIDATED FINANCIAL STATEMENTS APPENDICES NOTICE OF ANNUAL
GENERAL MEETING ADMINISTRATION

REMUNERATION COMMITTEE
SCHEDULED MEETINGS RESPONSIBILITY
MEMBERS
E Oblowitz (Chairman)*F AbrahamsD FriedlandM LewisB L M Makgabo-Fiskerstrand**D M Nurek#
INVITEE
A D Murray
Four times per annum The remuneration committee sets the group’s remuneration strategy, policies and practices. Main focus areas include:• recommending, reviewing and approving all
remuneration for non-executive directors, executive directors and senior executives;
• ensuring a fair balance between fixed and variable remuneration within the company's financial constraints;
• reviewing the short-term and long-term incentive to ensure it is market related and supports shareholder value creation; and
• overseeing the setting of remuneration at all levels in the group.
* Appointed as Chairperson on 1 October 2015.** Resigned from the committee on 1 October 2015.# Resigned from the board on 19 June 2015.
NOMINATION COMMITTEE
SCHEDULED MEETINGS RESPONSIBILITY
MEMBERS
M Lewis (Chairman)*S E AbrahamsD M Nurek#
R Stein**
INVITEE
A D Murray
Three times per annum Main functions include:• reviewing the board structure, size and composition;• reviewing the nature, size and composition of the
board committees;• succession planning;• reviewing the balance between non-executive and
executive directors;• ensuring the directors have the required blend of
experience, skills and knowledge to support the continued success of the group; and
• ensuring the existence of a formal process of performance evaluation.
# Resigned from the board on 19 June 2015.* Chairperson from 19 June 2015.** Appointed to the committee from 1 October 2015.
OUR GOVERNANCE PROFILE CONTINUED
TFG INTEGRATED ANNUAL REPORT 2016 www.tfglimited.co.za96
INVESTMENT CASE
ABOUTTHIS REPORT
OUR PROFILE
OUR OPERATINGCONTEXT
OUR STRATEGY AND PERFORMANCE

LEGAL COMPLIANCEUltimate accountability for legal compliance rests with the board. The board is responsible to establish an effective legal compliance framework. Management implements this legal compliance framework and related processes to manage legal compliance risks as an integral part of enterprise-wide risk management. In addition, the board receives regulatory updates and legal compliance reports at the audit, risk and social and ethics committee meetings. The functioning and purpose of the legal compliance function is documented in TFG’s Legal Compliance Policy, which is in accordance with chapter 6 of King III.
The management of legal compliance risk refers to the current and future risk of damage or harm to TFG’s business model or objectives, reputation and financial soundness arising from non-adherence with regulatory requirements.
The responsibilities of the legal compliance function include:
• reporting to the audit, and social and ethics committees;
• identifying, assessing and advising TFG on existing, new or amended legislation that is applicable to TFG’s business, including giving recommendations on applicable rules;
• facilitating legal compliance with relevant laws and rules;
• assigning responsibility for areas of legal compliance;• facilitating legal compliance with internal policies,
rules, guidelines and procedures;• drafting legal compliance risk management plans for
key pieces of legislation; • monitoring regulatory legal compliance by the business
and reporting on findings to management; • drafting and submitting statutory legal compliance
reports to regulators; and• liaising with various regulators regarding regulatory
reporting and legislative changes.
During 2016, additional effort was applied to:
• continuing facilitation of compliance with amendments to credit legislation into business processes, policies and documentation;
• attending Parliament, meeting with regulators and legislators (both in South Africa and elsewhere in Africa) to positively impact the legislative landscape taking the practicalities of the retail and financial services sectors into account;
• obtaining regulatory frameworks and rolling out increased regulatory legal compliance measures to stores in African countries and monitoring adherence thereto;
• supplementing legal compliance systems and procedures with technological tools to increase access to legal compliance information across divisions;
• establishing and advocating measures that support legal compliance risk management in line with TFG’s consumer-centric focus; and
• monitoring adherence to legal compliance in call centres, stores and head office.
TFG recently focused on the following new, amended or draft laws:
• National Credit Amendment Act and Affordability Regulations, as well as amendments to interest rates and fees applicable to credit advanced by TFG to consumers
• Twin peaks regulatory regime including the Financial Sector Regulation Bill
• Amendments to the Broad-based Black Economic Empowerment Act Codes and Draft Regulations
• Amendments to the Financial Intelligence Centre Act• Insurance Draft Bill• Protection of Personal Information Act (partly
effective)• National Equitable Economic Empowerment
Framework and Bill in Namibia • Consumer Credit Bill in Swaziland• EU Regulation on Data Protection (not effective) and
the UK Modern Slavery Act The group is impacted by, adheres to, or uses as guidance in its operations non-binding rules, codes, standards, initiatives and frameworks, which includes the following:
• Advertising Standards Authority Code of Conduct• Information Technology (IT) ISO Standards and
IT Governance Frameworks• Payment Card Industry Data Security Standard
(PCI DSS)• Europay, MasterCard and Visa (EMV) Standard
for credit and debit payment cards based on chip card technology
• Carbon and Water Disclosure Project (CDP and WDP)• Kimberley Process• Global Reporting Initiative (GR4)• King Code on Corporate Governance (King III)
TFG has working groups and project boards in place to ensure there are impact assessments for significant new laws and amendments. Thereafter, timelines, implementation areas and the business owners to implement changes are agreed.
Based on key laws that are effective as at 31 March 2016, there were no material areas of non-compliance.
97
OUR GOVERNANCEPROFILE
SUMMARY CONSOLIDATED FINANCIAL STATEMENTS APPENDICES NOTICE OF ANNUAL
GENERAL MEETING ADMINISTRATION
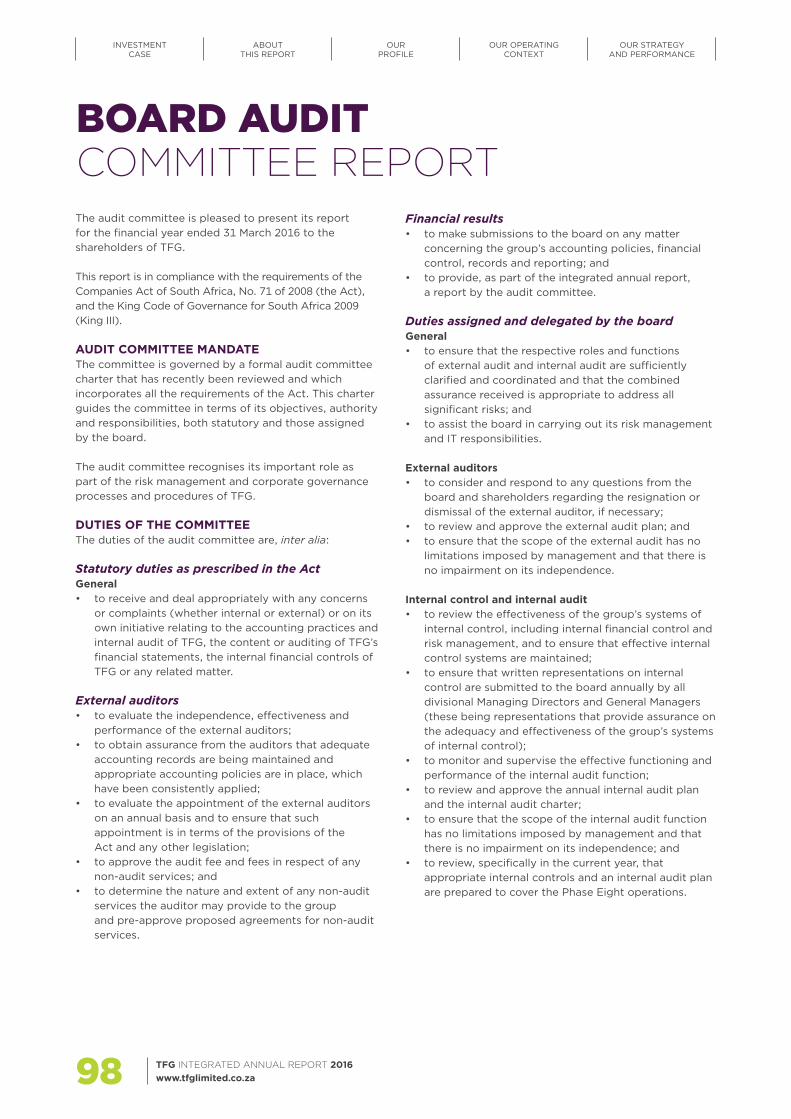
BOARD AUDITCOMMITTEE REPORTThe audit committee is pleased to present its report for the financial year ended 31 March 2016 to the shareholders of TFG.
This report is in compliance with the requirements of the Companies Act of South Africa, No. 71 of 2008 (the Act), and the King Code of Governance for South Africa 2009 (King III).
AUDIT COMMITTEE MANDATEThe committee is governed by a formal audit committee charter that has recently been reviewed and which incorporates all the requirements of the Act. This charter guides the committee in terms of its objectives, authority and responsibilities, both statutory and those assigned by the board.
The audit committee recognises its important role as part of the risk management and corporate governance processes and procedures of TFG.
DUTIES OF THE COMMITTEEThe duties of the audit committee are, inter alia:
Statutory duties as prescribed in the ActGeneral• to receive and deal appropriately with any concerns
or complaints (whether internal or external) or on its own initiative relating to the accounting practices and internal audit of TFG, the content or auditing of TFG’s financial statements, the internal financial controls of TFG or any related matter.
External auditors• to evaluate the independence, effectiveness and
performance of the external auditors; • to obtain assurance from the auditors that adequate
accounting records are being maintained and appropriate accounting policies are in place, which have been consistently applied;
• to evaluate the appointment of the external auditors on an annual basis and to ensure that such appointment is in terms of the provisions of the Act and any other legislation;
• to approve the audit fee and fees in respect of any non-audit services; and
• to determine the nature and extent of any non-audit services the auditor may provide to the group and pre-approve proposed agreements for non-audit services.
Financial results• to make submissions to the board on any matter
concerning the group’s accounting policies, financial control, records and reporting; and
• to provide, as part of the integrated annual report, a report by the audit committee.
Duties assigned and delegated by the boardGeneral• to ensure that the respective roles and functions
of external audit and internal audit are sufficiently clarified and coordinated and that the combined assurance received is appropriate to address all significant risks; and
• to assist the board in carrying out its risk management and IT responsibilities.
External auditors• to consider and respond to any questions from the
board and shareholders regarding the resignation or dismissal of the external auditor, if necessary;
• to review and approve the external audit plan; and• to ensure that the scope of the external audit has no
limitations imposed by management and that there is no impairment on its independence.
Internal control and internal audit• to review the effectiveness of the group’s systems of
internal control, including internal financial control and risk management, and to ensure that effective internal control systems are maintained;
• to ensure that written representations on internal control are submitted to the board annually by all divisional Managing Directors and General Managers (these being representations that provide assurance on the adequacy and effectiveness of the group’s systems of internal control);
• to monitor and supervise the effective functioning and performance of the internal audit function;
• to review and approve the annual internal audit plan and the internal audit charter;
• to ensure that the scope of the internal audit function has no limitations imposed by management and that there is no impairment on its independence; and
• to review, specifically in the current year, that appropriate internal controls and an internal audit plan are prepared to cover the Phase Eight operations.
TFG INTEGRATED ANNUAL REPORT 2016 www.tfglimited.co.za98
INVESTMENT CASE
ABOUTTHIS REPORT
OUR PROFILE
OUR OPERATINGCONTEXT
OUR STRATEGY AND PERFORMANCE
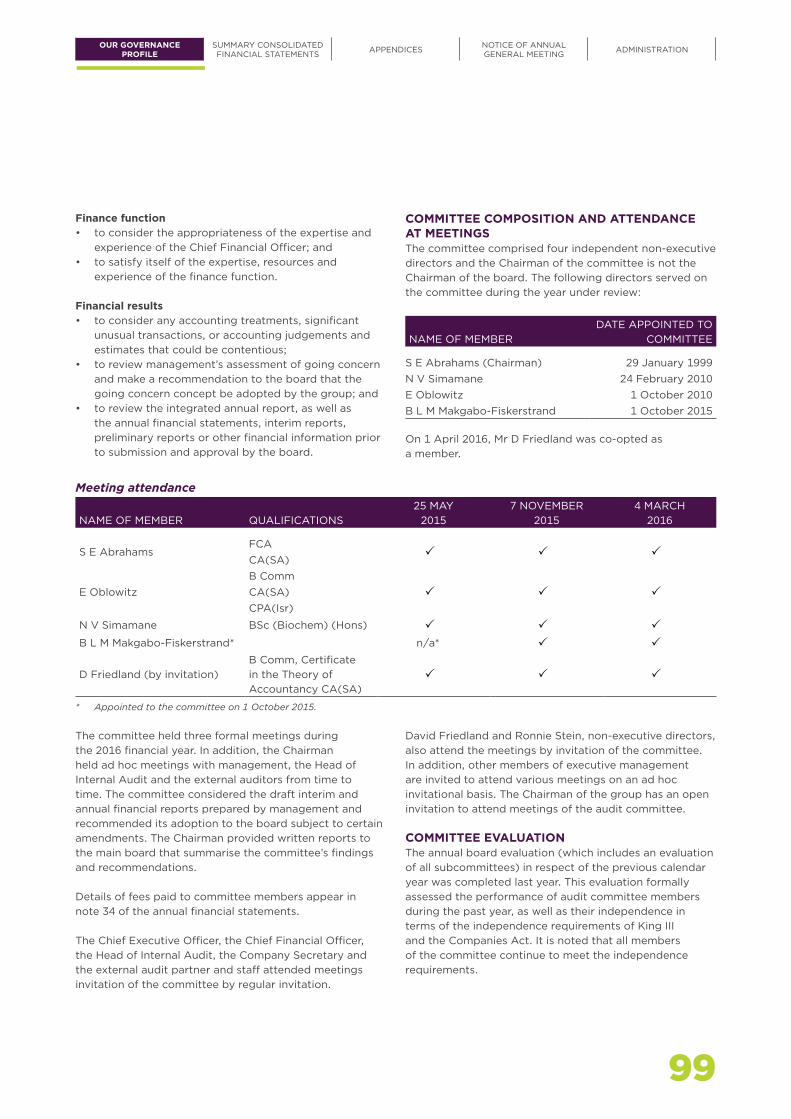
Finance function• to consider the appropriateness of the expertise and
experience of the Chief Financial Officer; and• to satisfy itself of the expertise, resources and
experience of the finance function.
Financial results• to consider any accounting treatments, significant
unusual transactions, or accounting judgements and estimates that could be contentious;
• to review management’s assessment of going concern and make a recommendation to the board that the going concern concept be adopted by the group; and
• to review the integrated annual report, as well as the annual financial statements, interim reports, preliminary reports or other financial information prior to submission and approval by the board.
COMMITTEE COMPOSITION AND ATTENDANCE AT MEETINGSThe committee comprised four independent non-executive directors and the Chairman of the committee is not the Chairman of the board. The following directors served on the committee during the year under review:
NAME OF MEMBERDATE APPOINTED TO
COMMITTEE
S E Abrahams (Chairman) 29 January 1999N V Simamane 24 February 2010E Oblowitz 1 October 2010B L M Makgabo-Fiskerstrand 1 October 2015
On 1 April 2016, Mr D Friedland was co-opted as a member.
Meeting attendance
NAME OF MEMBER QUALIFICATIONS25 MAY
20157 NOVEMBER
20154 MARCH
2016
S E AbrahamsFCA
P P PCA(SA)
E OblowitzB Comm
P P PCA(SA)CPA(Isr)
N V Simamane BSc (Biochem) (Hons) P P PB L M Makgabo-Fiskerstrand* n/a* P P
D Friedland (by invitation)B Comm, Certificate in the Theory of Accountancy CA(SA)
P P P
* Appointed to the committee on 1 October 2015.
The committee held three formal meetings during the 2016 financial year. In addition, the Chairman held ad hoc meetings with management, the Head of Internal Audit and the external auditors from time to time. The committee considered the draft interim and annual financial reports prepared by management and recommended its adoption to the board subject to certain amendments. The Chairman provided written reports to the main board that summarise the committee’s findings and recommendations.
Details of fees paid to committee members appear in note 34 of the annual financial statements.
The Chief Executive Officer, the Chief Financial Officer, the Head of Internal Audit, the Company Secretary and the external audit partner and staff attended meetings invitation of the committee by regular invitation.
David Friedland and Ronnie Stein, non-executive directors, also attend the meetings by invitation of the committee. In addition, other members of executive management are invited to attend various meetings on an ad hoc invitational basis. The Chairman of the group has an open invitation to attend meetings of the audit committee.
COMMITTEE EVALUATIONThe annual board evaluation (which includes an evaluation of all subcommittees) in respect of the previous calendar year was completed last year. This evaluation formally assessed the performance of audit committee members during the past year, as well as their independence in terms of the independence requirements of King III and the Companies Act. It is noted that all members of the committee continue to meet the independence requirements.
99
OUR GOVERNANCEPROFILE
SUMMARY CONSOLIDATED FINANCIAL STATEMENTS APPENDICES NOTICE OF ANNUAL
GENERAL MEETING ADMINISTRATION
ELECTION OF COMMITTEE MEMBERSThe following members made themselves available for election to the committee. Such election was recommended by the nomination committee and will be proposed to shareholders at the upcoming annual general meeting:
S E AbrahamsD FriedlandB L M Makgabo-FiskerstrandE OblowitzN V Simamane
COMMITTEE FUNCTIONINGThe committee typically meets three times a year with the main focus of each respective meeting being as follows:
• consideration of control risks and risk management (typically in February/March each year);
• approval of annual results (typically in May each year); and
• approval of interim results (typically in November each year).
Independently of management, members of the committee meet separately with the Head of Internal Audit and the external auditors respectively. The Head of Internal Audit reports directly to the audit committee.
Meeting dates and topics are agreed well in advance each year. Each meeting is preceded by the distribution to each attendee of an audit committee pack, inter alia, comprising:
• a detailed agenda;• minutes of the previous meeting;• a report by the external auditors; and• written reports by management including:
– compliance and legal,– IT governance,– internal audit,– loss statistics, and– fraud.
The Chairman of this committee has an open invitation to attend meetings of the board risk committee (BRC).
SPECIFIC RESPONSIBILITIESThe committee confirms that it has carried out its functions in terms of the board audit committee charter and section 94 (7) of the Companies Act, No. 71 of 2008, by:
• confirming the nomination of KPMG Inc. as the group’s registered auditor for the year ending 31 March 2017 and being satisfied that they are independent of the company;
• approving the terms of engagement and fees to be paid to KPMG Inc.;
• ensuring that the appointment of KPMG Inc. complies with the provisions of the Companies Act;
• determining the nature and extent of any non-audit services, which the external auditors provide to the company or a related company;
• pre-approving proposed agreements with KPMG Inc. for the provision of any non-audit services;
• preparing this report for inclusion in the annual financial statements and in the integrated annual report;
• receiving and dealing appropriately with any relevant concerns or complaints;
• making submissions to the board on any matter concerning the company’s accounting policies, financial control, records and reporting; and
• performing such other oversight functions as may be determined by the board.
INTERNAL FINANCIAL CONTROL AND INTERNAL AUDITBased on the assessment of the system of internal financial controls conducted by internal audit, as well as information and explanations given by management and discussions held with the external auditor on the results of their audit, the committee is of the opinion that TFG’s system of internal financial controls is effective and forms a basis for the preparation of reliable financial statements in respect of the year under review.
In addition, during the 2016 financial year, the committee was not made aware of any:
• material breaches of any laws or regulations; or• material breaches of internal controls or procedures.
BOARD AUDIT COMMITTEE REPORT CONTINUED
TFG INTEGRATED ANNUAL REPORT 2016 www.tfglimited.co.za100
INVESTMENT CASE
ABOUTTHIS REPORT
OUR PROFILE
OUR OPERATINGCONTEXT
OUR STRATEGY AND PERFORMANCE
RISK MANAGEMENTWhile the board is ultimately responsible for the maintenance of an effective risk management process, the committee, together with the risk committee, assists the board in the assessment of the adequacy of the risk management process. The Chairman of this committee has an open invitation to risk committee meetings to ensure that relevant information is regularly shared. The committee fulfils an oversight role regarding financial reporting risks, internal financial controls, fraud risk as it relates to financial reporting and information technology risks as they relate to financial reporting.
As reported last year, the continued cooperation with the board risk committee (BRC) resulted in further clarification and delineation in the roles and responsibilities of both committees. The strategies adopted by each committee ensure timely review of any internal control weakness identified by any of the assurance providers. In addition, there were significant improvements in the development of Enterprise Risk Management (ERM) methodologies, which will further enhance the group’s risk management coverage and focus.
Further details on the risk management approach and process are included in the risk report, which appears on page 111.
PHASE EIGHTThis acquisition received continuing attention during the year and various workshops were arranged and will continue to be convened with the object of fully integrating the Phase Eight operations into the overall risk management framework of the group. Internal audit drew up an audit plan to cover the major risks identified and audits were conducted to cover those risks. No major concerns surfaced from their initial audit work, although it must be appreciated that it is still work in progress to achieve full integration into the group’s risk management framework.
The focus for the 2016 year end was directed at verifying the carrying values of stock and trade debtors. Both internal and external audit provided the board audit committee with positive reports on these significant asset classes.
WHISTLESAs the Whistles operations were acquired by TFG Brands (London) Limited (previously Dress Holdco B Limited) at the end of the financial year, only review work was undertaken by the external auditors. Further to the review on the Phase Eight operations earlier in this report, it is
the intention to apply the same procedures to the Whistles operations, with the initial combined workshop to be held in July 2016.
THE FINANCIAL AND BUSINESS ENVIRONMENTAs presented in the previous years’ integrated annual reports, the concerns expressed in this report that relate to the financial and business environment remain relevant and are accordingly once again presented in this report.
The South African political turmoil, which triggered the uncertainty in December 2015 that was caused by the “ins and outs” of finance ministers, the lack of GDP growth and hence the inability to increase job creation, the increased regulatory landscape and intermittent interest rate increases, put our credit customers under immense pressure. It is therefore pleasing to report that, despite the unstable and unfavourable macroeconomic environment, TFG in South Africa achieved an improvement in bad debt statistics. This is as a result of a concerted effort to be vigilant to trends and not to attempt to increase customer numbers by lowering the credit granting criteria. Going forward, the board audit committee will continue to focus on the ability of the group to curtail bad debts. Supported by an in-depth review undertaken by the external auditors, I can confirm that, in the opinion of the board audit committee, the provision for doubtful debts is adequate to sustain the year-end carrying value of trade receivables.
During the year, group management has been able to negotiate more favourable terms for future funding requirements by having an improved balance among short-term, medium-term and longer-term facilities. Although there had always been a significant funding headroom, the quality of the headroom is much improved currently.
The group continues to place importance on IT risk management and consistently reviews the measures to curb the threat of cybercrime and IT fraud in general. The governance over the IT support system is considered to be best of breed and complies with the recommendations contained in King III.
Regrettably, the group continues to suffer from ever-increasing financial loss arising from increased levels of crime-related incidents. Senior management is continuing to explore ways to reduce or curtail these operating losses. The introduction of a specialist ERM division soon to be bolstered by the hiring of a forensics expert are some of the initiatives being introduced to examine ways to make our stores, distribution centres, etc. more secure.
101
OUR GOVERNANCEPROFILE
SUMMARY CONSOLIDATED FINANCIAL STATEMENTS APPENDICES NOTICE OF ANNUAL
GENERAL MEETING ADMINISTRATION

EXTERNAL AUDITORSThe group’s external auditors are KPMG Inc. and the designated auditor is Mr P Farrand. KPMG Inc. is afforded unrestricted access to the group’s records and management, and present any significant issues arising from the annual audit to the committee. In addition, Mr P Farrand, where necessary, raises matters of concern directly with the Chairman of the committee.
The committee gave due consideration to the independence of the external auditors and is satisfied that KPMG Inc. is independent of the group and management and therefore able to express an independent opinion on the group’s annual financial statements.
The committee nominated, for approval at the annual general meeting, KPMG Inc. as the external auditor and Mr P Farrand as designated auditor for the 2017 financial year, having satisfied itself that the audit firm is accredited by the JSE.
FINANCIAL STATEMENTSThe committee reviewed the financial statements of the company and the group and is satisfied that they comply with International Financial Reporting Standards (IFRS) and the requirements of the Companies Act of South Africa.
In addition, the committee reviewed management’s assessment of going concern and recommended to the board that the going concern concept be adopted by TFG.
INTEGRATED ANNUAL REPORTThe committee fulfils an oversight role in respect of TFG’s integrated annual report. In this regard, the committee gave due consideration to the need for assurance on the
sustainability information contained in this report and concluded that obtaining independent assurance would not be beneficial to stakeholders.
The committee considered the sustainability information as disclosed in the integrated annual report, assessed its consistency with the annual financial statements and is satisfied that the sustainability information is in no way contradictory to that disclosed in the annual financial statements.
EXPERTISE OF CHIEF FINANCIAL OFFICER AND FINANCE FUNCTIONThe committee considers the appropriateness of the expertise and experience of the Chief Financial Officer and finance function on an annual basis.
In respect of the above requirement, the committee believes that Mr A E Thunström, the Chief Financial Officer, possesses the appropriate expertise and experience to meet his responsibilities in that position.
The committee further considers that the expertise, resources and experience of the finance function are appropriate based on the nature, complexity and size of the group’s operations.
APPROVALThe committee recommended the approval of the annual financial statements and the integrated annual report to the board.
S E AbrahamsChairman: Audit committee
29 June 2016
BOARD AUDIT COMMITTEE REPORT CONTINUED
TFG INTEGRATED ANNUAL REPORT 2016 www.tfglimited.co.za102
INVESTMENT CASE
ABOUTTHIS REPORT
OUR PROFILE
OUR OPERATINGCONTEXT
OUR STRATEGY AND PERFORMANCE

103
OUR GOVERNANCEPROFILE
SUMMARY CONSOLIDATED FINANCIAL STATEMENTS APPENDICES NOTICE OF ANNUAL
GENERAL MEETING ADMINISTRATION
SOCIAL AND ETHICSCOMMITTEE REPORTThe social and ethics committee is pleased to present its report for the financial year ended 31 March 2016 to the shareholders of TFG.
COMMITTEE MANDATEThe committee is governed by a formal charter, which guides the committee in terms of its objectives, authority and responsibilities. The charter incorporates the requirements of the Companies Act, specifically regulation 43(5) of the Act’s regulations, which requires the committee to monitor matters relating to:
• social and economic development;• good corporate citizenship;• the environment, health and public safety;• labour and employment;• transformation; and• consumer relationships.
TFG’s online sustainability overview report deals with some of the aspects falling within the mandate of the committee, such as the environment.
COMMITTEE COMPOSITION AND ATTENDANCE AT MEETINGSThe committee comprises three independent non-executive directors and one executive director, being the CEO. In addition, the CFO and other TFG executives attend meetings of this committee by invitation.
During the financial year, a subcommittee of the social and ethics committee, the transformation subcommittee, was absorbed into the main committee. Therefore, transformation is an agenda item of the social and ethics committee.
The committee held three meetings during the 2015 financial year. At each of these meetings the committee received reports detailing matters relevant to each of the areas within its mandate. The committee specifically dealt with the following aspects: compliance with consumer laws; wage negotiations and labour law developments; environmental metrics for waste, electricity consumption, paper use and recyclables; implementation of action items arising from the United Nations Global Compact principles;
corporate social investment initiatives; and a review of TFG’s sustainability strategy and its implementation including approval of TFG’s sustainability overview report.
At this stage, there are no specific matters the committee would like to bring to the attention of shareholders. The committee is satisfied with the efforts and activities undertaken by TFG in each of the areas falling within the committee’s mandate.
Details of fees paid to committee members appear in the remuneration report on page 133.
TRANSFORMATION REPORT The board recognises the critical role it has to play in the transformation process. The board’s social and ethics committee, through its governance and oversight role, ensures that an appropriate transformation strategy exists that is aligned with the Broad-based Black Economic Empowerment Act (BBBEE) (as amended) and the associated codes of good practice.
At its meetings during the 2016 financial year, the committee received feedback detailing matters relevant to each of the functional areas within its transformation mandate. The committee specifically dealt with the following aspects: TFG’s BBBEE scorecard and related matters, the alignment of TFG’s transformation strategy with the Broad-based Black Economic Empowerment Act (as amended) and each of the individual BBBEE elements, in particular employment equity and skills development and the various transformation surveys, which TFG participated in.
Transformation strategyThe role of the committee is to achieve sustainable empowerment through alignment with the five elements of the BBBEE codes, being ownership, management control, skills development, enterprise and supplier development, and socio-economic development.
Clear guidelines were defined for each of the five elements of BBBEE, and the committee has an ongoing responsibility to govern and oversee all aspects of the group’s BBBEE strategies.
AFRICA
TFG INTEGRATED ANNUAL REPORT 2016 www.tfglimited.co.za104
INVESTMENT CASE
ABOUTTHIS REPORT
OUR PROFILE
OUR OPERATINGCONTEXT
OUR STRATEGY AND PERFORMANCE

Meeting attendance
NAME OF MEMBER 21 JULY 2015 14 OCTOBER 2015 8 DECEMBER 2015
F Abrahams (Chairperson) P P P
N V Simamane P x P
B L M Makgabo-Fiskerstrand P P P
A D Murray P P P
A E Thunström (by invitation) P P P
2015 2014BBBEE ELEMENT MAXIMUM ACHIEVED ACHIEVED
DIRECT EMPOWERMENTOwnership 20 10,5 8,8Management control 10 4,7 4,8INDIRECT EMPOWERMENTEmployment equity 15 6,8 6,7Skills development 15 14,2 10,6Preferential procurement 20 18,2 17,8Enterprise development 15 15,0 15,0Socio-economic development 5 5,0 5,0TOTAL 100 74,4 68,7BBBEE RECOGNITION LEVEL CONTRIBUTOR – Level 4 Level 4
* Note: As per the Broad-based Black Economic Empowerment Act (as amended) and the associated codes of good practice, TFG was rated under the old codes of good practice for the financial year ended 31 March 2015.
Our performanceTFG was rated* a level four contributor by Empowerdex, an accredited economic empowerment rating agency (based on information in respect of the year ended 31 March 2015). Our performance over the past two years is recorded below.
We are pleased to report that TFG was ranked third in the 2015 Business Report Top 100 Most Empowered Companies survey within the retail sector.
Equity ownershipIn terms of paragraph 3.4.5 of code 100, statement 100 of the codes of good practice, TFG appointed an external research organisation to undertake a competent person’s report to estimate the extent of black rights measurable in TFG that originate from mandated investments. A score of 10,5 points was achieved and included in our verification certificate.
Management controlIn respect of 2015, TFG scored 4,7 out of a maximum of 10 points, which is indicative of the representivity achieved through securing black non-executive directors and senior executives through a continued focus on diversity in the succession planning and talent management processes. The board is satisfied with the progress being made in this area.
Employment equityEmployment equity remains a key focus of TFG’s transformation agenda. The group continues to ensure that there is alignment between the national economically active population and the targets set within the divisions.
TFG’s representation of employees in designated groups to the total employee workforce continues to increase year on year (from 90,36% in 2013 to 92,25% in 2016). Employment equity progress at a senior management level remains a key strategic focus area, with development opportunities aligned to the selection of employees from designated groups. In the last financial year, TFG applied a new sourcing strategy specific to senior management talent attraction, which resulted in the acquisition of top equity female talent appointments across the group.
105
OUR GOVERNANCEPROFILE
SUMMARY CONSOLIDATED FINANCIAL STATEMENTS APPENDICES NOTICE OF ANNUAL
GENERAL MEETING ADMINISTRATION
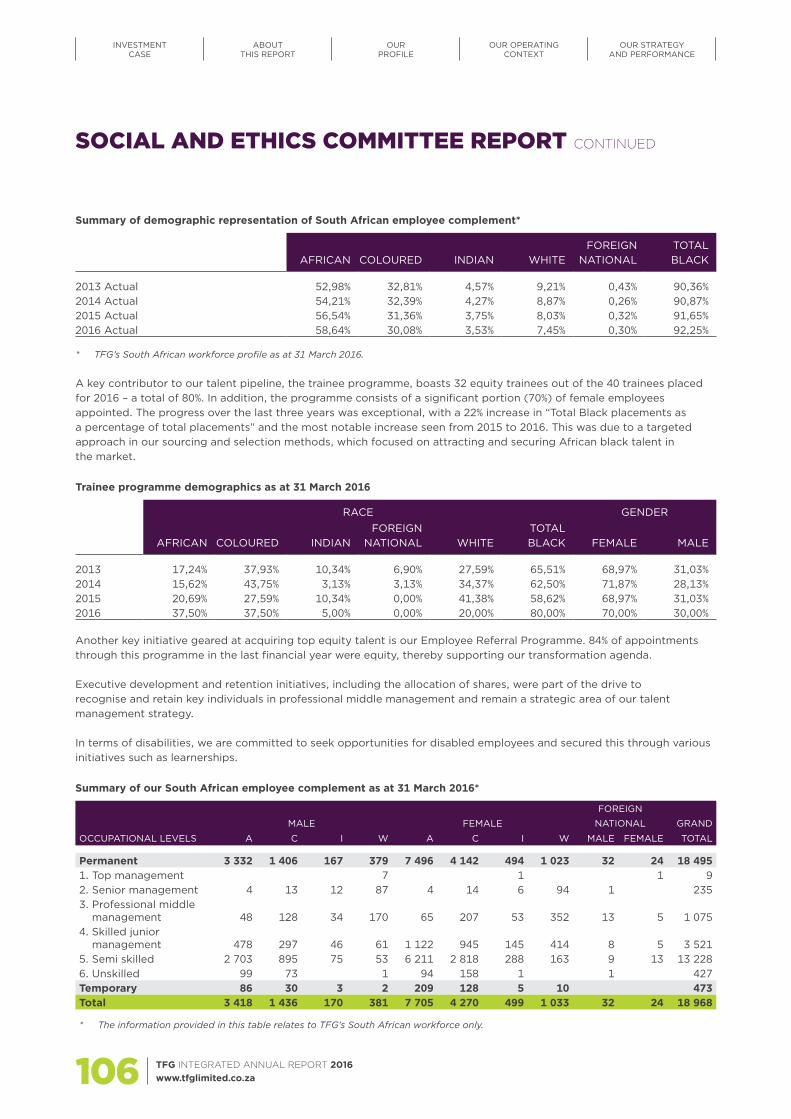
Summary of demographic representation of South African employee complement*
AFRICAN COLOURED INDIAN WHITEFOREIGN
NATIONALTOTAL
BLACK
2013 Actual 52,98% 32,81% 4,57% 9,21% 0,43% 90,36%2014 Actual 54,21% 32,39% 4,27% 8,87% 0,26% 90,87%2015 Actual 56,54% 31,36% 3,75% 8,03% 0,32% 91,65%2016 Actual 58,64% 30,08% 3,53% 7,45% 0,30% 92,25%
* TFG’s South African workforce profile as at 31 March 2016.
A key contributor to our talent pipeline, the trainee programme, boasts 32 equity trainees out of the 40 trainees placed for 2016 – a total of 80%. In addition, the programme consists of a significant portion (70%) of female employees appointed. The progress over the last three years was exceptional, with a 22% increase in “Total Black placements as a percentage of total placements” and the most notable increase seen from 2015 to 2016. This was due to a targeted approach in our sourcing and selection methods, which focused on attracting and securing African black talent in the market.
Trainee programme demographics as at 31 March 2016
RACE GENDER
AFRICAN COLOURED INDIANFOREIGN
NATIONAL WHITETOTAL
BLACK FEMALE MALE
2013 17,24% 37,93% 10,34% 6,90% 27,59% 65,51% 68,97% 31,03%2014 15,62% 43,75% 3,13% 3,13% 34,37% 62,50% 71,87% 28,13%2015 20,69% 27,59% 10,34% 0,00% 41,38% 58,62% 68,97% 31,03%2016 37,50% 37,50% 5,00% 0,00% 20,00% 80,00% 70,00% 30,00%
Another key initiative geared at acquiring top equity talent is our Employee Referral Programme. 84% of appointments through this programme in the last financial year were equity, thereby supporting our transformation agenda.
Executive development and retention initiatives, including the allocation of shares, were part of the drive to recognise and retain key individuals in professional middle management and remain a strategic area of our talent management strategy.
In terms of disabilities, we are committed to seek opportunities for disabled employees and secured this through various initiatives such as learnerships.
Summary of our South African employee complement as at 31 March 2016*
MALE FEMALE
FOREIGN
NATIONAL GRAND
OCCUPATIONAL LEVELS A C I W A C I W MALE FEMALE TOTAL
Permanent 3 332 1 406 167 379 7 496 4 142 494 1 023 32 24 18 4951. Top management 7 1 1 92. Senior management 4 13 12 87 4 14 6 94 1 2353. Professional middle
management 48 128 34 170 65 207 53 352 13 5 1 0754. Skilled junior
management 478 297 46 61 1 122 945 145 414 8 5 3 5215. Semi skilled 2 703 895 75 53 6 211 2 818 288 163 9 13 13 2286. Unskilled 99 73 1 94 158 1 1 427Temporary 86 30 3 2 209 128 5 10 473Total 3 418 1 436 170 381 7 705 4 270 499 1 033 32 24 18 968
* The information provided in this table relates to TFG’s South African workforce only.
SOCIAL AND ETHICS COMMITTEE REPORT CONTINUED
TFG INTEGRATED ANNUAL REPORT 2016 www.tfglimited.co.za106
INVESTMENT CASE
ABOUTTHIS REPORT
OUR PROFILE
OUR OPERATINGCONTEXT
OUR STRATEGY AND PERFORMANCE
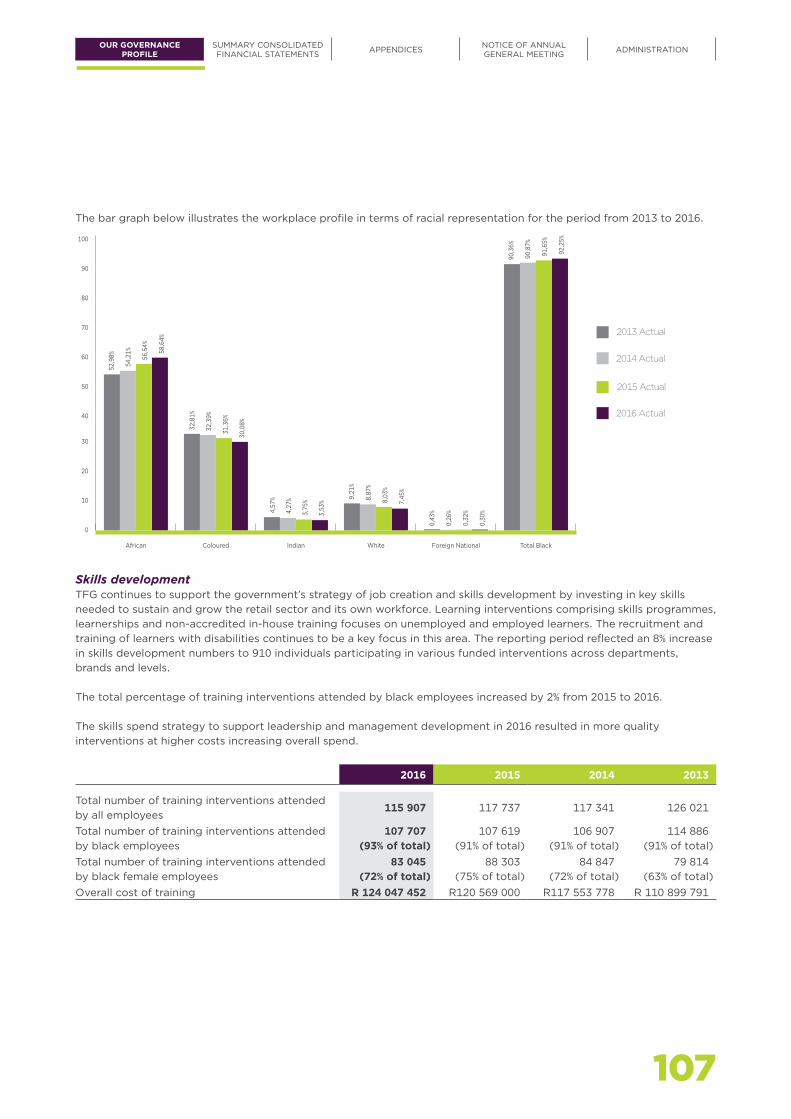
The bar graph below illustrates the workplace profile in terms of racial representation for the period from 2013 to 2016.
0
10
20
30
40
50
60
70
80
90
100
2016 Actual
2015 Actual
2014 Actual
2013 Actual
Total BlackForeign NationalWhiteIndianColouredAfrican
52,9
8%
54,2
1%
56,5
4%
58,6
4%
32,8
1%
32,3
9%
31,3
6%
30,0
8%
4,57
%
4,27
%
3,75
%
3,53
%
9,21
%
8,87
%
8,03
%
7,45
%
0,43
%
0,26
%
0,32
%
0,30
%
90,3
6%
90,8
7%
91,6
5%
92,2
5%
Skills development TFG continues to support the government’s strategy of job creation and skills development by investing in key skills needed to sustain and grow the retail sector and its own workforce. Learning interventions comprising skills programmes, learnerships and non-accredited in-house training focuses on unemployed and employed learners. The recruitment and training of learners with disabilities continues to be a key focus in this area. The reporting period reflected an 8% increase in skills development numbers to 910 individuals participating in various funded interventions across departments, brands and levels.
The total percentage of training interventions attended by black employees increased by 2% from 2015 to 2016.
The skills spend strategy to support leadership and management development in 2016 resulted in more quality interventions at higher costs increasing overall spend.
2016 2015 2014 2013
Total number of training interventions attended by all employees
115 907 117 737 117 341 126 021
Total number of training interventions attended by black employees
107 707(93% of total)
107 619(91% of total)
106 907(91% of total)
114 886(91% of total)
Total number of training interventions attended by black female employees
83 045(72% of total)
88 303(75% of total)
84 847(72% of total)
79 814(63% of total)
Overall cost of training R 124 047 452 R120 569 000 R117 553 778 R 110 899 791
107
OUR GOVERNANCEPROFILE
SUMMARY CONSOLIDATED FINANCIAL STATEMENTS APPENDICES NOTICE OF ANNUAL
GENERAL MEETING ADMINISTRATION
PREFERENTIAL PROCUREMENTIn respect of 2015, TFG achieved a score of 18,2 points out of a maximum of 20 points and remains pleased with the progress that was made in this area through an ongoing focus on the supply base. 38% of our BBBEE procurement spend applied to merchandise purchases (South Africa only) and 42% to non-merchandise goods and services (South Africa only).
ENTERPRISE DEVELOPMENTIn respect of 2015, TFG achieved a score of 15,0 points out of a maximum of 15 points, reflecting the commitment that was made to ensure the development of our local supply base.
The development of our local supply base is supported by a number of supply chain enhancement initiatives which are in place.
In addition, during the year under review, we continued to engage with a number of service providers with regard to other opportunities where we can assist in the development of our suppliers.
SOCIO-ECONOMIC DEVELOPMENTIn respect of 2015, we achieved a score of 5,0 points out of a maximum of 5 points.
TFG’s main focus is to create opportunities for employment by leading sustainable developments.
A shared value mindset has become increasingly important within our business and therefore we have strategically partnered with a number of organisations to successfully implement our strategy.
TFG also moved towards a value-added approach where our employees are involved in conveying their knowledge and expertise onto the beneficiaries. This ensures that our investment is more than just monetary as we encourage our employees to be part of our journey. After all, doing good never goes out of fashion!
Further information on our projects can be found in the TFG sustainability overview report.
Prof F AbrahamsChairperson: Social and ethics committee
29 June 2016
SOCIAL AND ETHICS COMMITTEE REPORT CONTINUED
TFG INTEGRATED ANNUAL REPORT 2016 www.tfglimited.co.za108
INVESTMENT CASE
ABOUTTHIS REPORT
OUR PROFILE
OUR OPERATINGCONTEXT
OUR STRATEGY AND PERFORMANCE

NOMINATION COMMITTEEREPORTThe nomination committee is pleased to provide a report of their activities for the 2016 financial year.
NOMINATION COMMITTEE MANDATEThe committee is governed by a charter which sets out its mandate and key responsibilities, and reports are provided to the supervisory board on a quarterly basis.
DUTIES OF THE COMMITTEEThe key responsibilities of the committee are to ensure the following:
• There is appropriate board composition by:– complying with the King Code of Governance for
South Africa 2009 (King III) recommended mix of executive and non-executive directors;
– complying with the King III recommended practice that the majority of non-executive directors are independent by:0 ensuring that annual disclosures are completed
by each director, and0 reviewing the independence status of
non-executive directors at least annually and ensuring that they are subjected to review by the whole board where required by King III;
– ensuring that the individual directors possess the relevant skills and experience;
– ensuring that collectively the board comprises directors with a mix of relevant skills and experience; and
– ensuring that board diversity (age, gender and race) receives appropriate focus.
• The board is supported by an appropriate committee structure and committees are chaired by suitably qualified non-executive directors.
• The composition of the various subcommittees is in accordance with King III recommendations as far as practically possible.
• The performance of the individual directors, committees and the board as a whole is evaluated from time to time.
• A recommendation is made to the board in respect of directors who are due to retire by rotation.
• There is a programme for director induction and a focus on continued education of non-executive directors.
• Succession planning for the board and its subcommittees and for key senior executives is in place.
• Talent development of senior executives is taking place and the committee remains abreast of all proposed senior staffing changes.
COMMITTEE COMPOSITION AND ATTENDANCE AT MEETINGSAt the year end, the committee comprised two independent non-executive directors and one non-executive director. In addition, the CEO attends meetings of this committee by invitation.
Meeting attendance
NAME OF MEMBER4 MAY 2015
31 AUGUST 2015
8 MARCH 2016
M Lewis (Chairman) P P P
S E Abrahams P P P
R Stein P P PA D Murray (by invitation) P P P
The committee held three meetings during the 2016 financial year. The key issues which were considered by the committee during the current year included the following:
• Appointment of a Chairman following Mr D M Nurek’s resignation on 19 June 2015
• Recommendation that Mr R Stein remains on the board as a non-executive following his retirement in June 2015
• Appointment of new CFO, Mr A E Thunström in July 2015
• Following board changes this year, review and amendment of committee composition to ensure appropriate mix of skills
• Oversight of board evaluation process with a key action being the recommended appointment of an additional director with international experience (completed with the appointment of Mr G H Davin in November 2015)
• CEO and general succession
M Lewis Chairman
29 June 2016
109
OUR GOVERNANCEPROFILE
SUMMARY CONSOLIDATED FINANCIAL STATEMENTS APPENDICES NOTICE OF ANNUAL
GENERAL MEETING ADMINISTRATION

110 TFG INTEGRATED ANNUAL REPORT 2016 www.tfglimited.co.za
INVESTMENT CASE
ABOUTTHIS REPORT
OUR PROFILE
OUR OPERATINGCONTEXT
OUR STRATEGY AND PERFORMANCE

RISKREPORTThe risk committee is pleased to present its report for the financial year ended 31 March 2016 to the shareholders of TFG.
The TFG Enterprise Risk Management (ERM) framework provides a structured, dynamic and consistent approach to risk management. It is an integrated approach to strategy, risk and performance. The framework is in line with the King Code on Corporate Governance 2009 (King III) and relevant international standards, including ISO 31 000 and the COSO framework.
The ERM framework ensures that emerging risks that could affect the group’s strategy and achievement of objectives are identified and managed in accordance with acceptable risk levels. Identified risks are documented in a risk register and are assessed on the basis of likelihood of occurrence and impact. The group continuously seeks to improve and enhance the risk management process and made progress in developing its risk appetite for managing significant risks that could have a material impact on the business.
The board confirms that the group’s risk management, mitigation and monitoring processes were effective in
limiting the potential impact of risks on the business during the period. While the board is ultimately responsible to maintain an effective risk management process, it is assisted by the risk and audit committees.
INFORMATION TECHNOLOGY GOVERNANCEAn IT steering committee was established, which includes representatives from the various trading and services divisions. The committee meets quarterly and reviews the emerging IT-related risks, disaster recovery plans and other significant initiatives. The risk committee receives feedback on matters discussed and monitors IT initiatives to ensure these do not pose a risk to the continuity of the group’s operations.
LEGISLATIVE COMPLIANCEThe risk committee is updated on all matters of compliance. No fines and/or censures were incurred during this period, and there were no instances of prosecutions of directors or officials for failure to comply with any applicable legislation or codes of conduct.
RISK MANAGEMENT PROCESSThe TFG risk management process is continuous and is depicted in the diagram below:
COMMUNICATIONAND
CONSULTATION
IDENTIFYRISKS AND
EVENTS
EVALUATE IMPACT AND LIKELIHOOD
ASSESS EFFECTIVENESS OF CONTROLS
DEVELOP RISK MITIGATION
STRATEGY
MONITOR AND REVIEW
Risks are monitored continuously and are discussed formally once a year, with quarterly reviews by the executive management. The risk process includes South Africa, Africa and UK operations.
The audit committee focuses on the financial risks and all other risks are reviewed by the risk committee.
111
OUR GOVERNANCEPROFILE
SUMMARY CONSOLIDATED FINANCIAL STATEMENTS APPENDICES NOTICE OF ANNUAL
GENERAL MEETING ADMINISTRATION
ENTERPRISE RISK RESPONSE AND CONTROLS
REGULATORY RISKS
Increasing complexity of the South African regulatory environment
The legal and compliance department monitors significant risks and provides the business with updates and training as required. Regular reports are provided to senior management and the audit and risk committees respectively.
Introduction of credit legislation hampering ability to increase credit limits and customer base
The group strategy and related initiatives are in place to grow TFG’s account base and the average spend per account.
Increasing footprint of the group into other jurisdictions including Africa and those operated by Phase Eight and Whistles
The compliance department was restructured to give advice and support to new territories, including Africa and Phase Eight.
ECONOMIC RISKS
Our customer base and average credit spend do not grow sufficiently to support our turnover targets and the competitive advantage of in-house credit is reduced
The group manages its Rewards programme to stimulate cash and credit, and continues to review available credit products with the potential to attract less debt-vulnerable accounts (LSM 8+).
Instability of the South African financial market influences available funding and increases cost of capital
Treasury meetings are held monthly to review funding requirements and options. The funding strategy is presented to and reviewed by the board at each meeting.
The impact of global financial instability and the effect of fluctuating exchange rates on purchasing power and the ability to remain price competitive
The strategy for purchasing forward cover is reviewed regularly to ensure it remains relevant and provides the best possible protection against currency fluctuations for committed and future orders.
Current consumer debt levels inhibit credit and cash sales
The group manages its Rewards programme to stimulate cash and credit, and continues to review available credit products with the potential to attract less debt-vulnerable accounts (LSM 8+).
Increase in bad debts and delinquencies Credit applications are reviewed for fraud indicators and assessed against NCA-compliant internal scorecards, credit bureau scores and verification of employment where necessary. Collection strategies are reviewed regularly with the assistance of internal behavioural and credit bureau scorecards.
The weakening economy, increasing cost of living and high level of retrenchments negatively affects TFG’s customers’ purchasing power
The group continually strives to increase accessibility to a broad spectrum of the market by growing its footprint in varied locations. In addition, it continues to refine credit score models for collections and follow-ups to assist customers in maintaining an open-to-buy position.
The weakening economy leads to the collapse of key suppliers
The group’s supply chain strategy includes sourcing alternate suppliers and maintaining relationships with relevant government, industry and trade union organisations. This includes building sustainable relationships with local suppliers and the continuous performance measurement and grading of suppliers.
The landscape in which the group operates changed during the year under review. At this stage last year, the country experienced a significant number of power outages. This situation stabilised and, although the group mitigations remain in place, the risk decreased. Recent events led to instability in the economy, which influences available capital and affects consumers. Our consumer have less disposable income and this increases the risk to turnover and debtor delinquencies.
The group has identified the following key risks:
RISK REPORT CONTINUED
TFG INTEGRATED ANNUAL REPORT 2016 www.tfglimited.co.za112
INVESTMENT CASE
ABOUTTHIS REPORT
OUR PROFILE
OUR OPERATINGCONTEXT
OUR STRATEGY AND PERFORMANCE
ENTERPRISE RISK RESPONSE AND CONTROLS
OPERATIONAL RISKS
Continued high levels of crime (i.e. burglaries and armed robberies but excluding credit fraud) reducing the operating margin
The group subscribes to a culture of zero tolerance and recently appointed a Head of Forensics to coordinate investigation, engage with anti-crime forums, other retailers, mobile providers, industry bodies and South African Police Service (SAPS). Various analytical tools are employed to identify trends. The group has also embarked on the roll-out of a revised and enhanced security strategy.
The destruction of head office buildings or distribution centres (including international operations)
Business continuity plans were developed across the group. These plans are reviewed annually.
Failure of IT infrastructure Disaster recovery plans are in place across the group.
Power outages’ impact on the stores’ ability to trade
The group continues to monitor Eskom’s announcements to proactively anticipate power outages. Generators were installed at the head office and main warehouses, and selected stores are fitted with phase inverters.
WHISTLE-BLOWINGThe group has adopted a zero tolerance approach to fraud, corruption and other forms of crime or dishonesty. Measures were implemented to assist in minimising the number of incidents:
• The board promotes a culture of openness and transparency throughout the organisation in accordance with the group’s values of trust and mutual respect.
• Encourage whistle-blowing through the outsourced Deloitte tip-off anonymous line. A whistle-blowing facility for the reporting of suspected fraud and unethical behaviour has been in place since February 1998. Reports are submitted to the group forensics department for investigation.
• Conduct forensic investigations and recommend corrective action where applicable.
During the year, 141 reports were received (2015: 114). These matters were independently investigated leading to appropriate disciplinary action including dismissals.
E OblowitzChairman: Risk committee
29 June 2016
113
OUR GOVERNANCEPROFILE
SUMMARY CONSOLIDATED FINANCIAL STATEMENTS APPENDICES NOTICE OF ANNUAL
GENERAL MEETING ADMINISTRATION

REMUNERATIONREPORTLETTER FROM THE CHAIRMAN OF THE REMUNERATION COMMITTEE TO SHAREHOLDERSWe are pleased to present the remuneration report for the 2016 financial year. This report summarises the philosophy, principles and approach to remuneration at TFG as it applies to executive directors, non-executive directors and other employees. It details the policy and principles set by the remuneration committee (Remco) for each of the primary components of remuneration.
In addition, it expands on and explains the implementation of this policy for each of the pay components, depicting the resulting remuneration mix and remuneration structures in detail. We disclosed the changes made to each component in the past year as part of the continuous need to revise and improve our remuneration practices to align with our strategy and respond to current trends and specific circumstances.
TFG operated in a difficult economic environment in light of the slow pace of growth in the domestic market. Despite this, our group turnover increased by 31,2%. We experienced strong cash sales growth and pleasing HEPS growth levels. More details are disclosed in the Chief Executive Officer’s report on page 44.
Mr D M Nurek retired from the board and Remco on 19 June 2015 and was replaced by Mr M Lewis. We acknowledge the valuable role Mr Nurek played in the Remco over many years, and we welcome the international experience and insights Mr Lewis brings to the committee.
The CEO, Mr A D Murray, reaches the normal retirement age of 60 in March 2017. Mr Murray agreed not to retire at that date and agreed to extend his tenure as part of our succession strategy. Consequently, and in consultation with the nomination committee, Remco structured his remuneration package to facilitate, inter alia, an orderly and smooth transition to his successor. This matter is covered in more detail in part 1 of this report.
The remuneration and shareholdings of the directors and prescribed officers of TFG Limited are disclosed, as well as the fees paid to non-executive directors. When setting and reviewing the remuneration policy, we have taken into account the best practice requirements of corporate governance, including the draft King IV report on corporate governance (King IV). In addition, the remuneration packages for directors and senior executives are determined after due consideration of their specific performance, experience and responsibilities. This determination includes engaging external remuneration consultants and performing an extensive independent benchmarking exercise of similar roles in companies comparable to TFG’s size, industry, complexity and risk profile.
The remuneration report is segmented into two parts. The remuneration policy is set out first (part 1), followed by the implementation of the remuneration policy in our 2016 financial year (FY2016) (part 2). We are of the view that the implementation of the policy achieved its FY2016 strategic objectives.
We took note of comments received from shareholder advisors and our investors that arose from the shareholder approval of the remuneration report for the 2015 financial year. Some of the comments from shareholder advisors and our investors, and our responses to those comments, are set out in the table alongside.
As in previous years, we will submit our remuneration report for shareholder approval at our annual general meeting (AGM) through a non-binding advisory vote. We request that you demonstrate your support of our policy, and we welcome any comments and/or suggestions for improvement that you may have.
E OblowitzChairperson of the remuneration committee
TFG INTEGRATED ANNUAL REPORT 2016 www.tfglimited.co.za114
INVESTMENT CASE
ABOUTTHIS REPORT
OUR PROFILE
OUR OPERATINGCONTEXT
OUR STRATEGY AND PERFORMANCE

SHAREHOLDER ADVISOR/INVESTOR COMMENT RESPONSE FROM TFG REMCO
There should be more than one performance measure for short-term incentives (STI) and long-term incentives (LTI).
• STI has multiple performance measures, namely divisional profit before tax (PBT), group earnings before interest and tax (EBIT) and individual performance rating.
• As from April 2016, we introduced return on capital employed (ROCE) as a secondary LTI performance condition for performance shares (forfeitable shares).
There was inadequate disclosure of performance criteria for STI and LTI, and a lack of disclosure of weightings.
The weightings and performance conditions are disclosed under part 1 of the report.
The performance criteria for the long-term incentive plan should be reviewed.
The performance criteria is reviewed on an annual basis and we are confident that the performance conditions for the FSP and SAR respectively are sufficiently stretching and robust. Taking into account various macroeconomic and retail economic forecast, Remco has decided that the FSP HEPS vesting of CPI +2% will remain unchanged.
Basic parameters of executive contracts should be disclosed.
The basic parameters of executive contracts were disclosed in part 1 of the report.
Share usage limit is set at 7,5%, which is above the ISS recommended limit of 5% for mature companies.
In response to comments received from investors and shareholder advisors, Remco further reduced the share usage limit to 5%.
115
OUR GOVERNANCEPROFILE
SUMMARY CONSOLIDATED FINANCIAL STATEMENTS APPENDICES NOTICE OF ANNUAL
GENERAL MEETING ADMINISTRATION
PART 1: REMUNERATION POLICY
PrinciplesTFG’s remuneration policy, as determined by the TFG Remco, aims to attract, engage and retain the best talent that is essential for the implementation of its business strategy and the achievement of its performance objectives while it operates within the group’s approved risk and governance frameworks. The remuneration policy is an enabler for creating sustainable and long-term positive returns for shareholders.
Remuneration of executives seeks to achieve the following principal objectives:
• External equity, ensuring executives are rewarded in line with the practice in national and retail markets, taking all relevant and appropriate factors into account
• Internal equity, ensuring executives are remunerated correctly in relation to each other, in recognition of their individual contributions and accountabilities
• Performance alignment, ensuring executives and employees are aware of the requirements of strong short-term and long-term performance and its rewards
• An appropriate remuneration mix, establishing a balance between base pay, short-term incentives (STI) and long-term incentives (LTI)
Remuneration must be balanced with attractive benefits, an enjoyable, ethical and values-based working environment and the opportunity for employees to develop and grow. The Remco is also committed to fair and responsible remuneration. The Chairperson of the social and ethics committee is also a member of the remuneration committee and due cognisance is paid to appropriate recommendations from the social and ethics committee in this regard.
Role of remuneration committeeThe Remco’s primary function is to set the group’s remuneration strategy, policies and practices. The committee is responsible for recommending, reviewing and approving all remuneration components such as base pay (including non-executive directors’ fees), STI and LTI. The Remco implements its board subcommittee mandate through its consultative interaction with board members, external consultants, management (including dedicated human resource specialists) and shareholders. In line with King IV, the majority of members are independent non-executive directors.
In addition to members of the Remco, an independent advisor attends meetings on a regular basis. The CEO attends meetings by invitation and is not present when his remuneration is discussed.
Further details on the role and membership of the Remco are detailed in the corporate governance section of this integrated annual report on page 96.
The terms of reference for the Remco, which are reviewed at least annually to ensure appropriateness and compliance, are available on our website.
Key items considered by the remuneration committee during the year under reviewBase pay• Approval of annual merit increase guidelines for
pensionable salary• Approval of annual increases in travel and housing
allowances• Approval of increases for union members (in line
with the two-year agreement signed in the 2015 financial year)
• Review and analysis of an external independent remuneration benchmarking exercise for senior executives and directors
• Approval of merit increases and promotions for senior executives and directors
REMUNERATION REPORT CONTINUED
TFG INTEGRATED ANNUAL REPORT 2016 www.tfglimited.co.za116
INVESTMENT CASE
ABOUTTHIS REPORT
OUR PROFILE
OUR OPERATINGCONTEXT
OUR STRATEGY AND PERFORMANCE
STI• Confirmation of divisional and group performance
criteria and resultant annual bonus payments• Approval of the Group Annual Bonus Scheme
targets at group and divisional levels for the 2016 financial year
• Approval of individual performance ratings for senior executives and directors
• Approval of the overall distribution curve based on the individual performance ratings for all participants in the scheme
• Review and approval of STI payment multiples linked to guaranteed pay (base pay) effective in the 2017 financial year
LTI• Confirmation of group performance, and resultant
authority to convert share appreciation rights and vesting of forfeitable shares
• Approval of June 2015 share award allocation for share appreciation rights and forfeitable shares (including the share award mix and performance conditions)
• Conducted an assessment to include a secondary measure (returns-based) for the Forfeitable Share Scheme (performance shares)
• Review and approval of LTI allocation multiples linked to guaranteed pay (base pay) effective in the 2017 financial year (June 2016)
• Approval of the change in the share scheme usage limit from 7,5% to 5%
Non-executive directors • Noted that the recommendation of board fees
and change in the annual increase cycle for non-executive directors (including foreign non-executive directors), effective from 1 October 2015 to 30 September 2016, was approved by shareholders at the AGM in September 2015
• Subsequent to the year under review, approval of a recommendation of board fees for the period 1 October 2016 to 30 September 2017, for approval by shareholders at the 2016 AGM
117
OUR GOVERNANCEPROFILE
SUMMARY CONSOLIDATED FINANCIAL STATEMENTS APPENDICES NOTICE OF ANNUAL
GENERAL MEETING ADMINISTRATION
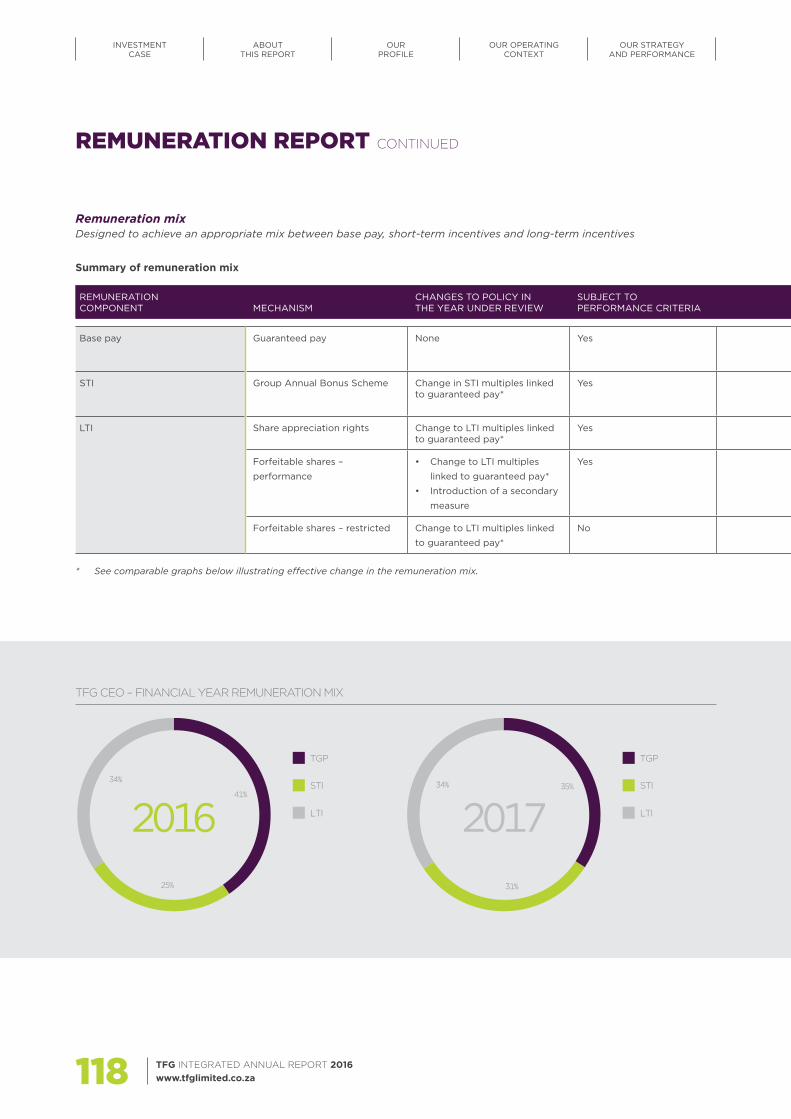
TGP
LTI
STI
TFG CEO – FINANCIAL YEAR REMUNERATION MIX
2016
25%
34%
41%
TFG CEO – 2017 FINANCIAL YEAR REMUNERATION MIX
2017
31%
34% 35%
TGP
LTI
STI
REMUNERATION COMPONENT MECHANISM
CHANGES TO POLICY IN THE YEAR UNDER REVIEW
SUBJECT TO PERFORMANCE CRITERIA
APPLICABLE PERFORMANCE CRITERIA
PERFORMANCE CONDITION
MINIMUM PERFORMANCE PERIOD
STRATEGIC PURPOSE OF COMPONENT
Base pay Guaranteed pay None Yes Performance review Merit increase approved by Remco
n/a Attracts and retains key talent, with dual focus on external market equity and internal equity
STI Group Annual Bonus Scheme Change in STI multiples linked to guaranteed pay*
Yes Earnings before interest and tax (EBIT), individual performance and divisional profit growth
Set by Remco each year One year Rewards employees for achieving or exceeding targeted performance levels
LTI Share appreciation rights Change to LTI multiples linked to guaranteed pay*
Yes HEPS growth (continuing operations)
CPI 3 years from date of grant Aligns executive and key management interests with shareholders’ interests
Forfeitable shares –
performance
• Change to LTI multiples
linked to guaranteed pay*
• Introduction of a secondary
measure
Yes • HEPS growth (continuing
operations)
• ROCE
• CPI plus 2%
• Set by Remco each year
3 years from date of grant
Forfeitable shares – restricted Change to LTI multiples linked
to guaranteed pay*
No n/a n/a 3 years from date of grant
* See comparable graphs below illustrating effective change in the remuneration mix.
TFG CEO – FINANCIAL YEAR REMUNERATION MIX
2016 2017
Remuneration mixDesigned to achieve an appropriate mix between base pay, short-term incentives and long-term incentives
Summary of remuneration mix
REMUNERATION REPORT CONTINUED
TFG INTEGRATED ANNUAL REPORT 2016 www.tfglimited.co.za118
INVESTMENT CASE
ABOUTTHIS REPORT
OUR PROFILE
OUR OPERATINGCONTEXT
OUR STRATEGY AND PERFORMANCE

REMUNERATION COMPONENT MECHANISM
CHANGES TO POLICY IN THE YEAR UNDER REVIEW
SUBJECT TO PERFORMANCE CRITERIA
APPLICABLE PERFORMANCE CRITERIA
PERFORMANCE CONDITION
MINIMUM PERFORMANCE PERIOD
STRATEGIC PURPOSE OF COMPONENT
Base pay Guaranteed pay None Yes Performance review Merit increase approved by Remco
n/a Attracts and retains key talent, with dual focus on external market equity and internal equity
STI Group Annual Bonus Scheme Change in STI multiples linked to guaranteed pay*
Yes Earnings before interest and tax (EBIT), individual performance and divisional profit growth
Set by Remco each year One year Rewards employees for achieving or exceeding targeted performance levels
LTI Share appreciation rights Change to LTI multiples linked to guaranteed pay*
Yes HEPS growth (continuing operations)
CPI 3 years from date of grant Aligns executive and key management interests with shareholders’ interests
Forfeitable shares –
performance
• Change to LTI multiples
linked to guaranteed pay*
• Introduction of a secondary
measure
Yes • HEPS growth (continuing
operations)
• ROCE
• CPI plus 2%
• Set by Remco each year
3 years from date of grant
Forfeitable shares – restricted Change to LTI multiples linked
to guaranteed pay*
No n/a n/a 3 years from date of grant
* See comparable graphs below illustrating effective change in the remuneration mix.
TFG OPERATING BOARD – 2016 FINANCIAL YEAR REMUNERATION MIX
2016
20%
33%
47%
TGP
LTI
STI
TFG OPERATING BOARD – 2017 FINANCIAL YEAR REMUNERATION MIX
2017
23%
31%
46%
TGP
LTI
STI
TFG OPERATING BOARD – FINANCIAL YEAR REMUNERATION MIX
2016 2017
119
OUR GOVERNANCEPROFILE
SUMMARY CONSOLIDATED FINANCIAL STATEMENTS APPENDICES NOTICE OF ANNUAL
GENERAL MEETING ADMINISTRATION
During the year under review, STI and LTI multiples were adjusted marginally to bring the multiples more in line with current market benchmarks and peers. The comparative graphs on the previous page illustrate the change in the remuneration mix effective from 1 April 2016.
Each component, as well as the mix between components, is benchmarked against comparable peers and the market median using independent external objective market information, principles in King IV and expert guidance surrounding best practice.
The remuneration mix comprises base pay (guaranteed pay), short-term incentives (STI) and long-term incentives (LTI). The STI and LTI components of remuneration are designed relative to base pay to achieve an appropriate mix between base pay, short-term incentives and long-term incentives.
The remuneration mix varies by organisational level, with incentive pay (short-term and long-term) forming a more significant portion of remuneration at higher organisational levels.
The targeted remuneration mix at varying levels of organisational performance is approved by the Remco. The tables on the previous page depict the mix of remuneration components for the CEO and operating board, taking the following into account:
• Current base pay levels• Short-term incentive pay at performance tier
On Target levels• Share scheme awards at expected value, for
benchmarking purposes, on the date of award
The face value of share scheme awards is determined using industry standard option pricing formulae and probability factors, together with established performance conditions.
Base payAttracts and retains key talent, with dual focus on external market equity and internal equity
• Base pay consists of the following and applies to all permanent employees:– A pensionable salary– Travel and housing allowance (depending on
organisational level)– Employer contributions to:
0 TFG retirement fund0 Provident fund (dependent on
organisational level)0 Group life and disability benefits0 TFG medical aid scheme (where applicable)
• Base pay is reviewed annually, with reference to the market, and is targeted around the median of comparable market survey statistics.
• Base pay increases are awarded based on guidelines determined with reference to peers, independent market surveys, such as REMchannel salary survey, Hay’s salary survey and national economic indicators. The Remco also takes past and current group trading performance and current economic indicators into account when determining the annual merit increase guidelines.
• Each role is benchmarked against the market using proven job evaluation and benchmarking methods.
• TFG is sensitive to paying fair, market-related remuneration for all employees and fully supports the concept of equal pay for work of equal value in line with the Employment Equity Act 55, as amended, (the EEA). TFG monitors salary differentials for all employees performing work of equal value, and pay inequality is addressed by providing training to employees and ensuring that extensive career mapping and talent management strategies are in place.
BenefitsInfluences attraction and retention of key talent
Vehicle benefits are provided based on the employee’s organisational level and role, as defined by our travel allowance and fleet policies.
Retirement, group life and disability benefits are provided in proportion to pensionable salary. To this end, TFG contributes 12% of pensionable salary to the TFG Retirement Fund for all employees eligible for membership of the fund. Members are required to contribute 7,5% to the fund. In addition to being members of the TFG Retirement Fund, executives are also members of a provident fund. The employer contributes 1,5% of pensionable salary to the provident fund and there is no compulsory contribution required of the employee. Contributions to TFG Retirement Fund and provident fund are based on pensionable salary and no element of variable pay is regarded as pensionable.
Medical aid is income related, providing identical cover to employees on the same plans, but requiring lower contributions from lower-earning employees. Employees on one of the in-house schemes receive a 50% subsidy for all approved dependents. In this way, TFG seeks to ease the burden of the increased cost of living on its employees.
REMUNERATION REPORT CONTINUED
TFG INTEGRATED ANNUAL REPORT 2016 www.tfglimited.co.za120
INVESTMENT CASE
ABOUTTHIS REPORT
OUR PROFILE
OUR OPERATINGCONTEXT
OUR STRATEGY AND PERFORMANCE
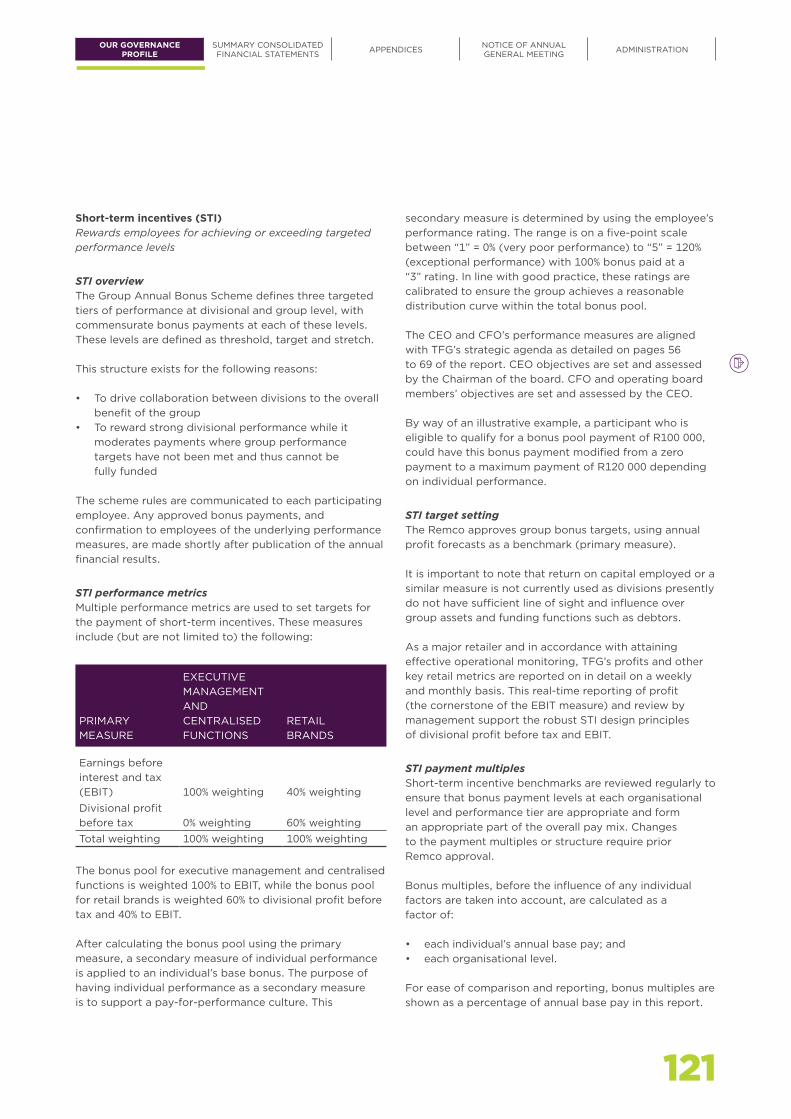
PRIMARY MEASURE
EXECUTIVE MANAGEMENT AND CENTRALISED FUNCTIONS
RETAIL BRANDS
Earnings before interest and tax (EBIT) 100% weighting 40% weightingDivisional profit before tax 0% weighting 60% weightingTotal weighting 100% weighting 100% weighting
Short-term incentives (STI)Rewards employees for achieving or exceeding targeted performance levels
STI overviewThe Group Annual Bonus Scheme defines three targeted tiers of performance at divisional and group level, with commensurate bonus payments at each of these levels. These levels are defined as threshold, target and stretch.
This structure exists for the following reasons:
• To drive collaboration between divisions to the overall benefit of the group
• To reward strong divisional performance while it moderates payments where group performance targets have not been met and thus cannot be fully funded
The scheme rules are communicated to each participating employee. Any approved bonus payments, and confirmation to employees of the underlying performance measures, are made shortly after publication of the annual financial results.
STI performance metricsMultiple performance metrics are used to set targets for the payment of short-term incentives. These measures include (but are not limited to) the following:
secondary measure is determined by using the employee’s performance rating. The range is on a five-point scale between “1” = 0% (very poor performance) to “5” = 120% (exceptional performance) with 100% bonus paid at a “3” rating. In line with good practice, these ratings are calibrated to ensure the group achieves a reasonable distribution curve within the total bonus pool.
The CEO and CFO’s performance measures are aligned with TFG’s strategic agenda as detailed on pages 56 to 69 of the report. CEO objectives are set and assessed by the Chairman of the board. CFO and operating board members’ objectives are set and assessed by the CEO.
By way of an illustrative example, a participant who is eligible to qualify for a bonus pool payment of R100 000, could have this bonus payment modified from a zero payment to a maximum payment of R120 000 depending on individual performance.
STI target settingThe Remco approves group bonus targets, using annual profit forecasts as a benchmark (primary measure).
It is important to note that return on capital employed or a similar measure is not currently used as divisions presently do not have sufficient line of sight and influence over group assets and funding functions such as debtors.
As a major retailer and in accordance with attaining effective operational monitoring, TFG’s profits and other key retail metrics are reported on in detail on a weekly and monthly basis. This real-time reporting of profit (the cornerstone of the EBIT measure) and review by management support the robust STI design principles of divisional profit before tax and EBIT.
STI payment multiplesShort-term incentive benchmarks are reviewed regularly to ensure that bonus payment levels at each organisational level and performance tier are appropriate and form an appropriate part of the overall pay mix. Changes to the payment multiples or structure require prior Remco approval.
Bonus multiples, before the influence of any individual factors are taken into account, are calculated as a factor of:
• each individual’s annual base pay; and• each organisational level.
For ease of comparison and reporting, bonus multiples are shown as a percentage of annual base pay in this report.
The bonus pool for executive management and centralised functions is weighted 100% to EBIT, while the bonus pool for retail brands is weighted 60% to divisional profit before tax and 40% to EBIT.
After calculating the bonus pool using the primary measure, a secondary measure of individual performance is applied to an individual’s base bonus. The purpose of having individual performance as a secondary measure is to support a pay-for-performance culture. This
121
OUR GOVERNANCEPROFILE
SUMMARY CONSOLIDATED FINANCIAL STATEMENTS APPENDICES NOTICE OF ANNUAL
GENERAL MEETING ADMINISTRATION
WE HAVE TAKEN NOTE OF COMMENTS RECEIVED FROM SHAREHOLDER ADVISORS AND OUR INVESTORS THAT AROSE FROM THE SHAREHOLDER APPROVAL OF THE REMUNERATION REPORT FOR THE 2015 FINANCIAL YEAR.
The Remco reviews and assesses the achievement of approved group and divisional targets and then recommends the appropriate bonus payments to the board.
The Remco has an overriding discretion in exceptional circumstances to recommend any adjustments to bonus targets and payments to the board as a result of changed business conditions, including where a payment is inappropriate given the company’s financial circumstances.
STI tiers of performance and related bonus multipleThe following rationale is applied at each tier of performance when determining and approving targets:
Threshold• Performance marginally below On Target that is
nevertheless satisfactory and substantially aligned with forecasted trading performance
• Performance at this level, or anywhere between Threshold and On Target, warrants and justifies up to a maximum of 50% of the On Target bonus value
• Threshold is thus the point under which no payment, regardless of size, is warranted
On Target• Strong performance that is above forecast trading
performance
Stretch• A superior level of performance that is sufficient to
warrant and justify the maximum potential bonus payment (double the On Target value)
• Performance above Stretch target does not result in additional bonus payment; payment cap by design is achieved once stretch targets are achieved
Remco guidelines dictate that the performance range between Threshold and On Target be substantially smaller than the range between On Target and Stretch to prevent payment for underperformance.
Threshold and On Target is paid on an all-or-nothing basis to limit bonus payments at performance below strong levels and to create a significant incentive to achieve On Target performance levels.
Performance between On Target and Stretch is rewarded proportionately and payments are capped at the Stretch level.
As mentioned earlier in this report, STI multiples have been adjusted to bring the multiples more in line with the market and TFG’s peers. As from the 2017 financial year, the On Target multiple for the CEO was increased from 62% to 90% and the average On Target multiple for the operating board was increased from 43% to 49%.
REMUNERATION REPORT CONTINUED
TFG INTEGRATED ANNUAL REPORT 2016 www.tfglimited.co.za122
INVESTMENT CASE
ABOUTTHIS REPORT
OUR PROFILE
OUR OPERATINGCONTEXT
OUR STRATEGY AND PERFORMANCE

DIVISIONAL PROFIT/EBIT PERFORMANCE LEVEL SLIDING SCALE
% ANNUAL BASE PAY ASSUMING INDIVIDUAL PERFORMANCE
MODIFIER OF 3 (MET ALL EXPECTATIONS)
% ANNUAL BASE PAY ASSUMING MAXIMUM INDIVIDUAL
PERFORMANCE MODIFIER OF 5 (EXCEEDED ALL EXPECTATIONS)
CEO
OPERATING BOARD
(AVERAGE) CEO
OPERATING BOARD
(AVERAGE)
StretchSliding scale between target and stretch
180% 97% 216%* 116%*
On Target 90% 49% 108% 58%
Threshold
No sliding scale between threshold and target 45% 24% 54% 29%
Under Threshold No payment 0% 0% 0% 0%
* 216% and 116% is the maximum resultant bonus payment expressed as a percentage of annual base pay for the CEO and average operating board respectively.
As of 1 April 2016, the resultant bonus structure for the CEO and operating board members, expressed as a percentage of annual base pay, is indicated below.
CEO and operating board bonus payments for financial year 2017
Long-term incentives (LTI)Aligns executive and key management interests with those of shareholders
Share Appreciation Rights (SARs)(Foschini 2007 Share Incentive Scheme) Participants are entitled to receive resultant shares in value equal to the growth in the share price on a defined number of rights between the date of grant and the date of conversion to resultant shares.
All shares issued under this scheme are subject to group performance criteria, which are tested against inflation-linked group HEPS targets over a period of three years with no retesting. The minimum period between grant and conversion is three years, and all rights expire after six years.
Forfeitable Shares(Foschini 2010 Share Incentive Scheme) Two instruments form part of this scheme, namely Performance shares and Restricted shares.
Performance Shares (Forfeitable Shares)Performance shares issued under this scheme are subject to group performance criteria, which are tested against inflation-linked HEPS targets and ROCE targets over a period of three years with no retesting.
The weighting between HEPS and ROCE as performance measures is 80%/20% respectively, with linear vesting for both measures.
Share awards prior to June 2016 100% vesting will take place after three years if a performance criterion of HEPS growth of CPI plus 2% is met. Linear vesting will take place if HEPS growth is between CPI and CPI plus 2%, with no vesting taking place if HEPS growth is less than CPI.
Share awards after June 2016100% vesting will take place after three years if performance criteria of HEPS growth of CPI plus 2% is met and the upper ROCE target is met. On a weighted basis, linear vesting will take place if HEPS growth is between CPI and CPI plus 2% and if ROCE is between the lower limit and the upper limit. No vesting of the HEPS weighted shares takes place if HEPS growth is less than CPI. No vesting of the ROCE weighted shares takes place if ROCE is at or below the ROCE lower limit. FY2017 share awards will be the first year that ROCE targets have been introduced as a secondary measure. Stretching and robust targets will be proposed by management for Remco approval before the end of September 2016. These targets will be disclosed in the 2017 integrated annual report.
Restricted Shares (Forfeitable Shares)Restricted shares are issued with the specific objective of improving the retention of key senior talent, while still utilising an instrument that aligns the interests of recipients with those of shareholders. Restricted shares vest after three years and are subject to continued employment.
123
OUR GOVERNANCEPROFILE
SUMMARY CONSOLIDATED FINANCIAL STATEMENTS APPENDICES NOTICE OF ANNUAL
GENERAL MEETING ADMINISTRATION

LTI allocation policyAllocations are made using predefined multiples for each share incentive type based on:
• organisational level;• annual base pay; and• targeted pay mixes, given market guidelines
appropriate for each organisational level.
Allocations are made annually on a consistent basis to establish the awards as an accumulating asset in the hands of eligible employees with the objective to incentivise them to create growth and retain such employees in service for at least three years. With annual allocations, each allocation has a three-year vesting period, resulting in each new LTI allocation providing a further three-year incentive/retention period. Ad hoc, once-off allocations are exceptional, and will normally represent upfront remuneration approved when an employee is first employed. Any such exceptional awards to executive directors are disclosed to shareholders.
The allocation levels per role for LTI (as percentage of annual base pay) are outlined below:
ROLE
EXPECTED VALUE OF ANNUAL SHARE ALLOCATION LEVEL (AS A % OF ANNUAL
BASE PAY)
CEO 100%Operating board executives 75% – 60%Balance of participating employees 55% – 15%
Benchmarks for the expected value of share awards are reviewed regularly. No changes are made without approval by the Remco and in turn by the board.
As mentioned earlier in this report, LTI multiples were adjusted to bring the multiples more in line with the market and TFG peers. As from the 2017 financial year, the expected value of annual share allocation level for the CEO was increased from 85% to 100% and operating board reduced from a range of 75% to 70% to a range of 75% to 60%. The balance of participating employees reduced from a range of 60% to 20% to a range of 55% to 15%.
100% of LTI allocations made to the CEO, operating board executives and senior executive management are subject to group performance criteria. LTI shares vest based on the performance criteria applicable to the relevant LTI scheme.
New allocations are not adjusted to compensate for any existing allocations that may be underwater.
As part of TFG’s retention strategy of other key senior employees, annual allocations are a defined mix of both performance and restricted shares. However, restricted shares are not allocated where there is another retention mechanism in place, namely a restraint of trade and minimum service agreement.
Newly appointed executives and managers may have their allocations initially increased to ensure that an appropriate holding for their role is reached over time and to create parity in the incentivising of long-term performance across similar categories of employees.
All allocations are approved by the Remco. The Remco confirms that fair principles and scheme rules were applied in determining each individual’s allocation, and also ensures that the overall share capital dilution and costs are within the defined guidelines.
Dilution limitsDespite dilution limits detailed as part of each scheme’s rules, Remco guidelines do not permit the total number of shares issued, allocated across all schemes, to exceed the following limits:
• 1% individual limit • 5% company limit
LTI shares are settled through market purchase and are therefore not resulting in a dilution to shareholders. The usage of the dilution limit in FY2016 is set out in part 2 of the report.
Performance conditions (current and forward looking) A best practice review was undertaken to evaluate the current LTI performance criteria against the market for forfeitable performance shares. After consultation with external remuneration advisors and a review of recommendations, Remco introduced a secondary measure for forfeitable performance shares as from the 2017 financial year.
Forfeitable performance sharesFrom 2017 financial year, HEPS growth of CPI plus 2% and a stretching and robust ROCE (return on capital employed) target will be used as performance measures for share awards. ROCE is the secondary measure for forfeitable share awards made to the CEO and operating board members. The use of the HEPS performance target is considered appropriate as it establishes a basis for long-term financial planning and team-based effort between share scheme participants. ROCE has been introduced as a secondary measure to further align the vesting of share awards to the board strategy. ROCE targets as proposed by management will be approved by Remco during the first half of the 2017 financial year.
REMUNERATION REPORT CONTINUED
TFG INTEGRATED ANNUAL REPORT 2016 www.tfglimited.co.za124
INVESTMENT CASE
ABOUTTHIS REPORT
OUR PROFILE
OUR OPERATINGCONTEXT
OUR STRATEGY AND PERFORMANCE

PARTICIPANTSALLOCATION FREQUENCY
PERFORMANCE TARGET*MEASUREMENT PERIOD
VESTING SUMMARYHEPS ROCE
SHARE APPRECIATION RIGHTS
CEO and operating board
One allocation per annum
HEPS growth of at least CPI, compounded annually over the measurement period
Weighting 100%
Three years
Expiry period six years from date of grant
100% vest if performance target is met and participant is employed by TFG
All lapse if performance target is not met
PERFORMANCE SHARES (FORFEITABLE SHARES)
CEO, operating board and executives (Paterson scale E1 and above)
One allocation per annum
HEPS growth of CPI plus 2%, compounded annually over the measurement period
Weighting 80%
Target reviewed and set annually by Remco
ROCE target as set by Remco
Weighting 20%
Three years
Expiry period three years from date of grant
100% vest if performance targets are met and participant is employed by TFG
Linear vesting takes place between HEPS growth of CPI and CPI plus 2% and ROCE of between lower and upper target
On a weighted basis, 100% shares that do not meet minimum HEPS criteria will lapse and 100% shares that do not meet minimum ROCE criteria will lapse
RESTRICTED SHARES (FORFEITABLE SHARES)
Senior management above the entry level of middle management i.e. Paterson scale D3, (excluding CEO, operating board and any employee with a restraint of trade and minimum service agreement)
One allocation per annum
No performance target –retention only
Three years 100% vest once measurement period has expired and participant is employed by TFG
* Note that ROCE will be introduced as a secondary measure for the first time in 2017 financial year, with a weighting of 20% ROCE and 80% HEPS. Prior to 2017 financial year, FSP share award has one performance measure, namely HEPS.
Eligibility, allocation guideline, performance conditions for vesting (weighing and vesting levels) for LTI are detailed below:
125
OUR GOVERNANCEPROFILE
SUMMARY CONSOLIDATED FINANCIAL STATEMENTS APPENDICES NOTICE OF ANNUAL
GENERAL MEETING ADMINISTRATION

Vesting on terminationIn line with scheme rules, the Remco must consider and resolve whether, based on the circumstances, a portion of the unvested LTI may vest as a result of early termination. In the case of normal retirement, death, ill health or retrenchment, all shares vest. In the case of early retirement, the Remco applies defined decision-making guidelines in determining if a portion of the shares will vest.
All shares and rights are forfeited upon an employee’s resignation or dismissal in terms of the scheme rules.
Retention strategySpecific programmes are in place to ensure that business continuity and delivery of strategy is supported through risk management of the loss of key employees
Restraints and minimum service agreementsIt is TFG’s practice to have restraint of trade and minimum service agreements in place for the CEO and operating board members. These agreements are in place for the duration of employment and contain notice periods of between 6 and 12 months. In the event of summary dismissal on grounds of misconduct (for example dishonest or fraudulent conduct), notice periods do not apply.
Ex gratia or other lump sum payments on severance or retirement Apart from the CEO transitional agreement (see alongside), there are no other agreements currently in place that provide for ex gratia or other lump sum payments to executives on severance or retirement. Executives who depart after having performed poorly are not awarded “golden handshakes”. There are no ex gratia payments made in the event of a merger or takeover.
Outcome of executive benchmarking As reported last year, the CEO received a base pay increase of 12% for the 2016 financial year.This 12% increase was the initial step in a series of steps intended to reduce the gap between historical base pay and that of comparable industry-specific peers. During the year under review, Remco once again commissioned external remuneration experts to conduct a comprehensive benchmarking survey and a specific evaluation of the complexity and increased span of responsibilities of the various executive director job functions within TFG. As a result of this survey, further steps were taken to ensure that levels of remuneration are market related.
Taking into account market benchmarking, the complexity of the job, his increased responsibilities both domestically and internationally, commensurate with the international expansion of the group and the CEO’s extensive retail experience (31 years in the retail sector and nine years as CEO of TFG), Remco considered and approved an increase to the CEO’s annual base pay to bring it in line with a market-related annual base pay of R10 million for the 2017 financial year.
Remco reviewed and approved an increase in the CFO’s annual base pay to a market-related annual base pay of R4,23 million for the 2017 financial year. Both the CEO and CFO’s pay mixes weightings remain geared towards variable pay, which contains robust performance metrics aimed at realising TFG’s overall business strategy.
We believe that TFG has now closed the gap between current annual base pay and that of comparable market peers. However, to ensure that annual base pay remains market related and competitive (supported by good remuneration governance), annual benchmarking will continue to be conducted.
Transition and succession for the CEOMr Murray will reach the normal TFG retirement age of 60 in March 2017. In order to ensure completion of a number of strategic initiatives currently underway and to enable a smooth transition to his successor, Mr Murray agreed to extend his tenure as CEO to at least the completion of the 2018 financial year and will not retire before that date. Mr Murray agreed that future annual increases to his annual base pay will only be linked to inflationary market guideline increases, if applicable.
In terms of an agreement with Mr Murray to extend his tenure until at least the completion of the 2018 financial year and for him to facilitate a smooth transition to his successor, the Remco agreed to award Mr Murray forfeitable restricted shares to the value of R20 million. This award will vest no earlier than June 2019 and will be subject to Mr Murray meeting a number of objectives set by the nomination committee regarding, inter alia, his successor and the smooth transition from Mr Murray to his successor.
Remco’s approach is to ensure an effective and deliberate handover and succession plan that preserves and builds on the value and momentum that Mr Murray and his executive team achieved. It is further aimed at ensuring active mentorship of the replacement CEO and to ensure that Mr Murray’s long-term decision-making extends beyond his
REMUNERATION REPORT CONTINUED
TFG INTEGRATED ANNUAL REPORT 2016 www.tfglimited.co.za126
INVESTMENT CASE
ABOUTTHIS REPORT
OUR PROFILE
OUR OPERATINGCONTEXT
OUR STRATEGY AND PERFORMANCE
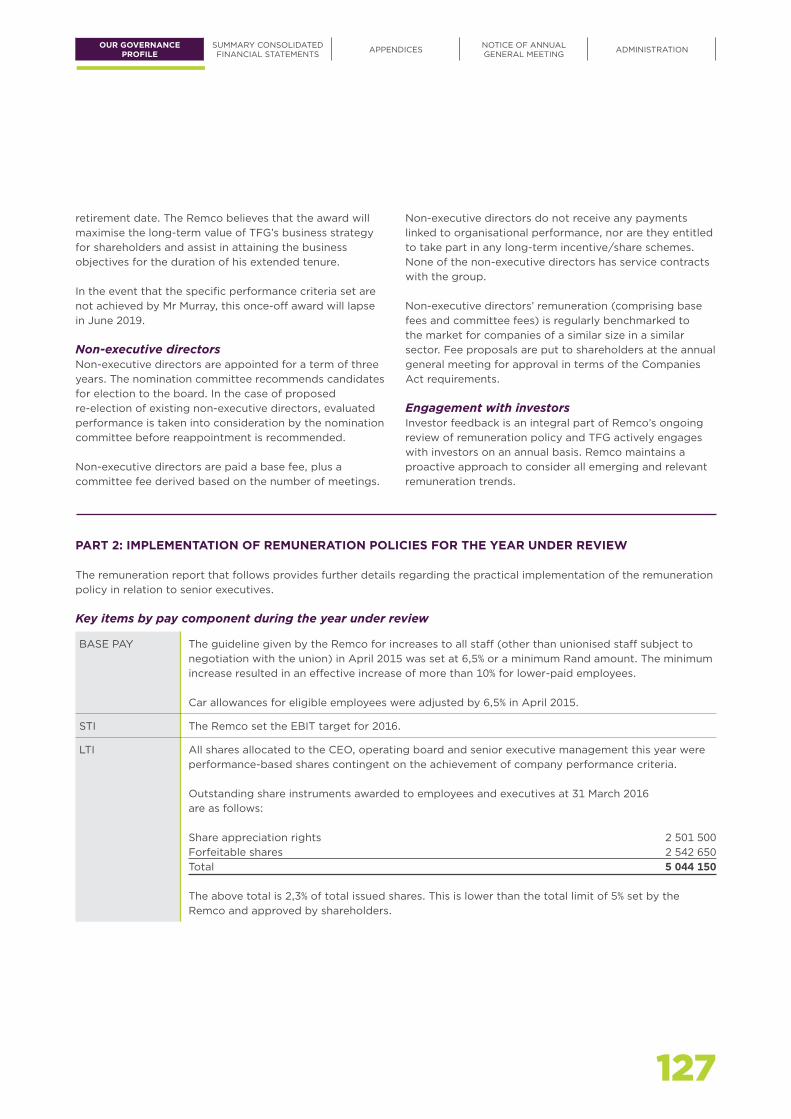
retirement date. The Remco believes that the award will maximise the long-term value of TFG’s business strategy for shareholders and assist in attaining the business objectives for the duration of his extended tenure.
In the event that the specific performance criteria set are not achieved by Mr Murray, this once-off award will lapse in June 2019.
Non-executive directorsNon-executive directors are appointed for a term of three years. The nomination committee recommends candidates for election to the board. In the case of proposed re-election of existing non-executive directors, evaluated performance is taken into consideration by the nomination committee before reappointment is recommended.
Non-executive directors are paid a base fee, plus a committee fee derived based on the number of meetings.
Non-executive directors do not receive any payments linked to organisational performance, nor are they entitled to take part in any long-term incentive/share schemes. None of the non-executive directors has service contracts with the group.
Non-executive directors’ remuneration (comprising base fees and committee fees) is regularly benchmarked to the market for companies of a similar size in a similar sector. Fee proposals are put to shareholders at the annual general meeting for approval in terms of the Companies Act requirements.
Engagement with investorsInvestor feedback is an integral part of Remco’s ongoing review of remuneration policy and TFG actively engages with investors on an annual basis. Remco maintains a proactive approach to consider all emerging and relevant remuneration trends.
PART 2: IMPLEMENTATION OF REMUNERATION POLICIES FOR THE YEAR UNDER REVIEW
The remuneration report that follows provides further details regarding the practical implementation of the remuneration policy in relation to senior executives.
Key items by pay component during the year under review
BASE PAY The guideline given by the Remco for increases to all staff (other than unionised staff subject to negotiation with the union) in April 2015 was set at 6,5% or a minimum Rand amount. The minimum increase resulted in an effective increase of more than 10% for lower-paid employees.
Car allowances for eligible employees were adjusted by 6,5% in April 2015.
STI The Remco set the EBIT target for 2016.
LTI All shares allocated to the CEO, operating board and senior executive management this year were performance-based shares contingent on the achievement of company performance criteria.
Outstanding share instruments awarded to employees and executives at 31 March 2016 are as follows:
Share appreciation rights 2 501 500Forfeitable shares 2 542 650Total 5 044 150
The above total is 2,3% of total issued shares. This is lower than the total limit of 5% set by the Remco and approved by shareholders.
127
OUR GOVERNANCEPROFILE
SUMMARY CONSOLIDATED FINANCIAL STATEMENTS APPENDICES NOTICE OF ANNUAL
GENERAL MEETING ADMINISTRATION
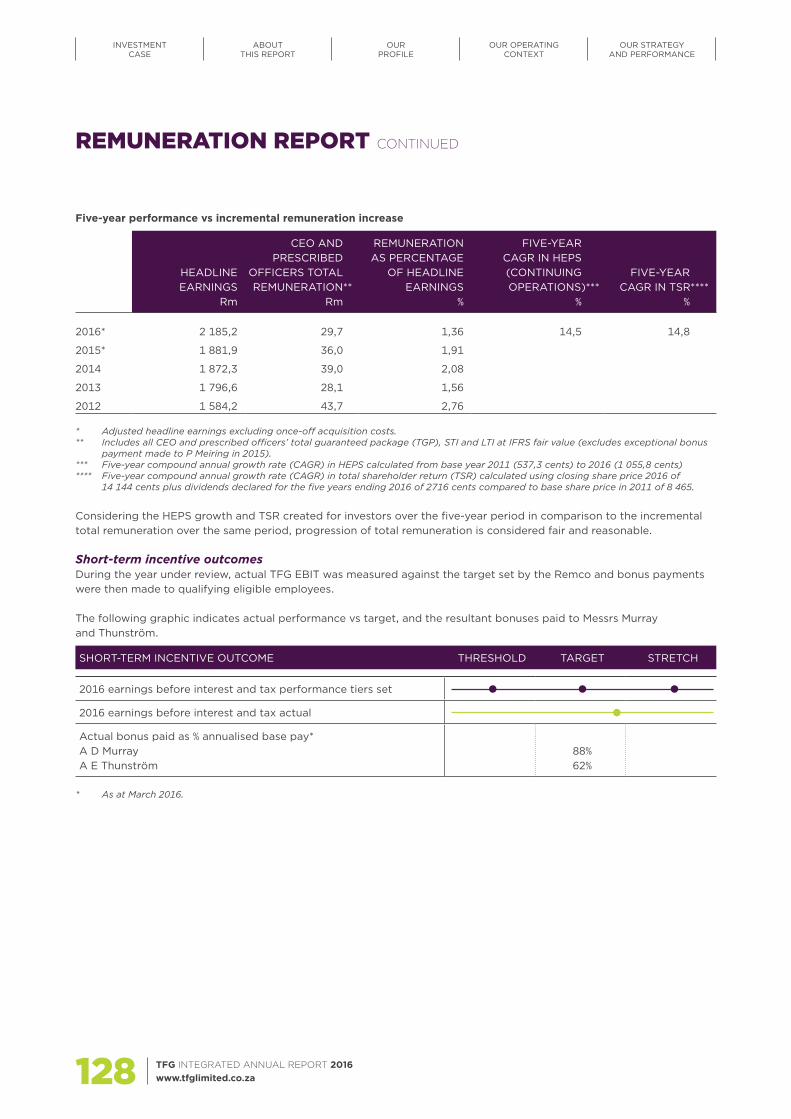
Five-year performance vs incremental remuneration increase
HEADLINE EARNINGS
Rm
CEO AND PRESCRIBED
OFFICERS TOTAL REMUNERATION**
Rm
REMUNERATION AS PERCENTAGE
OF HEADLINE EARNINGS
%
FIVE-YEAR CAGR IN HEPS (CONTINUING OPERATIONS)***
%
FIVE-YEAR CAGR IN TSR****
%
2016* 2 185,2 29,7 1,36 14,5 14,8
2015* 1 881,9 36,0 1,91
2014 1 872,3 39,0 2,08
2013 1 796,6 28,1 1,56
2012 1 584,2 43,7 2,76
* Adjusted headline earnings excluding once-off acquisition costs.** Includes all CEO and prescribed officers’ total guaranteed package (TGP), STI and LTI at IFRS fair value (excludes exceptional bonus
payment made to P Meiring in 2015).*** Five-year compound annual growth rate (CAGR) in HEPS calculated from base year 2011 (537,3 cents) to 2016 (1 055,8 cents)**** Five-year compound annual growth rate (CAGR) in total shareholder return (TSR) calculated using closing share price 2016 of
14 144 cents plus dividends declared for the five years ending 2016 of 2716 cents compared to base share price in 2011 of 8 465.
Considering the HEPS growth and TSR created for investors over the five-year period in comparison to the incremental total remuneration over the same period, progression of total remuneration is considered fair and reasonable.
Short-term incentive outcomesDuring the year under review, actual TFG EBIT was measured against the target set by the Remco and bonus payments were then made to qualifying eligible employees.
The following graphic indicates actual performance vs target, and the resultant bonuses paid to Messrs Murray and Thunström.
SHORT-TERM INCENTIVE OUTCOME THRESHOLD TARGET STRETCH
2016 earnings before interest and tax performance tiers set
2016 earnings before interest and tax actual
Actual bonus paid as % annualised base pay*A D MurrayA E Thunström
88%62%
* As at March 2016.
REMUNERATION REPORT CONTINUED
TFG INTEGRATED ANNUAL REPORT 2016 www.tfglimited.co.za128
INVESTMENT CASE
ABOUTTHIS REPORT
OUR PROFILE
OUR OPERATINGCONTEXT
OUR STRATEGY AND PERFORMANCE
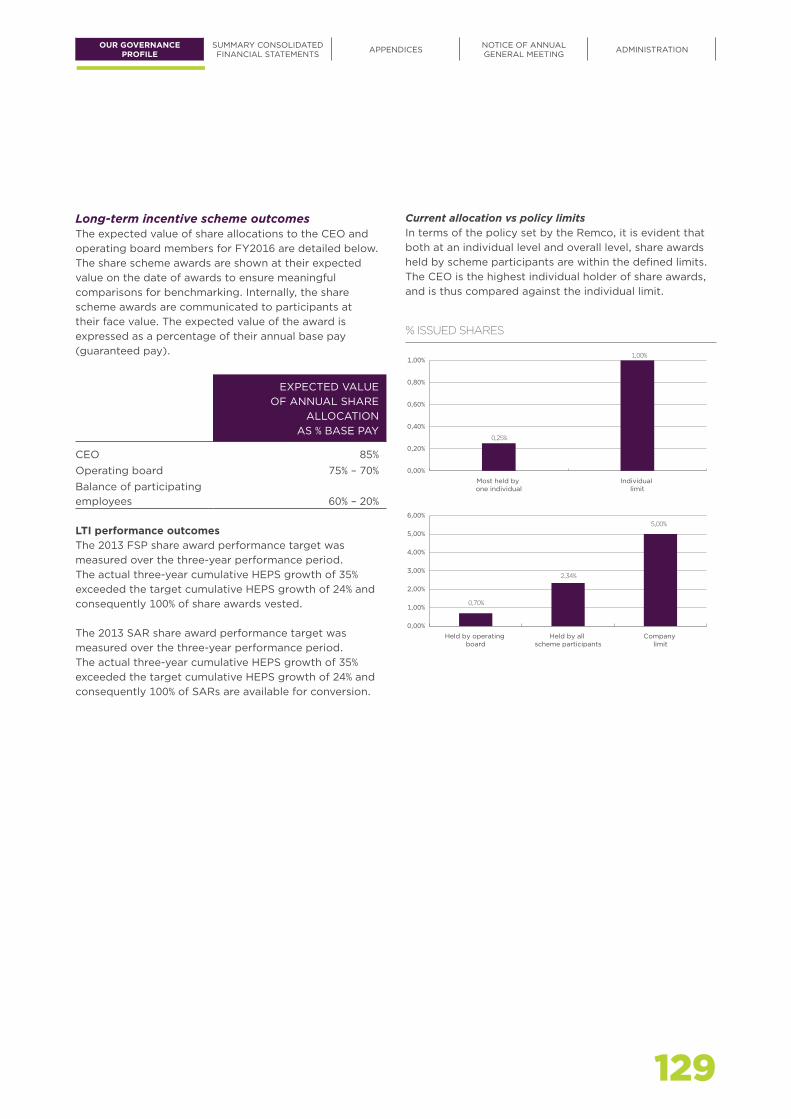
% ISSUED SHARES
0,00%
0,20%
0,40%
0,60%
0,80%
1,00%
Individual limit
Most held by one individual
0,25%
1,00%
0,00%
1,00%
2,00%
3,00%
4,00%
5,00%
6,00%
Company limit
Held by all scheme participants
Held by operating board
0,70%
2,34%
5,00%
Long-term incentive scheme outcomesThe expected value of share allocations to the CEO and operating board members for FY2016 are detailed below. The share scheme awards are shown at their expected value on the date of awards to ensure meaningful comparisons for benchmarking. Internally, the share scheme awards are communicated to participants at their face value. The expected value of the award is expressed as a percentage of their annual base pay (guaranteed pay).
EXPECTED VALUE OF ANNUAL SHARE
ALLOCATION AS % BASE PAY
CEO 85%Operating board 75% – 70%Balance of participating employees 60% – 20%
LTI performance outcomesThe 2013 FSP share award performance target was measured over the three-year performance period. The actual three-year cumulative HEPS growth of 35% exceeded the target cumulative HEPS growth of 24% and consequently 100% of share awards vested.
The 2013 SAR share award performance target was measured over the three-year performance period. The actual three-year cumulative HEPS growth of 35% exceeded the target cumulative HEPS growth of 24% and consequently 100% of SARs are available for conversion.
Current allocation vs policy limitsIn terms of the policy set by the Remco, it is evident that both at an individual level and overall level, share awards held by scheme participants are within the defined limits. The CEO is the highest individual holder of share awards, and is thus compared against the individual limit.
129
OUR GOVERNANCEPROFILE
SUMMARY CONSOLIDATED FINANCIAL STATEMENTS APPENDICES NOTICE OF ANNUAL
GENERAL MEETING ADMINISTRATION
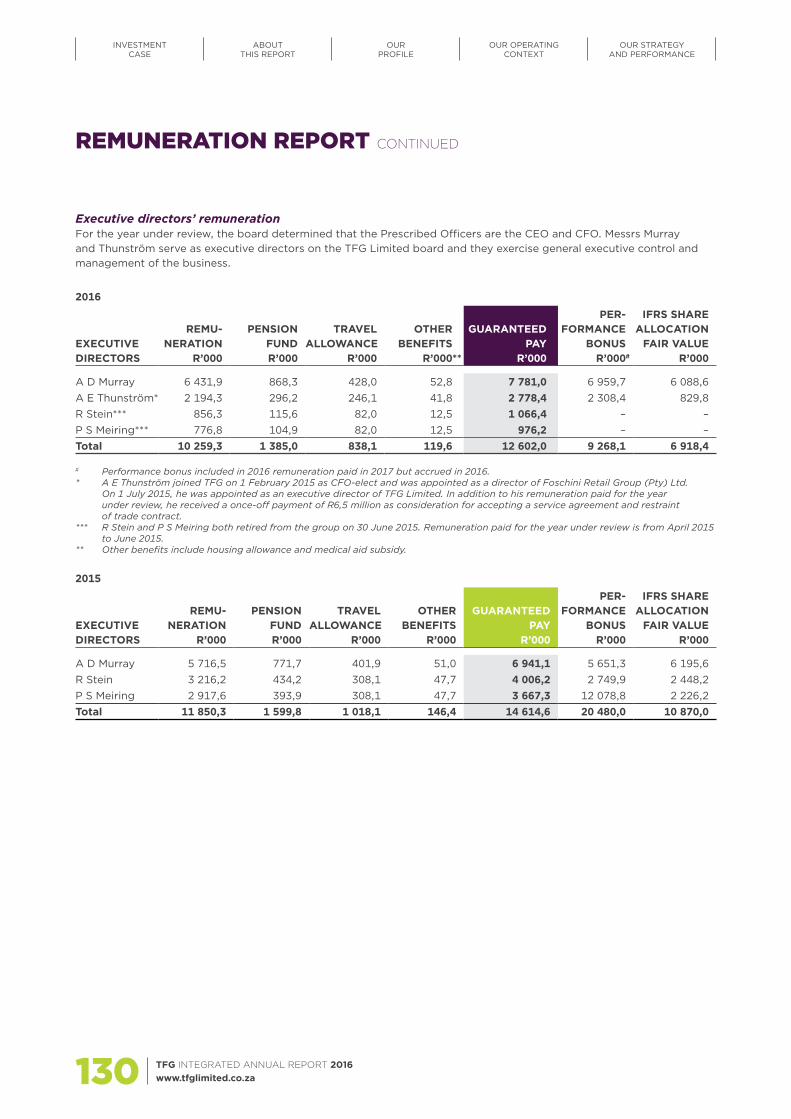
Executive directors’ remunerationFor the year under review, the board determined that the Prescribed Officers are the CEO and CFO. Messrs Murray and Thunström serve as executive directors on the TFG Limited board and they exercise general executive control and management of the business.
2016
EXECUTIVE DIRECTORS
REMU-NERATION
R’000
PENSION FUNDR’000
TRAVEL ALLOWANCE
R’000
OTHER BENEFITS
R’000**
GUARANTEED PAY
R’000
PER-FORMANCE
BONUS R’000#
IFRS SHARE ALLOCATION
FAIR VALUE R’000
A D Murray 6 431,9 868,3 428,0 52,8 7 781,0 6 959,7 6 088,6A E Thunström* 2 194,3 296,2 246,1 41,8 2 778,4 2 308,4 829,8R Stein*** 856,3 115,6 82,0 12,5 1 066,4 – –P S Meiring*** 776,8 104,9 82,0 12,5 976,2 – –Total 10 259,3 1 385,0 838,1 119,6 12 602,0 9 268,1 6 918,4
# Performance bonus included in 2016 remuneration paid in 2017 but accrued in 2016. * A E Thunström joined TFG on 1 February 2015 as CFO-elect and was appointed as a director of Foschini Retail Group (Pty) Ltd.
On 1 July 2015, he was appointed as an executive director of TFG Limited. In addition to his remuneration paid for the year under review, he received a once-off payment of R6,5 million as consideration for accepting a service agreement and restraint of trade contract.
*** R Stein and P S Meiring both retired from the group on 30 June 2015. Remuneration paid for the year under review is from April 2015 to June 2015.
** Other benefits include housing allowance and medical aid subsidy.
2015
EXECUTIVE DIRECTORS
REMU-NERATION
R’000
PENSION FUND R’000
TRAVEL ALLOWANCE
R’000
OTHER BENEFITS
R’000
GUARANTEED PAY
R’000
PER-FORMANCE
BONUS R’000
IFRS SHARE ALLOCATION
FAIR VALUE R’000
A D Murray 5 716,5 771,7 401,9 51,0 6 941,1 5 651,3 6 195,6R Stein 3 216,2 434,2 308,1 47,7 4 006,2 2 749,9 2 448,2P S Meiring 2 917,6 393,9 308,1 47,7 3 667,3 12 078,8 2 226,2Total 11 850,3 1 599,8 1 018,1 146,4 14 614,6 20 480,0 10 870,0
REMUNERATION REPORT CONTINUED
TFG INTEGRATED ANNUAL REPORT 2016 www.tfglimited.co.za130
INVESTMENT CASE
ABOUTTHIS REPORT
OUR PROFILE
OUR OPERATINGCONTEXT
OUR STRATEGY AND PERFORMANCE

Directors’ interestsAs at 31 March 2016, directors had the following interests in company issued shares:
EXECUTIVE
Total shares
’000
M Lewis
’000
E Oblowitz
’000
D Friedland
’000
N V Simamane
’000
R Stein
’000
A D Murray
’000
A E Thunström
’000
Direct beneficial 2,1 41,1 1,6 751,6 1 207,1 2 003,5Indirect beneficial 281,7 699,6 981,3Indirect non-beneficial 9 799,8 9 799,8Total 9 799,8 2,1 41,1 1,6 1 033,3 1 906,7 – 12 784,6
As at March 2016, executive directors had accepted the following share appreciation rights and forfeitable shares:
FINANCIAL YEAR OF
AWARD
FINANCIAL YEAR OF
EARLIEST DELIVERY
FINANCIALYEAR OF
LATEST DELIVERY
STRIKE PRICE PER
INSTRUMENT
NUMBER OFINSTRUMENTS
AWARDED’000
NUMBER EXERCISED
IN YEAR’000
CLOSINGNUMBER OF UNVESTED
AND/OR UNEXERCISED INSTRUMENTS
’000
AD MurraySARs 2012 2017 2018 R86,32 85,2 85,2
2013 2017 2019 R136,22 62,8 62,82014 2017 2020 R96,86 133,4 133,42015 2018 2021 R111,10 89,4 89,42016 2019 2022 R148,15 76,4 76,4
FSs 2013 2016 – 27,9 27,9 –2014 2017 – 21,7 21,72015 2018 – 38,3 38,32016 2019 – 32,8 32,8
A E ThunströmSARs 2016 2019 2022 148,15 31,2 31,2 FSs 2015 2019 – 11,8 11,8
2016 2019 – 13,4 13,4
131
OUR GOVERNANCEPROFILE
SUMMARY CONSOLIDATED FINANCIAL STATEMENTS APPENDICES NOTICE OF ANNUAL
GENERAL MEETING ADMINISTRATION
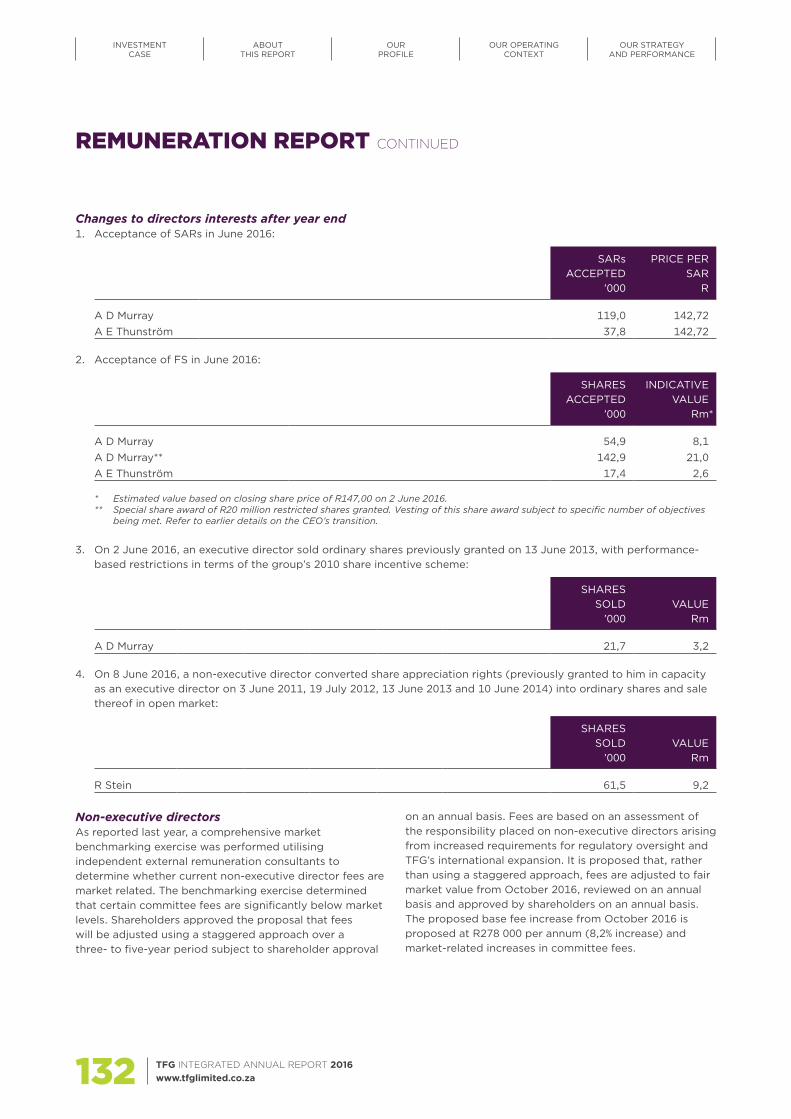
Changes to directors interests after year end1. Acceptance of SARs in June 2016:
SARs ACCEPTED
’000
PRICE PER SAR
R
A D Murray 119,0 142,72A E Thunström 37,8 142,72
2. Acceptance of FS in June 2016:
SHARES ACCEPTED
’000
INDICATIVE VALUE
Rm*
A D Murray 54,9 8,1A D Murray** 142,9 21,0A E Thunström 17,4 2,6
* Estimated value based on closing share price of R147,00 on 2 June 2016.** Special share award of R20 million restricted shares granted. Vesting of this share award subject to specific number of objectives
being met. Refer to earlier details on the CEO’s transition.
3. On 2 June 2016, an executive director sold ordinary shares previously granted on 13 June 2013, with performance-based restrictions in terms of the group’s 2010 share incentive scheme:
SHARES SOLD
’000VALUE
Rm
A D Murray 21,7 3,2
4. On 8 June 2016, a non-executive director converted share appreciation rights (previously granted to him in capacity as an executive director on 3 June 2011, 19 July 2012, 13 June 2013 and 10 June 2014) into ordinary shares and sale thereof in open market:
SHARES SOLD
’000VALUE
Rm
R Stein 61,5 9,2
Non-executive directorsAs reported last year, a comprehensive market benchmarking exercise was performed utilising independent external remuneration consultants to determine whether current non-executive director fees are market related. The benchmarking exercise determined that certain committee fees are significantly below market levels. Shareholders approved the proposal that fees will be adjusted using a staggered approach over a three- to five-year period subject to shareholder approval
on an annual basis. Fees are based on an assessment of the responsibility placed on non-executive directors arising from increased requirements for regulatory oversight and TFG’s international expansion. It is proposed that, rather than using a staggered approach, fees are adjusted to fair market value from October 2016, reviewed on an annual basis and approved by shareholders on an annual basis. The proposed base fee increase from October 2016 is proposed at R278 000 per annum (8,2% increase) and market-related increases in committee fees.
REMUNERATION REPORT CONTINUED
TFG INTEGRATED ANNUAL REPORT 2016 www.tfglimited.co.za132
INVESTMENT CASE
ABOUTTHIS REPORT
OUR PROFILE
OUR OPERATINGCONTEXT
OUR STRATEGY AND PERFORMANCE
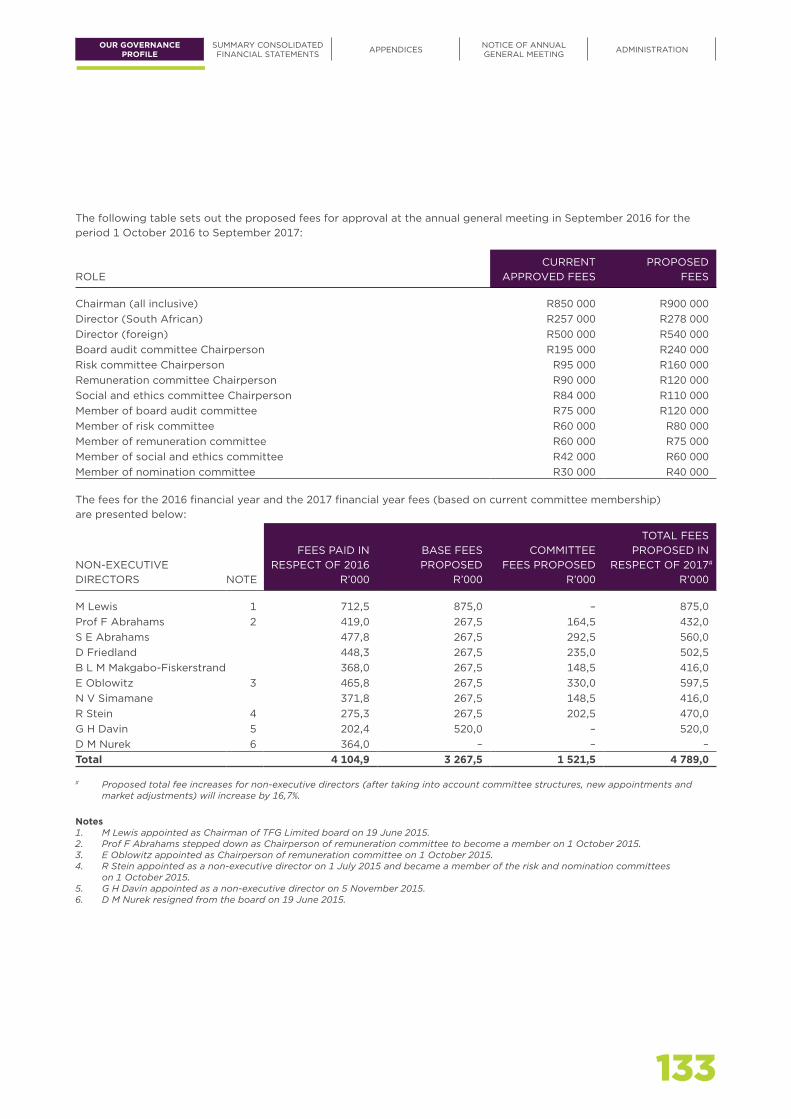
ROLECURRENT
APPROVED FEESPROPOSED
FEES
Chairman (all inclusive) R850 000 R900 000Director (South African) R257 000 R278 000Director (foreign) R500 000 R540 000Board audit committee Chairperson R195 000 R240 000Risk committee Chairperson R95 000 R160 000Remuneration committee Chairperson R90 000 R120 000Social and ethics committee Chairperson R84 000 R110 000Member of board audit committee R75 000 R120 000Member of risk committee R60 000 R80 000Member of remuneration committee R60 000 R75 000Member of social and ethics committee R42 000 R60 000Member of nomination committee R30 000 R40 000
The fees for the 2016 financial year and the 2017 financial year fees (based on current committee membership) are presented below:
NON-EXECUTIVE DIRECTORS NOTE
FEES PAID IN RESPECT OF 2016
R’000
BASE FEES PROPOSED
R’000
COMMITTEE FEES PROPOSED
R’000
TOTAL FEES PROPOSED IN
RESPECT OF 2017# R’000
M Lewis 1 712,5 875,0 – 875,0Prof F Abrahams 2 419,0 267,5 164,5 432,0S E Abrahams 477,8 267,5 292,5 560,0D Friedland 448,3 267,5 235,0 502,5B L M Makgabo-Fiskerstrand 368,0 267,5 148,5 416,0E Oblowitz 3 465,8 267,5 330,0 597,5N V Simamane 371,8 267,5 148,5 416,0R Stein 4 275,3 267,5 202,5 470,0G H Davin 5 202,4 520,0 – 520,0D M Nurek 6 364,0 – – –Total 4 104,9 3 267,5 1 521,5 4 789,0
# Proposed total fee increases for non-executive directors (after taking into account committee structures, new appointments and market adjustments) will increase by 16,7%.
Notes1. M Lewis appointed as Chairman of TFG Limited board on 19 June 2015.2. Prof F Abrahams stepped down as Chairperson of remuneration committee to become a member on 1 October 2015.3. E Oblowitz appointed as Chairperson of remuneration committee on 1 October 2015.4. R Stein appointed as a non-executive director on 1 July 2015 and became a member of the risk and nomination committees
on 1 October 2015.5. G H Davin appointed as a non-executive director on 5 November 2015.6. D M Nurek resigned from the board on 19 June 2015.
The following table sets out the proposed fees for approval at the annual general meeting in September 2016 for the period 1 October 2016 to September 2017:
133
OUR GOVERNANCEPROFILE
SUMMARY CONSOLIDATED FINANCIAL STATEMENTS APPENDICES NOTICE OF ANNUAL
GENERAL MEETING ADMINISTRATION

SUMMARY CONSOLIDATED FINANCIALSTATEMENTS
Summary consolidated statement of financial position 136
Summary consolidated income statement 137
Summary consolidated statement of comprehensive income 138
Summary consolidated statement of changes in equity 139
Summary consolidated cash flow statement 141
Summary consolidated segmental analysis 142
Selected explanatory notes to the consolidated financial statements 144
TFG INTEGRATED ANNUAL REPORT 2016 www.tfglimited.co.za134
SUMMARY CONSOLIDATED FINANCIALSTATEMENTS
135

TFG INTEGRATED ANNUAL REPORT 2016 www.tfglimited.co.za136
The Foschini Group Limited and its subsidiaries
SUMMARY CONSOLIDATED STATEMENT OF FINANCIAL POSITIONAT 31 MARCH
2016Restated
2015Rm Rm
ASSETSNon-current assetsProperty, plant and equipment (note 17) 2 335,7 1 925,2Goodwill and intangible assets (note 17) 5 577,8 4 637,0Participation in export partnerships 8,2 8,4Deferred taxation asset 527,2 354,7
8 448,9 6 925,3
Current assetsInventory (note 4) 5 116,1 3 813,9Trade receivables – retail 6 695,0 6 199,9Other receivables and prepayments 592,9 624,2Concession receivables 347,2 156,5Participation in export partnerships 6,2 13,2Cash 888,8 800,4
13 646,2 11 608,1Total assets 22 095,1 18 533,4
EQUITY AND LIABILITIESEquity attributable to equity holders of The Foschini Group Limited 9 896,7 8 130,9Non-controlling interest 4,0 2,7Total equity 9 900,7 8 133,6
LIABILITIESNon-current liabilitiesInterest-bearing debt 5 026,3 3 709,5Put option liability 48,1 20,3Cash-settled share incentive scheme 8,5 0,7Operating lease liability 238,2 223,1Deferred taxation liability 435,4 345,2Post-retirement defined benefit plan 217,3 192,6
5 973,8 4 491,4
Current liabilitiesInterest-bearing debt 3 139,4 3 333,0Trade and other payables 3 046,7 2 553,0Operating lease liability 10,8 9,0Taxation payable 23,7 13,4
6 220,6 5 908,4Total liabilities 12 194,4 10 399,8Total equity and liabilities 22 095,1 18 533,4
INVESTMENT CASE
ABOUTTHIS REPORT
OUR PROFILE
OUR OPERATINGCONTEXT
OUR STRATEGY AND PERFORMANCE

137
The Foschini Group Limited and its subsidiaries
SUMMARY CONSOLIDATED INCOME STATEMENTFOR THE YEARS ENDED 31 MARCH
2016 2015 %Continuing operations Rm Rm change
Revenue (note 5) 23 746,4 18 544,0Retail turnover 21 107,5 16 085,9 31,2Cost of turnover (10 613,1) (8 484,2)Gross profit 10 494,4 7 601,7Interest income (note 6) 1 533,0 1 367,7Other income (note 7) 1 105,9 1 090,4Trading expenses (note 8) (9 537,2) (7 252,7)Operating profit before once-off acquisition costs and finance costs 3 596,1 2 807,1 28,1Once-off acquisition costs (65,9) (292,4)Finance costs (509,0) (228,1)Profit before tax 3 021,2 2 286,6Income tax expense (863,9) (748,8)Profit from continuing operations 2 157,3 1 537,8 40,3Discontinued operationsProfit from discontinued operations, net of tax – RCS Group – 86,2Profit on disposal of discontinued operation – RCS Group – 273,2Profit for the year 2 157,3 1 897,2 13,7
Attributable to:Continuing operations 2 155,6 1 537,4Discontinued operations – 320,6Equity holders of The Foschini Group Limited 2 155,6 1 858,0Non-controlling interest 1,7 39,2Profit for the year 2 157,3 1 897,2
Earnings per ordinary share (cents)TotalBasic 1 041,5 909,4 14,5Headline 1 024,0 780,3 31,2Diluted (basic) 1 031,9 901,7 14,4Diluted (headline) 1 014,5 773,7 31,1
Weighted average ordinary shares in issue (millions) 207,0 204,3
OUR GOVERNANCEPROFILE
SUMMARY CONSOLIDATED FINANCIAL STATEMENTS APPENDICES NOTICE OF ANNUAL
GENERAL MEETING ADMINISTRATION
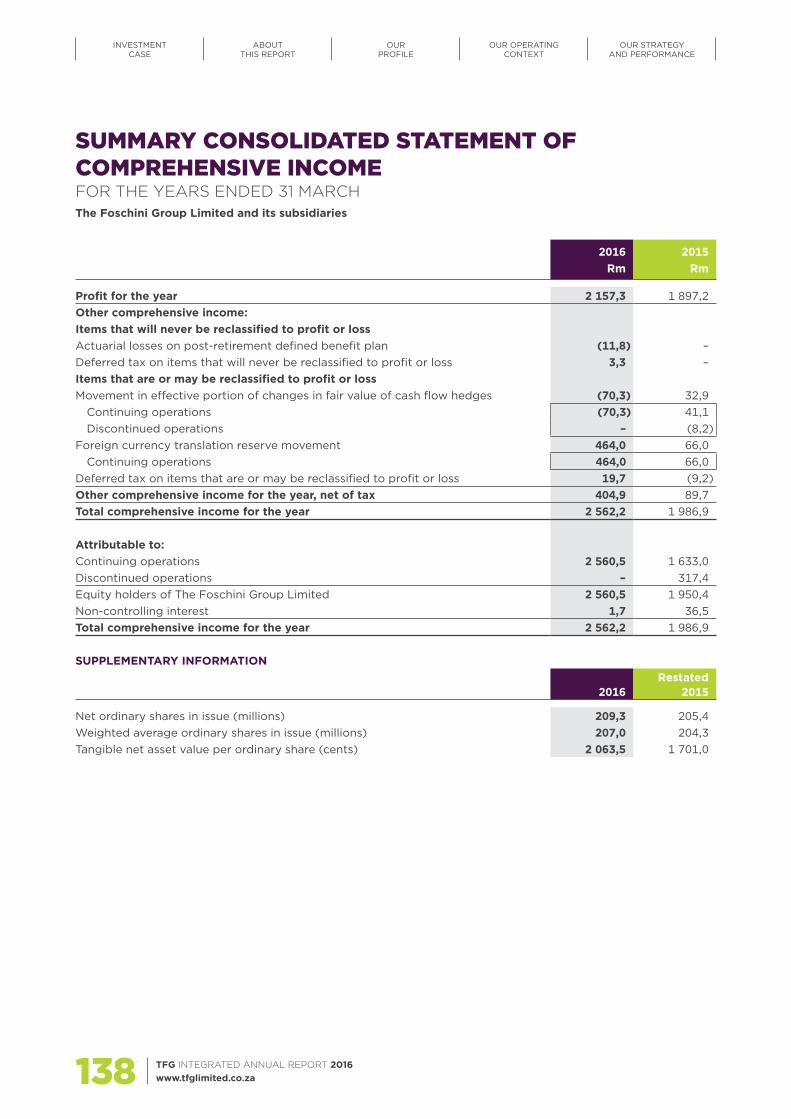
TFG INTEGRATED ANNUAL REPORT 2016 www.tfglimited.co.za138
The Foschini Group Limited and its subsidiaries
INVESTMENT CASE
ABOUTTHIS REPORT
OUR PROFILE
OUR OPERATINGCONTEXT
OUR STRATEGY AND PERFORMANCE
SUMMARY CONSOLIDATED STATEMENT OFCOMPREHENSIVE INCOMEFOR THE YEARS ENDED 31 MARCH
2016 2015Rm Rm
Profit for the year 2 157,3 1 897,2Other comprehensive income:Items that will never be reclassified to profit or lossActuarial losses on post-retirement defined benefit plan (11,8) –Deferred tax on items that will never be reclassified to profit or loss 3,3 –Items that are or may be reclassified to profit or lossMovement in effective portion of changes in fair value of cash flow hedges (70,3) 32,9
Continuing operations (70,3) 41,1Discontinued operations – (8,2)
Foreign currency translation reserve movement 464,0 66,0Continuing operations 464,0 66,0
Deferred tax on items that are or may be reclassified to profit or loss 19,7 (9,2)Other comprehensive income for the year, net of tax 404,9 89,7Total comprehensive income for the year 2 562,2 1 986,9
Attributable to:Continuing operations 2 560,5 1 633,0Discontinued operations – 317,4Equity holders of The Foschini Group Limited 2 560,5 1 950,4Non-controlling interest 1,7 36,5Total comprehensive income for the year 2 562,2 1 986,9
SUPPLEMENTARY INFORMATION
2016Restated
2015
Net ordinary shares in issue (millions) 209,3 205,4Weighted average ordinary shares in issue (millions) 207,0 204,3Tangible net asset value per ordinary share (cents) 2 063,5 1 701,0
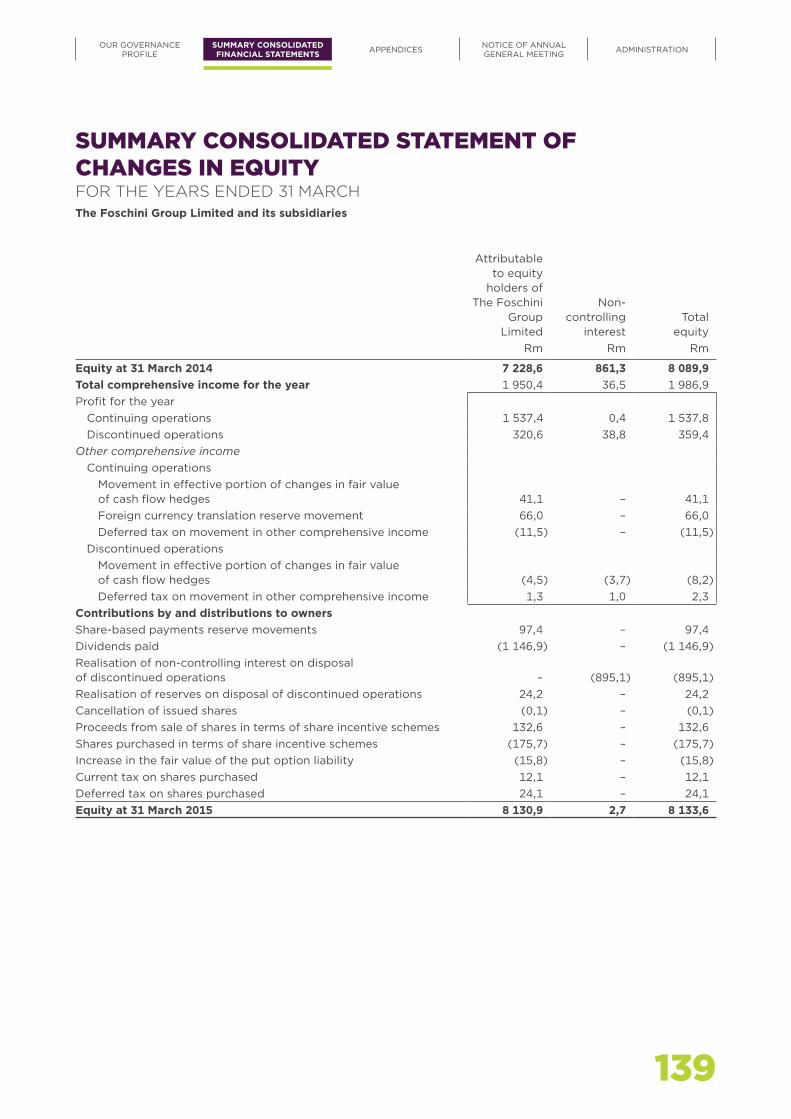
139
The Foschini Group Limited and its subsidiaries
OUR GOVERNANCEPROFILE
SUMMARY CONSOLIDATED FINANCIAL STATEMENTS APPENDICES NOTICE OF ANNUAL
GENERAL MEETING ADMINISTRATION
SUMMARY CONSOLIDATED STATEMENT OF CHANGES IN EQUITYFOR THE YEARS ENDED 31 MARCH
Attributable to equity
holders of The Foschini
Group Limited
Non-controlling
interestTotal
equityRm Rm Rm
Equity at 31 March 2014 7 228,6 861,3 8 089,9Total comprehensive income for the year 1 950,4 36,5 1 986,9Profit for the year
Continuing operations 1 537,4 0,4 1 537,8Discontinued operations 320,6 38,8 359,4
Other comprehensive incomeContinuing operations
Movement in effective portion of changes in fair value of cash flow hedges 41,1 – 41,1Foreign currency translation reserve movement 66,0 – 66,0Deferred tax on movement in other comprehensive income (11,5) – (11,5)
Discontinued operationsMovement in effective portion of changes in fair value of cash flow hedges (4,5) (3,7) (8,2)Deferred tax on movement in other comprehensive income 1,3 1,0 2,3
Contributions by and distributions to ownersShare-based payments reserve movements 97,4 – 97,4Dividends paid (1 146,9) – (1 146,9)Realisation of non-controlling interest on disposal of discontinued operations – (895,1) (895,1)Realisation of reserves on disposal of discontinued operations 24,2 – 24,2Cancellation of issued shares (0,1) – (0,1)Proceeds from sale of shares in terms of share incentive schemes 132,6 – 132,6Shares purchased in terms of share incentive schemes (175,7) – (175,7)Increase in the fair value of the put option liability (15,8) – (15,8)Current tax on shares purchased 12,1 – 12,1Deferred tax on shares purchased 24,1 – 24,1Equity at 31 March 2015 8 130,9 2,7 8 133,6
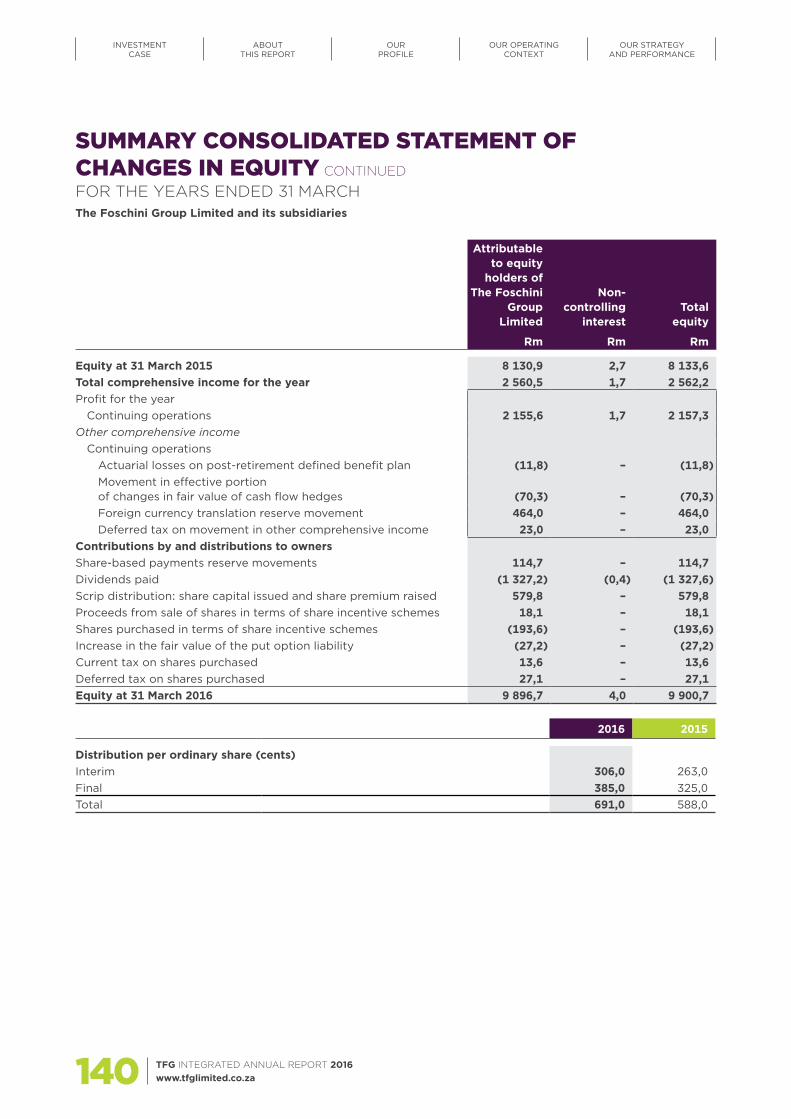
TFG INTEGRATED ANNUAL REPORT 2016 www.tfglimited.co.za140
The Foschini Group Limited and its subsidiaries
INVESTMENT CASE
ABOUTTHIS REPORT
OUR PROFILE
OUR OPERATINGCONTEXT
OUR STRATEGY AND PERFORMANCE
SUMMARY CONSOLIDATED STATEMENT OF CHANGES IN EQUITY CONTINUED
FOR THE YEARS ENDED 31 MARCH
Attributable to equity
holders of The Foschini
Group Limited
Non-controlling
interestTotal
equity
Rm Rm Rm
Equity at 31 March 2015 8 130,9 2,7 8 133,6Total comprehensive income for the year 2 560,5 1,7 2 562,2Profit for the year
Continuing operations 2 155,6 1,7 2 157,3Other comprehensive income
Continuing operationsActuarial losses on post-retirement defined benefit plan (11,8) – (11,8)Movement in effective portion of changes in fair value of cash flow hedges (70,3) – (70,3)Foreign currency translation reserve movement 464,0 – 464,0Deferred tax on movement in other comprehensive income 23,0 – 23,0
Contributions by and distributions to ownersShare-based payments reserve movements 114,7 – 114,7Dividends paid (1 327,2) (0,4) (1 327,6)Scrip distribution: share capital issued and share premium raised 579,8 – 579,8Proceeds from sale of shares in terms of share incentive schemes 18,1 – 18,1Shares purchased in terms of share incentive schemes (193,6) – (193,6)Increase in the fair value of the put option liability (27,2) – (27,2)Current tax on shares purchased 13,6 – 13,6Deferred tax on shares purchased 27,1 – 27,1Equity at 31 March 2016 9 896,7 4,0 9 900,7
2016 2015
Distribution per ordinary share (cents)Interim 306,0 263,0Final 385,0 325,0Total 691,0 588,0

141
The Foschini Group Limited and its subsidiaries
OUR GOVERNANCEPROFILE
SUMMARY CONSOLIDATED FINANCIAL STATEMENTS APPENDICES NOTICE OF ANNUAL
GENERAL MEETING ADMINISTRATION
SUMMARY CONSOLIDATED CASH FLOW STATEMENTFOR THE YEARS ENDED 31 MARCH
2016 2015Rm Rm
Cash flows from operating activitiesOperating profit before working capital changes (note 9) 4 127,2 3 047,4Increase in working capital (1 509,4) (998,4)Cash generated from operations 2 617,8 2 049,0Interest income 22,3 30,0Finance costs (509,0) (228,1)Taxation paid (921,8) (765,7)Dividends paid (747,8) (1 146,9)Net cash inflows (outflows) from operating activities 461,5 (61,7)
Cash flows from investing activitiesPurchase of property, plant and equipment and intangible assets (901,0) (669,8)Acquisition of assets through business combinations, net of cash (152,4) (2 576,9)Proceeds from sale of property, plant and equipment 14,6 10,2Repayment of participation in export partnerships 7,2 14,2Proceeds from disposal of investment 1,1 –Proceeds from disposal of discontinued operations – 1 442,7Net cash outflows from investing activities (1 030,5) (1 779,6)
Cash flows from financing activitiesShares purchased in terms of share incentive schemes (193,6) (175,7)Proceeds from sale of shares in terms of share incentive schemes 18,1 132,6Increase in interest-bearing debt 760,6 2 371,6Net cash inflows from financing activities 585,1 2 328,5
Net increase in cash during the year 16,1 487,2Cash at the beginning of the year 800,4 301,3Effect of exchange rate fluctuations on cash held 72,3 11,9Cash at the end of the year 888,8 800,4
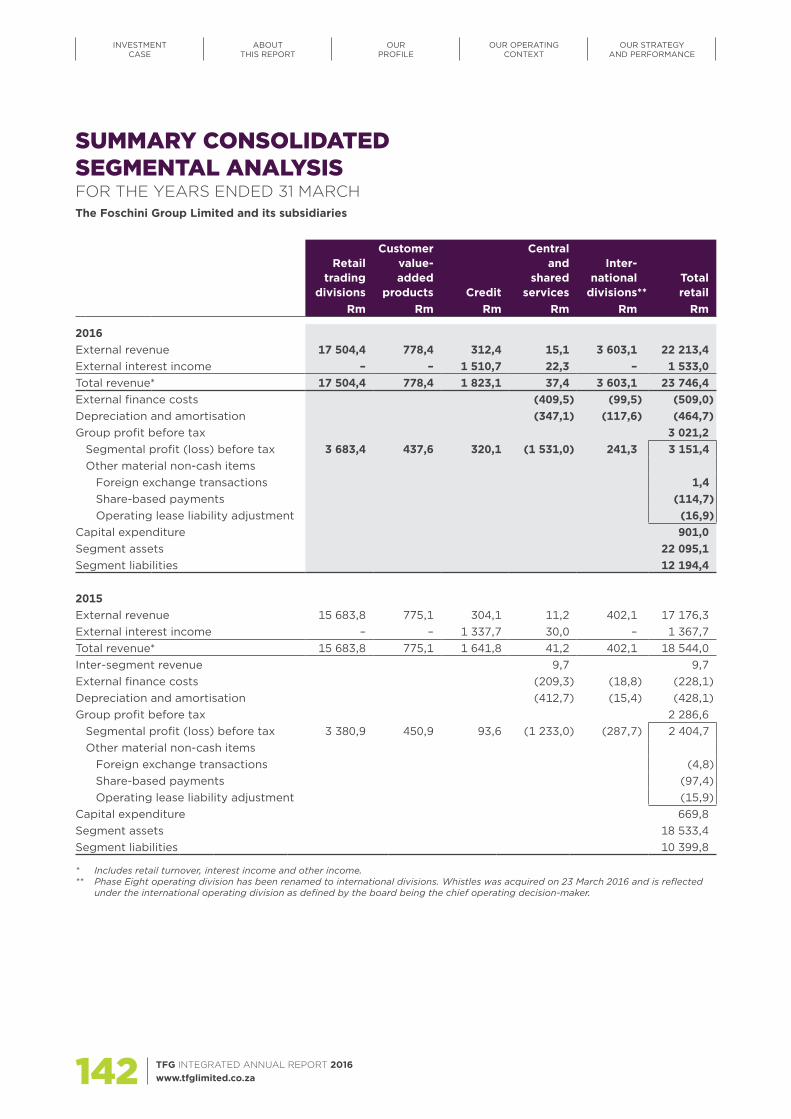
TFG INTEGRATED ANNUAL REPORT 2016 www.tfglimited.co.za142
The Foschini Group Limited and its subsidiaries
INVESTMENT CASE
ABOUTTHIS REPORT
OUR PROFILE
OUR OPERATINGCONTEXT
OUR STRATEGY AND PERFORMANCE
SUMMARY CONSOLIDATED SEGMENTAL ANALYSISFOR THE YEARS ENDED 31 MARCH
Retail trading
divisions
Customer value- added
products Credit
Central and
shared services
Inter-national
divisions**Total retail
Rm Rm Rm Rm Rm Rm
2016External revenue 17 504,4 778,4 312,4 15,1 3 603,1 22 213,4External interest income – – 1 510,7 22,3 – 1 533,0Total revenue* 17 504,4 778,4 1 823,1 37,4 3 603,1 23 746,4External finance costs (409,5) (99,5) (509,0)Depreciation and amortisation (347,1) (117,6) (464,7)Group profit before tax 3 021,2 Segmental profit (loss) before tax 3 683,4 437,6 320,1 (1 531,0) 241,3 3 151,4 Other material non-cash items Foreign exchange transactions 1,4 Share-based payments (114,7) Operating lease liability adjustment (16,9)Capital expenditure 901,0Segment assets 22 095,1Segment liabilities 12 194,4
2015External revenue 15 683,8 775,1 304,1 11,2 402,1 17 176,3External interest income – – 1 337,7 30,0 – 1 367,7Total revenue* 15 683,8 775,1 1 641,8 41,2 402,1 18 544,0Inter-segment revenue 9,7 9,7External finance costs (209,3) (18,8) (228,1)Depreciation and amortisation (412,7) (15,4) (428,1)Group profit before tax 2 286,6 Segmental profit (loss) before tax 3 380,9 450,9 93,6 (1 233,0) (287,7) 2 404,7 Other material non-cash items Foreign exchange transactions (4,8) Share-based payments (97,4) Operating lease liability adjustment (15,9)Capital expenditure 669,8Segment assets 18 533,4Segment liabilities 10 399,8
* Includes retail turnover, interest income and other income.** Phase Eight operating division has been renamed to international divisions. Whistles was acquired on 23 March 2016 and is reflected
under the international operating division as defined by the board being the chief operating decision-maker.

143
OUR GOVERNANCEPROFILE
SUMMARY CONSOLIDATED FINANCIAL STATEMENTS APPENDICES NOTICE OF ANNUAL
GENERAL MEETING ADMINISTRATION
2016 2015Discontinued operations – RCS Group# Rm Rm
External revenue – 164,5External interest income – 298,2Total revenue* – 462,7Inter-segment revenue – 2,7External finance costs – (65,0)Depreciation and amortisation – (4,8)Segmental profit before tax – 480,4Capital expenditure – 4,9Segment assets – –Segment liabilities – –
# Year ended 31 March 2015 represents three months of trading prior to the disposal of RCS Group.* Includes retail turnover, interest income and other income.
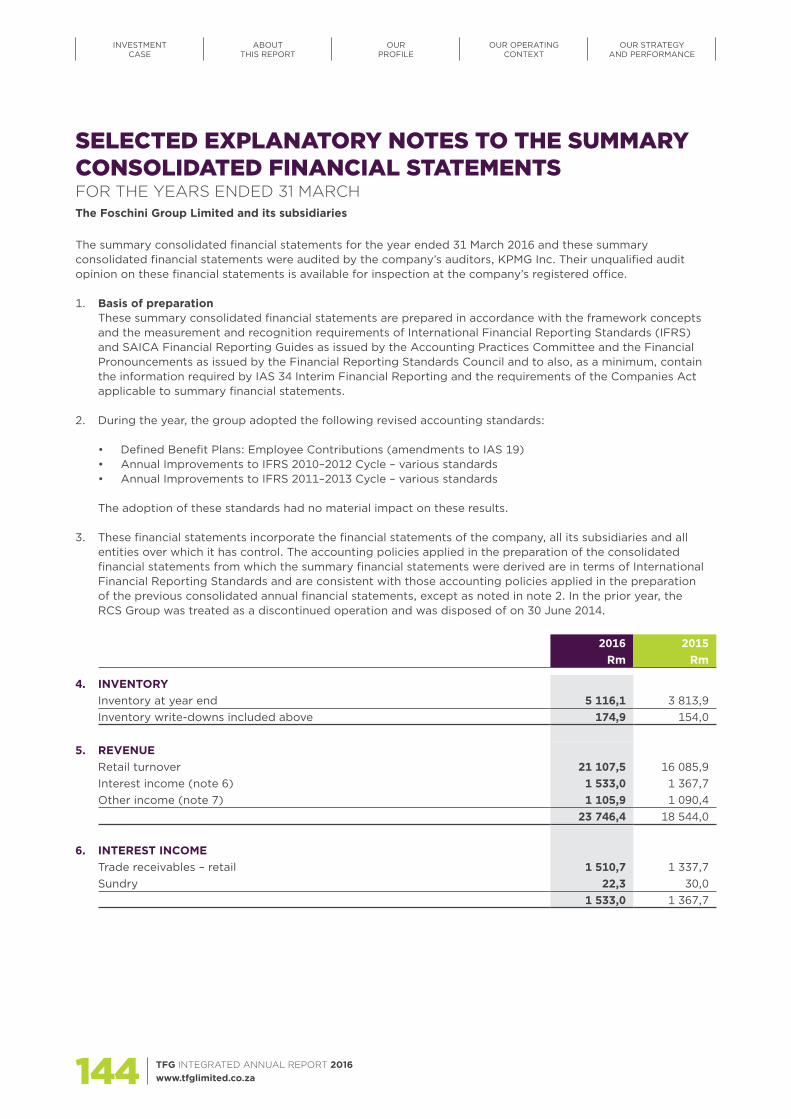
TFG INTEGRATED ANNUAL REPORT 2016 www.tfglimited.co.za144
The Foschini Group Limited and its subsidiaries
INVESTMENT CASE
ABOUTTHIS REPORT
OUR PROFILE
OUR OPERATINGCONTEXT
OUR STRATEGY AND PERFORMANCE
SELECTED EXPLANATORY NOTES TO THE SUMMARYCONSOLIDATED FINANCIAL STATEMENTSFOR THE YEARS ENDED 31 MARCH
The summary consolidated financial statements for the year ended 31 March 2016 and these summary consolidated financial statements were audited by the company’s auditors, KPMG Inc. Their unqualified audit opinion on these financial statements is available for inspection at the company’s registered office.
1. Basis of preparation These summary consolidated financial statements are prepared in accordance with the framework concepts
and the measurement and recognition requirements of International Financial Reporting Standards (IFRS) and SAICA Financial Reporting Guides as issued by the Accounting Practices Committee and the Financial Pronouncements as issued by the Financial Reporting Standards Council and to also, as a minimum, contain the information required by IAS 34 Interim Financial Reporting and the requirements of the Companies Act applicable to summary financial statements.
2. During the year, the group adopted the following revised accounting standards:
• Defined Benefit Plans: Employee Contributions (amendments to IAS 19)• Annual Improvements to IFRS 2010–2012 Cycle – various standards• Annual Improvements to IFRS 2011–2013 Cycle – various standards
The adoption of these standards had no material impact on these results.
3. These financial statements incorporate the financial statements of the company, all its subsidiaries and all entities over which it has control. The accounting policies applied in the preparation of the consolidated financial statements from which the summary financial statements were derived are in terms of International Financial Reporting Standards and are consistent with those accounting policies applied in the preparation of the previous consolidated annual financial statements, except as noted in note 2. In the prior year, the RCS Group was treated as a discontinued operation and was disposed of on 30 June 2014.
2016 2015Rm Rm
4. INVENTORYInventory at year end 5 116,1 3 813,9Inventory write-downs included above 174,9 154,0
5. REVENUERetail turnover 21 107,5 16 085,9Interest income (note 6) 1 533,0 1 367,7Other income (note 7) 1 105,9 1 090,4
23 746,4 18 544,0
6. INTEREST INCOMETrade receivables – retail 1 510,7 1 337,7Sundry 22,3 30,0
1 533,0 1 367,7

145
OUR GOVERNANCEPROFILE
SUMMARY CONSOLIDATED FINANCIAL STATEMENTS APPENDICES NOTICE OF ANNUAL
GENERAL MEETING ADMINISTRATION
2016 2015Rm Rm
7. OTHER INCOMEPublishing income 399,4 388,2Collection cost recovery 312,4 304,1Insurance income 297,8 300,3Mobile one2one airtime income 81,2 86,6Sundry income 15,1 11,2
1 105,9 1 090,4
8. TRADING EXPENSESDepreciation and amortisation (464,7) (428,1)Employee costs (3 210,8) (2 325,2)Occupancy costs (2 043,2) (1 585,0)Net bad debt (947,7) (1 023,6)Other operating costs (2 870,8) (1 890,8)
(9 537,2) (7 252,7)
9. OPERATING PROFIT BEFORE WORKING CAPITAL CHANGESProfit before tax 3 021,2 2 286,6Finance costs 509,0 228,1Operating profit before finance charges 3 530,2 2 514,7Adjustments for:Interest income – sundry (22,3) (30,0)Non-cash items 619,3 562,7
Depreciation and amortisation 464,7 428,1Operating lease liability adjustment 16,9 15,9Share-based payments 114,7 97,4Post-retirement defined benefit medical aid movement 12,9 12,2Foreign currency translation reserve movement 1,4 (4,8)Cash-settled share incentive scheme 7,7 0,7Profit on disposal of investment (1,1) –Loss on disposal of property, plant and equipment 7,1 13,5Profit on disposal of property, plant and equipment (5,0) (0,3)
4 127,2 3 047,4
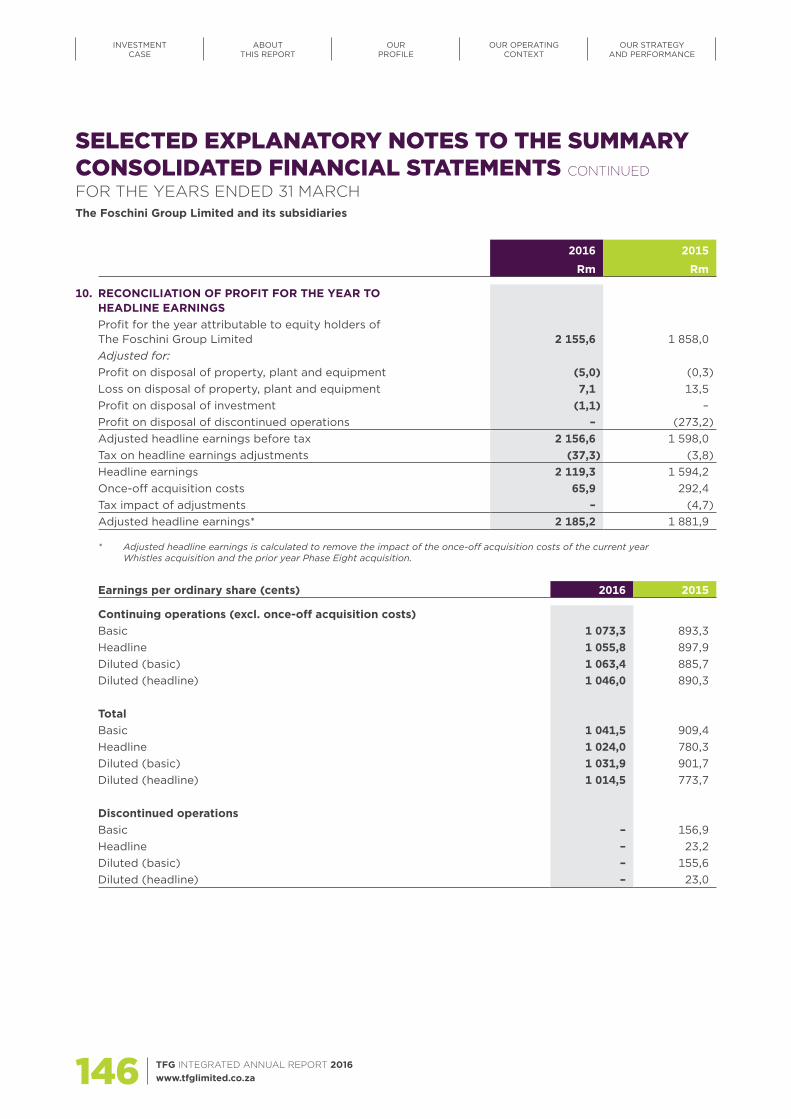
TFG INTEGRATED ANNUAL REPORT 2016 www.tfglimited.co.za146
The Foschini Group Limited and its subsidiaries
INVESTMENT CASE
ABOUTTHIS REPORT
OUR PROFILE
OUR OPERATINGCONTEXT
OUR STRATEGY AND PERFORMANCE
SELECTED EXPLANATORY NOTES TO THE SUMMARYCONSOLIDATED FINANCIAL STATEMENTS CONTINUED
FOR THE YEARS ENDED 31 MARCH
2016 2015
Rm Rm
10. RECONCILIATION OF PROFIT FOR THE YEAR TO HEADLINE EARNINGSProfit for the year attributable to equity holders of The Foschini Group Limited 2 155,6 1 858,0Adjusted for:Profit on disposal of property, plant and equipment (5,0) (0,3)Loss on disposal of property, plant and equipment 7,1 13,5Profit on disposal of investment (1,1) –Profit on disposal of discontinued operations – (273,2)Adjusted headline earnings before tax 2 156,6 1 598,0Tax on headline earnings adjustments (37,3) (3,8)Headline earnings 2 119,3 1 594,2Once-off acquisition costs 65,9 292,4Tax impact of adjustments – (4,7)Adjusted headline earnings* 2 185,2 1 881,9
* Adjusted headline earnings is calculated to remove the impact of the once-off acquisition costs of the current year Whistles acquisition and the prior year Phase Eight acquisition.
Earnings per ordinary share (cents) 2016 2015
Continuing operations (excl. once-off acquisition costs)Basic 1 073,3 893,3Headline 1 055,8 897,9Diluted (basic) 1 063,4 885,7Diluted (headline) 1 046,0 890,3
TotalBasic 1 041,5 909,4Headline 1 024,0 780,3Diluted (basic) 1 031,9 901,7Diluted (headline) 1 014,5 773,7
Discontinued operationsBasic – 156,9Headline – 23,2Diluted (basic) – 155,6Diluted (headline) – 23,0
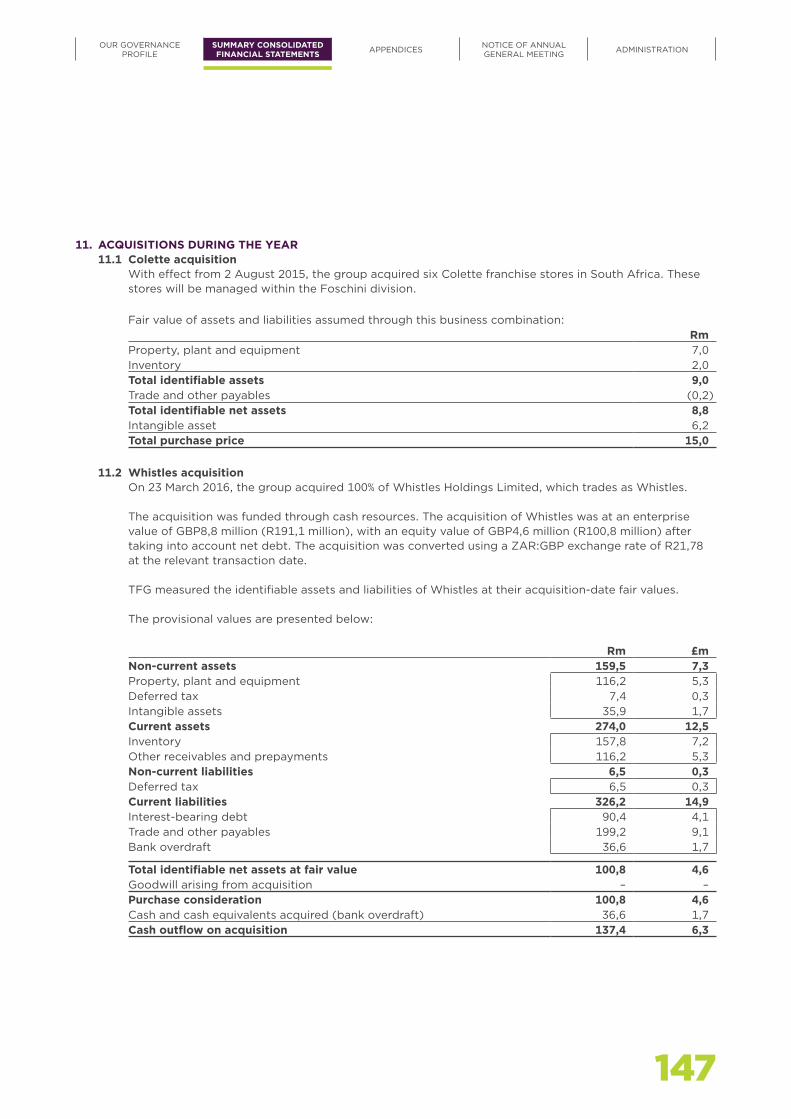
147
OUR GOVERNANCEPROFILE
SUMMARY CONSOLIDATED FINANCIAL STATEMENTS APPENDICES NOTICE OF ANNUAL
GENERAL MEETING ADMINISTRATION
11. ACQUISITIONS DURING THE YEAR11.1 Colette acquisition
With effect from 2 August 2015, the group acquired six Colette franchise stores in South Africa. These stores will be managed within the Foschini division.
Fair value of assets and liabilities assumed through this business combination:Rm
Property, plant and equipment 7,0Inventory 2,0Total identifiable assets 9,0Trade and other payables (0,2)Total identifiable net assets 8,8Intangible asset 6,2Total purchase price 15,0
11.2 Whistles acquisitionOn 23 March 2016, the group acquired 100% of Whistles Holdings Limited, which trades as Whistles.
The acquisition was funded through cash resources. The acquisition of Whistles was at an enterprise value of GBP8,8 million (R191,1 million), with an equity value of GBP4,6 million (R100,8 million) after taking into account net debt. The acquisition was converted using a ZAR:GBP exchange rate of R21,78 at the relevant transaction date.
TFG measured the identifiable assets and liabilities of Whistles at their acquisition-date fair values.
The provisional values are presented below:
Rm £mNon-current assets 159,5 7,3Property, plant and equipment 116,2 5,3Deferred tax 7,4 0,3Intangible assets 35,9 1,7Current assets 274,0 12,5Inventory 157,8 7,2Other receivables and prepayments 116,2 5,3Non-current liabilities 6,5 0,3Deferred tax 6,5 0,3Current liabilities 326,2 14,9Interest-bearing debt 90,4 4,1Trade and other payables 199,2 9,1Bank overdraft 36,6 1,7
Total identifiable net assets at fair value 100,8 4,6Goodwill arising from acquisition – –Purchase consideration 100,8 4,6Cash and cash equivalents acquired (bank overdraft) 36,6 1,7Cash outflow on acquisition 137,4 6,3
TFG INTEGRATED ANNUAL REPORT 2016 www.tfglimited.co.za148
The Foschini Group Limited and its subsidiaries
INVESTMENT CASE
ABOUTTHIS REPORT
OUR PROFILE
OUR OPERATINGCONTEXT
OUR STRATEGY AND PERFORMANCE
11. ACQUISITIONS DURING THE YEAR continued11.2 Whistles acquisition continued
No goodwill has arisen from the acquisition, and the Whistles brand amounting to GBP1,7 million (R35,9 million) has been recognised as an intangible asset at acquisition. Once-off acquisition costs of R65,9 million related to the acquisition have been expensed in the current year. For the purpose of comparability, headline earnings per share from continuing operations, excluding these once-off acquisition costs, has been calculated. No profit and loss has been included within the group’s results in the current financial year.
12. RELATED PARTIES Related-party transactions similar to those disclosed in the group’s annual financial statements for the year
ended 31 March 2015 took place during the year. There are no significant related-party transactions which took place in the current year.
13. FAIR VALUE The carrying value less impairment provision of trade receivables and payables are assumed to approximate their fair values due to the short-term nature. The group only has level 2 financial instruments. There are no level 1 or level 3 financial instruments within the group and there were no transfers between levels during the year.
14. SUBSEQUENT EVENTS No further significant events took place between the year ended 31 March 2016 and date of issue of this report.
15. CHANGES IN DIRECTORS • Mr M Lewis was appointed as Deputy Chairman on 28 May 2015 and as Chairman on 19 June 2015.• Mr D M Nurek resigned from the board on 19 June 2015.• Mr P S Meiring retired at the end of June 2015 and resigned from the board.• Mr R Stein retired as an executive director at the end of June 2015 and remains on the board in
a non-executive capacity.• On 1 July 2015, Mr A E Thunström was appointed as CFO and as an executive director.• On 5 November 2015, Mr G H Davin was appointed as an independent non-executive director.
16. CHANGE IN ESTIMATE Property, plant and equipmentAs required by IAS 16, the group reassessed the useful lives of its property, plant and equipment during the year. The group determined that certain asset categories generally had longer useful lives than was being used for depreciation purposes. In the current year, management revised certain useful lives of shopfittings assets from five years to seven years in accordance with IAS 8, effective 1 April 2015.
SELECTED EXPLANATORY NOTES TO THE SUMMARYCONSOLIDATED FINANCIAL STATEMENTS CONTINUED
FOR THE YEARS ENDED 31 MARCH

149
OUR GOVERNANCEPROFILE
SUMMARY CONSOLIDATED FINANCIAL STATEMENTS APPENDICES NOTICE OF ANNUAL
GENERAL MEETING ADMINISTRATION
The change in estimate results in a (decrease) increase in the depreciation expense for the current and future years is disclosed below:
Financial year
(Decrease)increase in
depreciation for the year
ended 31 March
2016 (115,2)
2017 (69,6)
2018 (12,7)
2019 37,6
2020 75,0
2021 64,9
2022 20,0
17. RECLASSIFICATION OF PROPERTY, PLANT AND EQUIPMENT TO GOODWILL AND INTANGIBLE ASSETS The group previously accounted for software under property, plant and equipment. In order to provide a more detailed disclosure, software in property, plant and equipment with a net book value of R271,8 million (2015) and R226,5 million (2014) has subsequently been reclassified to goodwill and intangible assets.
The reclassification had no effect on basic or headline earnings per share, or on diluted basic or diluted headline earnings per share.
The effect of the change is as follows:
31 March 2014 31 March 2014 31 March 2014As reported Adjustment As restated
Property, plant and equipment 1 696,1 (226,5) 1 469,6Goodwill and intangible assets 63,4 226,5 289,9
31 March 2015 31 March 2015 31 March 2015As reported Adjustment As restated
Property, plant and equipment 2 197,0 (271,8) 1 925,2Goodwill and intangible assets 4 365,2 271,8 4 637,0
APPENDICESAppendix 1: Definitions 152
Appendix 2: Consolidated performance table 154
Appendix 3: Subsidiary companies 156
Appendix 4: Shareholdings of The Foschini Group Limited 157
Appendix 5: Exchange rate and share performance information 159
Appendix 6: Value-added statement 160
150 TFG INTEGRATED ANNUAL REPORT 2016 www.tfglimited.co.za

151
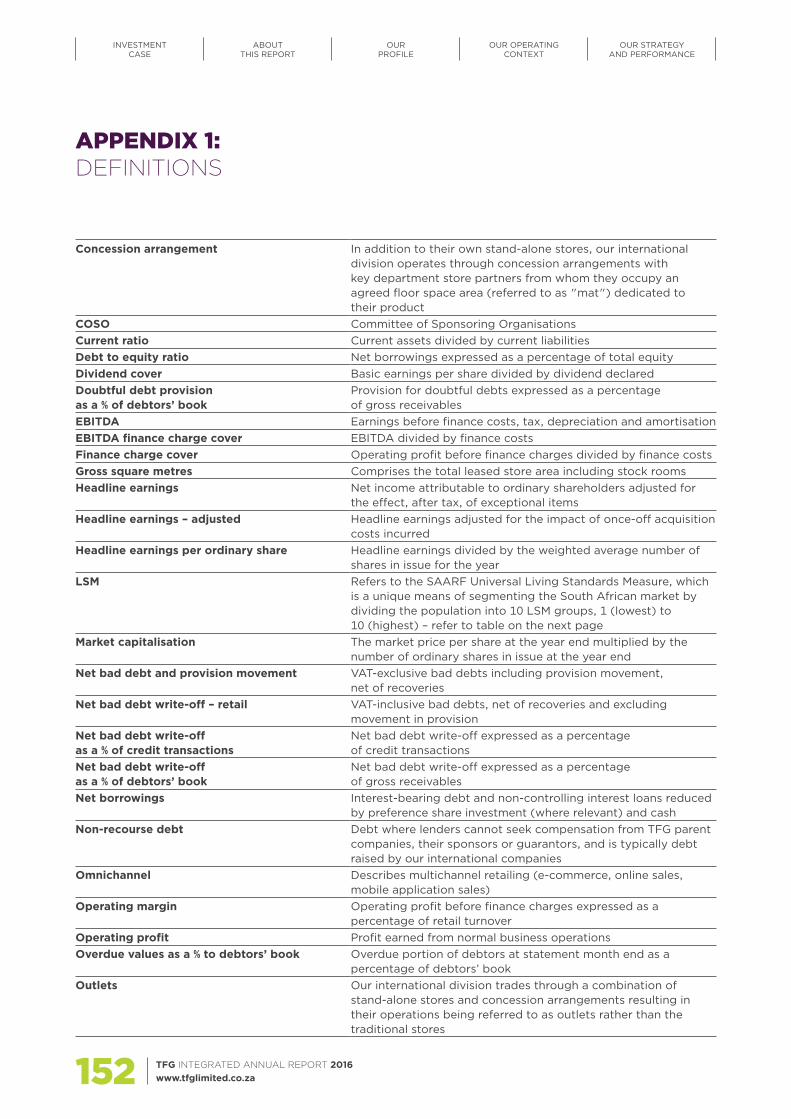
TFG INTEGRATED ANNUAL REPORT 2016 www.tfglimited.co.za152
APPENDIX 1: DEFINITIONS
Concession arrangement In addition to their own stand-alone stores, our international division operates through concession arrangements with key department store partners from whom they occupy an agreed floor space area (referred to as "mat") dedicated to their product
COSO Committee of Sponsoring OrganisationsCurrent ratio Current assets divided by current liabilitiesDebt to equity ratio Net borrowings expressed as a percentage of total equityDividend cover Basic earnings per share divided by dividend declaredDoubtful debt provision as a % of debtors’ book
Provision for doubtful debts expressed as a percentage of gross receivables
EBITDA Earnings before finance costs, tax, depreciation and amortisationEBITDA finance charge cover EBITDA divided by finance costsFinance charge cover Operating profit before finance charges divided by finance costsGross square metres Comprises the total leased store area including stock roomsHeadline earnings Net income attributable to ordinary shareholders adjusted for
the effect, after tax, of exceptional itemsHeadline earnings – adjusted Headline earnings adjusted for the impact of once-off acquisition
costs incurredHeadline earnings per ordinary share Headline earnings divided by the weighted average number of
shares in issue for the year LSM Refers to the SAARF Universal Living Standards Measure, which
is a unique means of segmenting the South African market by dividing the population into 10 LSM groups, 1 (lowest) to 10 (highest) – refer to table on the next page
Market capitalisation The market price per share at the year end multiplied by the number of ordinary shares in issue at the year end
Net bad debt and provision movement VAT-exclusive bad debts including provision movement, net of recoveries
Net bad debt write-off – retail VAT-inclusive bad debts, net of recoveries and excluding movement in provision
Net bad debt write-off as a % of credit transactions
Net bad debt write-off expressed as a percentage of credit transactions
Net bad debt write-off as a % of debtors’ book
Net bad debt write-off expressed as a percentage of gross receivables
Net borrowings Interest-bearing debt and non-controlling interest loans reduced by preference share investment (where relevant) and cash
Non-recourse debt Debt where lenders cannot seek compensation from TFG parent companies, their sponsors or guarantors, and is typically debt raised by our international companies
Omnichannel Describes multichannel retailing (e-commerce, online sales, mobile application sales)
Operating margin Operating profit before finance charges expressed as a percentage of retail turnover
Operating profit Profit earned from normal business operationsOverdue values as a % to debtors’ book Overdue portion of debtors at statement month end as a
percentage of debtors’ bookOutlets Our international division trades through a combination of
stand-alone stores and concession arrangements resulting in their operations being referred to as outlets rather than the traditional stores
INVESTMENT CASE
ABOUTTHIS REPORT
OUR PROFILE
OUR OPERATINGCONTEXT
OUR STRATEGY AND PERFORMANCE

153
SOUTH AFRICAN ADULT (15+): POPULATION SPLIT BY LSM: AVERAGE MONTHLY HOUSEHOLD INCOME
Source: AMPS Individual Databases (2014B, 2015B)
Notes:All adults aged 15+
Average income is calculated using the midpoint of the income bands provided by AMPS. Maximum category in 2014B and 2015B is R60 000+, and the value R60 000 was used in this instance.
LSM refers to SAARF Universal Living Standards Measure
All Rand values are nominal (inflation is not taken into account)
LSM
Popu-lation 2015B
% Popu-lation 2010
% Popu-lation 2011
% Popu-lation 2012
% Popu-lation 2013
% Popu-lation 2014
% Popu-lation 2015B
Average monthly
household income 2015B
Average monthly
household income 2014B
LSM 1 423 803 2,4% 1,9% 1,6% 1,4% 1,6% 1,1% R2 225 R2 168LSM 2 1 033 699 5,7% 5,1% 4,1% 3,6% 3,3% 2,7% R3 353 R2 886LSM 3 2 196 284 7,0% 6,1% 6,2% 5,7% 5,2% 5,7% R3 358 R3 307LSM 4 4 908 513 14,0% 12,2% 13,0% 11,6% 12,3% 12,8% R4 157 R4 068LSM 5 6 408 562 16,6% 17,4% 17,1% 16,4% 15,9% 16,8% R5 636 R5 016LSM 6 8 707 403 20,3% 22,4% 22,6% 23,7% 23,6% 22,8% R7 869 R7 387LSM 7 5 193 862 10,6% 11,4% 11,4% 12,3% 13,0% 13,6% R13 285 R12 923LSM 8 3 300 143 8,3% 8,4% 8,6% 8,8% 8,8% 8,6% R19 397 R17 224LSM 9 3 705 911 8,9% 8,9% 9,4% 10,0% 10,0% 9,7% R26 337 R24 292LSM 10 2 380 729 6,2% 6,2% 6,0% 6,5% 6,3% 6,2% R38 970 R36 838Total 38 258 909 100,0% 100,0% 100,0% 100,0% 100,0% 100,0% R12 459 R11 276
OUR GOVERNANCEPROFILE
SUMMARY CONSOLIDATED FINANCIAL STATEMENTS APPENDICES NOTICE OF ANNUAL
GENERAL MEETING ADMINISTRATION
Recourse debt Recourse debt is amounts owing to TFG companies in Africa (excluding our international subsidiaries) where the lenders have the ability to claim for damages from the borrower’s parent, sponsor or guarantor
Recourse debt to equity ratio Recourse debt reduced by preference share investment (where relevant) and cash expressed as a percentage of total equity
Return on capital employed (ROCE) Earnings before interest and tax (EBIT)/capital employedSame store Stores which have traded out of the same trading area for the
full current and previous financial yearsTangible net asset value per ordinary share Total net asset value, after non-controlling interest, excluding
goodwill and intangible assets, divided by the net number of ordinary shares in issue at the year end
Trading expenses Trading expenses are costs incurred in the normal course of business, and includes, among others, depreciation and amortisation, employee costs, occupancy costs, net bad debt and other operating costs

TFG INTEGRATED ANNUAL REPORT 2016 www.tfglimited.co.za154
APPENDIX 2: CONSOLIDATED PERFORMANCE TABLE
Performance indicator % change 2016 2015
Economic and related core baseline indicatorsRetail turnover (Rm) 31,2 21 107,5 16 085,9Operating profit before finance costs and once-off acquisition costs (Rm) 28,1 3 596,1 2 807,1EBITDA (Rm)** 25,5 4 060,8 3 235,2Adjusted headline earnings (Rm) 16,1 2 185,2 1 881,9Earnings per ordinary share from continuing operations excluding once-off acquisition costs (cents) 20,2 1 073,3 893,3Headline earnings per ordinary share from continuing operations excluding once-off acquisition costs (cents) 17,6 1 055,8 897,9Distribution declared per ordinary share (cents) 17,5 691,0 588,0Value added (Rm) 43,7 7 782,5 5 417,6Total number of outlets 14,7 3 125 2 724Total number of distribution centres* – 8 8Number of environmental, health and safety and/or governance legal incidents – zero zero
Employee indicatorsTotal number of employeesPermanent full-time employees 5,4 15 053 14 277Permanent part-time employees 41,3 2 207 1 562Flexitime employees 10,6 4 721 4 268Contract employees 53,4 747 487Casual employees 13,4 152 134Employee turnover excluding contractors (%) 3,6 37,1 35,8
* South Africa only.
INVESTMENT CASE
ABOUTTHIS REPORT
OUR PROFILE
OUR OPERATINGCONTEXT
OUR STRATEGY AND PERFORMANCE
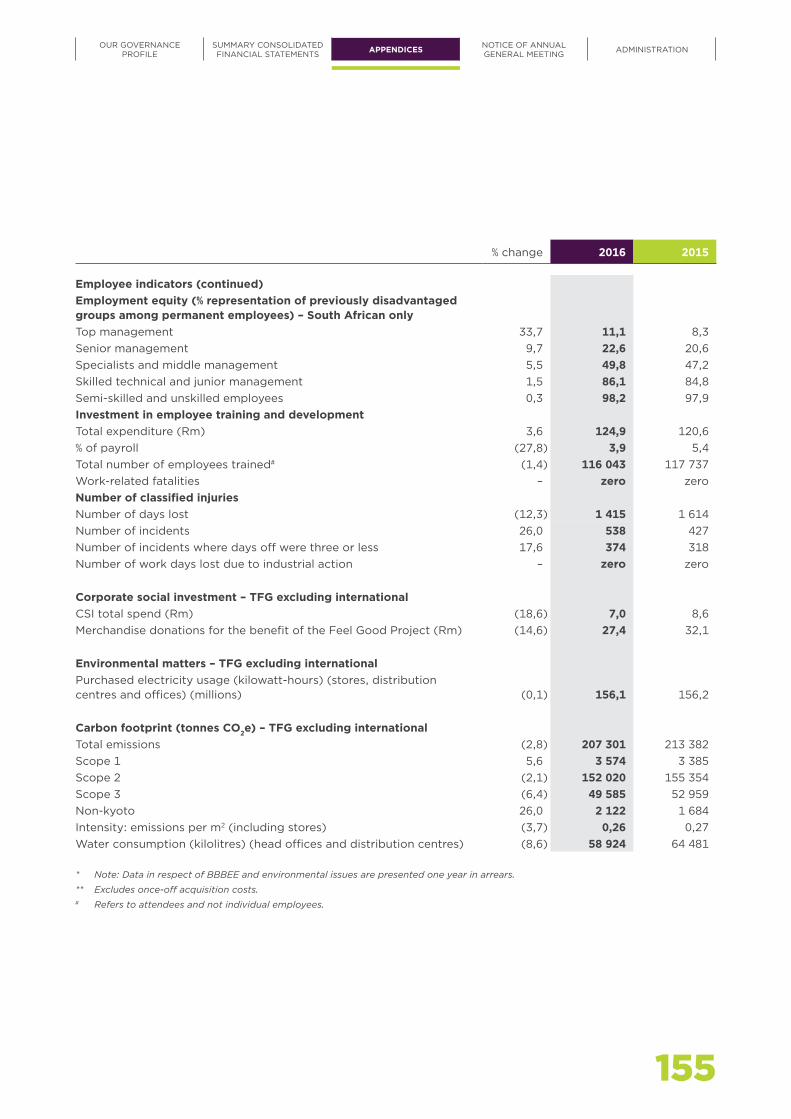
155
% change 2016 2015
Employee indicators (continued)Employment equity (% representation of previously disadvantaged groups among permanent employees) – South African onlyTop management 33,7 11,1 8,3Senior management 9,7 22,6 20,6Specialists and middle management 5,5 49,8 47,2Skilled technical and junior management 1,5 86,1 84,8Semi-skilled and unskilled employees 0,3 98,2 97,9Investment in employee training and developmentTotal expenditure (Rm) 3,6 124,9 120,6% of payroll (27,8) 3,9 5,4Total number of employees trained# (1,4) 116 043 117 737Work-related fatalities – zero zeroNumber of classified injuriesNumber of days lost (12,3) 1 415 1 614Number of incidents 26,0 538 427Number of incidents where days off were three or less 17,6 374 318Number of work days lost due to industrial action – zero zero
Corporate social investment – TFG excluding internationalCSI total spend (Rm) (18,6) 7,0 8,6Merchandise donations for the benefit of the Feel Good Project (Rm) (14,6) 27,4 32,1
Environmental matters – TFG excluding internationalPurchased electricity usage (kilowatt-hours) (stores, distribution centres and offices) (millions) (0,1) 156,1 156,2
Carbon footprint (tonnes CO2e) – TFG excluding internationalTotal emissions (2,8) 207 301 213 382Scope 1 5,6 3 574 3 385Scope 2 (2,1) 152 020 155 354Scope 3 (6,4) 49 585 52 959Non-kyoto 26,0 2 122 1 684Intensity: emissions per m2 (including stores) (3,7) 0,26 0,27Water consumption (kilolitres) (head offices and distribution centres) (8,6) 58 924 64 481
* Note: Data in respect of BBBEE and environmental issues are presented one year in arrears.
** Excludes once-off acquisition costs.# Refers to attendees and not individual employees.
OUR GOVERNANCEPROFILE
SUMMARY CONSOLIDATED FINANCIAL STATEMENTS APPENDICES NOTICE OF ANNUAL
GENERAL MEETING ADMINISTRATION
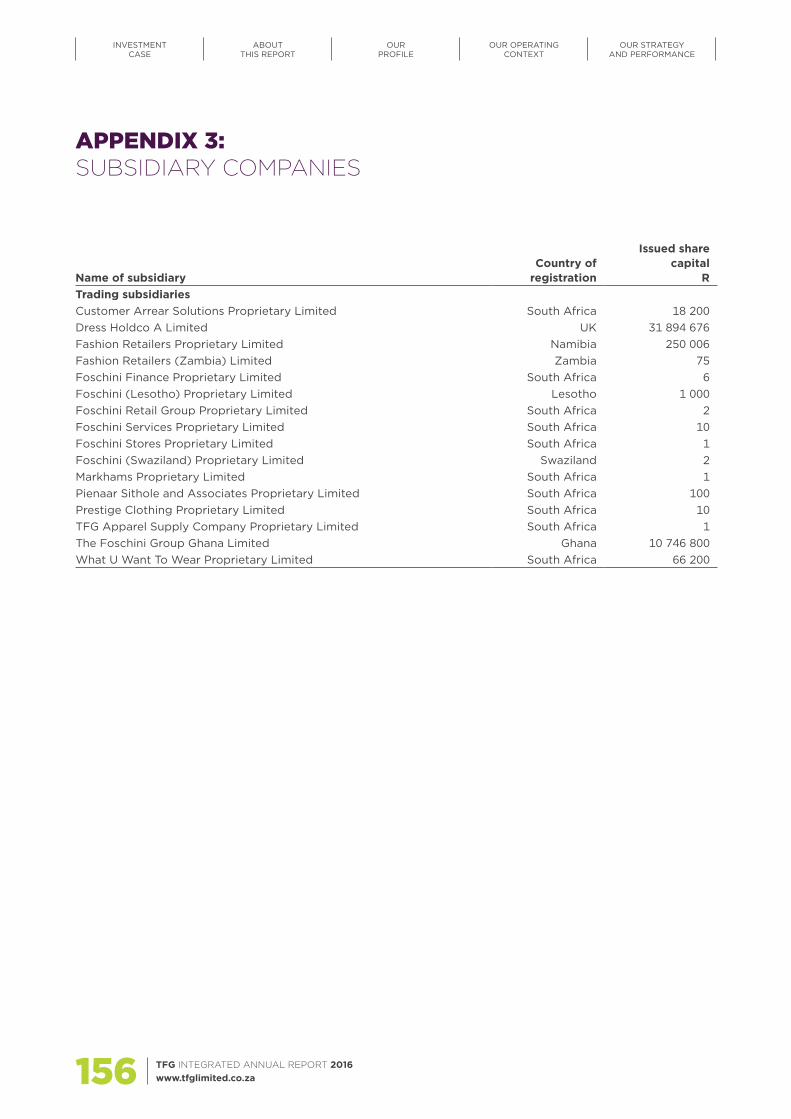
TFG INTEGRATED ANNUAL REPORT 2016 www.tfglimited.co.za156
APPENDIX 3: SUBSIDIARY COMPANIES
Name of subsidiaryCountry of
registration
Issued share capital
RTrading subsidiariesCustomer Arrear Solutions Proprietary Limited South Africa 18 200Dress Holdco A Limited UK 31 894 676Fashion Retailers Proprietary Limited Namibia 250 006Fashion Retailers (Zambia) Limited Zambia 75Foschini Finance Proprietary Limited South Africa 6Foschini (Lesotho) Proprietary Limited Lesotho 1 000Foschini Retail Group Proprietary Limited South Africa 2Foschini Services Proprietary Limited South Africa 10Foschini Stores Proprietary Limited South Africa 1Foschini (Swaziland) Proprietary Limited Swaziland 2Markhams Proprietary Limited South Africa 1Pienaar Sithole and Associates Proprietary Limited South Africa 100Prestige Clothing Proprietary Limited South Africa 10TFG Apparel Supply Company Proprietary Limited South Africa 1The Foschini Group Ghana Limited Ghana 10 746 800What U Want To Wear Proprietary Limited South Africa 66 200
INVESTMENT CASE
ABOUTTHIS REPORT
OUR PROFILE
OUR OPERATINGCONTEXT
OUR STRATEGY AND PERFORMANCE
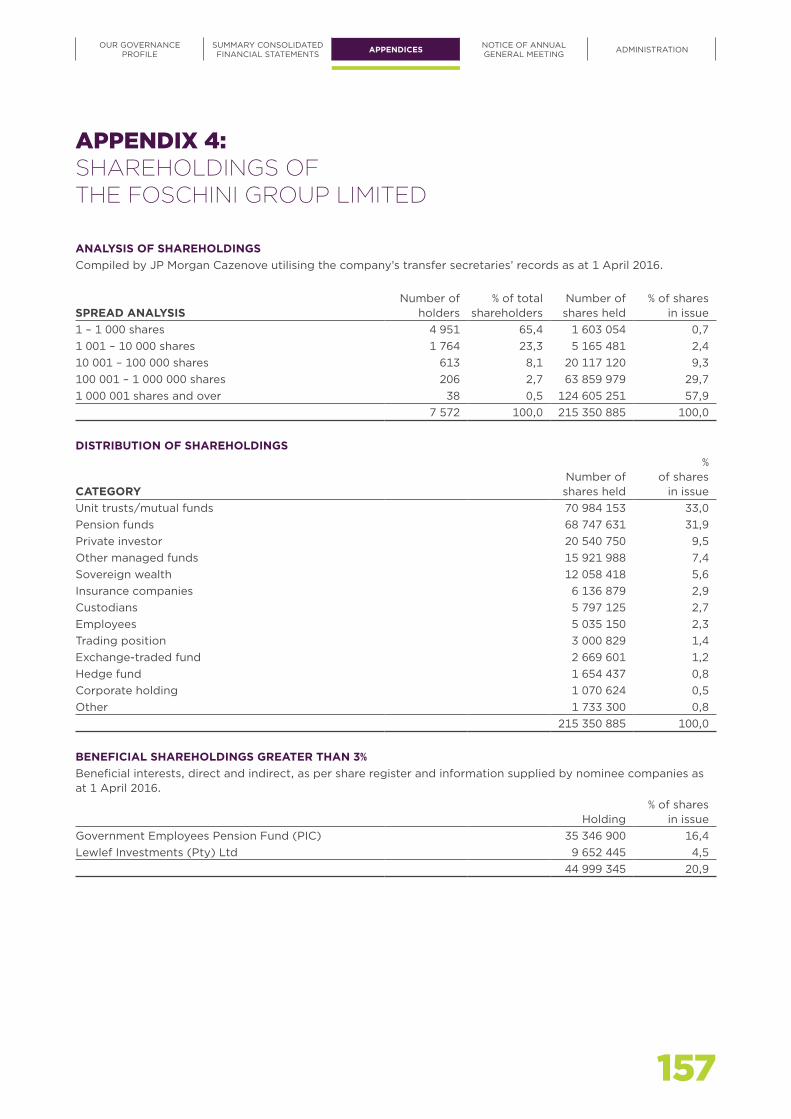
157
APPENDIX 4: SHAREHOLDINGS OF THE FOSCHINI GROUP LIMITED
ANALYSIS OF SHAREHOLDINGSCompiled by JP Morgan Cazenove utilising the company’s transfer secretaries’ records as at 1 April 2016.
SPREAD ANALYSISNumber of
holders% of total
shareholdersNumber of shares held
% of shares in issue
1 – 1 000 shares 4 951 65,4 1 603 054 0,71 001 – 10 000 shares 1 764 23,3 5 165 481 2,410 001 – 100 000 shares 613 8,1 20 117 120 9,3100 001 – 1 000 000 shares 206 2,7 63 859 979 29,71 000 001 shares and over 38 0,5 124 605 251 57,9 7 572 100,0 215 350 885 100,0
DISTRIBUTION OF SHAREHOLDINGS
CATEGORYNumber of shares held
% of shares
in issueUnit trusts/mutual funds 70 984 153 33,0Pension funds 68 747 631 31,9Private investor 20 540 750 9,5Other managed funds 15 921 988 7,4Sovereign wealth 12 058 418 5,6Insurance companies 6 136 879 2,9Custodians 5 797 125 2,7Employees 5 035 150 2,3Trading position 3 000 829 1,4Exchange-traded fund 2 669 601 1,2Hedge fund 1 654 437 0,8Corporate holding 1 070 624 0,5Other 1 733 300 0,8 215 350 885 100,0
BENEFICIAL SHAREHOLDINGS GREATER THAN 3%Beneficial interests, direct and indirect, as per share register and information supplied by nominee companies as at 1 April 2016.
Holding% of shares
in issueGovernment Employees Pension Fund (PIC) 35 346 900 16,4Lewlef Investments (Pty) Ltd 9 652 445 4,5 44 999 345 20,9
OUR GOVERNANCEPROFILE
SUMMARY CONSOLIDATED FINANCIAL STATEMENTS APPENDICES NOTICE OF ANNUAL
GENERAL MEETING ADMINISTRATION
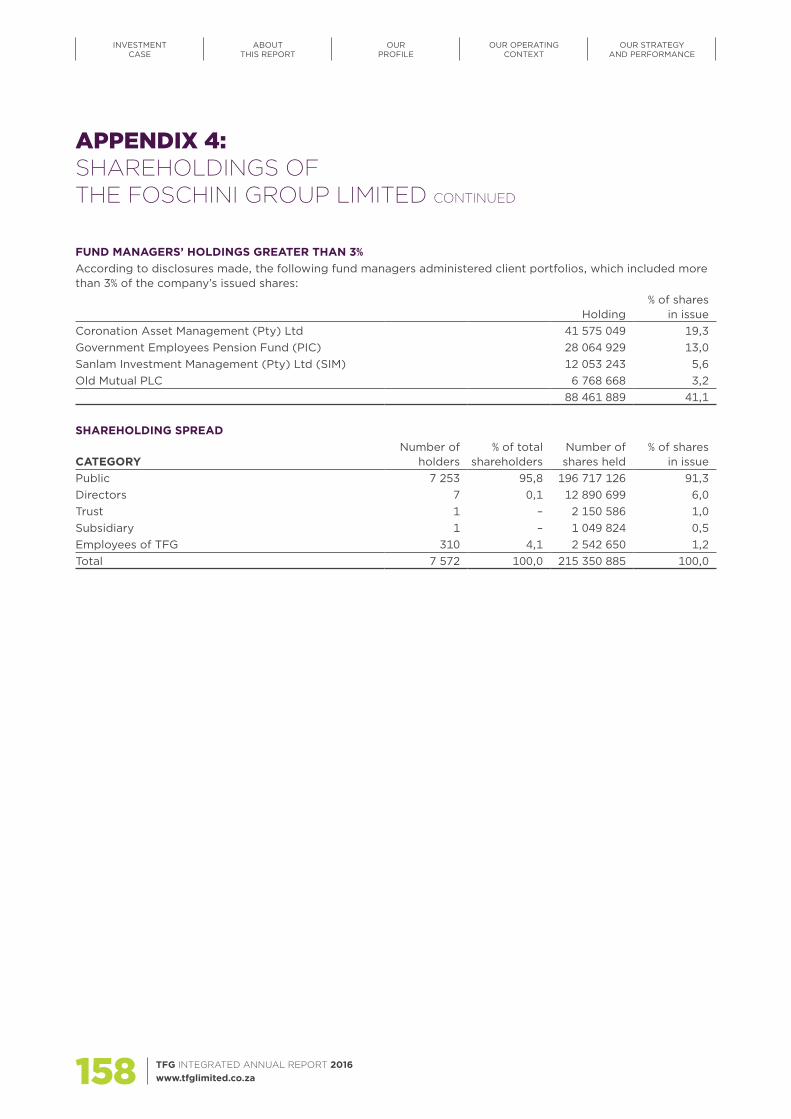
TFG INTEGRATED ANNUAL REPORT 2016 www.tfglimited.co.za158
APPENDIX 4: SHAREHOLDINGS OF THE FOSCHINI GROUP LIMITED CONTINUED
FUND MANAGERS’ HOLDINGS GREATER THAN 3%According to disclosures made, the following fund managers administered client portfolios, which included more than 3% of the company’s issued shares:
Holding% of shares
in issueCoronation Asset Management (Pty) Ltd 41 575 049 19,3Government Employees Pension Fund (PIC) 28 064 929 13,0Sanlam Investment Management (Pty) Ltd (SIM) 12 053 243 5,6Old Mutual PLC 6 768 668 3,2 88 461 889 41,1
SHAREHOLDING SPREAD
CATEGORYNumber of
holders% of total
shareholdersNumber of shares held
% of shares in issue
Public 7 253 95,8 196 717 126 91,3Directors 7 0,1 12 890 699 6,0Trust 1 – 2 150 586 1,0Subsidiary 1 – 1 049 824 0,5Employees of TFG 310 4,1 2 542 650 1,2Total 7 572 100,0 215 350 885 100,0
INVESTMENT CASE
ABOUTTHIS REPORT
OUR PROFILE
OUR OPERATINGCONTEXT
OUR STRATEGY AND PERFORMANCE
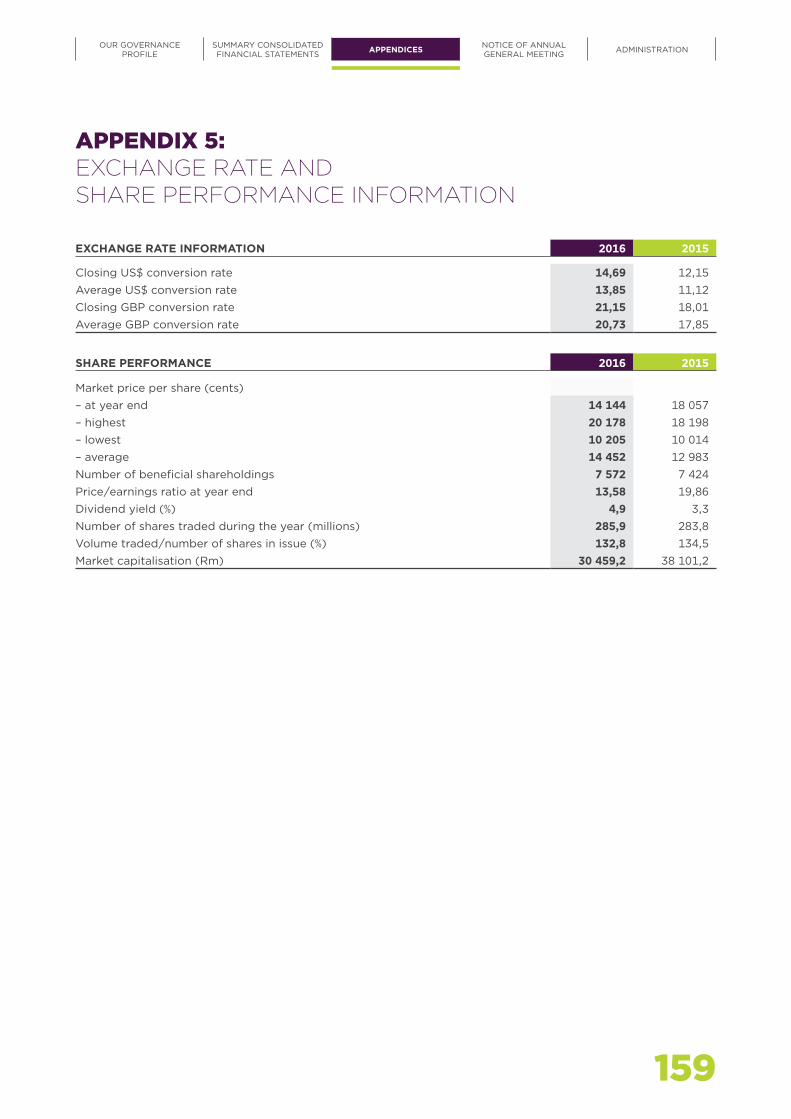
159
APPENDIX 5: EXCHANGE RATE AND SHARE PERFORMANCE INFORMATION
EXCHANGE RATE INFORMATION 2016 2015
Closing US$ conversion rate 14,69 12,15Average US$ conversion rate 13,85 11,12Closing GBP conversion rate 21,15 18,01Average GBP conversion rate 20,73 17,85
SHARE PERFORMANCE 2016 2015
Market price per share (cents)– at year end 14 144 18 057– highest 20 178 18 198– lowest 10 205 10 014– average 14 452 12 983Number of beneficial shareholdings 7 572 7 424Price/earnings ratio at year end 13,58 19,86Dividend yield (%) 4,9 3,3Number of shares traded during the year (millions) 285,9 283,8Volume traded/number of shares in issue (%) 132,8 134,5Market capitalisation (Rm) 30 459,2 38 101,2
OUR GOVERNANCEPROFILE
SUMMARY CONSOLIDATED FINANCIAL STATEMENTS APPENDICES NOTICE OF ANNUAL
GENERAL MEETING ADMINISTRATION
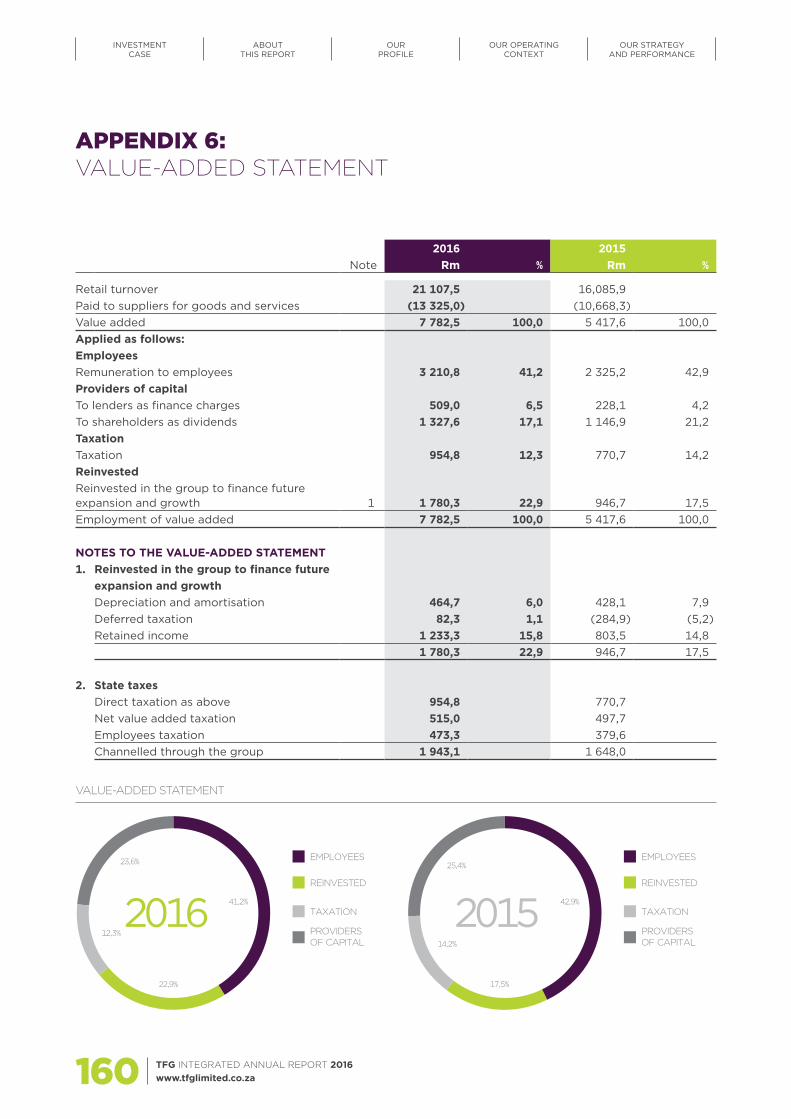
TFG INTEGRATED ANNUAL REPORT 2016 www.tfglimited.co.za160
APPENDIX 6: VALUE-ADDED STATEMENT
2016 2015Note Rm % Rm %
Retail turnover 21 107,5 16,085,9Paid to suppliers for goods and services (13 325,0) (10,668,3)Value added 7 782,5 100,0 5 417,6 100,0Applied as follows:EmployeesRemuneration to employees 3 210,8 41,2 2 325,2 42,9Providers of capitalTo lenders as finance charges 509,0 6,5 228,1 4,2To shareholders as dividends 1 327,6 17,1 1 146,9 21,2TaxationTaxation 954,8 12,3 770,7 14,2ReinvestedReinvested in the group to finance future expansion and growth 1 1 780,3 22,9 946,7 17,5Employment of value added 7 782,5 100,0 5 417,6 100,0
NOTES TO THE VALUE-ADDED STATEMENT1. Reinvested in the group to finance future
expansion and growthDepreciation and amortisation 464,7 6,0 428,1 7,9Deferred taxation 82,3 1,1 (284,9) (5,2)Retained income 1 233,3 15,8 803,5 14,8
1 780,3 22,9 946,7 17,5
2. State taxesDirect taxation as above 954,8 770,7Net value added taxation 515,0 497,7Employees taxation 473,3 379,6Channelled through the group 1 943,1 1 648,0
INVESTMENT CASE
ABOUTTHIS REPORT
OUR PROFILE
OUR OPERATINGCONTEXT
OUR STRATEGY AND PERFORMANCE
VALUE-ADDED STATEMENT
17,5%
14,2%
25,4%
42,9%
EMPLOYEES
TAXATION
REINVESTED
PROVIDERS OF CAPITAL
22,9%
12,3%
23,6%
41,2%
EMPLOYEES
TAXATION
REINVESTED
PROVIDERS OF CAPITAL
2016 2015

OUR GOVERNANCEPROFILE
SUMMARY CONSOLIDATED FINANCIAL STATEMENTS APPENDICES NOTICE OF ANNUAL
GENERAL MEETING ADMINISTRATION
161

NOTICE OF ANNUAL GENERAL MEETING
Important dates and times 166
Notice of annual general meeting 167
Application to participate electronically in the AGM 177
Form of proxy 179
TFG INTEGRATED ANNUAL REPORT 2016 www.tfglimited.co.za162

163
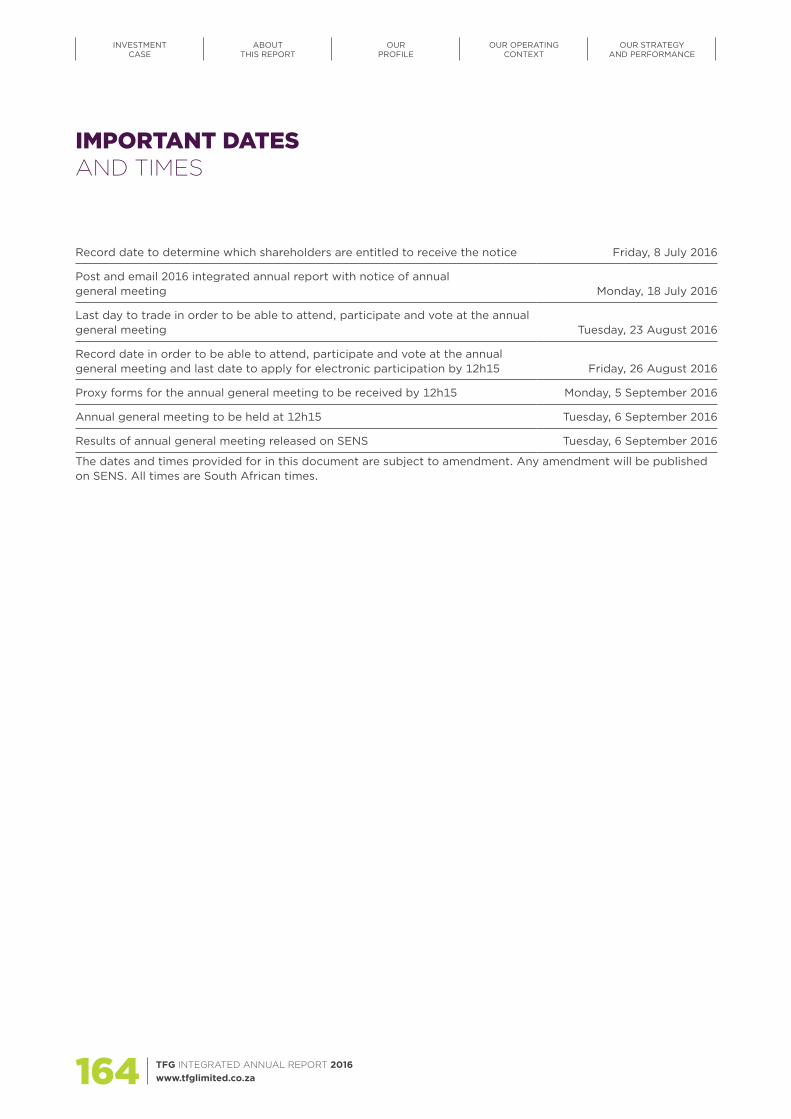
TFG INTEGRATED ANNUAL REPORT 2016 www.tfglimited.co.za164
IMPORTANT DATES AND TIMES
Record date to determine which shareholders are entitled to receive the notice Friday, 8 July 2016
Post and email 2016 integrated annual report with notice of annual general meeting Monday, 18 July 2016
Last day to trade in order to be able to attend, participate and vote at the annual general meeting Tuesday, 23 August 2016
Record date in order to be able to attend, participate and vote at the annual general meeting and last date to apply for electronic participation by 12h15 Friday, 26 August 2016
Proxy forms for the annual general meeting to be received by 12h15 Monday, 5 September 2016
Annual general meeting to be held at 12h15 Tuesday, 6 September 2016
Results of annual general meeting released on SENS Tuesday, 6 September 2016
The dates and times provided for in this document are subject to amendment. Any amendment will be published on SENS. All times are South African times.
INVESTMENT CASE
ABOUTTHIS REPORT
OUR PROFILE
OUR OPERATINGCONTEXT
OUR STRATEGY AND PERFORMANCE
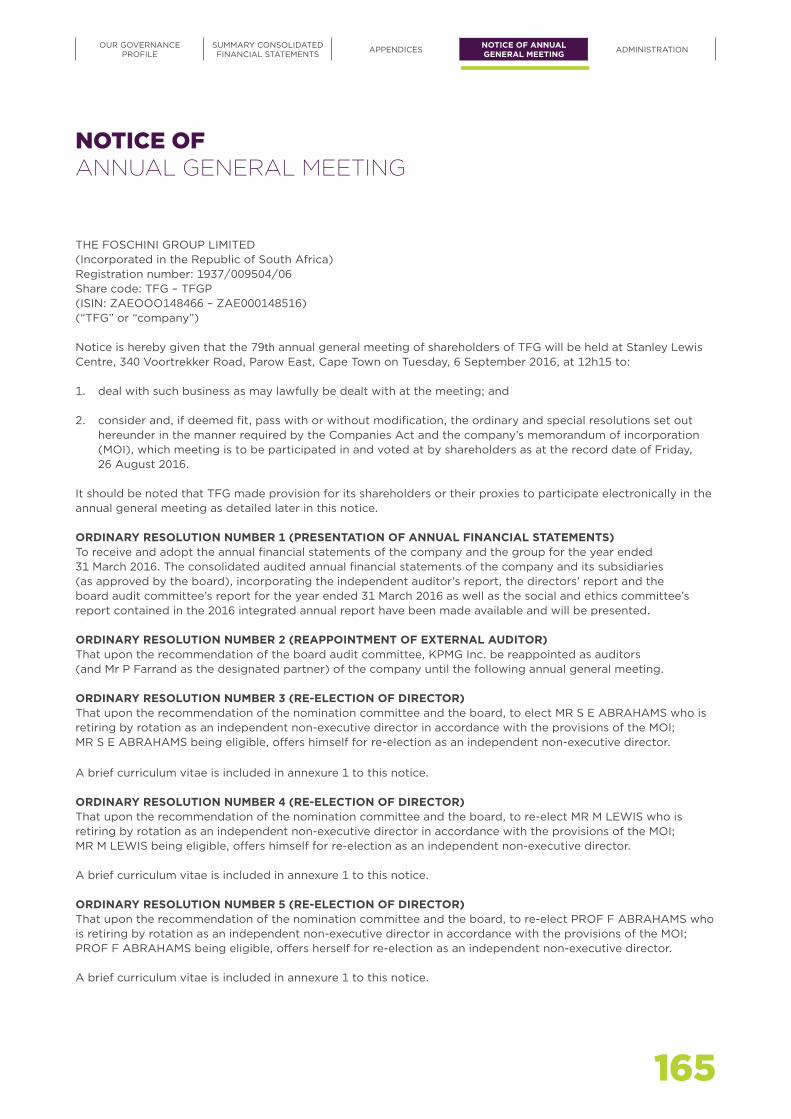
165
NOTICE OF ANNUAL GENERAL MEETING
THE FOSCHINI GROUP LIMITED(Incorporated in the Republic of South Africa)Registration number: 1937/009504/06Share code: TFG – TFGP(ISIN: ZAEOOO148466 – ZAE000148516)(“TFG” or “company”)
Notice is hereby given that the 79th annual general meeting of shareholders of TFG will be held at Stanley Lewis Centre, 340 Voortrekker Road, Parow East, Cape Town on Tuesday, 6 September 2016, at 12h15 to:
1. deal with such business as may lawfully be dealt with at the meeting; and
2. consider and, if deemed fit, pass with or without modification, the ordinary and special resolutions set out hereunder in the manner required by the Companies Act and the company’s memorandum of incorporation (MOI), which meeting is to be participated in and voted at by shareholders as at the record date of Friday, 26 August 2016.
It should be noted that TFG made provision for its shareholders or their proxies to participate electronically in the annual general meeting as detailed later in this notice.
ORDINARY RESOLUTION NUMBER 1 (PRESENTATION OF ANNUAL FINANCIAL STATEMENTS)To receive and adopt the annual financial statements of the company and the group for the year ended 31 March 2016. The consolidated audited annual financial statements of the company and its subsidiaries (as approved by the board), incorporating the independent auditor’s report, the directors’ report and the board audit committee’s report for the year ended 31 March 2016 as well as the social and ethics committee’s report contained in the 2016 integrated annual report have been made available and will be presented.
ORDINARY RESOLUTION NUMBER 2 (REAPPOINTMENT OF EXTERNAL AUDITOR)That upon the recommendation of the board audit committee, KPMG Inc. be reappointed as auditors (and Mr P Farrand as the designated partner) of the company until the following annual general meeting.
ORDINARY RESOLUTION NUMBER 3 (RE-ELECTION OF DIRECTOR)That upon the recommendation of the nomination committee and the board, to elect MR S E ABRAHAMS who is retiring by rotation as an independent non-executive director in accordance with the provisions of the MOI; MR S E ABRAHAMS being eligible, offers himself for re-election as an independent non-executive director.
A brief curriculum vitae is included in annexure 1 to this notice.
ORDINARY RESOLUTION NUMBER 4 (RE-ELECTION OF DIRECTOR)That upon the recommendation of the nomination committee and the board, to re-elect MR M LEWIS who is retiring by rotation as an independent non-executive director in accordance with the provisions of the MOI; MR M LEWIS being eligible, offers himself for re-election as an independent non-executive director.
A brief curriculum vitae is included in annexure 1 to this notice.
ORDINARY RESOLUTION NUMBER 5 (RE-ELECTION OF DIRECTOR)That upon the recommendation of the nomination committee and the board, to re-elect PROF F ABRAHAMS who is retiring by rotation as an independent non-executive director in accordance with the provisions of the MOI; PROF F ABRAHAMS being eligible, offers herself for re-election as an independent non-executive director.
A brief curriculum vitae is included in annexure 1 to this notice.
OUR GOVERNANCEPROFILE
SUMMARY CONSOLIDATED FINANCIAL STATEMENTS APPENDICES NOTICE OF ANNUAL
GENERAL MEETING ADMINISTRATION
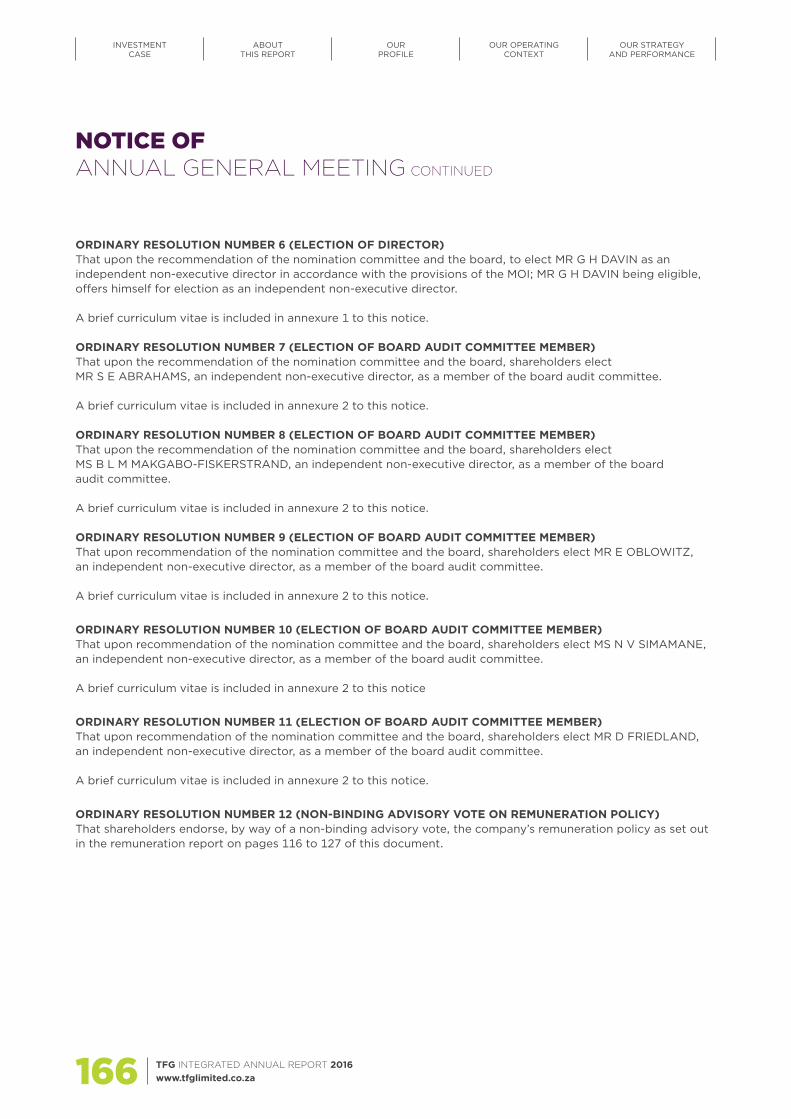
TFG INTEGRATED ANNUAL REPORT 2016 www.tfglimited.co.za166
NOTICE OF ANNUAL GENERAL MEETING CONTINUED
ORDINARY RESOLUTION NUMBER 6 (ELECTION OF DIRECTOR)That upon the recommendation of the nomination committee and the board, to elect MR G H DAVIN as an independent non-executive director in accordance with the provisions of the MOI; MR G H DAVIN being eligible, offers himself for election as an independent non-executive director.
A brief curriculum vitae is included in annexure 1 to this notice.
ORDINARY RESOLUTION NUMBER 7 (ELECTION OF BOARD AUDIT COMMITTEE MEMBER)That upon the recommendation of the nomination committee and the board, shareholders elect MR S E ABRAHAMS, an independent non-executive director, as a member of the board audit committee.
A brief curriculum vitae is included in annexure 2 to this notice.
ORDINARY RESOLUTION NUMBER 8 (ELECTION OF BOARD AUDIT COMMITTEE MEMBER)That upon the recommendation of the nomination committee and the board, shareholders elect MS B L M MAKGABO-FISKERSTRAND, an independent non-executive director, as a member of the board audit committee.
A brief curriculum vitae is included in annexure 2 to this notice.
ORDINARY RESOLUTION NUMBER 9 (ELECTION OF BOARD AUDIT COMMITTEE MEMBER)That upon recommendation of the nomination committee and the board, shareholders elect MR E OBLOWITZ, an independent non-executive director, as a member of the board audit committee.
A brief curriculum vitae is included in annexure 2 to this notice.
ORDINARY RESOLUTION NUMBER 10 (ELECTION OF BOARD AUDIT COMMITTEE MEMBER)That upon recommendation of the nomination committee and the board, shareholders elect MS N V SIMAMANE, an independent non-executive director, as a member of the board audit committee.
A brief curriculum vitae is included in annexure 2 to this notice
ORDINARY RESOLUTION NUMBER 11 (ELECTION OF BOARD AUDIT COMMITTEE MEMBER)That upon recommendation of the nomination committee and the board, shareholders elect MR D FRIEDLAND, an independent non-executive director, as a member of the board audit committee.
A brief curriculum vitae is included in annexure 2 to this notice.
ORDINARY RESOLUTION NUMBER 12 (NON-BINDING ADVISORY VOTE ON REMUNERATION POLICY)That shareholders endorse, by way of a non-binding advisory vote, the company’s remuneration policy as set out in the remuneration report on pages 116 to 127 of this document.
INVESTMENT CASE
ABOUTTHIS REPORT
OUR PROFILE
OUR OPERATINGCONTEXT
OUR STRATEGY AND PERFORMANCE
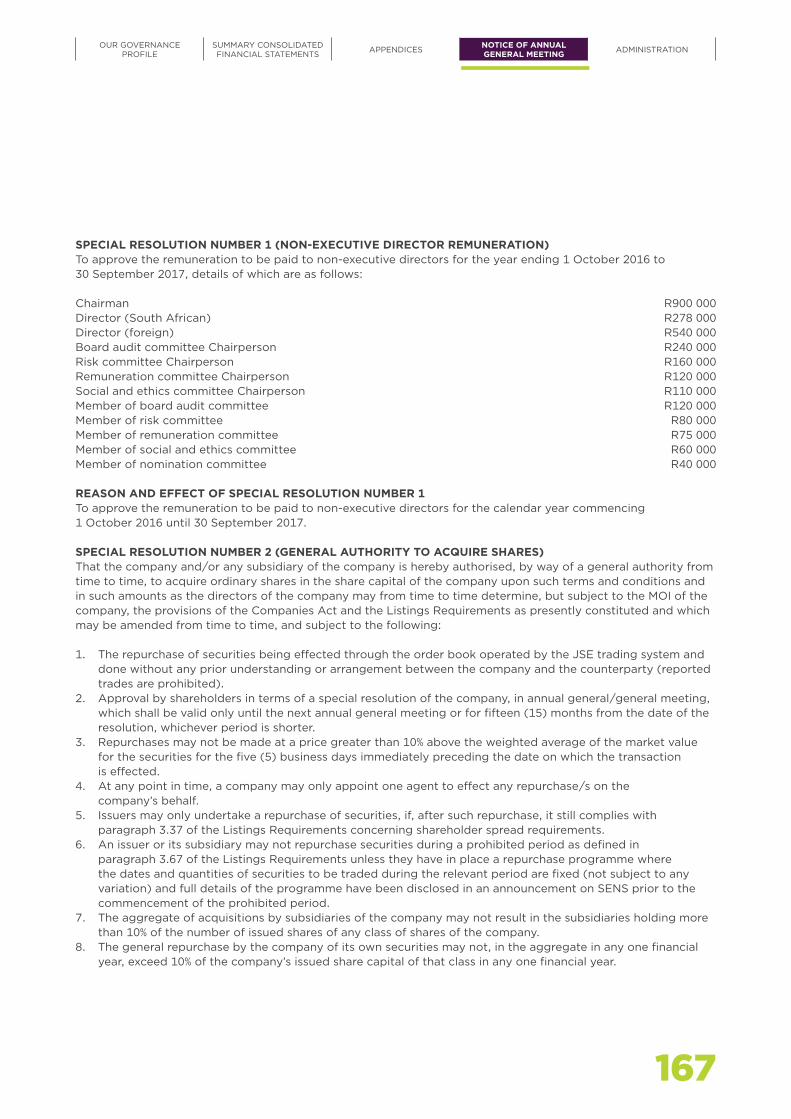
167
SPECIAL RESOLUTION NUMBER 1 (NON-EXECUTIVE DIRECTOR REMUNERATION)To approve the remuneration to be paid to non-executive directors for the year ending 1 October 2016 to 30 September 2017, details of which are as follows:
Chairman R900 000Director (South African) R278 000Director (foreign) R540 000Board audit committee Chairperson R240 000Risk committee Chairperson R160 000Remuneration committee Chairperson R120 000Social and ethics committee Chairperson R110 000Member of board audit committee R120 000Member of risk committee R80 000Member of remuneration committee R75 000Member of social and ethics committee R60 000Member of nomination committee R40 000
REASON AND EFFECT OF SPECIAL RESOLUTION NUMBER 1To approve the remuneration to be paid to non-executive directors for the calendar year commencing 1 October 2016 until 30 September 2017.
SPECIAL RESOLUTION NUMBER 2 (GENERAL AUTHORITY TO ACQUIRE SHARES)That the company and/or any subsidiary of the company is hereby authorised, by way of a general authority from time to time, to acquire ordinary shares in the share capital of the company upon such terms and conditions and in such amounts as the directors of the company may from time to time determine, but subject to the MOI of the company, the provisions of the Companies Act and the Listings Requirements as presently constituted and which may be amended from time to time, and subject to the following:
1. The repurchase of securities being effected through the order book operated by the JSE trading system and done without any prior understanding or arrangement between the company and the counterparty (reported trades are prohibited).
2. Approval by shareholders in terms of a special resolution of the company, in annual general/general meeting, which shall be valid only until the next annual general meeting or for fifteen (15) months from the date of the resolution, whichever period is shorter.
3. Repurchases may not be made at a price greater than 10% above the weighted average of the market value for the securities for the five (5) business days immediately preceding the date on which the transaction is effected.
4. At any point in time, a company may only appoint one agent to effect any repurchase/s on the company’s behalf.
5. Issuers may only undertake a repurchase of securities, if, after such repurchase, it still complies with paragraph 3.37 of the Listings Requirements concerning shareholder spread requirements.
6. An issuer or its subsidiary may not repurchase securities during a prohibited period as defined in paragraph 3.67 of the Listings Requirements unless they have in place a repurchase programme where the dates and quantities of securities to be traded during the relevant period are fixed (not subject to any variation) and full details of the programme have been disclosed in an announcement on SENS prior to the commencement of the prohibited period.
7. The aggregate of acquisitions by subsidiaries of the company may not result in the subsidiaries holding more than 10% of the number of issued shares of any class of shares of the company.
8. The general repurchase by the company of its own securities may not, in the aggregate in any one financial year, exceed 10% of the company’s issued share capital of that class in any one financial year.
OUR GOVERNANCEPROFILE
SUMMARY CONSOLIDATED FINANCIAL STATEMENTS APPENDICES NOTICE OF ANNUAL
GENERAL MEETING ADMINISTRATION
TFG INTEGRATED ANNUAL REPORT 2016 www.tfglimited.co.za168
NOTICE OF ANNUAL GENERAL MEETING CONTINUED
Statement by the boardPursuant to and in terms of the Listings Requirements, the board hereby states:
1. The intention of the directors of the company is to use the general authority if at some future date the cash resources of the company are in excess of its requirements. In this regard the directors will take account of, inter alia, an appropriate capitalisation structure for the company, the long-term cash needs of the company, and will ensure that any such use is in the interests of shareholders.
2. In determining the method by which the company intends to repurchase its securities, the maximum number of securities to be repurchased and the date on which such repurchase will take place, the board will ensure that:
1. the company and the group will be able to pay their debts as they become due in ordinary course of business for the next twelve (12) months;
2. the assets of the company and the group will be in excess of the liabilities of the company and the group for the next twelve (12) months, and for this purpose, the assets and liabilities will be recognised and measured in accordance with the accounting policies used in the latest audited consolidated annual financial statements;
3. the issued share capital and reserves of the company and the group will be adequate for the purposes of the business of the company and the group for the next twelve (12) months; and
4. the working capital available to the company and the group will be sufficient for the group’s requirements for next twelve (12) months.
The board will notify the shareholders of the terms of the repurchase of the company’s shares by publishing an announcement in accordance with the Listings Requirements should the company or its subsidiaries cumulatively repurchase more than 3% of the company’s issued share capital.
The board will ensure that its sponsor provides the necessary sponsor letter on the adequacy of the company’s working capital in terms of paragraph 2.12 of the Listings Requirements prior to the commencement of any repurchases of TFG shares.
REASON AND EFFECT OF SPECIAL RESOLUTION NUMBER 2The reason for special resolution number 2 is to grant the company a general authority in terms of the Companies Act for the acquisition by the company or any of its subsidiaries of shares issued by the company, which authority shall be valid until earlier of the next annual general meeting of the company or the variation or revocation of such general authority by special resolution at any subsequent general meeting of the company, provided that the general authority shall not extend beyond fifteen (15) months from the date of this annual general meeting. The passing of this special resolution will have the effect of authorising the company or any of its subsidiaries to acquire shares issued by the company.
Listings Requirements disclosuresParagraph 11.26 of the Listings Requirements require the following disclosures:
• Major shareholders (paragraph 11.26 (b)(i) – refer to pages 157 and 158 of this document)• Share capital of the company (paragraph 11.26(b)(iii) – refer to note 11 of the 2016 annual financial
statements)
Update on directors’ interests in terms of paragraph 7.B.20 of the Listings RequirementsPlease refer to page 92 of this document.
Litigation statement In terms of paragraph 7.D.11 of the Listings Requirements, the directors are not aware of any legal proceedings that are pending or threatened which may have or had in the recent past (being at least the previous twelve (12) months) a material effect on TFG’s financial position.
INVESTMENT CASE
ABOUTTHIS REPORT
OUR PROFILE
OUR OPERATINGCONTEXT
OUR STRATEGY AND PERFORMANCE

169
Material changesOther than the facts and developments reported on in this document, there were no material changes in the financial or trading position of the company and its subsidiaries since the date of signature of this document.
Directors’ responsibility statementThe directors whose names are given on pages 84 to 87 of this document collectively and individually accept full responsibility for the accuracy of the information pertaining to this special resolution and certify that, to the best of their knowledge and belief, there are no facts that were omitted which would make any statement false or misleading, and that all reasonable enquiries to ascertain such facts were made and that this special resolution contains all information required by law and the Listings Requirements.
SPECIAL RESOLUTION NUMBER 3 (FINANCIAL ASSISTANCE)The shareholders approve that the company may provide direct or indirect financial assistance to a related or interrelated company or corporation provided that such financial assistance may only be provided within two (2) years from the date of the adoption of this special resolution and subject further to sections 44 and 45 of the Companies Act.
REASON AND EFFECT OF SPECIAL RESOLUTION NUMBER 3Section 44 of the Act applies to financial assistance provided by a company to related or interrelated companies in the event that the financial assistance is provided for the purpose of, or in connection with, the subscription of any option, or any securities issued or to be issued by the company or a related or interrelated company, or for the purchase of any securities of the company or a related or interrelated company.
Section 45 of the Companies Act applies to financial assistance provided by a company to related or interrelated companies and corporations, including, among others, its subsidiaries.
Thus both sections 44 and 45 of the Companies Act provide that the financial assistance may only be provided pursuant to a special resolution passed by shareholders within the previous two (2) years.
The passing of this special resolution will have the effect of authorising the company to provide financial assistance to related and interrelated companies and corporations.
ORDINARY RESOLUTION NUMBER 13Any director of the company is authorised to do all such things and sign all such documents as may be necessary for, or incidental to, the implementation of ordinary resolutions 1 to 12 and special resolutions 1 to 3 proposed at the company’s annual general meeting to be held on Tuesday, 6 September 2016.
To transact any other business that may be transacted at an annual general meeting.
Voting requirementsAn ordinary resolution requires the support of more than 50% of the voting rights exercised on the resolution to be adopted.
A special resolution requires the support of more than 75% of the voting rights exercised on the resolution to be adopted.
General instructionsMembers are encouraged to attend, speak and vote at the annual general meeting.
Meeting participants (including shareholders and proxies) will be required to provide proof of identity before being entitled to attend and/or participate in the meeting. Forms of identification include identity documents, driver’s licence and passports.
OUR GOVERNANCEPROFILE
SUMMARY CONSOLIDATED FINANCIAL STATEMENTS APPENDICES NOTICE OF ANNUAL
GENERAL MEETING ADMINISTRATION
TFG INTEGRATED ANNUAL REPORT 2016 www.tfglimited.co.za170
NOTICE OF ANNUAL GENERAL MEETING CONTINUED
If you hold shares in certificated form (in other words, you have not dematerialised your TFG shares) or are registered as an own-name dematerialised shareholder, then:
• you may attend and vote at this meeting; alternatively• you may appoint a proxy to represent you at this meeting by completing the attached form of proxy and
lodging it with the transfer secretaries of TFG by 12h15 on Monday, 5 September 2016.
Where you are entitled and wish to appoint a proxy, the proxy does not have to be a TFG shareholder and you may appoint more than one proxy to exercise voting rights attached to different securities held by you which entitled you to vote.
If you have dematerialised your shares and are not registered as an own-name dematerialised shareholder(in other words, you have specifically instructed your CSDP not to hold your shares in your own name on TFG’s uncertificated securities register), then subject to the custody agreement between yourself and your CSDP or broker:
• If you wish to attend the meeting you must contact your CSDP or broker and obtain the relevant letter of representation from it; or
• If you are unable to attend the meeting but wish to be represented at the meeting, you must contact your CSDP or broker and furnish it with your voting instructions in respect of the meeting. You must not complete the attached form of proxy. The instructions must be provided in accordance with the custody agreement between yourself and your CSDP or broker within the time period required by your CSDP or broker.
CSDPs, brokers or their nominees recorded in the company’s uncertificated securities register should, when authorised in terms of their mandate or instructed to do so by the owner on behalf of whom they hold dematerialised shares in the company, vote by either appointing a duly authorised representative to attend and vote at the meeting or by completing the attached form of proxy in accordance with the instructions thereon and lodging it with the transfer secretaries of the company by 12h15 on Monday, 5 September 2016.
Electronic participationThe company has made provision for shareholders or their proxies to participate electronically in the annual general meeting by way of telephone conference call.
Should you wish to participate in the annual general meeting by telephone conference call, you or your proxy must complete the application form attached to this document and return it to the transfer secretaries of the company by no later than 12h15 on Friday, 26 August 2016.
By order of the board
D van RooyenGroup Company Secretary
29 June 2016
INVESTMENT CASE
ABOUTTHIS REPORT
OUR PROFILE
OUR OPERATINGCONTEXT
OUR STRATEGY AND PERFORMANCE

171
NOTICE OF ANNUAL GENERAL MEETING ANNEXURE 1
BRIEF CURRICULUM VITAE OF DIRECTORS STANDING FOR RE-ELECTIONIn terms of the MOI, each year, one third (or a number closest to) of the non-executive directors are subject to retirement by rotation and are eligible for re-election.
The nomination committee has considered the confirmation, performance and attendance of the following directors retiring by rotation:
• Mr S E Abrahams• Mr M Lewis• Prof F Abrahams
The nomination committee has also considered the re-election of Mr G H Davin.
The nomination committee has no hesitation in recommending these directors for reappointment by the shareholders.
S E ABRAHAMS (77) FCA, CA(SA)
Appointed: 1998
Member of: Audit and nomination committees
Chairman of: Audit committee
Open invitation: Risk committee
Also a director of a South African company: Investec Bank Limited
Sam is a very experienced director. He was formerly an international partner and South African managing partner of Arthur Andersen. Sam is currently the Chairman of Investec Securities (Pty) Ltd and Chairman of The Victor Daitz Foundation, one of the largest charitable foundations in South Africa.
M LEWIS (57) Chairman (appointed 19 June 2015)
BA (Econ) (Hons)
Appointed: 1989
Member of: Nomination and remuneration committees
Chairman of: Nomination committee
Meetings attended by invitation: Risk and audit committees
Michael has been involved in investment management since 1983, having worked at Ivory & Sime and Lombard Odier. He is Chairman of Oceana Investment Corporation Limited (UK), The Foschini Group Limited (South Africa) and Strandbags Limited (Australia). He is also a partner of Oceana Investment Partners (UK) and a director of Histogenics Corporation (US).
OUR GOVERNANCEPROFILE
SUMMARY CONSOLIDATED FINANCIAL STATEMENTS APPENDICES NOTICE OF ANNUAL
GENERAL MEETING ADMINISTRATION
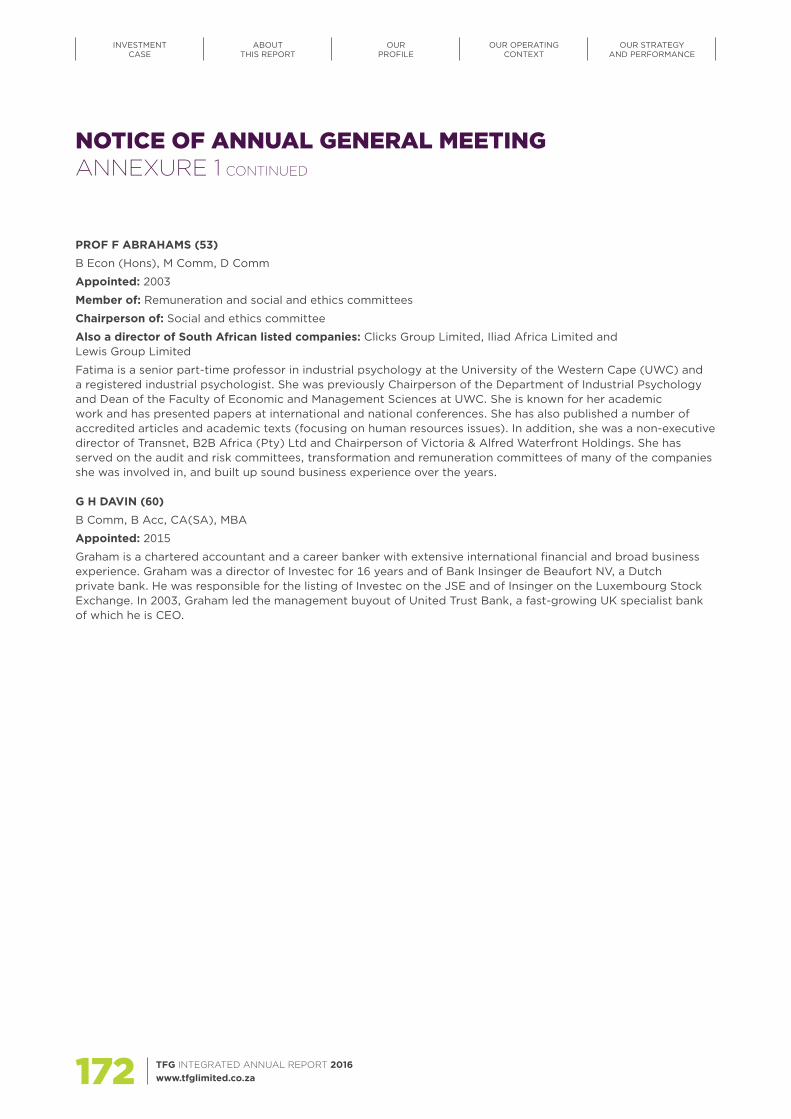
TFG INTEGRATED ANNUAL REPORT 2016 www.tfglimited.co.za172
PROF F ABRAHAMS (53) B Econ (Hons), M Comm, D Comm
Appointed: 2003
Member of: Remuneration and social and ethics committees
Chairperson of: Social and ethics committee
Also a director of South African listed companies: Clicks Group Limited, Iliad Africa Limited and Lewis Group Limited
Fatima is a senior part-time professor in industrial psychology at the University of the Western Cape (UWC) and a registered industrial psychologist. She was previously Chairperson of the Department of Industrial Psychology and Dean of the Faculty of Economic and Management Sciences at UWC. She is known for her academic work and has presented papers at international and national conferences. She has also published a number of accredited articles and academic texts (focusing on human resources issues). In addition, she was a non-executive director of Transnet, B2B Africa (Pty) Ltd and Chairperson of Victoria & Alfred Waterfront Holdings. She has served on the audit and risk committees, transformation and remuneration committees of many of the companies she was involved in, and built up sound business experience over the years.
G H DAVIN (60)B Comm, B Acc, CA(SA), MBA
Appointed: 2015
Graham is a chartered accountant and a career banker with extensive international financial and broad business experience. Graham was a director of Investec for 16 years and of Bank Insinger de Beaufort NV, a Dutch private bank. He was responsible for the listing of Investec on the JSE and of Insinger on the Luxembourg Stock Exchange. In 2003, Graham led the management buyout of United Trust Bank, a fast-growing UK specialist bank of which he is CEO.
NOTICE OF ANNUAL GENERAL MEETING ANNEXURE 1 CONTINUED
INVESTMENT CASE
ABOUTTHIS REPORT
OUR PROFILE
OUR OPERATINGCONTEXT
OUR STRATEGY AND PERFORMANCE
173
NOTICE OF ANNUAL GENERAL MEETING ANNEXURE 2
BRIEF CURRICULUM VITAE OF DIRECTORS PROPOSED FOR ELECTION TO THE BOARD AUDIT COMMITTEEIn terms of the MOI and section 94(2) of the Companies Act, the board audit committee is required to be elected by shareholders at each annual general meeting.
In terms of King III, the board audit committee must comprise a minimum of three independent non-executive directors and further in terms of the regulations of the Companies Act at least one third of the members of the committee must have academic qualifications or experience in economics, law, corporate governance, finance, accounting, commerce, industry, public affairs or human resource management.
Having regard to the above requirements, the nomination committee considered the expertise, experience and independence requirements of the members offering themselves for election and recommended to the board that the board propose the following candidates to shareholders:
• Mr S E Abrahams• Mr D Friedland• Ms B L M Makgabo-Fiskerstrand• Mr E Oblowitz• Ms N V Simamane
Brief details of their qualifications and experience follow.
S E ABRAHAMS (77) FCA, CA(SA)
Appointed: 1998
Member of: Audit and nomination committees
Chairman of: Audit committee
Open invitation: Risk committee
Also a director of a South African company: Investec Bank Limited
Sam is a very experienced director. He was formerly an international partner and South African managing partner of Arthur Andersen. Sam is currently the Chairman of Investec Securities (Pty) Ltd and Chairman of The Victor Daitz Foundation, one of the largest charitable foundations in South Africa.
D FRIEDLAND (63) B Comm, Certificate in the Theory of Accountancy, CA(SA)
Appointed: 2013
Member of: Remuneration, audit and risk committees
Also a director of South African listed companies: Pick ’n Pay Stores Limited and Investec Limited
Also a director of a foreign listed company: Investec PLC
David is a chartered accountant with extensive audit experience of a broad range of retail listed companies. He served as international partner at Arthur Andersen from 1990 and as a partner at KPMG from 2002. David was Head of Audit and Risk at KPMG (Cape Town) and was the lead audit partner for several listed companies. In 2013, David retired as a partner at KPMG and was appointed to the boards of Investec Limited and Investec PLC in March 2013, serving as the group audit committee Chairman.
OUR GOVERNANCEPROFILE
SUMMARY CONSOLIDATED FINANCIAL STATEMENTS APPENDICES NOTICE OF ANNUAL
GENERAL MEETING ADMINISTRATION
TFG INTEGRATED ANNUAL REPORT 2016 www.tfglimited.co.za174
INVESTMENT CASE
ABOUTTHIS REPORT
OUR PROFILE
OUR OPERATINGCONTEXT
OUR STRATEGY AND PERFORMANCE
NOTICE OF ANNUAL GENERAL MEETING ANNEXURE 2 CONTINUED
B L M MAKGABO-FISKERSTRAND (42) Appointed: 2012
Member of: Audit and social and ethics committees
Also a director of a South African listed company: Sun International Limited
Tumi is founder and executive director of AfricaWorldwide Media and director of Tumi Makgabo Enterprises, focusing on enterprise development in South Africa and across the African continent. In addition, Tumi served for two years as the Vice Chairperson of the World Economic Forum’s Global Agenda Council for Women’s Empowerment and as a member of its Council on Africa. In 2008, she was nominated to the World Economic Forum’s Forum of Young Global Leaders, which is a multistakeholder community of exceptional leaders below the age of 40 selected from around the world. She also serves as a non-executive director of South African Tourism and was appointed a member of the Department of Arts and Culture’s reference group for Africa Month in 2015.
E OBLOWITZ (58) B Comm, CA(SA), CPA(Isr)
Appointed: 2010
Member of: Audit, remuneration and risk committees
Chairperson of: Remuneration and risk committees
Also a director of a South African listed company: Trencor Limited
Eddy has considerable audit and business advisory experience, having spent 21 years in professional practice, most notably as a senior partner of the Cape Town, Durban and Port Elizabeth offices of Arthur Andersen. In addition, he served as a member of the firm’s worldwide Retail and Distribution Industry Team. He is currently the Executive Chairman of Stonehage Fleming South Africa, which provides multifamily office, wealth management and advisory services to an extensive local and international client base.
N V SIMAMANE (57)BSc (Biochem) (Hons)
Appointed: 2009
Member of: Audit and social and ethics committees
Also a director of South African listed companies: Cashbuild Limited, Oceana Group, Hollard Insurance, Hollard Life Insurance, SA Post Office
Nomahlubi has extensive business, marketing and communications experience, having previously held the positions of Marketing Manager at Unilever, Marketing Director of British American Tobacco and Managing Director of BLGK Bates Advertising Agency. She is currently the CEO of Zanusi Brand Solutions, a branding consultancy that she founded in 2001, and a director of various South African companies including Ancestral Connect, Combined Artistic Productions, Digital Space Content Agency (DSCA), Heads Up Effective Market Focus and PNB Investments. She has worked in the United States and Kenya and has been recognised as a seasoned business woman, having won two Business Women of the Year Awards in 2009. She was recently named the 2013 Enterprising Woman in Fort Lauderdale, Florida, USA.
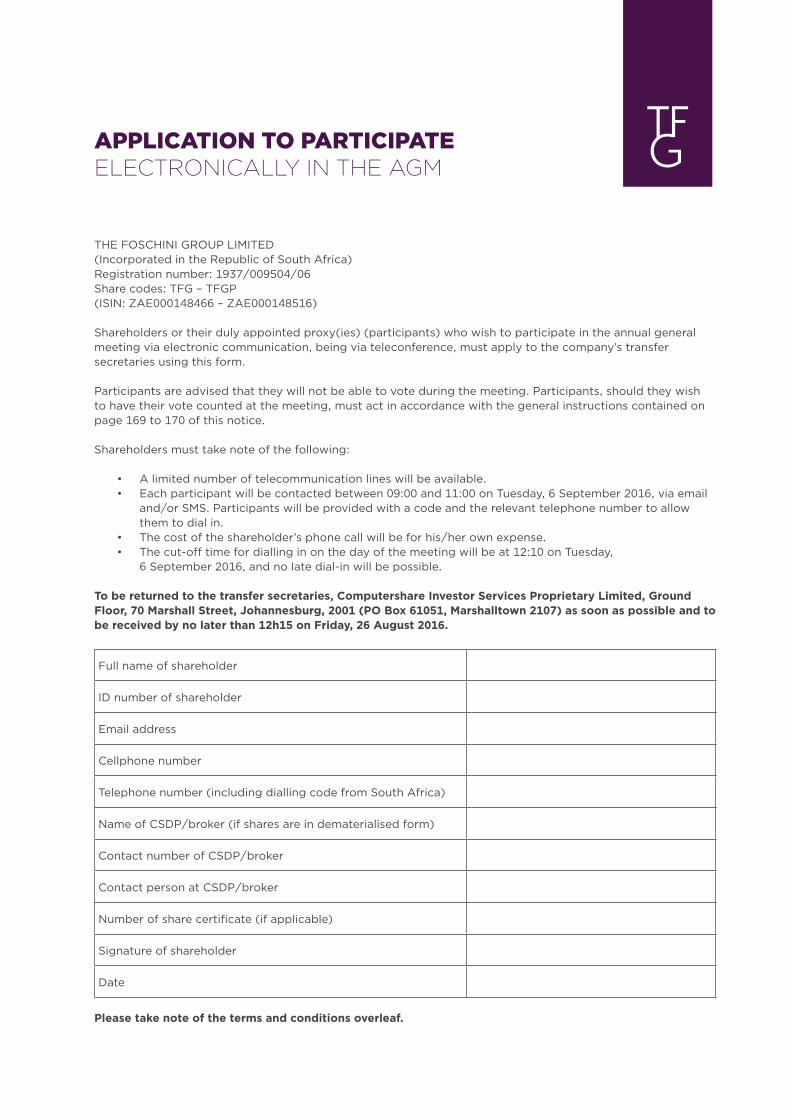
APPLICATION TO PARTICIPATE ELECTRONICALLY IN THE AGM
THE FOSCHINI GROUP LIMITED(Incorporated in the Republic of South Africa) Registration number: 1937/009504/06 Share codes: TFG – TFGP(ISIN: ZAE000148466 – ZAE000148516)
Shareholders or their duly appointed proxy(ies) (participants) who wish to participate in the annual general meeting via electronic communication, being via teleconference, must apply to the company’s transfer secretaries using this form.
Participants are advised that they will not be able to vote during the meeting. Participants, should they wish to have their vote counted at the meeting, must act in accordance with the general instructions contained on page 169 to 170 of this notice.
Shareholders must take note of the following:
• A limited number of telecommunication lines will be available.• Each participant will be contacted between 09:00 and 11:00 on Tuesday, 6 September 2016, via email
and/or SMS. Participants will be provided with a code and the relevant telephone number to allow them to dial in.
• The cost of the shareholder’s phone call will be for his/her own expense.• The cut-off time for dialling in on the day of the meeting will be at 12:10 on Tuesday,
6 September 2016, and no late dial-in will be possible.
To be returned to the transfer secretaries, Computershare Investor Services Proprietary Limited, Ground Floor, 70 Marshall Street, Johannesburg, 2001 (PO Box 61051, Marshalltown 2107) as soon as possible and to be received by no later than 12h15 on Friday, 26 August 2016.
Full name of shareholder
ID number of shareholder
Email address
Cellphone number
Telephone number (including dialling code from South Africa)
Name of CSDP/broker (if shares are in dematerialised form)
Contact number of CSDP/broker
Contact person at CSDP/broker
Number of share certificate (if applicable)
Signature of shareholder
Date
Please take note of the terms and conditions overleaf.
APPLICATION TO PARTICIPATE ELECTRONICALLY IN THE AGM CONTINUED
Terms and conditions for participation in the annual general meeting via electronic communication
1. The cost of dialling in using a telecommunication line to participate in the annual general meeting is for the expense of the participant and will be billed separately by the participant’s own telephone service provider.
2. The shareholder/participant acknowledges that the telecommunication lines are provided by a third party and indemnifies TFG against any loss, damage, penalty or claim arising in any way from the use or possession of the telecommunication lines whether or not the problem is caused by any act or omission on the part of the shareholder/participant or anyone else.
3. Shareholders who wish to participate in the meeting by dialling in must note that they will not be able to vote during the meeting. Such shareholders, should they wish to have their votes counted at the meeting, must act in accordance with the general instructions contained in this notice of annual general meeting by:
(a) completing the form of proxy; or(b) contacting their CSDP/broker.
4. The application will only be successful if this application form has been completed in full and signed by the shareholder/proxy, and the terms and conditions have been complied with.
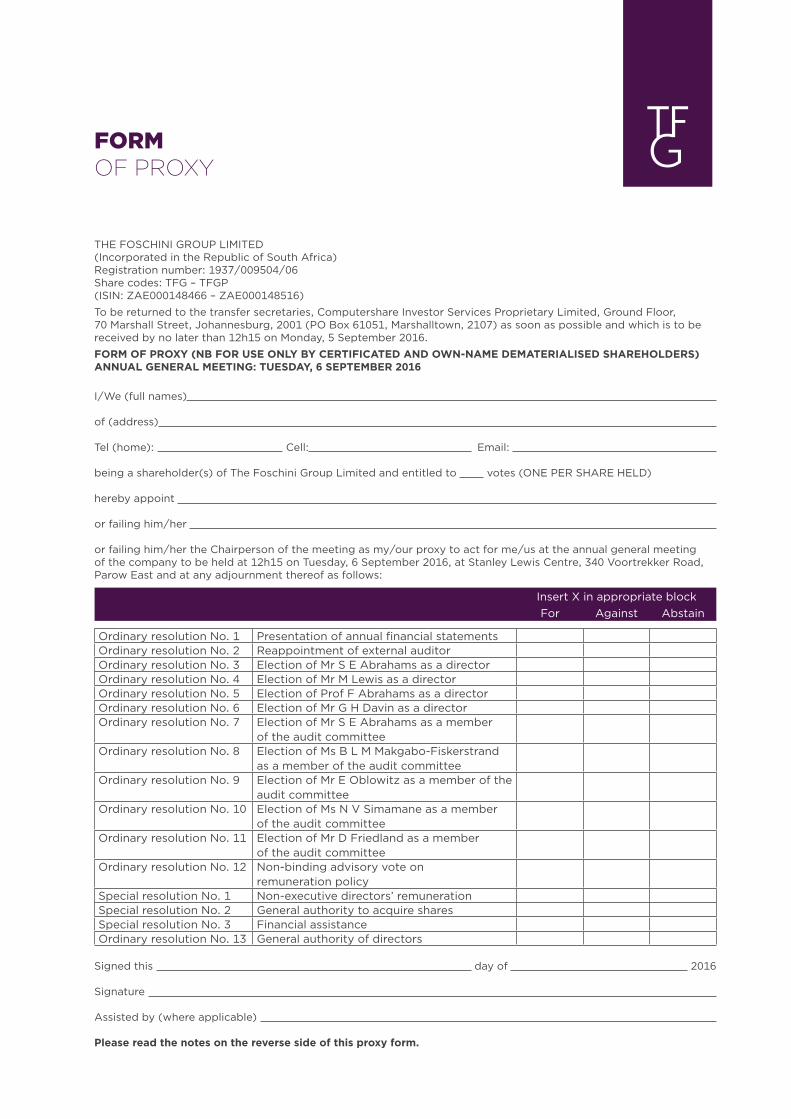
FORM OF PROXY
THE FOSCHINI GROUP LIMITED(Incorporated in the Republic of South Africa) Registration number: 1937/009504/06 Share codes: TFG – TFGP(ISIN: ZAE000148466 – ZAE000148516)
To be returned to the transfer secretaries, Computershare Investor Services Proprietary Limited, Ground Floor, 70 Marshall Street, Johannesburg, 2001 (PO Box 61051, Marshalltown, 2107) as soon as possible and which is to be received by no later than 12h15 on Monday, 5 September 2016.
FORM OF PROXY (NB FOR USE ONLY BY CERTIFICATED AND OWN-NAME DEMATERIALISED SHAREHOLDERS) ANNUAL GENERAL MEETING: TUESDAY, 6 SEPTEMBER 2016
I/We (full names)
of (address)
Tel (home): Cell: Email:
being a shareholder(s) of The Foschini Group Limited and entitled to votes (ONE PER SHARE HELD)
hereby appoint
or failing him/her
or failing him/her the Chairperson of the meeting as my/our proxy to act for me/us at the annual general meetingof the company to be held at 12h15 on Tuesday, 6 September 2016, at Stanley Lewis Centre, 340 Voortrekker Road, Parow East and at any adjournment thereof as follows:
Insert X in appropriate blockFor Against Abstain
Ordinary resolution No. 1 Presentation of annual financial statementsOrdinary resolution No. 2 Reappointment of external auditorOrdinary resolution No. 3 Election of Mr S E Abrahams as a directorOrdinary resolution No. 4 Election of Mr M Lewis as a directorOrdinary resolution No. 5 Election of Prof F Abrahams as a directorOrdinary resolution No. 6 Election of Mr G H Davin as a directorOrdinary resolution No. 7 Election of Mr S E Abrahams as a member
of the audit committeeOrdinary resolution No. 8 Election of Ms B L M Makgabo-Fiskerstrand
as a member of the audit committeeOrdinary resolution No. 9 Election of Mr E Oblowitz as a member of the
audit committeeOrdinary resolution No. 10 Election of Ms N V Simamane as a member
of the audit committeeOrdinary resolution No. 11 Election of Mr D Friedland as a member
of the audit committeeOrdinary resolution No. 12 Non-binding advisory vote on
remuneration policySpecial resolution No. 1 Non-executive directors’ remunerationSpecial resolution No. 2 General authority to acquire sharesSpecial resolution No. 3 Financial assistanceOrdinary resolution No. 13 General authority of directors
Signed this day of 2016
Signature
Assisted by (where applicable)
Please read the notes on the reverse side of this proxy form.

FORM OF PROXY CONTINUED
NOTES
1. The person whose name stands first on the proxy form and who is present at the annual general meeting will be entitled to act as a proxy to the exclusion of those whose names follow thereafter. If no proxy is inserted in the spaces provided, the Chairperson shall be deemed to be appointed as the proxy.
2. Unless otherwise instructed above, a proxy is entitled to vote as he/she thinks fit.
3. A proxy appointed by a shareholder to attend, speak and vote in his/her stead need not also be a shareholder of the company.
4. In order to be effective, this proxy form and the power of attorney or other authority (if any) under which it is signed, must be RECEIVED by the transfer secretaries of the company, Computershare Investor Services Proprietary Limited, not less than twenty-four (24) hours before the time appointed for the holding of the meeting or any adjournment thereof, as the case may be, at which the proxy proposes to vote, excluding Saturdays, Sundays and South African public holidays.
5. Any alteration or correction made to this proxy form must be initialled by the signatory(ies), but may not be accepted by the Chairperson.
6. If you hold shares in certificated form (i.e. you have not dematerialised your shares) or are registered as an own-name dematerialised shareholder, you may attend and vote at this meeting; alternatively, you may appoint a proxy to represent you at the meeting by completing the attached form of proxy and lodging it with the transfer secretaries of the company to be RECEIVED at least 24 hours before the time of the meeting, excluding Saturdays, Sundays and South African public holidays.
7. If you have dematerialised your shares and are not registered as an own-name dematerialised shareholder (i.e. specifically instructed your CSDP to hold your shares in your own name), then subject to the custody agreement between yourself and your CSDP or broker:
• If you wish to attend the meeting you must contact your CSDP or broker and obtain the relevant letter of representation from it; or
• If you are unable to attend the meeting but wish to be represented at the meeting, you must contact your CSDP or broker and furnish it with your voting instructions in respect of the meeting. You must NOT complete the attached form of proxy. The instructions must be provided in accordance with the custody agreement between you and your CSDP or broker within the time period required by your CSDP or broker.
8. Brokers or their nominees recorded in the company’s register should, when authorised in terms of their mandate or instructed to do so by the owner on behalf of whom they hold dematerialised shares in the company may vote by either appointing a duly authorised representative to attend and vote at the meeting or by completing the attached form of proxy in accordance with the instructions thereon, which must be RECEIVED by the transfer secretaries of the company at least 24 hours before the time of the meeting, excluding Saturdays, Sundays and South African public holidays.


ADMINISTRATIONThe Foschini Group LimitedRegistration number 1937/009504/06JSE codes: TFG – TFGPISIN: ZAE000148466 – ZAE000148516
Registered officeStanley Lewis Centre340 Voortrekker RoadParow East 7500South Africa
Head officeStanley Lewis Centre340 Voortrekker RoadParow East 7500South AfricaTelephone +27(0) 21 938 1911
Company SecretaryD van Rooyen, B Acc (Hons), CA(SA) Stanley Lewis Centre340 Voortrekker RoadParow East 7500South AfricaPO Box 6020, Parow East 7501South Africa
SponsorUBS South Africa Proprietary Limited64 Weirda Road East, Weirda ValleySandton 2196South Africa
AuditorsKPMG Inc.
AttorneysEdward Nathan Sonnenbergs Inc.
Principal bankerFirstRand Bank Limited
Transfer secretariesComputershare Investor Services Proprietary Limited70 Marshall StreetJohannesburg 2001South AfricaPO Box 61051, Marshalltown 2107South AfricaTelephone +27(0) 11 370 5000
United States ADR DepositaryThe Bank of New York Mellon620 Avenue of the Americas New York, NY 10011
Websitewww.tfglimited.co.za
Shareholders’ calendarFinancial year end 31 March 2016Integrated report publication date 18 July 2016Annual general meeting (79th) 6 September 2016Interim profit announcement (2017) 10 November 2016
Upcoming distribution paymentsOrdinary – final 2016 July 2016 – interim 2017 January 2017Preference – interim 2017 September 2016 – final 2017 March 2017
Queries regarding this report to be addressed to:D van Rooyen (Company Secretary)Email: [email protected]
GREYMATTER & FINCH # 9748
WWW.TFGLIMITED.CO.ZA