Group Five 2015 Annual Report - g5.co.za
172
20 15
Transcript of Group Five 2015 Annual Report - g5.co.za
2015
22 CHAIRPERSON’S REVIEW
32 CHIEF EXECUTIVE OFFICER’S REVIEW
54 CHIEF FINANCIAL OFFICER’S REVIEW
84 COMBINED ASSURANCE
88 GROUP MEASURES
94 TEAM MEASURES
108 TEAM REMUNERATION
140DIRECTORS’ RESPONSIBILITY STATEMENT
141REPORT OF THE INDEPENDENT AUDITOR
142SUMMARY CONSOLIDATED ANNUAL FINANCIAL STATEMENTS
143 DIRECTORS’ REPORT
148 GROUP INCOME STATEMENT
149GROUP STATEMENT OF COMPREHENSIVE INCOME
149DETERMINATION OF GROUP HEADLINE EARNINGS
150GROUP STATEMENT OF FINANCIAL POSITION
YEAR UNDER REVIEW AND FUTURE FOCUS01SECTION
20PAGE
GOVERNANCE, MEASUREMENT AND REMUNERATION02SECTION
82PAGE
138PAGESUMMARY CONSOLIDATED
ANNUAL FINANCIAL STATEMENTS03SECTION
151 GROUP STATEMENT OF CASH FLOW
151GROUP CAPITAL EXPENDITURE AND DEPRECIATION
152GROUP STATEMENT OF CHANGES IN EQUITY
154 GROUP SEGMENTAL ANALYSIS
157 GROUP STATISTICS
157 ESTIMATES AND CONTINGENCIES
158 DIVIDEND DECLARATION
159 ANALYSIS OF SHAREHOLDERS
162NOTICE OF THE ANNUAL GENERAL MEETING
167 FORM OF PROXY
02 ABOUT THIS REPORT
04 PERFORMANCE AT A GLANCE
06 STRATEGY AND STRUCTURE

Group Five is a leading African construction, concessions and manufacturing group with the capability to deliver across the full infrastructure lifecycle. Our offering includes
project development, investment, design,
construction, operations and maintenance, as
well as manufacturing and supply of materials.
We operate in the infrastructure, energy,
resources and real estate sectors. Our
operations are largely focused on South Africa
and the rest of Africa, with operating experience
in 26 countries. We also have established road
concessions in Eastern Europe.
This integrated annual report outlines the group’s strategy,
structure, year under review and future focus.
GR
OU
P F
IVE
IN
TE
GR
AT
ED
CE
NT
RA
L O
FF
ICE
So
uth
Afr
ica
01
AB
OU
T T
HIS
R
EP
OR
T
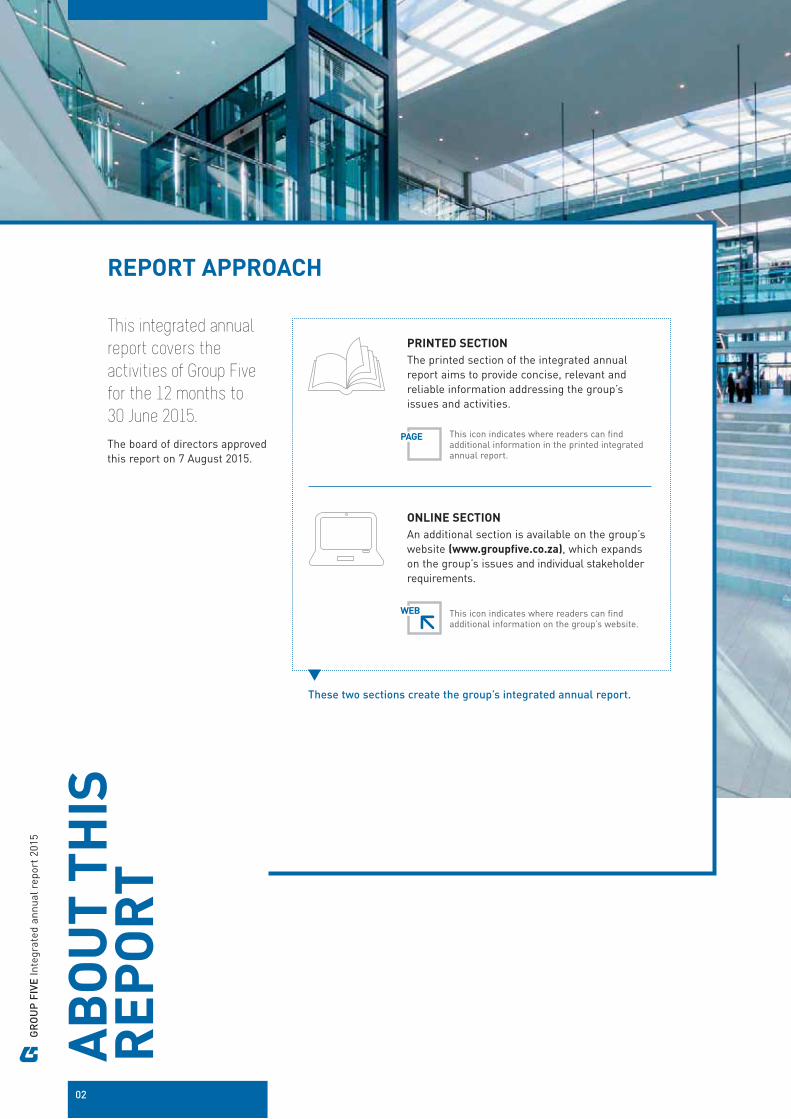
REPORT APPROACH
This integrated annual
report covers the
activities of Group Five
for the 12 months to
30 June 2015.
The board of directors approved this report on 7 August 2015.
This icon indicates where readers can find additional information on the group’s website.
WEB
This icon indicates where readers can find additional information in the printed integrated annual report.
PAGE
These two sections create the group’s integrated annual report.
ONLINE SECTION
An additional section is available on the group’s website (www.groupfive.co.za), which expands on the group’s issues and individual stakeholder requirements.
PRINTED SECTION
The printed section of the integrated annual report aims to provide concise, relevant and reliable information addressing the group’s issues and activities.
GR
OU
P F
IVE
Inte
grat
ed a
nnua
l rep
ort
2015
02
03
SCOPE AND BOUNDARYThe group operates in
South Africa, the rest of
Africa and Eastern Europe.
This integrated annual report was compiled whilst considering the recommendations of the new Global Reporting Initiative (GRI G4), the King III Report on Corporate Governance (King III) for South African reports and the International Integrated Reporting Council. We have documented our assessment of the 75 King III principles in a register. Although we are not in a position to fully report against G4, we outline a response table to certain of the new relevant GRI indicators. These can be found in the online section of the integrated annual report.
The printed section of the integrated annual report includes audited summarised consolidated annual financial statements on pages 148 to 158, which were extracted from the audited consolidated annual financial statements. The complete set of these statements is available in the online section of the integrated annual report. The annual financial statements comply with International Financial Reporting Standards (IFRS), JSE Listings Requirements and the South African Companies Act.
MATERIAL ISSUES AND STAKEHOLDER ENGAGEMENT The group engages with
a range of stakeholders
throughout the year.
The issues communicated to management by our stakeholders were considered during the compilation of this integrated annual report. For information on stakeholder engagement, refer to page 28.
The board considers what constitutes material issues to the group. This year, we continued to interrogate the material issues through various forums, such as our main board and sub-committee board meetings.
APPROVALS
The audit committee
is responsible for overseeing
the content of the integrated
annual report and
recommended the integrated
annual report to the board
for its approval.
Our independent auditors, PricewaterhouseCoopers Inc., issued an unmodified audit opinion on the consolidated annual financial statements and on the summarised consolidated annual financial statements. The unmodified audit opinion on the group’s consolidated annual financial statements is incorporated in the consolidated annual financial statements. The unmodified audit opinion on the summarised consolidated annual financial statements can be found on page 141 of this integrated annual report. References to future financial performance in the integrated annual report have not been reviewed or reported on by our auditors.
We are pleased to have again published our integrated annual report on the same day as our results release date, which is within 50 days of the group’s year end.
WE WELCOME FEEDBACK ON OUR INTEGRATED
ANNUAL REPORT
Please contact us [email protected] or +27 10 060 1555
PAGE PAGEPAGE WEB
03

18 4
24
1613
17
14
27
25
198
15
2
6
3
12
22
5
26
23 11
9
21
10
71
20
“The group’s weak Contracting performance resulted in management and stakeholders questioning the robustness of the group’s risk management systems.
We paid specific attention during the year under review to each of the group’s loss-making contracts and evaluated these against the group’s risk systems. Where necessary, the risk systems have been updated and enhanced.
In most cases the risk procedures themselves were sound, although on-site application of the procedures was inadequate, which led to an unacceptable level of contract losses.”
“These lessons learnt have received significant attention. Procedures
have been updated, training provided and monitoring controls
implemented to reduce the risk of these errors repeating.” 54PAGE
CRISTINA FREITAS TEIXEIRA
CHIEF FINANCIAL OFFICER
GEOGRAPHIC EXPERIENCE
26COUNTRIES
EXPERIENCE IN REGION
OPERATING IN REGION
PE
RF
OR
MA
NC
E
AT
A G
LA
NC
E
“Against a very disappointing performance, we examined what needs to be fixed in our business and established clear plans to tackle the difficult issues head on, agree a common way forward and deliver on action plans. Measures taken have included increasing our team’s responsibility, accountability and consequences for poor delivery.”
“Whilst a weak South African market exacerbated our poor
performance, we acknowledge that a large part of our under-delivery
was due to internal execution issues in our Civil Engineering
segment. We acted promptly by restructuring and rightsizing
this segment. The business is now more competitively placed to
secure a fair share of available work, as well as being sized
appropriately to the anticipated future market demand.” 32PAGE
ERIC VEMER
CHIEF EXECUTIVE OFFICER
1 Abu Dhabi – UAE
2 Algeria3 Angola4 Botswana5 Burkina Faso6 DRC7 Dubai – UAE8 Ghana9 Hungary
10 Jordan11 Lesotho12 Liberia13 Madagascar14 Malawi15 Mali16 Mauritius17 Mozambique18 Namibia19 Nigeria
20 Oman21 Poland22 Sierra Leone23 South Africa24 Swaziland25 Tanzania26 Zambia27 Zimbabwe
GR
OU
P F
IVE
Inte
grat
ed a
nnua
l rep
ort
2015
04

PERFORMANCE SUMMARY
Revenue from over-border operations
27%
Percentage of Contracting revenue from multi-disciplinary and EPC^ contracts
42%
Percentage of annuity^^ profit to core operating profit
87%
EMPLOYEES
12 178 at 30 June 2015
0.17 to 0.15
GROUP LTIFR~ IMPROVED FROM
~ Lost-time injury frequency rate.
FATALITIES
zero
STRATEGY MEASURES
OPERATIONS AND MAINTENANCE ORDER BOOKup 2% to
R4,7 billion June 14 = R4,6 billion
CONTRACTING ORDER BOOK up 13% to
R14,1 billion June 14 = R12,5 billion
RESULTS SUMMARY
6
34
9151
17
18
REVENUER13,9billion
Mining Industrial Power Oil and gas Water Real estate Transport
ESTABLISHED PRESENCE
IN SEVEN SECTORS
# Broad-based black economic empowerment.
Level 2
BBBEE# SCORECARD RATING
^ Engineer, procure and construct.^^ Non-Contracting businesses.
* Restated for the application of IFRS 5 – Non-current assets held for sale and discontinued operations, as a result of the decision to transfer the remaining business within the discontinued cluster of Construction Materials into continuing operations within the Manufacturing cluster.
REVENUE
down 10% to
R13,9 billionJune 14 = R15,4 billion*
RETURN ON EQUITYdown to
8.1%June 14 = 16.8%
OPERATING PROFITdown 43% to
R366 millionJune 14 = R643 million*
EARNINGS PER SHAREdown 45% to
222 cents per shareJune 14 = 401 cents
TOTAL DIVIDENDS PER SHAREdown 45% to
55 cents per shareJune 14 = 100 cents
CASH AND CASH EQUIVALENTSup 16% to
R3,4 billionJune 14 = R2,9 billion
CORE OPERATING PROFIT CONTRIBUTION
(R’000) 2015 2014*
Engineering & Construction 43 836 370 860
Building & Housing 91 383 90 817 Civil Engineering (96 263) 66 567 Projects 20 411 119 661 Energy 28 305 93 815
Investments & Concessions 236 638 197 021 Manufacturing 67 894 82 289
348 368 650 170
PAGERefer to the CEO’s review on page 32 and the CFO’s review on page 54.
05

ST
RA
TE
GY
AN
D
ST
RU
CT
UR
E
OUR STRATEGY AT WORK
A key element of the
evolution of the strategy
to a broader infrastructure
group is securing a growing
percentage of annuity
income through the group’s
concessions and
manufacturing activities to
balance the cyclicality of
construction revenues and
earnings. Annuity income
has grown from 47% to 87%
of group operating profit
since 2006.
As outlined in the case studies on the right, over the last decade the group has evolved from a contractor and manufacturer to an integrated multi-disciplinary project development, construction and infrastructure services group.
PRIVATE PUBLIC PARTNERSHIP
This private public partnership was awarded to Group Five in 2013 for the construction and design of an 822 kilometre road upgrade in Zimbabwe.
Group Five Civil Engineering secured the construction and Intertoll the operations and maintenance contract.
During the year, we completed the road rehabilitation and toll plaza construction. The operations and maintenance contract is also well underway. This flagship contract entails the design, build, operate and transfer, with Intertoll managing toll operations, system integration and routine road maintenance for more than ten years. Group Five implemented its own innovative systems and tolling solutions.
ZIMBABWE
The group’s business model is to selectively develop, invest in, design,
construct and operate various infrastructure assets throughout their lifecycle.
This enables the extraction of multiple revenues from target contracts and the
generation of an improved blended group operating margin. We also
manufacture and supply materials and operate in the infrastructure, energy,
resources and real estate growth sectors. Our operations are focused in South
Africa and the rest of Africa, as well as in Eastern Europe for concessions.
OUR BUSINESS MODEL
GR
OU
P F
IVE
Inte
grat
ed a
nnua
l rep
ort
2015
06
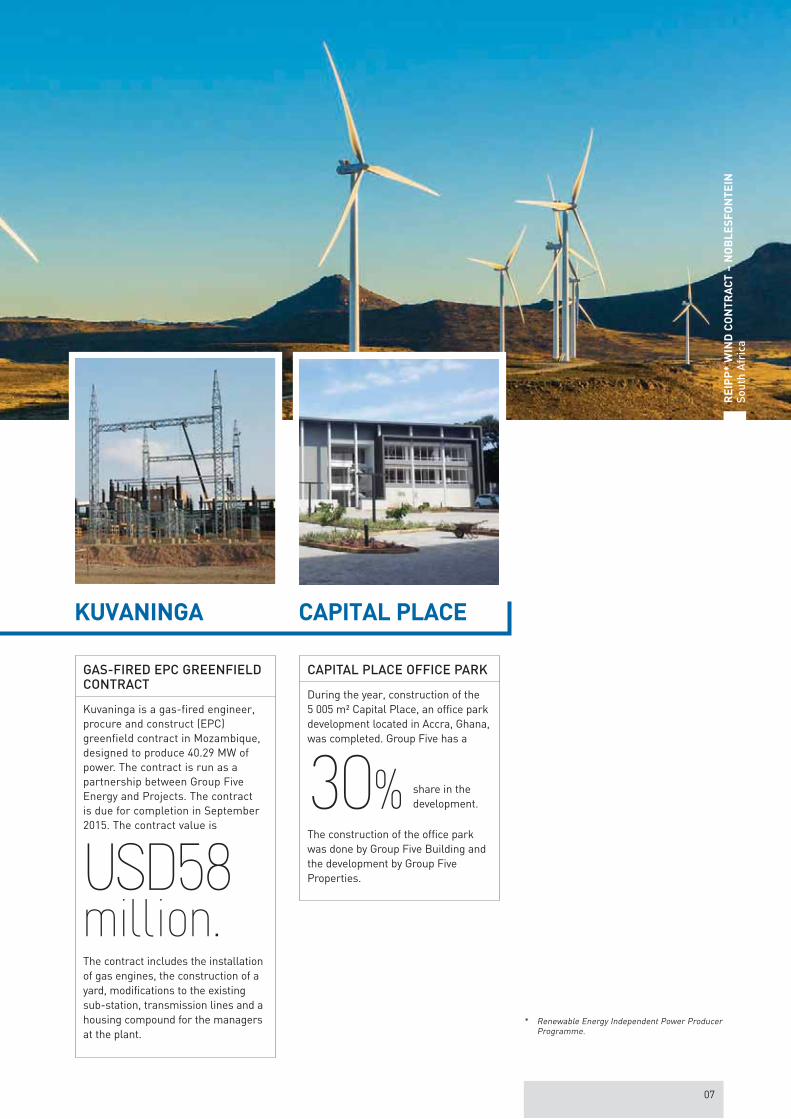
* Renewable Energy Independent Power Producer Programme.
CAPITAL PLACE OFFICE PARK
During the year, construction of the 5 005 m² Capital Place, an office park development located in Accra, Ghana, was completed. Group Five has a
30% share in the development.
The construction of the office park was done by Group Five Building and the development by Group Five Properties.
GAS-FIRED EPC GREENFIELD CONTRACT
Kuvaninga is a gas-fired engineer, procure and construct (EPC) greenfield contract in Mozambique, designed to produce 40.29 MW of power. The contract is run as a partnership between Group Five Energy and Projects. The contract is due for completion in September 2015. The contract value is
USD58million.The contract includes the installation of gas engines, the construction of a yard, modifications to the existing sub-station, transmission lines and a housing compound for the managers at the plant.
CAPITAL PLACEKUVANINGA
RE
IPP
* W
IND
CO
NT
RA
CT
– N
OB
LE
SF
ON
TE
IN
So
uth
Afr
ica
07

STRATEGY AND STRUCTURE / STRATEGY AT A GLANCE
continued
PROGRESSION OF OUR STRATEGY
PROGRESS
FOCUS
02Dedicated resources were appointed for the group Developments team and at segment level to specifically target and grow our expansion plan in the rest of Africa.
Additional development resources in Intertoll Europe were appointed to increase our portfolio of target projects in Eastern Europe.
Small regional offices were established in Ghana and Mozambique, along with an early-stage development office in Russia. The USA is being evaluated. These offices are being established with low holding costs to fast-track access in these markets.
Our Contracting order book is
39% over-border.
84% of the group’s Operations & Maintenance order book is over-border.
59% of our pipeline represents possible contract opportunities in the rest of Africa.
of total revenue was generated in the rest of Africa and
23%
in Eastern Europe. 4%
We created a focused Developments team led by a group executive committee (exco) member to drive targeted sector business growth.
We designed and implemented an integrated stakeholder engagement strategy to create clear lines of accountability for core target client management, aligned to our sector focus.
Group executive and senior management market engagements in selected sectors were increased through a co-ordinated programme of client, partner, financier and technology supplier roadshows to position Group Five as a key project enabler.
Tender approval and risk review processes were streamlined to ensure tactical alignment of target tenders to our sector strategy, with full support, ownership and accountability of segment management.
PROGRESS
FOCUS
SECTOR-LED GROWTH
016
36
109
19
20
TRADEDCONTRACTING
REVENUE
11
34
76
40
2
CONTRACTINGORDERBOOK
94
16
43
2
13
13
CONTRACTINGPIPELINE
Mining Industrial Power Oil and gas Water Real estate Transport
Although significant time was spent on addressing key problem areas identified within the group, under the guidance of the new CEO we did not lose sight of specific actions required to drive the agreed strategy. During the year, the strategy was reviewed and reaffirmed by the CEO, executive team and the board, with specific focus on the entrenchment and delivery of the strategy.
STRATEGY AT A GLANCE
GEOGRAPHIC FOCUS AND PENETRATION
GR
OU
P F
IVE
Inte
grat
ed a
nnua
l rep
ort
2015
08

FOCUS
04In Investments & Concessions, the team is focusing on further expanding its reach in Eastern Europe. We also established an early-stage development office in Russia and are evaluating the USA to target concessions and operations and maintenance transport contracts. The possible entry into the USA is on the back of relationships with our international partners who have successfully secured concessions projects in this region.
In Manufacturing, our annuity growth occurred on the back of our strategy of creating alternative revenues by continuing to add new earnings-enhancing and sustainable traded goods to our traditional fibre cement building materials range. Our focus on exports has yielded new territories and the potential to grow our effective target market.
PROGRESS
CREATING ANNUITY STREAMS
Investments & Concessions
contributed
to total group revenueto core group operating profit
7%68%Manufacturing contributed
to total group revenue
to core group operating profit
8%19%
Secured Operations & Maintenance order book of
R4,7 billion is focused on the transport, oil and gas, industrial and power sectors.
FOCUS
MULTI-DISCIPLINARY CAPACITY
03
The Construction and Engineering functions and segments were consolidated into a single cluster, Engineering & Construction. One leadership team was put in place, with a focus on improved inter-segment engagement and delivery and standardisation of processes.
The team’s incentivisation on multi-disciplinary contracts was changed to ensure a one-team approach, with remuneration linked to the outcome of the contract, not individual segment performance criteria.
PROGRESS
MULTI-DISCIPLINARY CONTRACTS %
Traded Contractingrevenue
Contracting order book
Contracting pipeline
30%
11%
11%
ENGINEER, PROCURE AND CONSTRUCT (EPC) CONTRACTS %
Contractingorder book
Contracting pipeline
Traded Contractingrevenue12%
33%
12%
09

OUR STRUCTURE
During the year, to ensure improved accountability, responsibility and focused delivery, a simplified
group structure was introduced. The group was restructured from four to three clusters, with the
consolidation of all the construction and engineering functions and segments into one cluster,
Engineering & Construction, under a single leadership team.
STRATEGY AND STRUCTURE / OUR STRUCTURE
continued
DEVELOPMENTS
ENGINEERING &
CONSTRUCTIONMANUFACTURING
INVESTMENTS &
CONCESSIONS
85%
7%
8%
REVENUE % OF GROUP
02
01 03
CORE OPERATING
PROFIT % OF GROUP
68%
19%13%
CORPORATE SUPPORT
Developments supports the group in identifying and developing significant contract opportunities in line with the group’s strategy in target sectors.
It takes the lead in co-ordinating the group’s business development activities for agreed target contracts to ensure alignment of effort. It also develops key relationships in target African geographies, leads project finance partner relationships and provides the appropriate expertise for the development of public private partnerships and concessions.
GR
OU
P F
IVE
Inte
grat
ed a
nnua
l rep
ort
2015
10

STEEL
COMPETENCIES Large bore spiral welded steel pipes for mainly water transport systems and steel reinforcing and mesh for use in concrete structures.
FIBRE CEMENT
COMPETENCIES Exterior and interior walling, ceiling boards, roofing systems and pipes and fibre cement-clad, steel-framed modular housing systems.
PROJECTS
COMPETENCIES Multi-disciplinary plant construction covering structural, mechanical, electrical, instrumentation and piping.
BUILDING & HOUSING
COMPETENCIES Design to build and construction of large buildings, low-cost and affordable mass housing and residential and mine housing solutions.
CIVIL ENGINEERING
COMPETENCIES Construction of large structures in public and private infrastructure, including heavy civil, mining and industrial structures, roads, ports, airports and pipelines.
01
ENERGY
POWER
COMPETENCIES Multi-disciplinary EPC^ contract delivery from feasibility through to supporting bankability and implementation, including plant operations and maintenance.
NUCLEAR
COMPETENCIES Nuclear readiness certification implementation and local nuclear plant services and refurbishment.
OIL & GAS
COMPETENCIES Core maintenance, shutdowns and turnarounds, above-ground storage tank design and construction, repairs and maintenance, as well as new-build oil and gas contracts.
ENGINEERING SERVICES
COMPETENCIES Technical support, design, engineering and construction methodologies and innovative solutions for the Engineering & Construction cluster and in support of developing multi-disciplinary and EPC^ solutions.
^ Engineer, procure and construct.
TRANSPORT
COMPETENCIES Investment in and implementation of concessions and private public partnerships, including operations and maintenance. Toll road development and operation under the Intertoll brand.
PROPERTY
COMPETENCIES Development, ownership and management of selected A-grade property assets generating development and investment returns.
02
03
11
OUR TEAM
The board has a diverse set of skills to support the team in the execution of its strategy.
Following significant changes made to the board last year, this year the focus was on ensuring the
members were fully engaged through their respective board roles in Group Five to allow them to
contribute their full value.
STRATEGY AND STRUCTURE / OUR TEAM
continued
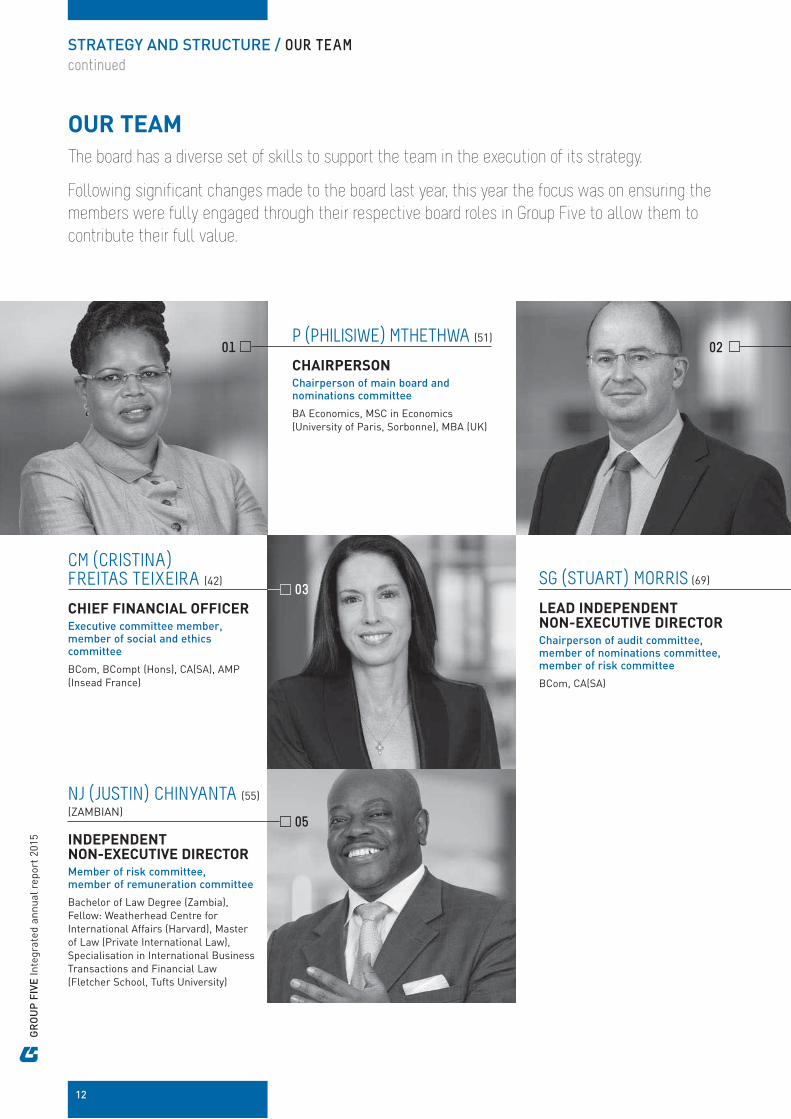
0201P (PHILISIWE) MTHETHWA (51)
CHAIRPERSON
Chairperson of main board and nominations committee
BA Economics, MSC in Economics (University of Paris, Sorbonne), MBA (UK)
CM (CRISTINA) FREITAS TEIXEIRA (42)
CHIEF FINANCIAL OFFICER
Executive committee member, member of social and ethics committee
BCom, BCompt (Hons), CA(SA), AMP (Insead France)
03
NJ (JUSTIN) CHINYANTA (55) (ZAMBIAN)
INDEPENDENT NON-EXECUTIVE DIRECTOR
Member of risk committee, member of remuneration committee
Bachelor of Law Degree (Zambia), Fellow: Weatherhead Centre for International Affairs (Harvard), Master of Law (Private International Law), Specialisation in International Business Transactions and Financial Law (Fletcher School, Tufts University)
05
SG (STUART) MORRIS (69)
LEAD INDEPENDENT NON-EXECUTIVE DIRECTOR
Chairperson of audit committee, member of nominations committee, member of risk committee
BCom, CA(SA)
GR
OU
P F
IVE
Inte
grat
ed a
nnua
l rep
ort
2015
12
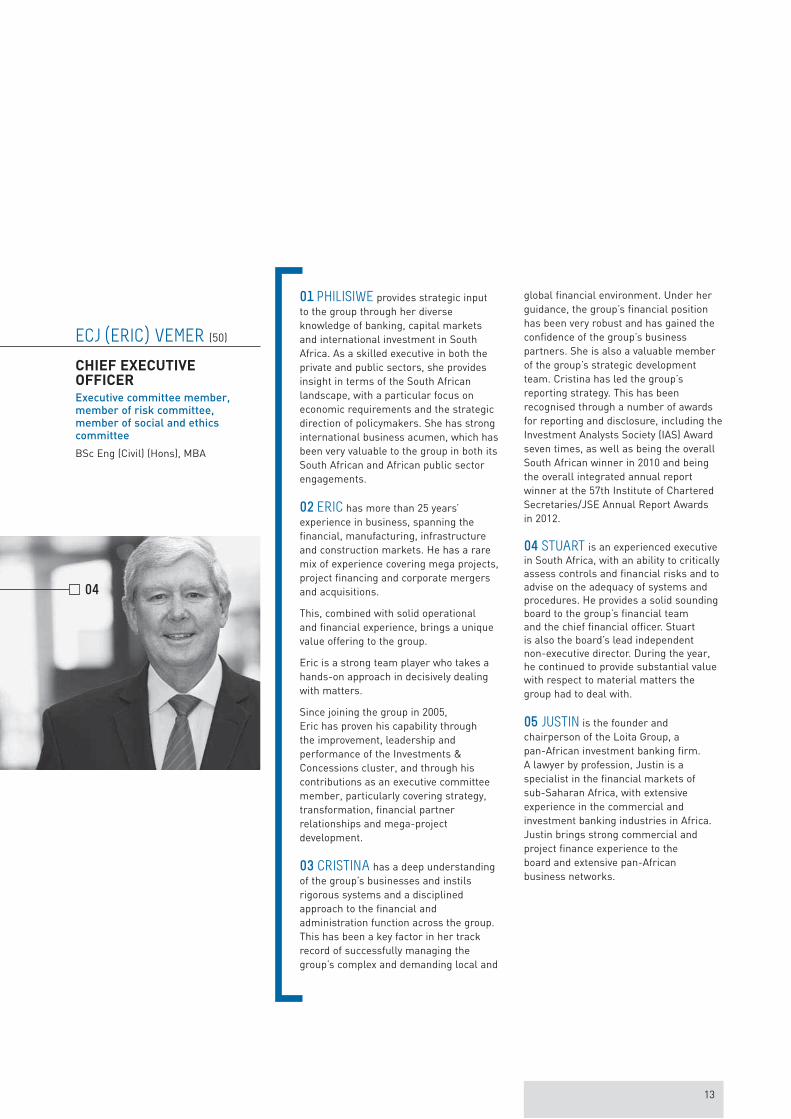
01 PHILISIWE provides strategic input to the group through her diverse knowledge of banking, capital markets and international investment in South Africa. As a skilled executive in both the private and public sectors, she provides insight in terms of the South African landscape, with a particular focus on economic requirements and the strategic direction of policymakers. She has strong international business acumen, which has been very valuable to the group in both its South African and African public sector engagements.
02 ERIC has more than 25 years’ experience in business, spanning the financial, manufacturing, infrastructure and construction markets. He has a rare mix of experience covering mega projects, project financing and corporate mergers and acquisitions.
This, combined with solid operational and financial experience, brings a unique value offering to the group.
Eric is a strong team player who takes a hands-on approach in decisively dealing with matters.
Since joining the group in 2005, Eric has proven his capability through the improvement, leadership and performance of the Investments & Concessions cluster, and through his contributions as an executive committee member, particularly covering strategy, transformation, financial partner relationships and mega-project development.
03 CRISTINA has a deep understanding of the group’s businesses and instils rigorous systems and a disciplined approach to the financial and administration function across the group. This has been a key factor in her track record of successfully managing the group’s complex and demanding local and
global financial environment. Under her guidance, the group’s financial position has been very robust and has gained the confidence of the group’s business partners. She is also a valuable member of the group’s strategic development team. Cristina has led the group’s reporting strategy. This has been recognised through a number of awards for reporting and disclosure, including the Investment Analysts Society (IAS) Award seven times, as well as being the overall South African winner in 2010 and being the overall integrated annual report winner at the 57th Institute of Chartered Secretaries/JSE Annual Report Awards in 2012.
04 STUART is an experienced executive in South Africa, with an ability to critically assess controls and financial risks and to advise on the adequacy of systems and procedures. He provides a solid sounding board to the group’s financial team and the chief financial officer. Stuart is also the board’s lead independent non-executive director. During the year, he continued to provide substantial value with respect to material matters the group had to deal with.
05 JUSTIN is the founder and chairperson of the Loita Group, a pan-African investment banking firm. A lawyer by profession, Justin is a specialist in the financial markets of sub-Saharan Africa, with extensive experience in the commercial and investment banking industries in Africa. Justin brings strong commercial and project finance experience to the board and extensive pan-African business networks.
ECJ (ERIC) VEMER (50)
CHIEF EXECUTIVE OFFICER
Executive committee member, member of risk committee, member of social and ethics committee
BSc Eng (Civil) (Hons), MBA
04
13
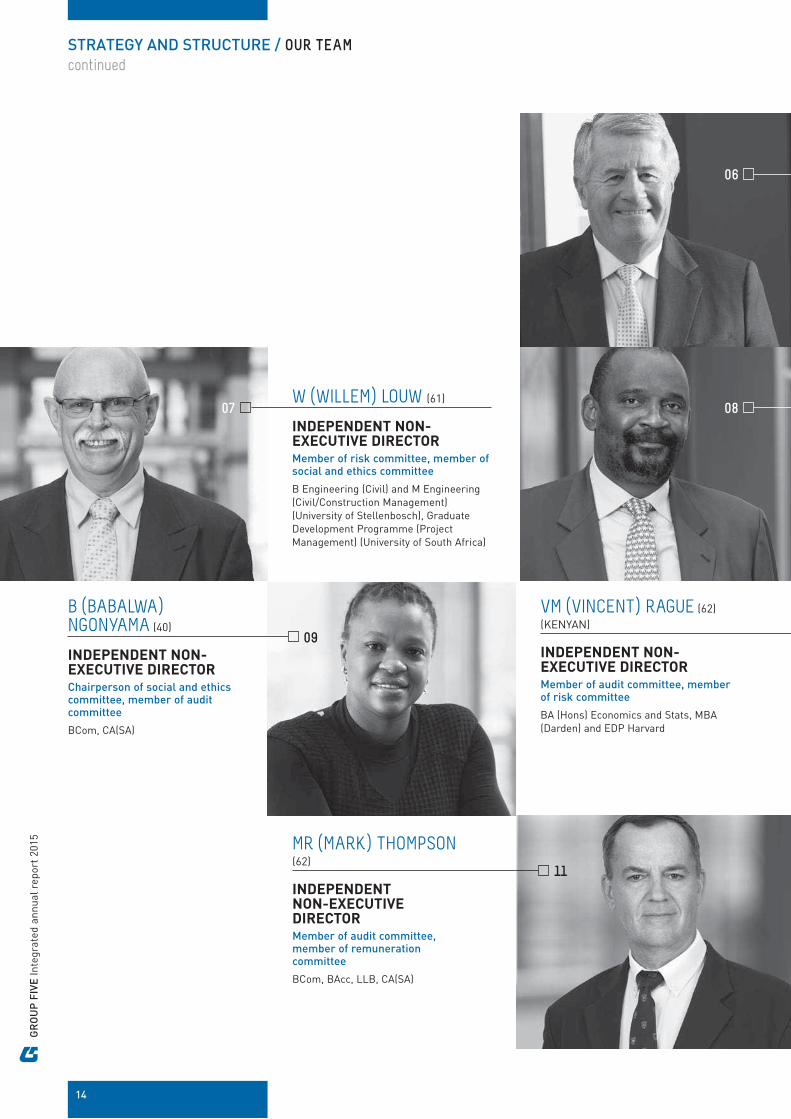
MR (MARK) THOMPSON (62)
INDEPENDENT NON-EXECUTIVE DIRECTOR
Member of audit committee, member of remuneration committee
BCom, BAcc, LLB, CA(SA)
VM (VINCENT) RAGUE (62) (KENYAN)
INDEPENDENT NON-EXECUTIVE DIRECTOR
Member of audit committee, member of risk committee
BA (Hons) Economics and Stats, MBA (Darden) and EDP Harvard
11
09
B (BABALWA) NGONYAMA (40)
INDEPENDENT NON-EXECUTIVE DIRECTOR
Chairperson of social and ethics committee, member of audit committee
BCom, CA(SA)
STRATEGY AND STRUCTURE / OUR TEAM
continued
08
06
07W (WILLEM) LOUW (61)
INDEPENDENT NON-EXECUTIVE DIRECTOR
Member of risk committee, member of social and ethics committee
B Engineering (Civil) and M Engineering (Civil/Construction Management) (University of Stellenbosch), Graduate Development Programme (Project Management) (University of South Africa)
GR
OU
P F
IVE
Inte
grat
ed a
nnua
l rep
ort
2015
14

10
06 JOHN brings significant operational, executive and strategic leadership to the group. He assists the group and management with evaluating new opportunities and is able to question decisions on a very practical level.
He has a particularly strong ability to identify potential problem areas and provide advice on resolutions.
07 WILLEM is a civil engineer with extensive technology and technical management skills, including capital project skills and new business development and acquisition integration management experience in the energy and chemical industry, both in South Africa and over-border. Willem brings relevant industrial and engineering and project management experience to the board.
08 KALAA brings significant experience in mining, construction, operations and relationships in Africa. He has a clear understanding of the over-border political and operating environment, with keen insight into effective risk management. His experience as an executive and shareholder of his own businesses also offers a constructive perspective to assist the board and management team. He is a strong supporter of the group’s African expansion strategy.
09 BABALWA is a chartered accountant with significant experience in the auditing, finance and mining industries. She has several business interests and actively participates in numerous national forums on economic growth and development. Babalwa brings additional auditing and financial experience to the board.
10 VINCENT is the co-founder and director of Catalyst Principal Partners, a private equity group based in Nairobi, Kenya. His experience in advisory services, investments, project and corporate finance, as well as banking, spans Latin America, Europe, Africa and Asia. Vincent brings investment, project and corporate finance experience to the board.
11 MARK is a qualified lawyer and chartered accountant, with extensive international finance and general business experience amassed during his tenure as chief financial officer with Sappi Limited, prior career appointments and from his current other non-executive positions. Mark brings accounting and corporate financial management experience to the board.
KK (KALAA) MPINGA (54) (CONGOLESE)
INDEPENDENT NON-EXECUTIVE DIRECTOR
Chairperson of risk committee, member of audit committee, member of nominations committee
BSc Agricultural Economics, MSc International Agricultural Development
DR JL (JOHN) JOB (70)
INDEPENDENT NON-EXECUTIVE DIRECTOR
Chairperson of remuneration committee, member of audit committee, member of risk committee
BSc (Hons), PhD in Physical Chemistry
N (NONQABA) KATAMZI (46)
COMPANY SECRETARYBA Law, LLB, CIBM
NONQABA has solid experience in the company secretarial field, with particular knowledge of governance issues and JSE compliance. This allows her to effectively advise the board on all legislative requirements.
15

The executive team (exco) works with the board on the execution of our strategy. To further
strengthen the team, in addition to the new CEO appointed in December, two new exco
appointments, Jon Hillary and Themba Mosai, were made from within the group. Willie Zeelie,
previously exco member responsible for the Energy segment, was appointed exco member
of the combined Engineering & Construction cluster. These members bring extensive
experience to their portfolios.
01 02 03 04
STRATEGY AND STRUCTURE / OUR TEAM
continued
01 ECJ (ERIC) VEMER (50)
CHIEF EXECUTIVE OFFICER
The CEO is a main board member. His CV is contained on
02 CM (CRISTINA) FREITAS TEIXEIRA (42)
CHIEF FINANCIAL OFFICER
The CFO is a main board member.Her CV is contained on
03 WI (WILLIE) ZEELIE (53)
EXECUTIVE – ENGINEERING & CONSTRUCTION
Member of risk committee
Higher National Diploma Electrical Engineering, Pr Tech Eng, MSAIEE
During the year, Willie became head of the newly restructured Engineering & Construction cluster, which houses all the group’s Engineering and Contracting businesses. This restructuring will harness Willie’s strength of increasingly driving single company delivery into the rest of Africa.
Willie brings 30 years of experience in multi-disciplinary engineering and infrastructure contracts, with a robust marketing and business development ability. He has an established track record in the power and energy sectors and has successfully led the team that developed the group’s engineer, procure and construct (EPC) capability through which numerous infrastructure and power plant contracts in South Africa and the rest of Africa have been delivered. Willie has also been instrumental in developing the group’s technical abilities in oil and gas and the renewable energy markets and the early identification of contracts from development to closure.
04 JW (JON) HILLARY (42)
EXECUTIVE – INVESTMENTS & CONCESSIONS
BCompt (Hons), CA(SA)
Jon was appointed to exco during the financial year.
Prior to this, Jon ran the successful business of Intertoll, comprising Eastern Europe and Africa, for a number of years.
Jon joined the group in 2004 as financial director of the Investments & Concessions cluster, before being appointed as the managing director of the group’s property business in 2009.
Jon possesses a broad range of internationally-based finance and commercial experience. His focus on execution and delivery bodes well for the cluster going forward. Jon has a clear mandate to deliver on growth over the short to medium term.
13PAGE
13PAGE
GR
OU
P F
IVE
Inte
grat
ed a
nnua
l rep
ort
2015
16

05 06 07 08
05 JA (JOHN) WALLACE (57)
EXECUTIVE – MANUFACTURING
BCom, Hons Programme in Advanced Marketing and Executive Management Programme
John has been with Group Five Manufacturing for 13 years. During this time, Manufacturing has built an impressive track record despite extremely difficult economic conditions. John has an exceptionally strong strategic ability, which has been invaluable to the group in driving executive focus on shareholder value-creation opportunities. He has a particular ability to effect change and repair problem entities. For example, he successfully transformed Everite from an asbestos problem-beset company many years ago to a segment that continues to consistently produce strong earnings today. John has applied this expertise in the honing of the Manufacturing business portfolio and in the pursuit of opportunities to support the current business and to expand into new aligned areas in the future.
06 ST (THEMBA) MOSAI (39)
EXECUTIVE – DEVELOPMENTS
BSc Electrical Engineering, MBA (Cum Laude)
Themba was appointed to exco during the financial year to lead the Developments team.
Prior to joining exco, Themba was the managing director of Intertoll Africa, having successfully led the company for the previous seven years. During his time at Intertoll Africa, Themba was instrumental in driving growth into new markets in Africa, including Zimbabwe.
Themba is a strong relationship builder, and has a good ability to match client aspirations to the realities of developing, financing, constructing and operating infrastructure assets across Africa.
Themba is technical and practical, supported by his Electrical Engineering qualification, as well as tactical, business-minded and strategic, supported by his MBA degree. Since taking on his new role, he has already made great strides in further enhancing our position across target African geographies and our profile with both public sector and private sector clients, as well as securing new work and resolving legacy matters in key markets.
07 GD (GUY) MOTTRAM (49)
EXECUTIVE – RISK
Member of risk committee, member of social and ethics committee
BCom, LLB
Guy has solid experience in commercial matters. This, together with his formal legal training, ensures that opportunities and risks are approached with a business sense, whilst being rooted in an understanding of legal requirements. As a member of the Engineering and Construction Risk Institute, he is able to consider leading global trends for application in the group.
08 J (JESSE) DOORASAMY (44)
EXECUTIVE – HUMAN RESOURCES
Member of social and ethics committee
BSoc Sc, BCom (Hons), PG DIP IR
Jesse has almost ten years of in-depth experience in the group from both an operational and strategic perspective. He held the role of Human Resources Director: Construction before his appointment as HR executive as part of the executive committee. Prior to that, Jesse was the HR director for the Projects segment. Jesse’s experience in the group allows him to bring strong operational knowledge to the group level. As he worked in the group’s most internationally-focused Construction cluster, he has a particular ability to manage human capital issues in the rest of Africa, something that is crucial in the group’s continued expansion strategy.
17
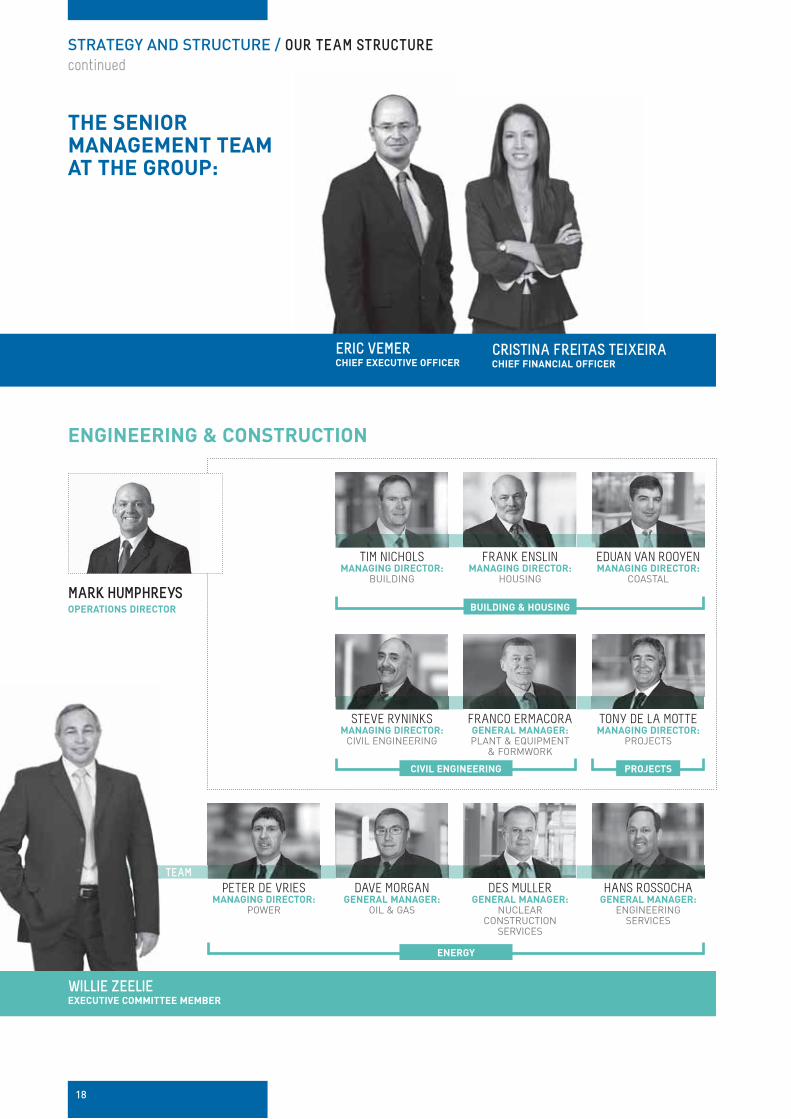
STRATEGY AND STRUCTURE / OUR TEAM STRUCTURE
continued
PETER DE VRIESMANAGING DIRECTOR:
POWER
DAVE MORGANGENERAL MANAGER:
OIL & GAS
DES MULLER GENERAL MANAGER:
NUCLEAR CONSTRUCTION
SERVICES
HANS ROSSOCHAGENERAL MANAGER:
ENGINEERING SERVICES
ENERGY
ERIC VEMERCHIEF EXECUTIVE OFFICER
CRISTINA FREITAS TEIXEIRACHIEF FINANCIAL OFFICER
THE SENIOR MANAGEMENT TEAM AT THE GROUP:
STEVE RYNINKS MANAGING DIRECTOR:
CIVIL ENGINEERING
FRANCO ERMACORAGENERAL MANAGER: PLANT & EQUIPMENT
& FORMWORK
TONY DE LA MOTTEMANAGING DIRECTOR:
PROJECTS
CIVIL ENGINEERING PROJECTS
TIM NICHOLSMANAGING DIRECTOR:
BUILDING
FRANK ENSLIN MANAGING DIRECTOR:
HOUSING
EDUAN VAN ROOYENMANAGING DIRECTOR:
COASTAL
BUILDING & HOUSING
ENGINEERING & CONSTRUCTION
TEAM
WILLIE ZEELIEEXECUTIVE COMMITTEE MEMBER
MARK HUMPHREYSOPERATIONS DIRECTOR
18
JURGEN STRAGIER MANAGING DIRECTOR:
EVERITE AND ABT
CEDOMIR DJORDJEVIC TECHNICAL DIRECTOR: MANUFACTURING AND MANAGING DIRECTOR:
STEEL
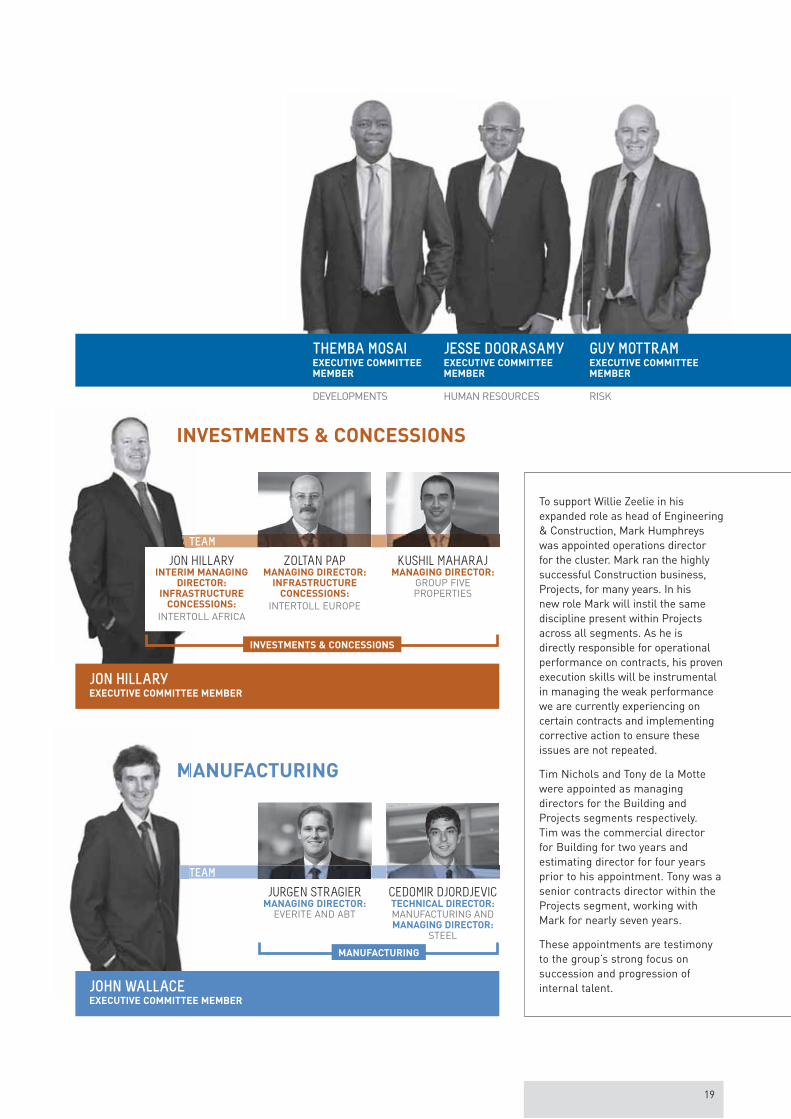
INVESTMENTS & CONCESSIONSIN
JON HILLARYINTERIM MANAGING
DIRECTOR: INFRASTRUCTURE
CONCESSIONS:
INTERTOLL AFRICA
ZOLTAN PAPMANAGING DIRECTOR:
INFRASTRUCTURE CONCESSIONS:
INTERTOLL EUROPE
KUSHIL MAHARAJMANAGING DIRECTOR:
GROUP FIVE PROPERTIES
TEAM
INVESTMENTS & CONCESSIONS
JON HILLARYEXECUTIVE COMMITTEE MEMBER
TEAM
MANUFACTURING
MANUFACTURINGM
JOHN WALLACEEXECUTIVE COMMITTEE MEMBER
To support Willie Zeelie in his expanded role as head of Engineering & Construction, Mark Humphreys was appointed operations director for the cluster. Mark ran the highly successful Construction business, Projects, for many years. In his new role Mark will instil the same discipline present within Projects across all segments. As he is directly responsible for operational performance on contracts, his proven execution skills will be instrumental in managing the weak performance we are currently experiencing on certain contracts and implementing corrective action to ensure these issues are not repeated.
Tim Nichols and Tony de la Motte were appointed as managing directors for the Building and Projects segments respectively. Tim was the commercial director for Building for two years and estimating director for four years prior to his appointment. Tony was a senior contracts director within the Projects segment, working with Mark for nearly seven years.
These appointments are testimony to the group’s strong focus on succession and progression of internal talent.
JESSE DOORASAMYEXECUTIVE COMMITTEE MEMBER
THEMBA MOSAIEXECUTIVE COMMITTEE MEMBER
HUMAN RESOURCES RISK DEVELOPMENTS
GUY MOTTRAMEXECUTIVE COMMITTEE MEMBER
19

20
01SECTION

21
YEAR UNDER REVIEW AND
FUTURE FOCUS
PAGE
32CHIEF EXECUTIVE OFFICER’S REVIEW
PAGE
54CHIEF FINANCIAL OFFICER’S REVIEW
PAGE
22CHAIRPERSON’S REVIEW

GR
OU
P F
IVE
Inte
grat
ed a
nnua
l rep
ort
2015
22
CH
AIR
PE
RS
ON
’SR
EV
IEW
Despite slow trading conditions
in our home market, the rest of
Africa offers an attractive
number of sectors within which
to grow our business.
Philiswe Mthethwa CHAIRPERSONtheethwa CHAIRPERSON
OUR OPERATING CONTEXTWhilst our domestic and continental markets are competitive, our unique African offering, which incorporates a complete solution to developing, financing, constructing and operating infrastructure assets, as well as our ability to operate in remote areas, presents us with a strong competitive advantage in securing order book in the rest of Africa.
We have a very clear geographic strategy of growing into high-growth countries in the rest of Africa in our seven target sectors. Refer to pages 44 to 49 for additional information.
However, our current board and management priority is to ensure that our South African industry issues are resolved, including closing out Competition Commission legacy matters, addressing distrust between the public and private sectors and assisting the roll out of public infrastructure. It is only with firm alignment and certainty of government support for our sector in South Africa, together with our associated endeavours in the rest of Africa, that we will be able to sustainably grow our competitive advantage.
Intertoll’s international markets in Eastern Europe are offering improving prospects as national and intra-regional programmes exist in those regions for renewing, upgrading and expanding key routes.

23
The South African market continued to experience difficult
market conditions, with the construction and civil engineering sector
particularly affected.
The domestic economy grew by an estimated 1.4% in 2014 from 1.8% in 2013, and is not expected to improve much from these levels of growth through calendar 2015.
KEY MARKET DYNAMICS
Continued lack of traction in large-scale public infrastructure, with fixed investment at historically low levels Ongoing consumption-driven economic activity, supporting retail and residential real estate and other
consumer-related sectors A relatively weak Rand More hawkish interest rate outlook (especially as US interest rates start to rise) A rising inflationary outlook, driven by increasing energy prices and import inflation Power interruptions due to Eskom power outages Further roll out of the renewable energy independent power producer procurement power programme, and investment
in base-load coal-fired power stations Continued labour unrest in many sectors Inflationary impact of wage settlements Low commodity prices South African sovereign credit rating downgraded to one notch above “junk bond” status
73%OF GROUP REVENUE
PAGE Refer to pages 54 to 75 for additional information on how the group navigated market conditions.
CE
NT
RA
L B
AS
IN –
AC
ID M
INE
TR
EA
TM
EN
T P
LA
NT
So
uth
Afr
ica
SOUTH AFRICA
GR
OU
P F
IVE
Inte
grat
ed a
nnua
l rep
ort
2015
24
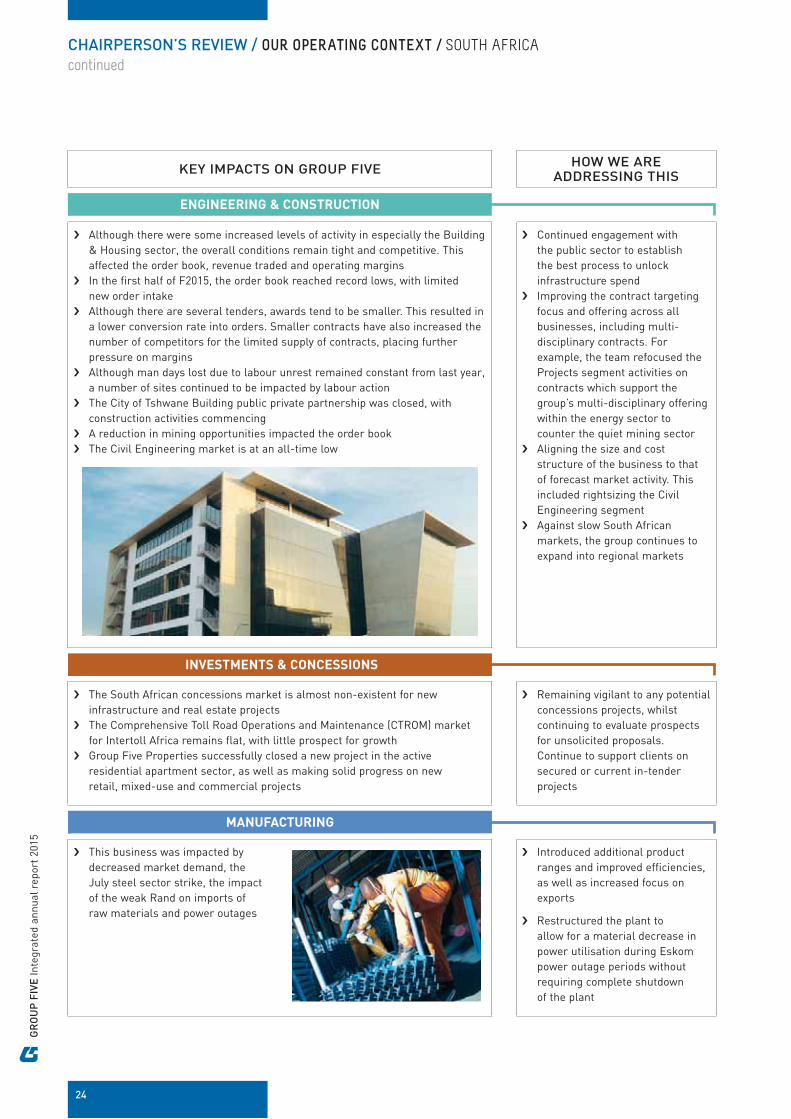
CHAIRPERSON’S REVIEW / OUR OPERATING CONTEXT / SOUTH AFRICA
continued
KEY IMPACTS ON GROUP FIVE HOW WE ARE
ADDRESSING THIS
Although there were some increased levels of activity in especially the Building & Housing sector, the overall conditions remain tight and competitive. This affected the order book, revenue traded and operating margins
In the first half of F2015, the order book reached record lows, with limited new order intake
Although there are several tenders, awards tend to be smaller. This resulted in a lower conversion rate into orders. Smaller contracts have also increased the number of competitors for the limited supply of contracts, placing further pressure on margins
Although man days lost due to labour unrest remained constant from last year, a number of sites continued to be impacted by labour action
The City of Tshwane Building public private partnership was closed, with construction activities commencing
A reduction in mining opportunities impacted the order book The Civil Engineering market is at an all-time low
Continued engagement with the public sector to establish the best process to unlock infrastructure spend
Improving the contract targeting focus and offering across all businesses, including multi-disciplinary contracts. For example, the team refocused the Projects segment activities on contracts which support the group’s multi-disciplinary offering within the energy sector to counter the quiet mining sector
Aligning the size and cost structure of the business to that of forecast market activity. This included rightsizing the Civil Engineering segment
Against slow South African markets, the group continues to expand into regional markets
INVESTMENTS & CONCESSIONS
The South African concessions market is almost non-existent for new infrastructure and real estate projects
The Comprehensive Toll Road Operations and Maintenance (CTROM) market for Intertoll Africa remains flat, with little prospect for growth
Group Five Properties successfully closed a new project in the active residential apartment sector, as well as making solid progress on new retail, mixed-use and commercial projects
Remaining vigilant to any potential concessions projects, whilst continuing to evaluate prospects for unsolicited proposals. Continue to support clients on secured or current in-tender projects
MANUFACTURING
This business was impacted by decreased market demand, the July steel sector strike, the impact of the weak Rand on imports of raw materials and power outages
Introduced additional product ranges and improved efficiencies, as well as increased focus on exports
Restructured the plant to allow for a material decrease in power utilisation during Eskom power outage periods without requiring complete shutdown of the plant
ENGINEERING & CONSTRUCTION

25
PAGE Refer to pages 54 to 75 for additional information on how the group navigated market conditions.
According to the 2014 IMF World Economic Outlook, six of the ten
fastest-growing economies globally are African. It is forecast that seven
of the ten highest growth economies in the coming five years will be in
the rest of Africa.
As outlined in a recent Deloitte Africa report, to achieve this growth, and to continue building on this momentum, accelerated infrastructure growth is imperative, specifically infrastructure development that facilitates manufacturing and intra-African trade.
REST OF AFRICA
KEY MARKET DYNAMICS
Growth in the rest of Africa will be driven by increased output in the natural resources sector, underpinning rising fiscal expenditure, especially in infrastructure projects, and an expected increase in Africa’s trade and investment
Rising income and urbanisation are supporting growth in domestic demand and consumption Growth in sub-Saharan Africa remains strong, but is expected to slow this year to 4.5% (from 5% in 2014) due to
declining commodity prices and to some extent from the impact of Ebola The oil price decline impacted the region’s oil exporters Many infrastructure contracts are available, although matching to funding and long lead times to develop contracts
remain issues Governance concerns remain in many countries Due to a lack of work in South Africa, the rest of Africa has become more competitive The entry of foreign companies into African markets continues to increase
23%OF GROUP REVENUE
CH
IRO
DZ
I C
OA
L M
INE
Mo
zam
biq
ue
GR
OU
P F
IVE
Inte
grat
ed a
nnua
l rep
ort
2015
26
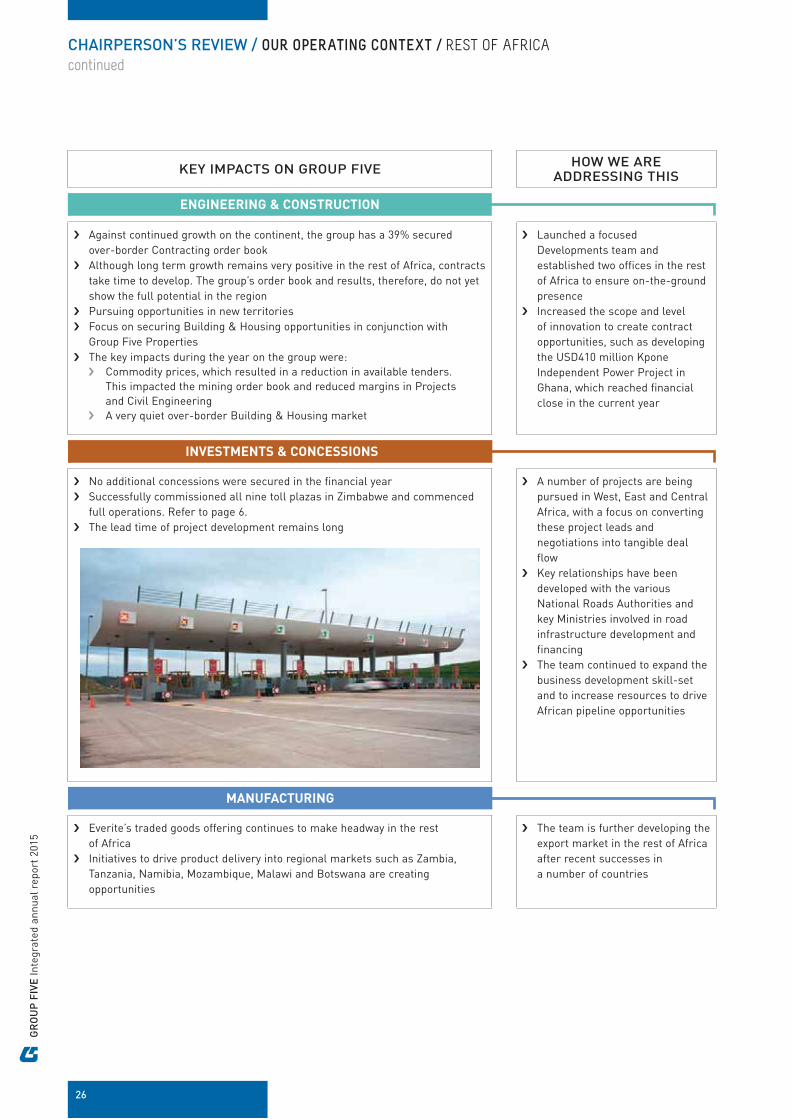
CHAIRPERSON’S REVIEW / OUR OPERATING CONTEXT / REST OF AFRICA
continued
KEY IMPACTS ON GROUP FIVE HOW WE ARE
ADDRESSING THIS
Against continued growth on the continent, the group has a 39% secured over-border Contracting order book
Although long term growth remains very positive in the rest of Africa, contracts take time to develop. The group’s order book and results, therefore, do not yet show the full potential in the region
Pursuing opportunities in new territories Focus on securing Building & Housing opportunities in conjunction with
Group Five Properties The key impacts during the year on the group were:
Commodity prices, which resulted in a reduction in available tenders. This impacted the mining order book and reduced margins in Projects and Civil Engineering
A very quiet over-border Building & Housing market
Launched a focused Developments team and established two offices in the rest of Africa to ensure on-the-ground presence
Increased the scope and level of innovation to create contract opportunities, such as developing the USD410 million Kpone Independent Power Project in Ghana, which reached financial close in the current year
INVESTMENTS & CONCESSIONS
No additional concessions were secured in the financial year Successfully commissioned all nine toll plazas in Zimbabwe and commenced
full operations. Refer to page 6. The lead time of project development remains long
A number of projects are being pursued in West, East and Central Africa, with a focus on converting these project leads and negotiations into tangible deal flow
Key relationships have been developed with the various National Roads Authorities and key Ministries involved in road infrastructure development and financing
The team continued to expand the business development skill-set and to increase resources to drive African pipeline opportunities
MANUFACTURING
Everite’s traded goods offering continues to make headway in the rest of Africa
Initiatives to drive product delivery into regional markets such as Zambia, Tanzania, Namibia, Mozambique, Malawi and Botswana are creating opportunities
The team is further developing the export market in the rest of Africa after recent successes in a number of countries
ENGINEERING & CONSTRUCTION

27
A1
CO
NC
ES
SIO
N
Po
lan
d
EASTERN EUROPE
Eastern Europe remains a key focus area for the group’s
Investments & Concessions cluster.
During the current financial year, the team established a small development office in Russia and is evaluating a potential Intertoll office in the USA. This section addresses the current key market of Eastern Europe.
Europe is currently emerging from a difficult few years of recession, with the European Union region achieving 1.7% growth in GDP in 2015. This is a vast improvement on the negative GDP growth experienced in 2013 and the marginal increase seen in 2014. Over the last few years, central government spending and investment have been cut as they aim to curb borrowing, which in turn has led to a lack of infrastructure tenders.
4%OF GROUP REVENUE
KEY MARKET DYNAMICS
The Central European market is still emerging from the most recent financial downturn and projects that do come to market are being targeted by a large number of competitors
Russia and the Commonwealth of Independent States (CIS) region has a strong pipeline of projects, although delays have been experienced
Delays have also been experienced in the Balkans
Turkey, a key new focus country for the group, announced a material pipeline of construction contracts
KEY IMPACTS ON GROUP FIVE
HOW WE ARE ADDRESSING THIS
The lack of project flow, as well as competition in our traditional Hungarian and Polish markets, made it difficult for the group to secure projects
Although the Balkans and Russia are focus countries for the group, they have experienced project delays and competition
Turkey has strong potential for the group
Intertoll opened a development office in Russia during the financial year. This has led to pre-qualifications with a new partner on projects in Russia
We have a dedicated resource for Russia and the CIS who focuses on higher success probability projects
We have focused on strong partnerships with investment funds and construction groups to ensure we are best placed to be in a winning consortium on target projects being tendered
PAGE Refer to pages 54 to 75 for additional information on how the group navigated market conditions.

GR
OU
P F
IVE
Inte
grat
ed a
nnua
l rep
ort
2015
28
EMPLOYEES
Reason for engagement: Employees drive our business through their enterprise, skill and commitment.
CLIENTS
Reason for engagement: Our existence and growth depend on the group understanding the requirements of our public and private sector clients and providing effective solutions and infrastructure in line with their needs.
GOVERNMENT AS A REGULATOR
Reason for engagement: As the group operates in a growing number of sectors and countries, adequate communication with relevant government bodies is critical to ensure compliance with relevant legislation.
BUSINESS ORGANISATIONS
Reason for engagement: As business organisations often drive opinions based on interaction with a wide base of constituents, it is important for us to understand the macro environment and their objectives to ensure alignment and relevance. The peer group collective in business organisations is also important to create unified industry views.
STAKEHOLDER ENGAGEMENT
During the year, we focused
on a number of stakeholders,
including employees,
clients, shareholders, debt
providers, governments
and regulatory bodies.
The negative growth experienced during the year resulted in a number of cost cuts and rationalisation initiatives, which unfortunately necessitated a reduction in employee headcount and the related engagement.
Low levels of traction in public and private spend required improved engagement with clients to develop alternative or improved product offerings, or solutions to client needs.
We increased our engagement with shareholders and debt providers following the recent poor group performance to provide adequate disclosure on areas of concern.
In addition, we increased our level of engagement with government and regulatory and industry bodies following a significant level of attention on the construction industry during the year.
PAGERefer to pages 50 to 52.
A key stakeholder management strategy developed during the year will improve our group stakeholder management and communications activities. The strategy will ensure better planning, prioritisation, targeting and co-ordination of our stakeholder activities across all levels of the organisation. Focused development activities in target countries in the rest of Africa is being driven under the leadership of our new exco member Themba Mosai.
CHAIRPERSON’S REVIEW / OUR OPERATING CONTEXT / STAKEHOLDER ENGAGEMENT
continued
BUSINESS PARTNERS
Reason for engagement: We select business partners that complement our product and service offering to deliver complete infrastructure solutions to clients. Our sector strategies rely on current and future technical partnerships to ensure alignment in terms of business approach and values at inception and during implementation of contracts.
PROVIDERS OF FINANCIAL RESOURCES (including debt providers and equity shareholders)
Reason for engagement: Providers of debt and equity are core to our existence and growth. The group’s financial strength is generated from the initial backing of equity from shareholders, debt from bondholders and bankers, as well as financial guarantees from bankers and insurance companies.
Without access to guarantee facilities, the group would not be able to tender for contracts. The group’s equity materially defines the group’s ability to access guarantees and growth opportunities.

29
ANALYSTS AND MEDIA
Reason for engagement: Analysts and media provide other stakeholders, especially clients, providers of equity capital (shareholders) and providers of debt capital (bankers) with research and information on the group, its performance and challenges.
COMMUNITIES
Reason for engagement: We engage with communities that are located around our contracts, as the people in communities live and work close to our operations. Understanding and aiming to meet their needs is critical to ensure the successful completion of contracts, especially in the context of South Africa where community unrest around business’ operations is increasing.
EDUCATION AND TRAINING INSTITUTIONS
Reason for engagement: Being an attractive employer is fundamental to our ability to source, retain and develop the best talent in the market. Group Five’s in-house Academy forms partnerships with external training and education institutions to identify talent for our bursary programmes and employee pipeline.
KEY STAKEHOLDER ISSUES The three most material stakeholder issues that were regularly communicated to the group during the year are outlined below, as well as where more information can be found on how we are addressing their areas of concern:
MACRO-ECONOMIC ISSUES, ESPECIALLY THE TOUGH SOUTH AFRICAN MARKET
2
THE BROADER SOUTH AFRICAN TRANSFORMATION AGENDA
Legacy issues following the Competition Commission investigation into the construction sector
Broad-based black economic empowerment (BBBEE) legislative changes
Increasing diversity within the group
3
INTERNAL CHALLENGES, WITH A KEY FOCUS ON:
Execution, especially in light of operational delivery challenges in Engineering & Construction
Ensuring competitiveness
Driving order book growth
1 34 – 39PAGES
RE
IPP
* S
OL
AR
PR
OJ
EC
T –
JA
SP
ER
So
uth
Afr
ica
* Renewable Energy Independent Power Producer Programme.
23 – 24PAGES
50 – 52PAGES

GR
OU
P F
IVE
Inte
grat
ed a
nnua
l rep
ort
2015
30
ACTING RESPONSIBLY
Within the context of an expanding geographic strategy, it becomes even more critical for the group to protect its brand and integrity by ensuring that its employees are well trained and aware of their responsibilities, including providing guidance on how to deal with situations of duress.
Integrity is one of the group’s seven values. The group’s ethics standards are set out in a code of conduct. The code of conduct details the group’s expectation of how employees, sub-contractors, suppliers and joint venture partners should conduct themselves whilst working with Group Five.
In line with our ongoing commitment to compliance and ethics,
management further increased our focus on compliance with the appointment of a senior compliance and ethics manager. During the year, 140 employees attended
ethics training. Ethics training also forms a core part of new
employee induction training.
CHAIRPERSON’S REVIEW / OUR OPERATING CONTEXT / LOOKING FORWARD
continued
As outlined to the market before, Group Five has co-operated proactively with the Competition Commission of South Africa (the Commission) since 2009 in terms of its investigations into matters of collusion in the construction industry in South Africa.
To date, the group has not reached settlement with the Commission on two contracts where the group has been implicated for anti-competitive behaviour. These matters have been referred to the Competition Tribunal. The group has not received any evidence of it partaking in anti-competitive behaviour on these contracts. The group awaits the date for the hearing from the Competition Tribunal for the matters referred. We welcome the opportunity to address
LOOKING FORWARD
SOUTH AFRICA
Market conditions in our home market of South Africa are set to remain challenging.
The views expressed by credit rating agencies on South Africa’s ability to manage its current account deficit and electricity crisis are also of concern. State-owned enterprises’ infrastructure programmes are being delayed due to financial constraints as tariff increases are deemed as insufficient to finance pipeline projects.
The private sector confidence remains low, with a lack in spending. This, combined with challenges in the mining sector, will continue to delay much-needed infrastructure spending.
However, we remain encouraged by the objectives set in the NDP, which specifically recognise the important part that investment in infrastructure plays in driving growth of our economy. The NDP targets Gross Domestic Fixed Investment to grow from the current 16% of GDP to 30% by 2030. As the NDP is endorsed and supported by most political parties and the ANC-led government, this bodes well over the medium to longer term for a recovery in our sector.
At a regulatory level, the alignment of the Construction Sector broad-based black economic empowerment (BBBEE) Charter to the revised Codes of Good Practice has commenced. We are working with relevant role players to better understand the expected timing and process for implementation. We conducted a review of the impact of the revised requirements on our current empowerment scorecard and are proactively implementing amended internal structures and performance metrics to ensure alignment with the expected revised scorecard targets.
PAGERefer to pages 50 to 52.
Whilst Group Five has a Level 2 rating in terms of the Construction Charter and has progressed in terms of diversity, certain challenges remain.
and clarify this long-outstanding issue to bring certainty to shareholders, employees and all other stakeholders.
Two other matters have been dropped and are no longer being investigated by the Commission.
We acknowledge the reputational damage done to the country, our sector and our group and continue to work with and through the industry and representative business bodies and government to effect transformation and rebuild the stature of the industry as a precursor to, and in support of, the national agenda for the much-needed roll out of the infrastructure programmes under the government’s National Development Plan (NDP).

31
Our key focus areas for improvement remain senior management level transformation and improving the gender demographics of the company. Although we made progress during the year in terms of an additional senior management appointment, more remains to be done.
PAGEWe have clear plans in place to address these challenges, as outlined on pages 50 to 52.
Furthermore, women comprise only 16% of the entire workforce. In F2012, we launched the Basadi programme, a special initiative focusing on women empowerment, which intends to highlight and address systemic barriers (policy, structural and cultural) that impede the attraction and retention of women. The Basadi programme focuses on the development and empowerment of women in line with one of the group’s stated values of transformation. Since its creation, we have focused on women empowerment, with employee training and development, support of women in our sector and contribution to the community through social development initiatives. The programme recently received recognition from the Women in Construction Awards as one of the most innovative women training programmes.
THE REST OF AFRICA
Rising income and urbanisation are supporting growth in domestic demand, which is helping to increase diversification into sectors such as construction, financial services and telecommunications, which will contribute to ongoing economic expansion.
The power sector across the rest of Africa is buoyant, with a number of very strong prospects at advanced development and tender stage across multiple geographies. The transport sector also remains active, with a number of realistic contracts on the horizon across the rest of Africa. The real estate market continues to be busy in our target African countries.
Due to a sharply lower oil price, the prospects in the oil and gas markets have tempered somewhat, but do remain positive in West and East Africa. Mining markets across the rest of Africa will continue to be weak in line with sustained lower commodity prices.
PAGERefer to pages 44 to 49 for more about our focus on growth in the rest of Africa.
EASTERN EUROPE
Eastern Europe is emerging from the recession with mixed results. This is mainly due to either political or regional issues in specific countries, which are also impacted by the current European Union (EU) sanctions with Russia.
It is clear that both Hungary and Poland will remain challenging markets, with political and financial issues limiting the opportunity for new projects. However, over the medium term Poland offers strong potential for future projects, with additional EU cohesion funding of Euro 106 billion expected for the next six years, of which around Euro 20 billion is earmarked for public private partnership (PPP) infrastructure projects. There is also a devolvement of political power in Poland to local regions, giving them greater autonomy for their budgets and the ability to issue PPP and maintenance contracts as opposed to central government. There are visible signs of improvement in the pipeline of projects being put out to tender.
Outside our existing geographies, Intertoll’s view is that there is still a strong pipeline of work in certain selected countries further east in Europe and in the old Soviet Union. Intertoll is currently part of a pre-qualified consortium in Russia where there is a PPP construction pipeline of around USD30 billion for road PPPs, and in Kazakhstan for a new motorway PPP project.
APPRECIATION My appreciation goes out to my fellow board members for their continued input. Our board restructuring during F2014 has positively reinvigorated and increased diversity of debate around the table. I have enjoyed this time.
Our new CEO, Eric Vemer, has stepped seamlessly into the role in December 2014. Eric is a very skilled executive with over 25 years’ experience, of which ten years have been with Group Five. The board is confident that he can lead the group through what will remain difficult conditions.
The board and myself as chairperson are enthused by the changes Eric has already implemented and believe the new executive structure will assist the team to address the key issues we face.
We thank our previous CEO, Mike Upton, who retired at the end of November, for his hard work over the years he was with us. He navigated the group through significant challenges and left a strong team to continue driving the group forward.
My appreciation also goes to all our stakeholders. We faced an extremely tough year, but I am confident that the current management team has the experience and focus to take the action required to steer us forward with success.
Philiswe Mthethwa CHAIRPERSON
Intertoll is also tendering for operations and maintenance contracts in Turkey on three sections of new PPP motorways, with a construction value of over USD3 billion.
Both Russia and Turkey have strong economic bases and histories of closing PPP projects.
Intertoll’s focus will remain on closing projects in countries where there is strong investment funding and bank support for the region. Although we will continue to expand our home base in Poland and Hungary, we will continue with our expansionary geographic strategy in regions that have strong financial support.

GR
OU
P F
IVE
Inte
grat
ed a
nnua
l rep
ort
2015
32
CH
IEF
EX
EC
UT
IVE
O
FF
ICE
R’S
RE
VIE
W
INTRODUCTIONAgainst challenging market conditions and very clear
stakeholder expectations, we focused on identifying our issues,
taking firm action and setting measurable milestones with
regular review dates to ensure problem issues were addressed
and improvements delivered.
We did not hesitate to tackle the difficult issues head on and
engage widely and transparently to ensure support for the
actions taken.
Eric Vemer CHIEF EXECUTIVE OFFICER
We also increased our focus on the team’s ownership and accountability for segment performance, as well as speed of action in the event of poor delivery. For example, responsibility for contract performance has been reconfirmed to be that of contract directors. Although they are supported by managing directors, they must retain clear and direct accountability for contract delivery without delegating responsibility to junior subordinates or escalating issues to the group executive to resolve without consequence. At the same time, we are also focused on driving our
safety and quality performance, an improved order book, addressing execution challenges, ensuring a lean overhead base and driving successful client relationships.
As a result of our revised approach and renewed culture of accountability, we have experienced increased energy and vigour within the group, which was further cemented with several senior management changes made during the financial year, as outlined on pages 16 to 19.

33
MATERIAL ISSUES
ENSURE EFFECTIVE EXECUTION
ENGINEERING &
CONSTRUCTION
Management of contracts, ensuring effective delivery and reducing loss-making contracts
Ensure continued safe operations
INVESTMENTS &
CONCESSIONS
Continue to focus on costs and efficiencies to maintain and grow strong margins
Ensure continued safe operations
MANUFACTURING
Continue to drive operational excellence
Ensure continued safe operations
TACKLING OUR ISSUESAs outlined on pages 28 to 29, our stakeholders identified key issues of concern. As a management team and board we also held a number of discussion forums, which highlighted issues which required immediate action.
Our overall performance in the year was very disappointing and as a management team not acceptable to us. The strong performance by Investments & Concessions and solid delivery by Manufacturing was undermined by the significant losses incurred on certain contracts in Engineering & Construction.
We focus on the top three issues and related plans in this integrated annual report.
/01MATERIAL ISSUE
REMAIN RELEVANT IN A COMPETITIVE AND CHANGING LANDSCAPE
Address reputational damage and the mistrust created between our sector and the public sector as a result of the anti-competitive behaviour identified by the Competition Commission investigation into the construction sector in South Africa
Prepare for changing regulatory requirements, especially in South Africa, where new broad-based black economic empowerment legislation will require increased focus on diversity in companies’ operations
UES/03MATERIAL ISSUE
SECURE A QUALITY MULTI-YEAR CONTRACTING AND ANNUITY ORDER BOOK
Extract opportunities in a constrained South African market
Drive continued sector-led African expansion
Grow the Intertoll brand in other markets and consider a separate equities listing once appropriate size and scale is reached
/02MATERIAL ISSUE

GR
OU
P F
IVE
Inte
grat
ed a
nnua
l rep
ort
2015
34
WHY IS THIS RELEVANT? During the current year,
the group’s contract loss-/
profit-maker ratio weakened
significantly following poor
execution. This materially
impacted earnings and returns,
resulting in execution risk
becoming management’s most
material focus area.
CHIEF EXECUTIVE OFFICER’S REVIEW
continued
ENSURE EFFECTIVE EXECUTION
SECURE A QUALITY MULTI-YEAR CONTRACTING AND ANNUITY ORDER BOOK
REMAIN RELEVANT IN A COMPETITIVE AND CHANGING LANDSCAPE
/01MATERIAL ISSUE
/03MATERIAL ISSUE
/02MATERIAL ISSUE
PE
RK
OA
ZIN
C
Bu
rkin
a F
as
o
35
ACTIONS TAKEN TO ADDRESS THIS FOCUS AREA
ENGINEERING & CONSTRUCTION
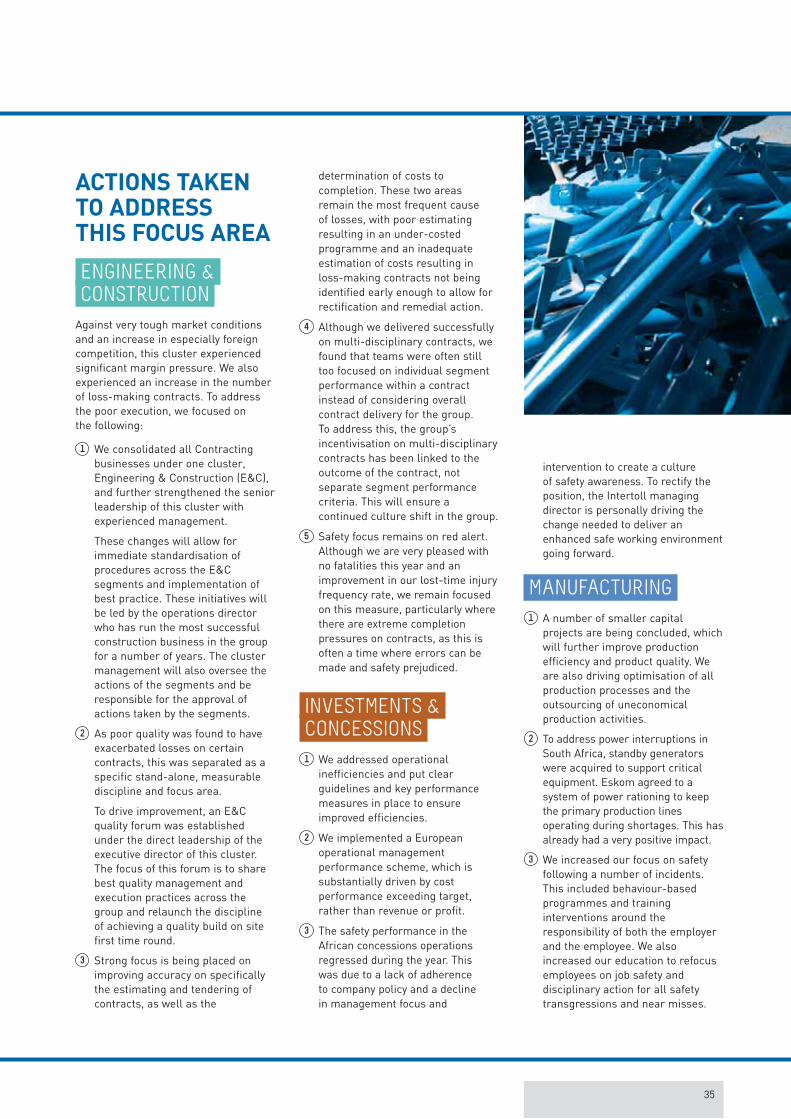
Against very tough market conditions and an increase in especially foreign competition, this cluster experienced significant margin pressure. We also experienced an increase in the number of loss-making contracts. To address the poor execution, we focused on the following:
1 We consolidated all Contracting businesses under one cluster, Engineering & Construction (E&C), and further strengthened the senior leadership of this cluster with experienced management.
These changes will allow for immediate standardisation of procedures across the E&C segments and implementation of best practice. These initiatives will be led by the operations director who has run the most successful construction business in the group for a number of years. The cluster management will also oversee the actions of the segments and be responsible for the approval of actions taken by the segments.
2 As poor quality was found to have exacerbated losses on certain contracts, this was separated as a specific stand-alone, measurable discipline and focus area.
To drive improvement, an E&C quality forum was established under the direct leadership of the executive director of this cluster. The focus of this forum is to share best quality management and execution practices across the group and relaunch the discipline of achieving a quality build on site first time round.
3 Strong focus is being placed on improving accuracy on specifically the estimating and tendering of contracts, as well as the
intervention to create a culture of safety awareness. To rectify the position, the Intertoll managing director is personally driving the change needed to deliver an enhanced safe working environment going forward.
MANUFACTURING
1 A number of smaller capital projects are being concluded, which will further improve production efficiency and product quality. We are also driving optimisation of all production processes and the outsourcing of uneconomical production activities.
2 To address power interruptions in South Africa, standby generators were acquired to support critical equipment. Eskom agreed to a system of power rationing to keep the primary production lines operating during shortages. This has already had a very positive impact.
3 We increased our focus on safety following a number of incidents. This included behaviour-based programmes and training interventions around the responsibility of both the employer and the employee. We also increased our education to refocus employees on job safety and disciplinary action for all safety transgressions and near misses.
determination of costs to completion. These two areas remain the most frequent cause of losses, with poor estimating resulting in an under-costed programme and an inadequate estimation of costs resulting in loss-making contracts not being identified early enough to allow for rectification and remedial action.
4 Although we delivered successfully on multi-disciplinary contracts, we found that teams were often still too focused on individual segment performance within a contract instead of considering overall contract delivery for the group. To address this, the group’s incentivisation on multi-disciplinary contracts has been linked to the outcome of the contract, not separate segment performance criteria. This will ensure a continued culture shift in the group.
5 Safety focus remains on red alert. Although we are very pleased with no fatalities this year and an improvement in our lost-time injury frequency rate, we remain focused on this measure, particularly where there are extreme completion pressures on contracts, as this is often a time where errors can be made and safety prejudiced.
INVESTMENTS & CONCESSIONS
1 We addressed operational inefficiencies and put clear guidelines and key performance measures in place to ensure improved efficiencies.
2 We implemented a European operational management performance scheme, which is substantially driven by cost performance exceeding target, rather than revenue or profit.
3 The safety performance in the African concessions operations regressed during the year. This was due to a lack of adherence to company policy and a decline in management focus and

GR
OU
P F
IVE
Inte
grat
ed a
nnua
l rep
ort
2015
36
CHIEF EXECUTIVE OFFICER’S REVIEW / ENSURE EFFECTIVE EXECUTION
continued
ENSURE EFFECTIVE EXECUTION continued/01MATERIAL ISSUE
WHAT PROGRESS CAN BE SEEN?
In line with tendering norms for Projects and Energy, the level of negotiated contracts within these segments remains low.
Although the year-on-year
percentage of revenue
traded from negotiated
contracts decreased from
18% to 15%, it is pleasing
to note that the segment
with the largest revenue
in the financial year is
also the segment with the
highest percentage of
negotiated contracts.
ENGINEERING & CONSTRUCTION
1 Due to the strong action taken on non-performance, we have seen a number of initial improvements, including:
Clearer understanding of where accountability and responsibility reside, including improved management of contracts
Detailed knowledge of non-performing contracts by cluster executives, with proactive action being taken to address weak performance
Revision of risk procedures to incorporate lessons learnt from loss-making contracts, with a focus on accurate estimating at tender stage and cost to completion assessment during execution stage
Increased training on estimating and tendering and cost to completion Improved communication between segments by simplifying the interaction
within the cluster to result in faster decision-making
2 Performance reviews have been conducted, with revised key performance measures put in place to ensure a strong focus on performance and accountability.
3 We are very pleased with the improvement seen in the safety performance of both our employees and those of sub-contractors.
Group’s traded Contracting* revenue (R million)
Building &Housing
CivilEngineering
Projects Energy Total Engineering
& Construction
2015, % of traded revenue won through tender process
2015, % of traded revenue won as a negotiated contract
2014, % of traded revenue won through tender process
2014, % of traded revenue won as a negotiated contract15% 18%
11 694 13 228
85%
24%
37%
4 886 4 430
76%63%
19% 19%
2 666 3 760
81% 81%
2 214 1 741
100% 100%
4% 3%
1 928 3 297
96% 97%82%
CLIENT CONFIDENCE IN THE GROUP INDICATED BY NEGOTIATED CONTRACTS:
* Excluding Operations & Maintenance revenue.
Negotiated contracts in Building & Housing’s revenue was 24%

37
The improvement in safety performance was achieved due to a focus on
conducting internal audits to identify the causes of injuries and
implementing corrective actions, as well as generating mitigating
strategies and risk rankings for high and extreme risks.
Both employees and sub-contractors showed an improvement due to an unwavering focus on safety awareness over the last few years and grouping both employees and sub-contractors under one central safety function to ensure consistent implementation of safety measures.
Safety measures are also now linked to management’s key performance
indicators to ensure strict measurement. We also implemented ad hoc
site visits from senior management to work closely with sites on
addressing improvements before incidents occur.
The focus on implementing the group’s Zero Harm campaign
resulted in a very pleasing decrease in our segment lost-time injury frequency rate (LTIFR) from
0.12 to 0.10 and a decrease in the group
LTIFR from 0.17 to 0.15. This, combined with
no fatalities,is an outstanding achievement
and very pleasing to the management team.
The Building & Housing
segment, the group’s
largest Contracting segment,
increased its work from
repeat clients.
The decrease in the repeat client work in the Projects segment was mainly due to the slowdown within the mining sector, securing additional South African revenue and securing new clients following further diversification into new regions.
It is pleasing to see an increase in repeat work within the group’s Energy segment in line with the group’s stated strategy.
Group’s traded Contracting* revenue (R million)
Building &Housing
CivilEngineering
Projects Energy TotalEngineering
& Construction
2015, % of traded revenue won with new clients
2015, % of traded revenue won with repeat clients
2014, % of traded revenue won with new clients
2014, % of traded revenue won with repeat clients
57% 61%
11 694 13 228
43%
60%55%
4 886 4 430
40%45%
82%96%
2 666 3 760
18%
2 214 1 741
86%74%
61%49%
1 928 3 297
39%51%
39%
14%26%
4%
CLIENT CONFIDENCE IN THE GROUP INDICATED BY AWARDS WITH REPEAT CLIENTS:
* Excluding Operations & Maintenance revenue.

GR
OU
P F
IVE
Inte
grat
ed a
nnua
l rep
ort
2015
38
ENSURE EFFECTIVE EXECUTION continued/01MATERIAL ISSUE
MANUFACTURING
1 Costs were reduced through a further reduction in headcount as technical improvements were concluded in the Everite factory.
2 Certain low-volume and inefficient processes were outsourced to low-cost external suppliers.
3 The declining steel price was reasonably managed to limit exposure to the carrying values of steel inventories.
4 Through careful planning we managed to fully address the impact of Eskom power outages.
5 Disciplinary action was taken against negligent employees who impacted safety. Management are also now more visible on the plant floor and on sites. Superintendents are measured weekly on compliance with safety and health and corrective action is taken where necessary.
INVESTMENTS & CONCESSIONS
1 To address operational inefficiencies, a review of key performance measures has started to show positive results. Cost savings have already been realised on specific line items.
2 The realignment of the European team to be cost-focused resulted in cost-out to date of around Euro 1,6 million.
3 Non-adherence to safety policy has been dealt with. We will ensure continued intervention by senior management until safety is brought back to acceptable levels.
CHIEF EXECUTIVE OFFICER’S REVIEW / ENSURE EFFECTIVE EXECUTION
continued
EXPORTS COST-OUT
Export volumes on a like-for-like
basis increased by
27.4%
Exports as a percentage of total
revenue increased by
11.7% to 6.7% of total revenue
Direct labour cost per product
output dropped by
6.2%year-on-year even after a higher
than CPI wage settlement
Although electricity increased
by 15%, the Rand cost of energy
consumed per product output
only increased by
1%due to a focus on new technology
and equipment upgrades
35
24
12
1219
Employee-related expenses Professional fees Office expenses Winter maintenance Vehicles Materials Sub-contractors
16
COST SAVING BY TYPE (%)
F2015
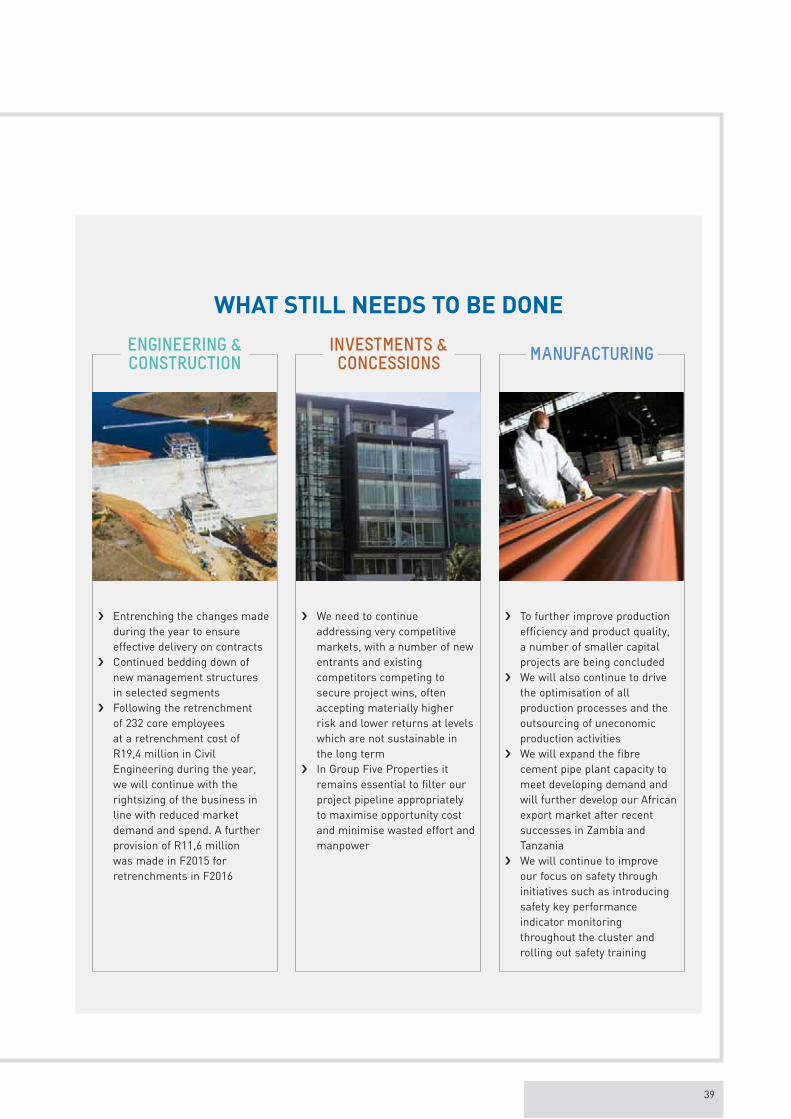
39
WHAT STILL NEEDS TO BE DONE
Entrenching the changes made during the year to ensure effective delivery on contracts
Continued bedding down of new management structures in selected segments
Following the retrenchment of 232 core employees at a retrenchment cost of R19,4 million in Civil Engineering during the year, we will continue with the rightsizing of the business in line with reduced market demand and spend. A further provision of R11,6 million was made in F2015 for retrenchments in F2016
We need to continue addressing very competitive markets, with a number of new entrants and existing competitors competing to secure project wins, often accepting materially higher risk and lower returns at levels which are not sustainable in the long term
In Group Five Properties it remains essential to filter our project pipeline appropriately to maximise opportunity cost and minimise wasted effort and manpower
To further improve production efficiency and product quality, a number of smaller capital projects are being concluded
We will also continue to drive the optimisation of all production processes and the outsourcing of uneconomic production activities
We will expand the fibre cement pipe plant capacity to meet developing demand and will further develop our African export market after recent successes in Zambia and Tanzania
We will continue to improve our focus on safety through initiatives such as introducing safety key performance indicator monitoring throughout the cluster and rolling out safety training
ENGINEERING & CONSTRUCTION
INVESTMENTS & CONCESSIONS
MANUFACTURING

GR
OU
P F
IVE
Inte
grat
ed a
nnua
l rep
ort
2015
40
The group suffered significant losses on one contract
in the Eastern Cape. The Civil Engineering and Projects
segments were appointed as sub-contractors to deliver
civil engineering and structural, mechanical, electrical,
instrumentation and piping (SMEIP) construction of a
re-measurable peaking power plant. Construction
commenced in September 2013.
The group identified areas of concern during the execution phase of the contract and significant corrective action and additional support by the group, cluster and segments was provided. However, although the contract will be successfully completed by August 2015, it will be at a significantly higher cost than the tendered value, as the remedial interventions instituted during the current financial year were unable to return the contract to profit. A loss of R224 million was incurred in the year. Cluster management have assessed the contract’s performance and believe that sufficient provision for losses has been recorded within F2015 to cater for the costs to come on completion of the contract.
Eastern Cape
CA
SE
ST
UD
Y
EASTERN CAPE LOSS-MAKING CONTRACT – lessons learnt
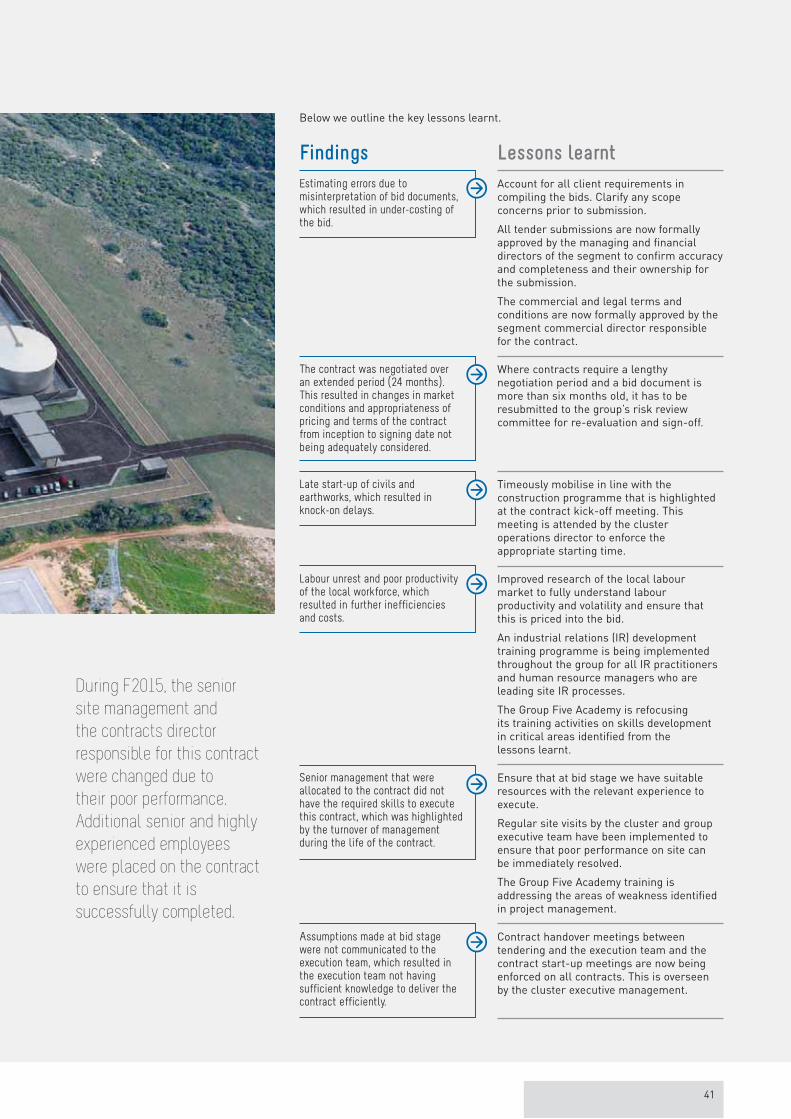
41
Below we outline the key lessons learnt.
Findings Lessons learnt
Estimating errors due to misinterpretation of bid documents, which resulted in under-costing of the bid.
Account for all client requirements in compiling the bids. Clarify any scope concerns prior to submission.
All tender submissions are now formally approved by the managing and financial directors of the segment to confirm accuracy and completeness and their ownership for the submission.
The commercial and legal terms and conditions are now formally approved by the segment commercial director responsible for the contract.
The contract was negotiated over an extended period (24 months). This resulted in changes in market conditions and appropriateness of pricing and terms of the contract from inception to signing date not being adequately considered.
Where contracts require a lengthy negotiation period and a bid document is more than six months old, it has to be resubmitted to the group’s risk review committee for re-evaluation and sign-off.
Late start-up of civils and earthworks, which resulted in knock-on delays.
Timeously mobilise in line with the construction programme that is highlighted at the contract kick-off meeting. This meeting is attended by the cluster operations director to enforce the appropriate starting time.
Labour unrest and poor productivity of the local workforce, which resulted in further inefficiencies and costs.
Improved research of the local labour market to fully understand labour productivity and volatility and ensure that this is priced into the bid.
An industrial relations (IR) development training programme is being implemented throughout the group for all IR practitioners and human resource managers who are leading site IR processes.
The Group Five Academy is refocusing its training activities on skills development in critical areas identified from the lessons learnt.
Senior management that were allocated to the contract did not have the required skills to execute this contract, which was highlighted by the turnover of management during the life of the contract.
Ensure that at bid stage we have suitable resources with the relevant experience to execute.
Regular site visits by the cluster and group executive team have been implemented to ensure that poor performance on site can be immediately resolved.
The Group Five Academy training is addressing the areas of weakness identified in project management.
Assumptions made at bid stage were not communicated to the execution team, which resulted in the execution team not having sufficient knowledge to deliver the contract efficiently.
Contract handover meetings between tendering and the execution team and the contract start-up meetings are now being enforced on all contracts. This is overseen by the cluster executive management.
During F2015, the senior
site management and
the contracts director
responsible for this contract
were changed due to
their poor performance.
Additional senior and highly
experienced employees
were placed on the contract
to ensure that it is
successfully completed.
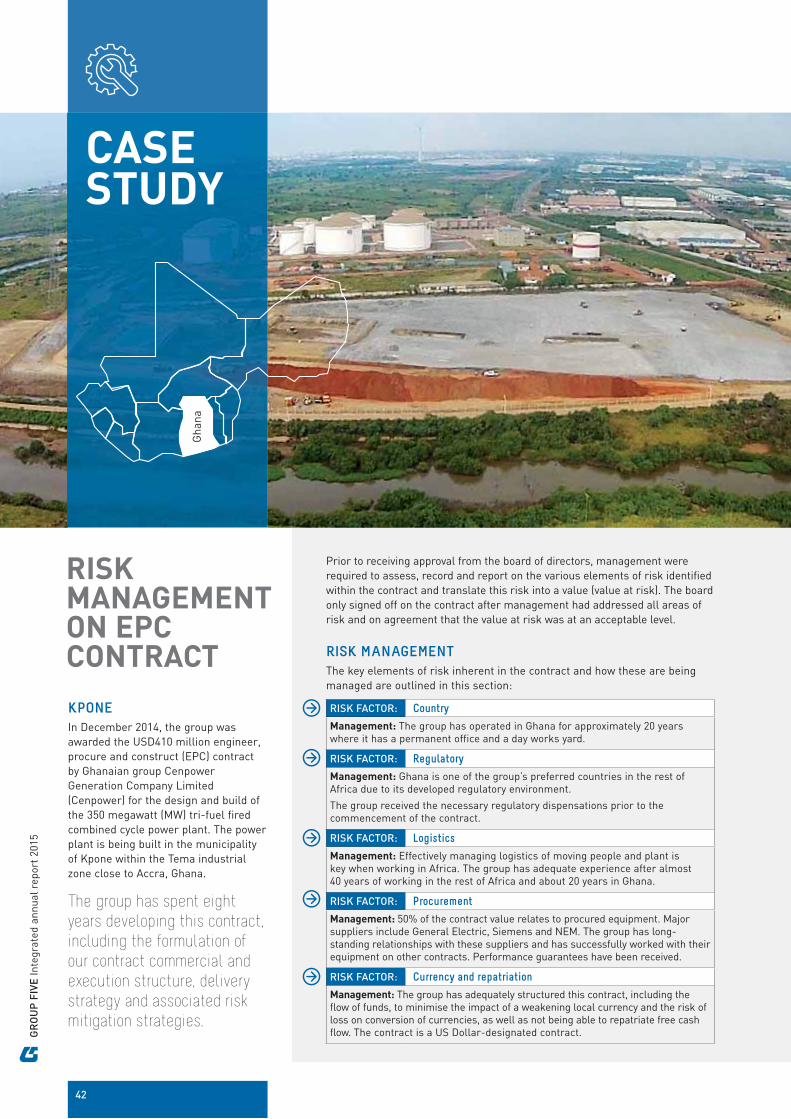
GR
OU
P F
IVE
Inte
grat
ed a
nnua
l rep
ort
2015
42
Prior to receiving approval from the board of directors, management were required to assess, record and report on the various elements of risk identified within the contract and translate this risk into a value (value at risk). The board only signed off on the contract after management had addressed all areas of risk and on agreement that the value at risk was at an acceptable level.
RISK MANAGEMENT
The key elements of risk inherent in the contract and how these are being managed are outlined in this section:
KPONE
In December 2014, the group was awarded the USD410 million engineer, procure and construct (EPC) contract by Ghanaian group Cenpower Generation Company Limited (Cenpower) for the design and build of the 350 megawatt (MW) tri-fuel fired combined cycle power plant. The power plant is being built in the municipality of Kpone within the Tema industrial zone close to Accra, Ghana.
The group has spent eight
years developing this contract,
including the formulation of
our contract commercial and
execution structure, delivery
strategy and associated risk
mitigation strategies.
RISK FACTOR: Country
Management: The group has operated in Ghana for approximately 20 years where it has a permanent office and a day works yard.
RISK FACTOR: Regulatory
Management: Ghana is one of the group’s preferred countries in the rest of Africa due to its developed regulatory environment.
The group received the necessary regulatory dispensations prior to the commencement of the contract.
RISK FACTOR: Logistics
Management: Effectively managing logistics of moving people and plant is key when working in Africa. The group has adequate experience after almost 40 years of working in the rest of Africa and about 20 years in Ghana.
RISK FACTOR: Procurement
Management: 50% of the contract value relates to procured equipment. Major suppliers include General Electric, Siemens and NEM. The group has long-standing relationships with these suppliers and has successfully worked with their equipment on other contracts. Performance guarantees have been received.
RISK FACTOR: Currency and repatriation
Management: The group has adequately structured this contract, including the flow of funds, to minimise the impact of a weakening local currency and the risk of loss on conversion of currencies, as well as not being able to repatriate free cash flow. The contract is a US Dollar-designated contract.
CASE STUDY
Gha
na
RISK MANAGEMENT ON EPC CONTRACT
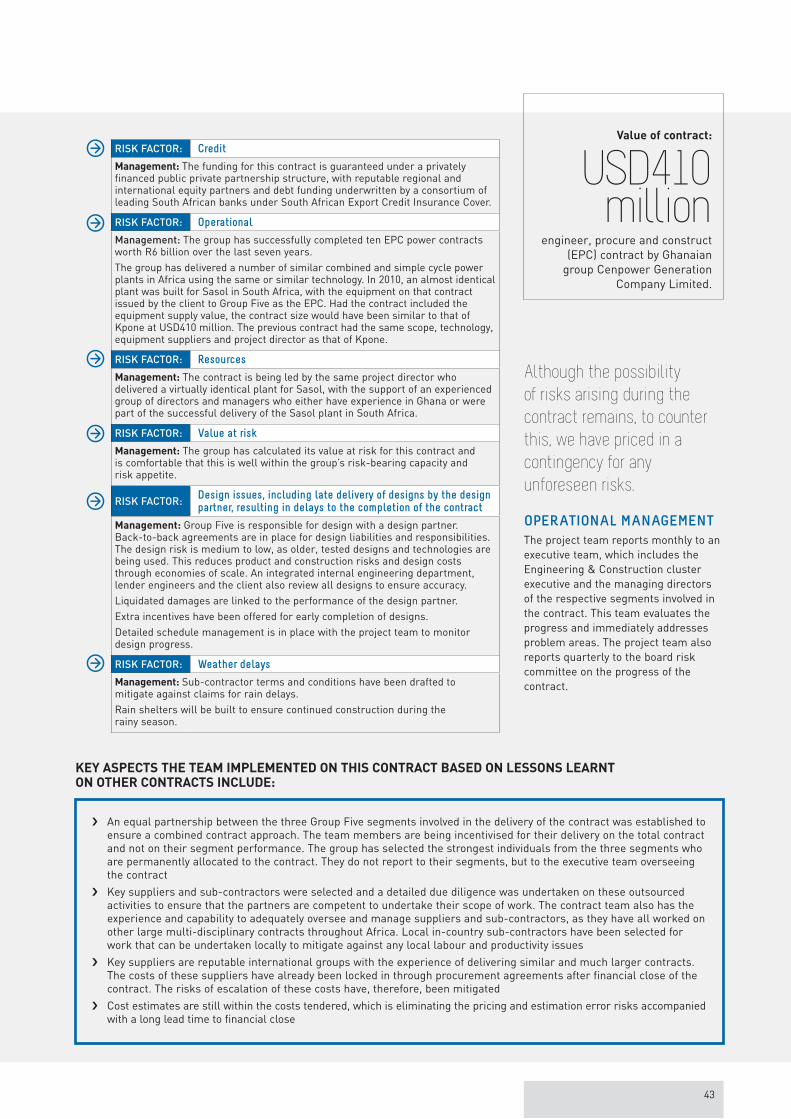
43
Although the possibility
of risks arising during the
contract remains, to counter
this, we have priced in a
contingency for any
unforeseen risks.
OPERATIONAL MANAGEMENT
The project team reports monthly to an executive team, which includes the Engineering & Construction cluster executive and the managing directors of the respective segments involved in the contract. This team evaluates the progress and immediately addresses problem areas. The project team also reports quarterly to the board risk committee on the progress of the contract.
An equal partnership between the three Group Five segments involved in the delivery of the contract was established to ensure a combined contract approach. The team members are being incentivised for their delivery on the total contract and not on their segment performance. The group has selected the strongest individuals from the three segments who are permanently allocated to the contract. They do not report to their segments, but to the executive team overseeing the contract
Key suppliers and sub-contractors were selected and a detailed due diligence was undertaken on these outsourced activities to ensure that the partners are competent to undertake their scope of work. The contract team also has the experience and capability to adequately oversee and manage suppliers and sub-contractors, as they have all worked on other large multi-disciplinary contracts throughout Africa. Local in-country sub-contractors have been selected for work that can be undertaken locally to mitigate against any local labour and productivity issues
Key suppliers are reputable international groups with the experience of delivering similar and much larger contracts. The costs of these suppliers have already been locked in through procurement agreements after financial close of the contract. The risks of escalation of these costs have, therefore, been mitigated
Cost estimates are still within the costs tendered, which is eliminating the pricing and estimation error risks accompanied with a long lead time to financial close
RISK FACTOR: Credit
Management: The funding for this contract is guaranteed under a privately financed public private partnership structure, with reputable regional and international equity partners and debt funding underwritten by a consortium of leading South African banks under South African Export Credit Insurance Cover.
RISK FACTOR: Operational
Management: The group has successfully completed ten EPC power contracts worth R6 billion over the last seven years. The group has delivered a number of similar combined and simple cycle power plants in Africa using the same or similar technology. In 2010, an almost identical plant was built for Sasol in South Africa, with the equipment on that contract issued by the client to Group Five as the EPC. Had the contract included the equipment supply value, the contract size would have been similar to that of Kpone at USD410 million. The previous contract had the same scope, technology, equipment suppliers and project director as that of Kpone.
RISK FACTOR: Resources
Management: The contract is being led by the same project director who delivered a virtually identical plant for Sasol, with the support of an experienced group of directors and managers who either have experience in Ghana or were part of the successful delivery of the Sasol plant in South Africa.
RISK FACTOR: Value at risk
Management: The group has calculated its value at risk for this contract and is comfortable that this is well within the group’s risk-bearing capacity and risk appetite.
RISK FACTOR:Design issues, including late delivery of designs by the design partner, resulting in delays to the completion of the contract
Management: Group Five is responsible for design with a design partner. Back-to-back agreements are in place for design liabilities and responsibilities. The design risk is medium to low, as older, tested designs and technologies are being used. This reduces product and construction risks and design costs through economies of scale. An integrated internal engineering department, lender engineers and the client also review all designs to ensure accuracy.Liquidated damages are linked to the performance of the design partner.Extra incentives have been offered for early completion of designs.Detailed schedule management is in place with the project team to monitor design progress.
RISK FACTOR: Weather delays
Management: Sub-contractor terms and conditions have been drafted to mitigate against claims for rain delays.Rain shelters will be built to ensure continued construction during the rainy season.
Value of contract:
USD410million
engineer, procure and construct (EPC) contract by Ghanaian
group Cenpower Generation Company Limited.
KEY ASPECTS THE TEAM IMPLEMENTED ON THIS CONTRACT BASED ON LESSONS LEARNT ON OTHER CONTRACTS INCLUDE:
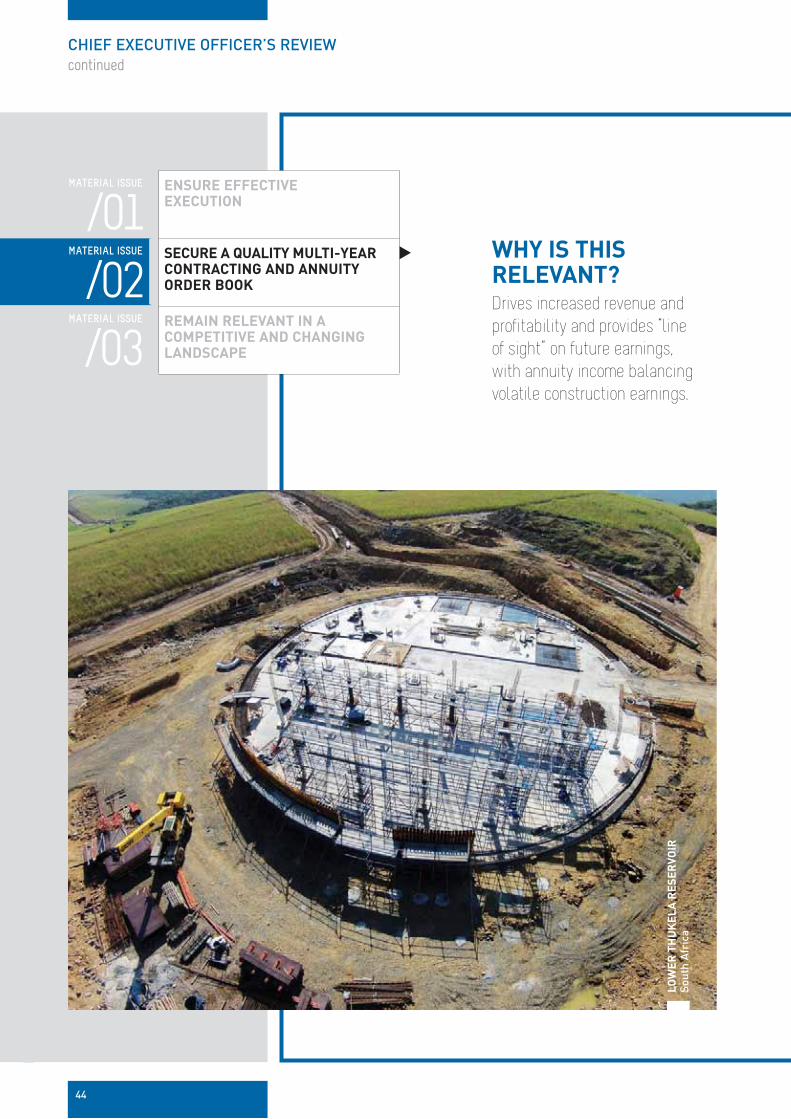
GR
OU
P F
IVE
Inte
grat
ed a
nnua
l rep
ort
2015
44
ENSURE EFFECTIVE EXECUTION
SECURE A QUALITY MULTI-YEAR CONTRACTING AND ANNUITY ORDER BOOK
REMAIN RELEVANT IN A COMPETITIVE AND CHANGING LANDSCAPE
/01MATERIAL ISSUE
/03MATERIAL ISSUE
/02MATERIAL ISSUE
CHIEF EXECUTIVE OFFICER’S REVIEW
continued
WHY IS THIS RELEVANT? Drives increased revenue and
profitability and provides “line
of sight” on future earnings,
with annuity income balancing
volatile construction earnings.
LO
WE
R T
HU
KE
LA
RE
SE
RV
OIR
So
uth
Afr
ica

45
ACTIONS TAKEN TO ADDRESS THIS FOCUS AREA
ENGINEERING & CONSTRUCTION
1 Businesses are increasingly focusing on sectors and regions which provide the most margin and cash enhancement and ultimately the best returns. The group’s contract clearing house and risk review meetings prior to contract tenders will ensure that this focus is retained.
2 We balanced our emphasis on order book growth against the group’s capacity to assume risk.
3 We secured R1,6 billion multi-disciplinary contracts within our year-end reported Contracting order book to optimise margin extraction.
4 As outlined on page 26, we improved our targeted African strategy through the appointment of dedicated resources and the creation of small in-country offices in Ghana and Mozambique. We have a clear target in place to drive our contribution to revenue from over-border work to 50% by 2020.
INVESTMENTS & CONCESSIONS
1 On the back of the secured portfolio in Poland and Hungary, the Intertoll business is prudently expanding into other Eastern European markets such as Slovakia, Bulgaria, Russia and Turkey. Intertoll is also evaluating various road concessions opportunities in North America with our current European partners, which offer a number of attractive future project prospects.
2 In Intertoll, during the year, we pre-qualified on a number of potential PPP projects and successfully employed defensive strategies on all our projects that were due for price renegotiation.
3 We secured a number of residential, commercial and retail development opportunities in Group Five Properties.
MANUFACTURING 1 We continue to drive potential areas
of growth in our markets, which include:
Securing large volume reinforcing steel orders for building and civil engineering contracts
Targeting the large water pipeline contracts planned by Rand Water and the Department of Water and Sanitation
Sourcing target RDP housing contracts which will provide a three-year order book for our alternative building technology business, ABT
Sourcing complementary traded products within the context of our alternative revenue streams and limiting volume decline in the face of increased imports
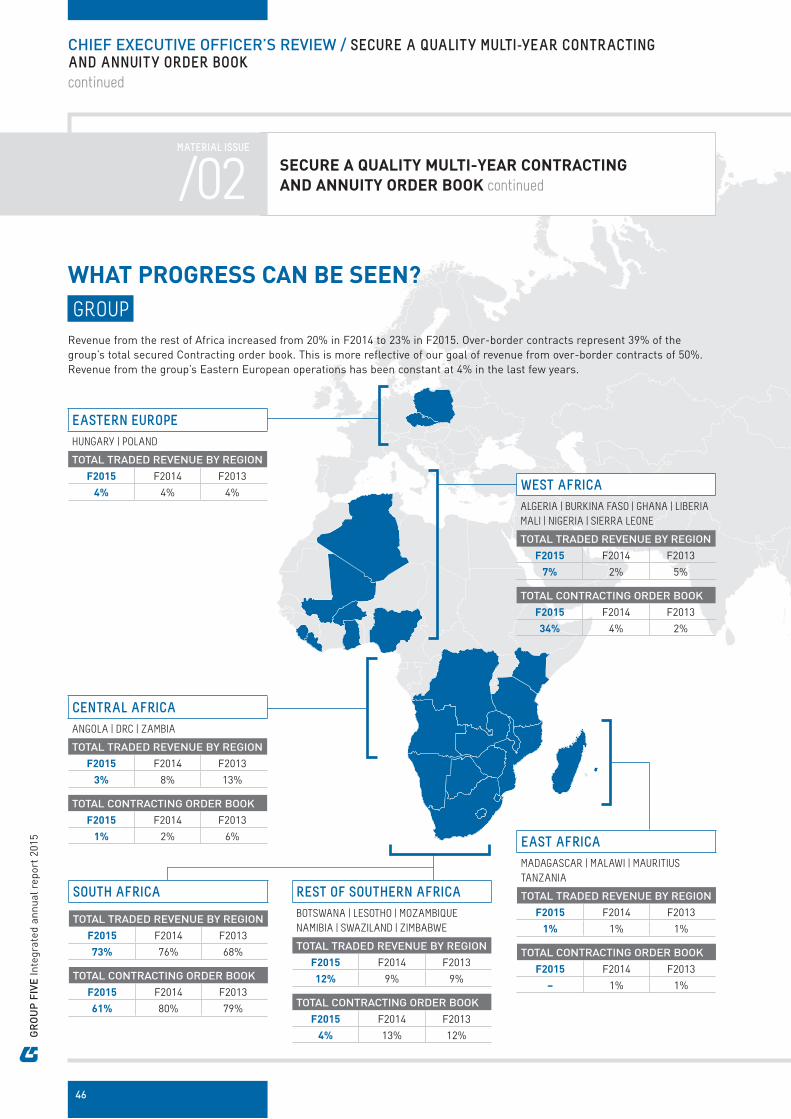
GR
OU
P F
IVE
Inte
grat
ed a
nnua
l rep
ort
2015
46
SECURE A QUALITY MULTI-YEAR CONTRACTING
AND ANNUITY ORDER BOOK continued/02MATERIAL ISSUE
CHIEF EXECUTIVE OFFICER’S REVIEW / SECURE A QUALITY MULTI-YEAR CONTRACTING AND ANNUITY ORDER BOOK
continued
WHAT PROGRESS CAN BE SEEN?
GROUP
WEST AFRICA
ALGERIA | BURKINA FASO | GHANA | LIBERIA
MALI | NIGERIA | SIERRA LEONE
TOTAL TRADED REVENUE BY REGION
F2015 F2014 F2013
7% 2% 5%
TOTAL CONTRACTING ORDER BOOK
F2015 F2014 F2013
34% 4% 2%
EASTERN EUROPE
HUNGARY | POLAND
TOTAL TRADED REVENUE BY REGION
F2015 F2014 F2013
4% 4% 4%
SOUTH AFRICA
TOTAL TRADED REVENUE BY REGION
F2015 F2014 F2013
73% 76% 68%
TOTAL CONTRACTING ORDER BOOK
F2015 F2014 F2013
61% 80% 79%
REST OF SOUTHERN AFRICA
BOTSWANA | LESOTHO | MOZAMBIQUE
NAMIBIA | SWAZILAND | ZIMBABWE
TOTAL TRADED REVENUE BY REGION
F2015 F2014 F2013
12% 9% 9%
TOTAL CONTRACTING ORDER BOOK
F2015 F2014 F2013
4% 13% 12%
CENTRAL AFRICA
ANGOLA | DRC | ZAMBIA
TOTAL TRADED REVENUE BY REGION
F2015 F2014 F2013
3% 8% 13%
TOTAL CONTRACTING ORDER BOOK
F2015 F2014 F2013
1% 2% 6% EAST AFRICA
MADAGASCAR | MALAWI | MAURITIUS
TANZANIA
TOTAL TRADED REVENUE BY REGION
F2015 F2014 F2013
1% 1% 1%
TOTAL CONTRACTING ORDER BOOK
F2015 F2014 F2013
– 1% 1%
Revenue from the rest of Africa increased from 20% in F2014 to 23% in F2015. Over-border contracts represent 39% of the group’s total secured Contracting order book. This is more reflective of our goal of revenue from over-border contracts of 50%. Revenue from the group’s Eastern European operations has been constant at 4% in the last few years.

47
SECURED OPERATIONS AND MAINTENANCE ORDER BOOK – ANNUITY INCOME
R million
Actual revenue Order book
F2013 F2014 F2015 F2016Three-year
to F2019Total
secured*
Transport 654 834 892 835 2 022 4 460
Industrial, oil and gas 59 224 157 71 – 71
Power – – 24 42 105 156
Total 713 1 058 1 073 948 2 127 4 687
* Secured Operations & Maintenance order book is valued using real cash flows (excluding escalation clauses) to first review date.
The group has R4,7 billion in secured operations and maintenance contracts. This provides solid annuity revenue and income in line with the group’s stated strategy. The R4,7 billion represents the value to first review date only, which represents a conservative amount on what relates to multi-year contracts.
ENGINEERING & CONSTRUCTION
Mining Industrial Power Oil and gas Water Real estate Transport
6
36
109
19
20
F2015
5
31
179
1
18
19 5
30
25
15
4
8
13
TRADED CONTRACTING REVENUE BY SECTOR (%)
F2014 F2013
TOTAL CONTRACTING ORDER BOOK BY SECTOR (%)
11
34
76
40
2
F2015
44
10101
15
127
34
10111
22
15
F2014 F2013
Mining Industrial Power Oil and gas Water Real estate Transport
8
The group has a spread of traded revenue and Contracting order book within its seven sectors of focus. Over the last three years, real estate continued to be significant for the group, with an increase in power. In line with market conditions, opportunities from the mining sector reduced.

GR
OU
P F
IVE
Inte
grat
ed a
nnua
l rep
ort
2015
48
Opportunities in the short to medium term favour the African mining, power and transport sectors, although we see an
improvement in
opportunities within the oil and gas sector.
The pipeline guides to a more over-border Contracting order book in future years, with 59% of opportunities listed being outside of South Africa.
Total opportunities at 30 June 2015
R225 billionTotal pre-tender opportunities
at 30 June 2015
R74 billion Cost plus Design and build EPC^ Labour only
Lump sum Re-measurable
2
56
2 7
33JUNE2015
83
5 45
3
JUNE2014
TOTAL CONTRACTING ORDER BOOK (%)
MULTI-YEAR OPPORTUNITY PIPELINE
%June
2015
June2014
June2013
Mining 16 25 24
Industrial 2 2 2
Power 13 19 20
Oil and gas 13 13 3
Water 9 5 10
Real estate 4 7 12
Transport 43 29 29
MULTI-YEAR OPPORTUNITY PIPELINE
Opportunities in the short to medium term favour a more balanced geographic mix in both South Africa and the rest of Africa.
Rest of Africa Local
at 30 June 2015 Total Private Public Total Private Public
Total Rbn 132 99 33 93 43 50
% of total pipeline 59 44 15 41 19 22
Pre-tender and tender Rbn 49 38 11 25 20 5
% of pre-tender and tender 66 51 15 34 27 7
ENGINEERING & CONSTRUCTION continued
SECURE A QUALITY MULTI-YEAR CONTRACTING
AND ANNUITY ORDER BOOK continued/02MATERIAL ISSUE
CHIEF EXECUTIVE OFFICER’S REVIEW / SECURE A QUALITY MULTI-YEAR CONTRACTING AND ANNUITY ORDER BOOK
continued
^ Engineer, procure and construct.
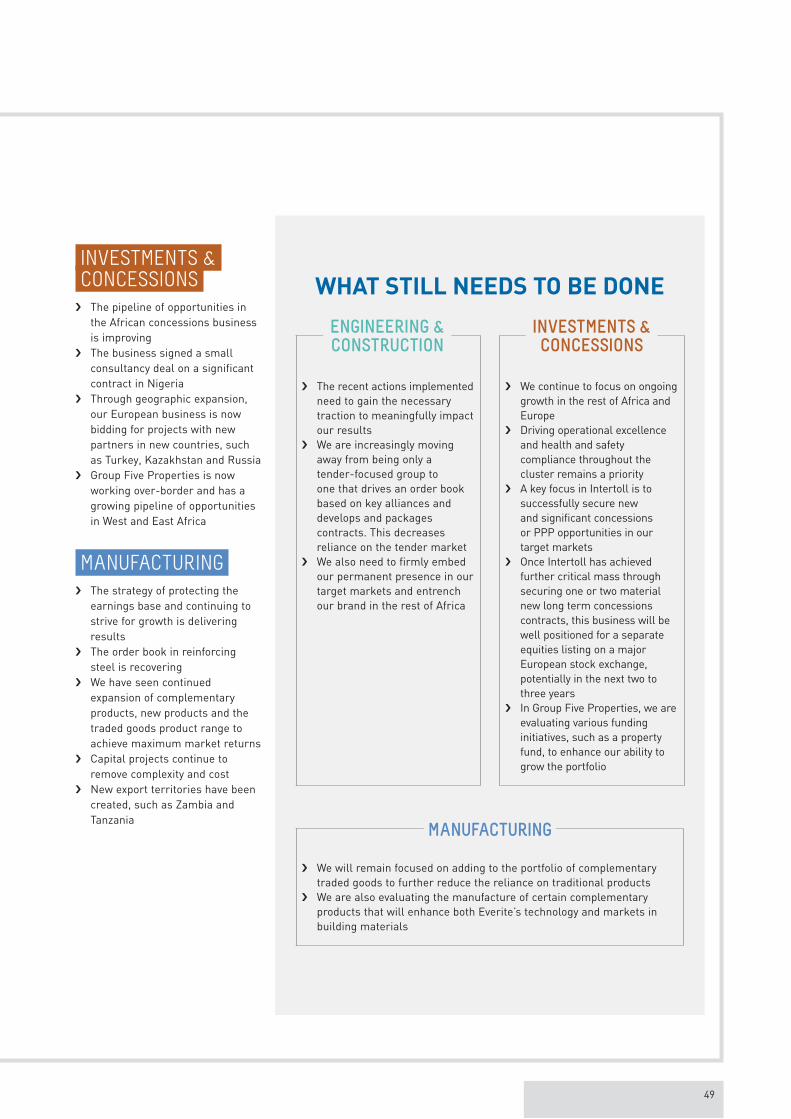
49
INVESTMENTS & CONCESSIONS
The pipeline of opportunities in the African concessions business is improving
The business signed a small consultancy deal on a significant contract in Nigeria
Through geographic expansion, our European business is now bidding for projects with new partners in new countries, such as Turkey, Kazakhstan and Russia
Group Five Properties is now working over-border and has a growing pipeline of opportunities in West and East Africa
MANUFACTURING The strategy of protecting the
earnings base and continuing to strive for growth is delivering results
The order book in reinforcing steel is recovering
We have seen continued expansion of complementary products, new products and the traded goods product range to achieve maximum market returns
Capital projects continue to remove complexity and cost
New export territories have been created, such as Zambia and Tanzania
WHAT STILL NEEDS TO BE DONE
The recent actions implemented need to gain the necessary traction to meaningfully impact our results
We are increasingly moving away from being only a tender-focused group to one that drives an order book based on key alliances and develops and packages contracts. This decreases reliance on the tender market
We also need to firmly embed our permanent presence in our target markets and entrench our brand in the rest of Africa
We continue to focus on ongoing growth in the rest of Africa and Europe
Driving operational excellence and health and safety compliance throughout the cluster remains a priority
A key focus in Intertoll is to successfully secure new and significant concessions or PPP opportunities in our target markets
Once Intertoll has achieved further critical mass through securing one or two material new long term concessions contracts, this business will be well positioned for a separate equities listing on a major European stock exchange, potentially in the next two to three years
In Group Five Properties, we are evaluating various funding initiatives, such as a property fund, to enhance our ability to grow the portfolio
We will remain focused on adding to the portfolio of complementary traded goods to further reduce the reliance on traditional products
We are also evaluating the manufacture of certain complementary products that will enhance both Everite’s technology and markets in building materials
ENGINEERING & CONSTRUCTION
INVESTMENTS & CONCESSIONS
MANUFACTURING
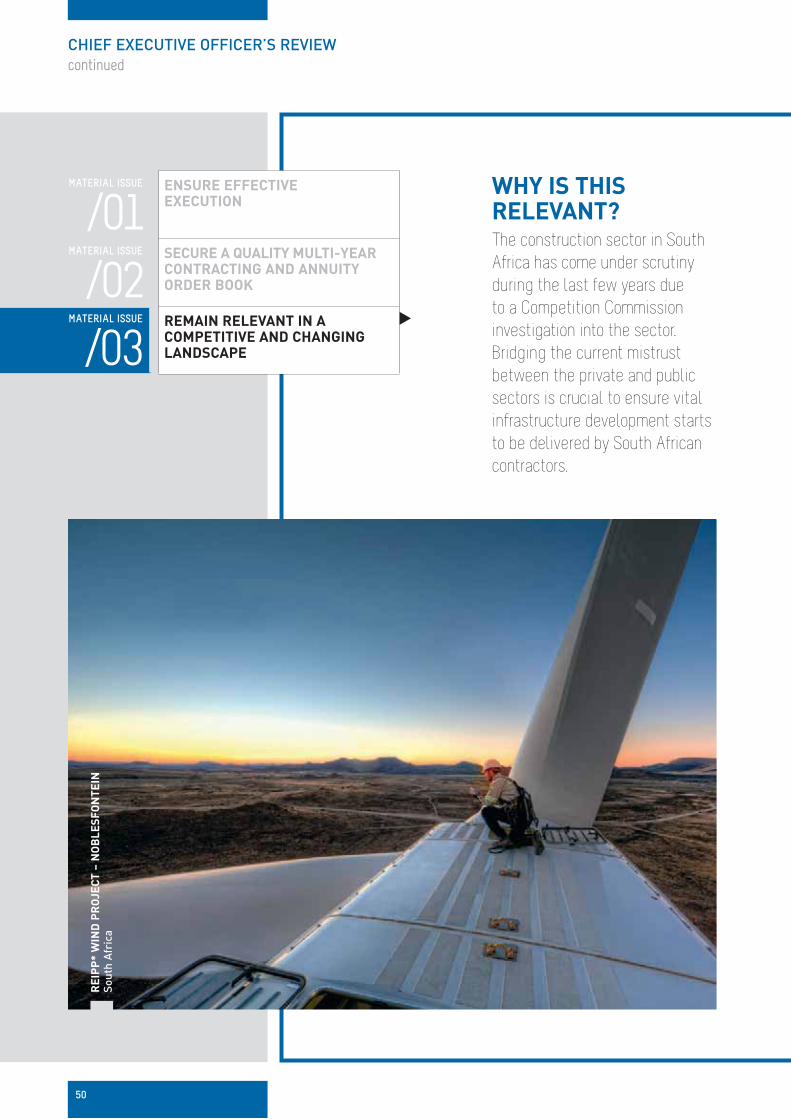
50
CHIEF EXECUTIVE OFFICER’S REVIEW
continued
WHY IS THIS RELEVANT? The construction sector in South
Africa has come under scrutiny
during the last few years due
to a Competition Commission
investigation into the sector.
Bridging the current mistrust
between the private and public
sectors is crucial to ensure vital
infrastructure development starts
to be delivered by South African
contractors.
ENSURE EFFECTIVE EXECUTION
SECURE A QUALITY MULTI-YEAR CONTRACTING AND ANNUITY ORDER BOOK
REMAIN RELEVANT IN A COMPETITIVE AND CHANGING LANDSCAPE
/01MATERIAL ISSUE
/03MATERIAL ISSUE
/02MATERIAL ISSUE
RE
IPP
* W
IND
PR
OJ
EC
T –
NO
BL
ES
FO
NT
EIN
So
uth
Afr
ica
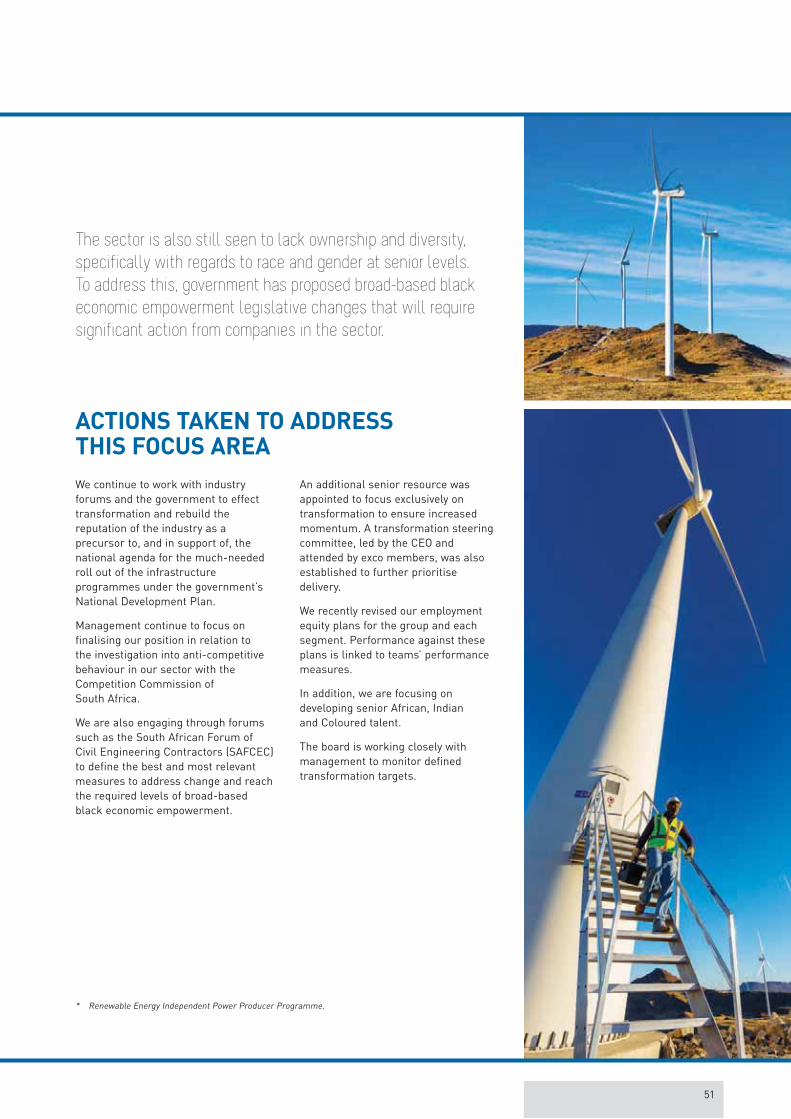
51
We continue to work with industry forums and the government to effect transformation and rebuild the reputation of the industry as a precursor to, and in support of, the national agenda for the much-needed roll out of the infrastructure programmes under the government’s National Development Plan.
Management continue to focus on finalising our position in relation to the investigation into anti-competitive behaviour in our sector with the Competition Commission of South Africa.
We are also engaging through forums such as the South African Forum of Civil Engineering Contractors (SAFCEC) to define the best and most relevant measures to address change and reach the required levels of broad-based black economic empowerment.
An additional senior resource was appointed to focus exclusively on transformation to ensure increased momentum. A transformation steering committee, led by the CEO and attended by exco members, was also established to further prioritise delivery.
We recently revised our employment equity plans for the group and each segment. Performance against these plans is linked to teams’ performance measures.
In addition, we are focusing on developing senior African, Indian and Coloured talent.
The board is working closely with management to monitor defined transformation targets.
ACTIONS TAKEN TO ADDRESS THIS FOCUS AREA
The sector is also still seen to lack ownership and diversity,
specifically with regards to race and gender at senior levels.
To address this, government has proposed broad-based black
economic empowerment legislative changes that will require
significant action from companies in the sector.
* Renewable Energy Independent Power Producer Programme.

GR
OU
P F
IVE
Inte
grat
ed a
nnua
l rep
ort
2015
52
WHAT STILL NEEDS TO BE DONE
As outlined above, we
will continue to work
with the Competition
Commission and Tribunal
to reach finalisation
on anti-competitive
investigations.
While the industry continues to negotiate the requirements for the construction sector scorecard, we have modelled our score on the new generic scorecard. We anticipate that by focusing on further initiatives in the areas of management control, enterprise development and employment equity we will ensure the best possible outcome for the group, irrespective of whether the sector ultimately adopts the generic scorecard or a construction sector-specific scorecard.
Our newly constituted transformation committee will ensure delivery against targets. In line with our renewed culture of accountability, we will increasingly hold teams responsible for meeting agreed targets.
WHAT PROGRESS CAN BE SEEN?
African, Indian and Coloured junior management representation
improved from 76% to 78%, middle management from 29% to
30%, senior management from 25% to 28% and executive
management from 11% to 25%.
We maintained our BBBEE Level 2 rating in February 2015.
REMAIN RELEVANT IN A COMPETITIVE
AND CHANGING LANDSCAPE continued/03MATERIAL ISSUE
CONSTRUCTION SECTOR SCORECARD COMPARATIVE ANALYSIS
Group Five has a Level 2 BBBEE rating. We continue to score well in the ownership, skills development, enterprise development and socio-economic development elements of the scorecard by scoring equal to other leading companies in the sector. Our continued focus on management control and employment equity will yield our desired results in the medium term.
Scorecard element Weighting Group FiveLowest
in sector#Highest
in sector#
Ownership 25 25 24 25
Management control 10 4.42 4.42 9.66
Employment equity 10 3.96 3.26 4.93
Skills development 15 14.73 10.78 14.73
Preferential procurement 20 19.1 19.1 20
Enterprise development 15 15 13.42 15
Socio-economic development 5 5 2.31 5
# 2014 comparison, as 2015 audits have not yet been verified.
CHIEF EXECUTIVE OFFICER’S REVIEW / REMAIN RELEVANT IN A COMPETITIVE AND CHANGING LANDSCAPE
continued
To date, the group has not reached settlement with the Commission on two contracts where we were implicated for anti-competitive behaviour due to no evidence being presented by the Commission on these matters.
Two other matters are no longer being investigated by the Commission due to lack of evidence on their part.
PAGE As outlined on pages 30 and 77 to 78, we welcome a hearing by the Tribunal to bring finality on this matter to stakeholders.

53
LOOKING FORWARD
We have proven sector credentials in power, infrastructure, resources and real estate, supported by strong project development and execution capability, execution ability in building, housing, civil engineering, roads and structural, mechanical, electrical, instrumentation and piping (SMEIP), as well as operating expertise in the roads and energy markets. This places us well to target relevant growth markets and contract opportunities in chosen geographies, in line with available capacity and resources.
Despite current challenges
within our home market of
South Africa, we remain highly supportive of this market and its potential
over the medium and
longer term.
At the same time, we are aggressively pursuing other markets across the rest of Africa and in Eastern Europe that are providing more immediate prospects for growth.
The distinctiveness of our skills set and strength of our Africa-to-Africa offering bodes well for new contract awards both in the short and longer term.
The corporate restructuring implemented during this financial year has further enhanced the group’s
operating platform, which positions us better for growth and higher quality of execution and client delivery. Our continuously improving approach to large multi-disciplinary contract execution has provided us with the confidence and competitive advantage to grow our participation in these markets in future, whilst maintaining our prudent approach to risk.
We continue to leverage off our concessions and development operating platform in both Africa and Eastern Europe to position the group to secure new projects that provide investment, construction and long term operating opportunities, specifically in the transport, energy and real estate markets. This business model is proven for the group and remains a strategic priority. Due to the long-cycle nature of the projects targeted, this strategy provides the group with quality growth prospects over the medium to longer term.
The solidly performing Manufacturing cluster, anchored by the Everite business and supported by strategic steel supply, will selectively target aligned opportunities in light-weight dry building materials and steel supply to secure future expansion. Concurrently, a strong culture of driving operational efficiencies continues in this cluster to ensure constant alignment to the competitive pressures of international manufacturing.
Our dedicated and passionate people are core to our current and future success. Our focus on the holistic wellbeing of our employees, the adoption of a strong set of values and a culture of delivery, operating through an aligned business platform, positions us favourably in the value offering we present to our clients.
During the year, we also
continued to focus on
driving a culture of
responsibility and living
the group’s embedded
values. We are striving to
create a more cohesive team
that is measured through
the delivery of strategy and
remunerated against not only
operational measures, but
also on performance against
our key values.
OUR CORPORATE
VALUES ARE:
People Excellence Transformation Client focus Integrity Innovation Performance
Our focus on safety and quality, as well as operating responsibly in the communities where we operate, are key to our sustainability and ensuring an equitable balance between stakeholder interests and delivering strong value creation for our shareholders over the long term.
APPRECIATION I am deeply honoured to have been selected by the board to lead Group Five, now in its 41st year as a listed company.
During my first seven months at the helm I have been strongly encouraged and energised by the level of commitment from the senior management team in the face of numerous challenges, whilst being buoyed by our collective enthusiasm for achievable new opportunities. I thank my team and everyone at Group Five who have demonstrated such huge commitment and passion for the wellbeing and future of our great company.
Eric Vemer CHIEF EXECUTIVE OFFICER
Group Five is uniquely positioned as a leading South African-
based project development, construction, concessions and
manufacturing group focused on operating effectively in
Africa. Additionally, we are well placed in Eastern Europe
through our specialist toll road operating company Intertoll.

GR
OU
P F
IVE
Inte
grat
ed a
nnua
l rep
ort
2015
54
GROUP RESULTS Group statistics for the year ended 30 June 2015:
F2015 F2014**
Revenue – R million 13 875 15 360
Operating profit – R million 366 643
Earnings per share – cents 222 401
Fully diluted headline earnings per share – cents 204 399
Dividends per share – cents 55 100
Cash – R million 3 390 2 912
Net asset value – R per share 28,96 25,99
Net debt to equity ratio – –
Return on equity – % 8.1 16.8
Total order book* – R million 18 834 17 149
* Total order book is the sum of the group’s Contracting order book and Operations & Maintenance order book. ** During the year, the group transferred the remaining business within its discontinued cluster of Construction
Materials into continuing operations. This operation now trades within the Manufacturing cluster. In terms of IFRS 5 – Non-current assets held for sale and discontinued operations, the group is required to restate its prior year reported income statement and statement of cash flow numbers to reflect the result of the change.
CH
IEF
FIN
AN
CIA
LO
FF
ICE
R’S
RE
VIE
W
INTRODUCTIONWhilst a weak South African market exacerbated the poor performance, management acknowledge that a large part of the under-delivery was due to internal execution issues specifically in the Civil Engineering segment. Management acted promptly in restructuring and rightsizing this segment.
The business is now more competitively placed to secure a reasonable share of available work, as well as being sized appropriately to the anticipated future market demand. The benefits of these actions will start to be felt from F2016.
Cristina Freitas Teixeira CHIEF FINANCIAL OFFICER
This review should be read in conjunction with the audited annual financial statements contained in the online section of the integrated annual report.
WEB Refer to the online section of the integrated annual report at www.groupfive.co.za.
The group delivered a
disappointing result in F2015
due to under-performance in
the Engineering & Construction
cluster.
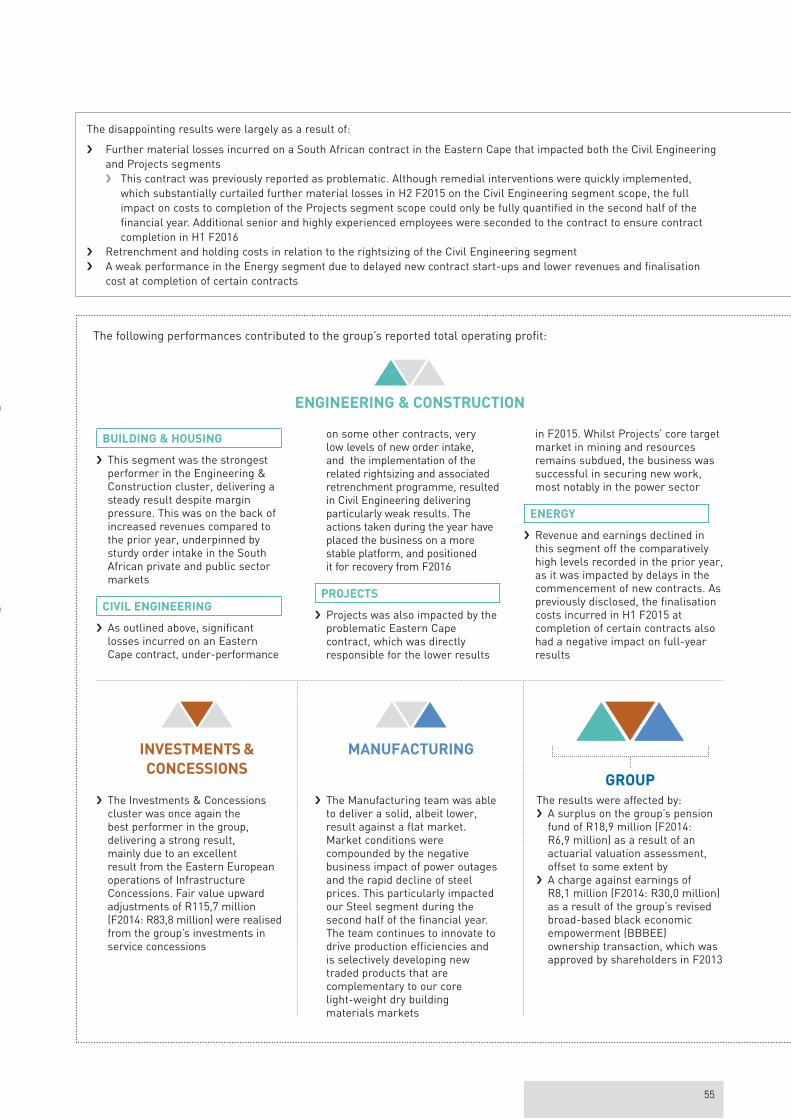
55
The following performances contributed to the group’s reported total operating profit:
MANUFACTURING
The Manufacturing team was able to deliver a solid, albeit lower, result against a flat market. Market conditions were compounded by the negative business impact of power outages and the rapid decline of steel prices. This particularly impacted our Steel segment during the second half of the financial year. The team continues to innovate to drive production efficiencies and is selectively developing new traded products that are complementary to our core light-weight dry building materials markets
INVESTMENTS &
CONCESSIONS
The Investments & Concessions cluster was once again the best performer in the group, delivering a strong result, mainly due to an excellent result from the Eastern European operations of Infrastructure Concessions. Fair value upward adjustments of R115,7 million (F2014: R83,8 million) were realised from the group’s investments in service concessions
The results were affected by: A surplus on the group’s pension fund of R18,9 million (F2014: R6,9 million) as a result of an actuarial valuation assessment, offset to some extent by
A charge against earnings of R8,1 million (F2014: R30,0 million) as a result of the group’s revised broad-based black economic empowerment (BBBEE) ownership transaction, which was approved by shareholders in F2013
GROUP
ENGINEERING & CONSTRUCTION
BUILDING & HOUSING
This segment was the strongest performer in the Engineering & Construction cluster, delivering a steady result despite margin pressure. This was on the back of increased revenues compared to the prior year, underpinned by sturdy order intake in the South African private and public sector markets
CIVIL ENGINEERING
As outlined above, significant losses incurred on an Eastern Cape contract, under-performance
on some other contracts, very low levels of new order intake, and the implementation of the related rightsizing and associated retrenchment programme, resulted in Civil Engineering delivering particularly weak results. The actions taken during the year have placed the business on a more stable platform, and positioned it for recovery from F2016
PROJECTS
Projects was also impacted by the problematic Eastern Cape contract, which was directly responsible for the lower results
in F2015. Whilst Projects’ core target market in mining and resources remains subdued, the business was successful in securing new work, most notably in the power sector
ENERGY
Revenue and earnings declined in this segment off the comparatively high levels recorded in the prior year, as it was impacted by delays in the commencement of new contracts. As previously disclosed, the finalisation costs incurred in H1 F2015 at completion of certain contracts also had a negative impact on full-year results
The disappointing results were largely as a result of:
Further material losses incurred on a South African contract in the Eastern Cape that impacted both the Civil Engineering and Projects segments
This contract was previously reported as problematic. Although remedial interventions were quickly implemented, which substantially curtailed further material losses in H2 F2015 on the Civil Engineering segment scope, the full impact on costs to completion of the Projects segment scope could only be fully quantified in the second half of the financial year. Additional senior and highly experienced employees were seconded to the contract to ensure contract completion in H1 F2016
Retrenchment and holding costs in relation to the rightsizing of the Civil Engineering segment A weak performance in the Energy segment due to delayed new contract start-ups and lower revenues and finalisation
cost at completion of certain contracts
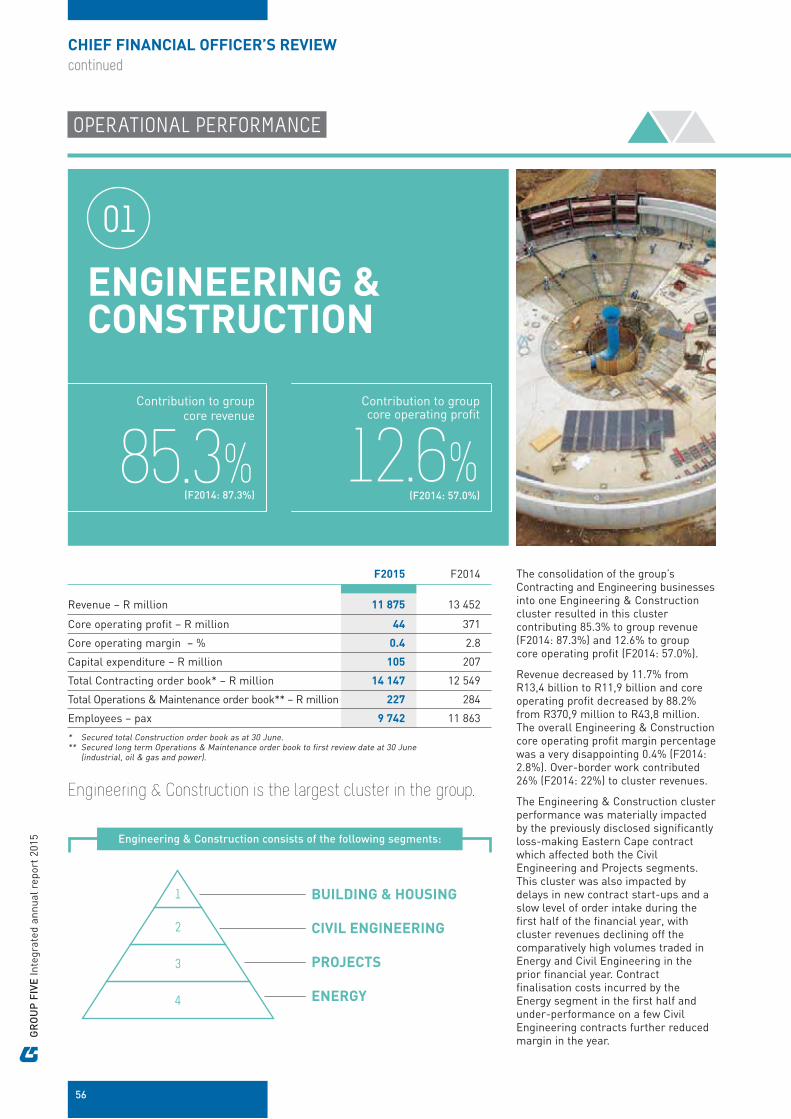
GR
OU
P F
IVE
Inte
grat
ed a
nnua
l rep
ort
2015
56
OPERATIONAL PERFORMANCE
CHIEF FINANCIAL OFFICER’S REVIEW
continued
Contribution to group core operating profit
12.6%(F2014: 57.0%)
Contribution to group core revenue
85.3%(F2014: 87.3%)
F2015 F2014
Revenue – R million 11 875 13 452
Core operating profit – R million 44 371
Core operating margin – % 0.4 2.8
Capital expenditure – R million 105 207
Total Contracting order book* – R million 14 147 12 549
Total Operations & Maintenance order book** – R million 227 284
Employees – pax 9 742 11 863
* Secured total Construction order book as at 30 June.** Secured long term Operations & Maintenance order book to first review date at 30 June
(industrial, oil & gas and power).
ENGINEERING & CONSTRUCTION
01
Engineering & Construction is the largest cluster in the group.
The consolidation of the group’s Contracting and Engineering businesses into one Engineering & Construction cluster resulted in this cluster contributing 85.3% to group revenue (F2014: 87.3%) and 12.6% to group core operating profit (F2014: 57.0%).
Revenue decreased by 11.7% from R13,4 billion to R11,9 billion and core operating profit decreased by 88.2% from R370,9 million to R43,8 million. The overall Engineering & Construction core operating profit margin percentage was a very disappointing 0.4% (F2014: 2.8%). Over-border work contributed 26% (F2014: 22%) to cluster revenues.
The Engineering & Construction cluster performance was materially impacted by the previously disclosed significantly loss-making Eastern Cape contract which affected both the Civil Engineering and Projects segments. This cluster was also impacted by delays in new contract start-ups and a slow level of order intake during the first half of the financial year, with cluster revenues declining off the comparatively high volumes traded in Energy and Civil Engineering in the prior financial year. Contract finalisation costs incurred by the Energy segment in the first half and under-performance on a few Civil Engineering contracts further reduced margin in the year.
Engineering & Construction consists of the following segments:
BUILDING & HOUSING
CIVIL ENGINEERING
PROJECTS
ENERGY
1
2
3
4

57
Contribution to group core revenue
35.1%(F2014: 28.7%)
Contribution to group core operating profit
26.2%(F2014: 14.0%)
F2015 F2014
Revenue – R million 4 886 4 430
Core operating profit – R million 91 91
Core operating margin – % 1.9 2.0
Capital expenditure – R million 8 22
Total Contracting order book* – R million 6 094 6 833
Employees – pax 2 501 2 477
* Secured total Contracting order book as at 30 June.
BU
ILD
ING
&
HO
US
ING
BUILDING & HOUSING CONSISTS OF:
BUILDING HOUSING
Building is one of South Africa’s largest real estate Contracting companies. It constructs a range of large structures, such as government buildings, public use infrastructure, healthcare and educational facilities, targeted multi-storey mixed-use complexes, commercial buildings, hotels and retail shopping centres
Housing constructs large-scale residential contracts for the mining and industrial sectors, private/public sector housing developments and low-cost and affordable housing schemes
GJ
CR
OO
KE
S H
OS
PIT
AL
So
uth
Afr
ica

GR
OU
P F
IVE
Inte
grat
ed a
nnua
l rep
ort
2015
58
CHIEF FINANCIAL OFFICER’S REVIEW / OPERATIONAL PERFORMANCE
continued
ENGINEERING & CONSTRUCTION BUILDING & HOUSING continued
YEAR UNDER REVIEW
TRADED REVENUE F2015
Private versus public (%)
Private 57
Public 43
57
F2015
43F2015
5
Mining –
Industrial –
Power 2
Oil and gas 5
Water 7
Real estate – Building 67
Real estate – Housing 11
Transport 8
By sector (%)
67
F2015
11
87
2
Cost plus 6
Design and build 3
EPC –
Labour only –
Lump sum 1
Re-measurable 90
By contract type (%)
90
F2015
6 3 1
Building & Housing revenue increased by 10.3% from R4,4 billion
(98% local) to R4,9 billion (100% local). The segment reported a largely
unchanged core operating profit from the prior comparable period,
increasing from R90,8 million to R91,4 million. This resulted in the overall
core operating margin percentage decreasing slightly from 2.0% to 1.9%.
New contract activity in the Building market continues to be relatively buoyant, with this segment realising a number of material new contract awards during the year from both the private and public sectors and growing its order book at year end.
The group has observed a decline in the South African mine housing market, in tandem with reducing commodity prices and mining markets. There are nevertheless signs of improving roll out of South African social housing contracts, with the group commencing new work in this area in the second half of the financial year.
FINANCIAL PERFORMANCE
REVENUE (R’000)
R4 885 951F2014 = R4 430 513
CORE OPERATING MARGIN (%)
1.9F2014 = 2.0

59
Private versus public (%)
Private 49
Public 51
49F201551
17
Mining –
Industrial –
Power –
Oil and gas –
Water 17
Real estate – Building 67
Real estate – Housing 9
Transport 7
By sector (%)
67
F2015
9
7
Cost plus –
Design and build 16
EPC –
Labour only –
Lump sum 4
Re-measurable 80
By contract type (%)
16
80
F2015
4
LOOKING FORWARD
SECURED CONTRACTING ORDER BOOK
The order book remains at a
high level.
The group’s backlog of social housing contracts where it is the preferred bidder remains robust, but not reported within the group’s secured Contracting order book due to ongoing delays experienced by local and provincial government in contract implementation.
Concurrently, enquiries for integrated housing and building contracts in the group’s target African geographies is increasing. Whilst cognisant of current trading capacity constraints, these contracts provide the group with attractive longer term prospects.
The secured one-year order book stands at R4,4 billion (100% local) (H1 F2015: R4,6 billion and 100% local) (F2014: R4,7 billion and 100% local). The total secured order book stands at R6,1 billion (100% local) (H1 F2015: R5,4 billion and 100% local) (F2014: R6,8 billion and 100% local).
DS
TV
HE
AD
OF
FIC
E
So
uth
Afr
ica

GR
OU
P F
IVE
Inte
grat
ed a
nnua
l rep
ort
2015
60
Contribution to group core revenue
19.1%(F2014: 24.4%)
Contribution to group core operating profit
loss(F2014: 10.2%)
CHIEF FINANCIAL OFFICER’S REVIEW / OPERATIONAL PERFORMANCE
continued
F2015 F2014
Revenue – R million 2 666 3 760
Core operating (loss)/profit – R million (96) 67
Core operating margin – % (3.6) 1.8
Capital expenditure – R million 52 144
Total Contracting order book* – R million 3 293 2 442
Employees – pax 2 352 4 824
* Secured total Contracting order book as at 30 June.
CIV
IL
EN
GIN
EE
RIN
G
CIVIL ENGINEERING UNDERTAKES A BROAD RANGE OF CONTRACTS FOR BOTH PRIVATE AND PUBLIC CLIENTS IN:
ENGINEERING & CONSTRUCTION
Heavy civil works
Large concrete structures
Infrastructure works:RoadsRailEarthworksMarine civils Pipelines
SP
RIN
G G
RO
VE
DA
M
So
uth
Afr
ica
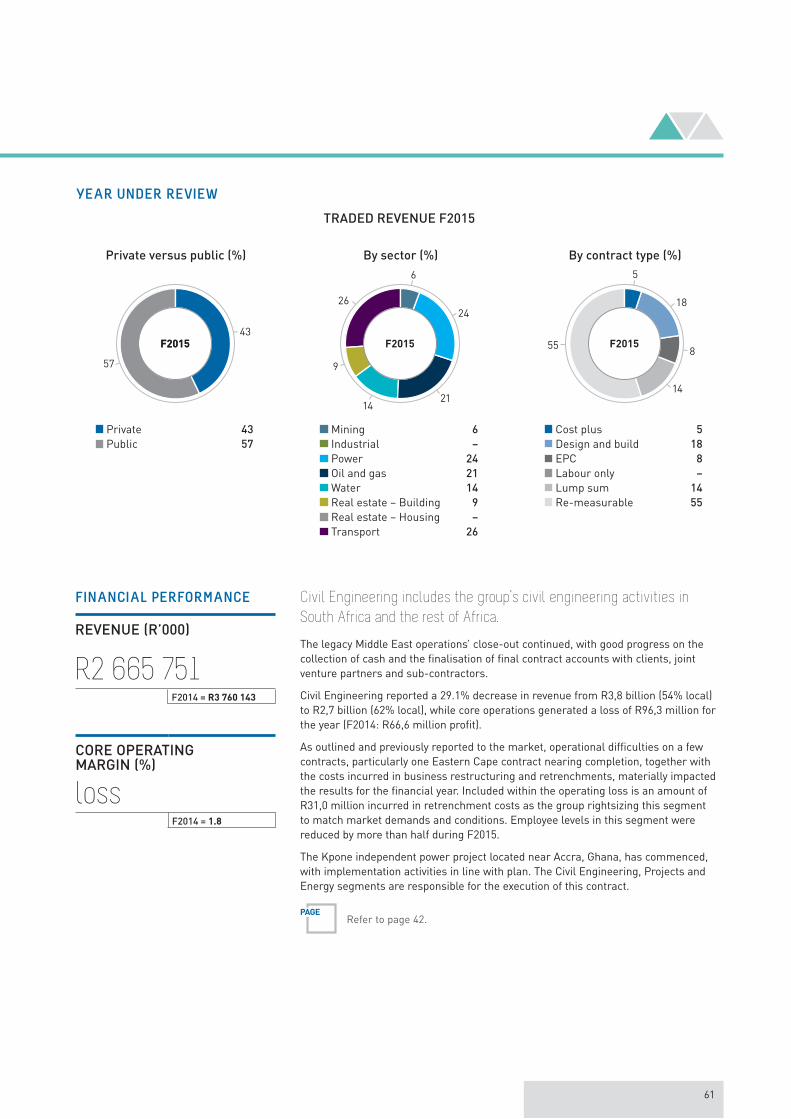
61
YEAR UNDER REVIEW
TRADED REVENUE F2015
Private versus public (%)
Private 43
Public 57
43F2015
57
F2015
21
24
Mining 6
Industrial –
Power 24
Oil and gas 21
Water 14
Real estate – Building 9
Real estate – Housing –
Transport 26
By sector (%)
14
F2015
9
26
6
Cost plus 5
Design and build 18
EPC 8
Labour only –
Lump sum 14
Re-measurable 55
By contract type (%)
18
55 F2015
5
14
8
Civil Engineering includes the group’s civil engineering activities in
South Africa and the rest of Africa.
The legacy Middle East operations’ close-out continued, with good progress on the collection of cash and the finalisation of final contract accounts with clients, joint venture partners and sub-contractors.
Civil Engineering reported a 29.1% decrease in revenue from R3,8 billion (54% local) to R2,7 billion (62% local), while core operations generated a loss of R96,3 million for the year (F2014: R66,6 million profit).
As outlined and previously reported to the market, operational difficulties on a few contracts, particularly one Eastern Cape contract nearing completion, together with the costs incurred in business restructuring and retrenchments, materially impacted the results for the financial year. Included within the operating loss is an amount of R31,0 million incurred in retrenchment costs as the group rightsizing this segment to match market demands and conditions. Employee levels in this segment were reduced by more than half during F2015.
The Kpone independent power project located near Accra, Ghana, has commenced, with implementation activities in line with plan. The Civil Engineering, Projects and Energy segments are responsible for the execution of this contract.
PAGERefer to page 42.
FINANCIAL PERFORMANCE
REVENUE (R’000)
R2 665 751F2014 = R3 760 143
CORE OPERATING MARGIN (%)
lossF2014 = 1.8

62
CHIEF FINANCIAL OFFICER’S REVIEW / OPERATIONAL PERFORMANCE
continued
ENGINEERING & CONSTRUCTION CIVIL ENGINEERING continued
Private versus public (%)
Private 61
Public 39
61
F2015
39
60
Mining 6
Industrial –
Power 60
Oil and gas 1
Water 17
Real estate – Building 4
Real estate – Housing –
Transport 12
By sector (%)
17 F2015
12 6
1
4
1
Cost plus 1
Design and build 1
EPC 46
Labour only 1
Lump sum –
Re-measurable 51
By contract type (%)
1
51 F2015
1
46
LOOKING FORWARD
During the second half of the financial year, an improvement in the volume of tendered work in the roads and earthworks sector in South Africa was experienced, although these bids remain highly competitive. Civil Engineering’s markets continue to be challenging, with selected opportunities aligned to our priority sector of energy currently being the focus. The level of early-stage tender enquiries for this segment has started to increase, indicating better prospects in approximately 18 months.
Civil Engineering’s secured one-year order book stands at R2,1 billion (58% local) (H1 F2015: R2,0 billion and 56% local) (F2014: R1,8 billion and 65% local). The full order book is at R3,3 billion (53% local) (H1 F2015: R3,1 billion and 49% local) (F2014: R2,4 billion and 75% local).
SECURED CONTRACTING ORDER BOOK
KU
SIL
E P
OW
ER
ST
AT
ION
So
uth
Afr
ica

63
Contribution to group core revenue
15.9%(F2014: 11.3%)
Contribution to group core operating profit
5.9%(F2014: 18.4%)
F2015 F2014
Revenue – R million 2 214 1 741
Core operating profit – R million 20 120
Core operating margin – % 0.9 6.9
Capital expenditure – R million 40 19
Total Contracting order book* – R million 2 855 2 100
Employees – pax 2 773 2 372
* Secured total Contracting order book as at 30 June.
PR
OJ
EC
TS
PROJECTS IS A MULTI-DISCIPLINARY PLANT PROCESS CONSTRUCTOR WITH SKILLS IN:
It is an experienced African contractor, with a specific focus on
the mining sector.
Structural, mechanical, electrical, instrumentation and piping (SMEIP) contracts
TO
NK
OL
ILI
IRO
N O
RE
Sie
rra
Le
on
e

GR
OU
P F
IVE
Inte
grat
ed a
nnua
l rep
ort
2015
64
CHIEF FINANCIAL OFFICER’S REVIEW / OPERATIONAL PERFORMANCE
continued
ENGINEERING & CONSTRUCTION PROJECTS continued
YEAR UNDER REVIEW
TRADED REVENUE F2015
During the year, revenue increased by 27.2% from R1,7 billion (33% local) to R2,2 billion (30% local).
Core operating profit decreased by 82.9% from R120,0 million to R20,4 million. The core operating profit margin percentage decreased to 0.9% (F2014: 6.9%).
Projects’ performance in the second half of the year was impacted by the
same South African loss-making contract that affected Civil Engineering,
as well as a higher share of lower-margin South African work in the
revenue mix. Excluding this loss-making contract, this segment would
have performed in line with expectations and previous margin guidance
provided in February 2015.
The Kpone Independent power project located near Accra, Ghana, has commenced, with implementation activities in line with plan. The Civil Engineering, Projects and Energy segments are responsible for the execution of this contract.
Private versus public (%)
Private 88
Public 12
88
F2015
12
F201547
Mining 47
Industrial –
Power 35
Oil and gas 18
Water –
Real estate – Building –
Real estate – Housing –
Transport –
By sector (%)
35
F2015
18
Cost plus 16
Design and build –
EPC 17
Labour only –
Lump sum –
Re-measurable 67
By contract type (%)
67
F2015
16
17
FINANCIAL PERFORMANCE
REVENUE (R’000)
R2 213 758F2014 = R1 740 812
CORE OPERATING MARGIN (%)
0.9F2014 = 6.9

65
LOOKING FORWARD
Tendering activity in the mining sector remains very subdued, which necessitated an increased focus on securing work in the energy sector in alignment with the group’s activities in the power and oil and gas sectors. Despite the slow mining market, the segment was successful in securing a new gold mine contract in West Africa during the second half of the financial year.
The secured one-year order book stands at R2,0 billion (23% local) (H1 F2015: R2,0 billion and 17% local) (F2014: R1,7 billion and 33% local). The full secured order book stands at R2,8 billion (18% local) (H1 F2015: R2,8 billion and 12% local) (F2014: R2,1 billion and 28% local).
Private versus public (%)
Private 99
Public 1
99
F2015
1
29
Mining 29
Industrial –
Power 70
Oil and gas 1
Water –
Real estate – Building –
Real estate – Housing –
Transport –
By sector (%)
70
F2015
1
Cost plus 3
Design and build –
EPC 53
Labour only –
Lump sum –
Re-measurable 44
By contract type (%)
3
53F201544
SECURED CONTRACTING ORDER BOOK
CE
NT
RA
L A
SH
AN
TI
GO
LD
PL
AN
T
Gh
an
a
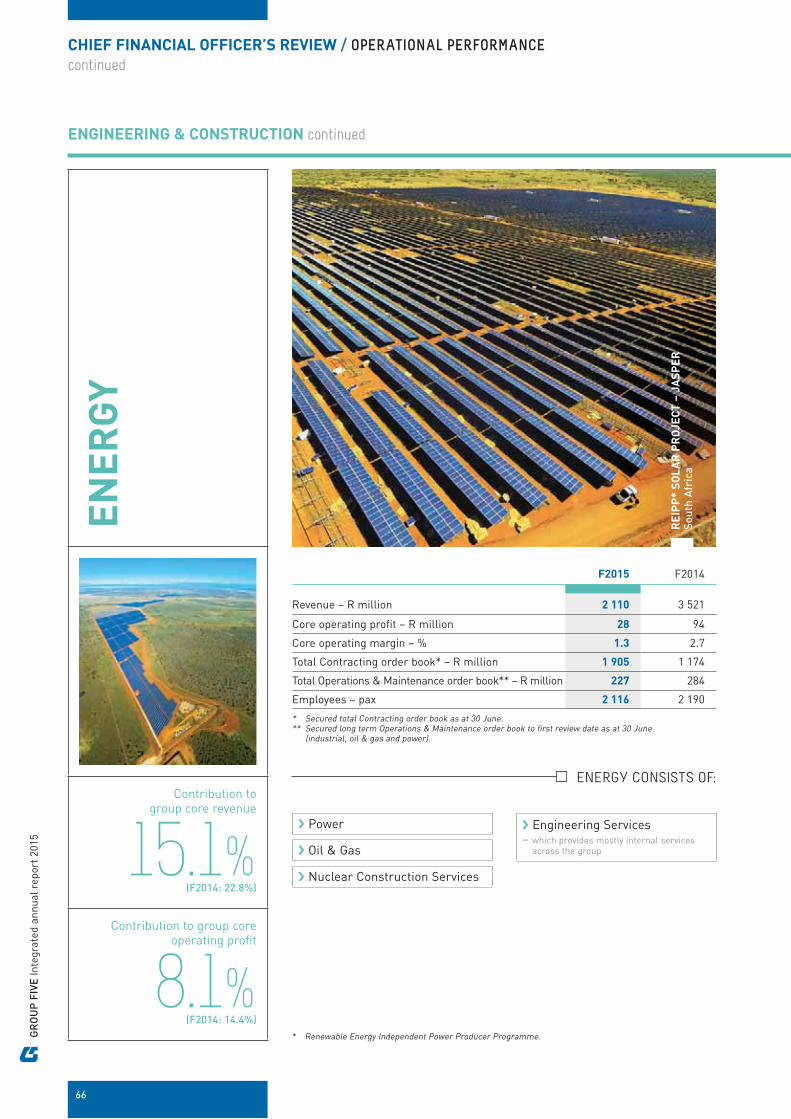
GR
OU
P F
IVE
Inte
grat
ed a
nnua
l rep
ort
2015
66
Contribution to group core revenue
15.1%(F2014: 22.8%)
Contribution to group core operating profit
8.1%(F2014: 14.4%)
F2015 F2014
Revenue – R million 2 110 3 521
Core operating profit – R million 28 94
Core operating margin – % 1.3 2.7
Total Contracting order book* – R million 1 905 1 174
Total Operations & Maintenance order book** – R million 227 284
Employees – pax 2 116 2 190
* Secured total Contracting order book as at 30 June.** Secured long term Operations & Maintenance order book to first review date as at 30 June
(industrial, oil & gas and power).
EN
ER
GY
ENERGY CONSISTS OF:
ENGINEERING & CONSTRUCTION continued
CHIEF FINANCIAL OFFICER’S REVIEW / OPERATIONAL PERFORMANCE
continued
Power
Oil & Gas
Nuclear Construction Services
Engineering Services– which provides mostly internal services
across the group
RE
IPP
* S
OL
AR
PR
OJ
EC
T –
JA
SP
ER
So
uth
Afr
ica
* Renewable Energy Independent Power Producer Programme.
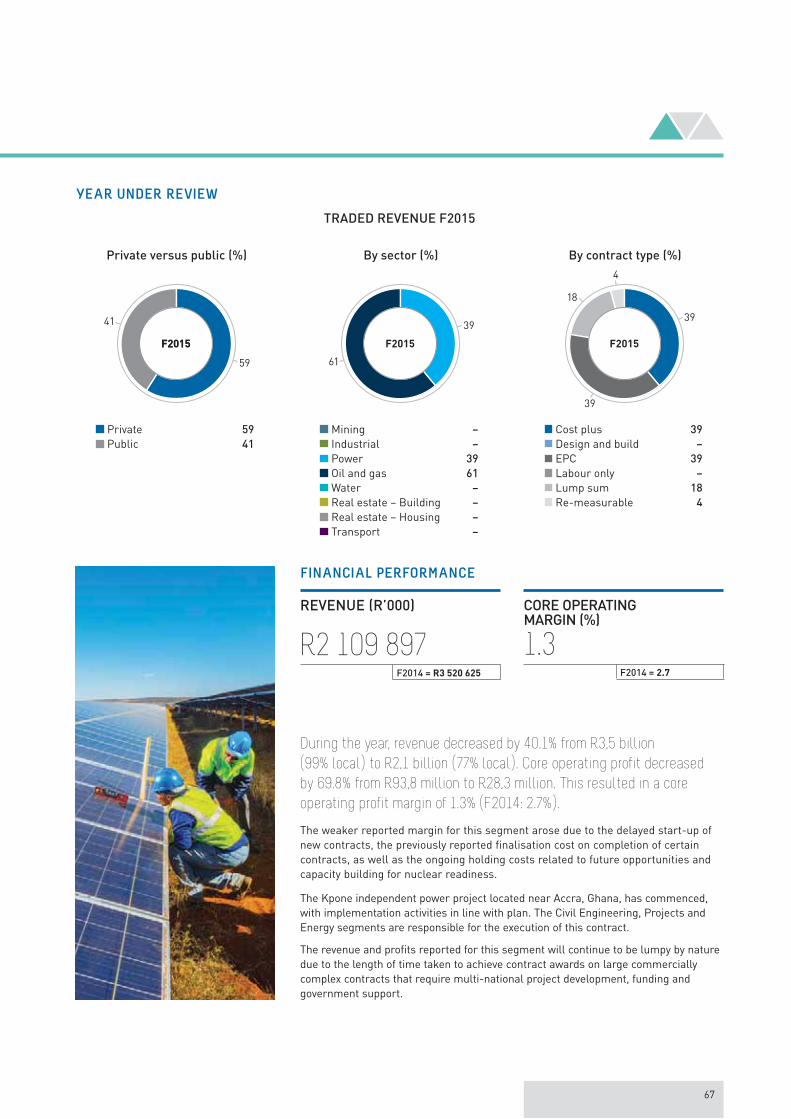
67
YEAR UNDER REVIEW
TRADED REVENUE F2015
Private versus public (%)
Private 59
Public 41
59
F2015
41
F2015
Mining –
Industrial –
Power 39
Oil and gas 61
Water –
Real estate – Building –
Real estate – Housing –
Transport –
By sector (%)
61
F2015
39
Cost plus 39
Design and build –
EPC 39
Labour only –
Lump sum 18
Re-measurable 4
By contract type (%)
18
F2015
4
39
39
During the year, revenue decreased by 40.1% from R3,5 billion
(99% local) to R2,1 billion (77% local). Core operating profit decreased
by 69.8% from R93,8 million to R28,3 million. This resulted in a core
operating profit margin of 1.3% (F2014: 2.7%).
The weaker reported margin for this segment arose due to the delayed start-up of new contracts, the previously reported finalisation cost on completion of certain contracts, as well as the ongoing holding costs related to future opportunities and capacity building for nuclear readiness.
The Kpone independent power project located near Accra, Ghana, has commenced, with implementation activities in line with plan. The Civil Engineering, Projects and Energy segments are responsible for the execution of this contract.
The revenue and profits reported for this segment will continue to be lumpy by nature due to the length of time taken to achieve contract awards on large commercially complex contracts that require multi-national project development, funding and government support.
FINANCIAL PERFORMANCE
REVENUE (R’000)
R2 109 897F2014 = R3 520 625
CORE OPERATING MARGIN (%)
1.3F2014 = 2.7

GR
OU
P F
IVE
Inte
grat
ed a
nnua
l rep
ort
2015
68
CHIEF FINANCIAL OFFICER’S REVIEW / OPERATIONAL PERFORMANCE
continued
ENGINEERING & CONSTRUCTION ENERGY continued
Private versus public (%)
Private 90
Public 10
90
F2015
10
Mining –
Industrial –
Power 87
Oil and gas 13
Water –
Real estate – Building –
Real estate – Housing –
Transport –
By sector (%)
87
F2015
13
Cost plus 8
Design and build –
EPC 87
Labour only –
Lump sum 5
Re-measurable –
By contract type (%)
8
87
F2015
5
LOOKING FORWARD
Activity levels in the African power markets are improving and the group has submitted a number of significant bids for all power technologies under development in West, East and Southern Africa. Further phases of the South African renewable energy programme present opportunities. The group, as the only level one nuclear accredited major listed construction group in South Africa, is well positioned to participate in a leading role in the South African nuclear construction programme should it proceed to implementation.
New contract prospects in the West and East African oil and gas markets continue to progress.
The secured one-year order book stands at R1,3 billion (21% local) (H1 F2015: R1,3 billion and 22% local) and (F2014: R1,1 billion and 77% local). The full secured order book stands at R1,9 billion (14% local) (H1 F2015: R2,0 billion and 14% local) (F2014: R1,2 billion and 74% local).
SECURED CONTRACTING ORDER BOOK
SA
SO
L F
UE
L S
TO
RA
GE
TA
NK
S
So
uth
Afr
ica
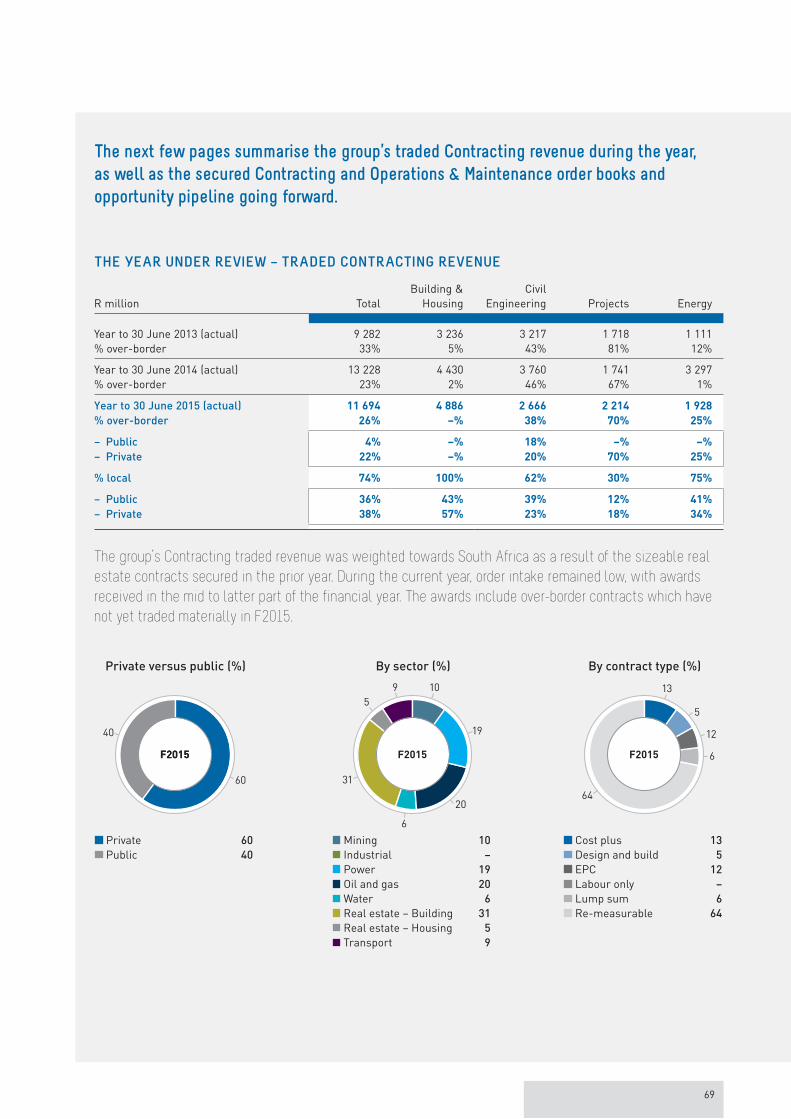
69
The next few pages summarise the group’s traded Contracting revenue during the year,
as well as the secured Contracting and Operations & Maintenance order books and
opportunity pipeline going forward.
THE YEAR UNDER REVIEW – TRADED CONTRACTING REVENUE
R million TotalBuilding &
HousingCivil
Engineering Projects Energy
Year to 30 June 2013 (actual) 9 282 3 236 3 217 1 718 1 111% over-border 33% 5% 43% 81% 12%
Year to 30 June 2014 (actual) 13 228 4 430 3 760 1 741 3 297% over-border 23% 2% 46% 67% 1%
Year to 30 June 2015 (actual) 11 694 4 886 2 666 2 214 1 928
% over-border 26% –% 38% 70% 25%
– Public 4% –% 18% –% –%
– Private 22% –% 20% 70% 25%
% local 74% 100% 62% 30% 75%
– Public 36% 43% 39% 12% 41%
– Private 38% 57% 23% 18% 34%
The group’s Contracting traded revenue was weighted towards South Africa as a result of the sizeable real
estate contracts secured in the prior year. During the current year, order intake remained low, with awards
received in the mid to latter part of the financial year. The awards include over-border contracts which have
not yet traded materially in F2015.
Private versus public (%)
Private 60
Public 40
60
F2015
40
F2015
19
Mining 10
Industrial –
Power 19
Oil and gas 20
Water 6
Real estate – Building 31
Real estate – Housing 5
Transport 9
By sector (%)
31
F2015
9 10
20
6
5
Cost plus 13
Design and build 5
EPC 12
Labour only –
Lump sum 6
Re-measurable 64
By contract type (%)
64
F2015
13
5
12
6

GR
OU
P F
IVE
Inte
grat
ed a
nnua
l rep
ort
2015
70
SECURED CONTRACTING ORDER BOOK
R million TotalBuilding &
HousingCivil
Engineering Projects Energy
At 30 June 2014 12 549 6 833 2 442 2 100 1 174% over-border 20% –% 25% 72% 26%
At 31 December 2014 13 298 5 375 3 118 2 834 1 971% over-border 43% –% 51% 88% 86%
At 30 June 2015* 14 147 6 094 3 293 2 855 1 905
% over-border 39% –% 47% 82% 86%
– Public –% –% –% –% –%
– Private 39% –% 47% 82% 86%
% local 61% 100% 53% 18% 14%
– Public 33% 51% 39% 1% 10%
– Private 28% 49% 14% 17% 4%
One-year order book** 9 778 4 386 2 143 1 976 1 273
One-year order book as a % of F2015 revenue 84% 90% 80% 89% 66%
Total order book as a % of F2015 revenue 121% 125% 124% 129% 99%
* Secured Contracting order book is the total value of construction contracts formally awarded to the group, which still have to be traded, i.e. secured work to be executed by the group. It reflects construction and engineer, procure and construct (EPC) work only and excludes the contribution from the group’s other clusters.
** Revenue to be executed in F2016 from the group’s total secured Contracting order book.
As evidenced by the group’s one-year order book, the group secured 84% of its F2015 revenue at the
commencement of the financial year. The order book is weighted more towards over-border than the traded
revenue. All segments, other than Building & Housing, increased their over-border secured contract content.
Private versus public (%)
Private 67
Public 33
67
F2015
33
F2015
2
Mining 7
Industrial –
Power 40
Oil and gas 2
Water 11
Real estate – Building 30
Real estate – Housing 4
Transport 6
By sector (%)
30 F2015
64 7
40
11 2
Cost plus 2
Design and build 7
EPC 33
Labour only –
Lump sum 2
Re-measurable 56
By contract type (%)
7
56F2015
2
33
CHIEF FINANCIAL OFFICER’S REVIEW / OPERATIONAL PERFORMANCE
continued

71
SECURED OPERATIONS & MAINTENANCE ORDER BOOK – ANNUITY INCOME
R million
Actual revenue Order book
F2013 F2014 F2015 F2016Three-year
to F2019Total
secured#
Transport 654 834 892 835 2 022 4 460
Industrial, oil and gas 59 224 157 71 – 71
Power – – 24 42 105 156
Total 713 1 058 1 073 948 2 127 4 687
# Secured Operations & Maintenance order book is valued using real cash flows (excluding escalation clauses) to first review date.
The group has R4,7 billion in secured Operations & Maintenance contracts. This provides solid annuity revenue
and income in line with the group’s stated strategy. The R4,7 billion represents the value to first review date
only, which provides a conservative amount on what relates to multi-year contracts.
MULTI-YEAR TARGET OPPORTUNITY PIPELINE*
By sector (Rbn)
Value of
opportunities
within
pipeline in
pre-tender
and tender
stage
REST OF AFRICA LOCAL
Total Private Public Total Private Public Total
Mining 20 20 – 17 17 – 37 16
Industrial 2 2 – 2 2 – 4 2
Power 16 16 – 14 7 7 30 17
Oil and gas 24 23 1 6 6 – 30 7
Water 10 2 8 10 – 10 20 1
Building 1 1 – 8 5 3 9 2
Housing – – – 1 – 1 1 1
Transport 59 35 24 35 6 29 94 28
Total 132 99 33 93 43 50 225 74
% over-border 59
% public 37
Value of above opportunity pipeline in pre-tender and tender phase 49 38 11 25 20 5 74
* Represents the value of contracts being targeted by the group as at 30 June 2015.
The pipeline of target contracts indicates a focus on mining, power, oil and gas, water and transport. The mix has
changed in favour of our strategic targeted sectors. Although it is still weighted towards the private sector,
there is an improved balance between South Africa and over-border.

GR
OU
P F
IVE
Inte
grat
ed a
nnua
l rep
ort
2015
72
Contribution to group core operating profit
67.9%(F2014: 30.3%)
Contribution to group core revenue
7.1%(F2014: 5.9%)
F2015 F2014
Revenue – R million 995 905
Core operating profit – R million 237 197
Core operating margin – % 23.8 21.8
Total Operations & Maintenance order book* – R million 4 460 4 316
Investment in concessions – R million 384 422
Employees – pax 1 482 1 521
* Secured long term Operations & Maintenance order book to first review date as at 30 June (transport).
INVESTMENTS & CONCESSIONS
02
Investments & Concessions consists of:
1
2
TRANSPORTTransport comprises Intertoll, which operates full concessions and transport public private partnerships (PPPs), including operations and maintenance in Poland, Hungary, South Africa and Zimbabwe
REAL ESTATEReal estate comprises the group’s property development business, which develops, owns and manages selected A-grade property assets. These generate development and investment returns primarily in South Africa, with a limited footprint in Africa
CHIEF FINANCIAL OFFICER’S REVIEW / OPERATIONAL PERFORMANCE
continued
FINANCIAL PERFORMANCE
REVENUE (R’000)
R995 125F2014 = R905 013
CORE OPERATING MARGIN (%)
23.8F2014 = 21.8

73
The Investments & Concessions cluster delivered an improved performance on the back of a strong operating result from the European operations and fair value gains from the group’s investment in service concessions.
The cluster contributed 7.1% (F2014: 5.9%) to group revenue, and 67.9% to group operating profit (F2014: 30.3%). Revenue, which consists primarily of fees for the operation and maintenance of toll roads, increased by 10.0% from R905,0 million to R995,1 million.
The core operating profit margin increased from 21.8% to 23.8%, which was above guidance on the back of core operating profit of R236,6 million (F2014: R197,0 million). The operating profit includes upward fair value adjustments of R115,7 million (F2014: R83,8 million).
Whilst the mild winter in Eastern Europe partially contributed to the improved operating result, a strong focus on cost containment and operating efficiency enhancements were key drivers of the improved Intertoll Europe performance.
The Developments team successfully reached financial and commercial close of the City of Tshwane’s new public private partnership project for the municipal headquarters during the second half of the financial year, with construction activities having commenced.
LOOKING FORWARD
and African project portfolio. The business has, along with its partners, successfully launched a new residential complex in Johannesburg, achieved strong trade at a new retail mall in Upington, achieved good progress in the development of a new industrial park in Cape Town, advanced and tenanted a new commercial office development in Accra (Ghana), and has grown its portfolio of new project prospects across all target geographies.
The team continues to focus
on securing new contracts
in Eastern Europe and
elsewhere, with projects
in Turkey, Russia, Poland,
Hungary, Kazakhstan and
the Czech Republic being
prioritised.
On the back of invitations from our existing European partners, selected
early-stage opportunities in North America are being investigated.
The African operations of Intertoll performed in line with plan, with the Zimbabwean phase 1 project now fully operational and encompassing all nine plazas. This project has been indicated as the benchmark for such projects and is expected to catalyse similar opportunities in our other target African geographies in future.
Group Five Properties is making steady progress in the profitable development of its South African
GR
AS
SM
ER
E T
OL
L P
LA
ZA
So
uth
Afr
ica

GR
OU
P F
IVE
Inte
grat
ed a
nnua
l rep
ort
2015
74
Contribution to group core operating profit
19.5%(F2014: 12.7%*)
Contribution to group core revenue
7.6%(F2014: 6.9%*)
F2015 F2014
Revenue – R million 1 059 1 060
Core operating profit – R million 68 82
Core operating margin – % 6.4 7.8
PPE** – R million 222 204
Capital expenditure – R million 33 39
Employees – pax 954 1 119
** Property, plant and equipment.
MANUFACTURING
03
* Restated for the application of IFRS 5 – Non-current assets held for sale and discontinued operations, as a result of the decision to transfer the remaining business within the discontinued cluster of Construction Materials into continuing operations within the Manufacturing cluster.
Manufacturing consists of:
1
2
FIBRE CEMENT
Everite
STEEL
BRIGroup Five Pipe
CHIEF FINANCIAL OFFICER’S REVIEW / OPERATIONAL PERFORMANCE
continued
FINANCIAL PERFORMANCE
REVENUE (R’000)
R1 058 795F2014 = R1 060 077*
CORE OPERATING MARGIN (%)
6.4F2014 = 7.8*

75
The Manufacturing cluster contributed 7.6% (F2014: 6.9%*) to group revenue, and 19.5% to group operating profit (F2014: 12.7%*). Revenue remained largely unchanged from F2014 at R1,1 billion. The reported core operating profit for the year was R67,9 million. This was 17.5% lower than the prior year’s core profit of R82,3* million, resulting in a core operating margin of 6.4% (F2014: 7.8%*).
The decline was partially due to the inclusion of the previous Construction Materials’ sand business into this cluster, as the business was transferred from discontinued operations. The sand business incurred an operating loss of R9,4 million (F2014: R3,8 million), consisting mainly of a loss on sale of fixed assets of R6,5 million and non-recurring depreciation of R2,3 million. The operation itself generated a profit before depreciation of R584 000. The core operating margin of the traditional Fibre Cement and Steel businesses was 7.5% (F2014: 8.3%).
Despite a slow domestic market, the performance by the Manufacturing cluster is testament to the team’s proactive approach to reduce costs from the business and to the nimbleness demonstrated by quickly tackling operational challenges such as power outages.
The Fibre Cement team also achieved progress in developing new product markets, encompassing the established fibre-cement product and pipe markets, Advanced Building Technologies (ABT), and the build-up of an aligned traded goods portfolio of complementary light-weight dry building materials that allow the business to better service its existing and target client base.
The Steel business had a challenging year, impacted by strike action in the first half and rapidly declining steel prices in the second half of the year. Despite these factors, and against the impact of the slowdown in demand from the Civil Engineering segment, it delivered a steady result. Group Five Pipe also delivered a solid performance.
LOOKING FORWARD
Headway was made in further regional geographic market
penetration.
The rapid decline in Group Five Pipe’s order book towards the year end due to a lack of new contracts coming to the market, with no clear view on recovery in the short term, will place the business under pressure in the year ahead.
Prospects for growth in revenue and earnings from the Manufacturing cluster are, therefore, dependent on a recovery in South African demand, predominantly driven by an improvement in public and private expenditure on infrastructure, including the housing and water markets.
FIB
RE
CE
ME
NT
OP
ER
AT
ION
S
So
uth
Afr
ica
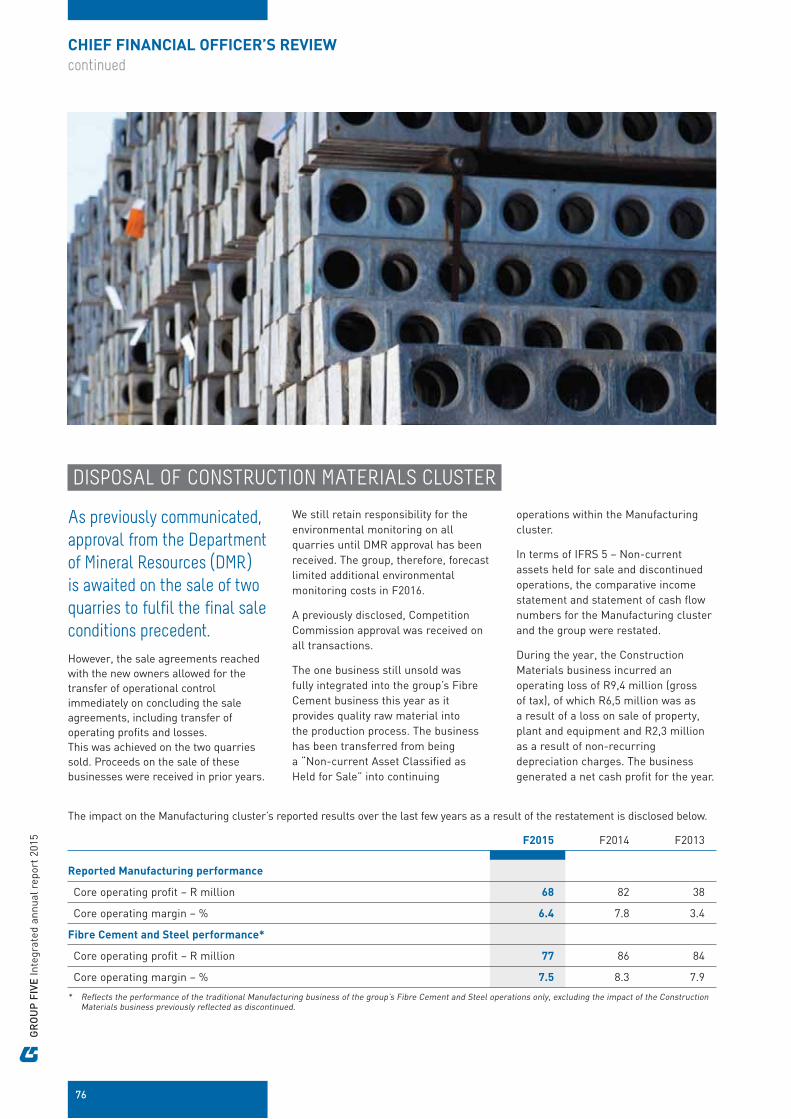
GR
OU
P F
IVE
Inte
grat
ed a
nnua
l rep
ort
2015
76
CHIEF FINANCIAL OFFICER’S REVIEW
continued
DISPOSAL OF CONSTRUCTION MATERIALS CLUSTER
As previously communicated,
approval from the Department
of Mineral Resources (DMR)
is awaited on the sale of two
quarries to fulfil the final sale
conditions precedent.
However, the sale agreements reached with the new owners allowed for the transfer of operational control immediately on concluding the sale agreements, including transfer of operating profits and losses. This was achieved on the two quarries sold. Proceeds on the sale of these businesses were received in prior years.
We still retain responsibility for the environmental monitoring on all quarries until DMR approval has been received. The group, therefore, forecast limited additional environmental monitoring costs in F2016.
A previously disclosed, Competition Commission approval was received on all transactions.
The one business still unsold was fully integrated into the group’s Fibre Cement business this year as it provides quality raw material into the production process. The business has been transferred from being a “Non-current Asset Classified as Held for Sale” into continuing
operations within the Manufacturing cluster.
In terms of IFRS 5 – Non-current assets held for sale and discontinued operations, the comparative income statement and statement of cash flow numbers for the Manufacturing cluster and the group were restated.
During the year, the Construction Materials business incurred an operating loss of R9,4 million (gross of tax), of which R6,5 million was as a result of a loss on sale of property, plant and equipment and R2,3 million as a result of non-recurring depreciation charges. The business generated a net cash profit for the year.
The impact on the Manufacturing cluster’s reported results over the last few years as a result of the restatement is disclosed below.
F2015 F2014 F2013
Reported Manufacturing performance
Core operating profit – R million 68 82 38
Core operating margin – % 6.4 7.8 3.4
Fibre Cement and Steel performance*
Core operating profit – R million 77 86 84
Core operating margin – % 7.5 8.3 7.9
* Reflects the performance of the traditional Manufacturing business of the group’s Fibre Cement and Steel operations only, excluding the impact of the Construction Materials business previously reflected as discontinued.

77
EXIT FROM THE MIDDLE EAST OPERATIONS
Good progress was made with
our operational withdrawal
from the Middle East.
The status of the one remaining material contract, which was terminated by the client and required final close-out, is as follows:
AS PREVIOUSLY REPORTED, THE GROUP HAS:
No active contracts in the region Dormatised its operations and shut down its trading office Legal entities and regulatory structures have been retained to allow the group
to re-enter the region when conditions improve
A trading loss of R700 000 (F2014: R1,5 million) was recorded for the financial year due to contract profits of R400 000 (F2014: R7,0 million) and overheads of R1,1 million (F2014: R8,5 million).
The net carrying value of the group’s Middle East assets and liabilities at 30 June are outlined in the table below:
R million F2015 F2014 F2013
Trade and other receivables 167,1 191,6 253,6Work in progress 31,8 27,5 43,7Cash and cash equivalents 29,5 49,9 40,8Net trade and other payables (159,3) (166,5) (198,6)
Net asset value 69,1 102,5 139,5
The values in the table above represent the DPF contract, as well as an additional four contracts which were completed and reached final certification, but which require close out and collection. We are actively working with our joint venture partner to ensure closure. Although limited, the group has forecast additional costs in F2016 to monitor the close-out and settlement on remaining contracts.
01
A payment plan is in place to recover the outstanding final certification
Payments are received on a quarterly basis
The final payment date is December 2015
DPF, ENGINEERS OFFICE (MERAAS)
COMPETITION COMMISSION
The board and management of Group Five identified historic incidences of anti-competitive behaviour and took immediate and decisive steps to implement internal corrective action. We secured conditional leniency from the Commission in terms of the Commission’s Corporate Leniency Policy in return for full disclosure of all matters the group was able to uncover during its internal investigation. As the group continues to co-operate with the Commission, it has retained its leniency position.
The Commission launched its “Fast-Track” process in 2011, mainly as a result of the group’s earlier co-operation. This triggered wider industry participation. During the “Fast-Track” process, the group was implicated in four contracts which were not detected through its internal investigation.
We subsequently conducted our own further investigation and consistently raised factual and evidentiary discrepancies with the Commission in respect of these contracts. In the interests of shareholders, we did not hastily settle, as there was no reasonable basis for attributing liability to the group in respect of the implicated contracts. In June 2013, a provision was raised against the risk of an administrative penalty, as reported in the group’s F2013 results.
Management have continued to engage with the Commission in an attempt to responsibly settle any outstanding matters on reasonable terms, whilst conscious of its accountability to conclude this matter for the benefit of all its stakeholders.
The group has co-operated
proactively with the
Competition Commission
of South Africa (the
Commission) since 2009,
at a very early stage of the
Commission’s investigations
into matters of collusion in
the construction industry
in South Africa.
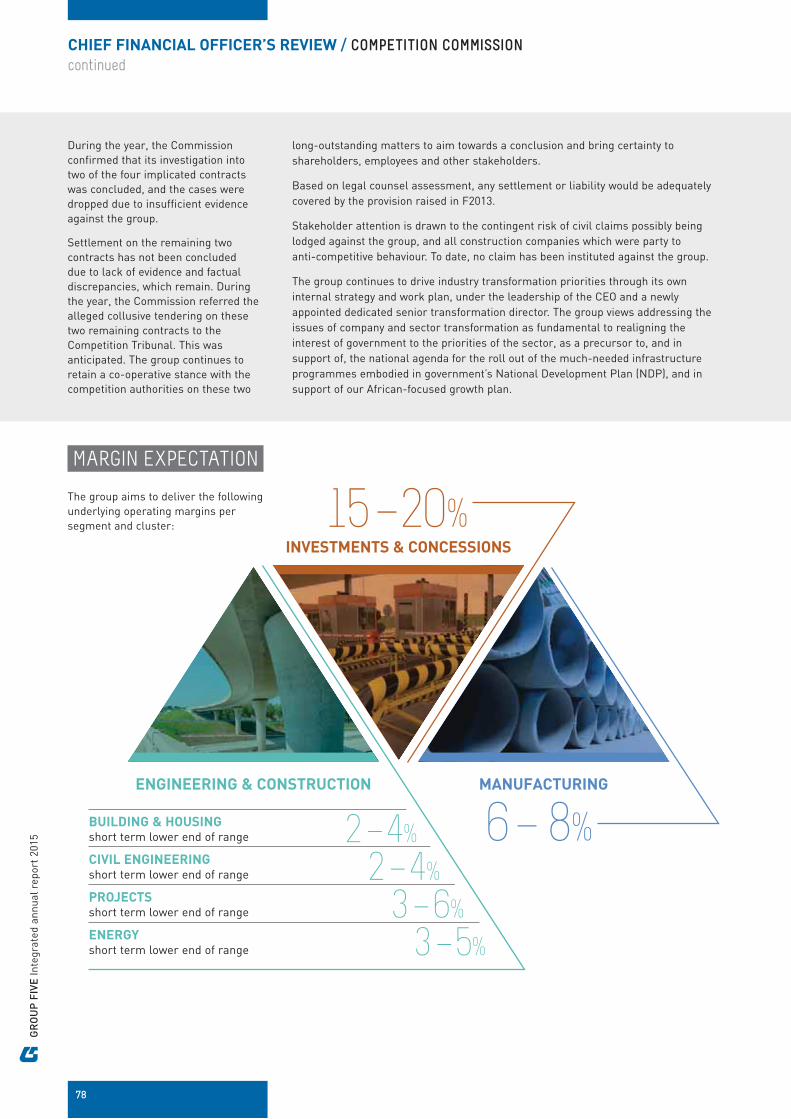
GR
OU
P F
IVE
Inte
grat
ed a
nnua
l rep
ort
2015
78
BUILDING & HOUSINGshort term lower end of range 2 � 4% CIVIL ENGINEERING short term lower end of range 2 � 4% PROJECTSshort term lower end of range 3 � 6%ENERGYshort term lower end of range 3 � 5%
CHIEF FINANCIAL OFFICER’S REVIEW / COMPETITION COMMISSION
continued
MARGIN EXPECTATION
The group aims to deliver the following underlying operating margins per segment and cluster:
During the year, the Commission confirmed that its investigation into two of the four implicated contracts was concluded, and the cases were dropped due to insufficient evidence against the group.
Settlement on the remaining two contracts has not been concluded due to lack of evidence and factual discrepancies, which remain. During the year, the Commission referred the alleged collusive tendering on these two remaining contracts to the Competition Tribunal. This was anticipated. The group continues to retain a co-operative stance with the competition authorities on these two
long-outstanding matters to aim towards a conclusion and bring certainty to shareholders, employees and other stakeholders.
Based on legal counsel assessment, any settlement or liability would be adequately covered by the provision raised in F2013.
Stakeholder attention is drawn to the contingent risk of civil claims possibly being lodged against the group, and all construction companies which were party to anti-competitive behaviour. To date, no claim has been instituted against the group.
The group continues to drive industry transformation priorities through its own internal strategy and work plan, under the leadership of the CEO and a newly appointed dedicated senior transformation director. The group views addressing the issues of company and sector transformation as fundamental to realigning the interest of government to the priorities of the sector, as a precursor to, and in support of, the national agenda for the roll out of the much-needed infrastructure programmes embodied in government’s National Development Plan (NDP), and in support of our African-focused growth plan.
ENGINEERING & CONSTRUCTION MANUFACTURING
INVESTMENTS & CONCESSIONS
15 � 20%
6 � 8%

79
CREDIT RISK PROFILE
Our clients are concentrated primarily in South Africa, as well
as in the rest of Africa, the Middle East and Eastern Europe.
The group has the following amounts due from its top five debtors:
ValueRm
% of tradeand other
receivables% of total
revenue
2015 R848,7 22.5 6.1
2014 R954,9 24.4 6.2
The group has the following credit risk per region:
R’000 F2015 F2014
Central Africa (Zambia, DRC) 269 379 468 789East Africa (Mauritius, Tanzania) 58 492 91 308Eastern Europe (Hungary, Poland) 3 020 32 047Middle East (Dubai, Jordan) 189 853 216 446Southern Africa (South Africa, Lesotho, Namibia, Mozambique, Zimbabwe) 2 775 413 2 972 485West Africa (Nigeria, Ghana, Burkina Faso, Sierra Leone, Liberia) 269 146 133 446
Total trade and other receivables 3 565 303 3 914 521
Included within contract and trade debtors is an amount of R547 million (F2014: R607 million). This is defined as being
past due for collection, but from which no loss is expected and
for which no impairment was raised.
R’000 F2015 F2014
One month past due 40 243 129 759Two months past due 35 829 67 490Three months past due 34 597 67 490Four months and greater past due 436 408 342 522
Total 547 077 607 261
Of the R547,1 million past due but not impaired, R33,1 million relates to a Middle East debtor. R153,6 million is due from over-border mining clients that have agreed to, and are honouring, short term repayment plans. R83,5 million relates to amounts due from a local client in the process of settlement.
The trade and other receivables past due, but not impaired, as a percentage of total trade and other receivables, is largely unchanged at 15% (F2014: 16%).

GR
OU
P F
IVE
Inte
grat
ed a
nnua
l rep
ort
2015
80
CHIEF FINANCIAL OFFICER’S REVIEW
continued
FINANCIAL INSTITUTION-BACKED GUARANTEES
Financial institution
guarantees are essential for
a Contracting group to allow
it to bid for and commit to
tenders and contract awards.
The group has total facilities in this regard of
R12 450 millionTotal financial institution guarantees to third parties amounted to R7 144 million as at 30 June 2015, compared to R7 298 million as at 31 December 2014 and R3 643 million as at 30 June 2014.
The increase in guarantees in issue is mostly as a result of an increased secured Contracting order book and in particular the guarantees issued with the award of the Kpone independent power project, which was the group’s largest single contract secured in the financial year.
The issued guarantees have the following expiry dates:
Rm F2015 F2014
Not later than one year 2 941 2 180Later than one year and not later than five years 4 198 1 460Later than five years 5 3
Total 7 144 3 643
The guarantees in issue can be allocated into the following categories:
Rm F2015 F2014
Issued in lieu of advance payments received 2 075 555Issued as a guarantee for performance 3 226 2 261Issued in lieu of retention monies received 1 742 693Issued in support of tenders submitted 16 50Issued for non-contract-related activities 85 84
Total 7 144 3 643
The group’s advance payment and retention guarantees are matched with cash balances on hand. It, therefore, represents a reduced risk profile to that of performance guarantees. This also illustrates the group’s strategy and ability to secure upfront cash on contracts.
The group has 17% of its total order book in the form of issued performance bonds. This is comparable to and in some instances lower than its local and international contracting peers.
KP
ON
E C
OM
BIN
ED
CY
CL
E P
OW
ER
PL
AN
T
Gh
an
a
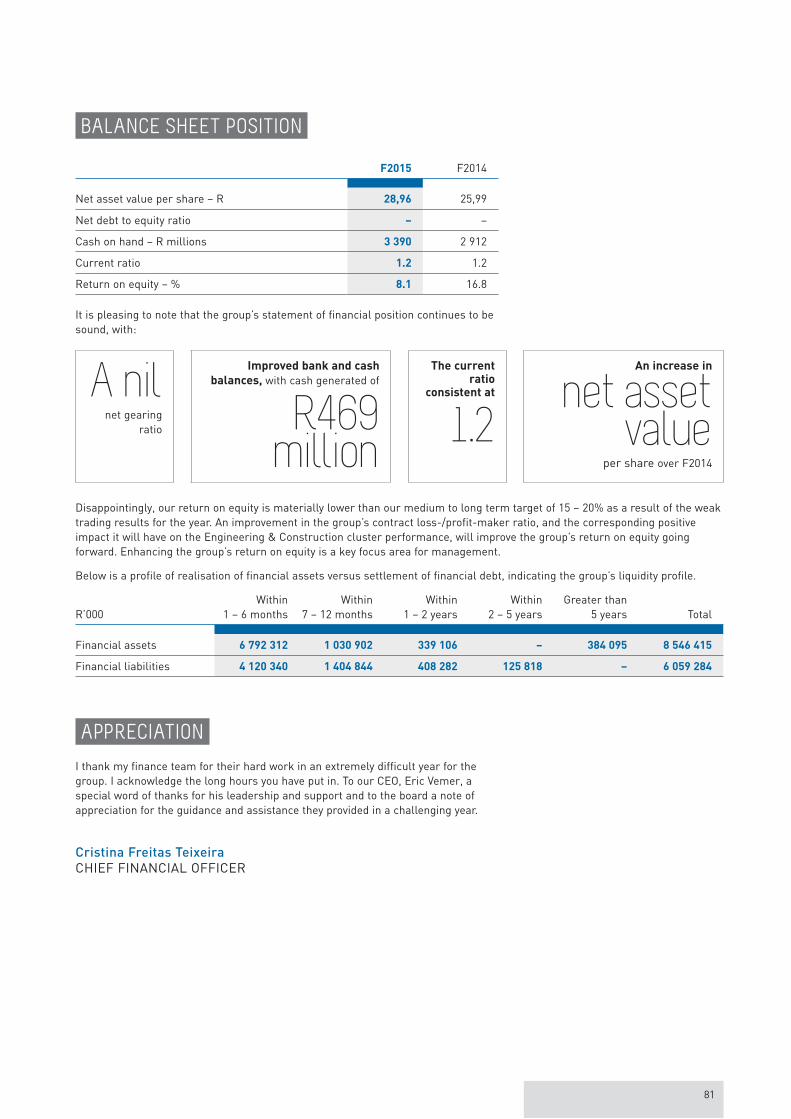
81
BALANCE SHEET POSITION
F2015 F2014
Net asset value per share – R 28,96 25,99
Net debt to equity ratio – –
Cash on hand – R millions 3 390 2 912
Current ratio 1.2 1.2
Return on equity – % 8.1 16.8
It is pleasing to note that the group’s statement of financial position continues to be sound, with:
A nilnet gearing
ratio
Improved bank and cash
balances, with cash generated of
R469 million
The current ratio
consistent at
1.2
An increase in
net asset value
per share over F2014
Disappointingly, our return on equity is materially lower than our medium to long term target of 15 – 20% as a result of the weak trading results for the year. An improvement in the group’s contract loss-/profit-maker ratio, and the corresponding positive impact it will have on the Engineering & Construction cluster performance, will improve the group’s return on equity going forward. Enhancing the group’s return on equity is a key focus area for management.
Below is a profile of realisation of financial assets versus settlement of financial debt, indicating the group’s liquidity profile.
R’000Within
1 – 6 monthsWithin
7 – 12 monthsWithin
1 – 2 yearsWithin
2 – 5 yearsGreater than
5 years Total
Financial assets 6 792 312 1 030 902 339 106 – 384 095 8 546 415
Financial liabilities 4 120 340 1 404 844 408 282 125 818 – 6 059 284
APPRECIATION
I thank my finance team for their hard work in an extremely difficult year for the group. I acknowledge the long hours you have put in. To our CEO, Eric Vemer, a special word of thanks for his leadership and support and to the board a note of appreciation for the guidance and assistance they provided in a challenging year.
Cristina Freitas Teixeira
CHIEF FINANCIAL OFFICER

82
PAGE
88GROUP MEASURES
PAGE
84COMBINED ASSURANCE
02SECTION
PAGE
94TEAM MEASURES
PAGE
108TEAM REMUNERATION

83
GOVERNANCE, MEASURES AND REMUNERATION
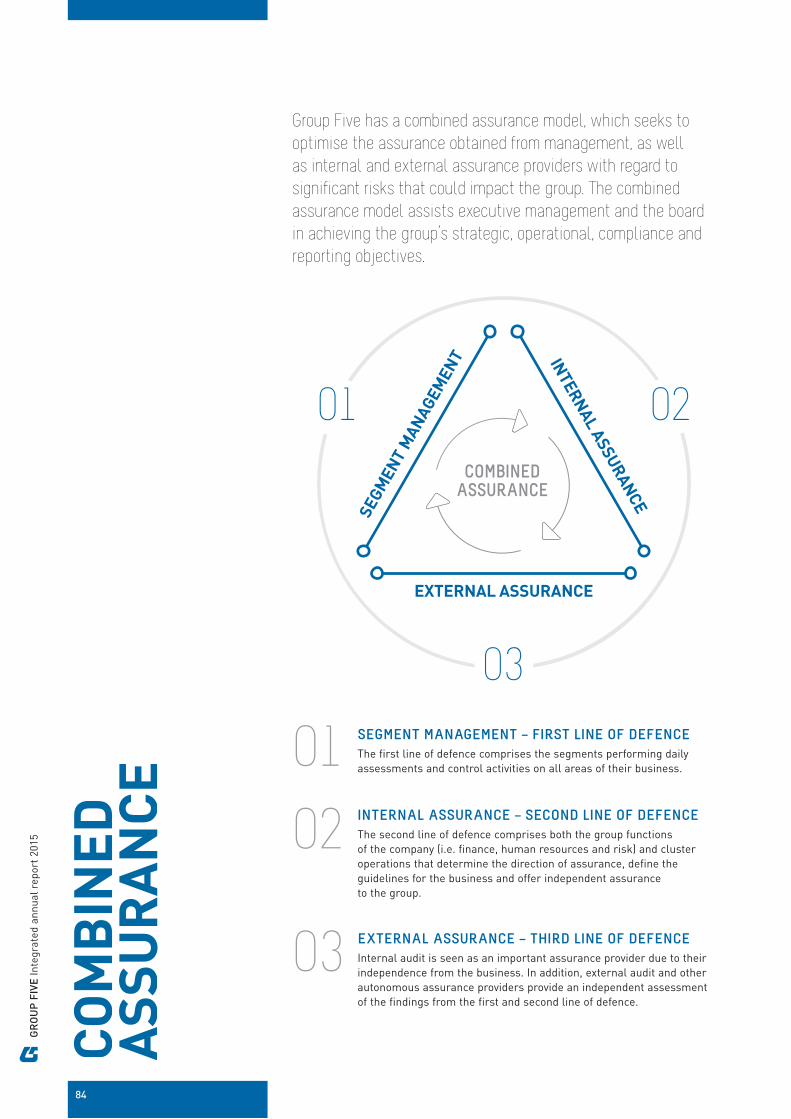
GR
OU
P F
IVE
Inte
grat
ed a
nnua
l rep
ort
2015
84
CO
MB
INE
DA
SS
UR
AN
CE
Group Five has a combined assurance model, which seeks to
optimise the assurance obtained from management, as well
as internal and external assurance providers with regard to
significant risks that could impact the group. The combined
assurance model assists executive management and the board
in achieving the group’s strategic, operational, compliance and
reporting objectives.
SEGMENT MANAGEMENT – FIRST LINE OF DEFENCE
The first line of defence comprises the segments performing daily assessments and control activities on all areas of their business.01INTERNAL ASSURANCE – SECOND LINE OF DEFENCE
The second line of defence comprises both the group functions of the company (i.e. finance, human resources and risk) and cluster operations that determine the direction of assurance, define the guidelines for the business and offer independent assurance to the group.
02
EXTERNAL ASSURANCE – THIRD LINE OF DEFENCE
Internal audit is seen as an important assurance provider due to their independence from the business. In addition, external audit and other autonomous assurance providers provide an independent assessment of the findings from the first and second line of defence.
03
03
0201
COMBINED ASSURANCE
INT
ER
NA
L A
SS
UR
AN
CE
SE
GM
EN
T M
AN
AG
EM
EN
T
EXTERNAL ASSURANCE
85
THE COMBINED ASSURANCE MODEL
The determination of risk takes place through three initial approaches:
The first is a “bottom-up” approach where risks identified at a contract and segment level are captured and consolidated at both cluster and group level. Material and/or recurring risks are extracted and prioritised.
1The second involves senior management’s identification of key threats to the cluster and the group strategy. This review is undertaken annually during the group’s business planning and strategy setting process. Further risks identified during the year are also included into the group combined assurance risk plan (GCARP) through discussion and agreement at the combined assurance workgroup (CAW).
2The executive committee (exco) reviews the consolidated findings of all the key risks and assesses the adequacy of this outcome in terms of the validity, accuracy and completeness of the risks included. It presents this list to the board for final review and approval.
3
The output from these three risk assessment processes is incorporated into our combined assurance
model and provides the input for both strategic and operational risks. The business process within
which each risk resides is also recorded. Risks inherent within business processes are assessed and
addressed within the combined assurance model.
MA
LL
OF
AF
RIC
A
So
uth
Afr
ica

GR
OU
P F
IVE
Inte
grat
ed a
nnua
l rep
ort
2015
86
COMBINED ASSURANCE
continued
DEVELOPMENTS DURING THE YEAR
With a focus on continuous improvement in risk management and in light of the poor financial performance during the year, management reviewed the adequacy of controls in place around key risks and processes and created a combined assurance workgroup (CAW) in the latter part of F2015.
The workgroup meets
quarterly to assess the completeness of the risks being assured and the
adequacy of the mitigation
actions implemented by
the business.
The CAW responsibilities include the following:
Discuss key risks reflected in the combined assurance risk plan to ensure that the risk plan is valid, accurate and complete
Agree assurance providers Agree the extent of assurance
required from each level of defence Ensure unnecessary duplication of
effort between parties Ensure adequacy and coverage of
assurance Evaluate whether key risks and
controls are being adequately managed and mitigated and apply correction action, as required
Approve the updated combined assurance risk plan on a quarterly basis
The CAW consists of six exco members, as well as representatives responsible for the implementation of combined assurance:
Chief financial officer
Executive committee member– Engineering & Construction
Executive committee member – Investments & Concessions
Executive committee member – Manufacturing
Executive committee member – Human resources
Executive committee member – Risk
Internal audit is also represented on the CAW and an external audit representative is invited to every alternate meeting.
During the year, the group implemented a self-assessment control questionnaire. This requires that the first line of defence:
Personally assesses its adherence to the controls and assurance requirements, as set out by the CAW and
Formally confirms its compliance on a quarterly basis
This improves management accountability and responsibility for the risks in their business and the adherence to processes to be followed, as it requires the inclusion of relevant measures and progress against mitigation.
THE KEY RISKS INCLUDED IN THE GCARP INCLUDE:
Community and workforce disruptions, which result in delays in the completion of contracts and in the recognition of revenue and profits
Not meeting transformation objectives, which will result in a decline in the group’s broad-based black economic empowerment rating
Not adhering to regulations, especially in over-border countries Claims and litigation risks Highly competitive markets due to foreign and local companies entering
our markets and lower commodity prices. This impacts the roll out of new contracts and poses a risk to the replenishment and growth of the group’s order book
Poor execution of contracts, which results in margin erosion and losses. This aspect includes the risk of poor quality control on site, which results in rework, increased costs and delayed delivery of contracts
Skills shortages in project management, execution and assurance Managing relationships with stakeholders, in particular government
following anti-competitive behaviour in the sector Managing safety and environmental risks, especially within the context
of cost and schedule pressures
The completed questionnaires are evaluated by the CAW to determine adequacy of actions taken to mitigate risk.
The output of these processes is the GCARP and a self-assessment control questionnaire. The GCARP is presented to exco and the board for their final review and approval. Any further risks or controls identified by exco or the board are added onto the GCARP.
The finalised GCARP was presented to the board risk committee in August 2015 for sign-off. This process included the controls to be implemented to ensure that key risks and controls are managed and monitored within the group.
WEBRefer to the online section of the integrated annual report for the group’s risks.

87
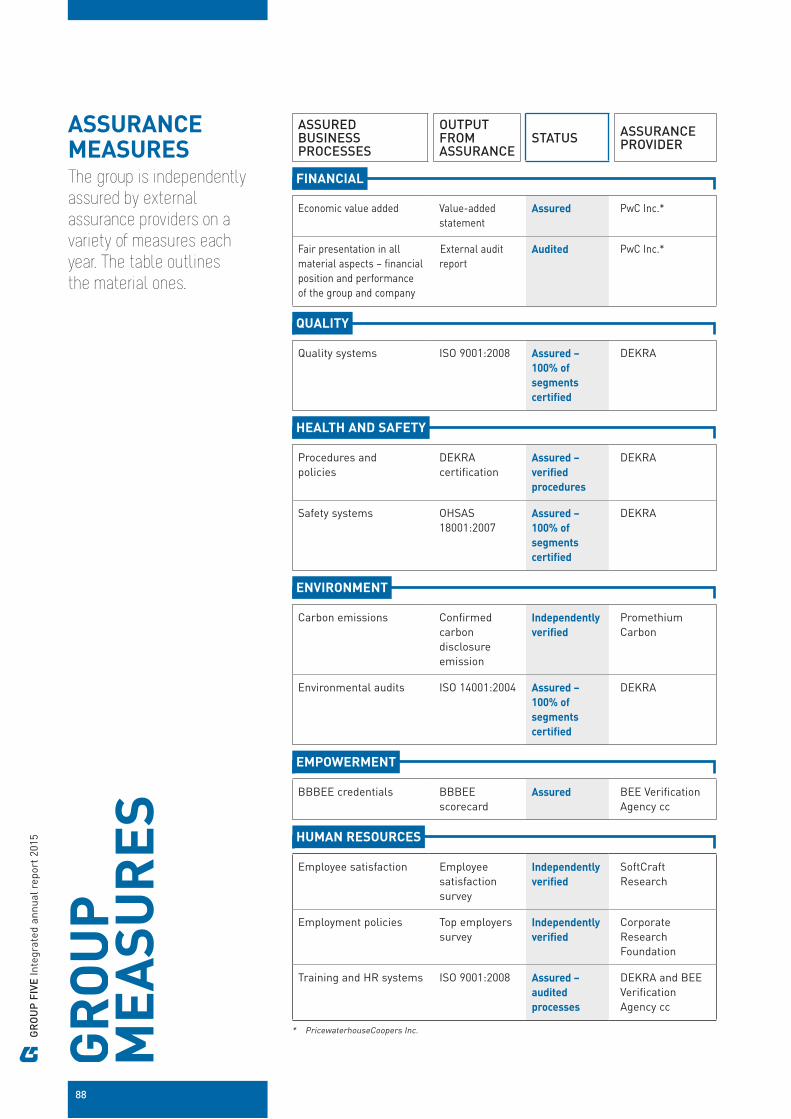
GR
OU
P F
IVE
Inte
grat
ed a
nnua
l rep
ort
2015
88
ASSURANCE MEASURESThe group is independently
assured by external
assurance providers on a
variety of measures each
year. The table outlines
the material ones.
GR
OU
PM
EA
SU
RE
SASSURED BUSINESS PROCESSES
OUTPUT FROM ASSURANCE
STATUSASSURANCE PROVIDER
FINANCIAL
Economic value added Value-added statement
Assured PwC Inc.*
Fair presentation in all material aspects – financial position and performance of the group and company
External audit report
Audited PwC Inc.*
QUALITY
Quality systems ISO 9001:2008 Assured –
100% of
segments
certified
DEKRA
HEALTH AND SAFETY
Procedures and policies
DEKRA certification
Assured –
verified
procedures
DEKRA
Safety systems OHSAS 18001:2007
Assured –
100% of
segments
certified
DEKRA
ENVIRONMENT
Carbon emissions Confirmed carbon disclosure emission
Independently
verified
Promethium Carbon
Environmental audits ISO 14001:2004 Assured –
100% of
segments
certified
DEKRA
EMPOWERMENT
BBBEE credentials BBBEE scorecard
Assured BEE Verification Agency cc
HUMAN RESOURCES
Employee satisfaction Employee satisfaction survey
Independently
verified
SoftCraft Research
Employment policies Top employers survey
Independently
verified
Corporate Research Foundation
Training and HR systems ISO 9001:2008 Assured –
audited
processes
DEKRA and BEE Verification Agency cc
* PricewaterhouseCoopers Inc.

89
The value-added statement was assured for the fourth year in a row.
INDEPENDENT AUDITOR’S REPORT TO THE DIRECTORS OF GROUP FIVE LIMITED
We have audited the group economic value-added statement of Group Five Limited for the year ended 30 June 2015 set out on page 90. This report should be read in conjunction with the audited consolidated financial statements in the online section of the integrated annual report at www.groupfive.co.za.
DIRECTORS’ RESPONSIBILITY FOR THE GROUP ECONOMIC VALUE-ADDED STATEMENT
The company’s directors are responsible for the preparation and presentation of the group economic value-added statement in terms of the basis of preparation to the statement, for determining that the basis of preparation is acceptable in the circumstances and for such internal control as the directors determine is necessary to enable the preparation of the group economic value-added statement that is free from material misstatements, whether due to fraud or error.
AUDITOR’S RESPONSIBILITY
Our responsibility is to express an opinion on the group economic value-added statement. We conducted our audit in accordance with International Standards on Auditing. Those standards require that we comply with ethical requirements and plan and perform the audit to obtain reasonable assurance whether the group economic value-added statement is free from material misstatement.
An audit involves performing procedures to obtain audit evidence about the amounts and disclosures in the group economic value-added statement. The procedures selected depend on the auditor’s judgement, including the assessment of the risks of material misstatement of the group economic value-added statement, whether due to fraud or error. In making those risk assessments, the auditor considers internal control relevant to the entity’s preparation and presentation of the group economic value-added statement in order to design audit procedures that are appropriate in the circumstances, but not for the purpose of expressing an opinion on the effectiveness of the entity’s internal control. An audit also includes evaluating the appropriateness of the group economic value-added statement principles used and the reasonableness of valuation estimates made by the management, as well as evaluating the overall presentation of the group economic value-added statement.
We believe that the audit evidence we have obtained is sufficient and appropriate to provide a basis for our audit opinion.
OPINION
In our opinion, the group economic value-added statement has been prepared, in all material respects, in accordance with the basis of preparation to the group economic value-added statement.
BASIS OF ACCOUNTING AND RESTRICTION ON USE
Without modifying our opinion, we draw attention to the paragraph on page 90 of the group economic value-added statement, which describes the basis of preparation of the economic value-added statement. The group economic value-added statement is prepared to support the group’s disclosure of its value-added for sustainability reporting purposes. As a result, the group economic value-added statement may not be suitable for another purpose. Our report is intended solely for the directors of Group Five Limited and should not be used by any other parties. We agree to the publication of our report in the Integrated Annual Report of Group Five Limited for the year ended 30 June 2015 in which the group economic value-added statement is included provided it is clearly understood by the recipients of the Integrated Annual Report that they enjoy such receipt for information only and that we accept no duty of care to them in respect of our report.
PricewaterhouseCoopers Inc.Director: AJ Rossouw
Registered auditor
Sunninghill
14 August 2015

GR
OU
P F
IVE
Inte
grat
ed a
nnua
l rep
ort
2015
90
ECONOMIC VALUE ADDED
BASIS OF PREPARATION
The value-added statement is derived from the annual financial statements (AFS) for the year ended 30 June 2015. The AFS were prepared in terms of International Financial Reporting Standards and the accounting policies as disclosed in the AFS, adjusted as described below:
Sustainability indicator %
F2015
(R’000) %F20141
(R’000)
Revenue2 15 586 695 17 289 997 Less: purchased cost of goods and services2 (11 464 342) (12 802 977)
Value added 96.7 4 122 353 97.6 4 487 020 Other income3 3.3 140 318 2.4 111 934
Wealth created 100.0 4 262 671 100.0 4 598 954
Employees4 64.6 2 752 198 58.7 2 697 575 Providers of equity5 3.6 156 602 2.5 116 627 Providers of funding6 0.1 1 622 0.1 1 779 Socio-economic development7 0.1 2 525 0.1 6 098 Government8 28.7 1 225 926 31.6 1 453 971 Funds retained 2.9 123 798 7.0 322 904
Wealth distribution 100.0 4 262 671 100.0 4 598 954
Number of employees9 12 044 14 326
Wealth created per employee (R) 353 925 321 022
Weighted number of shares (‘000) 100 895 100 053
Wealth created per share (R) 42 46
1 Restated for the transfer of the remaining Construction Materials operations from classified as held for sale to continued operations.2 Revenue and purchased cost of goods and services are stated, including value-added tax. 3 Other income consists of share of income from equity accounted investments, including joint ventures and fair value adjustments on investments in concessions.4 Distributions to employees exclude employee taxes deducted from their salaries and paid to the respective revenue authorities on their behalf.5 Distributions to providers of equity consist of dividends declared and paid during the year and non-controlling interests for the year.6 Distributions to providers of funding consist of the net interest expense incurred during the year. 7 Socio-economic development consists of investment in education, as well as other social initiatives. 8 Government includes income taxation, deferred taxation, employee taxes and net value-added taxation (VAT).9 Employees include permanent and temporary employees who are paid salaries and wages. Number of employees, including joint arrangements equity accounted,
is 12 178 (2014: 14 503).
MEASURING OUR DELIVERY
Employees 64.6
Providers of equity 3.6
Providers of funding 0.1
Socio-economic development 0.1
Government 28.7
Funds retained 2.9
DISTRIBUTION OF WEALTH CREATED (%)
2.5
58.7F2014
31.6
7.0
3.6 64.6
F2015
28.7
2.9
Employees 58.7
Providers of equity 2.5
Providers of funding 0.1
Socio-economic development 0.1
Government 31.6
Funds retained 7.0
GROUP MEASURES
continued
We monitor the delivery of our strategy against strict
measures relating to financial and non-financial measures.
A number of these measures are linked to management’s key performance indicators.
PAGERefer to pages 98 to 106.

91
Category
Mediumterm
targetF2015
actual
F2015
target
F2014*actual
F2014target
F2013*actual
Revenue per employee (medium term) – R’000 Increase 1 152 Increase 1 072 Increase 820
Net profit for the year per employee – R’000 Increase 19 Increase 28 Increase 19
Geographic diversification (revenue from over-border operations) – % 50 27 40 24 40 32
Multi-disciplinary revenue of Contracting revenue – % Increase 30 Increase 27 Increase 40
EPC^ revenue of Contracting revenue – % Increase 12 Increase 15 Increase 4
Secured order book (Contracting budget secured in order book at start of financial year) – % 70 of budget 79 70 of budget 71 70 of budget 88
Return on shareholders’ equity – long term – % 15 – 20 8 15 – 20 17 15 – 20 13
Fully diluted headline earnings per share – % (decrease)/growth
growth>CPI (49) growth 42 growth 144
Product diversification – (total operating profit from non-Contracting businesses) – % >33 87 >33 43 >33 47
Net gearing – % <33 of equity – <33 of equity – <33 of equity –
Cash generated from operations – R million
cash generative 544
cash
generative 372cash
generative 961
Total operating margin – %5 medium
term 2.6
5 medium
term 4.25 medium
term 4.3
* Restated for the application of IFRS 5 – Non-current assets held for sale and discontinued operations, as a result of the decision to transfer the remaining business within the discontinued cluster of Construction Materials into continuing operations within the Manufacturing cluster.
^ Engineer, procure and construct.
The group is pleased with the cash generated from operations of
R544 million.FINANCIAL

GR
OU
P F
IVE
Inte
grat
ed a
nnua
l rep
ort
2015
92
Medium termtarget
F2015
actual
F2015
target
F2014actual
F2014target
F2013actual
Employee turnover (permanent employees) – % <5 3^ <5 3^ <5 3^
Employee satisfaction rating – % >70 71 >70 68 >70 67
Employees trained per annum – % 35 41 35 39 35 30
Average training spend per employee R1 300 R1 480 R1 300 R1 314 R1 300 R1 100
Construction Charter BBBEE score – % >85 87 >85 89 >85 90
Lost-time injury frequency rate* 0 0.23 0 0.23 0 0.21
Lost-time injury frequency rate** 0 0.15 0 0.17 0 0.27
% of AIC^ ̂at top management, senior management and middle management 40 28 35 27 30 22
% of women at top management, senior management and middle management 20 14 19 14 17 13
OHSAS 18001:2007 certification across group – % 100 100 100 100 100 100
^ These numbers relate to voluntary terminations only and do not include involuntary labour turnover as a result of retrenchments and non-renewal of contracts.^^ African, Indian and Coloured.* Group Five permanent employees in South Africa and the rest of Africa.** Group Five permanent employees in South Africa and the rest of Africa and sub-contractors combined.
GROUP MEASURES / MEASURING OUR DELIVERY
continued
Employee satisfaction ratings
exceeded 70%
for the first time. Ratings in the structure and human capital management
categories showed significant improvements, which the group believes is an endorsement
of our new management structures.
PEOPLE
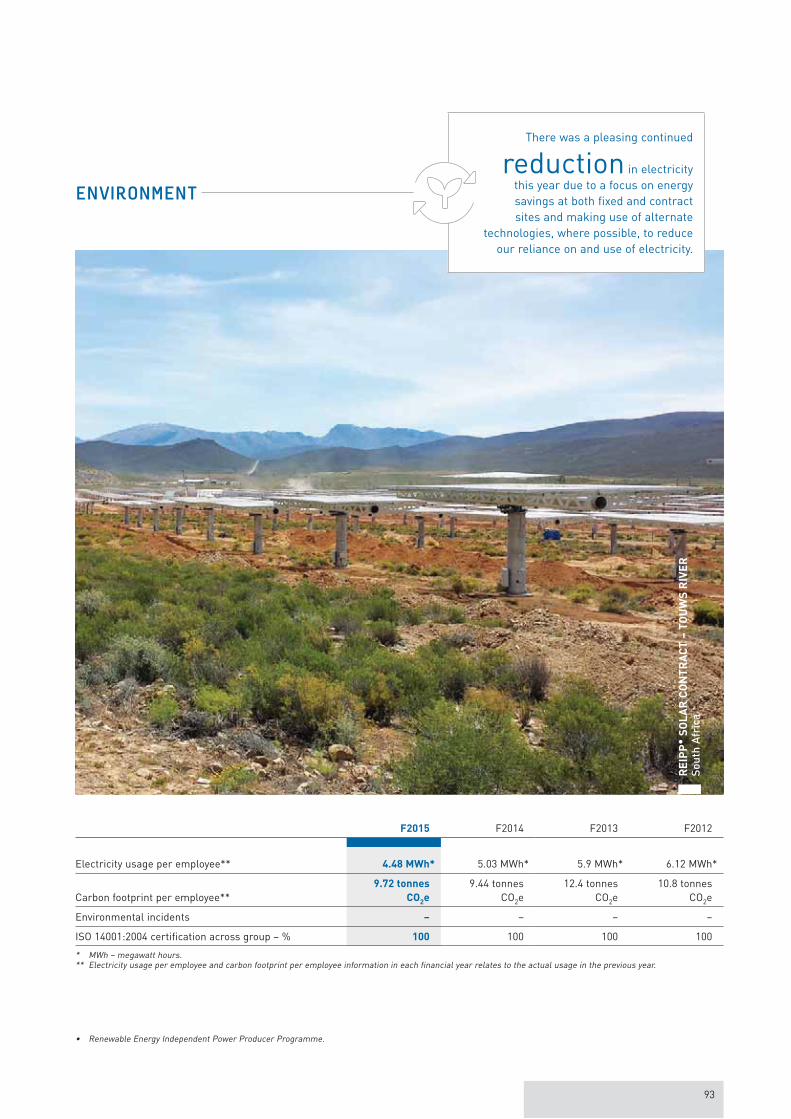
93
F2015 F2014 F2013 F2012
Electricity usage per employee** 4.48 MWh* 5.03 MWh* 5.9 MWh* 6.12 MWh*
Carbon footprint per employee**9.72 tonnes
CO2e
9.44 tonnesCO2e
12.4 tonnesCO2e
10.8 tonnesCO2e
Environmental incidents – – – –
ISO 14001:2004 certification across group – % 100 100 100 100
* MWh – megawatt hours.** Electricity usage per employee and carbon footprint per employee information in each financial year relates to the actual usage in the previous year.
There was a pleasing continued reduction in electricity
this year due to a focus on energy savings at both fixed and contract sites and making use of alternate
technologies, where possible, to reduce our reliance on and use of electricity.
ENVIRONMENT
RE
IPP
• S
OL
AR
CO
NT
RA
CT
– T
OU
WS
RIV
ER
So
uth
Afr
ica
• Renewable Energy Independent Power Producer Programme.
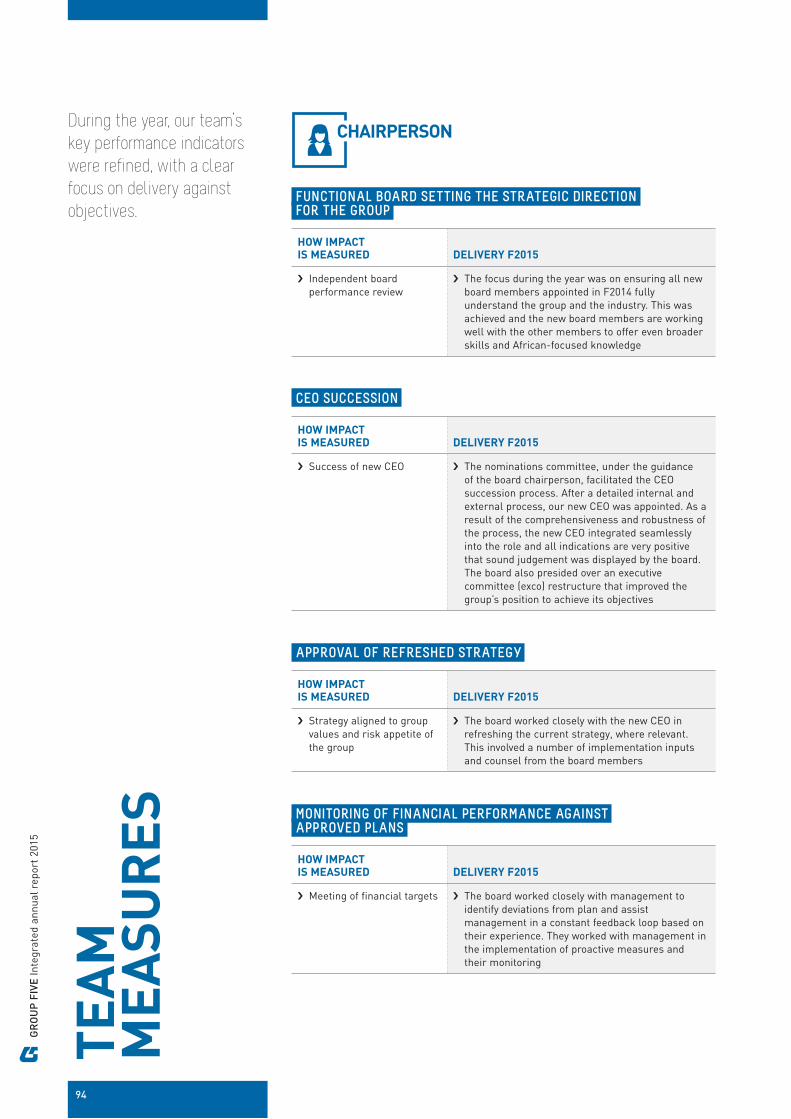
GR
OU
P F
IVE
Inte
grat
ed a
nnua
l rep
ort
2015
94
CHAIRPERSON
TE
AM
M
EA
SU
RE
SDuring the year, our team’s
key performance indicators
were refined, with a clear
focus on delivery against
objectives. FUNCTIONAL BOARD SETTING THE STRATEGIC DIRECTION FOR THE GROUP
HOW IMPACT
IS MEASURED DELIVERY F2015
Independent board performance review
The focus during the year was on ensuring all new board members appointed in F2014 fully understand the group and the industry. This was achieved and the new board members are working well with the other members to offer even broader skills and African-focused knowledge
CEO SUCCESSION
HOW IMPACT
IS MEASURED DELIVERY F2015
Success of new CEO The nominations committee, under the guidance of the board chairperson, facilitated the CEO succession process. After a detailed internal and external process, our new CEO was appointed. As a result of the comprehensiveness and robustness of the process, the new CEO integrated seamlessly into the role and all indications are very positive that sound judgement was displayed by the board. The board also presided over an executive committee (exco) restructure that improved the group’s position to achieve its objectives
APPROVAL OF REFRESHED STRATEGY
HOW IMPACT
IS MEASURED DELIVERY F2015
Strategy aligned to group values and risk appetite of the group
The board worked closely with the new CEO in refreshing the current strategy, where relevant. This involved a number of implementation inputs and counsel from the board members
MONITORING OF FINANCIAL PERFORMANCE AGAINST APPROVED PLANS
HOW IMPACT
IS MEASURED DELIVERY F2015
Meeting of financial targets The board worked closely with management to identify deviations from plan and assist management in a constant feedback loop based on their experience. They worked with management in the implementation of proactive measures and their monitoring

95
ANNUAL BOARD SCHEDULE COMPLIANCE
HOW IMPACT
IS MEASURED DELIVERY F2015
Schedule compliance Board schedule and objectives were met
ENSURING EFFECTIVE BOARD AND EXCO INTERACTIONS
HOW IMPACT
IS MEASURED DELIVERY F2015
Adherence to group policy for group strategy setting, budget approval and regular engagement
The board meets formally on a quarterly basis, with additional strategy sessions involving exco every six months. The exco members also attend board meetings when required. Exco members present material contract risk reviews to the board in line with the group’s pre-set levels of authority
BOARD EFFECTIVENESS
HOW IMPACT
IS MEASURED DELIVERY F2015
Board review Our external board reviews are completed every two years. The next board review is, therefore, due in F2016. During this year, an internal evaluation was done
COMPLETION OF CEO APPRAISAL
HOW IMPACT
IS MEASURED DELIVERY F2015
Completion of CEO appraisal
CEO appraisal completed
BOARD ATTENDANCE
HOW IMPACT
IS MEASURED DELIVERY F2015
Board attendance Board and sub-committee attendance remained good throughout the year
BR
I S
TE
EL
ST
OC
K
So
uth
Afr
ica

GR
OU
P F
IVE
Inte
grat
ed a
nnua
l rep
ort
2015
96
TEAM MEASURES
continued
SKILLS, EXPERIENCE AND TECHNICAL KNOWLEDGE OF STRATEGY, PERFORMANCE, RESOURCES, TRANSFORMATION, STANDARDS OF CONDUCT AND EVALUATION OF PERFORMANCE
HOW IMPACT IS MEASURED DELIVERY F2015
Evaluation of board skills against business requirements
The new and historic members integrated well and are delivering against expectations
LEVEL OF CONTRIBUTION AS A BOARD MEMBER
HOW IMPACT IS MEASURED DELIVERY F2015
Attendance at required meetings and contribution to meetings
All board meetings and sub-committees met the required quorum to be constituted, which allowed for the appropriate level of engagement and skills to be present
OFFERING SUFFICIENT TIME TO GROUP FIVE
HOW IMPACT IS MEASURED DELIVERY F2015
Number of other commitments and results of annual board evaluation
All board meetings and sub-committees met the required quorum to be constituted. Board members were readily available to assist the executive team
NON-EXECUTIVE DIRECTORS

97
COMPANY SECRETARY
ETHICS AND GOVERNANCE
HOW IMPACT IS MEASURED DELIVERY F2015
Code of ethics maintenance and communication, effective management of Tip-offs Anonymous line
The social and ethics committee functions effectively The ethics and compliance officer appointed in F2014 has delivered the expected value
from the role. Formal ethics and governance training continued and the group’s Tip-offs Anonymous line continues to be communicated, with improved levels of usage
COMPLIANCE WITH LAWS AND REGULATIONS
HOW IMPACT IS MEASURED DELIVERY F2015
Compliance exceptions, statutory and corporate status
The group’s operations met all material statutes and compliance requirements
DIRECTORS’ DUTIES AND INDUCTION
HOW IMPACT IS MEASURED DELIVERY F2015
Percentage of directors trained/inducted and adherence to laws and requirements
The group continues to induct and train all new directors through the Institute of Directors (SA). Attendance was 100% for F2015
ADHERENCE TO THE COMPANIES ACT AND JSE LISTINGS REQUIREMENTS
HOW IMPACT IS MEASURED DELIVERY F2015
Status of adherence and discretionary rating by manager
There were no adverse findings from the group’s sponsor, the JSE Limited or the Securities Regulation Panel (SRP)
BBBEE SCHEME ADMINISTRATION AND SHARE APPRECIATION RIGHTS ADMINISTRATION
HOW IMPACT IS MEASURED DELIVERY F2015
Effective administration of black management scheme and share appreciation rights scheme
The enhancements to the systems around administration implemented in F2014 have added the value anticipated and no changes were required in F2015

98
TEAM MEASURES
continued
CEO
GR
OU
P F
IVE
Inte
grat
ed a
nnua
l rep
ort
2015
GROUP STRATEGY DEVELOPMENT AND IMPLEMENTATION
WHAT THIS INVOLVED
DURING THE YEAR OBJECTIVE
HOW THIS IS
MEASURED DELIVERY
Put into action tangible steps to implement strategy, ensure group alignment of purpose and deliver on geographic, annuity revenue, multi-disciplinary and sector targets
A strategy that is endorsed by the board and focused on improved execution
Progress against planned implementation
The strategy was reviewed and reaffirmed by the CEO, exco and the board, with a specific focus on the entrenchment and delivery of the strategy
A revised group structure was put in place to support strategy implementation
Positive feedback on management structure, efficiency and effectiveness was received
Complexity was addressed, as well as speed of decisions/approvals
FOCUS AREAS FOR F2016
Further hone and clarify the group and cluster strategies to achieve material progress on strategy implementation Measurable strategic priorities with aligned actions for delivery against plan will be agreed with the board
GROUP TACTICAL AND OPERATIONAL PERFORMANCE, DELIVERY AND REPUTATION
WHAT THIS INVOLVED
DURING THE YEAR OBJECTIVE
HOW THIS IS
MEASURED DELIVERY
Addressing current loss-/profit-maker ratio in Engineering & Construction
Lead, promote and ensure integrity and reputation of the brand
Understand delivery problem areas, and put in place plans to rectify
Address reputational issues in South Africa following a Competition Commission industry investigation
Loss-/profit-maker ratio
Stakeholder feedback
Although the loss-/profit-maker ratio has not yet started to turn, significant corrective action was taken
Senior management continue to play leading roles in the various industry forums seeking to resolve industry matters
FOCUS AREAS FOR F2016
Further address the delivery areas by embedding the contract lifecycle and driving our refreshed culture of accountability Continue with our industry discussions to seek alternative and proactive ways to ensure progress in areas of concern

99
FINANCIAL PERFORMANCE MANAGEMENT
WHAT THIS INVOLVED
DURING THE YEAR OBJECTIVE
HOW THIS IS
MEASURED DELIVERY
Improve the poor overall group financial performance in line with the agreed group strategy
Ensure profitability and shareholder returns
Financial results versus return on equity (ROE), revenue, profit, cash, order book, business mix
The performance for the year to June 2015 was unacceptable to management, with a firm focus on recovery in place targeted from F2016
FOCUS AREAS FOR F2016
Group financial performance to improve materially towards achieving ROE >15%, ensure profit before interest and taxation and order book growth and to decrease overheads as a percentage of revenue
SAFETY, HEALTH, ENVIRONMENT (SHE)
WHAT THIS INVOLVED
DURING THE YEAR OBJECTIVE
HOW THIS IS
MEASURED DELIVERY
Implementation of new thinking and approaches towards achieving best-in-class in SHE
Safe operations Safety incidents, including injuries and fatalities
Lost-time injury frequency rate (LTIFR)
Environmental incidents
Health of employees
No fatalities during the year LTIFR improved from 0.17 to 0.15 No significant environmental incidents A decrease in the impact of chronic illness
on productivity
FOCUS AREAS FOR F2016
Implementation of behaviour-based safety programme Increase operational visibility by focusing on continued involvement and proactive management engagement on site Ongoing education of employees on health risk behaviours and follow-up on referrals
QUALITY
WHAT THIS INVOLVED
DURING THE YEAR OBJECTIVE
HOW THIS IS
MEASURED DELIVERY
A separation of quality from the safety portfolio and elevation of managers heading up this portfolio
Monitoring of non-conformances and applying the findings to improve execution
Resolution of non-conformances
Audits on contracts Lifecycle adherence Loss-making contracts
ISO 9001:2008 certification maintained A portfolio committee focusing on quality was
established across segments and have driven improvements in the execution of our quality objectives
Although loss-making contracts impacted results, firm action was taken
FOCUS AREAS FOR F2016
Further training to ensure improved execution

GR
OU
P F
IVE
Inte
grat
ed a
nnua
l rep
ort
2015
100
TEAM MEASURES / CEO EVALUATION
continued
RISK MANAGEMENT, GOVERNANCE AND COMPLIANCE
WHAT THIS INVOLVED
DURING THE YEAR OBJECTIVE
HOW THIS IS
MEASURED DELIVERY
Contract risk identification and management
Ensure that robust commercial policies and procedures are in place to manage legal risk/exposure
To effectively manage risks and compliance
Compliance with risk approval procedures
Contract loss-/profit maker ratio
Litigation and disputes
All bids have complied with the risk approval procedures
The construction loss-/profit maker ratio worsened, but firm action was and continues to be taken
Litigation and disputes increased during F2015 due to tougher market conditions and poor contract delivery
FOCUS AREAS FOR F2016
As outlined in this integrated annual report, the focus on managing risk will continue to be improved There are clear plans in place to improve the loss-/profit-maker ratio A new legal forum was established within the group to proactively manage disputes to minimise litigation Improved quality of delivery on contracts will result in reduced litigation and disputes
ORGANISATIONAL DEVELOPMENT, HUMAN CAPITAL, SUCCESSION AND TRANSFORMATION
WHAT THIS INVOLVED
DURING THE YEAR OBJECTIVE
HOW THIS IS
MEASURED DELIVERY
Driving transformation Succession plan for
self and other senior and critical roles, performance reviews, effective employee relations and a focus on employment equity and training and development
Achieve measurable improvement in African, Indian and Coloured executive appointments and overall employment equity
All areas functioning well and achieving desired outcomes
Leading position in sector in BBBEE performance
Number of African, Indian and Coloured appointments
Transformation action plan
Percentage of performance reviews completed, signed off succession plan, employee survey results, employment equity progression and training statistics
Scorecard performance
New black exco member appointed Senior group transformation manager appointed Transformation action plan with clear,
measurable deliverables agreed and being implemented
African, Indian and Coloured junior management representation improved from 76% to 78%, middle management from 29% to 30%, senior management from 25% to 28% and executive management from 11% to 25%
FOCUS AREAS FOR F2016
Continued improvements in transformation Minimum targets to be met for African, Indian and Coloured senior management appointments The group intends rolling out an organisational renewal programme that locks in the gains made and further improves our
employee engagement and alignment Alignment to new BBBEE scorecard
LEADERSHIP AND TEAMWORK
WHAT THIS INVOLVED
DURING THE YEAR OBJECTIVE
HOW THIS IS
MEASURED DELIVERY
Integrating group/cluster/segment functions
Reduced complexity in decision-making and improved execution of decisions made
Client feedback on especially multi-disciplinary contracts
Employee survey feedback on leadership and teamwork
Our restructured executive team is working well together
Our integrated Engineering & Construction structure increased leadership and teamwork across segments
Although our sites are operating more seamlessly, there are still areas to address to ensure the changes are deeply embedded
FOCUS AREAS FOR F2016
Further hands-on engagement with teams at all levels in the organisation to lead by example Continue with leadership training through our group Academy and selected external leadership development partners

101
FINANCIAL PERFORMANCE MANAGEMENT
WHAT THIS INVOLVED
DURING THE YEAR OBJECTIVE
HOW THIS IS
MEASURED DELIVERY
Managing complex contract problems and industry challenges, which impacted margins
Reporting on time, even against complex operational issues during the year
Managing financial risks against tough operational and market conditions
External and internal compliance management
Regular stakeholder engagement to keep the market informed of challenges
Drive financial performance of the group, while maintaining high standards of business integrity and sustainability
Timeous, accurate and transparent reporting
Financial risk management
Full compliance Positive stakeholder
communication and interaction, including investors, analysts and regulatory bodies such as SARS
Financial results versus plan for group
Headline earnings per share (HEPS), earnings per share (EPS), cash, ROE
Meeting external and group deadlines
Global credit rating Audit reports Feedback from
engagement
Group did not meet planned targets for HEPS, EPS or ROE
As outlined on pages 40 to 41, one loss-making contract impacted the results significantly. Although remedial actions were taken on this contract, the initial errors by the estimating team could not counter the full financial impact. Management reported the anticipated impact to the market as soon as it became evident that remedial action would not be able to stem the loss-making position
Targets for cash were met and exceeded All deadlines were met throughout year and at
year end Relevant and reliable information with adequate
disclosure was provided to stakeholders, which was required in a particularly difficult trading year
Even against huge challenges during the year, the credit rating was obtained and unchanged at A- long term rating and A1- short term rating, with rating outlook as stable
The number of significant findings from internal audit was reduced
Unqualified audit opinion received from external audit
Continued voluntary stakeholder engagements with SARS and SARB, with positive feedback
FOCUS AREAS FOR F2016
Adherence to plan Continued adherence to deadlines Enhance early warning systems
PAGERefer to case studies on pages 40 to 43.
Maintain credit rating Further reduce number of significant findings from internal audit Maintain unqualified audit opinion Maintain appropriate and balanced level of engagement with all key stakeholders Further develop engagement with the taxation authorities in the rest of Africa to ensure clarity on regulations
CFO
GR
OU
P F
IVE
Inte
grat
ed a
nnua
l rep
ort
2015
102
TEAM MEASURES / CFO EVALUATION
continued
RISK MANAGEMENT, GOVERNANCE AND COMPLIANCE
WHAT THIS INVOLVED
DURING THE YEAR OBJECTIVE
HOW THIS IS
MEASURED DELIVERY
Working with compliance teams to ensure adherence to policies and procedures
Managing complex contract problems and industry challenges, which impacted margins and required a risk management evaluation
Business and contract risk identification and management
Proactively manage legal risk/exposure
Drive compliance with policies and procedures in areas under control, including code of ethics and group values
Honest, transparent, accurate and realistic reporting
Effective risk management
Ensure no breaches in requirements
Acceptable internal audit results
Impact of actions taken to address non-compliance
Reduced/avoided disputes
No surprises Comprehensive risk
register Loss-/profit-maker
ratio Limited disputes and
litigation
Reduced number of significant findings from internal audit
Monitored compliance with financial regulatory requirements in the rest of Africa, with a specific focus on taxation risk
As outlined on pages 40 to 41, one loss-making contract impacted the results significantly. Although remedial actions were taken on this contract, the initial errors by the estimating team could not counter the financial impact. Management reported the anticipated impact to the market as soon as it became evident that remedial action would not be able to stem the loss-making position
Contributed to the enhancement of risk review procedures through amending the required assessments on areas of financial risk
Contract loss-/profit-maker ratio worsened to 35%
Proactive management on all disputes and litigation
FOCUS AREAS FOR F2016
Further develop engagement with taxation authorities in the rest of Africa to ensure clarity on regulations Improve time to complete foreign compliance requirements Timeous and appropriate communication to all stakeholders Ensure strict adherence to the financial risk assessment at clearing house and risk review stage of the contract lifecycle Stricter monitoring of actual performance against planned results set out at risk review stage and take action against
non-performance Continued proactive management to address or prevent any disputes and litigation
IT DEVELOPMENT AND ENHANCEMENT AND SUPPLY CHAIN MANAGEMENT
WHAT THIS INVOLVED
DURING THE YEAR OBJECTIVE
HOW THIS IS
MEASURED DELIVERY
Connectivity and usability of IT infrastructure across site and business locations
Cost and business appropriate IT solutions
Developing supply chain strategies that address suppliers, emerging enterprises and sub-contractors
Effective supply chain management
Ensure IT infrastructure supports strategy and results in broad connectivity
Drive new thinking and best practice approaches to being best-in-class in IT
Cluster feedback Cluster feedback and
connectivity Number of specific
ideas put forward for implementation in IT environment where benefits outweigh the costs
Although supply chain initiatives have been implemented with some level of success, further enhancement is required
IT initiatives continued to ensure the appropriate fit of technology for the business
Connectivity remained a critical issue to support the business initiatives in place and we continued to focus on improving the most optimal solution per site
The IT department focus has been on a cost-saving and optimisation drive in the current difficult market conditions without prejudicing the offering or risk management. This was achieved with costs below budget, whilst all critical systems and requirements were delivered
IT focus has been on ensuring that projects are only undertaken when return on investment (ROI) has been tabled and approved
FOCUS AREAS FOR F2016
Implement revised supply chain initiatives, as agreed with exco Improve on quality of connectivity and optimal cost Continue with best-in-class IT offering to match business requirements A number of business requests have been received, which will be implemented in F2016, with a focus on ensuring the business
tracks actual ROI to planned ROI

103
EXECUTIVE COMMITTEE MEMBERS
GROUP STRATEGY DEVELOPMENT AND IMPLEMENTATION
WHAT THIS INVOLVED
DURING THE YEAR OBJECTIVE
HOW THIS IS
MEASURED DELIVERY
Group strategy support
Areas under control to align to and support the execution of the group strategy
Achievement against group targets
Approved cluster strategy and plan
Each cluster executive re-evaluated their actions to deliver on the group strategy. Although Investments & Concessions and Manufacturing delivered on their targets, Engineering & Construction missed theirs. The cluster was restructured during the year to ensure improved delivery
FOCUS AREAS FOR F2016
To substantially deliver against strategy objectives, with a particular focus on African and multi-disciplinary/engineer, procure and construct order book growth
FINANCIAL PERFORMANCE MANAGEMENT
WHAT THIS INVOLVED
DURING THE YEAR OBJECTIVE
HOW THIS IS
MEASURED DELIVERY
OPERATIONAL EXCO MEMBERS
Drive financial performance of the clusters/segments
To deliver against budgets for the cluster and segments
Financial results versus plan for order book, ROE, profit before interest and taxation (PBIT), cash and debtors
Manufacturing and Investments & Concessions delivered against plan. Engineering & Construction did not meet expectations. Firm actions were taken to address this
FOCUS AREAS FOR F2016
Financial results >= plan for order book, ROE, PBIT, cash, forecasts and debtors Quality order book growth and cash remain priorities Reduction in fixed overheads as a percentage of revenue
WHAT THIS INVOLVED
DURING THE YEAR OBJECTIVE
HOW THIS IS
MEASURED DELIVERY
SUPPORT EXCO MEMBERS
Management of budgets under own area of control
To ensure that costs are contained and in line with planned expenditure
Budgets versus actual Saving initiatives for
the group
A resetting of budgets occurred in line with cost measures implemented
FOCUS AREAS FOR F2016
Ongoing overhead cost reduction and a focus on efficiencies between group and clusters/segments

GR
OU
P F
IVE
Inte
grat
ed a
nnua
l rep
ort
2015
104
TEAM MEASURES / EXECUTIVE COMMITTEE MEMBERS
continued
BUSINESS DEVELOPMENT/CLIENT FOCUS
WHAT THIS INVOLVED
DURING THE YEAR OBJECTIVE
HOW THIS IS
MEASURED DELIVERY
Strategic customer relationship management
To develop and maintain strong relationships with key clients
Repeat business Positive client
feedback Good balance of
sector, product and geography
During the year, a prime example of the group securing a contract through its strategic customer relationship management methodology was Kpone. Refer to pages 42 to 43
FOCUS AREAS FOR F2016
Stakeholder strategy to be finalised and implemented
SAFETY, HEALTH AND ENVIRONMENT
WHAT THIS INVOLVED
DURING THE YEAR OBJECTIVE
HOW THIS IS
MEASURED DELIVERY
Compliance and management, as well as driving new thinking and approaches to being best-in-class
Meet the group’s targets
Safety incidents, including injuries and fatalities
LTIFR Environmental
incidents Health of employees
No fatalities during the year LTIFR improved from 0.17 to 0.15 No environmental incidents A decrease in the impact of chronic illness
on productivity
FOCUS AREAS FOR F2016
Implementation of behaviour-based safety programme Increase operational visibility by focusing on continued involvement and proactive management engagement on site Ongoing education of employees on health risk behaviours and follow-up on referrals Ongoing reinforcement of safety issues and regular toolbox talks
QUALITY
WHAT THIS INVOLVED
DURING THE YEAR OBJECTIVE
HOW THIS IS
MEASURED DELIVERY
A separation of quality from the safety portfolio and elevation of managers heading up this portfolio
Monitoring of non-conformances and applying the findings to improve execution
ISO 9001:2008 certification
Resolution of non-conformances
Audits on contracts Lifecycle adherence Loss-making
contracts
ISO 9001:2008 certification maintained A portfolio committee focusing on quality was
established across segments and has driven improvements in the execution of our quality objectives
Although loss-making contracts impacted results, firm action was taken
FOCUS AREAS FOR F2016
Further training to ensure improved operational execution

105
RISK MANAGEMENT, GOVERNANCE AND COMPLIANCE
WHAT THIS INVOLVED
DURING THE YEAR OBJECTIVE
HOW THIS IS
MEASURED DELIVERY
Contract risk identification and management
Ensure that robust commercial policies and procedures are in place to manage legal risk/exposure
Ensure strong compliance and ethics and adherence to company values
Effective management of risks and compliance
To ensure that ethical behaviour and adherence to the company values become the norm across sites and operations
Compliance to risk approval procedures
Contract loss-/profit-maker ratio
Litigation and disputes
Tip-offs Anonymous reports
All bids have complied with the risk approval procedures
The construction loss-/profit-maker ratio worsened, but firm action has been and continues to be taken
Litigation and disputes increased during F2015 due to tougher market conditions and poor contract delivery
Substantial progress was made in entrenching the new compliance and ethics role. Ethics training for 35 line managers took place
Increased awareness of the group’s Tip-offs Anonymous line resulted in an increase in fraud-related tip-offs from 12 in 2014 to 21 in F2015. All of these calls were successfully closed, with 21 disciplinary cases
FOCUS AREAS FOR F2016
As outlined in this integrated annual report, the focus on managing risk will continue to be improved Targeted reduction in reported construction loss-/profit-maker ratio The group Academy will further invest in operational improvement programmes A new legal forum was established within the group to proactively manage disputes to minimise litigation Improved quality of delivery of contracts will result in reduced litigation and disputes Ethics training will be embedded into our induction programmes
ORGANISATIONAL DEVELOPMENT, HUMAN CAPITAL, SUCCESSION AND TRANSFORMATION
WHAT THIS INVOLVED
DURING THE YEAR OBJECTIVE
HOW THIS IS
MEASURED DELIVERY
Employment equity (EE) and transformation
Training and development
Positive culture and good alignment to Group Five values
Performance review process in place and operating for each cluster
To improve our diversity within the group across all levels
Training programmes that are aligned to group strategy execution
Positive score in the employee survey
Performance reviews completed for all skilled technical resources and junior and middle management
Achievement against plan
Percentage of South African payroll spend
Employee survey feedback
Performance reviews for required employees and agreed actions executed
An EE plan was successfully approved by the Department of Labour, with a number of improvements seen
An EE development programme was launched for skilled technical and management level employees
Targeted spend was achieved Critical training programmes were rolled out
for engineers and foremen Employee survey feedback score exceeded 70%
for the first time Performance reviews completed for 82% of
eligible employees
FOCUS AREAS FOR F2016
A development programme for a range of employees will continue to be rolled out Programmes for commercial, planning, estimating and supply chain areas will be rolled out Target further increase in percentage of payroll spent on training An organisational renewal programme is planned, which will focus on refreshed values for the group A revised performance management scheme for the clusters will be put in place to strictly measure performance against KPIs
and the level of effort and motivation

GR
OU
P F
IVE
Inte
grat
ed a
nnua
l rep
ort
2015
106
TEAM MEASURES / EXECUTIVE COMMITTEE MEMBERS
continued
LEADERSHIP AND TEAMWORK
WHAT THIS INVOLVED
DURING THE YEAR OBJECTIVE
HOW THIS IS
MEASURED DELIVERY
OPERATIONAL EXCO MEMBERS
Integrating group/cluster/segment/functions
Group Five operating as one entity across segments and clusters
Aligned and seamlessly integrated teams
As indicated in this integrated annual report, we implemented practices on sites to ensure teams are remunerated for delivery on the outcome of the contract and not separate segment performance
Feedback from sites and the operations indicate that the group has started to significantly improve how it integrates across clusters and segments
FOCUS AREAS FOR F2016
Final implementation of our reward and recognition policies to place greater emphasis on collaboration and teamwork Internal mentoring for high-potential talent will be a key deliverable
WHAT THIS INVOLVED
DURING THE YEAR OBJECTIVE
HOW THIS IS
MEASURED DELIVERY
SUPPORT EXCO MEMBERS
Integrating group/cluster/segment functions
Support departments seen as integral to the success of wider operations
Feedback from cluster executives
Positive feedback received
FOCUS AREAS FOR F2016
Further roll out of key support initiatives to ensure group strategy is met

107

GR
OU
P F
IVE
Inte
grat
ed a
nnua
l rep
ort
2015
108
TE
AM
RE
MU
NE
RA
TIO
N
01 REMUNERATION POLICY
The group’s remuneration strategy aims to attract, retain and
motivate skilled and performing employees to execute the
group’s strategy.
The group offers an integrated remuneration and reward model, which comprises:
This remuneration review is
based on the principles,
guidance and requirements of
the King Code of Governance
Principles (King III), the
Companies Act and the
JSE Listings Requirements.
The F2015 remuneration policy was approved by the group’s shareholders at the most recent annual general meeting (AGM) in November 2014.
(STI)a short term
incentive
(LTIP)a long term incentive
programme
(CTC) a cost to company/
guaranteed pay component
GROUP’S REMUNERATION

109
FOCUS AREAS FOR F2015
The executive performance format and process was refined for all prescribed officers to ensure relevant performance measures in line with the group’s strategy and restructure
Multi-disciplinary contract incentives were changed to encourage broader collaboration
The implementation of grading and remuneration for all employees linked directly to career path growth is a first for our industry
We reduced anomalies in our salary bands by 13%
Our remuneration policy was approved at the group’s AGM in November 2014, with 99% of shareholders voting in favour of the policy
FOCUS AREAS FOR F2016
We will refine our short term incentives to ensure stronger alignment of remuneration to performance and increasing rewards for outstanding contributions and penalties for poor performance
Bonus schemes will be standardised across segments to ensure a common approach
Following initial changes made this year to the remuneration on multi-disciplinary contracts, these practices will be standardised across Engineering & Construction segments to ensure that multi-disciplinary sites work towards the overall achievement of contract success and not individual performance
The group’s pay mix is compared to the market(s) from which it attracts and recruits employees.
The remuneration committee (remco) assists the board in setting the remuneration policies for the group, as well as the remuneration of senior employees and particularly the executive directors and the group’s prescribed officers. Independent non-executive director Dr JL Job is the chairperson of the remco. MR Thompson and NJ Chinyanta serve as independent non-executive directors to the board and the remco. During the reporting year, the previous CEO Mike Upton (who retired on 30 November 2014), as well as the newly appointed CEO Eric Vemer (who assumed his role on 1 December 2014) and the group human resources executive committee member Jesse Doorasamy attended the remco meetings.
The committee issues the mandate for the annual guaranteed remuneration (cost to company) review. The committee also advises the main board of directors, and makes recommendations to shareholders on fees for directors and non-executive directors.
Group Five benchmarks its remuneration practices against both the market from which it recruits and the most relevant markets where employees frequently might seek alternative employment. We also utilise available reputable benchmark remuneration surveys to ensure our remuneration packages are both competitive, fair and aligned to group policy.
Our policy is to ensure that employees’ cost to company (CTC) is positioned between the 60th and 65th percentiles of the market. At an individual employee level, the annual CTC increase is determined by the individual’s pay relative to the position and the Paterson band he or she is in, as well as the performance of the individual in the role. We group our positions along the following lines:
GENERAL – HR, administration, safety, etc. FINANCE AND IT – accountants, IT, etc. OPERATIONS – logistics, quality, etc. ENGINEERING AND TECHNICAL – core construction positions COMMERCIAL – quantity surveying and estimating positions MANUFACTURING – manufacturing positions
Each year we review individual employee positions within the salary ranges defined for the above groupings and deal with high and low anomalies appropriately to ensure we only have employees outside of our remuneration policy by exception.
DURING THE YEAR, THE REMCO FOCUSED on ensuring that the
remuneration paid to employees remained in line with market norms to attract
and retain skilled employees.
The committee also focused on continuing with the implementation and communication of the long term incentive programme (LTIP) that was implemented in the prior year to ensure that all participants understand the programme and its intended outcome and incentives.

GR
OU
P F
IVE
Inte
grat
ed a
nnua
l rep
ort
2015
110
TEAM REMUNERATION
continued
02 REMUNERATION STRUCTURE
COST TO COMPANY VARIABLE PAY
ELEMENT BASE PAY BENEFITSSHORT TERM
INCENTIVELONG TERM INCENTIVE
GROUP FIVE
Monthly salary
Hourly wage
Medical aid
Pension fund/
provident fund
Death benefit
Car allowance
Annual incentive
Bonus scheme
Share appreciation
rights
Performance shares*
Bonus shares
STRATEGIC
INTENT Attraction/retention
Provides a comprehensive remuneration offering inclusive of cash and benefits
Retention of skills in terms of the comprehensiveness of benefits offered
Rewards company performance
Rewards individual performance
Attraction/retention/recognition
Rewards company performance
Rewards individual performance
Attraction/retention Recognition of
contribution to company success
ELIGIBILITY All employees
Executive directors Prescribed officers Senior management
at a corporate, cluster and segment level
Executive directors Prescribed officers Senior management
at a corporate, cluster and segment level
ELIGIBILITY
PAY
CRITERIA
Market-based pay according to job grouping, grade and individual performance
Hurdle rate for payment includes targeted return on equity and profit thresholds
Individual award, subject to targets set for profit and cash generation, transformation measures achieved and individual performance
Target pay-out based on 1.2 times CTC
Maximum pay-out set at 2.4 times CTC
Allocation based on remuneration grade
Target pay set as a percentage of cost to company per participant
Subject to share price appreciation, return on capital target and total shareholder return realised relative to sector
* Performance shares are not allocated to segment senior management, as it is aimed at executive directors, prescribed officers and senior management at a corporate and cluster level who have a substantial impact on the long term strategic performance of the group.
Executive directors, prescribed officers and senior management at corporate, cluster and segment level are offered overseas travel every three to five years to facilitate exposure and development.

111
VARIABLE PAY
SHORT TERM INCENTIVES (STIs)
The group awards management and most salaried employees an annual performance incentive. The actual value awarded is subject to the achievement of predetermined thresholds relating to the performance and position of the group, cluster, segment and individual performance over the financial year. Non-executive directors do not participate in any variable pay offering. For executive directors, prescribed officers, corporate officers, segment directors and managing directors of the company, two thresholds need to be achieved before an incentive pay-out will be considered by the remco.
These are:
On-target performance, with all thresholds and measures met, will result in the CEO earning an incentive bonus of 1.2 times his annual total cost to company (CTC). The incentive is capped at 2.4 times the CTC.
Our policy is structured to result in 55% OF THE CEO’S REMUNERATION BEING DIRECTLY LINKED TO THE COMPANY’S PERFORMANCE
and 45% to individual performance. 52% of the CFO’s remuneration and 51% of
prescribed officers’ remuneration is linked to company performance.
The executive directors’ and prescribed officers’ target STI participation (target percentages of cost to company) was/is, therefore, as follows:
STI PARTICIPATION, ASSUMING ALL THRESHOLDS AND MEASURES ARE MET, COMPARED TO CTC
CEO CFO PRESCRIBED OFFICERS
F2016 120% 110% 105%
F2015 120% 110% 105%
F2014 120% 110% 105%
F2013 140% 120% 110%
The STI, which is intended to reward short term company
performance, is paid out over two tranches at six-monthly
intervals commencing in September following the financial
year end in which it was earned.
If the thresholds of return on equity and profit before tax – being the hurdle rates for eligibility for payment – are met, a maximum of 15% of group profit before tax (PBT), before accounting for the required accrual for directors’ STI, is made available as an incentive pool to approximately 120 individuals. These include the executive directors, prescribed officers and senior managers of the group. The individual incentive value is based on a grade-related participation percentage of company and cluster or business segment profit before tax.
The group achieving a
minimum return on equity
(ROE) percentage of no less than the group’s
weighted average cost of capital (WACC) for
the year.
01
The group achieving a
pre-set minimum level
of profit before tax, as approved by the main board at the beginning of
a financial year.
02
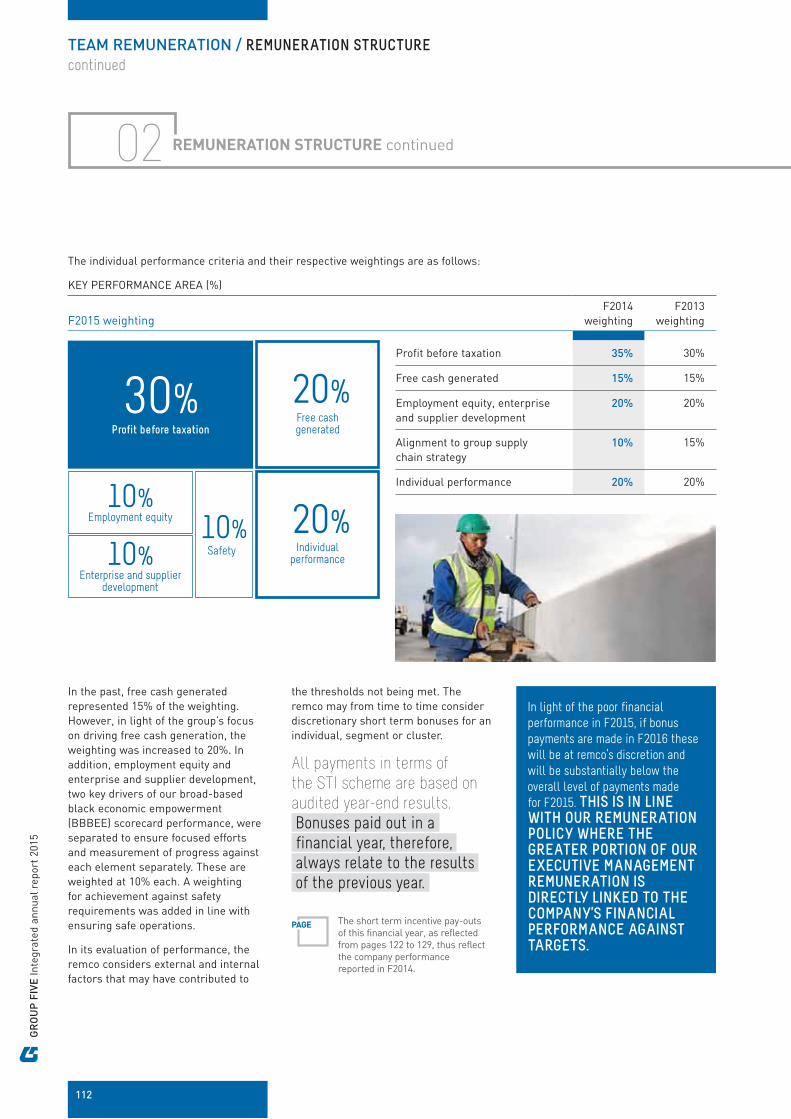
GR
OU
P F
IVE
Inte
grat
ed a
nnua
l rep
ort
2015
112
The individual performance criteria and their respective weightings are as follows:
KEY PERFORMANCE AREA (%)
F2015 weightingF2014
weightingF2013
weighting
Profit before taxation 35% 30%
Free cash generated 15% 15%
Employment equity, enterpriseand supplier development
20% 20%
Alignment to group supplychain strategy
10% 15%
Individual performance 20% 20%
TEAM REMUNERATION / REMUNERATION STRUCTURE
continued
02
30%Profit before taxation
20%Free cash generated
10%Employment equity
10%Enterprise and supplier
development
10%Safety
20%Individual
performance
the thresholds not being met. The remco may from time to time consider discretionary short term bonuses for an individual, segment or cluster.
All payments in terms of
the STI scheme are based on
audited year-end results.
Bonuses paid out in a financial year, therefore, always relate to the results of the previous year.
PAGE The short term incentive pay-outs of this financial year, as reflected from pages 122 to 129, thus reflect the company performance reported in F2014.
In the past, free cash generated represented 15% of the weighting. However, in light of the group’s focus on driving free cash generation, the weighting was increased to 20%. In addition, employment equity and enterprise and supplier development, two key drivers of our broad-based black economic empowerment (BBBEE) scorecard performance, were separated to ensure focused efforts and measurement of progress against each element separately. These are weighted at 10% each. A weighting for achievement against safety requirements was added in line with ensuring safe operations.
In its evaluation of performance, the remco considers external and internal factors that may have contributed to
In light of the poor financial
performance in F2015, if bonus
payments are made in F2016 these
will be at remco’s discretion and
will be substantially below the
overall level of payments made
for F2015. THIS IS IN LINE WITH OUR REMUNERATION POLICY WHERE THE GREATER PORTION OF OUR EXECUTIVE MANAGEMENT REMUNERATION IS DIRECTLY LINKED TO THE COMPANY’S FINANCIAL PERFORMANCE AGAINST TARGETS.
REMUNERATION STRUCTURE continued

113
CEO
The previous CEO Mike Upton
was awarded a bonus of 133%
of his annual guaranteed CTC, which was 111% of the targeted bonus of 120% of annual guaranteed CTC.
CEO
The current CEO Eric Vemer
was awarded a bonus of 137%
of his annual guaranteed CTC, which was 137% of the targeted bonus of 100% of annual guaranteed CTC.
CFO
The CFO Cristina Teixeira
was awarded a bonus of 110%
of her annual guaranteed CTC, which was on target at 110% of annual guaranteed CTC.
PRESCRIBED OFFICERS
The prescribed officers were on
average awarded bonuses of 87%
against a target of 100% of annual guaranteed CTC.
COMPARATIVE AWARDS AND PAY-OUTS
Based on achievements against various performance thresholds, the senior management teams were paid as follows this year:
PAGE Refer to pages 98 to 106 and 122 to 129 for achievement against key performance indicators and linked STI payments awarded for F2014, which are reflected in F2015 remuneration.
LONG TERM INCENTIVES (LTIs)
The long term incentive plan (LTIP) forms part of variable compensation and is used to attract, retain and motivate employees who influence the long term sustainability and strategic objectives of Group Five. The purpose is to foster sustainable performance or value creation over the long term, which is aligned to the group’s strategy and which enhances shareholder value. Its main characteristic is the promise to deliver value over a future vesting period, once performance criteria are met or exceeded.
The group’s new LTIP was implemented in February 2014 following its review and approval by shareholders.
The LTIP consists of three elements:
SHARE APPRECIATION RIGHTS (SARs)Value created through share price growth
1
PERFORMANCE SHARESFull value shares – value created through returns to shareholders relative to competitors
2
BONUS SHARES Full value shares – value created through short term performance and strategy alignment
3At the discretion of the remco, executives and selected senior managers in Paterson grades F – D, who are in good standing with the group, will be offered a weighted combination of the three LTIP elements.
It is envisaged that the combined implementation of the three long term incentive elements will allow Group Five to:
Remain competitive in its annual cash incentives and share-based incentives Reward long term sustainable company performance Retain senior employees Ensure that executives share a significant level of personal risk along with the
group’s shareholders

GR
OU
P F
IVE
Inte
grat
ed a
nnua
l rep
ort
2015
114
LTIP ELEMENT SUMMARY
SARs – ADDRESS SHARE PRICE
PERFORMANCE SHARES – ADDRESS RETURNS
BONUS SHARES – ADDRESS PERFORMANCE
ELIGIBILITY
Executive directors, prescribed officers, senior management (within Paterson grading bands F – D).
Executive directors, prescribed officers and senior management (within Paterson grade bands F & E).
Executive directors, prescribed officers and senior management (within Paterson grade bands F, E & D).
VESTING PERIOD
Three years from date of allocation, in equal tranches on the third, fourth and fifth anniversaries.
On the third anniversary of the award to the extent that performance indicators are met.
On the third anniversary of the award to the extent that performance indicators are met.
PERFORMANCE CRITERIA
Share price underpinned relative to strike price.
The average annual return on capital (ROC) in the three-year period post the award and the total shareholder return (TSR) when compared to a group of peers over the same period.
Conditional only on continued employment and being in good standing with the group at date of vesting.
TERMINATION
“No-fault of employee termination”* – all SARs, regardless of whether vested or not, will be settled by the group.
“Fault of employee, termination or resignation”* – all SARs not vested will be cancelled.
“No-fault of employee termination”* – performance shares will be pro-rated over the period from grant date to termination date as if the target performance criteria were met at date of termination and settled by the group.
“Fault of employee, termination or resignation”* – all unvested performance shares will be cancelled.
“No-fault of employee termination”* – all bonus shares will receive accelerated vesting and these will be settled by the group on shares that were granted.
“Fault of employee, termination or resignation”* – all unvested bonus shares will be cancelled.
SETTLEMENT
Settled through equity. SARs not exercised by the sixth anniversary date lapse.
Settled through equity. As far as is practical, settled through cash.
AGREED PERFORMANCE MEASURES
The SARs are self-regulated by the share price that is market-driven.
Return on the group’s capital (ROC).Total shareholder return (TSR) relative to nine peers.
Based on the short term measures of earnings, cash generation, return on capital, non-strategic criteria and individual performance.
* A “no-fault of employee termination” would be for retirement, disability, death and retrenchment. A “fault of employee termination or resignation” would be for dismissal due to misconduct or poor performance or resignation by the employee.
02
TEAM REMUNERATION / REMUNERATION STRUCTURE
continued
REMUNERATION STRUCTURE continued
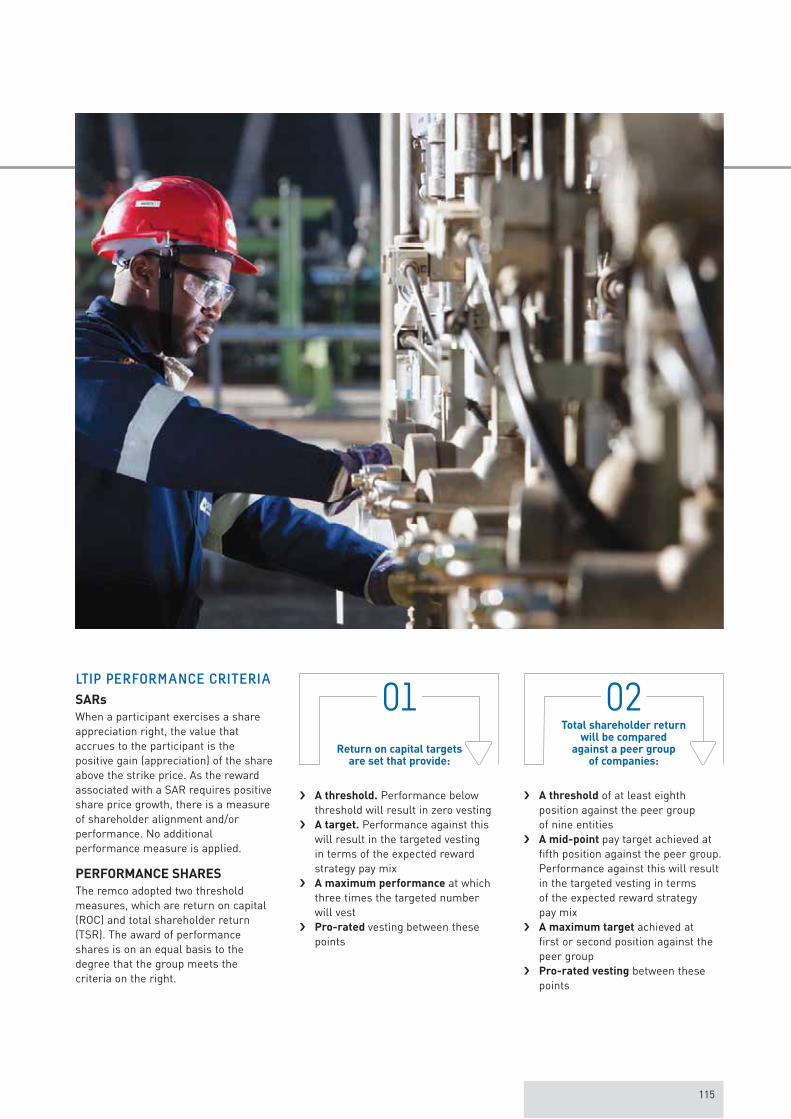
115
LTIP PERFORMANCE CRITERIA
SARs
When a participant exercises a share appreciation right, the value that accrues to the participant is the positive gain (appreciation) of the share above the strike price. As the reward associated with a SAR requires positive share price growth, there is a measure of shareholder alignment and/or performance. No additional performance measure is applied.
PERFORMANCE SHARES
The remco adopted two threshold measures, which are return on capital (ROC) and total shareholder return (TSR). The award of performance shares is on an equal basis to the degree that the group meets the criteria on the right.
A threshold. Performance below threshold will result in zero vesting
A target. Performance against this will result in the targeted vesting in terms of the expected reward strategy pay mix
A maximum performance at which three times the targeted number will vest
Pro-rated vesting between these points
A threshold of at least eighth position against the peer group of nine entities
A mid-point pay target achieved at fifth position against the peer group. Performance against this will result in the targeted vesting in terms of the expected reward strategy pay mix
A maximum target achieved at first or second position against the peer group
Pro-rated vesting between these points
Return on capital targets are set that provide:
Total shareholder return will be compared
against a peer group of companies:
01 02

GR
OU
P F
IVE
Inte
grat
ed a
nnua
l rep
ort
2015
116
The sliding scale pay-out is applied as per the two graphs. The main board of directors and the remco review the performance criteria annually for future grants. This is proactively communicated prior to the grant in the annual remuneration report.
11
EXTENT OF ALLOCATION/AWARD VSRETURN ON CAPITAL (%)
221210 15 17 19
Average ROC for the three-year period post allocation of the award
14 16 18 20 2113
Mul
tiple
of t
arge
t ves
ting
– co
mbi
ned
perf
orm
ance
and
bon
us s
hare
s
00
0.29
1.2
0.57
0.86
1.6
2.0
2.4
3.0
2.8
3.0 3.0
Threshold Target Maximum
9 8 1710 5 4 3 26
EXTENT OF ALLOCATION/AWARD VS TSR POSITIONING TO PEER COMPARATOR GROUP (%)
Mul
tiple
of t
arge
t ves
ting
– co
mbi
ned
perf
orm
ance
and
bon
us s
hare
s
00
3.0 3.0
0.25
1.0
0.50
0.75
1.67
2.33
Average of TSR for the three-year period post allocation of the award
Threshold Target Maximum
TEAM REMUNERATION / REMUNERATION STRUCTURE
continued
02
Combining these performance criteria results in a reward and retention strategy based on a full
spectrum of share, strategic and operational performance. The group believes this ensures that
management and shareholder interests are aligned.
BONUS SHARES
Bonus shares are a means of retention and are based on performance in the preceding financial year at the date of the allocation. This allocation is based on the short term/annual incentive measures, which include meeting the group’s annual internal targets in each of the categories below:
PROFITBEFORE TAXATION
FREE CASHGENERATED
EMPLOYMENT EQUITY
ENTERPRISE AND SUPPLIER
DEVELOPMENT SAFETYINDIVIDUAL
PERFORMANCE
30% 20% 10% 10% 10% 20%
PAGE As outlined on page 112, the targets were revised this year in line with the group’s restructure.
DURATION OF THE SCHEME
It is envisaged that the LTIP scheme will provide five annual offers (with a combination of allocations of SARs, awards of performance shares and grants of bonus shares). The individual SAR issues lapse after six years if not exercised.
REMUNERATION STRUCTURE continued

117
FOCUS AREAS DURING THE YEAR 03
REMUNERATION OF THE NEWLY CONSTITUTED EXECUTIVE COMMITTEE
Following the appointment of the new CEO Eric Vemer and the reconstitution of the executive committee (exco), the remco ensured that the CEO and the newly appointed exco members, as well as those now assigned to larger portfolios, are remunerated according to the group’s remuneration policy and in line with market-based remuneration. Exco remuneration is, therefore, now fully compliant with the group’s remuneration policy and mandate.
LABOUR ENVIRONMENT
Although labour activism decreased this year from the prior year, demands from major trade unions operating within the construction sector for significantly higher wages and improved employee benefits, primarily in the group’s home market of South Africa, continued to plague the industry. Contract completion bonus demands across construction sites in South Africa, as well as demands for travel, food, accommodation and site-specific allowances continued. Improved social benefits, such as health insurance and pension contributions, are also specified. Although we have a low union membership of 17%, the non-unionised employees on our sites have similar demands and the propensity to militancy on sites has increased.
Against this backdrop, the group continues to take a firm stance in dealing with labour unrest and associated community activism, as this is a material risk to the safety of our employees and to the delivery of large, mainly public sector, multi-disciplinary contracts. As a group we believe it is critical that the principles of centralised bargaining be maintained, despite substantial pressure from unions in the sector to deviate from this key tenant of sound industrial relations.
Our consistent response has been to not engage in addressing industry issues at site level or by individual contract, but at a sector level. We are members of the South African Federation of Civil Engineering Contractors (SAFCEC) and the Steel and Engineering Industries Federation of South Africa (SEIFSA) where we have assumed leadership roles within the wage negotiation committees. This allows us to influence challenges at an industry level. During the year, we further augmented the industrial relations management capabilities of the human resources teams across all businesses within the group. This, coupled with a more proactive approach, assisted in identifying and resolving the majority of issues at site level before they escalated.
EDUCATION AROUND REMUNERATION
The HR team continued to focus on educating line managers and employees on the group’s remuneration policy and practice, the structure of total remuneration and the group’s approach to rewarding performance. These sessions have proved invaluable in ensuring better informed employees. The group’s policy of remunerating around the 65th percentile of the market continues to ensure the successful attraction and retention of critical skills in line with our remuneration strategy. This places our remuneration competitively above the market median. Furthermore, due to the lower base of fixed remuneration, and higher proportion of variable pay linked to performance, our remuneration strategy assists the group’s sustainability through industry down-cycles.
LEGISLATIVE COMPLIANCE
The group focused on ensuring that its remuneration practices are compliant with new legislation introduced, particularly employment equity
legislation. The main changes to the legislation included compliance with the equal pay for equal work principle. We have reviewed our practices accordingly. Pleasingly, the Department of Labour audit in the year under review found that our remuneration practices were compliant.
JOB GRADING
Following the implementation of a Paterson job grading system during F2013, the group continued to align its grades across segments and clusters. This resulted in greater consistency and standardisation of job titles. As a result of this exercise, the group now has formal grading, career development plans and associated CTC ranges for critical grades across the group. This represents a first for our industry and positions the group as a leader in terms of transparent and defendable remuneration practices.
BENEFITS
In addition to the risk benefits offered by our retirement funding structures, we offer death and disability insurance cover through a group personal accident (GPA) insurance policy to all permanent and temporary employees. As with the base pay, the group reviews these employee benefits on a regular basis to ensure they remain competitive against prevailing market trends and conditions. Following a competitive tendering process undertaken during the year, the group was able to achieve an improved GPA offering at a significant saving.
During the year, the group further enhanced its disability benefit which now pays out 75% of pensionable income until retirement for permanent total disability in addition to pension contributions. This represents a substantial improvement to the previous capital disability benefit pay-out for disabled employees on the group’s disability scheme.

GR
OU
P F
IVE
Inte
grat
ed a
nnua
l rep
ort
2015
118
TEAM REMUNERATION
continued
04 PERFORMANCE REVIEWS AND KEY PERFORMANCE INDICATOR (KPI) SETTING
5.9
YEAR-ON-YEAR COMPARISON OF PERFORMANCE RATINGS BETWEEN F2014 AND F2015
5Outstanding
Notranked
2Marginal
3Good
4Superior
1Unsatisfactory
0.7
F2015 F2014
2.13.0
69.1
19.2
6.1
1.1
2.5 4.4
62.7
23.7
% o
f em
ploy
ees
per
ratin
g ca
gteg
ory
ALL EMPLOYEES
Annual performance reviews are required for permanent salaried employees in the group. These reviews provide input into the annual salary review process and represent an important aspect in determining the remuneration increase for each employee.
Through the group’s training Academy we focused on the quality and consistency of our performance review processes and the outcomes.
During the year, 82% of our eligible employees completed formal
appraisals, which exceeded our goal of targeting a minimum of
75% of eligible employees.
The individual performance ratings an employee can achieve are defined below:
Individual is new to the role and cannot be fairly assessed
Needs improvement, with visible room for improvement noted
Good overall performance, with the requirements of the job being met
Very good overall performance and highly effective execution of requirements
Outstanding overall performance
Needs major improvement. Performance does not meet expectations and substantial progress is needed
NOT RANKED
02
03
0405
01
RA
TIN
GS
The focus on improving the quality of performance reviews resulted in a greater degree of consistency in the application of ratings. We are pleased with the fact that 20% of our employees are rated as “superior” and “outstanding”. For the first time, the Engineering & Construction cluster, which is responsible for the majority of the group’s employees, conducted a joint performance moderation session where consistency in the application of ratings was focused on. Due to the more consistent application in evaluations, the number of “superior” and “outstanding” performance ratings decreased from last year.
Our focus going forward will be on employees rated in the lower levels of the performance scales through the provision of training initiatives. Employees rated at the top end of the performance scales will be a focus for our succession planning and retention initiatives.
BOARD AND EXCO
The performance of the board and the exco is appraised against a set of clear objectives and key performance indicators (KPIs) to ensure they are remunerated fairly and responsibly. Following the transition from the previous to the current CEO during the year, KPIs of the exco team were aligned to the priorities set by the CEO, as well as against the objectives for F2016. This rigorous process provides a set of KPIs that ensures delivery of the group strategy by the exco.
PAGE Refer to pages 98 to 102 for the updated KPIs of the CEO and CFO.
Executive and senior management members are measured and remunerated according to their alignment, achievement and contribution to the group’s strategy, the group’s financial performance, cluster performance, segment performance and individual performance.

119
GR
OU
P F
IVE
Inte
grat
ed a
nnua
l rep
ort
2015
120
TEAM REMUNERATION
continued
05 INCREASES
EMPLOYEES
During the year, the remco approved an overall salary increase of 7% effective from 1 March 2015. This consisted of a performance-based increase of 6.5% and an additional 0.5% made available to individuals who either required CTC band adjustments due to job grade changes or who needed to be repositioned to ensure remuneration between the 60th and 65th percentile of the market average position of guaranteed base pay.
At an individual employee level, the annual CTC increase is determined by the individual’s pay relative to the band he or she is in, as well as the performance of the individual in the role. This process of evaluation concluded with an average performance increase for the group of 5.5% against the mandated 6.5% and an average group band adjustment of 1.4% against the mandated 0.5%. The overall increase of 6.89% was within the mandate provided by the remco of 7%.
A focus area of improvement was addressing either low or high anomalies within our salary bands. With the last reviews we reduced individuals who fall outside of our bands, either on the low or high side, by 13%. This represents further improvement in paying within our pay policy. This will be further refined in next reviews.
Wage-based employees are remunerated either in line with relevant sectoral determinations, as set out by the Department of Labour, or in line with union-negotiated wages. The group has a low level of union representation at 17% of employees. The employees governed by the civil engineering sectoral determination received an increase of 10% for the more junior grades and 9% for the senior grades. Metal Industries Bargaining Council employees from our Projects and
Oil & Gas segments received a 7% increase and our Manufacturing segment Everite employees received a 9% increase. After a lengthy negotiation process, Intertoll Africa concluded on 10.1% for F2014 and 9.6% for F2015.
In instances where the group’s client issues an instruction to increase pay or offer additional benefits to that of sectoral agreements, we adopt this as a variation order to our construction contract and implement accordingly. We have been found to be compliant with labour regulations on all sites.
NON-EXECUTIVE DIRECTORS
The remco reviews the annual increases of non-executive directors’ fees and recommends these to the board. The board of directors in turn recommend the fees for approval by shareholders at the AGM. The F2015 fees were approved at the November 2014 AGM and the recommended fee schedule for F2016 is disclosed on page 131 and presented to shareholders for consideration and approval with the form of proxy ahead of the November 2015 AGM. The remco proposed an increase of 6.5% for the F2016 non-executive directors’ fees.
The chairperson of the board is remunerated based on a fixed fee for the year. The remainder of the non-executive board members receive a base fee for their main board membership and an attendance fee per meeting. In addition, the chairpersons of each sub-committee of the board receive a fixed fee for this role. Members of sub-committees receive an attendance fee per meeting. All non-executive board members are invited attendees to all sub-committee meetings. Where a non-executive board member attends a sub-committee meeting as an
invitee, they receive the same attendance fee as members.
Board members only receive fees for meetings in which they are in attendance.
A third of non-executive directors are required to retire on an annual basis, but can offer themselves for re-election. The determination of candidates for retirement is informed by the longest-standing serving director. Therefore, depending on the size of the board, this may translate to retirement on a two- or three-year basis.
EMPLOYEE AND DIRECTOR CONTRACTS OF EMPLOYMENT
Permanent employees sign an employment contract that complies with the labour law requirements of the country of employment. The CEO, CFO, group executive committee members, cluster, segment and corporate directors of the organisation have a retirement age of 60, which is reflective of working conditions and market benchmarking at senior and executive levels. All other employees are required to retire at 65.
NOTICE PERIOD OF EMPLOYEES
EMPLOYEES: One month
SEGMENT DIRECTORS: Two months
GENERAL MANAGERS, MANAGING DIRECTORS, EXECUTIVES, COMMITTEE MEMBERS AND EXECUTIVE DIRECTORS: Three months

121
LOOKING FORWARD 06
LOOKING FORWARD
Our core focus in the year
ahead will continue to be
on the Engineering & Construction cluster due to the work required to ensure greater alignment across the cluster’s segments.
This will result in further amendment of remuneration practices to assist improved cohesion on multi-disciplinary sites, especially those in the rest of Africa. Furthermore, an aligned bonus scheme for all employees that drive contract delivery across segments within this cluster will be a key focus area, rather than an orientation towards individual business segment delivery.
In the Manufacturing cluster we will work on further matching remuneration to the manufacturing sector benchmarks and focusing on retention strategies. In the Investments & Concessions cluster we will align our remuneration practices with the cluster’s international expansion plans to ensure expatriate mobility across a wider geography in Africa and Eastern Europe.
It is expected that negotiations with labour unions will remain challenging, as the trend continues for significantly higher increase demands than what is affordable to companies. Unions are also likely to demand that public sector clients become involved in negotiations due to their ability to instruct increases higher than legislated minimums on contracts of national strategic importance. This will require careful management to prevent precedents being set that become difficult to manage on other contracts.
With changes envisaged in legislation, especially with respect to “equal pay for equal work” within the Employment Equity Amendment Act of 2013, it is critical that there is a regular review of our remuneration guidelines. While we have addressed this, we will ensure that a documented audit trial is in place to support justifiable differences and to remove any newly-identified inappropriate differences where they exist.
A revised STI plan that accelerates bonuses for performance above plan was tabled to the remco for consideration. The objective is to award good bonuses for outstanding performance relative to prevailing market conditions, whilst at the same time penalising segments that do not meet planned targets.
* After three-year vesting period.
Grouping perparticipant types
Participantnumbers
LTIP REWARD STRATEGY – INCENTIVE PAY MIX
(Expected value expressed as a
% of CTC*)
1 2 72.0%2 2 62.0%3 5 62.0%4 13 52.0%5 16 52.0%6 67 42.0%
ALLOCATED AS FOLLOWS: (RECOMMENDED POLICY – FACE-VALUE GRANTS)
Shareappreciation
rightsPerformance
shares Bonus shares
Face value as a % of CTC
32.0% 28.0% 12.0%32.0% 18.6% 11.4%32.0% 10.0% 11.4%32.0% 10.0% 10.0%32.0% 10.0% 10.0%32.0% – 10.0%
F2016 LTIP AWARDS
The award mix for F2016 will be as follows:

GR
OU
P F
IVE
Inte
grat
ed a
nnua
l rep
ort
2015
122
TEAM REMUNERATION
continued
07 BREAKDOWN OF REMUNERATION PACKAGES
ERIC VEMER CEO
ELEMENTS OF
REMUNERATION
APPLICABLE
PERIOD
COST TO
COMPANY
R’000
IN F2015
TIMING OF PAY-OUTS(1)
F2015 F2016 F2017 F2018 F2019 F2020
LON
G T
ER
M
INC
EN
TIV
E P
LA
N
Share appreciation rights (SARs)
SARs granted from F2011 to F2015
Performance and bonus shares granted in F2014 and F2015
33% ofSAR awardin F2011,
F2012, F2013, exercisable
33% ofSAR awardin F2012,
F2013, exercisable
33% ofSAR awardin F2013,
F2014, exercisable
33% ofSAR awardin F2014,
F2015, exercisable
33% ofSAR award in F2014,
F2015, exercisable
33% ofSAR awardin F2015,
exercisable
Performance shares 1 070(2)
100% of performance share award
in F2014, exercisable assuming
performance criteria met
100% of performance share award
in F2015, exercisable assuming
performance criteria met
Bonus shares100% of
bonus share award in
F2014
100% of bonus share
award in F2015
The remco approved a standard allocation of SARs, performance shares and bonus shares in line with the LTIP policy.
SH
OR
T T
ER
MIN
CE
NT
IVE
Annual short term incentive
F2014(3) 4 116
The current CEO’s previous portfolio as head of the Investments & Concessions cluster delivered extremely well against set targets. As such, remco awarded a bonus that reflected this achievement.
BA
SE
PA
Y
Guaranteed total cost to company
March 2014 – Feb 2015(4) 3 472
March 2015 – Feb 2016(4) 4 750 4 139(5)
The base pay of the CEO was determined in line with our remuneration policy and takes into account his promotion to the CEO role in December 2014.
TOTAL REMUNERATION PAID IN F2015 8 255(6)
1 Refers to the financial period in which the remuneration awarded is actually paid to the employee/employee receives the benefit.2 Refers to the cost to the company of awarding the employee a share appreciation right, determined by the IFRS 2 cost for the specific allocation.3 Refers to the short term incentive awarded, relating to the most recent financial year completed.4 Refers to the remuneration award granted annually, effective at the start of the group’s remuneration year in March.5 Any difference between guaranteed cost to company and remuneration actually paid is due to variable benefits paid, as well as ad hoc long service-related awards. 6 The F2015 pay-out reflects the total value paid to the employee whereas page 132 reflects the value for the period in office only as required by the Companies Act.

123
CRISTINA FREITAS TEIXEIRA CFO
ELEMENTS OF
REMUNERATION
APPLICABLE
PERIOD
COST TO
COMPANY
R’000
IN F2015
TIMING OF PAY-OUTS(1)
F2015 F2016 F2017 F2018 F2019 F2020
LON
G T
ER
M
INC
EN
TIV
E P
LA
N
Share appreciation rights (SARs)
SARs granted from F2011 to F2015
Performance and bonus shares granted in F2014 and F2015
33% ofSAR awardin F2011,
F2012, F2013, exercisable
33% ofSAR awardin F2012,
F2013, exercisable
33% ofSAR awardin F2013,
F2014, exercisable
33% ofSAR awardin F2014,
F2015 exercisable
33% ofSAR awardin F2014,
F2015 exercisable
33% ofSAR awardin F2015,
exercisable
Performance shares 783(2)
100% of performance share award
in F2014, exercisable assuming
performance criteria met
100% of performance share award
in F2015, exercisable assuming
performance criteria met
Bonus shares100% of
bonus share award in
F2014
100% of bonus share
award in F2015
The remco approved a standard allocation of SARs, performance shares and bonus shares in line with the LTIP policy.
SH
OR
T T
ER
MIN
CE
NT
IVE
Annual short term incentive
F2014(3) 2 965
Based on the improvement in the F2014 performance, a bonus equal to the target bonus was awarded. Greater controls and centralised processes were put in place and were starting to show benefits.
BA
SE
PA
Y
Guaranteed total cost to company
March 2014 – Feb 2015(4) 3 021
March 2015 – Feb 2016(4) 3 324 3 137(5)
Based on the performance of the CFO and consideration of the market comparison for similar CFO roles, the CFO’s package was reviewed and adjusted accordingly.
TOTAL REMUNERATION PAID IN F2015 6 1021 Refers to the financial period in which the remuneration awarded is actually paid to the employee/employee receives the benefit.2 Refers to the cost to the company of awarding the employee a share appreciation right, determined by the IFRS 2 cost for the specific allocation.3 Refers to the short term incentive awarded, relating to the most recent financial year completed.4 Refers to the remuneration award granted annually, effective at the start of the group’s remuneration year in March.5 Any difference between guaranteed cost to company and remuneration actually paid is due to variable benefits paid, as well as ad hoc long service-related awards.

GR
OU
P F
IVE
Inte
grat
ed a
nnua
l rep
ort
2015
124
TEAM REMUNERATION
continued
07
PRESCRIBED OFFICER 1
ELEMENTS OF
REMUNERATION
APPLICABLE
PERIOD
COST TO
COMPANY
R’000
IN F2015
TIMING OF PAY-OUTS(1)
F2015 F2016 F2017 F2018 F2019 F2020
LON
G T
ER
M
INC
EN
TIV
E P
LA
N
Share appreciation rights (SARs)
SARs granted from F2011 to F2015
Performance and bonus shares granted in F2014 and F2015
33% ofSAR awardin F2011,
F2012, F2013, exercisable
33% ofSAR awardin F2012,
F2013, exercisable
33% ofSAR awardin F2013,
F2014, exercisable
33% ofSAR awardin F2014,
F2015 exercisable
33% ofSAR awardin F2014,
F2015 exercisable
33% ofSAR awardin F2015,
exercisable
Performance shares 845(2)
100% of performance share award
in F2014, exercisable assuming
performance criteria met
100% of performance share award
in F2015, exercisable assuming
performance criteria met
Bonus shares100% of
bonus share award in
F2014
100% of bonus share
award in F2015
The remco approved a standard allocation of SARs, performance shares and bonus shares in line with the LTIP policy.
SH
OR
T T
ER
MIN
CE
NT
IVE
Annual short term incentive
F2014(3) 2 000
This prescribed officer’s portfolio did not meet all the planned targets. The short term incentive awarded, therefore, reflected a shortfall against the target.
BA
SE
PA
Y
Guaranteed total cost to company
March 2014 – Feb 2015(4) 3 242
March 2015 – Feb 2016(4) 4 000 3 668(5)
The restructure within the group resulted in a substantial increase to the portfolio under the leadership of this prescribed officer. The base pay was, therefore, adjusted accordingly.
TOTAL REMUNERATION PAID IN F2015 5 6681 Refers to the financial period in which the remuneration awarded is actually paid to the employee/employee receives the benefit.2 Refers to the cost to the company of awarding the employee a share appreciation right, determined by the IFRS 2 cost for the specific allocation.3 Refers to the short term incentive awarded, relating to the most recent financial year completed.4 Refers to the remuneration award granted annually, effective at the start of the group’s remuneration year in March.5 Any difference between guaranteed cost to company and remuneration actually paid is due to variable benefits paid, as well as ad hoc long service-related awards.
BREAKDOWN OF REMUNERATION PACKAGES continued

125
PRESCRIBED OFFICER 2
ELEMENTS OF
REMUNERATION
APPLICABLE
PERIOD
COST TO
COMPANY
R’000
IN F2015
TIMING OF PAY-OUTS(1)
F2015 F2016 F2017 F2018 F2019 F2020
LON
G T
ER
M
INC
EN
TIV
E P
LA
N
Share appreciation rights (SARs)
SAR granted from F2011 to F2015
Performance and bonus shares granted in F2014 and F2015
33% ofSAR awardin F2011,
F2012, F2013, exercisable
33% ofSAR awardin F2012,
F2013, exercisable
33% ofSAR awardin F2013,
F2014, exercisable
33% ofSAR awardin F2014,
F2015 exercisable
33% ofSAR awardin F2014,
F2015 exercisable
33% ofSAR awardin F2015,
exercisable
Performance shares 852(2)
100% of performance share award
in F2014, exercisable assuming
performance criteria met
100% of performance share award
in F2015, exercisable assuming
performance criteria met
Bonus shares100% of
bonus share award in
F2014
100% of bonus share
award in F2015
The remco approved a standard allocation of SARs, performance shares and bonus shares in line with the LTIP policy.
SH
OR
T T
ER
MIN
CE
NT
IVE
Annual short term incentive
F2014(3) 3 160
This prescribed officer’s cluster exceeded targeted expectations. Based on the strong performance, the appropriate short term incentive was awarded.
BA
SE
PA
Y
Guaranteed total cost to company
March 2014 – Feb 2015(4) 3 161
March 2015 – Feb 2016(4) 3 418 3 303(5)
In line with retention policies and based on the strong cluster performance, this prescribed officer’s base pay was reviewed and adjusted.
TOTAL REMUNERATION PAID IN F2015 6 4631 Refers to the financial period in which the remuneration awarded is actually paid to the employee/employee receives the benefit.2 Refers to the cost to the company of awarding the employee a share appreciation right, determined by the IFRS 2 cost for the specific allocation.3 Refers to the short term incentive awarded, relating to the most recent financial year completed.4 Refers to the remuneration award granted annually, effective at the start of the group’s remuneration year in March.5 Any difference between guaranteed cost to company and remuneration actually paid is due to variable benefits paid, as well as ad hoc long service-related awards.

GR
OU
P F
IVE
Inte
grat
ed a
nnua
l rep
ort
2015
126
TEAM REMUNERATION
continued
07 BREAKDOWN OF REMUNERATION PACKAGES continued
PRESCRIBED OFFICER 3
ELEMENTS OF
REMUNERATION
APPLICABLE
PERIOD
COST TO
COMPANY
R’000
IN F2015
TIMING OF PAY-OUTS(1)
F2015 F2016 F2017 F2018 F2019 F2020
LON
G T
ER
M
INC
EN
TIV
E P
LA
N
Share appreciation rights (SARs)
SARs granted from F2011 to F2015
Performance and bonus shares granted in F2014 and F2015
33% ofSAR awardin F2011,
F2012, F2013, exercisable
33% ofSAR awardin F2012,
F2013, exercisable
33% ofSAR awardin F2013,
F2014, exercisable
33% ofSAR awardin F2014,
F2015 exercisable
33% ofSAR awardin F2014,
F2015 exercisable
33% ofSAR awardin F2015,
exercisable
Performance shares 606(2)
100% of performance share award
in F2014, exercisable assuming
performance criteria met
100% of performance share award
in F2015, exercisable assuming
performance criteria met
Bonus shares100% of
bonus share award in
F2014
100% of bonus share
award in F2015
The remco approved a standard allocation of SARs, performance shares and bonus shares in line with the LTIP policy.
SH
OR
T T
ER
MIN
CE
NT
IVE
Annual short term incentive
F2014(3) 2 650
The cluster of this prescribed officer exceeded expectations. The short term incentive, therefore, reflects this pleasing performance.
BA
SE
PA
Y
Guaranteed total cost to company
March 2014 – Feb 2015(4) 2 203
March 2015 – Feb 2016(4) 2 848 2 577(5)
This prescribed officer was recently promoted to the executive committee. As a result, the appropriate increase in base pay was awarded.
TOTAL REMUNERATION PAID IN F2015 5 227(6)
1 Refers to the financial period in which the remuneration awarded is actually paid to the employee/employee receives the benefit.2 Refers to the cost to the company of awarding the employee a share appreciation right, determined by the IFRS 2 cost for the specific allocation.3 Refers to the short term incentive awarded, relating to the most recent financial year completed.4 Refers to the remuneration award granted annually effective at the start of the group’s remuneration year in March.5 Any difference between guaranteed cost to company and remuneration actually paid is due to variable benefits paid, as well as ad hoc long service-related awards. 6 The F2015 pay-out reflects the total value paid to the employee whereas page 132 reflects the value for the period in office only as required by the Companies Act.

127
PRESCRIBED OFFICER 4
ELEMENTS OF
REMUNERATION
APPLICABLE
PERIOD
COST TO
COMPANY
R’000
IN F2015
TIMING OF PAY-OUTS(1)
F2015 F2016 F2017 F2018 F2019 F2020
LON
G T
ER
M
INC
EN
TIV
E P
LA
N
Share appreciation rights (SARs)
SARs granted from F2011 to F2015
Performance and bonus shares granted in F2014 and F2015
33% ofSAR awardin F2011,
F2012, F2013, exercisable
33% ofSAR awardin F2012,
F2013, exercisable
33% ofSAR awardin F2013,
F2014, exercisable
33% ofSAR awardin F2014,
F2015 exercisable
33% ofSAR awardin F2014,
F2015 exercisable
33% ofSAR awardin F2015,
exercisable
Performance shares 560(2)
100% of performance share award
in F2014, exercisable assuming
performance criteria met
100% of performance share award
in F2015, exercisable assuming
performance criteria met
Bonus shares100% of
bonus share award in
F2014
100% of bonus share
award in F2015
The remco approved a standard allocation of SARs, performance shares and bonus shares in line with the LTIP policy.
SH
OR
T T
ER
MIN
CE
NT
IVE
Annual short term incentive
F2014(3) 1 950
As a result of this prescribed officer’s contribution to the group result for F2014 and the traction in the critical areas within his portfolio, a short term incentive commensurate with his contribution was awarded.
BA
SE
PA
Y
Guaranteed total cost to company
March 2014 – Feb 2015(4) 2 209
March 2015 – Feb 2016(4) 2 500 2 356(5)
In line with our remuneration policy and a market review, this prescribed officer’s base pay was reviewed and adjusted accordingly.
TOTAL REMUNERATION PAID IN F2015 4 3061 Refers to the financial period in which the remuneration awarded is actually paid to the employee/employee receives the benefit.2 Refers to the cost to the company of awarding the employee a share appreciation right, determined by the IFRS 2 cost for the specific allocation.3 Refers to the short term incentive awarded, relating to the most recent financial year completed.4 Refers to the remuneration award granted annually effective at the start of the group’s remuneration year in March.5 Any difference between guaranteed cost to company and remuneration actually paid is due to variable benefits paid, as well as ad hoc long service-related awards.
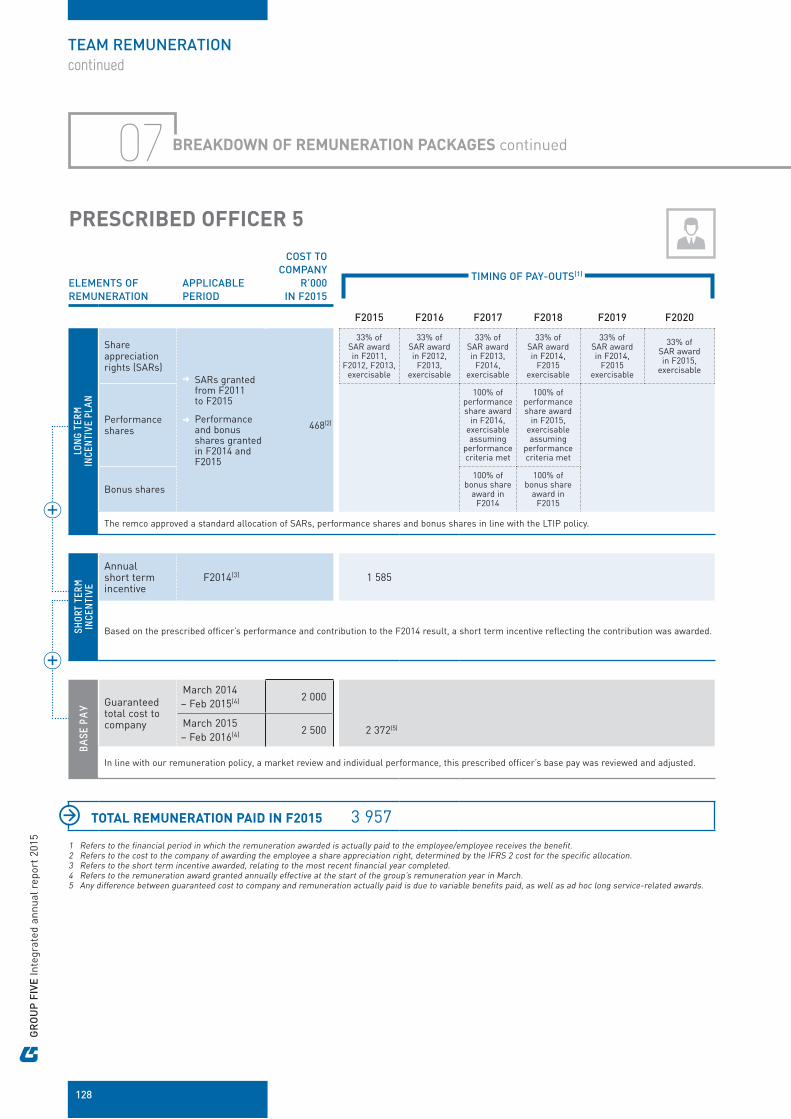
GR
OU
P F
IVE
Inte
grat
ed a
nnua
l rep
ort
2015
128
TEAM REMUNERATION
continued
07 BREAKDOWN OF REMUNERATION PACKAGES continued
PRESCRIBED OFFICER 5
ELEMENTS OF
REMUNERATION
APPLICABLE
PERIOD
COST TO
COMPANY
R’000
IN F2015
TIMING OF PAY-OUTS(1)
F2015 F2016 F2017 F2018 F2019 F2020
LON
G T
ER
M
INC
EN
TIV
E P
LA
N
Share appreciation rights (SARs)
SARs granted from F2011 to F2015
Performance and bonus shares granted in F2014 and F2015
33% ofSAR awardin F2011,
F2012, F2013, exercisable
33% ofSAR awardin F2012,
F2013, exercisable
33% ofSAR awardin F2013,
F2014, exercisable
33% ofSAR awardin F2014,
F2015 exercisable
33% ofSAR awardin F2014,
F2015 exercisable
33% ofSAR awardin F2015,
exercisable
Performance shares 468(2)
100% of performance share award
in F2014, exercisable assuming
performance criteria met
100% of performance share award
in F2015, exercisable assuming
performance criteria met
Bonus shares100% of
bonus share award in
F2014
100% of bonus share
award in F2015
The remco approved a standard allocation of SARs, performance shares and bonus shares in line with the LTIP policy.
SH
OR
T T
ER
MIN
CE
NT
IVE
Annual short term incentive
F2014(3) 1 585
Based on the prescribed officer’s performance and contribution to the F2014 result, a short term incentive reflecting the contribution was awarded.
BA
SE
PA
Y
Guaranteed total cost to company
March 2014 – Feb 2015(4) 2 000
March 2015 – Feb 2016(4) 2 500 2 372(5)
In line with our remuneration policy, a market review and individual performance, this prescribed officer’s base pay was reviewed and adjusted.
TOTAL REMUNERATION PAID IN F2015 3 9571 Refers to the financial period in which the remuneration awarded is actually paid to the employee/employee receives the benefit.2 Refers to the cost to the company of awarding the employee a share appreciation right, determined by the IFRS 2 cost for the specific allocation.3 Refers to the short term incentive awarded, relating to the most recent financial year completed.4 Refers to the remuneration award granted annually effective at the start of the group’s remuneration year in March.5 Any difference between guaranteed cost to company and remuneration actually paid is due to variable benefits paid, as well as ad hoc long service-related awards.
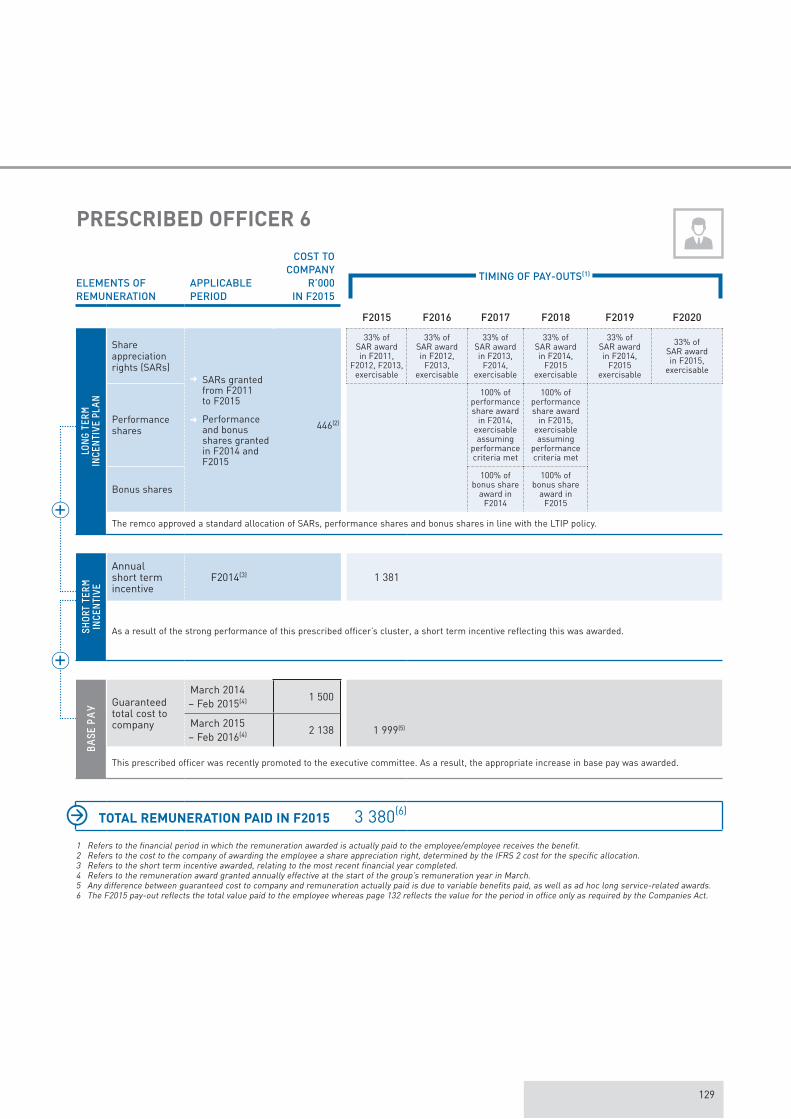
129
PRESCRIBED OFFICER 6
ELEMENTS OF
REMUNERATION
APPLICABLE
PERIOD
COST TO
COMPANY
R’000
IN F2015
TIMING OF PAY-OUTS(1)
F2015 F2016 F2017 F2018 F2019 F2020
LON
G T
ER
M
INC
EN
TIV
E P
LA
N
Share appreciation rights (SARs)
SARs granted from F2011 to F2015
Performance and bonus shares granted in F2014 and F2015
33% ofSAR awardin F2011,
F2012, F2013, exercisable
33% ofSAR awardin F2012,
F2013, exercisable
33% ofSAR awardin F2013,
F2014, exercisable
33% ofSAR awardin F2014,
F2015 exercisable
33% ofSAR awardin F2014,
F2015 exercisable
33% ofSAR awardin F2015,
exercisable
Performance shares 446(2)
100% of performance share award
in F2014, exercisable assuming
performance criteria met
100% of performance share award
in F2015, exercisable assuming
performance criteria met
Bonus shares100% of
bonus share award in
F2014
100% of bonus share
award in F2015
The remco approved a standard allocation of SARs, performance shares and bonus shares in line with the LTIP policy.
SH
OR
T T
ER
MIN
CE
NT
IVE
Annual short term incentive
F2014(3) 1 381
As a result of the strong performance of this prescribed officer’s cluster, a short term incentive reflecting this was awarded.
BA
SE
PA
Y
Guaranteed total cost to company
March 2014 – Feb 2015(4) 1 500
March 2015 – Feb 2016(4) 2 138 1 999(5)
This prescribed officer was recently promoted to the executive committee. As a result, the appropriate increase in base pay was awarded.
TOTAL REMUNERATION PAID IN F2015 3 380(6)
1 Refers to the financial period in which the remuneration awarded is actually paid to the employee/employee receives the benefit.2 Refers to the cost to the company of awarding the employee a share appreciation right, determined by the IFRS 2 cost for the specific allocation.3 Refers to the short term incentive awarded, relating to the most recent financial year completed.4 Refers to the remuneration award granted annually effective at the start of the group’s remuneration year in March.5 Any difference between guaranteed cost to company and remuneration actually paid is due to variable benefits paid, as well as ad hoc long service-related awards. 6 The F2015 pay-out reflects the total value paid to the employee whereas page 132 reflects the value for the period in office only as required by the Companies Act.
GR
OU
P F
IVE
Inte
grat
ed a
nnua
l rep
ort
2015
130
TEAM REMUNERATION
continued
07 BREAKDOWN OF REMUNERATION PACKAGES continued
ME
DT
RO
NIC
S B
UIL
DIN
G
So
uth
Afr
ica
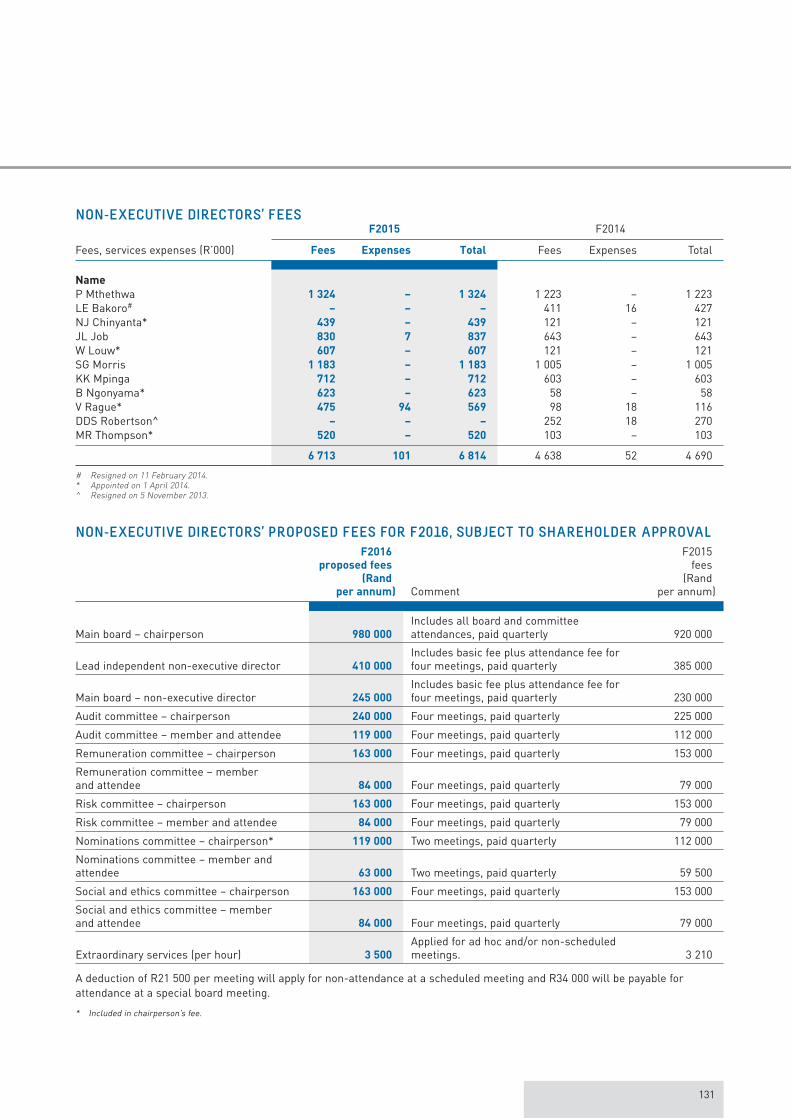
131
NON-EXECUTIVE DIRECTORS’ FEES
Fees, services expenses (R’000)
F2015 F2014
Fees Expenses Total Fees Expenses Total
Name
P Mthethwa 1 324 – 1 324 1 223 – 1 223 LE Bakoro# – – – 411 16 427 NJ Chinyanta* 439 – 439 121 – 121 JL Job 830 7 837 643 – 643 W Louw* 607 – 607 121 – 121 SG Morris 1 183 – 1 183 1 005 – 1 005 KK Mpinga 712 – 712 603 – 603 B Ngonyama* 623 – 623 58 – 58 V Rague* 475 94 569 98 18 116 DDS Robertson^ – – – 252 18 270 MR Thompson* 520 – 520 103 – 103
6 713 101 6 814 4 638 52 4 690
# Resigned on 11 February 2014.* Appointed on 1 April 2014.^ Resigned on 5 November 2013.
NON-EXECUTIVE DIRECTORS’ PROPOSED FEES FOR F2016, SUBJECT TO SHAREHOLDER APPROVAL
F2016
proposed fees
(Rand
per annum) Comment
F2015fees
(Randper annum)
Main board – chairperson 980 000
Includes all board and committee attendances, paid quarterly 920 000
Lead independent non-executive director 410 000
Includes basic fee plus attendance fee for four meetings, paid quarterly 385 000
Main board – non-executive director 245 000
Includes basic fee plus attendance fee for four meetings, paid quarterly 230 000
Audit committee – chairperson 240 000 Four meetings, paid quarterly 225 000
Audit committee – member and attendee 119 000 Four meetings, paid quarterly 112 000
Remuneration committee – chairperson 163 000 Four meetings, paid quarterly 153 000
Remuneration committee – member and attendee 84 000 Four meetings, paid quarterly 79 000
Risk committee – chairperson 163 000 Four meetings, paid quarterly 153 000
Risk committee – member and attendee 84 000 Four meetings, paid quarterly 79 000
Nominations committee – chairperson* 119 000 Two meetings, paid quarterly 112 000
Nominations committee – member and attendee 63 000 Two meetings, paid quarterly 59 500
Social and ethics committee – chairperson 163 000 Four meetings, paid quarterly 153 000
Social and ethics committee – member and attendee 84 000 Four meetings, paid quarterly 79 000
Extraordinary services (per hour) 3 500
Applied for ad hoc and/or non-scheduled meetings. 3 210
A deduction of R21 500 per meeting will apply for non-attendance at a scheduled meeting and R34 000 will be payable for attendance at a special board meeting.
* Included in chairperson’s fee.

GR
OU
P F
IVE
Inte
grat
ed a
nnua
l rep
ort
2015
132
TEAM REMUNERATION
continued
07EXECUTIVE DIRECTORS
(R’000)
Salaries Bonus* Retention award** Total
F2015 F2014 F2015 F2014 F2015 F2014 F2015 F2014
Name
MR Upton(1) 2 498 4 747 5 672 5 229 – 722 8 170 10 698 ECJ Vemer(2) 2 675 – 2 058 – – – 4 733 –CMF Teixeira 3 137 2 749 2 965 2 731 – – 6 102 5 480
8 310 7 496 10 695 7 960 – 722 19 005 16 178
In line with the requirements of the Companies Act of 2008, the group discloses the remuneration paid to prescribed officers who are defined as the group’s executive committee.
The three highest paid members of management are also reflected in the table below, as per the recommended practice suggested in 2.26.2 of the King III Code.
EXECUTIVE COMMITTEE MEMBERS (EXCO)
(R’000)
Salaries Bonus* Retention award** Total
F2015 F2014 F2015 F2014 F2015 F2014 F2015 F2014
Name
Prescribed officer 1 3 668 3 058 2 000 2 103 – – 5 668 5 161 Prescribed officer 2 3 303 3 212 3 160 2 710 – – 6 463 5 922 Prescribed officer 3 1 633 – 1 325 – – – 2 958 –Prescribed officer 4 2 356 2 177 1 950 1 640 – 230 4 306 4 047 Prescribed officer 5 2 372 1 594 1 585 1 034 – – 3 957 2 628 Prescribed officer 6 1 344 – 690 – – – 2 034 –Prescribed officer 7(3) 1 544 3 115 1 383 2 620 – – 2 927 5 735 Prescribed officer 8(2) 1 463 3 345 2 058 3 449 – 647 3 521 7 441 Prescribed officer 9(3) 1 887 3 414 1 000 2 948 – 470 2 887 6 832
19 570 19 915 15 151 16 504 – 1 347 34 721 37 766
SENIOR MANAGEMENT^ (EXCLUDING CEO, CFO AND EXCO)
(R’000)
Salaries Bonus* Retention award** Total
F2015 F2014 F2015 F2014 F2015 F2014 F2015 F2014
Total earnings 29 399 32 379 17 047 21 958 – 1 035 46 446 55 372
29 399 32 379 17 047 21 958 – 1 035 46 446 55 372
^ With regards to F2015, senior management refers to the individuals depicted within this integrated annual report, excluding the CEO, CFO and exco.* This indicates the gross bonus paid to the employee in the financial year under review. It does not represent the gross bonus awarded for the year, as the period to
which the bonus relates is different to that when the bonus is paid. Bonuses awarded in a year are paid to employees in the financial year following the award period. For a full reconciliation between the bonus awarded per financial year and the timing of payment, for the CEO, CFO and prescribed officers, refer to pages 122 to 129.
** In F2013, the remuneration committee approved a retention award to members of the executive committee and selected members of senior management. Recipients were encouraged to purchase shares in Group Five with the award received. Payments reflected above do not represent the full value awarded to the employee, but rather the value (before taxation) of the award actually paid. Where employees opted to receive their retention award in cash to buy shares, payment was received in November 2012 and shares were required to be purchased by the employee. The employee was only entitled to trade or dispose of 50% of the value of this award after 30 June 2013 and the remaining 50% after 30 June 2014. Employees who opted to receive retention awards in cash only received 50% of their award on 30 June 2013. The balance of the award was made on 30 June 2014.
(1) Retired 28 November 2014.(2) Appointed as CEO on 1 December 2014.(3) Resigned from exco on 28 November 2014.
BREAKDOWN OF REMUNERATION PACKAGES continued

133
DETAILS OF EXECUTIVE DIRECTORS’ SHARE OPTIONS AND SHARE APPRECIATION RIGHTS
Name of director
Optionsgranted –
opening balance
Optionsgranted
during the current year
Strikeprice
Options exercised
and paidOptionslapsed
Optionsgranted –
closing balance
Strikeprice
Optionsvested – closing
balance
ECJ Vemer
2014 34 000 – 54,81 – – 34 000 54,81 34 000
150 000 – 50,20 – – 150 000 50,20 150 000 81 842 – 34,09 81 842 – – 34,09 – 50 564 – 27,70 24 905 – 25 659 27,70 –
104 600 – 34,42 – – 104 600 34,42 – – 37 316 40,68 – – 37 316 40,68 –– 5 863 41,00 – – 5 863 41,00 –
421 006 43 179 106 747 357 438 184 000
2015
34 000 – 54,81 – 34 000 – 54,81 –
150 000 – 50,20 – 150 000 – 50,20 –
25 659 – 27,70 – – 25 659 27,70 25 659
104 600 – 34,42 – – 104 600 34,42 34 867
37 316 – 40,68 – – 37 316 40,68 –
5 863 11 093 28,44 – – 16 956 28,44 –
– 99 609 25,60 – – 99 609 25,60 –
357 438 110 702 – 184 000 284 140 60 526
CMF Teixeira
2014 25 000 – 54,81 – – 25 000 54,81 25 000 25 000 – 50,20 – – 25 000 50,20 25 000
200 000 – 42,84 – – 200 000 42,84 200 000 72 000 – 28,63 72 000 – – 28,63 – 71 740 – 34,09 – – 71 740 34,09 71 740 66 175 – 27,70 21 838 – 44 337 27,70 22 274 86 600 – 34,42 – – 86 600 34,42 –
– 34 828 40,68 – – 34 828 40,68 – – 4 745 41,00 – – 4 745 41,00 –
546 515 39 573 93 838 – 492 250 344 014
2015
25 000 – 54,81 – 25 000 – 54,81 –
25 000 – 50,20 – 25 000 – 50,20 –
200 000 – 42,84 – – 200 000 42,84 200 000
71 740 – 34,09 – – 71 740 34,09 71 740
44 337 – 27,70 – – 44 337 27,70 44 337
86 600 – 34,42 – – 86 600 34,42 28 867
34 828 – 40,68 – – 34 828 40,68 –
4 745 9 381 28,44 – – 14 126 28,44 –
– 59 712 25,60 – – 59 712 25,60 –
492 250 69 093 – 50 000 511 343 344 944

GR
OU
P F
IVE
Inte
grat
ed a
nnua
l rep
ort
2015
134
TEAM REMUNERATION
continued
07DETAILS OF PRESCRIBED OFFICERS’ SHARE OPTIONS AND SHARE APPRECIATION RIGHTS (INCLUDING THREE HIGHEST PAID MEMBERS OF MANAGEMENT)
Prescribed officer
Optionsgranted –
opening balance
Optionsgranted
during the current year
Strikeprice
Options exercised
and paidOptionslapsed
Optionsgranted –
closing balance
Strikeprice
Optionsvested – closing
balance
Prescribed officer 1
2014 19 000 – 54,81 – – 19 000 54,81 19 000
100 000 – 50,20 – – 100 000 50,20 100 000 – – 28,63 – – – 28,63 –
21 543 – 34,09 21 543 – – 34,09 – 38 974 – 27,70 19 196 – 19 778 27,70 19 584 97 600 – 34,42 – – 97 600 34,42 –
– 37 316 40,68 – – 37 316 40,68 – – 3 728 41,00 – – 3 728 41,00 –
277 117 41 044 40 739 – 277 422 138 584
2015
19 000 – 54,81 – 19 000 – 54,81 –
100 000 – 50,20 – 100 000 – 50,20 –
19 778 – 27,70 – – 19 778 27,70 19 778
97 600 – 34,42 – – 97 600 34,42 32 533
37 316 40,68 – – 37 316 40,68 –
3 728 6 328 28,44 – – 10 056 28,44 –
– 74 121 25,60 – – 74 121 25,60 –
277 422 80 449 – 119 000 238 871 52 311
Prescribed officer 2
2014 42 000 – 54,81 – – 42 000 54,81 42 000 53 000 – 50,20 – – 53 000 50,20 53 000 89 762 – 34,09 59 243 – 30 519 34,09 30 519 82 408 – 27,70 27 195 – 55 213 27,70 27 744
103 000 – 34,42 – – 103 000 34,42 – – 36 748 40,68 – – 36 748 40,68 –
– 4 865 41,00 – – 4 865 41,00 –
370 170 41 613 86 438 – 325 345 153 263
2015
42 000 – 54,81 – 42 000 – 54,81 –
53 000 – 50,20 – 53 000 – 50,20 –
30 519 – 34,09 – – 30 519 34,09 30 519
55 213 – 27,70 – – 55 213 27,70 55 213
103 000 – 34,42 – – 103 000 34,42 34 333
36 748 – 40,68 – – 36 748 40,68 –
4 865 9 998 28,44 – – 14 863 28,44 –
– 62 479 25,60 – – 62 479 25,60 –
325 345 72 477 – 95 000 302 822 120 065
BREAKDOWN OF REMUNERATION PACKAGES continued

135
Prescribed officer
Optionsgranted –
opening balance
Optionsgranted
during the current year
Strikeprice
Options exercised
and paidOptionslapsed
Optionsgranted –
closing balance
Strikeprice
Optionsvested –closing
balance
Prescribed officer 3
2014 20 000 – 54,81 – – 20 000 54,81 20 000 25 000 – 50,20 – – 25 000 50,20 25 000 43 000 – 28,63 43 000 – – 28,63 – 39 179 – 34,09 25 858 – 13 321 34,09 13 321 36 140 – 27,70 11 926 – 24 214 27,70 12 167 53 000 – 34,42 – – 53 000 34,42 –
– 20 924 40,68 – – 20 924 40,68 – – 5 147 41,00 – – 5 147 41,00 –
216 319 26 071 80 784 – 161 606 70 488
2015
20 000 – 54,81 – 20 000 – 54,81 –
25 000 – 50,20 – 25 000 – 50,20 –
13 321 – 34,09 – – 13 321 34,09 13 321
24 214 – 27,70 – – 24 214 27,70 24 214
53 000 – 34,42 – – 53 000 34,42 17 667
20 924 – 40,68 – – 20 924 40,68 –
5 147 8 386 28,44 – – 13 533 28,44 –
– 52 653 25,60 – 52 653 25,60 –
161 606 61 039 – – 45 000 177 645 55 202
Prescribed officer 4
2014 45 000 – 12,55 – – 45 000 12,55 45 000 30 000 – 54,81 – – 30 000 54,81 30 000 37 000 – 50,20 – – 37 000 50,20 37 000 69 000 – 28,63 – – 69 000 28,63 69 000 61 672 – 34,09 – – 61 672 34,09 61 672 56 619 – 27,70 – – 56 619 27,70 37 746 71 700 – 34,42 – – 71 700 34,42 –
– 21 237 40,68 – – 21 237 40,68 –– 3 441 41,00 – – 3 441 41,00 –
370 991 24 678 – – 395 669 280 418
2015
45 000 – 12,55 45 000 – – 12,55 –
30 000 – 54,81 – 30 000 – 54,81 –
37 000 – 50,20 – 37 000 – 50,20 –
69 000 – 28,63 – – 69 000 28,63 69 000
61 672 – 34,09 – – 61 672 34,09 61 672
56 619 – 27,70 – – 56 619 27,70 56 619
71 700 – 34,42 – – 71 700 34,42 23 900
21 237 – 40,68 – – 21 237 40,68 –
3 441 7 618 28,44 – – 11 059 28,44 –
– 36 241 25,60 – – 36 241 25,60 –
395 669 43 859 45 000 67 000 327 528 211 191
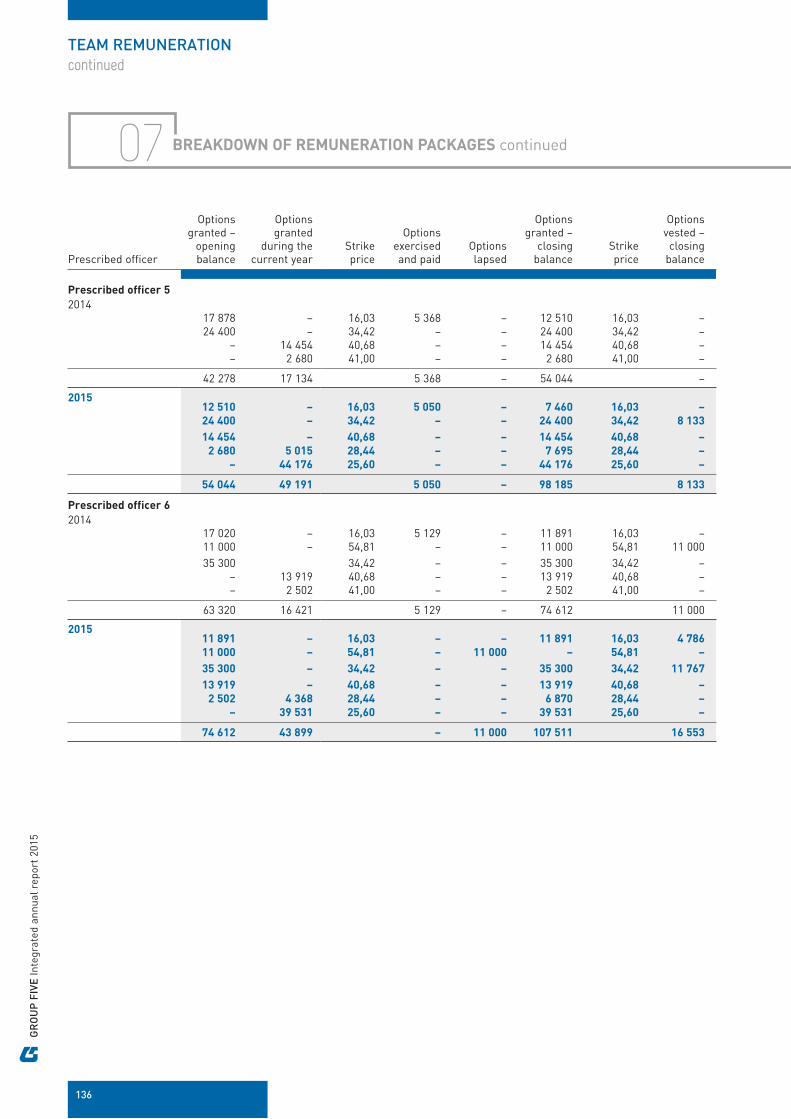
GR
OU
P F
IVE
Inte
grat
ed a
nnua
l rep
ort
2015
136
TEAM REMUNERATION
continued
07
Prescribed officer
Optionsgranted –
opening balance
Optionsgranted
during the current year
Strikeprice
Options exercised
and paidOptionslapsed
Optionsgranted –
closing balance
Strikeprice
Optionsvested – closing
balance
Prescribed officer 5
2014 17 878 – 16,03 5 368 – 12 510 16,03 – 24 400 – 34,42 – – 24 400 34,42 –
– 14 454 40,68 – – 14 454 40,68 – – 2 680 41,00 – – 2 680 41,00 –
42 278 17 134 5 368 – 54 044 –
2015 12 510 – 16,03 5 050 – 7 460 16,03 –
24 400 – 34,42 – – 24 400 34,42 8 133
14 454 – 40,68 – – 14 454 40,68 –
2 680 5 015 28,44 – – 7 695 28,44 –
– 44 176 25,60 – – 44 176 25,60 –
54 044 49 191 5 050 – 98 185 8 133
Prescribed officer 6
2014 17 020 – 16,03 5 129 – 11 891 16,03 – 11 000 – 54,81 – – 11 000 54,81 11 000 35 300 34,42 – – 35 300 34,42 –
– 13 919 40,68 – – 13 919 40,68 – – 2 502 41,00 – – 2 502 41,00 –
63 320 16 421 5 129 – 74 612 11 000
2015 11 891 – 16,03 – – 11 891 16,03 4 786
11 000 – 54,81 – 11 000 – 54,81 –
35 300 – 34,42 – – 35 300 34,42 11 767
13 919 – 40,68 – – 13 919 40,68 –
2 502 4 368 28,44 – – 6 870 28,44 –
– 39 531 25,60 – – 39 531 25,60 –
74 612 43 899 – 11 000 107 511 16 553
BREAKDOWN OF REMUNERATION PACKAGES continued

137
DETAILS OF SHARE OPTIONS AND SHARE APPRECIATION RIGHTS ISSUED TO SENIOR MANAGEMENT* (EXCLUDING CEO, CFO AND EXCO)
Optionsgranted –
opening balance
Optionsgranted
during the current year
Strikeprice
Options exercised
and paidOptionslapsed
Optionsgranted –
closing balance
Strikeprice
Optionsvested – closing
balance
2014 75 000 – 31,87 75 000 – – 31,87 –
154 000 – 54,81 – – 154 000 54,81 154 000 200 000 – 50,20 – – 200 000 50,20 200 000 264 000 – 28,63 264 000 – – 28,63 – 354 854 – 34,09 296 415 – 58 439 34,09 58 439 298 007 – 27,70 139 951 – 158 056 27,70 48 660 654 500 – 34,42 – – 654 500 34,42 –
56 819 – 16,03 12 912 – 43 907 16,03 – – 218 036 40,68 – – 218 036 40,68 – – 59 961 40,68 – – 59 961 40,68 – – 45 894 41,00 – – 45 894 41,00 –
2 057 180 323 891 788 278 – 1 592 793 461 099
2015
109 000 – 54,81 – 109 000 – 54,81 –
161 300 – 50,20 – 161 300 – 50,20 –
59 672 – 34,09 5 435 – 54 237 34,09 54 237
133 122 – 27,70 4 792 – 128 330 27,70 128 330
464 300 – 34,42 – – 464 300 34,42 154 767
13 520 – 16,03 – – 13 520 16,03 4 507
218 589 – 40,68 – – 218 589 40,68 –
35 316 70 667 28,44 – – 105 983 28,44 –
– 410 975 25,60 – – 410 975 25,60 –
1 194 819 481 642 10 227 270 300 1 395 934 341 841
* With regards to F2015, senior management refers to the individuals depicted within this integrated annual report, excluding the CEO, CFO and exco.

PAGE
141REPORT OF THE INDEPENDENT AUDITOR
03SECTION
148 GROUP INCOME STATEMENT
149GROUP STATEMENT OF COMPREHENSIVE INCOME
149DETERMINATION OF GROUP HEADLINE EARNINGS
150GROUP STATEMENT OFFINANCIAL POSITION
151 GROUP STATEMENT OF CASH FLOW
151GROUP CAPITAL EXPENDITUREAND DEPRECIATION
152GROUP STATEMENT OFCHANGES IN EQUITY
154 GROUP SEGMENTAL ANALYSIS
157 GROUP STATISTICS
157 ESTIMATES AND CONTINGENCIES
158 DIVIDEND DECLARATION
159 ANALYSIS OF SHAREHOLDERS
162NOTICE OF THE ANNUAL GENERAL MEETING
167 FORM OF PROXY
PAGEPAGE
140DIRECTORS’ RESPONSIBILITY STATEMENT
138

PAGE
143DIRECTORS’ REPORT
PAGE
142SUMMARY CONSOLIDATED ANNUAL FINANCIAL STATEMENTS
SUMMARY CONSOLIDATED
ANNUAL FINANCIAL
STATEMENTS
139

GR
OU
P F
IVE
Inte
grat
ed a
nnua
l rep
ort
2015
DIRECTORS’ RESPONSIBILITY STATEMENT for the year ended 30 June 2015
The board acknowledges its responsibility to ensure the integrity of the integrated annual report. The board has applied its mind to the integrated annual report and believes that it addresses all material issues, and presents fairly the integrated performance of the organisation and its impacts.
The integrated annual report has been prepared in line with best practice and the recommendations of King III.
The integrated annual report was approved by the board on 7 August 2015 and is signed on its behalf:
P (Philisiwe) Mthethwa ECJ (Eric) Vemer CM (Cristina) Freitas Teixeira
Chairperson Chief executive officer Chief financial officer
7 August 2015 7 August 2015 7 August 2015
140

REPORT OF THE INDEPENDENT AUDITOR for the year ended 30 June 2015
ON THE SUMMARY CONSOLIDATED FINANCIAL STATEMENTS TO THE SHAREHOLDERS OF GROUP FIVE LIMITED
The summary consolidated financial statements, which comprise the summary consolidated statement of financial position as at 30 June 2015, and the summary consolidated income statement, statements of comprehensive income, changes in equity and cash flows for the year then ended, and related notes, as set out on pages 148 to 158, are derived from the audited consolidated financial statements of Group Five Limited for the year ended 30 June 2015. We expressed an unmodified audit opinion on those consolidated financial statements in our report dated 14 August 2015. Our auditor’s report on the audited consolidated financial statements contained an Other Matter paragraph (refer below).
The summary consolidated financial statements do not contain all the disclosures required by International Financial Reporting Standards and the requirements of the Companies Act of South Africa as applicable to annual financial statements. Reading the summary consolidated financial statements, therefore, is not a substitute for reading the audited consolidated financial statements of Group Five Limited.
DIRECTORS’ RESPONSIBILITY FOR THE SUMMARY CONSOLIDATED FINANCIAL STATEMENTS
The company’s directors are responsible for the preparation of a summary of the audited consolidated financial statements in accordance with the requirements of the JSE Limited’s requirements for summary financial statements, set out in the basis of preparation note to the summary consolidated financial statements and the requirements of the Companies Act of South Africa as applicable to summary financial statements.
AUDITOR’S RESPONSIBILITY
Our responsibility is to express an opinion on the summary consolidated financial statements based on our procedures, which were conducted in accordance with International Standard on Auditing (ISA) 810, “Engagements to Report on Summary Financial Statements”.
OPINION
In our opinion, the summary consolidated financial statements derived from the audited consolidated financial statements of Group Five Limited for the year ended 30 June 2015 are consistent, in all material respects, with those consolidated financial statements, in accordance with the requirements of the JSE Limited’s requirements for summary financial statements, set out in basis of preparation note to the summary consolidated financial statements, and the requirements of the Companies Act of South Africa as applicable to summary financial statements.
The Other Matter paragraph in our audit report dated 14 August 2015 states that as part of our audit of the consolidated financial statements for the year ended 30 June 2015, we have read the Directors’ Report, Report of the Audit Committee and the Statement of Compliance by the Company Secretary for the purpose of identifying whether there are material inconsistencies between these reports and the audited consolidated financial statements. These reports are the responsibility of the respective preparers. The Other Matter paragraph states that, based on reading these reports, we have not identified material inconsistencies between these reports and the audited consolidated financial statements. The paragraph furthermore states that we have not audited these reports and accordingly do not express an opinion on these reports. The Other Matter paragraph does not have an effect on the summary consolidated financial statements or our opinion thereon.
PricewaterhouseCoopers Inc.
Director: AJ RossouwRegistered AuditorSunninghill
14 August 2015
141
GR
OU
P F
IVE
Inte
grat
ed a
nnua
l rep
ort
2015
for the year ended 30 June 2015
SUMMARY CONSOLIDATED ANNUAL FINANCIAL STATEMENTS
These consolidated annual financial statements comprise a summary of the audited consolidated annual financial statements of the group for the year ending 30 June 2015 that were approved by the board on 7 August 2015.
The summary consolidated annual financial statements are not the group’s statutory accounts and do not contain all the disclosures required by International Financial Reporting Standards. Reading the summary consolidated annual financial statements, therefore, is not a substitute for reading the audited consolidated annual financial statements of the group, as they do not contain sufficient information to allow for a complete understanding of the results and state of affairs of the group. The audited consolidated annual financial statements are available online at www.groupfive.co.za, or may be obtained from the company secretary. The annual financial statements have been audited by the independent accounting firm, PricewaterhouseCoopers Inc. Their unmodified audit report is available for inspection at the group’s registered office and their opinion on these summary consolidated annual financial statements is on page 141.
BASIS OF PREPARATION
The summary consolidated financial statements are prepared in accordance with the JSE Limited’s (JSE) requirements for summary financial statements, and the requirements of the Companies Act applicable to summary financial statements. The JSE requires summary financial statements to be prepared in accordance with the framework concepts and the measurement and recognition requirements of International Financial Reporting Standards, the SAICA Financial Reporting Guides as issued by the Accounting Practices Committee and Financial Pronouncements as issued by the Financial Reporting Standards Council, and to also, as a minimum, contain the information required by IAS 34 Interim Financial Reporting. The accounting policies applied in the preparation of the consolidated financial statements, from which the summary consolidated financial statements were derived, are in terms of International Financial Reporting Standards
and are consistent with the accounting policies applied in the preparation of the previous consolidated annual financial statements.
The summary consolidated annual financial statements have been prepared on the historical cost basis, except for certain items, including derivatives, investment in service concessions and investment property that are stated at fair value, and are presented in South African Rand, which is the parent company’s presentation currency.
The significant accounting policies and methods of computation are consistent in all material respects with those applied in the previous period. The summary consolidated annual financial statements should be read with the full set of annual financial statements as available on the company’s website.
The financial statements were prepared by the Chief Financial Officer CA(SA) and approved by the board of directors on 7 August 2015 and are signed on its behalf by:
P (Philisiwe) Mthethwa
Chairperson
ECJ (Eric) Vemer
Chief executive officer
CM (Cristina) Freitas Teixeira
Chief financial officer
7 August 2015
142

for the year ended 30 June 2015
DIRECTORS’ REPORT
NATURE OF BUSINESS
Group Five Limited is an investment holding company with interests in the building, infrastructural and engineering sectors. The company does not trade and all of its activities are undertaken through its subsidiaries, joint arrangements and associates. The group operates in South Africa, rest of Africa, and Eastern Europe. The company has its primary listing on the JSE Limited.
GROUP RESULTS
Headline earnings per share (HEPS) of 205 cents represents a decrease of 49.7%, and fully diluted HEPS (FDHEPS) of 204 cents per share a decrease of 49.0%, compared to the HEPS and FDHEPS of 407 cents and 399 cents per share respectively for F2014.
Earnings per share (EPS) of 222 cents and fully diluted EPS (FDEPS) of 221 cents per share represents a 44.7% and 43.9% decrease respectively over the 401 cents per share and 394 cents per share for F2014.
The difference between earnings and headline earnings in the period is mainly as a result of a profit on a fair value adjustment of an investment property held by associate company of R13,8 million (net of tax) and a net profit on disposal of an investment in associate including a reversal of an impairment of R2,6 million (net of tax).
Group revenue decreased by 9.7% from R15,4* billion to R13,9 billion, as a result of the comparatively large order book traded in the prior period in Energy and Civil Engineering segments.
The group’s core operating profit decreased by 46.4% from R650,2* million to R348,4 million as a result of weaker operating results from the Engineering & Construction cluster mostly due to contract losses within the Civil Engineering and Projects segments and the reduced rate of trade in the Civil Engineering and Energy segments, reducing the group’s overall core operating margin from 4.2*% in the prior year to 2.5%. The group’s total operating margin also reduced to 2.6% (F2014: 4.2%*). Most segments, other than the Civil Engineering and Projects segments, performed in line with the most recent margin guidance provided.
The core operating profit does not include a surplus on the group’s pension fund of R18,9 million (F2014: R6,9 million) as a result of an actuarial valuation assessment. This gain is included in total earnings. This gain was offset by a share-based payment expense of R8,1 million (F2014: R30,0 million) as a result of the
group’s BBBEE ownership transaction, which was approved by shareholders in F2013.
Included in operating profit is fair value net upward adjustments of R115,7 million (F2014: R83,8 million) relating to the group’s interests in Eastern European road transport concessions. This positively affected the group’s results in the year. The group values its investments in service concessions at fair value at the time of investing or making an irrevocable commitment to invest. Fair values are determined using the discounted cash flow method of valuation using anticipated future cash flow based on market-related exchange and inflation rates. The relevant Euro ZAR exchange rate used was 13,64 (2014: 14,46). The cash flows are discounted at appropriate rates that take into account the relevant market and project risks. Discount rates ranging between 9% to 14% was used for both F2015 and F2014.
The financial statements on pages 148 to 153 set out the financial position, results of operations and cash flows for the group for the financial year ended 30 June 2015. Segmental information as approved by the directors relating to the business of the group is set out on pages 154 to 156.
During the year the group transferred the remaining business within its discontinued cluster of Construction Materials into continuing operations. This operation now trades within the Manufacturing cluster. In terms of IFRS 5 – Non-current assets held for sale and discontinued operations, the group is required to restate its prior year reported income statement and statement of cash flow to reflect the result of the change.
Financial performance
The group delivered a disappointing result in F2015 as a result of the group’s Engineering & Construction cluster under-performance. Firm action has been taken to address underlying contract challenges.
The weak result was mainly as a result of: significant losses incurred on a previously reported
South African contract that impacted both the Civil Engineering and Projects segments
retrenchment and holding costs incurred in relation to the rightsizing of the Civil Engineering segment
a weak performance in the Energy segment due to delayed new contract start-ups and lower revenues over the prior year
The Building & Housing segment was the strongest performer in the Engineering & Construction cluster, delivering a steady result on the back of increased
* Restated for the application of IFRS 5 – Non-current assets held for sale and discontinued operations, as a result of the decision to transfer the remaining business within the discontinued cluster of Construction Materials into continuing operations within the Manufacturing cluster.
143

GR
OU
P F
IVE
Inte
grat
ed a
nnua
l rep
ort
2015
revenues compared to the prior year, underpinned by sturdy order intake in the South African private and public sector markets.
As a result of incurring significant losses on a local contract, experiencing very low levels of new order intake, and having to implement a rightsizing and associated retrenchment program, Civil Engineering delivered incredibly weak results. The actions taken during the year have placed the business on a more stable platform, and positioned it for recovery in F2016.
Projects reported a lower F2015 result, directly as a result of losses incurred on the same local contract that impacted Civil Engineering. Whilst Projects core target market in mining and resources remains subdued, the business has been successful in securing new work, notably in the power sector.
Revenue and earnings declined in the Energy segment off the comparatively high levels recorded in the prior year and impacted by delays in commencement of new projects. As previously disclosed, the finalisation costs incurred in H1 F2015 at completion of certain contracts also had a negative impact on full year results.
The Investments & Concessions cluster was the best performer for the group delivering a strong result. This cluster delivered a strong financial performance primarily due to an excellent result from the Eastern European operations of Infrastructure Concessions.
The Manufacturing team was able to deliver an acceptable, albeit lower result despite a flat market, the negative business impact of power outages, and the rapid decline of steel prices which impacted our steel cluster operations particularly during the second half of the financial year. The team continues to innovate to drive production efficiencies and is selectively developing new traded products that are complementary to our core light-weight dry building materials markets.
In line with expectations, group net finance costs of R1,6 million were recorded for the year compared to the net finance costs of R1,8* million in the prior year.
The effective tax rate of 28% (F2014: 34%) is the same as the South African statutory tax rate. This was mainly due to a prudent approach adopted to the raising of deferred taxation assets and an increase in under-provided taxation from the past year which was offset by liabilities in jurisdictions with lower taxation rates.
Financial position
It is pleasing to note that the group’s statement of financial position continues to be sound, with a nil net
gearing ratio and an increase in the bank and cash balance to R3,4 billion as at 30 June 2015 (F2014: R2,9 billion and H1 F2015: R3,1 billion).
Cash flow
The group generated R425,1 million (F2014: R902,7* million) cash from operations before working capital of R118,9 million (F2014: R530,7* million absorbed). This resulted in a net cash inflow from operating activities of R238,1 million (F2014: R150,6 million) after settlement of taxation liabilities of R218,4 million (F2014: R139,5 million) and the dividend to shareholders of R85,7 million (F2014: R80,2 million).
After a net cash investment of R69,7 million (F2014: R151,1 million) in plant and equipment and investment property and net borrowings raised of R145,5 million (F2014: net R68,5 million repaid), and net proceeds on repayment of service concessions loans of R153,2 million (F2014: R22,9 million), a net inflow of R468,8 million was realised (F2014: R44,9 million outflow).
Capital expenditure
Details on capital expenditure is set out on page 151 of this report.
SUBSIDIARIES, JOINT ARRANGEMENTS AND ASSOCIATES
The interest in subsidiaries, joint arrangements and associated companies, are set out on Annexures 3 to 6 of the audited group annual financial statements available online at www.groupfive.co.za.
BUSINESS COMBINATIONS
There were no business combinations during the current reporting period.
As previously communicated, approval from the Department of Mineral Resources (DMR) is awaited on the sale of two quarries to finally fulfil the sale conditions precedent. However, the sale agreements reached with the new owners allowed for the transfer of operational control immediately on concluding the sale agreements, including transfer of operating profits and losses. This was achieved on the two quarries sold in F2013. Proceeds on the sale of these businesses were received as expected. During the year the group transferred the remaining business within its discontinued cluster of Construction Materials into continuing operations. This operation now trades within the Manufacturing cluster.
STATED CAPITAL
The movement in the number of shares during the year under review is summarised in the statement of changes in
* Restated for the application of IFRS 5 – Non-current assets held for sale and discontinued operations, as a result of the decision to transfer the remaining business within the discontinued cluster of Construction Materials into continuing operations within the Manufacturing cluster.
DIRECTORS’ REPORT
continued
144

equity on pages 152 to 153 of this report. The authorised and issued share capital is as follows:
Authorised:
150 000 000 ordinary shares of no par value.
Issued:
112 206 869 ordinary shares of no par value (F2014: 112 104 493).
All shares have been fully paid up.
11 081 964 shares (F2014: 11 305 707) are held as treasury stock in terms of the trust deeds.
The group’s ownership transaction comprises two components, namely:
a Black Professionals Staff Trust; and the Izakhiwo Imfundo Bursary Trust
The implementation of the Black Professionals Staff Trust and Izakhiwo Imfundo Bursary Trust was approved by shareholders on 27 November 2012. The transaction was concluded on 16 January 2013 following the fulfilment of all conditions precedent.
The share-based payment benefit provided to the Izakhiwo Imfundo Bursary Trust was recognised as a non-recurring equity-settled share-based payment. The full charge of R16,8 million (originally estimated at R12,7 million as per the circular to shareholders) was recognised fully on grant date in H2 F2013.
The estimated share-based payment benefit with respect to the Black Professionals Staff Trust at period-end date was R86,4 million (June 2014: R149,9 million, December 2014: R87,0 million) and is recognised as a cash-settled share-based payment transaction over the life of the scheme from the effective date of this transaction to the assumed end date of November 2020. An amount of R8,1 million (F2014: R30,0 million) was charged to earnings in F2015.
The implementation of the Izakhiwo Imfundo Bursary Trust portion of the revised transaction resulted in a two million share increase in prior years. The implementation of the Black Professionals Staff Trust at the effective date did not increase the weighted average number of shares in issue, as these remain anti dilutive at 30 June 2015. However, this is required to be reassessed at each reporting period.
SPECIAL RESOLUTIONS
Other than the authorisation to repurchase shares, approval of non-executive directors’ remuneration and authority to
provide financial support to subsidiary companies, no special resolutions relating to the capital structure, borrowing powers or any other material matter that affects the understanding of the Group were passed.
RELATED PARTY TRANSACTIONS
Related parties to the group are identified as the group’s directors, prescribed officers, senior management, subsidiaries, joint ventures and associates. Disclosure of transactions with these parties during the year is provided in the audited group annual financial statements available online at www.groupfive.co.za.
SHAREHOLDER SPREAD
Details of shareholder categories are set out on pages 159 to 161 of this report.
DIVIDEND DECLARATION
The group has previously disclosed that the company has adopted an approximate four times basic earnings per share dividend cover policy. This policy is subject to review on a semi-annual basis, prior to dividend declaration, as distributions will be influenced by business growth or movements in earnings as a result of fair value accounting adjustments.
Details of the dividend declaration is set out on page 158 of this report.
DIRECTORS AND SECRETARY
The names and CVs of the directors appear on pages 12 to 15 and on the online integrated annual report under the corporate governance review, available at www.groupfive.co.za. Further information on the directors, including their interest in the shares of the company and share-based remuneration schemes are provided on pages 122 to 123, 133 and 160.
No contracts in which the directors share an interest were entered into.
The policy detailing the procedures for appointment to the board is detailed within the review from the company secretary that can be found on the online section of the integrated annual report at www.groupfive.co.za.
Appointments to the board are recommended by the nominations committee and considered by the board as a whole. This involves evaluating the existing balance of skills and experience against the needs of the group.
MR Upton, the group’s previous Chief Executive Officer, retired from the board of directors and from the group on
145

GR
OU
P F
IVE
Inte
grat
ed a
nnua
l rep
ort
2015
28 November 2014. We thank him for his hard work and valuable contribution over the years he was with us.
In terms of the company’s memorandum of incorporation, Ms PM Mthethwa (nee Buthelezi), Messrs NJ Chinyanta, and SG Morris are obliged to retire by rotation at this annual general meeting in accordance with the provisions of clause 24.6.2 of the company’s memorandum of incorporation. Having so retired and being eligible, Ms PM Mthethwa, Messrs NJ Chinyanta, and SG Morris offer themselves for re-election. The board of directors has assessed the performance of the directors standing for election and re-election, and has found them suitable for appointment and reappointment. Refer to pages 122 to 123 and 131 to 132 for disclosure on non-executive and executive directors’ remuneration.
DIRECTORS’ SHAREHOLDINGS
At 30 June 2015, the number of ordinary shares held beneficially and non-beneficially by the current directors was 46 370 and 1 000 respectively (F2014: 311 984 and 1 000 respectively). There has been no material change in their holdings between the year-end and the date of this report.
BORROWING POWERS
In terms of the memorandum of incorporation, the company has unlimited borrowing powers. The revised memorandum of incorporation was approved by the shareholders at the previous annual general meeting held in November 2014.
GOING CONCERN
The directors believe that the group has adequate financial resources to continue in operation for the foreseeable future and accordingly, the financial statements have been prepared on a going concern basis. The board is not aware of any new material changes that may adversely impact the group. The board is not aware of any material non-compliance with statutory or regulatory requirements. The board is not aware of any pending changes in legislation in any of the major countries in which it operates that may affect the group.
EVENTS AFTER REPORTING DATE
Other than the declaration of the final dividend for the 2015 financial year on 7 August 2015, the board is not aware of any matter or circumstance arising since the end of the reporting period not otherwise dealt with in the
consolidated annual financial statements which significantly affects the financial position of the group as at 30 June 2015 or the results of its operations or cash flows for the year then ended.
INDUSTRY MATTERS
Management have continued to engage with the Competition Commission of South Africa (“the Commission”) in an attempt to responsibly settle on any outstanding matters on reasonable terms, while conscious of its accountability to conclude this matter for the benefit of all its stakeholders.
As reported previously, the group has secured conditional leniency from the Commission in terms of the Commission’s Corporate Leniency Policy in return for full disclosure of all matters that the group was able to uncover during its internal investigation process.
The group was implicated in four contracts which had not been detected through its internal investigation. During the year the Commission confirmed that its investigation into two of the four implicated contracts has been concluded, and the cases have been dropped.
Settlement on the remaining two contracts has not been concluded due to a lack of evidence and factual discrepancies which remain. During the year the Commission referred the alleged collusive tendering on these two remaining contracts to the Competition Tribunal. This was anticipated. The group continues to retain a co-operative stance with the Competition Authorities on these two long outstanding matters so that it may be expeditiously concluded and in so doing bring certainty to shareholders, employees and all other stakeholders.
Based on legal counsel assessment, any settlement or liability would be adequately covered by the provision raised in F2013.
The group continues to drive industry transformation priorities through its own internal strategy and work-plan, under the leadership of the CEO and a newly appointed dedicated senior transformation director. The group views addressing the issues of company and sector transformation as fundamental to re-aligning the interest of government with the priorities of the sector, as a precursor to, and in support of, the national agenda for the roll out of the much needed infrastructure programmes embodied in government’s National Development Plan (NDP), and in support of our African focused growth plan.
DIRECTORS’ REPORT
continued
146
BOND ISSUE UNDER THE BOND EXCHANGE OF SOUTH AFRICA (BESA) DOMESTIC MEDIUM TERM NOTES (DMTN) PROGRAMME
The JSE Limited granted a listing to the group in respect of two senior unsecured notes issued under the group’s R1 billion Domestic Medium Term Note Programme.
Two unsecured bonds were issued on 11 April 2012 as follows:
GFC03: R220 million, three-year, 7.87% floating (three-month JIBAR) interest rate payable quarterly. The bond settlement due date was 10 April 2015.
GFC04: R280 million, five-year, 9.4850% fixed interest rate payable semi-annually. The settlement date for this bond is 11 April 2017. The primary application of these funds is intended to finance equity investments in Power, Transport, Real Estate opportunities and concessions.
The GFC03 bullet payment was settled in April 2015.
Global Credit Ratings agency awarded the group a long term National A- credit rating and a short term National A1- credit rating.
BORROWINGS
During the year, in addition to trade asset backed capital equipment finance leases and property backed finance the group entered into the following borrowing transactions:
A revolving credit facility for USD20 million bearing a variable interest, linked to LIBOR, at year end of 2.03%. This loan is repayable in September 2015.
A revolving credit facility for R250 million bearing a variable interest, linked to JIBAR, at year end of 8.6%. The revolving credit facility is available for a period of two years with the option to extend for one year. This loan replaces the funding previously made available by the domestic medium term note which was settled in April 2015.
AUDITORS
The policy with regard to the non-audit services provided by the external auditors is detailed within the review from the company secretary that can be found on the online section of the integrated annual report at www.groupfive.co.za. It confirms that the approval of non-audit work to be carried out by the external auditors is the responsibility of the audit committee and this is included within the committee’s terms of reference.
PricewaterhouseCoopers Inc. will continue in office in accordance with section 90(6) of the Companies Act. At the annual general meeting shareholders will be requested to appoint PricewaterhouseCoopers Inc. as the group’s auditors for the 2016 financial year and it is noted that M Naidoo will be the individual registered auditor who will undertake the audit.
ANNUAL GENERAL MEETING (AGM)
The AGM will be held at 11:00 on 3 November 2015. Refer to pages 162 to 166 of this report for further details of the ordinary and special business for consideration at this meeting.
DOMICILE, COUNTRY OF INCORPORATION AND REGISTERED OFFICE
The company is incorporated in the Republic of South Africa, its domicile and registered offices are No 9 Country Estate Drive Waterfall Business Estate, Jukskei View, Johannesburg, 1662.
147

GR
OU
P F
IVE
Inte
grat
ed a
nnua
l rep
ort
2015
GROUP INCOME STATEMENT for the year ended 30 June 2015
GROUP
AUDITED
(R’000)2015
2014Restated*
Construction and related revenue 11 943 497 13 499 363Revenue from goods and services supplied 1 852 519 1 831 617Property sales and development fees 79 554 29 464
Revenue 13 875 570 15 360 444
Cost of material (2 281 605) (2 235 792)Cost of subcontractors (5 835 872) (6 545 898)Direct payroll cost (3 454 480) (3 417 574)Other staff cost (327 581) (394 305)Depreciation (187 138) (267 143)Plant costs (813 269) (738 274)Manufacturing distribution cost (152 152) (159 669)Site administration costs (340 657) (654 952)Other administration cost (232 066) (387 723)
Operating expenses (13 624 820) (14 801 330)
Operating profit before fair value adjustments 250 750 559 114Fair value adjustment relating to investment in service concessions 115 726 83 840
Operating profit 366 476 642 954
Share of equity accounted profits 24 592 28 095Finance cost – net (1 622) (1 779)
Finance cost (64 255) (66 504)Finance income 62 633 64 725
Profit before taxation 389 446 669 270
Taxation (109 045) (229 738)
Profit for the year 280 401 439 532
Profit attributable to:Equity shareholders of Group Five Limited 223 884 401 421Non-controlling interest 56 517 38 111
280 401 439 532
Earnings per share – [Rand] 2,22 4,01Fully diluted earnings per share – [Rand] 2,21 3,94
* Restated for the application of IFRS 5 – Non-current assets held for sale and discontinued operations, as a result of the decision to transfer the remaining business within the discontinued cluster of Construction Materials into continuing operations within the Manufacturing cluster.
148

GROUP
AUDITED
(R’000) 2015 2014
Attributable profit 223 884 401 421
Adjusted for (net of tax) (17 331) 5 399
– (Profit)/loss on disposal of property, plant and equipment (918) 3 397– Loss on impairment of investment in associate including a loss on acquisition of
interest in subsidiary – 2 002– Profit on fair value adjustment on investment property held by associate company (13 787) –– Net profit on disposal of an investment in associate including a reversal of
impairment of investment in associate (2 626) –
Headline earnings 206 553 406 820
DETERMINATION OF GROUP HEADLINE EARNINGS for the year ended 30 June 2015
GROUP STATEMENT OF COMPREHENSIVE INCOME for the year ended 30 June 2015
GROUP
AUDITED
(R’000) 2015 2014
Profit for the year 280 401 439 532
Other comprehensive incomeItems that may be subsequently reclassified to profit or lossExchange difference on translating foreign operations 131 114 78 391Items that will not be reclassified to profit or lossRe-measurements of pension fund 20 440 53 503Tax on re-measurement of pension fund (5 723) (14 981)
Other comprehensive income for the year 145 831 116 913
Total comprehensive income for the year 426 232 556 445
Total comprehensive income attributable to:
Equity shareholders of Group Five Limited 369 715 518 334Non-controlling interest 56 517 38 111
Total comprehensive income for the year 426 232 556 445
149
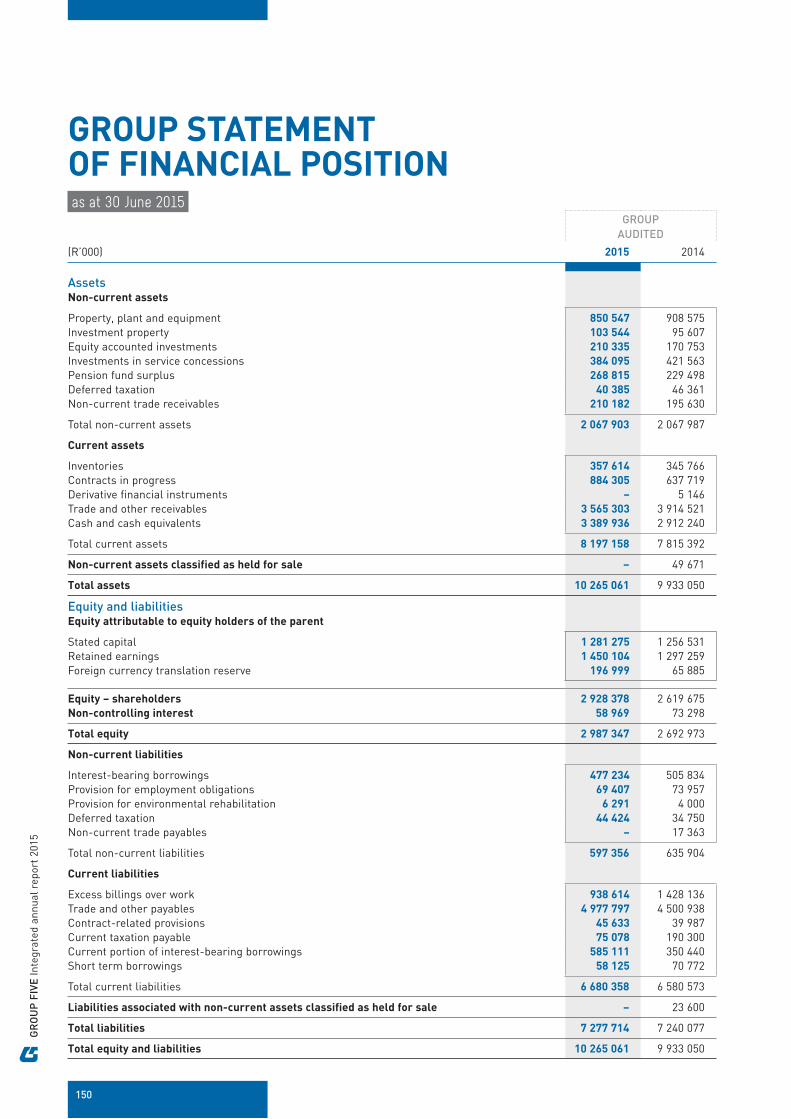
GR
OU
P F
IVE
Inte
grat
ed a
nnua
l rep
ort
2015
GROUP STATEMENT OF FINANCIAL POSITION as at 30 June 2015
GROUP
AUDITED
(R’000) 2015 2014
AssetsNon-current assets
Property, plant and equipment 850 547 908 575Investment property 103 544 95 607Equity accounted investments 210 335 170 753Investments in service concessions 384 095 421 563Pension fund surplus 268 815 229 498Deferred taxation 40 385 46 361Non-current trade receivables 210 182 195 630
Total non-current assets 2 067 903 2 067 987
Current assets
Inventories 357 614 345 766Contracts in progress 884 305 637 719Derivative financial instruments – 5 146Trade and other receivables 3 565 303 3 914 521Cash and cash equivalents 3 389 936 2 912 240
Total current assets 8 197 158 7 815 392
Non-current assets classified as held for sale – 49 671
Total assets 10 265 061 9 933 050
Equity and liabilitiesEquity attributable to equity holders of the parent
Stated capital 1 281 275 1 256 531Retained earnings 1 450 104 1 297 259Foreign currency translation reserve 196 999 65 885
Equity – shareholders 2 928 378 2 619 675Non-controlling interest 58 969 73 298
Total equity 2 987 347 2 692 973
Non-current liabilities
Interest-bearing borrowings 477 234 505 834Provision for employment obligations 69 407 73 957Provision for environmental rehabilitation 6 291 4 000Deferred taxation 44 424 34 750Non-current trade payables – 17 363
Total non-current liabilities 597 356 635 904
Current liabilities
Excess billings over work 938 614 1 428 136Trade and other payables 4 977 797 4 500 938Contract-related provisions 45 633 39 987Current taxation payable 75 078 190 300Current portion of interest-bearing borrowings 585 111 350 440Short term borrowings 58 125 70 772
Total current liabilities 6 680 358 6 580 573
Liabilities associated with non-current assets classified as held for sale – 23 600
Total liabilities 7 277 714 7 240 077
Total equity and liabilities 10 265 061 9 933 050
150

GROUP
AUDITED
(R’000) 2015 2014
– Capital expenditure for the year 148 596 261 593– Capital expenditure committed or authorised for the next year 376 496 258 723– Depreciation for the year 187 138 267 143
GROUP CAPITAL EXPENDITURE AND DEPRECIATION for the year ended 30 June 2015
GROUP STATEMENT OF CASH FLOW for the year ended 30 June 2015
(R’000)
GROUP
AUDITED
2015 2014Restated*
Cash flow from operating activities
Cash from operations before working capital changes 425 144 902 679Working capital changes 118 838 (530 692)
Cash generated from operations 543 982 371 987Finance income received 62 633 64 725Finance costs paid (64 255) (66 504)Taxation paid (218 453) (139 462)Dividends paid (85 756) (80 166)
Cash effects of operating activities 238 151 150 580
Cash flow from investing activities
Acquisition of property, plant and equipment (117 681) (167 409)Acquisition of investment property and associates (1 841) (25 154)Proceeds on disposal of property, plant and equipment 49 773 41 448
Cash effects of investing activities (69 749) (151 115)
Cash flow from financing activities
Distribution to non-controlling interest (70 846) (36 461)Loans to equity accounted investments (14 990) (10 053)Proceeds on service concessions investments 153 194 22 961Interest-bearing borrowings raised 493 128 –Interest-bearing borrowings repaid (347 596) (68 501)Net proceeds from share options 4 753 6 660
Cash effects of financing activities 217 643 (85 394)
Effects of exchange rates on cash and cash equivalents 82 794 41 069
Net increase/(decrease) in cash and cash equivalents 468 839 (44 860)Cash and cash equivalents at beginning of year 2 921 097 2 965 957
Cash and cash equivalents at end of year 3 389 936 2 921 097
– Included in cash and cash equivalents per statement of financial position 3 389 936 2 912 240– Included in non-current assets classified as held for sale – 8 857
3 389 936 2 921 097
* Restated for the application of IFRS 5 – Non-current assets held for sale and discontinued operations, as a result of the decision to transfer the remaining business within the discontinued cluster of Construction Materials into continuing operations within the Manufacturing cluster.
151

GR
OU
P F
IVE
Inte
grat
ed a
nnua
l rep
ort
2015
GROUP STATEMENT OF CHANGES IN EQUITY for the year ended 30 June 2015
Numberof
ordinarysharesissued
Numberof shares
held bysharetrust
Netshares
issued topublic
StatedcapitalR’000
Foreigncurrency
translationreserve
R’000
Retainedearnings
R’000
Equityshare-
holdersR’000
Non-controlling
interestR’000
TotalR’000
Balance at 30 June 2013 111 149 510 (11 643 098) 99 506 412 1 229 568 (12 506) 937 482 2 154 544 75 325 2 229 869
Issue of shares to share trust in terms of share scheme 954 983 (954 983) – – – – – – –
Issue of shares from share trust – 1 292 374 1 292 374 6 660 – – 6 660 – 6 660
Share-based payment expense – – – 20 303 – – 20 303 – 20 303
Total comprehensive income – – – – 78 391 439 943 518 334 38 111 556 445
Profit for the year – – – – – 401 421 401 421 38 111 439 532
Pension fund re-measurement – – – – – 53 503 53 503 – 53 503
Tax on pension fund re-measurement – – – – – (14 981) (14 981) – (14 981)
Exchange differences arising from foreign operations – – – – 78 391 – 78 391 – 78 391
Distribution to non-controlling interests – – – – – – – (36 461) (36 461)
Acquisition of interest in subsidiary – – – – – – – (3 677) (3 677)
Dividends paid – – – – – (80 166) (80 166) – (80 166)
Balance at 30 June 2014 112 104 493 (11 305 707) 100 798 786 1 256 531 65 885 1 297 259 2 619 675 73 298 2 692 973
Issue of shares to share trust in terms of share scheme (i) 102 376 (102 376) – – – – – –
Issue of shares from share trust – 326 119 326 119 4 753 – – 4 753 – 4 753
Share-based payment expense – – – 19 991 – – 19 991 – 19 991
Total comprehensive income – – – – 131 114 238 601 369 715 56 517 426 232
Profit for the year – – – – – 223 884 223 884 56 517 280 401
Pension fund re-measurement – – – – – 20 440 20 440 – 20 440
Tax on pension fund re-measurement – – – – – (5 723) (5 723) – (5 723)
Exchange differences arising from foreign operations – – – – 131 114 – 131 114 – 131 114
Distribution to non-controlling interests – – – – – – – (70 846) (70 846)
Dividends paid – – – – – (85 756) (85 756) – (85 756)
Balance at 30 June 2015 112 206 869 (11 081 964) 101 124 905 1 281 275 196 999 1 450 104 2 928 378 58 969 2 987 347
152

The following movement in the number of shares took place in the year:
(i) Issue of shares in terms of share scheme:
Date PriceNumber
of shares
September 2014 R41,50 1 414 October 2014 R12,55 – R40,89 68 896 March 2015 R25,30 – R25,75 26 899 May 2015 R31,00 5 167
Total 102 376
Non-controlling interest
Non-controlling interest mainly relates to profit share of controlled joint arrangements by the entity.
Foreign currency translation reserve
Non-distributable reserve arising from the translation of the assets and liabilities attributable to foreign operations to the presentation currency.
153
GR
OU
P F
IVE
Inte
grat
ed a
nnua
l rep
ort
2015
GROUP SEGMENTAL ANALYSIS for the year ended 30 June 2015
SEGMENT INFORMATION
Operating segments reflect the management structure of the group for the period under review and the manner in which performance is evaluated and resources allocated as managed by the group’s chief operating decision-maker, defined as the executive committee members (exco) of the group.
These operating segments for the year under review are defined as:
Operating segment Revenue source
ENGINEERING &
CONSTRUCTION
Building & Housing Civil Engineering Projects Energy
Building and housing contractor for large real estate and related infrastructure contracts
Civil engineering contractor for roads, ports, airports, pipelines and large structures in the mining and industrial sectors
Engineering project contractor for structural, mechanical, piping and electrical engineering, as well as complete plant construction solutions
Multi-disciplinary project delivery from feasibility through to supporting bankability and front-end design, as well as project management of contracts during execution to completion, with a focus on the energy sector, including power plant construction and nuclear construction services
Industrial services contractor
INVESTMENTS &
CONCESSIONS
Equipment supply, operations and maintenance revenue in concession contract developments in the transport sector
Rental and development sales of A-grade property assets generating development and investment returns
MANUFACTURING
Manufacture and sale of fibre cement products – exterior and interior walling, ceiling boards, roof tiles and pipes, fibre cement-clad, steel-framed modular housing systems
Manufacture and sale of steel products, including scaffolding, formwork and steel reinforcing for use in concrete structures, fabricated steel structures and large bore steel pipes
The group is focused by discipline and each discipline is led by an executive committee member.
During the current year, the Construction cluster, which housed the Building & Housing, Civil Engineering and Projects segments, was consolidated with the previously named Engineering & Construction cluster, now named Energy, and renamed Engineering & Construction.
The role of exco is to drive the strategic intent of the group per segment. The executive committee members meet monthly to review the group’s performance. Of primary focus to exco is the revenue, operating profit, capital expenditure and current assets per segment. Exco assesses the performance of the operating segments based on a measure of adjusted operating profit. This measurement basis excludes the effects of non-operational income and expenditure from the operating segments such as pension fund re-measurements, profit/loss on sale or impairment of subsidiaries and re-measurement of employment obligations. Gains or losses on disposal of property, plant and equipment, as well as investment property and fair value adjustments on service concessions and investment property are not adjusted as these are deemed to be in the segments’ core operational control. The operating profit does not include any impairment adjustments. As exco reviews operating profit, the results of discontinued operations are not included in the measure of operating profit.
Management do not believe that there are any additional segments that require separate reporting. The reportable operating segments derive their revenue as described above. The group is also considered by geographical segment due to the extensive geographic footprint maintained by the group. The geographies are grouped into regions for reporting purposes as the group moves towards establishing operational hubs for management of regions.
The segmental information presented includes the reconciliation of IFRS measures presented on the face of the income statement to non-IFRS measures which are used by management to analyse the group’s performance.
154
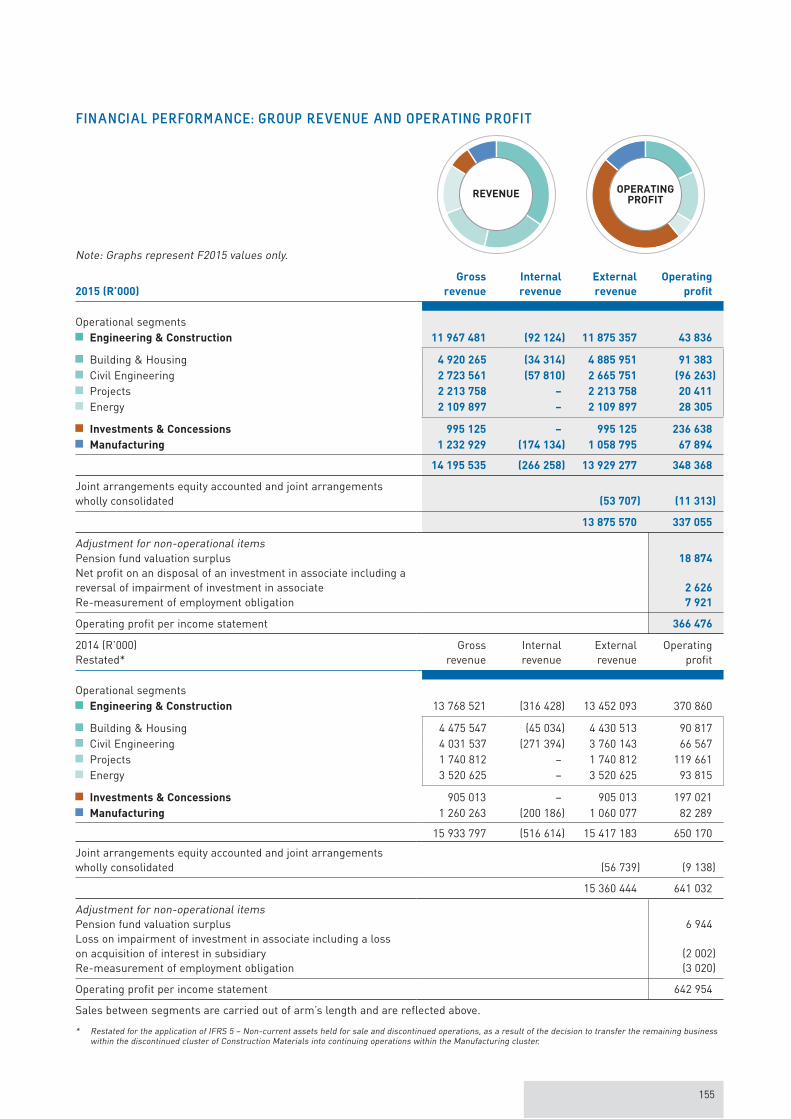
155
FINANCIAL PERFORMANCE: GROUP REVENUE AND OPERATING PROFIT
Note: Graphs represent F2015 values only.
REVENUE OPERATINGPROFIT
2015 (R’000)
Gross
revenue
Internal
revenue
External
revenue
Operating
profit
Operational segmentsEngineering & Construction 11 967 481 (92 124) 11 875 357 43 836
Building & Housing 4 920 265 (34 314) 4 885 951 91 383
Civil Engineering 2 723 561 (57 810) 2 665 751 (96 263)
Projects 2 213 758 – 2 213 758 20 411
Energy 2 109 897 – 2 109 897 28 305
Investments & Concessions 995 125 – 995 125 236 638
Manufacturing 1 232 929 (174 134) 1 058 795 67 894
14 195 535 (266 258) 13 929 277 348 368
Joint arrangements equity accounted and joint arrangements wholly consolidated (53 707) (11 313)
13 875 570 337 055
Adjustment for non-operational itemsPension fund valuation surplus 18 874
Net profit on an disposal of an investment in associate including a reversal of impairment of investment in associate 2 626
Re-measurement of employment obligation 7 921
Operating profit per income statement 366 476
2014 (R’000)Restated*
Grossrevenue
Internalrevenue
Externalrevenue
Operatingprofit
Operational segmentsEngineering & Construction 13 768 521 (316 428) 13 452 093 370 860
Building & Housing 4 475 547 (45 034) 4 430 513 90 817 Civil Engineering 4 031 537 (271 394) 3 760 143 66 567 Projects 1 740 812 – 1 740 812 119 661 Energy 3 520 625 – 3 520 625 93 815
Investments & Concessions 905 013 – 905 013 197 021 Manufacturing 1 260 263 (200 186) 1 060 077 82 289
15 933 797 (516 614) 15 417 183 650 170
Joint arrangements equity accounted and joint arrangements wholly consolidated (56 739) (9 138)
15 360 444 641 032
Adjustment for non-operational itemsPension fund valuation surplus 6 944Loss on impairment of investment in associate including a loss on acquisition of interest in subsidiary (2 002)Re-measurement of employment obligation (3 020)
Operating profit per income statement 642 954
Sales between segments are carried out of arm’s length and are reflected above.
* Restated for the application of IFRS 5 – Non-current assets held for sale and discontinued operations, as a result of the decision to transfer the remaining business within the discontinued cluster of Construction Materials into continuing operations within the Manufacturing cluster.

GR
OU
P F
IVE
Inte
grat
ed a
nnua
l rep
ort
2015
GROUP SEGMENTAL ANALYSIS
continued
156
FINANCIAL POSITION: CURRENT ASSETS AND CAPITAL EXPENDITURE
Note: Graphs represent F2015 values only.
CURRENTASSETS
CAPITALEXPENDITURE
(R'000) 2015 2014 2015 2014
Operational segmentsEngineering & Construction 4 046 432 4 193 043 104 694 207 025
Building & Housing 1 241 925 828 623 7 620 21 978 Civil Engineering 1 471 338 1 568 433 52 245 143 962 Projects 658 873 550 361 40 509 19 218 Energy 674 296 1 245 626 4 320 21 867
Investments & Concessions 305 216 301 051 15 301 16 223 Manufacturing 449 374 444 724 32 594 39 201
4 801 022 4 938 818 152 589 262 449
Joint arrangements equity accounted and joint arrangements wholly consolidated 6 200 (35 666) (3 993) (856)
4 807 222 4 903 152 148 596 261 593Bank balances and cash 3 389 936 2 912 240 – –
Total current assets per statement of financial position 8 197 158 7 815 392 – –Property, plant and equipment – additions – – 148 596 261 593
The measures of current assets and capital expenditure have been disclosed for each reportable segment as these are regularly provided to exco.
GEOGRAPHICAL INFORMATION
South Africa is regarded as the group’s country of domicile. As described, the various geographies are monitored via operational hubs and thus disclosed as such below.
Note: Graphs represent F2015 values only.
REVENUE
(R'000)2015 2014
Restated*
Geographical regionsEastern Europe 623 083 581 860Eastern Africa 11 763 143 781Southern Africa 11 895 079 12 966 788Central Africa 419 977 1 447 380Western Africa 979 375 277 374
13 929 277 15 417 183
Joint arrangements equity accounted and joint arrangements wholly consolidated (53 707) (56 739)
13 875 570 15 360 444
Per income statement 13 875 570 15 360 444
* Restated for the application of IFRS 5 – Non-current assets held for sale and discontinued operations, as a result of the decision to transfer the remaining business within the discontinued cluster of Construction Materials into continuing operations within the Manufacturing cluster.

ESTIMATES AND CONTINGENCIES
GROUP
AUDITED
2015 2014
Number of ordinary shares 101 124 905 100 798 786
– Shares in issue 112 206 869 112 104 493– Less: shares held by share trusts (11 081 964) (11 305 707)
Weighted average number of shares (’000s) 100 895 100 053Fully diluted weighted average number of shares (’000s) 101 298 101 897Total operations
EPS – R 2,22 4,01 HEPS – R 2,05 4,07 Fully diluted EPS – R 2,21 3,94 Fully diluted HEPS – R 2,04 3,99Dividend cover (based on earnings per share) 4,0 4,0Dividends per share (cents) 55,0 100,0
– Interim 30,0 45,0– Final 25,0 55,0
Net asset value per share – R 28,96 25,99Net debt to equity ratio – –Current ratio 1,2 1,2
EPS: Earnings per share.HEPS: Headline earnings per share.
GROUP STATISTICS as at 30 June 2015
The group makes estimates and assumptions concerning the future, particularly with regard to construction contract profit taking, provisions, arbitrations and claims and various fair value accounting policies.
Accounting estimates and judgements can, by definition, only approximate results, as the actual results may differ from such estimates. Estimates and judgements are continually evaluated and are based on historic experience and other factors, including expectations of future events that are believed to be reasonable under the circumstances.
Stakeholder attention is drawn to the contingent risk of civil claims possibly being lodged against the group, and all construction companies which were implicated in anti-competitive behaviour, following the Competition Commission release of its findings in June 2013 and the public interest reported in recent months. To date, no claim has been instituted against the group.
Total financial institution guarantees given to third parties on behalf of subsidiary companies amounted to R7 144 million as at 30 June 2015, compared to R7 298 million as at 31 December 2014 and R3 643 million as at 30 June 2014.
157

GR
OU
P F
IVE
Inte
grat
ed a
nnua
l rep
ort
2015
DIVIDEND DECLARATION
DIVIDEND DECLARATION
On 7 August 2015, the directors declared a gross dividend of 25 cents per ordinary share (cents per ordinary share net of dividend withholding tax) (H2 F2014: 55 cents).
The dividend has been declared from income reserves. In terms of dividend withholding tax, the following additional information is disclosed:
The dividend is subject to dividend withholding tax at 15% (3,75 cents per share) The net dividend will, therefore, be 21,25000 cents per share for shareholders who are not exempt from dividend
withholding tax The amount of shares in issue at the date of this declaration is 112 206 869 (101 124 905 exclusive of treasury shares)
and the company’s tax reference number is 9625/077/71/5
In order to comply with the requirements of STRATE, the relevant details are:
Event Date
Last date to trade (cum dividend) Thursday, 17 September 2015
Shares to commence trading (ex-dividend) Friday, 18 September 2015
Record date (date shareholders recorded in books) Friday, 25 September 2015
Payment date Monday, 28 September 2015
No share certificates may be dematerialised or rematerialised between Friday, 18 September 2015 and Friday, 25 September 2015, both dates inclusive.
158

ANALYSIS OF SHAREHOLDERS At 30 June 2015
No of shareholders %
No of shares %
1. SHAREHOLDER SPREAD1 – 1 000 shares 3 436 73.17 875 903 0.781 001 – 10 000 shares 813 17.31 2 856 468 2.5510 001 – 100 000 shares 326 6.94 11 361 369 10.13100 001 – 1 000 000 shares 100 2.13 29 638 669 26.411 000 001 shares and over 21 0.45 67 474 460 60.13
Totals 4 696 100.00 112 206 869 100.00
2. DISTRIBUTION OF SHAREHOLDERSBanks 53 1.13 11 978 986 10.68Close corporations 20 0.43 94 722 0.08Empowerment 3 0.06 13 055 259 11.64Endowment funds 26 0.55 287 402 0.26Government 2 0.04 121 469 0.11Individuals 3 847 81.92 4 653 771 4.15Insurance companies 40 0.85 4 743 518 4.23Investment companies 11 0.23 490 409 0.44Medical schemes 20 0.43 231 913 0.21Mutual funds 130 2.77 39 080 521 34.82Other corporations 6 0.13 16 930 0.01Private companies 59 1.26 3 539 703 3.15Public companies 5 0.11 21 262 0.02Retirement funds 220 4.68 32 768 971 29.20Share trust 1 0.02 26 705 0.02Trusts 253 5.39 1 095 328 0.98
Totals 4 696 100.00 112 206 869 100.00
3. PUBLIC/NON-PUBLIC SHAREHOLDERSNon-public shareholders 16 0.34 13 330 916 11.88Directors of the company 1 0.02 47 370 0.04Executive committee members of the company 5 0.11 119 423 0.11Senior management of the company 6 0.13 82 159 0.07Empowerment trusts 3 0.06 13 055 259 11.64Share trusts 1 0.02 26 705 0.02Public shareholders 4 680 99.66 98 875 953 88.12
Totals 4 696 100.00 112 206 869 100.00
159
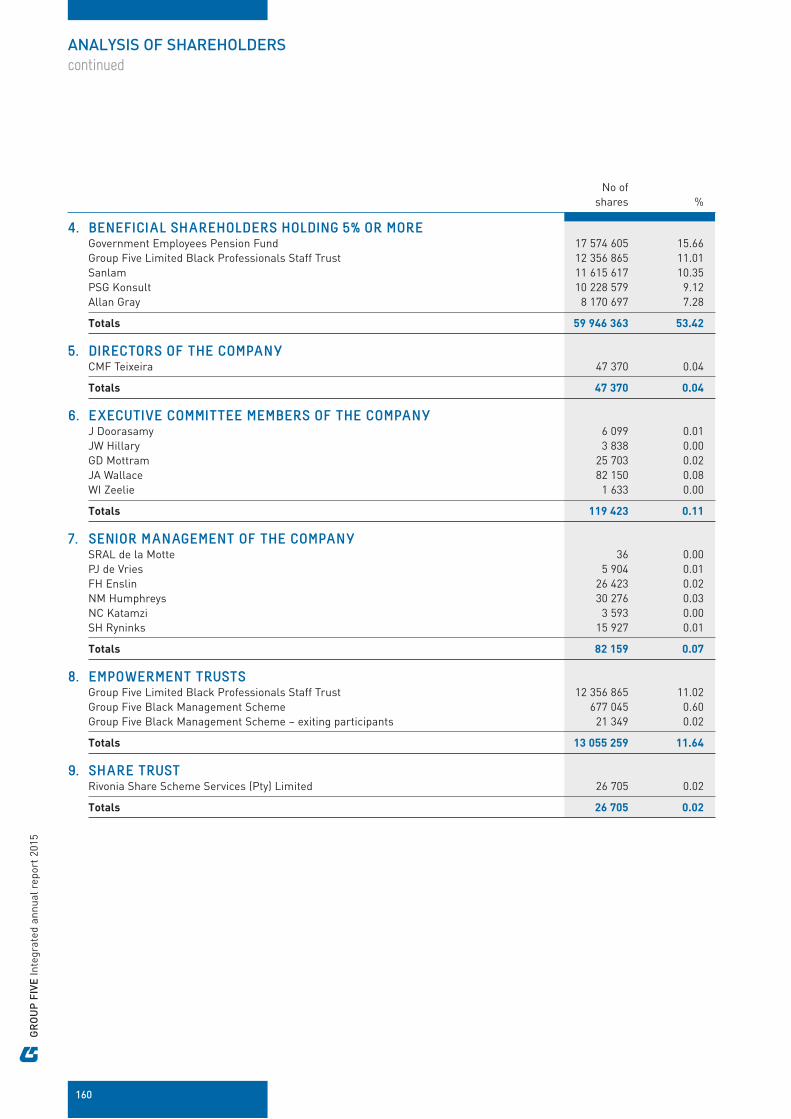
GR
OU
P F
IVE
Inte
grat
ed a
nnua
l rep
ort
2015
No of shares %
4. BENEFICIAL SHAREHOLDERS HOLDING 5% OR MOREGovernment Employees Pension Fund 17 574 605 15.66Group Five Limited Black Professionals Staff Trust 12 356 865 11.01Sanlam 11 615 617 10.35PSG Konsult 10 228 579 9.12Allan Gray 8 170 697 7.28
Totals 59 946 363 53.42
5. DIRECTORS OF THE COMPANY CMF Teixeira 47 370 0.04
Totals 47 370 0.04
6. EXECUTIVE COMMITTEE MEMBERS OF THE COMPANY J Doorasamy 6 099 0.01JW Hillary 3 838 0.00GD Mottram 25 703 0.02JA Wallace 82 150 0.08WI Zeelie 1 633 0.00
Totals 119 423 0.11
7. SENIOR MANAGEMENT OF THE COMPANY SRAL de la Motte 36 0.00PJ de Vries 5 904 0.01FH Enslin 26 423 0.02NM Humphreys 30 276 0.03NC Katamzi 3 593 0.00SH Ryninks 15 927 0.01
Totals 82 159 0.07
8. EMPOWERMENT TRUSTS Group Five Limited Black Professionals Staff Trust 12 356 865 11.02Group Five Black Management Scheme 677 045 0.60Group Five Black Management Scheme – exiting participants 21 349 0.02
Totals 13 055 259 11.64
9. SHARE TRUSTRivonia Share Scheme Services (Pty) Limited 26 705 0.02
Totals 26 705 0.02
ANALYSIS OF SHAREHOLDERS
continued
160
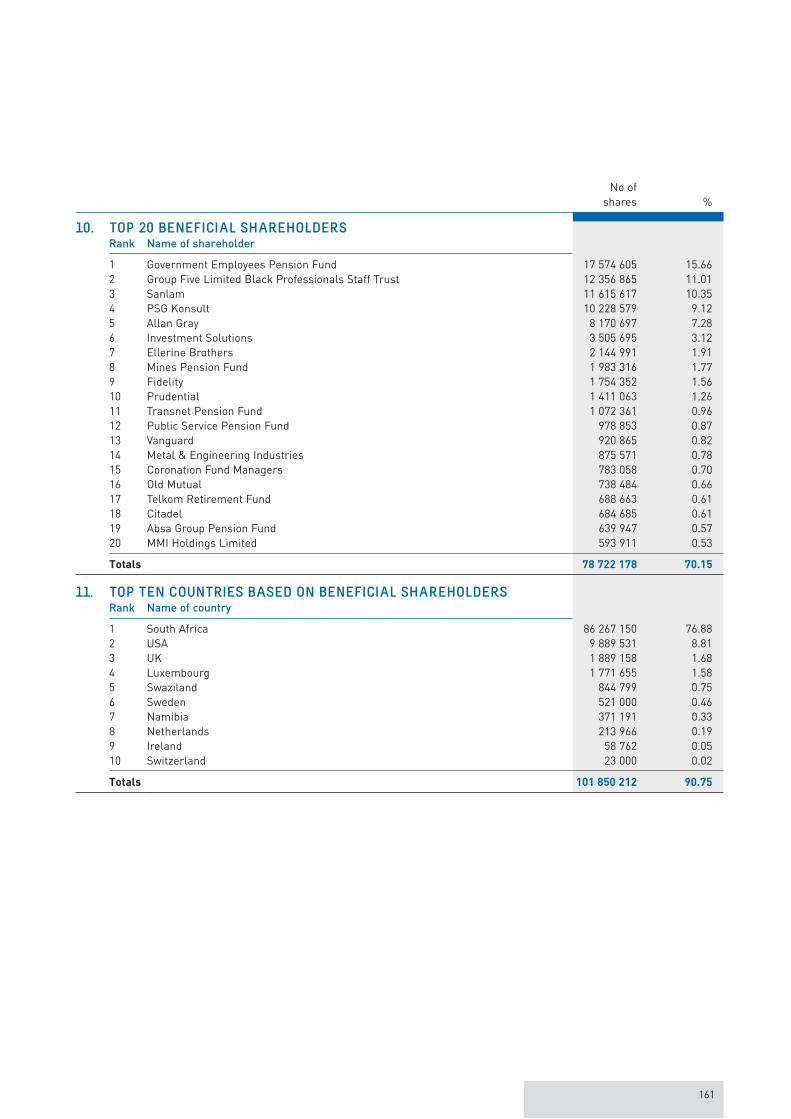
No of shares %
10. TOP 20 BENEFICIAL SHAREHOLDERSRank Name of shareholder
1 Government Employees Pension Fund 17 574 605 15.662 Group Five Limited Black Professionals Staff Trust 12 356 865 11.013 Sanlam 11 615 617 10.354 PSG Konsult 10 228 579 9.125 Allan Gray 8 170 697 7.286 Investment Solutions 3 505 695 3.127 Ellerine Brothers 2 144 991 1.918 Mines Pension Fund 1 983 316 1.779 Fidelity 1 754 352 1.5610 Prudential 1 411 063 1.2611 Transnet Pension Fund 1 072 361 0.9612 Public Service Pension Fund 978 853 0.8713 Vanguard 920 865 0.8214 Metal & Engineering Industries 875 571 0.7815 Coronation Fund Managers 783 058 0.7016 Old Mutual 738 484 0.6617 Telkom Retirement Fund 688 663 0.6118 Citadel 684 685 0.6119 Absa Group Pension Fund 639 947 0.5720 MMI Holdings Limited 593 911 0.53
Totals 78 722 178 70.15
11. TOP TEN COUNTRIES BASED ON BENEFICIAL SHAREHOLDERSRank Name of country
1 South Africa 86 267 150 76.882 USA 9 889 531 8.813 UK 1 889 158 1.684 Luxembourg 1 771 655 1.585 Swaziland 844 799 0.756 Sweden 521 000 0.467 Namibia 371 191 0.338 Netherlands 213 966 0.199 Ireland 58 762 0.0510 Switzerland 23 000 0.02
Totals 101 850 212 90.75
161

GR
OU
P F
IVE
Inte
grat
ed a
nnua
l rep
ort
2015
NOTICE OF THE ANNUAL GENERAL MEETING
GROUP FIVE LIMITED
(Registration number 1969/000032/06)(Incorporated in the Republic of South Africa)Share code: GRF ISIN code: ZAE000027405(“Group Five” or “the company” or “the group”)
NOTICE OF ANNUAL GENERAL MEETING
Notice is hereby given that the annual general meeting of shareholders of the company will be held at the registered office of Group Five, No 9 Country Estate Drive, Waterfall Business Estate, Jukskei View, Johannesburg, on Tuesday, 3 November 2015 at 11:00, to consider and, if deemed fit, pass, with or without modification, the ordinary and special resolutions set out below and to deal with such other business as may be lawfully dealt with at the meeting.
PRESENTATION TO SHAREHOLDERS OF:
The consolidated annual financial statements of the company and its subsidiaries for the year ended 30 June 2015
Directors’ report Independent auditor’s report Audit committee report Social and ethics committee report
The complete annual financial statements are available on www.groupfive.co.za
RESOLUTIONS FOR CONSIDERATION AND ADOPTION
1. ORDINARY RESOLUTION NUMBER 1: Re-election
of directors
Ms PM Mthethwa (nee Buthelezi), Messrs NJ Chinyanta, and SG Morris are obliged to retire by rotation at this annual general meeting in accordance with the provisions of clause 24.6.2 of the company’s memorandum of incorporation. Having so retired and being eligible, Ms PM Mthethwa, Messrs NJ Chinyanta, and SG Morris offer themselves for re-election.
1.1 ORDINARY RESOLUTION NUMBER 1.1 “RESOLVED that PM Mthethwa be and is hereby re-elected as a director of the company with effect from 3 November 2015.”
1.2 ORDINARY RESOLUTION NUMBER 1.2 “RESOLVED that NJ Chinyanta be and is hereby re-elected as a director of the company with effect from 3 November 2015.”
1.3 ORDINARY RESOLUTION NUMBER 1.3
“RESOLVED that SG Morris be and is hereby re-elected as a director of the company with effect from 3 November 2015.”
The board of directors has assessed the performance of the directors standing for re-election and has found them suitable for reappointment. A brief CV in respect of each director standing for re-election appears on pages 12 to 15 of this integrated annual report, as well as in the online section of the integrated annual report.
2. ORDINARY RESOLUTION NUMBER 2: Election of group
audit committee members subject, where necessary,
to their reappointment as directors of the company in
terms of the resolutions in paragraph 1 above.
To elect by separate resolutions a group audit committee comprising independent non-executive directors, as provided in section 94(4) of the Companies Act and appointed in terms of section 94(2) of the Companies Act to hold office until the next annual general meeting to perform the duties and responsibilities stipulated in section 94(7) of the Companies Act and the King III Report on Governance for South Africa 2009 and to perform such other duties and responsibilities as may from time to time be delegated by the board of directors for the company and all subsidiary companies.
2.1 ORDINARY RESOLUTION NUMBER 2.1 “RESOLVED that SG Morris be and is hereby elected as a member and chairperson of the group audit committee of the company with effect from 3 November 2015.”
2.2 ORDINARY RESOLUTION NUMBER 2.2 “RESOLVED that JL Job be and is hereby elected as a member of the group audit committee of the company with effect from 3 November 2015.”
2.3 ORDINARY RESOLUTION NUMBER 2.3 “RESOLVED that KK Mpinga be and is hereby elected as a member of the group audit committee of the company with effect from 3 November 2015.”
2.4 ORDINARY RESOLUTION NUMBER 2.4
“RESOLVED that B Ngonyama be and is hereby elected as a member of the group audit committee of the company with effect from 3 November 2015.”
2.5 ORDINARY RESOLUTION NUMBER 2.5
“RESOLVED that VM Rague be and is hereby elected as a member of the group audit committee of the company with effect from 3 November 2015.”
2.6 ORDINARY RESOLUTION NUMBER 2.6
“RESOLVED that MR Thompson be and is hereby elected as a member of the group audit committee of the company with effect from 3 November 2015.”
162
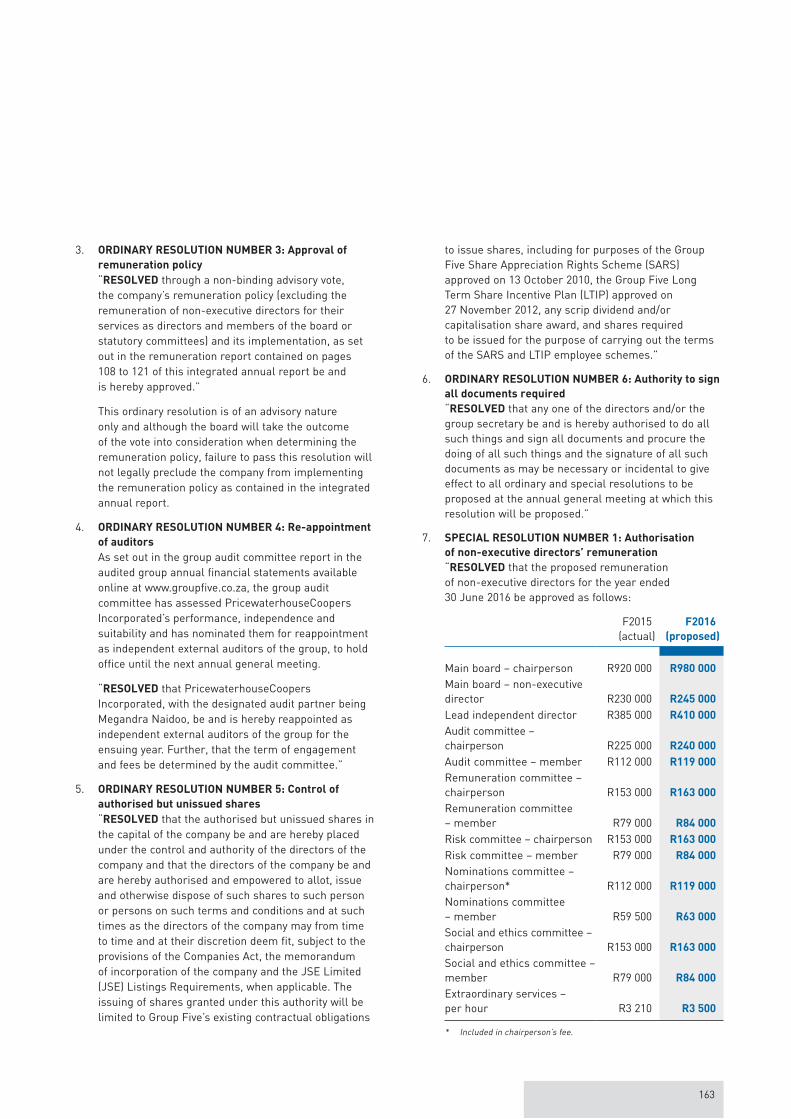
3. ORDINARY RESOLUTION NUMBER 3: Approval of
remuneration policy
“RESOLVED through a non-binding advisory vote, the company’s remuneration policy (excluding the remuneration of non-executive directors for their services as directors and members of the board or statutory committees) and its implementation, as set out in the remuneration report contained on pages 108 to 121 of this integrated annual report be and is hereby approved.”
This ordinary resolution is of an advisory nature only and although the board will take the outcome of the vote into consideration when determining the remuneration policy, failure to pass this resolution will not legally preclude the company from implementing the remuneration policy as contained in the integrated annual report.
4. ORDINARY RESOLUTION NUMBER 4: Re-appointment
of auditors
As set out in the group audit committee report in the audited group annual financial statements available online at www.groupfive.co.za, the group audit committee has assessed PricewaterhouseCoopers Incorporated’s performance, independence and suitability and has nominated them for reappointment as independent external auditors of the group, to hold office until the next annual general meeting.
“RESOLVED that PricewaterhouseCoopers Incorporated, with the designated audit partner being Megandra Naidoo, be and is hereby reappointed as independent external auditors of the group for the ensuing year. Further, that the term of engagement and fees be determined by the audit committee.”
5. ORDINARY RESOLUTION NUMBER 5: Control of
authorised but unissued shares
“RESOLVED that the authorised but unissued shares in the capital of the company be and are hereby placed under the control and authority of the directors of the company and that the directors of the company be and are hereby authorised and empowered to allot, issue and otherwise dispose of such shares to such person or persons on such terms and conditions and at such times as the directors of the company may from time to time and at their discretion deem fit, subject to the provisions of the Companies Act, the memorandum of incorporation of the company and the JSE Limited (JSE) Listings Requirements, when applicable. The issuing of shares granted under this authority will be limited to Group Five’s existing contractual obligations
to issue shares, including for purposes of the Group Five Share Appreciation Rights Scheme (SARS) approved on 13 October 2010, the Group Five Long Term Share Incentive Plan (LTIP) approved on 27 November 2012, any scrip dividend and/or capitalisation share award, and shares required to be issued for the purpose of carrying out the terms of the SARS and LTIP employee schemes.”
6. ORDINARY RESOLUTION NUMBER 6: Authority to sign
all documents required
“RESOLVED that any one of the directors and/or the group secretary be and is hereby authorised to do all such things and sign all documents and procure the doing of all such things and the signature of all such documents as may be necessary or incidental to give effect to all ordinary and special resolutions to be proposed at the annual general meeting at which this resolution will be proposed.”
7. SPECIAL RESOLUTION NUMBER 1: Authorisation
of non-executive directors’ remuneration
“RESOLVED that the proposed remuneration of non-executive directors for the year ended 30 June 2016 be approved as follows:
F2015 (actual)
F2016
(proposed)
Main board – chairperson R920 000 R980 000
Main board – non-executive director R230 000 R245 000
Lead independent director R385 000 R410 000
Audit committee – chairperson R225 000 R240 000
Audit committee – member R112 000 R119 000
Remuneration committee – chairperson R153 000 R163 000
Remuneration committee – member R79 000 R84 000
Risk committee – chairperson R153 000 R163 000
Risk committee – member R79 000 R84 000
Nominations committee – chairperson* R112 000 R119 000
Nominations committee – member R59 500 R63 000
Social and ethics committee – chairperson R153 000 R163 000
Social and ethics committee – member R79 000 R84 000
Extraordinary services – per hour R3 210 R3 500
* Included in chairperson’s fee.
163
GR
OU
P F
IVE
Inte
grat
ed a
nnua
l rep
ort
2015
8. SPECIAL RESOLUTION NUMBER 2: General authority
to repurchase shares
“RESOLVED that, subject to compliance with the JSE Listings Requirements, the Companies Act and the memorandum of incorporation of the company, the directors of the company be and are hereby authorised at their discretion to procure that the company or subsidiaries of the company acquire by repurchase on the JSE ordinary shares issued by the company provided that:
the number of ordinary shares acquired in any one financial year shall not exceed 20% (twenty percent) of the ordinary shares in issue at the date on which this resolution is passed;
this must be effected through the order book operated by the JSE trading system and done without any prior understanding or arrangement between the company and the counterparty;
this authority shall lapse on the earlier of the date of the next annual general meeting of the company or 15 months after the date on which this resolution is passed; and
the price paid per ordinary share may not be greater than 10% (ten percent) above the weighted average of the market value of the ordinary shares for the five business days immediately preceding the date on which a purchase is made.
RATIONALE FOR THE AUTHORITY
The rationale for this special resolution is to authorise the directors, if they deem it appropriate in the interests of the company, to procure that the company or subsidiaries of the company acquire or repurchase ordinary shares issued by the company subject to the restrictions contained in the above resolution. At the present time the directors have no specific intention with regard to the utilisation of this authority which will only be used if the circumstances are appropriate. The directors, after considering the effect of a repurchase of up to 20% (twenty percent) of the company’s issued ordinary shares, are of the opinion that if such repurchase is implemented:
the company and the group will be able to pay their debts in the ordinary course of business for a period of 12 months after the date of this notice;
the recognised and measured assets of the company and the group in accordance with the accounting policies used in the latest audited annual group financial statements, will exceed the liabilities of the company and the group for a period of 12 months after the date of this notice;
the ordinary capital and reserves of the company and the group will be adequate for the purposes of the business of the company and the group for a period of 12 months after the date of this notice; and
the working capital of the company and the group will be adequate for the purposes of the business of the company and the group for a period of 12 months after the date of this notice.
The directors undertake that: the company or the group will not repurchase securities
during a prohibited period as defined in paragraph 3.67 of the JSE Listings Requirements unless the company has a repurchase programme in place where the dates and quantities of securities to be traded during the relevant prohibited period are fixed (not subject to any variation) and full details of the programme have been disclosed to the JSE prior to the commencement of the prohibited period;
an announcement will be made when the company has cumulatively repurchased 3% (three percent) of the initial number of the relevant class of securities, and for each 3% (three percent) in aggregate of the initial number of that class acquired thereafter;
the company will only appoint one agent to effect any repurchase(s) on its behalf; and
prior to entering the market to repurchase the company’s securities, a company resolution to authorise the repurchase will have been passed in accordance with the requirements of section 48 of the Companies Act, and stating that the board has acknowledged that it has applied the solvency and liquidity test as set out in section 4 of the Companies Act and has reasonably concluded that the company will satisfy the solvency and liquidity test immediately after completing the proposed distribution.
DISCLOSURES REQUIRED IN TERMS OF THE JSE LISTINGS REQUIREMENTS
The following information is provided in accordance with paragraph 11.26 of the JSE Listings Requirements and relates to special resolution number 2 above.
DIRECTORS’ RESPONSIBILITY STATEMENT
The directors, whose names are given on pages 12 to 15 of this integrated annual report, collectively and individually accept full responsibility for the accuracy of the information given in special resolution number 2, and certify that to the best of their knowledge and belief there are no facts that have been omitted which would make any statements false or misleading and that all reasonable enquiries to ascertain such facts have been made and that this resolution and additional disclosure in terms of paragraph 11.26 of the JSE Listings Requirements pertaining thereto contain all information required by law and the JSE Listings Requirements.
MATERIAL CHANGES
Other than the facts and developments reported on in these annual financial statements, there have been no material changes in the affairs, financial or trading position of the group since the signature date of this integrated annual report and the posting date thereof.
The following disclosures required in terms of the JSE Listings Requirements are set out in accordance
NOTICE OF THE ANNUAL GENERAL MEETING
continued
164
with the reference pages in this integrated annual report of which this notice forms part: major shareholders of the company (pages 159 to 161);
and share capital of the company (page 152).
9. SPECIAL RESOLUTION NUMBER 3: General authority
to provide financial assistance to related and
inter-related companies
“RESOLVED as a special resolution in terms of the Companies Act that the provision by the company of any direct or indirect financial assistance as contemplated in section 45 of the Companies Act to any 1 (one) or more related or inter-related companies of the company, be and is hereby approved, provided that:
1. (i) the specific recipient or recipients of such financial assistance;
(ii) the form, nature and extent of such financial assistance;
(iii) the terms and conditions under which such financial assistance is provided are determined by the board of directors of the company from time to time;
2. the board has satisfied the requirements of section 45 of the Companies Act in relation to the provision of any financial assistance;
3. such financial assistance to a recipient thereof is, in the opinion of the board of directors of the company, required for the purpose of:
(i) meeting all or any of such recipient’s operating expenses (including capital expenditure); and/or
(ii) funding the growth, expansion, reorganisation or restructuring of the businesses or operations of such recipient; and/or
(iii) any other purpose, which in the opinion of the board of directors of the company, is directly or indirectly in the interests of the company; and
4. the authority granted in terms of this special resolution shall end 2 (two) years from the date of adoption of this special resolution.”
RATIONALE FOR THE AUTHORITY
The rationale for special resolution number 3 is to grant the directors of Group Five the authority to provide direct or indirect financial assistance through the lending of money, guaranteeing of a loan or other obligation and securing any debt or obligation, to its subsidiaries, associates and inter-related companies.
10. TO TRANSACT SUCH OTHER BUSINESS AS MAY BE
TRANSACTED AT AN ANNUAL GENERAL MEETING.
RECORD DATE
The board of directors of the company have set Friday, 23 October 2015, as the record date for determining which shareholders are entitled to participate in and vote at the annual general meeting.
IDENTIFICATION, VOTING AND PROXIES
In terms of section 63(1) of the Companies Act, any person attending or participating in the annual general meeting must present reasonable satisfactory identification and the person presiding at the annual general meeting must be reasonably satisfied that the right of any person to participate in and vote (as shareholder or as proxy for a shareholder) has been reasonably verified. Suitable forms of identification will include valid identity documentation, driver’s licences and passports.
A form of proxy is attached for the convenience of any certificated or dematerialised Group Five shareholders with own-name registrations who cannot attend the annual general meeting, but wish to be represented. To be valid, completed forms of proxy must be received by the transfer secretaries of the company, Computershare Investor Services (Pty) Limited, Ground Floor, 70 Marshall Street, Johannesburg, 2001 (PO Box 61051, Marshalltown, 2107) by no later than 11:00 on Friday, 30 October 2015.
All beneficial owners of Group Five shares who have dematerialised their shares through a central securities depository participant (CSDP) or broker, other than those with own-name registration, and all beneficial owners of shares who hold certificated shares through a nominee, must provide their CSDP, broker or nominee with their voting instructions, in accordance with the agreement between the beneficial owner and the CSDP, broker or nominee. Should such beneficial owners wish to attend the meeting in person, they must request their CSDP, broker or nominee to issue them with the appropriate letter of representation. Group Five does not accept responsibility and will not be held liable for any failure on the part of a CSDP or broker to notify such Group Five shareholder of the annual general meeting.
ELECTRONIC PARTICIPATION BY SHAREHOLDERS
In compliance with the provisions of the Companies Act, Group Five intends to offer shareholders reasonable access, through electronic facilities, to participate in the annual general meeting by means of a conference call facility. Shareholders will be able to listen to the proceedings and raise questions should they wish to do so. Shareholders are invited to indicate their intention to make use of this facility by applying in writing (including details on how the shareholder or representative (including proxy) can be contacted) to the transfer secretaries, at the address above. The aforesaid application is to be received by the transfer secretaries at least 7 (seven) business days prior to the annual general meeting, namely Friday, 23 October 2015.
165

GR
OU
P F
IVE
Inte
grat
ed a
nnua
l rep
ort
2015
The transfer secretaries will, by way of e-mail, provide information enabling participation to those shareholders who have made such application. Voting will not be possible via the electronic facility and shareholders wishing to exercise their voting rights at the annual general meeting are required to be represented at the meeting either in person, by proxy or by letter of representation as provided for in the notice of annual general meeting.
The company reserves the right not to provide for electronic participation at the annual general meeting if it determines that it is not practical to do so, or an insufficient number of shareholders (or their representatives or proxies) request to participate in this manner.
By order of the board
N (Nonqaba) Katamzi
Company secretary
7 August 2015
Registered office Transfer secretaries
Group Five Limited Computershare InvestorNo 9 Country Estate Drive Services (Pty) LimitedWaterfall Business Estate 70 Marshall StreetJukskei View Johannesburg 2001Johannesburg 1662
Postnet Suite 500 PO Box 61051Private Bag X26 MarshalltownSunninghill 21072157
NOTICE OF THE ANNUAL GENERAL MEETING
continued
166
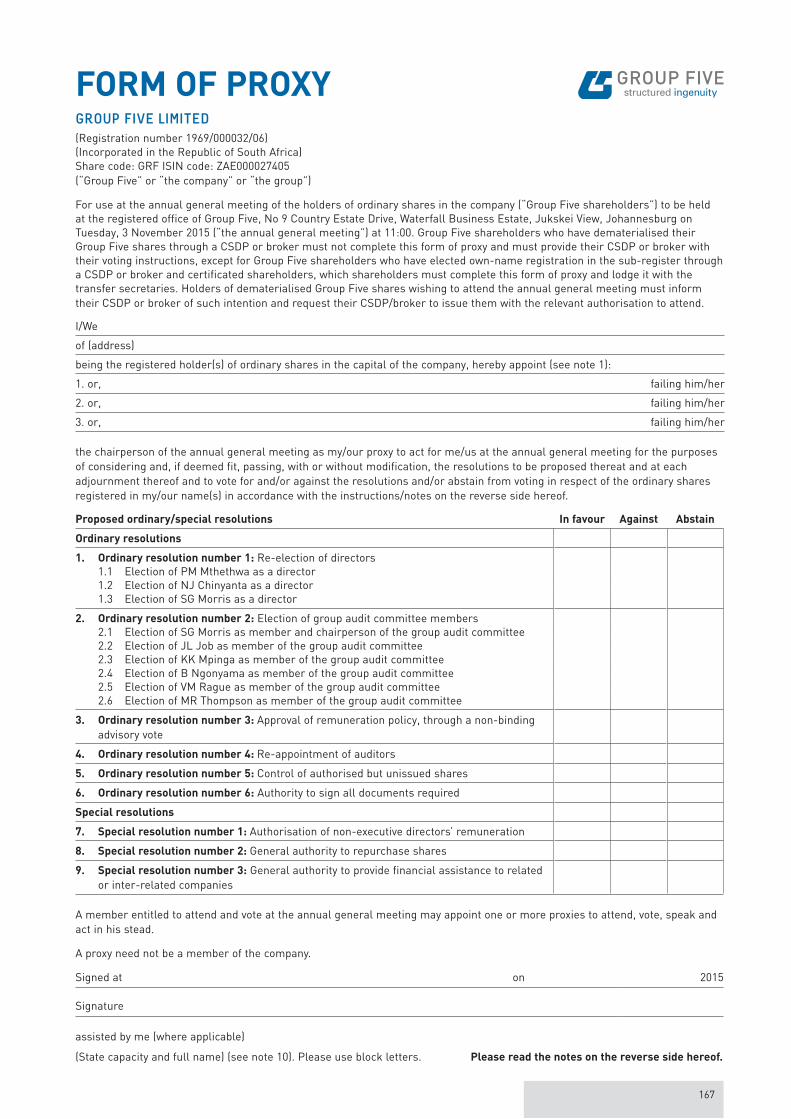
FORM OF PROXYGROUP FIVE LIMITED
(Registration number 1969/000032/06)(Incorporated in the Republic of South Africa)Share code: GRF ISIN code: ZAE000027405(“Group Five” or “the company” or “the group”)
For use at the annual general meeting of the holders of ordinary shares in the company (“Group Five shareholders”) to be held at the registered office of Group Five, No 9 Country Estate Drive, Waterfall Business Estate, Jukskei View, Johannesburg on Tuesday, 3 November 2015 (“the annual general meeting”) at 11:00. Group Five shareholders who have dematerialised their Group Five shares through a CSDP or broker must not complete this form of proxy and must provide their CSDP or broker with their voting instructions, except for Group Five shareholders who have elected own-name registration in the sub-register through a CSDP or broker and certificated shareholders, which shareholders must complete this form of proxy and lodge it with the transfer secretaries. Holders of dematerialised Group Five shares wishing to attend the annual general meeting must inform their CSDP or broker of such intention and request their CSDP/broker to issue them with the relevant authorisation to attend.
I/We
of (address)
being the registered holder(s) of ordinary shares in the capital of the company, hereby appoint (see note 1):
1. or, failing him/her
2. or, failing him/her
3. or, failing him/her
the chairperson of the annual general meeting as my/our proxy to act for me/us at the annual general meeting for the purposes of considering and, if deemed fit, passing, with or without modification, the resolutions to be proposed thereat and at each adjournment thereof and to vote for and/or against the resolutions and/or abstain from voting in respect of the ordinary shares registered in my/our name(s) in accordance with the instructions/notes on the reverse side hereof.
Proposed ordinary/special resolutions In favour Against Abstain
Ordinary resolutions
1. Ordinary resolution number 1: Re-election of directors 1.1 Election of PM Mthethwa as a director 1.2 Election of NJ Chinyanta as a director 1.3 Election of SG Morris as a director
2. Ordinary resolution number 2: Election of group audit committee members 2.1 Election of SG Morris as member and chairperson of the group audit committee 2.2 Election of JL Job as member of the group audit committee 2.3 Election of KK Mpinga as member of the group audit committee 2.4 Election of B Ngonyama as member of the group audit committee 2.5 Election of VM Rague as member of the group audit committee 2.6 Election of MR Thompson as member of the group audit committee
3. Ordinary resolution number 3: Approval of remuneration policy, through a non-binding advisory vote
4. Ordinary resolution number 4: Re-appointment of auditors
5. Ordinary resolution number 5: Control of authorised but unissued shares
6. Ordinary resolution number 6: Authority to sign all documents required
Special resolutions
7. Special resolution number 1: Authorisation of non-executive directors’ remuneration
8. Special resolution number 2: General authority to repurchase shares
9. Special resolution number 3: General authority to provide financial assistance to related or inter-related companies
A member entitled to attend and vote at the annual general meeting may appoint one or more proxies to attend, vote, speak and act in his stead.
A proxy need not be a member of the company.
Signed at on 2015
Signature
assisted by me (where applicable)
(State capacity and full name) (see note 10). Please use block letters. Please read the notes on the reverse side hereof.
167
GR
OU
P F
IVE
Inte
grat
ed a
nnua
l rep
ort
2015
NOTES TO THE FORM OF PROXY
1. This form of proxy must only be used by certificated ordinary shareholders or dematerialised ordinary shareholders who hold dematerialised ordinary shares with “own-name” registrations.
2. Dematerialised ordinary shareholders are reminded that the onus is on them to communicate with their CSDP or broker.
3. A Group Five shareholder may insert the name of a proxy or the names of two alternative proxies of his/her choice in the spaces provided, with or without deleting “the chairperson of the general meeting”, but any such deletion must be initialled by the Group Five shareholder concerned.
4. If two or more proxies attend the meeting, then that person attending the meeting whose name appears first on the form of proxy, and whose name is not deleted, shall be regarded as the validly appointed proxy.
5. The authority of a person signing a form of proxy in a representative capacity must be attached to the form of proxy unless that authority has already been recorded by the company’s transfer secretaries or waived by the chairperson of the annual general meeting.
6. In order to be effective, forms of proxy must reach the registered office of the company or the company’s transfer secretaries at least 48 hours before the time appointed for holding the meeting (excluding Saturdays, Sundays and public holidays).
7. Any alteration or correction made to this form of proxy must be initialled by the signatory/(ies).
8. If this form of proxy is returned without any indication as to how the proxy should vote, the proxy will be entitled to vote or abstain from voting as he thinks fit.
9. The delivery of the duly completed form of proxy shall not preclude any member or his duly authorised representative from attending the meeting, speaking and voting instead of such duly appointed proxy.
10. A minor must be assisted by his/her parent or guardian unless the relevant documents establishing his/her legal capacity are produced or have been registered by the company.
11. Where there are joint holders of any shares: any one holder may sign this form of proxy; and the vote(s) of the senior shareholders (for that purpose seniority will be determined by the order in which the names
of shareholders appear in the company’s register of members) who tenders a vote (whether in person or by proxy) will be accepted to the exclusion of the vote(s) of the other joint shareholder(s).
Registered office Transfer secretaries
Group Five Limited Computershare InvestorNo 9 Country Estate Drive Services (Pty) LimitedWaterfall Business Estate 70 Marshall StreetJukskei View Johannesburg 2001Johannesburg 1662
Postnet Suite 500 PO Box 61051Private Bag X26 MarshalltownSunninghill 21072157
168


www.groupfive.co.za
Tel: +27 10 060 1555 | Fax: +27 86 206 3885 | [email protected]
No 9 Country Estate Drive
Waterfall Business Estate
Jukskei View
Johannesburg 1662
Postnet Suite 500
Private Bag X26
Sunninghill 2157
South Africa
A