the Flyover Phenomenon - Environmental Justice Atlas · Understanding the Flyover Phenomenon ......
15
Phenomenon the Flyover Understanding
Transcript of the Flyover Phenomenon - Environmental Justice Atlas · Understanding the Flyover Phenomenon ......
Phenomenon
the Flyover
Understanding

Supported by:Global Greengrants Fund
June 2016
Understanding the Flyover Phenomenon
ParisarSanrakshan Sanvardhan Sanstha
Yamuna, I.C.S. Colony, Ganeshkhind Road, Pune 411 007India
www.parisar.org
Lead contributor: Shweta Vernekar Navlakha
Acknowledgements:The cost benefit analysis has been done by Kuljeetsingh Nimbalkar for Parisar
Cover photos of flyover by Kuljeetsingh Nimbalkar
Other photos in the report by Varun Humnabadkar
©Parisar2016

Phenomenon
the Flyover
Understanding

Contents
Foreword 4
Introduction 5
The story of Pune 6
Survey analysis and outcomes 10
Cost benefit analysis of flyover at 16 Cummins College Junction
Perceptions from stakeholder 19 interviews
The road ahead 20

4 5
IntroductionFOREWORD
While traffic in the city goes from bad to worse, the proposed solutions also follow the same trend. Instead of moving towards sustainable transportation, the city is going deeper into a motor vehicle centric planning of traffic. According to a study conducted in 2008, the share of personalised vehicles, especially two wheelers had increased by 12% in the two preceding decades. Public transportation services had at the same time deteriorated and congestion increased1. The study highlights that public transport services have declined over time, and that many cities do not even have what one could call a basic public transport system at all. It is projected that the share of private vehicles will consistently increase over the years, while non-motorised transport and public transport trips will reduce. The fear that deterioration of Public Transport will lead to a spurt in usage of personal vehicles is coming true.
The concept of a flyover is becoming a major hurdle in the path of sustainable transportation vision in Indian cities. More and more cities are getting obsessed by the idea of building flyovers for solving the traffic congestion. Huge amount of public money is being wasted in these projects, for which there are no traffic studies, no impact assessments and basically no clarity of purpose. One can get away with a flyover, by the mere suggestion that it will solve traffic snarls. This is despite the fact that there is now growing evidence of flyovers being failed solutions. They not only fail to solve congestion but in fact make it worse. While policy at the national level, such as the National Urban Transport Policy and City Mobility Plans2make it clear that flyovers are at best a temporary short term solution and need to be taken up only if other options are first considered and tried out, they continue to be popular with most city administrations.
While cities abroad are demolishing these massive and expensive structures3, Indian cities are keen to make them anew. There is a need to understand the popularity of this phenomenon, in order to device a rational way of dealing with and countering it with sustainable alternatives.
This report, based in Pune city, shall seek to understand the reasons behind this popularity among corporation officials, political party members, bureaucracy and common people.
Cities are reinventing themselves into becoming more people friendly and sustainable today. It is being realised that the way our cities have grown in the past may not be the best way, and it would be impossible to sustain in this way.
Transportation is a very important element defining whether cities are livable, sustainable, economically vibrant and smart. The conventional thinking of supply oriented transport planning in cities is failing to provide any relief from traffic congestion and pollution inspite of the huge expenditure on motor vehicle centric infrastructure development. Flyovers form a huge chunk of such investments. This has only led to an exponential increase in the number of vehicles. This year Pune has made a decision to focus on sustainable transport solutions, reducing drastically the allocation of budget for any new flyovers. This decision has been taken consciously, breaking away from previous trends where new flyovers were planned sporadically, sometimes without being part of the Comprehensive Mobility Plan of the city.
Pune has also started towards becoming a Smart City, which means we are dedicated to making the city people-friendly with safe, convenient and affordable public transportation, walking and cycling facilities and prioritising people over vehicles.
Despite the National Urban Transport Policy which clearly lays out the vision for sustainable transport there is a need to create awareness about these concepts amongst policy and decision makers as well as the public at large. This report, which documents what different stakeholders think about flyovers, will help us develop the right Information Education and Communication (IEC) strategy to bring about this mindset change.
Kunal KumarMunicipal Commissioner,Pune Municipal Corporation.June 2016
1 Study on Traffic and Transportation Policies and Strategies in Urban Areas in India, MoUD and Wilbur Smith Associates, 2008
2 City Mobility Plan (CMP) for Pune
3 “Flyovers torn down world over”, Hindustan Times, May 2013 http://www.hindustantimes.com/newdelhi/flyovers-torn-down-world-over/article1-1055952.aspx “Flyovers are flawed design” https://savethebasin.files.wordpress.com/2013/04/basin_flyover_design_backgrounder.pdf
6 7
The story of Pune
4 “Can Pune get back on the track”, The Hindu, December 2012 http://www.thehindu.com/news/national/can-pune-get-back-on-track/article4179089.ece
5 Draft Development Plan, 1982
6 Final Detailed Project Report for Pune Metro Rail Project, Page 26/54 http://www.punecorporation.org/informpdf/Metro/DPR_Metro_Aug_2014.pdf
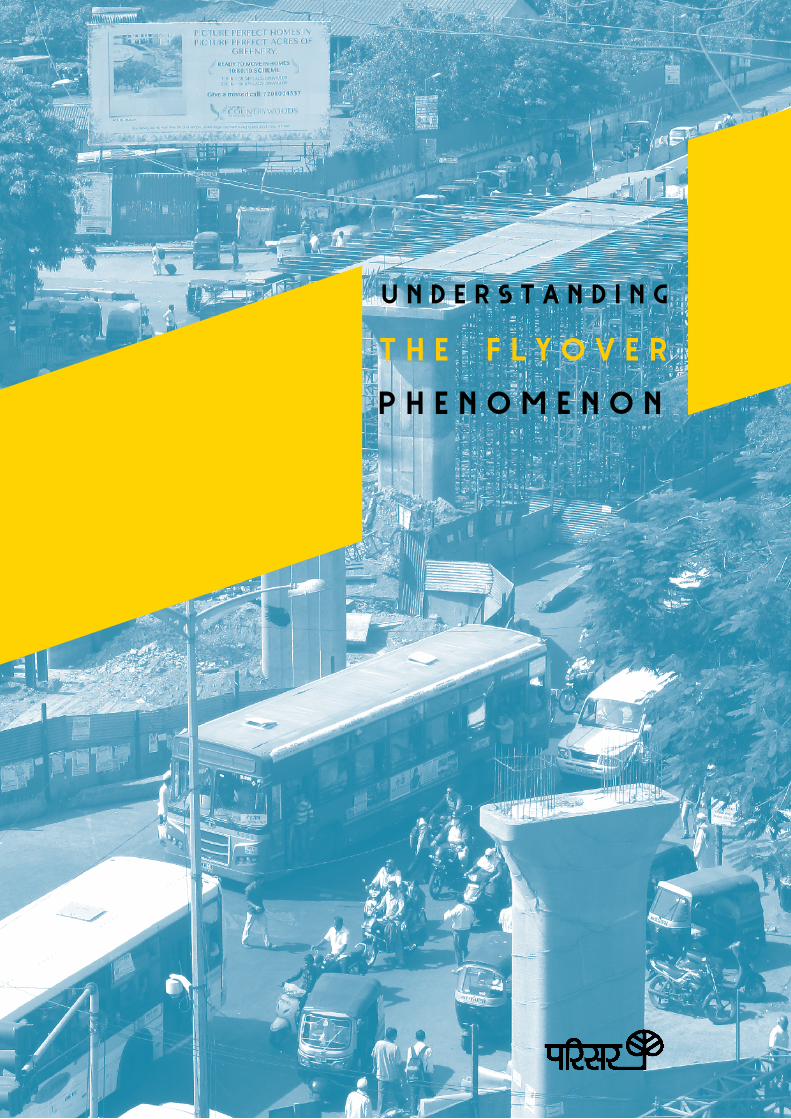
Pune was once known as the cycle city of Maharashtra. The situation has changed dramatically, owing to the dominance of motorised two wheelers today, augmented by the car centric development of the city4.
The transition of the city into one that is dominated by private vehicles is interesting, considering that in 1971, every household had an ownership of more than one cycle and the cycles available on hire was 6 times the total number of owned cycles in the city5. The policies and projects of the municipal authorities must have played a role in bringing about the skewed pattern of high rate of privatised, motorised vehicles from a cycling friendly city in the earlier decades. The vehicular ownership increased threefold from 1971 to 1980. Even so, the modal split of 1981 shows a significant portion of the people still using non-motorized transport, specifically, 31% walked and 32% used bicycles. The share of road based mass transportation was 12% and 1% by the rail.
Even in 2006, with the alarming number of private vehicles, the majority of citizens relied on non-motorised transport and public transport. While the preferred mode of travel (motorised) in Pune is two-wheelers, the predominant numbers of trips undertaken in the city are still pedestrian in nature followed by cycling and bus drives. 25% of the trips generated in the city are on foot, 18% by cycle and a significant 12.5% by bus6. Public
Population growth 2001-2011
6
popu
latio
n
grow
th ra
te
pune pimpri-chichwad
mill
ions
80
70
60
50
40
30
20
10
0
5
4
3
2
1
0pune UA
population-2001 population-2011 growth rate (decadal)
22.7
70.8
34.3
transport in Pune is mainly carried by Pune Mahanagar Parivahan MahamandalLtd (PMPML), as also by other means like auto rickshaws and para transit.
The lack of public transport system also encourages people to take to private modes such as cars and two wheelers. The city, in 2016, registered 2,24,341 new vehicles out of which 1,61,386 were two wheelers - accounting for about 72% share7. The growth of vehicles over the years is shown in the following graphs;
Growth of cars and two wheelers in pune
1800000
1600000
1400000
1200000
1000000
800000
600000
400000
200000
02000 2001 2002 2003 2004 2005 2006 2007 2008 2009 2010 2011
2-wheelers cars
7 Comprehensive Mobility Plan Pune, Page 4-25
The growth of private vehicles, especially two wheelers has increased steadily over the years. This high growth of private vehicles has given rise to a number of problems in the city such as congestion, accidents and pollution.
Growth rate of vehicles
2.0
0.0
2000 2001 2002 2003 2004 2005 2006 2007 2008 2009 2010 2011
6.0
4.0
10.0
8.0
14.0
12.0
16.0
20.0
18.0
2-wheelers cars
8 9
It is also interesting to note that though the number of two wheelers is much higher than cars, the annual growth rate of cars is more than that of two wheelers. This is signalling to a society which is increasingly being able to afford cars, coupled with the perception of cars being a symbol of economic well-being and social status. This kind of growth, without any kind of policy intervention in road space utilisation, is going to further complicate the problem of congestion.
What this growth has done to the pattern of policy making and project implementation is to create a supply oriented transportation model, one which lays undue emphasis on providing for more roads, more parking, unrestricted flow of these vehicles by introducing grade separations for pedestrians and so on. Transport has come to be equated to more road space and more road length rather than traffic management mechanisms. This thinking is the major factor shaping traffic policies in the city today. This is more than evident in the allocation of funds in the transportation budget of 2011-12, wherein, more than 61% of the funds are dedicated for motor vehicle friendly measures such as increasing road space and road repairs only.
Pune got its first flyover - Swatantryaveer V D Sawarkar Flyover in 1998, at Paud Phata.
The University flyover was inaugurated on July 14, 2007. The construction of this Rs. 21 crore, 792-mt flyover began in 2004. It has 2 lanes in each of the three legs and the one-way traffic moves towards Baner, Aundh and Pashan.
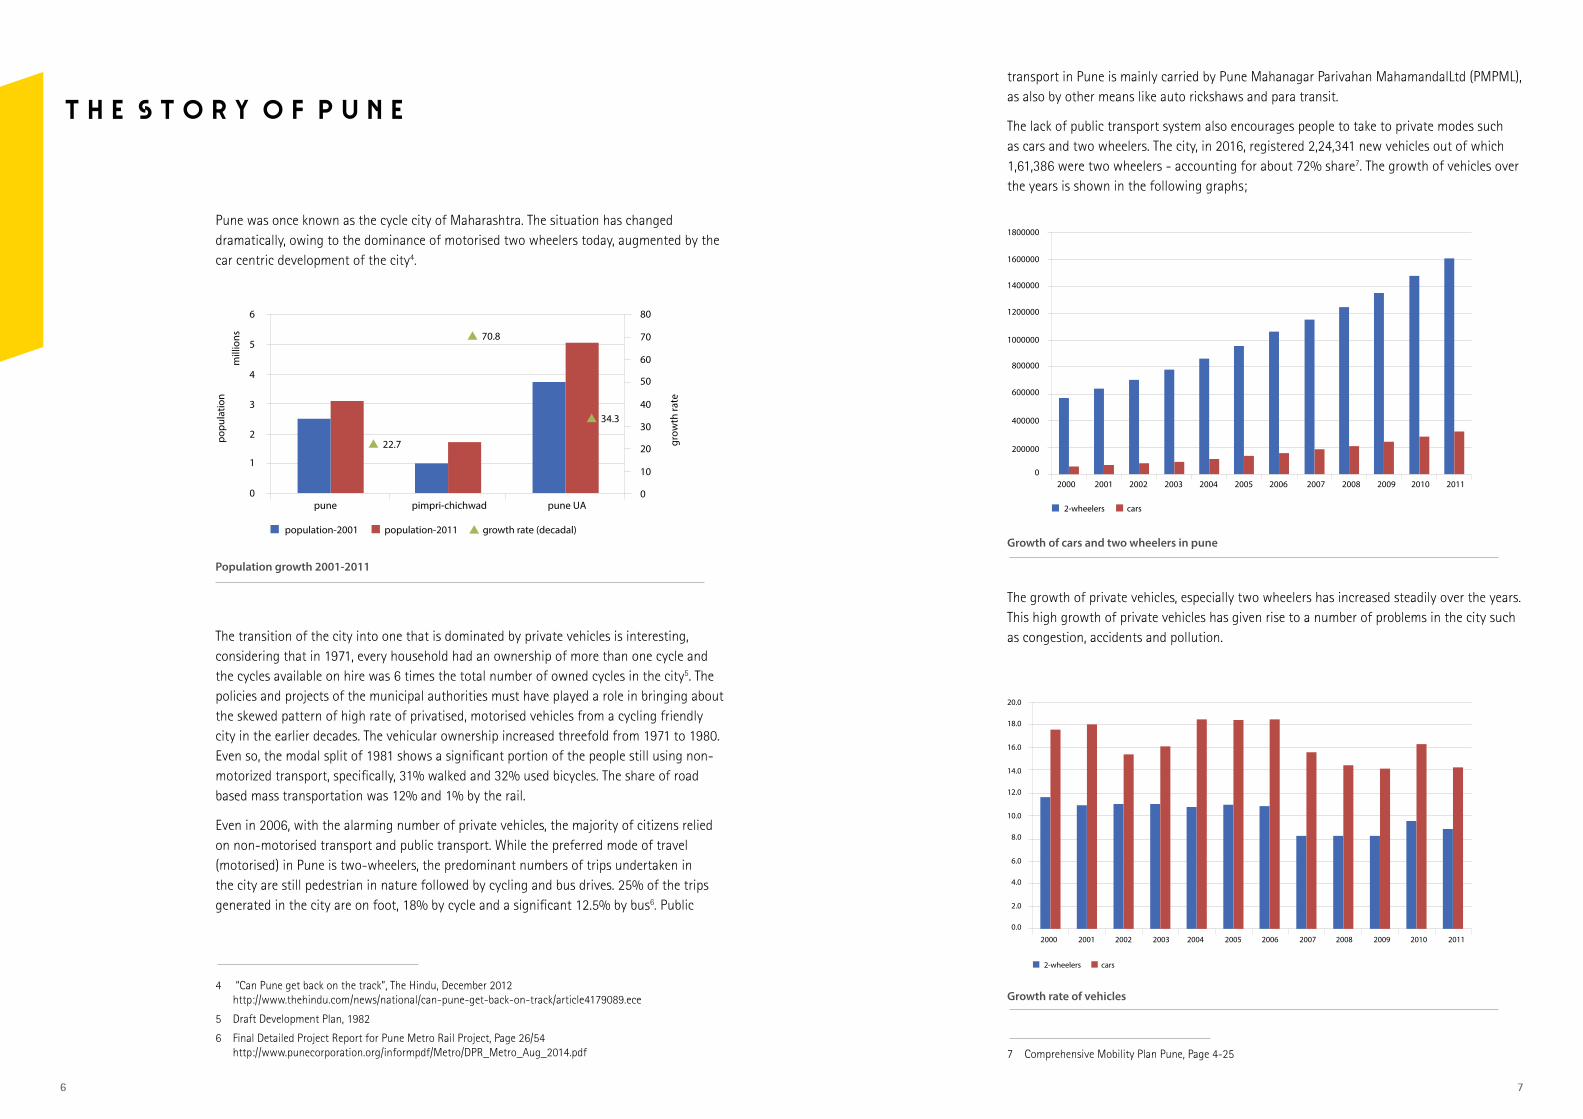
Various proposals for flyovers in Pune are found in the CMP, as shown in the map below.
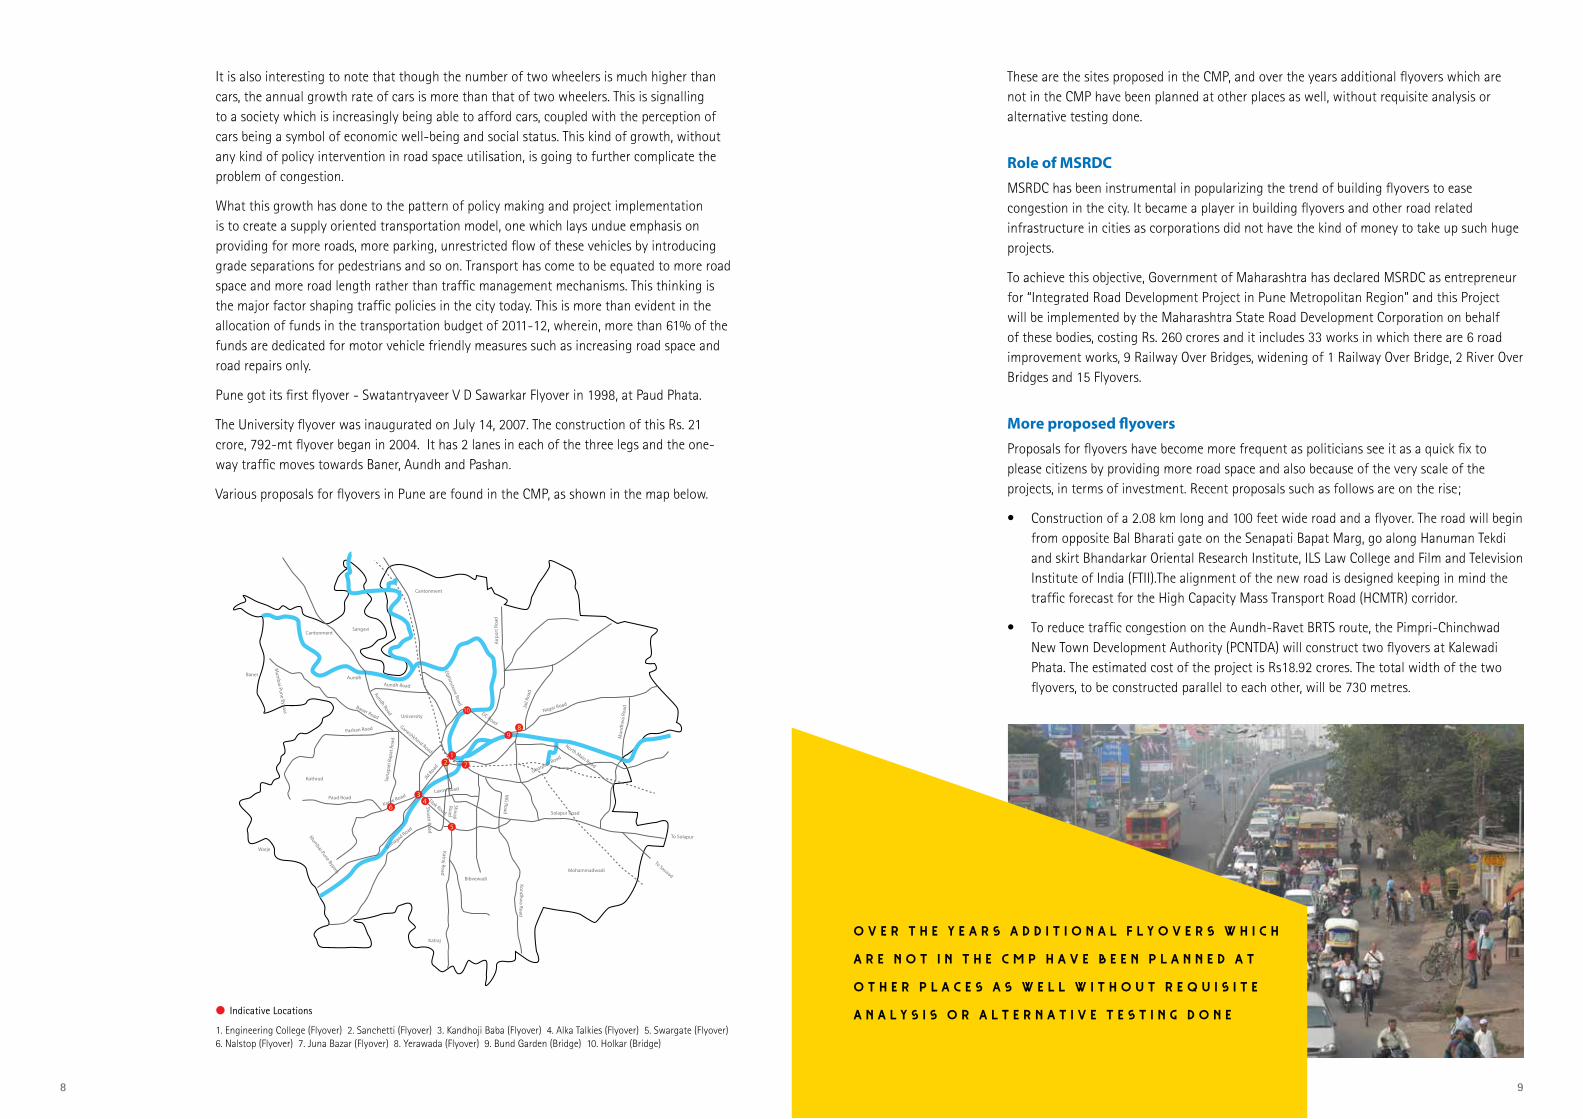
These are the sites proposed in the CMP, and over the years additional flyovers which are not in the CMP have been planned at other places as well, without requisite analysis or alternative testing done.
Role of MSRDC
MSRDC has been instrumental in popularizing the trend of building flyovers to ease congestion in the city. It became a player in building flyovers and other road related infrastructure in cities as corporations did not have the kind of money to take up such huge projects.
To achieve this objective, Government of Maharashtra has declared MSRDC as entrepreneur for “Integrated Road Development Project in Pune Metropolitan Region” and this Project will be implemented by the Maharashtra State Road Development Corporation on behalf of these bodies, costing Rs. 260 crores and it includes 33 works in which there are 6 road improvement works, 9 Railway Over Bridges, widening of 1 Railway Over Bridge, 2 River Over Bridges and 15 Flyovers.
More proposed flyovers
Proposals for flyovers have become more frequent as politicians see it as a quick fix to please citizens by providing more road space and also because of the very scale of the projects, in terms of investment. Recent proposals such as follows are on the rise;
• Construction of a 2.08 km long and 100 feet wide road and a flyover. The road will begin from opposite Bal Bharati gate on the Senapati Bapat Marg, go along Hanuman Tekdi and skirt Bhandarkar Oriental Research Institute, ILS Law College and Film and Television Institute of India (FTII).The alignment of the new road is designed keeping in mind the traffic forecast for the High Capacity Mass Transport Road (HCMTR) corridor.
• To reduce traffic congestion on the Aundh-Ravet BRTS route, the Pimpri-Chinchwad New Town Development Authority (PCNTDA) will construct two flyovers at Kalewadi Phata. The estimated cost of the project is Rs18.92 crores. The total width of the two flyovers, to be constructed parallel to each other, will be 730 metres.
Paud Road
Solapur Road
To Saswad
To SolapurMum
bai-Pune Bypass
Mum
bai-Pune Bypass Nagar RoadJail
Road
Mun
dhw
a Ro
ad
Airp
ort R
oad
Ghorpadi Road
North Main Road
Karve Road
JM Road
DC Road
Laxmi Road
Tilak Road
Shastri Road
MG
Road
Katraj Road
Shivaji Road
Kondhwa Road
Sena
pati
Bapa
t Roa
d
Kothrud
Baner Aundh
Sangavi
University
Warje
Katraj
Mohammadwadi
Bibvewadi
Cantonment
Cantonment
Pashan Road
Baner Road
Aundh Road
Aundh Road
Ganeshkhind Road
Elphinstone Road
Sinhagad Road
12
3
6
7
98
10
4
5
Over the years additional flyovers which
are not in the CMP have been planned at
other places as well without requisite
analysis or alternative testing done1. Engineering College (Flyover) 2. Sanchetti (Flyover) 3. Kandhoji Baba (Flyover) 4. Alka Talkies (Flyover) 5. Swargate (Flyover)6. Nalstop (Flyover) 7. Juna Bazar (Flyover) 8. Yerawada (Flyover) 9. Bund Garden (Bridge) 10. Holkar (Bridge)
Indicative Locations

10 11
Sample Details
The data was collected through the medium of a designed questionnaire, conducted in different areas of Pune.
Survey analysis and outcomes
12% 41-50 years
6% 51-60 years
22% 31-40 years
18% 11-20 years
41% 21-30 years
1% above 60 years
Age profile of sample
Modal share of the sample compared to actual modal share given in the Detailed Project Report of Pune Metro in 20148:
8 http://www.punecorporation.org/informpdf/Metro/DPR_Metro_Aug_2014.pdf
The sample size consisted of 641 individuals, and an attempt was made to cover different modes of transport used by people in reality to give a balanced base for the analysis. For the same, the sample has been compared to the actual modal share of the city, and though it does not match the actual modal share perfectly, effort was made to represent all modes fairly.
The following questions were designed to understand whether different perceptions about traffic have any correlation with the way they perceive flyovers.
11% walking
42% two wheeler
4% two wheeler/car
9% car
5% cycle
26% public transport
3% auto
Modal share given in the Detailed Project Report of Pune Metro in 2014
Modal share of the sample
38%
8%
8%
12%
24%
10%
PUNE
37.8L

12 13
Perception about traffic in Pune
Since flyovers are a direct result of ‘worsening’ traffic situation9, we first tried to gauge how bad the traffic situation is in Pune according to people.
250
200
150
100
50
8
71
218 221
123
0very good good ok bad worst
Perception of the traffic situation in pune
9 “Pune-Satara road flyover work begins”, Times of India, April 2012http://timesofindia.indiatimes.com/city/pune/Pune-Satara-road-flyover-work-begins/articleshow/12860978.cms“Green fetish holds up plans to clear Delhi’s worst traffic mess”, Times of India, April 2015http://timesofindia.indiatimes.com/city/delhi/Green-fetish-holds-up-plans-to-clear-Delhis-worst-traffic-mess/articleshow/47006917.cms
10 http://indianexpress.com/article/cities/pune/30-per-cent-vehicle-growth-in-3-yrs-but-no-infrastructure-to-match/
While a majority of the people thought the traffic situation in Pune was bad, a very close number thought that the situation was okay. It is surprising to note that an almost equal number of people think the traffic in Pune is manageable, in the light of the fact that media reports might show otherwise10.
12% pollution
1% other
13% discipline
19% safety
55% congestion
Most pressing traffic issues as perceived by the people
Reports of worsening traffic, increasing number of vehicles and the gap between the number and infrastructure keep reappearing in media throughout the year. These reports impress upon people the need for more roads, rather than looking into the root of the problem which is the increasing number of personal auto vehicles coming on the roads.
When asked what the issues were, congestion figured as the top priority, followed by safety and discipline. These provide important pointers as to whether proposed solutions like flyovers and road widening, really make the situation better or not. For example, cost benefit analyses show that flyovers do not really help solve the problem of congestion in the long run and have no significant impact on discipline or pollution.
About half of the people surveyed felt that flyovers do solve congestion sometimes. Discussions and stakeholder meetings revealed that people felt that flyovers if built with proper planning and design would ease traffic congestion. It would also be important to mention here that Pune has experienced the hazards of poorly designed and planned flyovers in the past. This however has not created an aversion to the concept of flyovers itself.
28% yes
24% no
48% sometimes
Do flyovers solve traffic congestion?
25% everyone
Who benefits from flyovers?
1% none
3% pedestrians
1% cyclists
70% motorised vehicles

14 15
A clear majority of people thought that only motorised vehicles benefitted from the construction of flyovers. 25% felt that it benefitted everyone. While people largely accepted the motor vehicle centric nature of flyovers, whether an immediate correlation was made between the costs and benefits of flyovers and the larger question of equity is doubtful.
This led us to the question of whether people knew how much of their tax money was being spent on these structures. Majority of the people had no idea of how much money goes into building the flyovers.
85% no
Do people know how much money is spent on flyovers?
15% yes
When the people who said yes were asked whether the expenditure was justified, 61% said it wasn’t. On the other hand, when those who confessed to not knowing how much money was spent on a flyover, 67% people said it was justified. The lack of knowledge of money spent versus benefit gained might be an important factor in the popularity of flyovers.
Whether flyovers are beneficial or not may be a doubtful question, they definitely are responsible for very visible changes in the city’s skyline. We tried to gauge whether this fact in any way tugs at people’s perception of development.
32% no
Do flyovers signify development?
68% yes
68% people felt that flyovers signify development of the city. This is unsettling because it seems like development has been equated with infrastructure and motorisation rather than with liveability of the city and equity for people. It has again highlighted the longstanding issue of what we should mean by ‘development’.
69% of people who felt that flyovers signify development had never heard of foreign countries taking a u-turn on flyover building. 44% of people who felt that flyovers did not signify development had never heard of foreign countries demolishing flyovers either. We may not be able to clearly conclude whether knowledge of so called developed nations practicing sustainable transport really affects peoples’ perception.
59% no
Does inclusion of flyovers in the political agenda affect their perception of the party/representative positively
41% yes
41% viewed those political parties/ representatives positively who initiate flyover projects. It can be safely said that nearly all the corporators and political parties existing today are pro flyovers.
66% of the people who perceive a pro-flyover political representative positively also think that it is a sign of development. Interestingly 48% of people who do not relate political agenda and flyovers, also think that it is a sign of development. The positive perception of flyovers prevails irrespective of whether it is associated with political agenda or not. What it may mean, is that inclusion of flyovers may not be the sole criteria for judging political representation and performance.
16 17
For projects like flyovers, which involve huge amounts of public money and considerable time and inconvenience for citizens while construction, a cost benefit analysis is a must. The Pune Municipal Corporation is supposed to submit such an analysis before execution of projects. It is difficult to understand how a project can be built knowing that its efficacy will end in a couple of years, while the problem of congestion remains unsolved. To understand this decision making process, a cost benefit analysis of a flyover in Pune was undertaken for examination. There are two parts of it, namely – the evaluation of the analysis done and submitted by PMC and secondly an independent, objective analysis done by our team.
Basically such an analysis looks mainly at how long will the flyover function without congestion. As congestion sets in, the so called benefit of a flyover essentially becomes zero. There are various parameters to judging the cost benefit such as time savings because of no congestion, pollution, environmental impacts and so on.
Critique of Cost Benefit Analysis done by Pune Municipal Corporation (PMC)
A detailed look into the analysis done by PMC revealed that there were various discrepancies and problems in their methodology. Important primary data such as vehicle growth rates, differential growth rates depending on type of vehicles, irregular inclusion of maintenance costs of the flyover and so on have been processed/ handled incorrectly in the analysis thereby questioning the outcome itself. Moreover, this analysis and its methodology is nowhere explained and is very difficult to make sense of, especially for a common man.
According to this analysis the flyover would not be congested for 20 years, whereas in their own document elsewhere they have shown that the volume/ capacity ratio of the flyover would cross 1 (which is the threshold for congestion) in about 10 years itself. However, after actually correcting all formulae and data in the sheets it was found that congestion would set in by the fourth or fifth year itself.
These kinds of hugely varying results are alarming. This either indicates deliberate manipulation of figures or a serious lack of expertise in research and planning, both of which need to be addressed.
Cost benefit analysis of Karve Road Flyover done by Parisar
Parisar conducted an in depth cost benefit analysis of the flyover trying to cover as many aspects as possible to work out an objective estimate of the efficacy of the flyover. The flyover with a construction cost of INR 45 crores, and which was completed in a span of two years in 2014 was used to develop a parametric model using different parameters such as differential growth rates of vehicles, vehicle operation costs, pollution, time saving and so on to present a holistic picture.
Cost Benefit Analysis of flyover at Cummins College Junction
Congestion
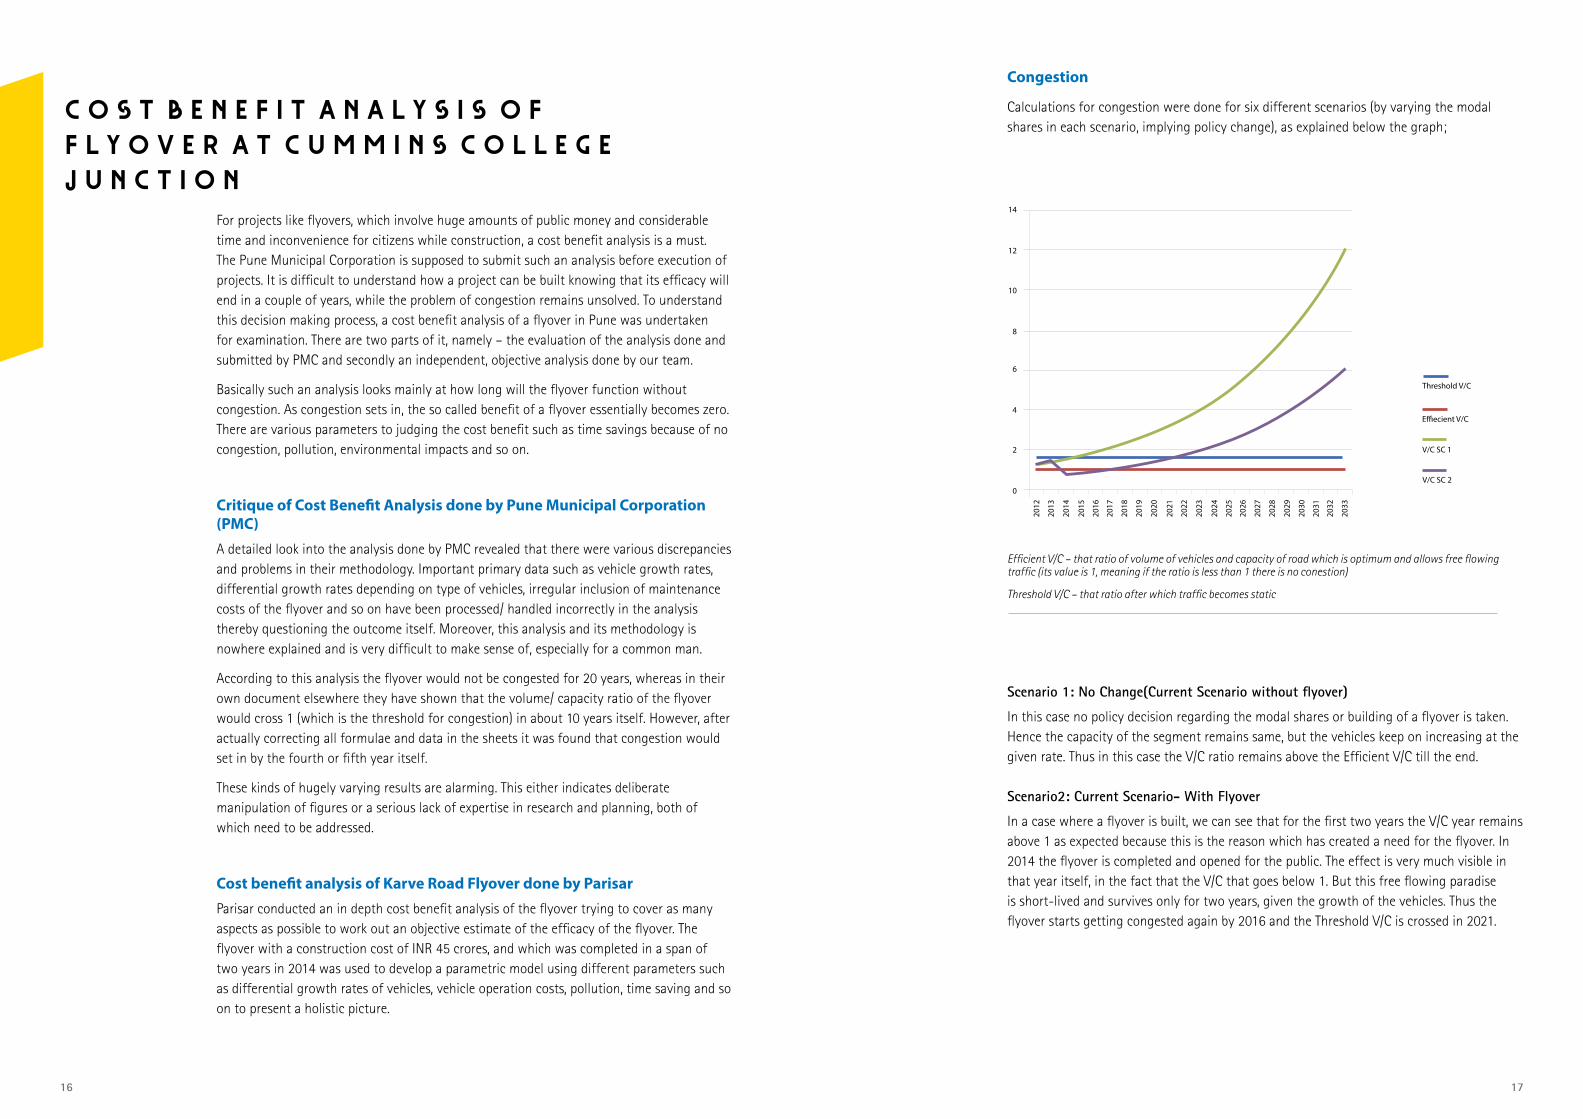
Calculations for congestion were done for six different scenarios (by varying the modal shares in each scenario, implying policy change), as explained below the graph;
V/C SC 2
V/C SC 1
E�ecient V/C
Threshold V/C
14
12
10
8
6
4
2
0
2012
2013
2014
2015
2016
2017
2018
2019
2020
2021
2022
2023
2024
2025
2026
2027
2028
2029
2030
2031
2032
2033
Scenario 1: No Change(Current Scenario without flyover)
In this case no policy decision regarding the modal shares or building of a flyover is taken. Hence the capacity of the segment remains same, but the vehicles keep on increasing at the given rate. Thus in this case the V/C ratio remains above the Efficient V/C till the end.
Scenario2: Current Scenario- With Flyover
In a case where a flyover is built, we can see that for the first two years the V/C year remains above 1 as expected because this is the reason which has created a need for the flyover. In 2014 the flyover is completed and opened for the public. The effect is very much visible in that year itself, in the fact that the V/C that goes below 1. But this free flowing paradise is short-lived and survives only for two years, given the growth of the vehicles. Thus the flyover starts getting congested again by 2016 and the Threshold V/C is crossed in 2021.
Efficient V/C – that ratio of volume of vehicles and capacity of road which is optimum and allows free flowing traffic (its value is 1, meaning if the ratio is less than 1 there is no conestion)
Threshold V/C – that ratio after which traffic becomes static

18 19
Pollution
Total Carbon Emission (CS with FL)
Total Carbon Emission (CS w/o FL)
35000
30000
25000
20000
15000
10000
5000
0
2012
2014
2016
2018
2020
2022
2024
2026
2028
2030
2032
As is the case with congestion, similar was found to be true with carbon emissions. As seen in the graph, there is a small window of drop in pollution for about two years with constant increase later, in the same trajectory as a no flyover scenario would have created. This only indicates that while flyovers may seem to temporarily reduce congestion and pollution, long term solutions should be concentrated on increasing public transport and non-motorised transport share in the total modal trips of the city over the years. This would require a planned, long term vision to enable the shift from two wheelers and cars to public transport and not sporadic infrastructures.
The fact that congestion sets in within two years of flyover construction should in itself be a pointer about the inefficacy of flyovers in solving congestion. For short term gains as are evident in these graphs, the amount of money spent cannot be justified. Above the monetary aspect, is the policy perspective which needs to be developed. A perspective of sustainable transportation which goes beyond mere demand oriented actions and focuses more on what kind of city the citizens want.
Stakeholder discussions were conducted with politicians, journalists and municipal officials and groups discussions with a resident group and cycle rickshaw union members. Following were the important insights from these interactions;
1. A very common perception of all the stakeholders was that of indiscipline. This is interesting because the existence of a flyover has no significant impact on discipline as such.
2. There was agreement among all stakeholders that the municipal corporation which is the planning and executing agency in the city lacks the planning and research capacity to handle the long term transport issues of the city.
3. The drivers of decisions to make flyovers were mostly found out to be traffic congestion at a particular spot and public demand for the same. However political factors were also said to be at play for a particular project to materialise or not.
4. There was a perception that flyover do solve traffic congestion. When counter-questioned on why they hadn’t worked so far, the patent reply was that they were built with the wrong designs or at wrong locations, indicating a need for better research. One of the politicians felt it was a matter of scale, and the main reason flyovers didn’t work was because they were built on a small scale, and the city should probably have a proper network of wide roads and flyovers in place to overcome congestion
5. Most stakeholders were unable to make the connection between increasing private vehicles and decreasing public transport usage. This led to them vouching for public transport improvement, while at the same demanding more roads, wider roads and flyovers.
6. The responses on whether private vehicles should be controlled was mixed. While one group strongly felt they should be, others did not. The rickshaw driver union group felt the need to control vehicles on road to control congestion. Other stakeholders felt that this could not or need not be done since personal vehicle is now a necessity in the city.
7. An interview with a journalist revealed that there was very little understanding about sustainable transportation amongst journalists. Over and above this is the fact that seldom is an objective view presented by the media. Media coverage is more often than not affected by the newspaper’s political affiliation, the editors’ understanding of the subject and the need to make sweeping statements instead of empirically inquiring about the issues at hand.
8. Very few of the stakeholders knew about the fact that flyovers were being demolished in foreign cities, and those who knew were reluctant to agree it had anything to do with its efficacy.
Perceptions from stakeholder interviews

20
This study has helped bring to light not only the monetary aspects of flyovers but also perceptions about flyovers. There were interesting insights through public surveys pointing to the fact that people do not necessarily believe that flyovers help them view politicians in positive light. It signifies some scope of work which needs to be done in bringing about more awareness about how flyovers are dead ends, and about sustainable transportation in general. There seems to be a huge need to sensitise media and politicians about sustainable transportation. It is imperative for these agents to understand and make connections between transport and different related field like land use, livelihood, poverty, economics and so on. This can be done by consistent, systematic learning processes and their involvement in it.
More awareness is needed among people who can take concerted action whenever such projects are announced, at least to understand whether prerequisite like cost benefit analysis and other data collection and analysis has been done and the quality of work. The fact that flyovers don’t solve the congestion issue inspite of spending huge amounts has to hit the public for them to take up resistance to such projects. The consequent question on what then can be done to solve urban transportation woes brings back the focus on sustainable transport rather than the vehicle centric, supply oriented model of transportation currently existing.
The road ahead


Des
ign+
Prin
t: M
udra
, ww
w.m
udra
web
.com