The Federal Reserve as Global Lender of Last Resort,...
41
The Federal Reserve as Global Lender of Last Resort, 2007-2010 J. Lawrence Broz Department of Political Science University of California, San Diego 9500 Gilman Dr., 0521 La Jolla, CA 92093-0521 tel. 858-822-5750 email: [email protected] This paper was prepared for delivery at 2012 Annual Meeting of the American Political Science Association, August 30-September 2, 2012. © Copyright by the American Political Science Association. I thank Stephen Weymouth for comments and Maya Oren for excellent research assistance.
Transcript of The Federal Reserve as Global Lender of Last Resort,...

The Federal Reserve as Global Lender of Last Resort, 2007-2010
J. Lawrence Broz Department of Political Science
University of California, San Diego 9500 Gilman Dr., 0521
La Jolla, CA 92093-0521 tel. 858-822-5750
email: [email protected]
This paper was prepared for delivery at 2012 Annual Meeting of the American Political Science Association, August 30-September 2, 2012. © Copyright by the American Political Science Association. I thank Stephen Weymouth for comments and Maya Oren for excellent research assistance.

1
TITLE: “The Federal Reserve as Global Lender of Last Resort, 2007-2010.” ABSTRACT: Passage of the Dodd-Frank financial reform bill, in conjunction with a Supreme Court ruling supporting a Freedom of Information Act request, forced the Federal Reserve (Fed) to disclose private information about its emergency lending during the financial crisis. The disclosures revealed the extent to which the Fed served as a global lender of last resort, providing dollar liquidity to foreign banks that were having difficulty funding their dollar-denominated assets. I exploit the exogenous nature of these disclosures on two levels. First, I use the disclosed information to evaluate the Fed's global lending during the crisis. My findings indicate that the Fed supported foreign banks in countries in which U.S. money-center banks had high loan exposures, which suggests that the Fed served the interests of global U.S. banks. Second, I explore the congressional response to revelations of the Fed's massive global lending. I analyze a House vote on "Audit the Fed" legislation that would end the Fed's confidentiality about the banks and countries it supports and potentially reduce its monetary policy independence. I find the influence of global banks extends to Congress by way of campaign contributions: contributions from global banks significantly reduce the likelihood that a representative will vote in favor of the bill. In addition, I find that right-wing representatives are substantially more likely than their left-wing peers to support the bill, which suggests that new congressional coalitions are forming on the role of the Fed in the (global) economy.

2
1. Introduction On December 1, 2010, the Federal Reserve (Fed) released previously confidential information
about its special emergency programs during the financial crisis, as required by the Dodd-Frank
Wall Street Reform and Consumer Protection Act. The Fed’s disclosures included the names of
the financial institutions and foreign central banks that received financial assistance from the Fed
during the crisis, the amounts borrowed, the dates credits were extended, the interest rates
charged, information about collateral, and a description and rationale of the credit terms under
each Federal Reserve emergency facility.1 While the Dodd-Frank law did not require the release
of these details for lending through the Fed’s regular “discount window” during the crisis, the
Fed was forced to disclose this information by court order on March 31, 2011, after running out
of legal appeals to block publication.2
These disclosures revealed the extent to which the Fed had served as a global lender of
last resort during the crisis, providing dollar liquidity to foreign banks with significant dollar-
denominated loans and securities. On the day the Fed published the first installment of this
detailed information on its Web site, news organizations from around the world touted the
unexpectedly large participation of foreign banks in the various Fed programs. The Financial
Times headlined the story with “European Banks Took Big Slice of Fed Aid” and stated that
“foreign banks were among the biggest beneficiaries of the $3,300bn in emergency credit
provided by the Federal Reserve during the crisis…a revelation…that underlines the global
1 The Fed’s crisis transactions data are available at http://www.federalreserve.gov/newsevents/reform_transaction.htm Bloomberg News provided spreadsheets aggregating the Fed’s seven broad-based facilities, including the discount window at http://bit.ly/Bloomberg-Fed-Data 2 Going forward, the Dodd-Frank law stipulates that the Fed must release data on future discount-window loans after a two-year lag.

3
nature of the turmoil and the crucial role of the Fed as the lender of last resort for the world’s
banking sector” (Hardin et al. 2010). The New York Times highlighted the global nature of the
Fed’s crisis lending and quoted the response of Senator Bernie Sanders, author of the Dodd-
Frank provision requiring the disclosures. According to Sanders, “After years of stonewalling by
the Fed, the American people are finally learning the incredible and jaw-dropping details of the
Fed’s multitrillion-dollar bailout of Wall Street and corporate America. Perhaps most surprising
is the huge sum that went to bail out foreign private banks and corporations including two
European megabanks--Deutsche Bank and Credit Suisse--which were the largest beneficiaries of
the Fed's purchase of mortgage-backed securities” (Sewall and McGinty 2010).3
The Fed’s disclosures were exogenous in the sense that Federal Reserve officials could
not have known they would be required to reveal the transaction-specific details of their lending
at the time they were making their emergency lending decisions. The Fed’s emergency program
lending peaked at more than $1 trillion in late-2008, months before the initial version of the
Dodd-Frank bill was introduced into Congress in June 2009, and over a year before Sanders’
disclosure requirements were added to the bill.
Three months
later, when the Fed released the transaction-level details of its discount window lending,
Bloomberg News headlined “Foreign Banks Tapped Fed’s Secret Lifeline Most at Crisis Peak.”
Bloomberg reported that foreign banks accounted for “at least 70 percent of the $110.7 billion
borrowed” at the discount window at the peak of the crisis in October 2008 (Keoun and Torres
2011).
4
3 The article quotes Sanders from his public statement, which is available at
Likewise, lending through the Fed’s permanent
http://www.sanders.senate.gov/newsroom/news/?id=f75fee31-aeba-4a13-b6a7-05adf56ccfe8 4 Sanders’ disclosure amendment (S.AMDT.3738) was proposed on May 6, 2010 and approved by a vote of 98-0 on May 11, 2010.
4
discount window peaked in late-2008, and since the Fed had never previously revealed the
identities and transaction details of discount window borrowers, it could not have foreseen the
March 2011 United States Supreme Court ruling that required it to release these data.5
I exploit data from the disclosures for two purposes. First, I use the disclosed
information to evaluate the Federal Reserve’s global operations during the crisis. Aggregating
the transaction-level data up to the country level, I explore the covariates of Federal Reserve
lending to commercial banks and corporations in foreign countries during the 2007-2010
financial crisis. I create two measures of the Fed’s “foreign lending” during the crisis. The first
measure is a country’s share of the Fed’s total foreign lending from all sources (six emergency
facilities plus the discount window). The second measure is an indicator variable equal to 1 if the
Federal Reserve selected a foreign central bank for a dollar swap line arrangement during the
crisis. Regardless of the measure, I find that the best predictor of the Fed’s foreign lending is the
exposure of large U.S. money-center banks to a foreign market (where “exposure” is measured
as the share of the individual foreign market in the total consolidated foreign claims of U.S.
banks). This suggests that the Federal Reserve served as lender of last resort for the world’s
banking sector during the crisis at least in part because it served the interests of large U.S. global
banks.
It is
therefore unlikely that either the Fed itself, or the banks that made use of its crisis programs,
could have anticipated these disclosures at the time of the crisis.
5 In 2008, Bloomberg News LP filed a request for the Fed’s discount window data under the Freedom of Information Act. When the Fed denied the request, Bloomberg filed a lawsuit and then won a trial court ruling in 2009. The Fed appealed the decision but a federal appeals court handed Bloomberg another victory in March 2010. At that point the Fed conceded the issue. However, the verdict was appealed by the New York Clearing House Association, which represents 10 of the nation’s largest banks (Appelbaum 2011). The U.S. Supreme Court rejected the appeal on March 21, 2011, breaking a policy of confidentiality that dates back to the Fed’s founding in 1913.

5
The second way I use the disclosures follows from this finding. Within the United States,
the disclosures contributed to a congressional backlash against the Federal Reserve. Prior to the
disclosures, many politicians believed that Fed officials were too cozy with Wall Street banks,
and legislation had been introduced to require the Fed to be more transparent about the banks it
supported in crises. For example, in February, 2009 Congressman Ron Paul (R-TX) found 320
cosponsors for the Federal Reserve Transparency Act of 2009 (H.R.1207), which was later
incorporated into the Dodd-Frank law. With the revelations in December 2010 and March 2011
that the Fed had provided hundreds of billions of dollars of support to foreign financial
institutions and central banks, pressure mounted in Congress to increase the Fed’s transparency.
I analyze congressional voting on the 2012 version of Paul’s “Audit the Fed” legislation, which
would end the Fed’s confidentiality about the banks and countries it supports and perhaps reduce
the Fed’s monetary policy independence as well. I find that the influence of global banks
extends to Congress by way of campaign contributions: contributions from “global banks”
(defined as U.S. and foreign-owned money-center banks with branches or agencies in the U.S.)
significantly reduce the likelihood that a legislator will vote in favor of the bill. In addition, I
find that ideologically right-wing representatives are substantially more likely than left-leaning
representatives to support this legislation--an historic reversal of ideological positions on the
Fed.
The plan of the paper is as follows. Section 2 provides background on the global crisis
and a summary of the Fed’s global lender-of-last-resort activities. Section 3 introduces the data,
models, and results of my analyses of the Fed’s foreign operations. Section 4 moves to the
domestic level and provides data, models, and results of my analysis of congressional voting on

6
the “Audit the Fed” bill, which was approved by the House on July 25, 2012 by a vote of 327-98.
Section 5 concludes with implications for the future of the Fed’s political independence.
2. The Federal Reserve’s Global Lending during the Crisis
The Federal Reserve Act of 1913 gave the Federal Reserve responsibility for both setting
monetary policy and for maintaining the stability of financial markets. In the latter capacity, the
Fed supervises U.S. and non-U.S. banks and bank holding companies that are members of the
Federal Reserve System and provides lender-of-last-resort services to these institutions during
financial crises. During the subprime financial crisis, the Fed provided more than a trillion
dollars in emergency loans to the financial sector to address the breakdown of interbank and
other money markets and to avert the failure of individual firms of systemic-importance, like
AIG. According to the General Accounting Office (GAO), which conducted a one-time audit of
the Fed’s emergency operations under the authority of the Dodd-Frank law, “the scale and nature
of this assistance amounted to an unprecedented expansion of the Federal Reserve System’s
traditional role as lender-of-last-resort” (United States GAO 2011, 1).
The programs were unprecedented partly because of their international scope. The
largest program, measured in terms of the peak dollar amount of loans outstanding, was the
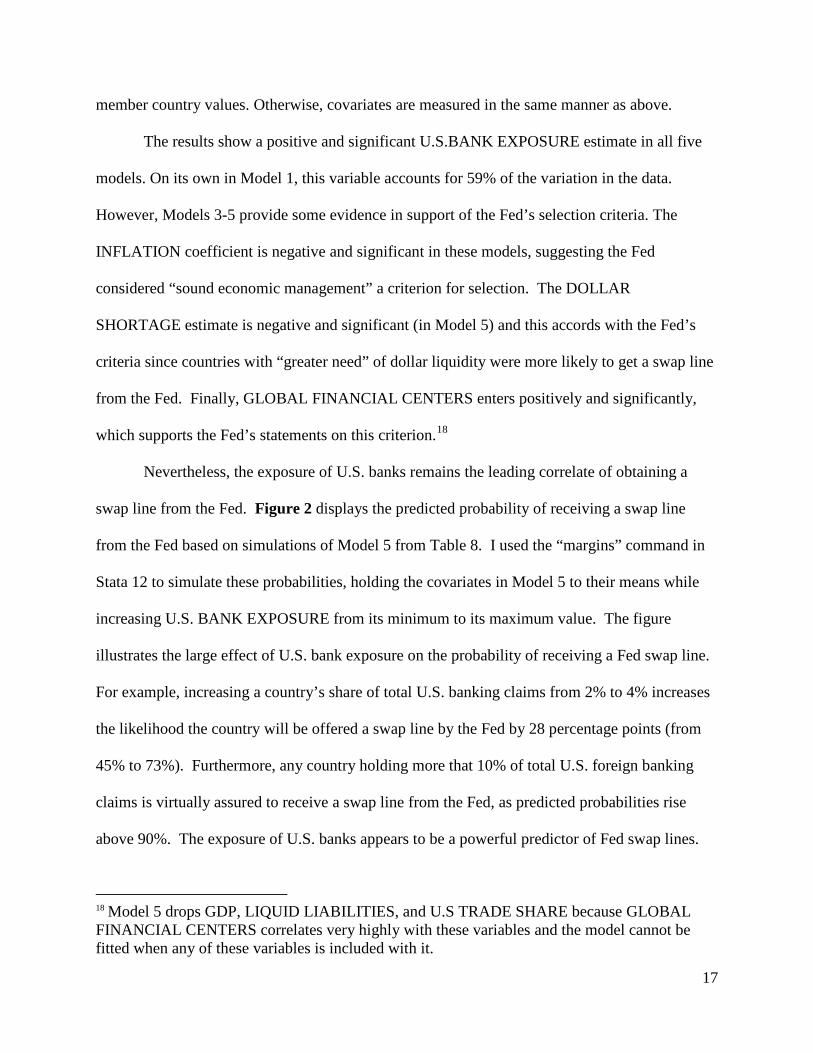
dollar swap lines program (see Table 1, reproduced from the GAO Report).6 But other
emergency programs, particularly the Term Auction Facility (TAF) and the Commercial Paper
Funding Facility (CPFF) were also heavily used by foreign banks.7
In fact, U.S. branches of
6 The table excludes lending from the discount window because the GAO was not authorized to review this part of the Fed’s activity during the crisis. 7 Foreign banks operating in the U.S. are eligible for Federal Reserve services—including emergency services—under the principle of “national treatment,” or parity of treatment between domestic and foreign banks.

7
foreign banks and U.S. subsidiaries of foreign institutions received more than half of the total
dollar amount of TAF and CPFF loans made (see Table 2, Table 3, and Figure 1). Non-U.S.
banks were also heavy borrowers at the Fed discount window during the crisis. Table 4
indicates that 15 of the 30 largest borrowers (measured by peak loan amount) at the discount
window where branches or agencies of foreign banking organizations.
The reason the Fed needed to play a lender-of-last-resort role for non-U.S. banks was that
foreign financial institutions were experiencing severe funding shortages in U.S. dollars. These
dollar shortages were a direct outgrowth of the rapid globalization of banking and asset
management. After 2000, foreign banks, particularly European banks, began accumulating large
amounts of dollar-denominated assets, including Mortgage-Backed Securities (MBS). Foreign
banks funded their dollar positions largely in short-term wholesale markets, either by borrowing
dollars in the United States (primarily from money-market mutual funds) or by acquiring
domestic currencies and converting them into dollars via foreign-exchange swaps. The resulting
maturities mismatch left banks vulnerable to any disruption in the short-term interbank and
dollar swap funding markets. When these markets tightened during the credit crisis--and then
froze completely after Lehman Brothers was allowed to fail--foreign banks could not rollover
their dollar liabilities. Although the resulting dollar liquidity crisis affected both U.S. and foreign
banks, but it was particularly acute for foreign banks since they did not hold significant U.S.
dollar deposits and relied more heavily on the interbank and swap markets to fund their dollar-
denominated assets.8
In response to the dollar liquidity crisis, the Federal Reserve simultaneously established
two programs in December 2007: the Term Auction Facility (TAF) and the dollar swap line
8 The preceding summary is based on McGuire and von Peter (2009), Allen and Moessner (2010), and Fleming and Klagge (2010). See also and Goldberg, et al. (2010).

8
program with foreign central banks. While the TAF addressed domestic dollar funding
pressures, the Fed recognized that the new facility was unlikely to alleviate dollar funding
pressures overseas since interbank lending was effectively frozen and foreign central banks’
could not create dollars (typically, central banks lend to domestic banks in domestic currency).
Although U.S. branches of foreign banks could borrow dollars from the Fed, many foreign banks
could not. The Fed stepped in by offering dollar swap lines to foreign central banks, which
enabled these central banks to provide dollar liquidity to banks in their jurisdictions. According
to Bordo et al. (2012, 8), “These swap lines essentially extended the Term Auction Facility’s
reach beyond U.S. borders by financing term dollar funding facilities for foreign banks.”
The Fed’s Federal Open Market Committee (FOMC) approved temporary swap lines
with 14 foreign central banks between December 12, 2007, and October 29, 2008 (see Table 5).
These foreign central banks used the U.S. dollars obtained through the swap lines to make dollar
loans to financial institutions in their jurisdictions. The foreign central banks assumed the risk of
losses on these dollar loans and paid Fed the interest collected on these loans, and the Fed did not
pay interest on the foreign currency it received under the swap lines (Fleming and Klagge 2010).
Dollars outstanding to foreign central banks peaked at $586 billion in December 2008,
with the European Central Bank accounting for about 80 percent of total dollars drawn (see
Table 5). At the peak, the temporary swap lines accounted for over 25 percent of the Fed’s total
assets (Fleming and Klagge 2010, 5). By most accounts, the swaps were successful in
channeling dollar liquidity abroad, signaling central bank cooperation, and calming markets
(Goldberg, et al. 2010, Baba et al. 2009, Obstfeld et al. 2009). The swap lines expired on
February 1, 2010. However, the Fed reauthorized the swap lines with five foreign central banks
in May 2010 in response to strains in dollar funding markets associated with the Eurozone debt

9
crisis. As Eurozone crisis continues, the swap lines have been reauthorized, with the latest
extension running to February 1, 2013.
The Fed explained the large participation of non-US banks in its various crisis programs
as a function of the large pools of dollar assets owned by foreign banks, which could not funded
by short-term borrowings in the frozen interbank and swap markets. With respect to the TAF,
the GAO reported that “FRBNY staff identified a few possible reasons for high use by U.S.
branches and agencies of foreign banks. First, many of them faced liquidity strains arising from
the need to bring certain illiquid U.S. dollar assets back on to their balance sheets and could not
finance these assets elsewhere. In addition, many of these institutions held U.S.-dollar
denominated collateral that could be pledged to TAF but not in their home country” (United
States GAO 2011, 235.)
While the crisis certainly caused a spike in demand for dollar liquidity worldwide, there
is substantial cross-national variation in the extent to which non-U.S. banks participated in the
various Fed programs. Table 6 aggregates foreign bank borrowing from the Fed by country
during the 2007-2010 crisis, using the peak daily outstanding balance owed to the Fed from all
programs (except the dollar swap lines) to indicate the extent to which foreign banks tapped the
Fed for dollar liquidity. The aggregation includes direct foreign bank borrowing from six broad-
based Fed facilities—the Asset-Backed Commercial Paper Money Market Mutual Fund
Liquidity Facility (AMLF), the Commercial Paper Funding Facility (CPFF), the Primary Dealer
Credit Facility (PDCF), the Term Auction Facility (TAF), the Term Securities Lending Facility
(TSLF), Single-Tranche Open Market Operations (ST OMO—plus borrowing through the

10
discount window.9
What explains cross-national variation in borrowing from the Federal Reserve during the
dollar liquidity crisis? Likewise, what explains the Fed’s selection of 14 foreign central banks
for dollar swap lines during the crisis? The next section explores these questions.
Overall, banks from 26 foreign countries made use of these Fed facilities.
Banks from the United Kingdom and Germany were the heaviest borrowers, drawing 27% and
24% respectively of the Fed’s total foreign lending.
3. Correlates of Foreign Borrowing from the Federal Reserve, 2007-2010
I create two measures of cross-country variation in the Fed’s foreign lending during the financial
crises. The first measure, FED PEAK LENDING, is a country’s share of the Fed’s total peak
foreign lending from August 1, 2007 to April 30, 2010. Country shares are calculated by taking
the largest daily outstanding amount owed to the Fed by all banks in a foreign country and
dividing by the largest daily outstanding amount owed to the Fed by all non-U.S. banks from all
foreign countries. The data for this measure incorporates lending from the Fed’s six temporary
broad-based emergency facilities (AMLF, CPFF, PDCF, TAF, TSLF, ST OMO) and the
discount window. For non-zero values, the variable has a mean of 0.039 and ranges from
0.00002 (Venezuela) to 0.2678 (United Kingdom). The second measure is DOLLAR SWAP
LINE, an indicator variable equal to 1 if the Federal Reserve selected a country for a dollar swap
line during the crisis. As indicated in Table 5, fourteen central banks received swap lines from
the Fed between December 2007 and October 2008.
9 The table does not include foreign borrowing via the dollar swap because swaps for Eurozone banks were administered by the European Central Bank (ECB), and the ECB did not disclose the names and nationalities of the borrowers that tapped the swapped dollar credits.

11
Each measure has its strengths and weaknesses. The advantage of the first measure is
that it allows observations of Fed lending to vary by country, rather than by central bank
jurisdiction. With the swap lines, by contrast, there is a single observation for all Eurozone
member countries.10 The weakness with the first measure is that the choice to draw on the Fed’s
emergency lending facilities rested with the borrowers rather than with the Federal Reserve, as
Fed policy was to provide access to any domestic or foreign banks that met the eligibility
requirements (United States GAO 2011). Foreign banks had similar access to the discount
window, but this was rooted in U.S. law rather than Fed policy.11
The dollar swap lines, by contrast, required explicit action by the Fed. According to the
GAO audit of this program, “The FOMC’s consideration of a new swap line arrangement
generally followed a request from an interested foreign central bank, but not all requests were
granted” (United States GAO 2011, 118). Although the names of the central banks that were
denied swap lines by the Fed are not public knowledge, the GAO audit did reveal the general
criteria the FOMC said it used to evaluate these requests. Based on internal memorandums and
communication with Federal Reserve Board staff, the GAO found that the FOMC’s approval of
swap line requests “were generally based on the economic and financial mass of the country’s
economy, a record of sound economic management, and the probability that the swap line would
For all these programs, the
impetus to draw credit from the Fed rested with the borrower.
10 The Fed established a dollar-euro swap arrangement with the ECB, and the ECB did not release the names and nationalities of the banks that drew dollar credits under the swaps. The lack of disclosure irked Representative Randy Neugebauer (R-TX19), Chairman of the House Financial Services Subcommittee on Oversight and Investigations, who wants to make disclosure of recipients a condition of Fed swap lines (Lanman and Keoun 2011).
11 The Monetary Control Act of 1980 stipulates that a U.S. branch or agency of a foreign bank that maintains reserves at a Fed bank may receive discount-window credit.

12
make an economic difference.” The GAO also noted that “the swap line arrangements were
generally made with foreign central banks of important U.S. trading partners or global financial
centers, such as Switzerland, Japan, and England, based on global funding needs” (United States
GAO 2011, 118). Further insight into the selection of foreign central banks comes from FOMC
member William Poole, President of the Federal Reserve Bank of St. Louis. Poole voted against
establishing swap lines with the ECB and the Swiss National Bank on that the grounds that these
central banks held large reserves, presumably in dollars, that could be used to backstop dollar
liquidity in Europe (Minutes 11 December 2007). The broader point is that the Fed selected
certain central banks for swap lines on basis of certain economic and financial considerations.
This differs from the Fed’s other emergency lending facilities, such as the TAF and CPFF which
were selected into by foreign borrowers.
I draw on the FOMC’s selection criteria to estimate the economic and financial covariates
of the Fed’s foreign lending during the crisis. I also consider political economy covariates;
notably, the influence and interests of the large money-center banks. Previous research has
shown that U.S. money-center banks comprise a key constituency for the International Monetary
Fund (IMF); in turn, the IMF, ensures that the countries in which these banks are highly exposed
are protected under the IMF’s insurance umbrella (Broz and Hawes 2006a, Broz and Hawes
2006b). A similar relationship exists between these commercial banks and the U.S Treasury
Department’s Exchange Stabilization Fund (ESF), which was tapped to provide financial rescues
to emerging market economies during the 1990s (Broz 2005). The connection between money-
center banks and the Federal Reserve is more direct and more formal than it with the ESF and the
IMF. Commercial banks elect the majority of the Federal Reserve Bank of New York’s
(FRBNY) Board of Directors. In normal times, the FRBNY plays the leadership role in

13
implementing Federal Reserve Board policy and conducting foreign operations for the system.
During the credit crisis, the Federal Reserve Board directed the FRBNY to implement most of its
emergency facilities (United States GAO 2011). As the dominant constituency with a formal
role in FRBNY policy-making, money-center banks can therefore be expected to have influence
on the Fed’s foreign lending.
My measure for the interests of money-center banks is U.S. BANK EXPOSURE, the
consolidated claims of U.S. banks on individual countries divided by the consolidated claims of
U.S. banks on all countries in December 2007.12 These data highlight the role of large financial
institutions located in the nation’s money centers (i.e., “money-center banks”) because a small
number of these very large banks conduct almost all international lending.13
Table 7 reports surprisingly strong results of a linear OLS regression of FED PEAK
LENDING on U.S. BANK EXPOSURE. Model 1 indicates a large, statistically significant
positive relationship between these variables. Furthermore, the model fits the data very well (R2
= 0.61). As these variables are measured as shares, the coefficient estimate suggests that a one
percent increase in the exposure of U.S. banks to a country is associated with a 1.3 percent
increase in the share of peak Fed lending to a country.
The intuition is that
large U.S. money-center banks benefit when the Fed provides liquidity to foreign countries in
which they are highly exposed.
12 The data are from the Bank of International Settlements (BIS), Consolidated Banking Statistics, Table 9B, Foreign claims by nationality of reporting banks, immediate borrower basis. http://www.bis.org/statistics/consstats.htm 13 According to data from the Federal Financial Institutions Examination Council Statistical Release E.16, dated December 31, 2007, the following 11 money-center banks accounted for 93% of the consolidated foreign claims of U.S. banks: Bank of America Corp., Bank of New York Co., Citigroup, Deutsche Bank (Taunus Corp.), HSBC Holdings PLC., JPMorgan Chase, State Street Corp., Wachovia Corp., and Wells Fargo. See http://www.ffiec.gov/E16.htm

14
Model 2 adds controls that may be correlated with the foreign exposures of U.S. banks.
The set of controls is derived from the GAO audit of the Fed’s emergency lending programs,
during which FOMC members and Federal Reserve staff described the factors that shaped the
their selection of countries for swap lines. The following considerations were highlighted by Fed
officials:
• The economic and financial mass of the country’s economy
• A global financial center
• Importance to the U.S. as a trading partner
• A record of sound economic management
• Dollar funding needs of a country’s banks
In Model 2, I control for the “economic and financial mass” of countries with GDP (gross
domestic product in billions of U.S. dollars in December 2007) and LIQUID LIABILITIES (in
millions of U.S. dollars in 2007).14 The estimates suggest that these variables are not related to
the Fed’s foreign lending. Model 3 introduces GLOBAL FINANCIAL CENTER, an indicator
variable equal to 1 if a country is home to a global financial center city.15
14 Liquid liabilities (aka M3) equal currency plus demand and interest-bearing liabilities of banks and other financial intermediaries. It is the broadest available indicator of financial intermediation. These data are from Beck et al (2000) Financial Structure Database. GDP data are from the World Economic Outlook (WEO) Database.
It also includes U.S.
TRADE SHARE, which is 2007 U.S. bilateral trade with a country (imports plus exports) as a
15 The Global Financial Centres Index at http://www.zyen.com designates cities in these 7 countries as “global financial centers”: Canada (Toronto), Germany (Frankfurt), Hong Kong, Japan (Tokyo), Singapore, Switzerland (Zurich), and the United Kingdom (London).

15
share of total U.S. trade (imports plus exports), and INFLATION, the annual percentage change
in CPI inflation averaged over the previous decade (1997-2007).16
The results of Model 3 suggest that financial importance, as measured by whether a
country serves as a global financial center, is positively related to crisis lending by the Fed. This
is important because two global financial centers—the United Kingdom and Germany—are
outliers in terms of borrowings from the Fed. Nevertheless, the BANK EXPOUSURE estimate
is nine times the magnitude of the GLOBAL FINACIAL CENTER control and highly
significant.
The inflation rate is meant to
capture the Fed’s concern with countries’ “record of sound economic management.”
The importance of a country as a trading partner of the United States is negatively
associated with lending from the Fed, according to Model 3 estimates, and a country’s record of
macroeconomic management, as measured by inflation performance, is uncorrelated with Fed
lending. Both results probably reflect the fact that Fed did not select which countries’ to support
via lending from its emergency facilities; these facilities were open to all non-U.S. banks with
branches and agencies in the U.S. As indicated above, the initiative for selecting which
borrowers to support rested with the Fed only in the case of the dollar swap lines, which I
analyze below.
Model 4 controls for the “dollar funding needs” of banks in foreign countries with
DOLLAR SHORTAGES, which I constructed from BIS Locational Banking Statistics following
Allen and Moessner (2010).17
16 Bilateral trade data are from the Correlate’s of War dataset and the inflation data are from the IMF’s International Financial Statistics.
The variable is constructed as the net outstanding U.S. dollar
17 The BIS collects data on the currency-specific claims and liabilities of banks in BIS reporting countries. Currency-specific banking data are not available by country from the BIS’s online

16
cross-border claims on BIS reporting banks and non-banks in a country, where “net” is defined
as cross-border total dollar liabilities minus claims in all foreign and domestic currencies at the
end of 2008. By this measure, the largest dollar liquidity shortage was in the United Kingdom
(-$153.6 billion), which was the largest borrowers from the Federal Reserve during the crisis (see
Table 6).
The sample in Model 4 drops to 32 observations because the BIS does not collect
currency-specific banking data on all countries. Despite the change in sample, the U.S BANK
EXPOSURE coefficient in Model 4 is similar in magnitude to other models and R2 increases to
0.87. The fit is driven almost entirely by the exposure variable: in a regression of FED PEAK
LENDING on DOLLAR SHORTAGE, the estimate for dollar shortages is tiny (-0.00015), and
not significant (t = -0.39).
Overall, the results in Table 7 reveal a remarkably consistent pattern: foreign countries
that received larger shares of the Fed’s total peak emergency lending were countries in which
U.S. money-center banks held larger claims on banks and corporations. In other words, the
exposure of U.S. banks to a foreign country correlates strongly and positively with crisis lending
from the Federal Reserve. In the next section, I analyze the Fed’s selection of countries for
dollar swap lines, which required explicit FOMC approval.
Table 8 reports the results of probit regressions of SWAP LINE on U.S. BANK
EXPOSURE and controls. The dependant variable takes the value of one for countries that the
FOMC selected for dollar swap lines between December 2007 and October 2008, zero otherwise
(see Table 5). As the ECB received a swap line for its nine member countries, there is a single
observation for the Eurozone, with covariate values representing either the sum or the mean of
database at http://www.bis.org/statistics/bankstats.htm. The BIS provided these data to me upon request.
17
member country values. Otherwise, covariates are measured in the same manner as above.
The results show a positive and significant U.S.BANK EXPOSURE estimate in all five
models. On its own in Model 1, this variable accounts for 59% of the variation in the data.
However, Models 3-5 provide some evidence in support of the Fed’s selection criteria. The
INFLATION coefficient is negative and significant in these models, suggesting the Fed
considered “sound economic management” a criterion for selection. The DOLLAR
SHORTAGE estimate is negative and significant (in Model 5) and this accords with the Fed’s
criteria since countries with “greater need” of dollar liquidity were more likely to get a swap line
from the Fed. Finally, GLOBAL FINANCIAL CENTERS enters positively and significantly,
which supports the Fed’s statements on this criterion.18
Nevertheless, the exposure of U.S. banks remains the leading correlate of obtaining a
swap line from the Fed. Figure 2 displays the predicted probability of receiving a swap line
from the Fed based on simulations of Model 5 from Table 8. I used the “margins” command in
Stata 12 to simulate these probabilities, holding the covariates in Model 5 to their means while
increasing U.S. BANK EXPOSURE from its minimum to its maximum value. The figure
illustrates the large effect of U.S. bank exposure on the probability of receiving a Fed swap line.
For example, increasing a country’s share of total U.S. banking claims from 2% to 4% increases
the likelihood the country will be offered a swap line by the Fed by 28 percentage points (from
45% to 73%). Furthermore, any country holding more that 10% of total U.S. foreign banking
claims is virtually assured to receive a swap line from the Fed, as predicted probabilities rise
above 90%. The exposure of U.S. banks appears to be a powerful predictor of Fed swap lines.
18 Model 5 drops GDP, LIQUID LIABILITIES, and U.S TRADE SHARE because GLOBAL FINANCIAL CENTERS correlates very highly with these variables and the model cannot be fitted when any of these variables is included with it.

18
4. Correlates of Congressional Voting to Increase the Fed’s Transparency
Immediately following the Federal Reserve’s court-ordered disclosure of the names and
nationalities of the banks that had borrowed from its discount window, Ron Paul began plans for
congressional hearings: “I am surprised and deeply disturbed to learn the staggering amount of
money that went to foreign banks. These lending activities provided no benefit to American
taxpayers, the American economy, or even directly to American banks” (Felsenthal and Zargham
2011). Paul’s efforts culminated in legislation to make the Federal Reserve transparent on a
permanent basis, culminating in The Federal Reserve Transparency Act of 2012 (H.R.459),
which was approved by the House of Representatives on July 25, 2012. I analyze voting on this
bill to see if the influence of global banks extends beyond the Fed to the political body that has
power over the Fed: the U.S. Congress.19
The intent of this legislation is to make the one-time Dodd-Frank Act disclosures a
permanent feature of congressional oversight and to extent the GAO’s audit authority to the
Fed’s open market operations. According to the congressional report that accompanied the bill
to the floor, the Dodd-Frank Act provided a one-time exception to legal restrictions that
prevented the GAO from auditing the Fed in four key areas: “(1) Transactions for or with a
foreign central bank, foreign government or international financing agency; (2) Deliberations,
decisions, or actions on monetary policy matters, including discount window operations, reserves
of member banks, securities credit, interest on deposits, and open market operations; (3)
Transactions made under the direction of the Federal Open Market Committee; and (4) Any
discussions or communications among or between members of the Federal Reserve Board of
19 The Fed is a creation of Congress and Congress conducts oversight of the central bank’s exercise of its constitutionally-delegated authority.

19
Governors and officers and employees of the Federal Reserve System related to the above.”20
H.R.459 would remove these restrictions. Elijah Cummings (D-MD7) wrote the “minority
views” section of the report, arguing that the bill would critically undermine the political
independence of the Federal Reserve.21
The bill was very popular in the House where the vote was taken under a procedure
called “suspension of the rules.” Suspension is typically used to pass non-controversial bills
since votes under suspension require two-thirds majority. The tally of 327-98 easily met this
hurdle. All Republicans except Robert Turner (R-NY9) voted in favor of the bill. But Democrats
were divided, with 89 Democrats joining Republicans to approve the bill and 97 voting against.
While election-year politics probably had some impact on the partisan alignment, it is
noteworthy that Republicans, the traditional supporters of the Fed’s independence, voted en
masse for the bill while Democrats, the party that usually attacks the Fed as an unaccountable
power with incestuous relations with banks, lined up as the Fed’s protector. In a striking
indicator of this reversal, Democratic Whip Steny Hoyer (D-MD5) implored Democrats to vote
“no” on the grounds that the bill “impedes the independence of this critical institution…House
Republicans cannot be allowed to hold our economy or our critical economic institutions hostage
in order to further their extreme agenda.”22
The whip was not effective as almost half of the Democrats broke ranks and voted with
Republicans. I analyze Democrats’ vote choice on this bill with an eye toward gauging the
influence of global banks and identifying the personal and constituency factors that contribute to
20 Committee on Oversight and Government Reform report, CRPT-112hrpt607-pt1. http://www.gpo.gov/fdsys/pkg/CRPT-112hrpt607/pdf/CRPT-112hrpt607-pt1.pdf 21 Ibid 22 Office of the Democratic Whip Steny Holler http://www.democraticwhip.gov/content/daily-whip-tuesday-july-24-2012

20
legislators’ decisions. While previous research has shown that campaign contributions from
money-center banks shapes congressional voting in other areas, such as funding for the IMF and
funding for foreign aid, I extend this analysis to voting on H.R.459, known as the “Audit the
Fed” legislation (Broz 2011, Milner and Tingley 2011). My measure of bank influence is
BANK CONTRIBUTIONS, which is operationalized as campaign contributions from money-
center banks to representatives during the two election cycles prior to the vote divided by total
contributions a representative received from all sources during these two cycles. My
expectation is that representatives that are more dependent on money-center banks for campaign
contributions are more likely to the vote against H.R.459.
I identify “money-center banks” from the FFIEC’s list of “Large Financial Institutions”
that account for over 90% of all foreign banking claims held by U.S. banks (see footnote 14).
The banks comprising this group are: Bank of America, Bank of New York, Citigroup, Deutsche
Bank (Taunus Corp.), HSBC, JPMorgan Chase, State Street Corp., Wachovia Corp., and Wells
Fargo. Deutsche Bank and HSBC are foreign-owned banks with branches in the United States
and each has a PAC that contributes to congressional campaigns. This measure thus captures the
role that “global banks” play in Congress via contributions to campaigns.
Model 1 in Table 9 reports results of a probit model regression of Democrats’ voting on
H.R.459. The BANK CONTRIBUTIONS estimate is negative and statistically significant, albeit
of limited explanatory power (Pseudo R2 = 0.03). Model 2 controls for the political “ideology”
of representatives using the first dimension DW-NOMINATE score, which is derived from a
spatial model of representatives’ individual roll-call voting histories. As Poole and Rosenthal
(2000) explain, the first dimension can be interpreted as a representative’s position on
government intervention in the economy. Values range from -1 to 1, with higher values

21
indicating a more right-wing anti-government ideology. The estimate in Model 2 suggests that
right-leaning Democrats are more likely than left-leaning Democrats to support auditing the Fed
even if it means a more politicized monetary policy environment.
This ideological finding is interesting for a number of reasons. First, it suggests that not
all Republicans that supported the bill did so to harm President Obama’s chances in the
upcoming election—right-wing ideology probably mattered too. Second, it suggests that
revelations of the Fed’s massive global operations during the crisis may have reversed partisan
positions on the Federal Reserve, so that the Right now opposes the Fed for its internationalist,
interventionist activities while the Left supports it for these very same reasons.23
I control for additional factors in Model 3 to be sure the contributions and ideology
estimates are not spurious. BANK HEADQUARTERS is an indicator variable equal to 1 if a
representative’s district is home to the headquarters to one of the nation’s 11 money-center
banks. I expected a negative sign since these banks opposed H.R.459. The estimate, however, is
positive and significant at the 10% level. Neverthelss, contributions from banks remain
negatively and significantly related to voting. CHAMBER SENIORITY counts the number of
terms representatives have served in the House, from Stewart and Woon (2011). More senior
representatives are more electorally secure and therefore more likely to vote on the basis of their
personal beliefs. The estimate is negative and significant, indicating that more senior Democrats
were less likely to support the bill, in line with their party’s whip. Nevertheless, the ideology
estimate is hardly affected. FINANCE COMMITTEE is an indicator variable equal to 1 if a
I discuss these
points in the conclusion.
23 See Milner and Tingley (2011) for a similar argument about the anti-globalization effect of right-wing ideology on foreign aid policy, and Broz (2011, 2008) for the Right’s opposition to funding the international financial institutions.

22
representative sits on the House Financial Services Committee, from Stewart and Woon (2011).
Membership on this committee may be correlated with bank contributions since interest groups
are known to bestow larger contributions on legislators with greater influence over their
industries. The estimate is positive but not significant.
Figures 3 and 4 present substantive effects of bank contributions and ideology. These
estimates are computed from Model 3 in Table 9 and indicate the change in the predicted
probability a Democrat will vote in favor of H.R.459 as each variable of interest is increased
over its range, holding other covariates at their means. Both figures reveal large effects.
According to Figure 3, there is a 58% chance that a Democrat will vote “yes” on the bill when
getting a zero share of contributions from banks. However, a Democrat that gets 1 percent of his
total contributions from banks is 38 percentage points less likely to favor the bill, with a
predicted probability of voting “yes” of just 20%. Contributions from big banks seem to have
large effects even when they compose small shares of representatives’ total receipts.
The same hold with ideology. According to Figure 4, moving DW-Nominate from the
value of the most left-wing Democrat (Jim McDermott, WA-7) to the value of the most right-
wing Democrat (Heath Shuler NC-11) increases the odds of voting “yes” on the bill by 67
percentage points. Ideology thus appears to have a large effect on voting to make the Fed more
transparent and perhaps less independent but the direction of this effect is the reserve of the
traditional coalition pattern. The Right is now challenging the Fed to be more transparent, more
accountable, and less beholden to banks while the Left is positioning itself as the defender of
the Fed.

23
5. Conclusions and Implications
The Dodd-Frank law and a Supreme Court ruling required the Federal Reserve to disclose nearly
all borrower-specific information about its lending during the financial crisis. The disclosures
revealed that the Fed had provided vast amounts of dollar liquidity to foreign banks and central
banks—a consequence of the rapid globalization of banking and asset innovation after 2000 that
had left many foreign banks highly exposed to disruptions in short-term dollar funding markets.
Had the Fed not supported foreign banks, the credit crisis in the U.S. would almost certainly
have been worse. So, in a broader sense, the disclosures revealed that the Federal Reserve had
become—by default—the lender of last resort for the world’s banking system.
At the time they were making crisis decisions, Federal Reserve officials didn’t know they
would have to reveal this borrower-specific information. In this paper, I utilized this exogeneity
for two purposes. First, I used data from the disclosures to evaluate cross-country variation in the
Fed’s foreign lending. I created two measures of this outcome: (1) a country’s share of the Fed’s
total peak foreign lending, and (2) an indicator variable for the 14 central bank jurisdictions the
Fed selected for dollar swap lines. I regressed each outcome on set of economic and financial
variables that proxy for the Fed’s selection criteria (as revealed by the disclosures), plus a
political-economy variable that captures the interests of U.S. money center banks: the claims on
U.S. banks on a country as a share of total foreign claims. While I find some support for the
Fed’s selection criteria in the case of the swap lines measure, the factor that most strongly and
consistently “predicts” the Fed’s foreign lending is the extent to which large U.S. banks have
financial claims on a country.
It is perhaps impolitic for the Fed to acknowledge the role that global banks played in
shaping its crisis decisions. Yet serving the interests of banks is a formal component of the Fed’s
structure: banks elect the majority of the regional reserve banks’ directors and the directors of the

24
FRBNY, in conjunction with the FOMC, managed most of the Fed’s crisis programs. But the
Federal Reserve has a greater principal to whom it owes its existence: the U.S. Congress. Hence,
the second way I exploited the disclosures was to examine the congressional response to them.
The revelations of the Fed’s support for foreign banks and central banks prompted
legislation in the House to make the one-time Dodd-Frank disclosures permanent, and to go
beyond them in certain areas. Ron Paul’s 2012 “Audit the Fed” bill would remove remaining
limits on GAO audits of the Fed's operations, including its transactions with foreign central
banks and its open-market operations, which might compromise the Fed’s political
independence. I analyzed voting on this bill with the aim of seeing whether global banks have
influence over the Fed’s ultimate principal, by way of contributions to congressional campaigns.
I found that voting against this bill is correlated with campaign contributions from the 11 money-
center banks that account for nearly all foreign lending by U.S. banks. I also found something
surprising and worthy of further analysis: members of Congress with right-wing ideologies
strongly support audits of the Fed, apparently even at the risk of a politicizing monetary policy,
while left-leaning legislators oppose such transparency.
With all but one Republican voting “yes”, and 97 mostly right-wing Democrats joining
them, the Fed seems to have fallen out of favor with the Right. Put another way, Ron Paul’s
anti-Fed ideas, which for most of his career have been considered to be on the fringe, have
moved into the mainstream of the Right. This is a break from the past since the Right has
historically supported the Federal Reserve for its conservative commitment to monetary stability.
What caused this historic reversal? While it is too soon to tell with any certainly, one
possibility is that the Dodd-Frank disclosures fueled the Right’s antipathy of the Fed. The
financial crisis downgraded monetary policy to a second-order concern for the Fed, which

25
concentrated on restoring stability to the increasingly globalized financial sector. This shift in
focus left the Fed vulnerable to attacks from the right of the political spectrum, where people
tend to see financial instability as caused by excessive government intervention in the economy.
From this perspective, the Fed’s emergency loans were “bailouts” that created the moral hazard
that caused banks to take on too much risk in the first place. In addition, the disclosures revealed
the Fed to be an agency committed to global financial stability, which touched another nerve on
the Right. Details of the Fed’s support for foreign banks and central banks antagonized right-
wing legislators, who are known to oppose organizations like the IMF that backstop the
international financial system (Broz 2011, Broz 2008). In short, the disclosures may have led
the Federal Reserve to be associated with “globalization,” “bailouts,” and “excessive government
intervention,” thereby reversing the Right’s traditional support for the central bank

26
References:
Aizenman, Joshua and Gurnain Kuar Pasricha. 2010. “Selective Swap Arrangements and the Global Financial Crisis: Analysis and Interpretation.” International Review of Economics and Finance 19 (3): 353-365 Allen, William A. and Richhild Moessner. 2010. “Central Bank Co-operation and International Liquidity in the Financial Crisis of 2008-9.” Bank for International Settlements Working Papers No. 310 (May). Appelbaum, Binyamin. 2011. “Supreme Court Denies a Move to Bar the Details of a Fed Bailout.” New York Times (March 21). Beck, Thorsten, Asli Demirgüç-Kunt, and Ross Levine. 2000. "A New Database on Financial Development and Structure." World Bank Economic Review 14: 597-605. Baba, Naohik, Robert N McCauley,and Srichander Ramaswamy. 2009. “U.S. Dollar Money Market Funds and Non-U.S. Banks.” BIS Quarterly Review (March):65-81. Bordo, Michael D., Owen Humpage, and Anna J. Schwartz. 2012. “Epilogue: Foreign Exchange Market Operations in the Twenty-First Century.” NBER Working Paper No. 17984 (April):1-21. Broz, J. Lawrence. 2005. “Congressional Politics of International Financial Rescues." American Journal of Political Science 49, 3 (July): 479-496. _______________. 2008. "Congressional Voting on Funding the International Financial Institutions.” The Review of International Organizations 3, 4 (December 2008): 351-374. _______________. 2011. “The United States Congress and IMF Financing, 1944-2009.” The Review of International Organizations 6, 3 (September 2011): 341-368. Broz, J. Lawrence and Michael Brewster Hawes. 2006a.“U.S. Domestic Politics and International Monetary Fund Policy” In Delegation and Agency in International Organizations. Edited by Darren Hawkins, David A. Lake, Daniel Nielson, and Michael J. Tierney. Cambridge University Press, 2006. Broz, J. Lawrence and Michael Brewster Hawes. 2006b. “Congressional Politics of Financing the International Monetary Fund.” International Organization 60, 1 (Spring): 367-399. Felsenthal, Mark and Mohammad Zargham. 2011. “Rep. Paul Planning Hearing on Fed Foreign Lending.” Reuters (April, 2). http://www.reuters.com/article/2011/04/02/usa-fed-paul-idUSN0214517620110402

27
Fleming, Michael. J. and Nicholas J. Klagge. 2010. “The Federal Reserve’s Foreign Exchange Swap Lines.” Federal Reserve Bank of New York Current Issues in Economics and Finance. 16, 4 (April):1-7. Goldberg, Linda S., Craig Kennedy, and Jason Miu. 2010. “Central Bank Dollar Swap Lines and Overseas Dollar Funding Costs.” Federal Reserve Bank of New York Staff Reports, No. 429, (January).
Harding, Robin, Tom Braithwaite and Francesco Guerrera. 2010. “European Banks Took Big Slice of Fed Aid.” Financial Times (December 2, 2010).
Keoun, Bradley and Craig Torres. 2011. “Foreign Banks Tapped Fed’s Secret Lifeline Most at Crisis Peak.” Bloomberg News (April 1, 2011).
Lanman, Scott and Bradley Keoun. 2011. “No One Says Who Took $586 Billion in Fed Swaps Done in Anonymity.” Bloomberg News (December 22). McGuire, Patrick and Goetz von Peter. 2009. “The US Dollar Shortage in Global Banking.” Bank for International Settlements Quarterly Review (March): 47-63. Milner, Helen V. and Dustin H. Tingley. 2011. “Who Supports Global Economic Engagement? The Sources of Preferences in American Foreign Economic Policy.” International Organization 65 (Winter):37-68. Minutes of the Federal Open Market Committee, Board of Governors of the Federal Reserve System: Washington, D. C. 11 December 2007. Obstfeld, Maurice, Shambaugh, Jay. C., and Alan M. Taylor. 2009. “Financial Instability, Reserves, and Central Bank Swap Lines in the Panic of 2008.” American Economic Review: Papers & Proceedings 99 (2): 480-86. Poole, Keith T. and Howard Rosenthal. 2000. Congress: A Political-Economic History of Roll Call Voting. Oxford University Press. Sewall, Chan and Jo Craven McGinty. 2010. “Fed Documents Reveal Scope of Aid to Stabilize Economy.” New York Times (December 1, 2010). Stewart III, Charles and Jonathan Woon. Congressional Committee Assignments, 103rd to 112th Congresses, 1993-2011: [House], [March 20, 2011]. United States General Accounting Office. 2011. Federal Reserve System: Opportunities Exist to Strengthen Policies and Processes for Managing Emergency Assistance. GAO-11-696. July 21, 2011.

28
Table 1: Federal Reserve Emergency Programs Covered by the GAO Audit
Source: United States General Accounting Office (2011). The GAO was not authorized by the Dodd-Frank law to audit the Fed’s discount window lending, which is why it is not included in the table.
29
Table 2: Top 25 Largest CPFF Borrowers (U.S. dollars in billions)
Rank Issuer of unsecured commercial paper or sponsor of ABCP issuer
ABCP
Unsecured commercial paper
Issuer total
Percent of total CPFF issuance
1 UBS AG (Switzerland) 0.00 74.50 74.50 10.10 2 American International Group 36.3 24 60.2 8.2 3 Dexia SA (Belgium) 0 53.5 53.5 7.2 4 Hudson Castle 53.3 0 53.3 7.2 5 BSN Holdings (United Kingdom) 42.8 0 42.8 5.8 6 The Liberty Hampshire Company 41.4 0 41.4 5.6 7 Barclays PLC (United Kingdom) 0 38.8 38.8 5.3 8 Royal Bank of Scotland Group PLC
(United Kingdom) 24.8 13.7 38.5 5.2
9 Fortis Bank SA/NV (Belgium) 26.9 11.6 38.5 5.2 10 Citigroup Inc. 12.8 19.9 32.7 4.4 11 Natixis (France) 4.7 22.3 27 3.7 12 General Electric Co 0 16.1 16.1 2.2 13 Ford Credit 15.9 0 15.9 2.1 14 Bank of America Corporation 0 14.9 14.9 2 15 State Street Corporation 14.1 0 14.1 1.9 16 GMAC LLC 13.5 0 13.5 1.8 17 KBC BANK NV (Belgium) 9 2.3 11.3 1.5 18 ING Group NV (Netherlands) 0 10.9 10.9 1.5 19 Dresdner Bank AG (Germany) 5.1 4.9 10 1.4 20 Northcross (United Kingdom) 8.6 0 8.6 1.2 21 WestLB (Germany) 8.2 0 8.2 1.1 22 Merrill Lynch & Co 0 8 8 1.1 23 Allied Irish Bank (Ireland) 0 6.6 6.6 0.9 24 Bayerische Motoren Werke AG
(Germany) 0 6.2 6.2 0.8
25 Handelsbanken (Sweden) 0 6 6 0.8 All Others 24.9 61.8 86.7 11.80 Total 342.3 395.9 738.3 100.00 Notes: Reproduced from United States General Accounting Office (2011), Table 20, p. 196. Borrowing is aggregated at the parent company level and includes borrowing by branches, agencies, subsidiaries, and sponsored ABCP conduits.

30
Table 3: Top 25 Largest TAF Borrowers at the Parent Company Level Rank Parent company of TAF borrowing institution Total TAF loans
(Billions USD) Percent of total
1 Bank of America Corporation 280 7.3 2 Barclays PLC (United Kingdom) 232 6.1 3 Royal Bank of Scotland Group PLC (United Kingdom) 212 5.5 4 Bank of Scotland PLC (United Kingdom) 181 4.7 5 Wells Fargo & Co. 159 4.2 6 Wachovia Corporation 142 3.7 7 Societe Generale SA (France) 124 3.3 8 Dresdner Bank AG (Germany) 123 3.2 9 Citigroup Inc. 110 2.9
10 Bayerische Landesbank (Germany) 108 2.8 11 Dexia AG (Belgium) 105 2.8 12 Norinchukin Bank (Japan) 105 2.8 13 JP Morgan Chase & Co. 99 2.6 14 UniCredit SpA (Italy) 97 2.5 15 Mitsubishi UFJ Financial Group, Inc. (Japan) 84 2.2 16 WestLB AG (Germany) 78 2.1 17 Deutsche Bank AG (Germany) 77 2 18 Regions Financial Corporation 72 1.9 19 BNP Paribas SA (France) 64 1.7
20 Sumitomo Mitsui Banking Corporation (Japan) 56 1.5 21 UBS AG (Switzerland) 56 1.5 22 HSH Nordbank AG (Germany) 53 1.4 23 Mizhuo Financial Group, Inc. (Japan) 51 1.3 24 Commerzbank AG (Germany) 51 1.3 25 Hypo Real Estate Holding AG (Germany) 47 1.2
All others 1,051 27.5 Total 3,818 100.0
Notes: Reproduced from United States General Accounting Office (2011), Table 30, pp. 231-32. Total borrowing is aggregated at the parent company level and includes borrowing by branches, agencies, and subsidiaries for foreign financial organizations.

31
Table 4: 30 Largest Borrowers at the Fed’s Discount Window from March 3, 2008 through March 16, 2009 Rank Origination
Date Borrower Maturity
Date Peak
Borrowing (Billions
USD) 1 10/1/2008 AIG 9/22/2010 61.00 2 10/29/2008 CPFF 1/27/2009 56.56 3 9/26/2008 BANK OF NY MELLON 9/29/2008 44.11 4 12/31/2008 DEXIA CREDIT LOCAL NY BR (Belgium) 1/5/2009 37.00 5 11/6/2008 DEPFA BK PLC NY BR (Ireland) 11/7/2008 28.50 6 3/28/2008 JPMORGAN CHASE BK NA 3/31/2008 28.50 7 10/6/2008 WACHOVIA BK NA 1/2/2009 23.00 8 10/6/2008 ROYAL BK OF SCOTLAND PLC NY B (United Kingdom) 10/7/2008 8.40 9 3/27/2008 BANK OF NY 3/28/2008 7.50
10 10/14/2008 SOVEREIGN BK 10/15/2008 7.26 11 9/29/2008 FORTIS BK SA/NV NY BR (Belgium) 9/30/2008 6.96 12 11/24/2008 US CENTRAL FCU 11/25/2008 6.00 13 9/17/2008 BANK OF SCOTLAND PLC NY BR (United Kingdom) 10/17/2008 5.00 14 9/19/2008 SOCIETE GENERALE NY BR (France) 12/18/2008 4.00 15 10/8/2008 MS CO 10/9/2008 3.63 16 5/28/2008 ERSTE BK OESTERREICHISCH NY BR (Austria) 6/6/2008 3.50 17 10/9/2008 MORGAN STANLEY BK NA 10/14/2008 3.25 18 6/30/2008 DEUTSCHE BK AG NY BR (Germany) 7/1/2008 3.04 19 3/28/2008 CALYON NY BR (France) 4/4/2008 3.00 20 9/16/2008 NORINCHUKIN BK NY BR (Japan) 12/15/2008 3.00 21 12/22/2008 WESTERN CORP FCU 12/23/2008 2.75 22 5/19/2008 HSH NORDBK AG NY BR (Germany) 8/15/2008 2.50 23 9/18/2008 LANDESBK BADEN WUERTTEMB NY (Germany) 10/16/2008 2.50 24 3/31/2008 RBS CITIZENS NA 4/1/2008 2.24 25 10/7/2008 COMMERZBANK AG NY BR (Germany) 1/5/2009 2.00 26 9/18/2008 WASHINGTON MUT BK 9/22/2008 2.00 27 6/20/2008 BANK OF AMER NA 6/23/2008 1.70 28 4/10/2008 BNP PARIBAS EQUITABLE TOWER B (France) 4/11/2008 1.64 29 9/22/2008 ABCP - JPMORGAN CHASE BK 9/29/2008 1.15 30 9/29/2008 BANK TOK-MIT UFJ NY BR (Japan) 10/8/2008 1.00
Source: Bloomberg News released the Fed’s court-ordered data files in raw form at http://cdn.gotraffic.net/downloads/30110331_fed_release_documents.zip. The discount window data are included in Bloomberg’s spreadsheets at http://bit.ly/Bloomberg-Fed-Data

32
Table 5: Dollar Liquidity Swap Lines with Foreign Central Banks
Foreign Central Bank (date announced) Number of Transactions
Peak Amount (Billions USD)
Peak Trade Date
European Central Bank (12/12/2007) 271 170.93 Oct 15 2008 Bank of England (09/18/2008) 114 76.31 Oct 15 2008 Bank of Japan (09/18/2008) 35 50.17 Oct 21 2008 Swiss National Bank (12/12/2007) 81 13.11 Jan 13 2009 Danmarks Nationalbank (09/24/2008) 19 10.00 Oct 24 2008 Sveriges Riksbank (09/24/2008) 18 10.00 Oct 15 2008 Reserve Bank of Australia (09/24/2008) 10 10.00 Sep 26 2008 Norges Bank (09/24/2008) 8 7.05 Jan 27 2009 Bank of Korea (10/29/2008) 10 4.00 Dec 2 2008 Banco de Mexico (10/29/2008) 3 3.22 Apr 21 2009 Bank of Canada (09/18/2008) 0 0 - Reserve Bank of New Zealand (10/28/2008) 0 0 - Banco Central do Brasil (10/29/2008) 0 0 - Monetary Authority of Singapore (10/29/2008) 0 0 -
Notes: These data cover the swap agreements that ran between December 1, 2007 and February 1, 2010. Peak amount represents the largest dollar swap transaction under the arrangement. Peak trade date indicates the date the largest swap took place. The central banks of Canada, New Zealand, Brazil, and Singapore did not draw on their swap lines. These data are derived from the Fed’s disclosures at http://www.federalreserve.gov/newsevents/reform_swaplines.htm

33
Table 6: Peak Amount of Debt Owed to the Federal Reserve by Foreign Banks during the Crisis (Billions, USD)
Notes: Peak debt to the Fed is the largest daily outstanding amount owed to the Fed by all banks in a country (in billions of U.S. dollars) during the August 1, 2007 to April 30, 2010 period. The aggregation includes direct foreign bank borrowing from six broad-based Fed facilities—AMLF, CPFF, PDCF, TAF, TSLF, ST OMO—plus borrowing at the discount window. The table does not include indirect borrowing from the dollar swap line program. Data are from the Bloomberg spreadsheets at http://bit.ly/Bloomberg-Fed-Data.
$0
$50
$100
$150
$200
$250
$300
$350
$400 U
nite
d Ki
ngdo
m
Germ
any
Switz
erla
nd
Belg
ium
Japa
n
Fran
ce
Cana
da
Net
herla
nds
Italy
Spai
n
Swed
en
Irela
nd
Bahr
ain
Aust
ria
Denm
ark
Sout
h Ko
rea
Puer
to R
ico
Aust
ralia
Braz
il
Isra
el
Luxe
mbo
urg
Port
ugal
Taiw
an
Mal
aysia
Chin
a
Vene
zuel
a

34
Table 7: U.S. Bank Exposure and Federal Reserve Lending to Non-U.S. Banks
(1) (2) (3) (4) U.S. Bank Exposure
1.320*** (0.178)
1.171*** (0.194)
0.731*** (0.228)
1.227*** (0.260)
GDP
0.000
(0.000) 0.000** (0.000)
0.000 (0.000)
Liquid Liabilities
-0.000 (0.000)
-0.000** (0.000)
-0.000 (0.000)
Global Financial Center
0.086** (0.037)
0.042 (0.034)
U.S. Trade Share
-0.516*** (0.138)
-0.323* (0.162)
Inflation
-0.000 (0.000)
0.000 (0.000)
Dollar Shortage
0.000 (0.000)
Constant -0.002*
(0.001) -0.003 (0.002)
-0.002* (0.001)
-0.009** (0.003)
Observations 160 133 129 32 R-Squared 0.614 0.626 0.806 0.869 P-Value 0.0000 0.0000 0.0000 0.0000 Robust standard errors in parentheses * p < 0.10, ** p < 0.05, *** p < 0.01 Notes: OLS regressions where the dependent variable is peak lending by the Federal Reserve to the banks and non-banks of a foreign country as a share of the Fed’s total peak lending to all foreign banks and non-banks during the financial crisis (see the text for more details).

35
Table 8: U.S. Bank Exposure and the Federal Reserve’s Selection of Dollar Swap Lines
(1) (2) (3) (4) (5) U.S. Bank Exposure 118.967***
(33.817) 137.029*** (46.285)
154.809*** (37.379)
148.454*** (46.113)
76.115*** (22.841)
GDP
-0.000 (0.001)
0.001 (0.001)
0.001 (0.001)
Liquid Liabilities
-0.000 (0.000)
-0.000** (0.000)
-0.000** (0.000)
U.S. Trade Share
-14.603 (14.273)
-8.436 (16.411)
Inflation
-0.609*** (0.182)
-0.800*** (0.277)
-0.351** (0.139)
Dollar Shortage
-0.004 (0.005)
-0.031*** (0.012)
Global Financial Center
4.552** (2.178)
Constant -2.202***
(0.231) -2.129*** (0.245)
-0.592 (0.444)
0.866 (0.824)
-0.310 (0.586)
Observations 149 122 117 32 38 Model probit probit probit probit probit Pseudo R2 0.594 0.622 0.728 0.679 0.600 P-Value 0.000435 0.00195 0.00000591 0.0201 0.00244 Log pseudolikelihood -18.85 -15.66 -9.906 -6.619 -9.761 Wald Chi2 12.38 14.85 32.01 15.02 16.48 Robust standard errors in parentheses * p < 0.10, ** p < 0.05, *** p < 0.01 Notes: Probit models of the binary dependent variable FEDSWAP which equals one when the FOMC selected a country’s central bank for a dollar swap line, zero otherwise. Since the ECB received a swap line for all its members, I code a single observation for the Eurozone and sum (or average, where appropriate) values of covariates for its member countries.

36
Table 9: Probit Analysis of the 2012 Congressional Vote to “Audit the Fed” (H.R.459)
(1) (2) (3) Bank Contributions -78.000***
(26.784) -104.382***
(28.201) -119.695***
(38.941) DW-Nominate
3.484*** (0.825)
3.023*** (0.917)
Bank Headquarters
0.739* (0.397)
Chamber Seniority
-0.066*** (0.022)
Finance Committee
0.023 (0.328)
Constant 0.122
(0.107) 1.642*** (0.369)
1.932*** (0.392)
Observations 191 179 179 Pseudo R2 0.0288 0.116 0.155 P-Value 0.00359 0.00000 0.00000 Log Pseudo-likelihood -128.5 -109.6 -104.9 Wald Chi2 8.481 27.56 36.40 Robust standard errors in parentheses * p < 0.10, ** p < 0.05, *** p < 0.01 Notes: The analysis is of Democrats only since all but one Republican voted for H.R.459. DW-Nominate measures the “left-right” ideology of representatives and ranges from -1 to 1, with higher values indicating a more right-wing ideology. See the text for the definitions of other variables. Sample size drops in Model 2 because DW-Nominate scores for freshman elected in 2010 are not yet available.

37
Figure 1: Total TAF and CPFF Borrowing by Country of the Parent Company
Notes: Reproduced from United States General Accounting Office (2011), Figure 10, p.134.
United States 36%
United Kingdon 17%
Germany 16%
Other Countries 16%
Japan 8%
France 7%
TAF
United States 41%
United Kingdon 18%
Belgium 10%
Switzerland 9%
Germany 9%
Other Countries 7% France
6%
CPFF

38
Figure 2:
Notes: I computed the predicted probability of receiving a swap line from the Fed using Model 5 from Table 8, holding covariates to their means while increasing U.S. BANK EXPOSURE from its minimum to its maximum value.

39
Figure 3: Marginal Effect of Bank Campaign Contributions on Voting to Audit the Fed
Notes: I simulated the predicted probability that a representative would vote “YES” on H.R.459 based on Model 3 from Table 9, holding covariates to their means while increasing BANK CONTRIBUTIONS from its minimum to its maximum value.

40
Figure 4: Marginal Effect of “Ideology” on Voting to Audit the Fed
Notes: I simulated the predicted probability that a representative would vote “YES” on H.R.459 based on Model 3 from Table 9, holding covariates to their means while increasing DW-NOMINATE from its minimum to its maximum value.