The Farmer’s Grain Marketing Guide - AgEcon...
80
January 2004 ER04-01 The Farmer’s Grain Marketing Guide Carl L. German Extension Specialist, Marketing 208 Townsend Hall University of Delaware Newark, Delaware 19717-1303 [email protected] phone: 302-831-1317 -In collaboration with- Linda Smith, Managing Editor, Top Producer, Farm Journal, Inc. & Dr. Art Barnaby, Professor, Department of Agricultural Economics Kansas State University
Transcript of The Farmer’s Grain Marketing Guide - AgEcon...

January 2004 ER04-01
The Farmer’s Grain Marketing Guide
Carl L. German Extension Specialist, Marketing
208 Townsend Hall University of Delaware
Newark, Delaware 19717-1303 [email protected] phone: 302-831-1317
-In collaboration with- Linda Smith, Managing Editor, Top Producer, Farm Journal, Inc.
& Dr. Art Barnaby, Professor, Department of Agricultural Economics
Kansas State University

Cooperative Extension Education in Agriculture and Home Economics, University of Delaware, Delaware State University and the United States Department of Agriculture cooperating. Distributed in furtherance of Acts of Congress of May 8 and June 30, 1914. Delaware Cooperative Extension, University of Delaware. It is the policy of the Delaware Cooperative Extension System that no person shall be subjected to discrimination on the grounds of race, color, sex, disability, age or national origin.
i

Acknowledgements
Funding for this project was provided by the Northeast Center for Risk Management Education, The Delaware Department of Agriculture, and Con Agra. The authors would also like to express their appreciation to the many contributors to this project. Specifically, Charlie Stubbs, Grain Merchandiser, Perdue Farms, Inc. deserves special recognition for his insights into the intricacies of the many marketing alternatives that are available to the grain farmer. His insights were very valuable to the Units written on Cash Marketing Alternatives and Basis.
ii

Prelude
This publication is available as an interactive online e-learning course at <http://agweb.com>. To learn more about the online course click on AgWeb Professional, scroll through the list of Market News advisory services to the bottom of the list to ‘The Farmers Grain Marketing Guide’, listed under the heading On Line Learning. The course covers Market Planning, Cash, Basis, Hedging, Options, Crop Insurance, and Selected Resources. The interactive course is available on a fee basis from <Agweb.com>. This publication contains a descriptive version of the online course. Content questions regarding Units 1-5 and Unit 7 should be directed to Carl L. German, Extension Marketing Specialist, University of Delaware, Phone: (302) 831-1317 or email [email protected]. Content questions regarding Unit 6 should be directed to Art Barnaby, Professor, Agricultural Economics, Kansas State University, Phone: (785) 532-1515 or email [email protected].
iii

Table of Contents
Extension Clause i. Acknowledgments ii. Prelude iii. Introduction 1 Unit 1. Market Planning Introduction 1 Eight Basic Steps to Grain Market Planning 1 Establish Price Objective Based Upon Cost of Production Keep Abreast of Market Developments Learn to Use and Understand Historical and Current Basis Information Select the Appropriate Sales Method Become Familiar With Contract Information and the Language of the Marketplace Plan Sales According to Cash Flow and Income Needs Select a Broker Make Necessary Adjustments Market Planning Summary 4
Worksheet 1: Establishing Grain and Oilseed Maximum Sales Price 5 Objectives Worksheet 2: Establishing Grain and Oilseed Minimum Sales Price 6
Objectives Worksheet # 3: A Checklist for Grain Market Planning 7
Unit 2. Cash Market Alternatives 8 Introduction 8 Cash Sale/Spot/Daily to Arrive 8 How Does the Spot Sale Work? Advantages to the Spot Sale Disadvantages to the Spot Sale Best Time to Use the Spot Sale Test Your Understanding of Cash Sales The Forward Cash Contract 9 How Does the Forward Contract Work? Advantages of Forward Contracting Disadvantages of Forward Contracting Best Time To Use the Forward Cash Contract Test Your Understanding of Forward Cash Contracts The Cash Sale with Deferred Payment 10 Advantages of the Cash Sale with Deferred Payment Disadvantages of the Cash Sale with Deferred Payment Test your Understanding of Cash Sales with Deferred Payment
The Minimum Price Contract 10 How Does the Minimum Price Contract Work? Advantages to the Minimum Price Contract Disadvantages to the Minimum Price Contract Best Time to Use the Minimum Price Contract Test Your Understanding of Minimum Price Contracts Other Cash Market Alternatives 12
The Basis Contract 12 Does the Basis Contract Work? Advantages to the Basis Contract
Disadvantages to the Basis Contract Best Time to Use the Basis contract
The No Price Established Contract 13 The Hedge-to-Arrive Contract 13 How Does the Non-roll Hedge-to-Arrive Contract Work? Advantages to the Non-roll Hedge-to-Arrive Contract Disadvantages to the Non-roll Hedge-to-Arrive Contract Best Time to Use the Hedge-to-Arrive Contract Test Your Understanding of Other Cash Marketing Alternatives Unit 3. Basis: The Economics of Where and When? 14 Introduction 14 Using Basis in Making Grain Marketing Decisions 15 Basis Movement 15 Factors That Affect The Basis 15 Test Your Understanding of the Basis Basis History 16 How to Use Basis Tables; An Example Sample Basis Table Test Your Understanding of Basis History Putting Basis to Work 18 Basis Summary 18 Definitions Test Your Understanding of the Basis Unit 4. Options on Agricultural Futures 19 Introduction 19
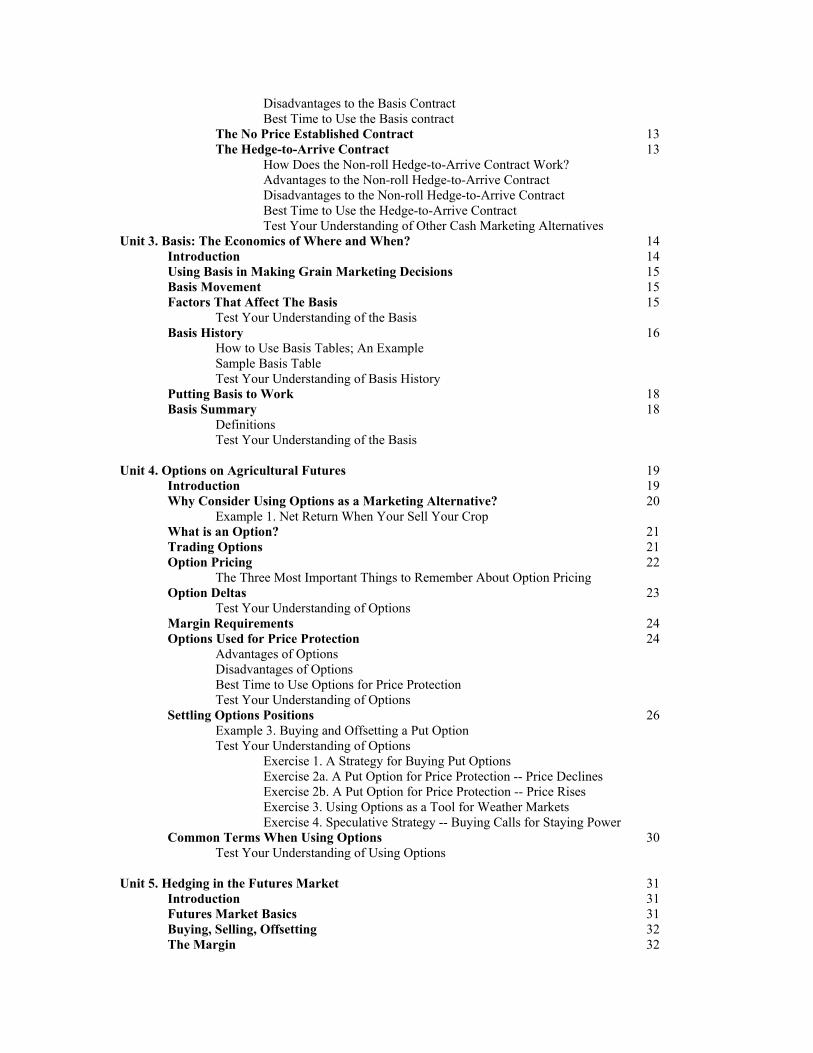
Why Consider Using Options as a Marketing Alternative? 20 Example 1. Net Return When Your Sell Your Crop What is an Option? 21 Trading Options 21
Option Pricing 22 The Three Most Important Things to Remember About Option Pricing Option Deltas 23 Test Your Understanding of Options Margin Requirements 24
Options Used for Price Protection 24 Advantages of Options
Disadvantages of Options Best Time to Use Options for Price Protection Test Your Understanding of Options
Settling Options Positions 26 Example 3. Buying and Offsetting a Put Option Test Your Understanding of Options Exercise 1. A Strategy for Buying Put Options Exercise 2a. A Put Option for Price Protection -- Price Declines Exercise 2b. A Put Option for Price Protection -- Price Rises Exercise 3. Using Options as a Tool for Weather Markets Exercise 4. Speculative Strategy -- Buying Calls for Staying Power Common Terms When Using Options 30 Test Your Understanding of Using Options Unit 5. Hedging in the Futures Market 31 Introduction 31 Futures Market Basics 31 Buying, Selling, Offsetting 32 The Margin 32
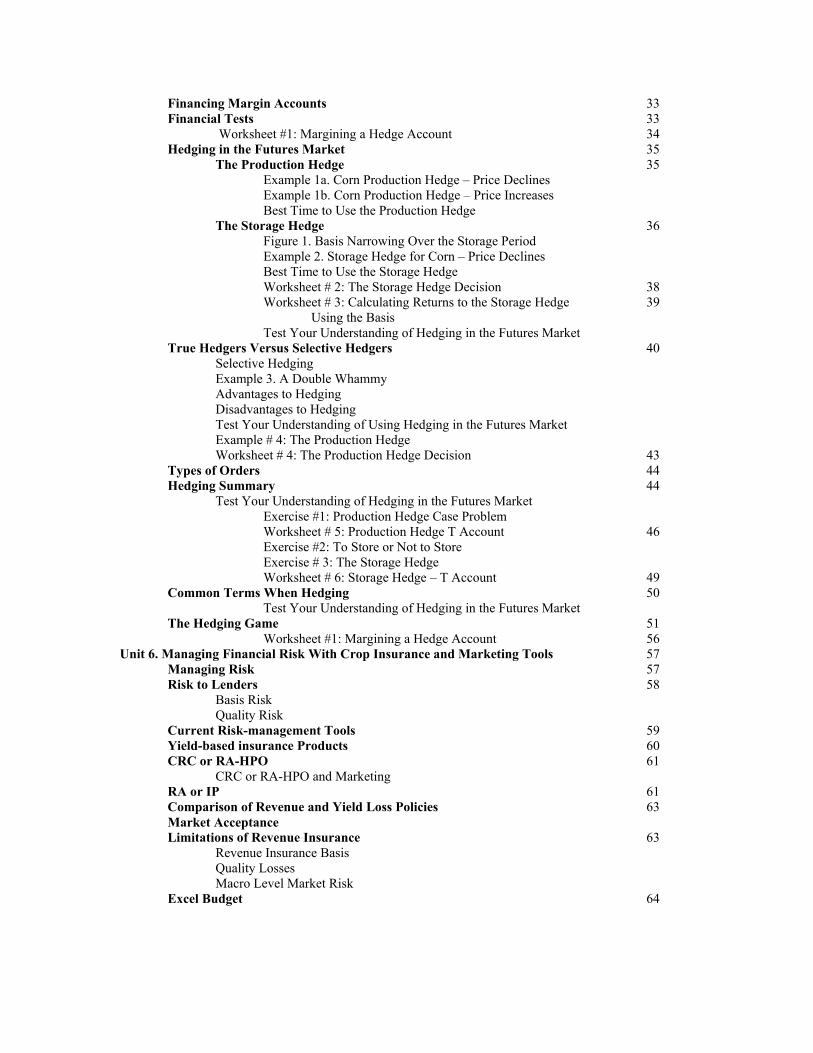
Financing Margin Accounts 33 Financial Tests 33
Worksheet #1: Margining a Hedge Account 34 Hedging in the Futures Market 35
The Production Hedge 35 Example 1a. Corn Production Hedge – Price Declines Example 1b. Corn Production Hedge – Price Increases Best Time to Use the Production Hedge
The Storage Hedge 36 Figure 1. Basis Narrowing Over the Storage Period Example 2. Storage Hedge for Corn – Price Declines Best Time to Use the Storage Hedge Worksheet # 2: The Storage Hedge Decision 38 Worksheet # 3: Calculating Returns to the Storage Hedge 39
Using the Basis Test Your Understanding of Hedging in the Futures Market True Hedgers Versus Selective Hedgers 40 Selective Hedging Example 3. A Double Whammy Advantages to Hedging Disadvantages to Hedging Test Your Understanding of Using Hedging in the Futures Market Example # 4: The Production Hedge Worksheet # 4: The Production Hedge Decision 43 Types of Orders 44 Hedging Summary 44 Test Your Understanding of Hedging in the Futures Market Exercise #1: Production Hedge Case Problem Worksheet # 5: Production Hedge T Account 46 Exercise #2: To Store or Not to Store Exercise # 3: The Storage Hedge Worksheet # 6: Storage Hedge – T Account 49 Common Terms When Hedging 50 Test Your Understanding of Hedging in the Futures Market The Hedging Game 51 Worksheet #1: Margining a Hedge Account 56 Unit 6. Managing Financial Risk With Crop Insurance and Marketing Tools 57 Managing Risk 57 Risk to Lenders 58 Basis Risk Quality Risk Current Risk-management Tools 59 Yield-based insurance Products 60
CRC or RA-HPO 61 CRC or RA-HPO and Marketing RA or IP 61 Comparison of Revenue and Yield Loss Policies 63 Market Acceptance Limitations of Revenue Insurance 63 Revenue Insurance Basis Quality Losses Macro Level Market Risk Excel Budget 64

Unit 7. Selected Resources 71 Electronic Sources of Grain Marketing Information Market News, Quotes, Basis, and Other Information Grain Marketing Discussion Group

Introduction
The purpose of this publication is to serve as a guide for farmers in making every-day grain marketing decisions. Marketing grain effectively is something that can be learned over time. Its importance to farmers cannot be overstated; it is widely held that a 10% increase in price can have a significant impact in improving the bottom line, at times by as much as 200%. This publication provides farmers with a basic understanding of the tools necessary to improve their grain marketing skills and profits. The emphasis is on price-risk-reducing marketing alternatives. A few speculative sales strategies that allow farmers to strive for higher prices are addressed in the unit headed "Options on Agricultural Futures." An occasional mention of other speculative alternatives may be necessary in order to complete a specific discussion. While we have used the word "grain" in this publication, the discussion applies to soybeans as well.
Unit 1. Market Planning
Introduction The grain marketer’s plan is atypical of what one normally thinks about in terms of a marketing plan. The grain marketer’s plan has more to do with market planning as an ongoing process than it does with developing one. The primary reason is that the grain markets and the farmer’s production are ‘moving targets’. Both commodity prices and production outcomes are highly dependent upon weather developments throughout the production and marketing year. Grain marketers are faced with two types of risk: price and yield. Grain marketing alternatives, used properly, provide one mechanism for dealing with these risks. Price risk is dealt with via various methods: forward pricing in the cash market, hedging futures, buying puts for price risk protection, buying calls to replace grain ownership, etc. Yield risk, or fear of a production shortfall, can be handled using put options. It is not necessary to deliver the bushels contracted when using options for price protection. The grain marketer’s plan needs to include taking other steps to assure that all of the bases have been covered. Included is considering participating in the farm program for government target price and loan deficiency payment protection. Also important to a grain marketer’s plan is the consideration of crop insurance. Commodity prices, based upon global supply and demand, are constantly changing, thereby requiring flexibility in formulating a plan for marketing a crop. Due to the nature of commodity markets, the grain marketer’s plan must include the basics that can be used to assist the individual grain marketer in making grain sales and marketing decisions. Yields also can be highly variable. The marketing plan presented in this guide accounts for the fact that grain production and marketing are moving targets. Grain market planning involves collecting and analyzing information that makes for informed decisions that are flexible enough to make necessary adjustments. Eight Basic Steps to Grain Market Planning Establish price objectives based upon costs of production. Price Objectives = acceptable sales prices. Price objectives can be used as indicators in making grain sales. Many times, grain marketers establish minimum and maximum sales price objectives to be used as indicators in making sales through harvest. The minimum price accounts for the cash costs of production and, when covered, allows one to stay in business for the coming year. The maximum includes fixed costs and, when covered, includes profit objectives. (See Worksheet # 1. Establishing Grain and Oilseed Maximum Sales Price Objectives; and Worksheet # 2. Establishing Grain and Oilseed Minimum Sales Price Objectives).
1

It is always a good idea to know the minimum and maximum sales price objectives for the crop being marketed. The objectives help grain sellers to recognize profitable sales opportunities. It is not always possible to achieve profit objectives in commodity markets. It also isn’t always possible to produce the yield that planned price objectives are based upon. When price objectives are not met within a marketing year, the grain seller will find it necessary to either lower their price expectations or, if the commodity outlook suggests, hold the grain for later sale. This can be done by storing grain in a long cash position, holding the cash grain and hedging, or selling the cash grain and purchasing call options to achieve staying power. Costs and basic grain marketing indicators are used to determine which sales method might be appropriate. It is important to note that each crop produced has a marketing horizon of about two marketing years. Grain producers may want to consider crop insurance as a possible avenue for covering possible production shortfalls. Keep Abreast of Market Developments Grain marketers need to become familiar with the indicated price direction for the commodities they are marketing. Since the grain market is a moving target, factors that are affecting the market today may not be relevant tomorrow. Commodity prices can change rapidly. There are two ways in which a grain seller can become acquainted with price direction for specific commodities and begin to anticipate where prices appear to be headed. They are fundamental and technical analysis. Fundamental analysis is used to track the supply and demand for a given commodity. Supply and demand balance sheets are reported monthly for all major commodities grown in the U.S. and world by the United States Department of Agriculture (USDA). Fundamental analysis can be used to gain an appreciation for whether commodity market prices are trending up or down depending upon the indicated supply and usage of the commodity. USDA and University Extension systems are generally good sources of objective information for fundamental analysis. A description for interpreting fundamental analysis can be found at the Commodity Futures Trading Commission (CFTC) Education Resources web site: <http://tfc-charts.w2d.com/learning/index.html>. Monthly supply and demand balance sheets can be obtained at the World Agricultural Outlook Board web site: <http://www.usda.gov/agency/oce/waob/waob.htm>. Technical analysis is based upon price charting and is another method used to anticipate price direction in commodity markets. It is generally a good idea to ‘double check’ whether grain sales should be made at a given point in time by analyzing or getting an analysis of the price chart for the specific commodity. Account Executives/Brokers can be good sources of information for obtaining technical analysis on commodities. A description of technical analysis can be found at the CFTC Education Resources Web site. The address is given above, keyword ‘charts’. Caution. Externalities can have an effect on commodity prices at given points in time and are extremely difficult and sometimes impossible to account for in advance of an event occurring. External factors that impact commodity prices are considered to be those things that happen that were not accounted for when a price outlook was made. An example might be when a firm unexpectedly attempts to corner a market. The attempt is likely to cause a large unexpected price swing. The market generally returns to normal after the Commodities Futures Trading Commission has the opportunity to gather relevant facts and to take corrective action. Externalities can play havoc with the best market planning.
2

Market psychology can also cause price swings in commodity prices from time to time. An example is when ending stocks for a commodity are projected to be below what market traders consider to be normal. Any news that suggests stocks-to-use ratios may be shrinking as a result of weather concerns or strong demand may cause a larger move in price than normal expectations might suggest. Learn to Use and Understand Historical and Current Basis Information Basis is a key indicator in all grain sales decisions. The basis should be considered in making every grain marketing decision. The basis must be understood before grain sales can be made effectively. See “Basis: The Economics of Where and When”. Select the Appropriate Sales Method Grain sellers have numerous marketing alternatives from which to choose. This guide presents the basics regarding the cash market; options, and hedging in the futures market. Tips to choosing the right alternative to fit a sales decision is given in the advantages and disadvantages section of each. Grain sellers need to use a combination of alternatives during the course of a marketing horizon. Price and basis levels and, to some degree, commodity outlooks and technical indicators, assist the seller in selecting the appropriate method for each sale. Become Familiar with Contract Information and the Language of the Marketplace Grain sellers can obtain cash market contract information from local grain dealers. Information pertaining to contract specifications for futures and options can be gotten at the Chicago Board of Trade’s Web Site, go to http://www.cbot.com/, Agricultural Products home page, and click on Contract Specifications. It is important for grain sellers to learn the language of the marketplace. Trading commodities is easier to communicate once one becomes familiar with market lingo. To learn more about the language of the market place go to http://www.cbot.com/, Agricultural Products home page, and click on Glossary of Terms. Plan Sales According to Cash Flow and Income Needs At times it may be necessary to haul grain to market due to the necessity to meet financial obligations. Sometimes a predicted storm can make it necessary to make the proper arrangements to get grain hauled immediately. At other times, it may be necessary to defer income from cash grain sales into the next tax year. The Farm Service Agency (FSA) requires farmers to file the proper forms for harvest and storage delivered grain. It is also necessary to follow FSA rules that apply to beneficial interest for the grain sale in question. Participation in the farm program is highly recommended. Select a Broker Before making transactions in the futures and options markets, you are required to contact a licensed brokerage representative and open an account. It may take some time and effort to find an appropriate broker. Farmers who trade commodities are excellent sources for information pertaining to brokerage firms that they use. However, it is the grain seller’s responsibility to seek out an individual that they are comfortable with. Broker listings are available at the CBOT and National Futures Association (NFA) Web sites (see Selected Resources – Unit 7). Suggested questions to use when selecting a broker for trading agricultural commodities:
• Does the broker have a farm background? If so, what type of farm background (commodities, geographic location, etc)?
3

• Does the broker normally handle hedging or speculative accounts? Are they willing to work on an account that is strictly maintained for hedging purposes?
• Does the broker understand both futures and options? • Does the broker have experience with the commodity that you want to trade? • Does the broker understand fundamental and technical analysis for the commodities in question? • What services does the broker offer? • What are the commission fees and margin requirements?
Experienced traders may eventually choose to trade through a discount brokerage firm for its cost savings. The broker you choose to do business with must be someone who is competent, has knowledge and experience, and provides the service and a commission structure that meet your needs. Make Necessary Adjustments The nature of the grain marketing business requires grain sellers to adjust their market planning accordingly. Sometimes that requires offsetting a position previously taken in options or futures that is later determined to be a bad decision. At other times, it will mean sticking to your decision and seeing a transaction through. For example, futures contracts have a tendency to bid themselves into adverse territory during the life of a contract, making margin calls necessary, only to come back later into profitable territory. Market Planning Summary Grain marketing is as much an art as it is a science, involving an ongoing process. Successful grain marketing requires diligence, knowledge, patience, perseverance, and flexibility. It is up to the individual grain marketer to decide upon the marketing alternatives that best suits their needs. Worksheet 3. A Checklist for Grain Market Planning is provided for the purpose of making notes and recording sales to assist the grain marketer in effective market planning and an orderly marketing experience.
4

Worksheet # 1: Establishing Grain and Oilseed Maximum Sales Price Objectives Procedure 1. Setting Price Objectives Based Upon Total Production Costs Crop __________ __________ __________ - Per acre - A. Yield (Bushels or cwt.) __________ __________ __________ B. Cash Production Costs 1. Lime __________ __________ __________ 2. Fertilizer __________ __________ __________ 3. Seed and Seed Treatment __________ __________ __________ 4. Pesticides __________ __________ __________ a. Insecticides __________ __________ __________ b. Herbicides __________ __________ __________ 5. Spreading __________ __________ __________ 6. Repairs __________ __________ __________ 7. Fuel __________ __________ __________ 8. Hired Labor __________ __________ __________ 9. Machinery Payment __________ __________ __________ 10. Hauling __________ __________ __________ 11. Other __________ __________ __________ C. Total Cash Costs (add 1 to 11) __________ __________ __________ D. Interest on Operating Capital __________ __________ __________ E. Total Cash Costs plus Interest (c + d) __________ __________ __________ F. Fixed Costs
1. Machinery Depreciation (total machine cost X ____ % / acres harvest) __________ __________ __________
2. Machine Interest (1/2 value of machine cost per acre X ____ %) __________ __________ __________
3. Insurance (1.5% of machine cost per acre) __________ __________ __________
4. Land Payment __________ __________ __________ 5. Land Tax __________ __________ __________ 6. (or) Cash Rent __________ __________ __________ G. Total Fixed Costs (add F1 to F6) __________ __________ __________ H. Return to Management __________ __________ __________ I. Total Production Costs (add E + G + H) __________ __________ __________ I. Break-Even Costs/Unit of Production Based Upon Total Production Costs (I / A) __________ __________ __________
The maximum sales price objective is based on the anticipated total costs of production. Sales prices that are achieved at or above this level may represent profitable sales trigger opportunities.
5

Worksheet # 2: Establishing Grain And Oilseed Minimum Sales Price Objectives Procedure 2. Setting Price Objectives Based Upon Cash Production or Out of Pocket Costs Crop __________ __________ __________ - Per acre - A. Yield (Bushels or cwt.) __________ __________ __________ B. Cash Production Costs __________ __________ __________ 1. Lime __________ __________ __________ 2. Fertilizer __________ __________ __________ 3. Seed and Seed Treatment __________ __________ __________ 4. Pesticides __________ __________ __________ a. Insecticides __________ __________ __________ b. Herbicides __________ __________ __________ 5. Spreading __________ __________ __________ 6. Repairs __________ __________ __________ 7. Fuel __________ __________ __________ 8. Hired Labor __________ __________ __________ 10. Hauling __________ __________ __________ 11. Other __________ __________ __________ C. Total Cash Costs (add 1 to 11) __________ __________ __________ D. Interest on Operating Capital __________ __________ __________ E. Custom Costs __________ __________ __________ F. Machinery Payment __________ __________ __________ G. Land Payment and __________ __________ __________ H. Land Taxes or __________ __________ __________ I. Cash Rent __________ __________ __________ J. Return to Management * __________ __________ __________ K. Other __________ __________ __________ L. Total Cash Costs (add C through K) __________ __________ __________ M. Break-Even Costs/Unit Based Upon Cash Costs of Production (L / A) __________ __________ __________ * Include only family living expenses. Prices above the minimum sales price objectives will go toward paying for machinery depreciation and other fixed costs. Achieving minimum sales price objectives helps one to stay in business next year.
6

Worksheet # 3: A Checklist for Grain Market Planning Your Name __________________________________ Date: ___________________ Business Name and Address _________________________________________________________ ____________________________________________________________ ____________________________________________________________ ____________________________________________________________ Commodity: _________________________________ Expected Production (bu., cwt.) Your Share ____________________ Loan Rate _________________ Communicate Plan: ___ Lender 1 ___ Lender 2 ___ Lender 3 ___ Family ___ Adviser(s) ___ Others Personal Goal: ___ Maximize Net Price ___ Minimize Price Risk ___ Maximize Cash Sales ___ Top 1/3 of Market ___ Other (specify) _________________________ Price Necessary to: Cover Cash Costs _________ Cover Total Production Costs _________ Average Local Basis _________ Range in Basis _________ Low to ________ High Price Expectations/Forecast _________ Range in Price Expectations _________ Low to ________ High Marketing Strategy: ________________________________________________________________________________________________________________________________________________________________________________________________________________________________________________________________________________________________________________________________________________________ Date(s) Sales Made and Marketing Alternative Used: Day Amount Sold Sales Method Used ______________________________________________________________________________________ ______________________________________________________________________________________ ______________________________________________________________________________________ Actual Net Price Received: _________ Goal(s) Met ___ Yes ___ No Comments for Future Reference: ________________________________________________________________________________________________________________________________________________________________________________________________________________________________________________________________________________________________________________________________________________________
7

Unit 2. Cash Marketing Alternatives
Introduction Every grain marketing transaction, involving price protection, results in the sale of the physical commodity in the cash market. In other words, all spot, forward cash, futures hedges, options, basis, hedge-to-arrive contracts, etc., are not considered complete until the cash sale is made. This is a key point to remember when we discuss the mechanics of alternatives that employ more than one transaction in the cash, futures, or options markets. The majority of all cash sales do not require any further action in terms of using additional marketing alternatives. Once the cash sale is complete, any further action taken regarding previously sold grain results in the "speculative" use of grain marketing alternatives, futures or options. It is important to remember that the cash sale often represents the best sale that can be made at a given point in time. Deciding when to use the cash sale as the primary pricing method for a given unit of grain, instead of other marketing alternatives, depends on many factors. Most of the factors are quite similar to those used in making all grain sales decisions. This section of The Farmer’s Grain Marketing Guide is designed specifically to help grain producers and marketers understand and use cash marketing alternatives. It describes the cash market alternatives that are available to producers in most grain-producing areas. Each is explained in detail, along with its advantages and disadvantages. Increasing one’s understanding of cash sales alternatives is important in establishing a successful marketing program. Cash Sale/Spot/Daily to Arrive The cash sale of the physical commodity is the most common sales method used by farmers, and is ultimately involved in all grain sales. At times, it is used as a stand-alone transaction; at other times, it represents the completion of a hedge or other strategy. How Does the Spot Sale Work?
• The price for the spot sale is based on the nearby futures contract plus or minus the basis and is stated as a cash price ($/bu. or, in some cases, $/lb. or $/cwt.).
• The farmer agrees to sell a specific quantity of grain at the spot price on the day that the grain is delivered. Note that premiums may be available for special qualities or large volumes. These premiums are negotiated between the seller and the grain merchant.
• Payment for the grain sold may be taken immediately or deferred to a later date.
Advantages of the Spot Sale
• Exact price is known. • Further downside price risk is eliminated for the quantity sold. • Carrying charges are eliminated on the quantity sold. • The sale may be for any quantity of grain.
Disadvantages to the Spot Sale
• Since the price is fixed on the quantity sold, flexibility in pricing is eliminated or greatly reduced. • Because title and control change hands, USDA's Commodity Credit Corporation (CCC) loan and
loan deficiency payment (LDP) are no longer available on the grain.
8

Best Time to Use the Spot Sale
• When the price represents an acceptable profit. • When the basis is stronger than normal (in most regions, a positive basis is highly indicative that
the spot price represents a good sales opportunity). Test Your Understanding of Cash Sales
1. Cash sales are involved in every grain marketing decision? Yes ___ No ___ 2. When making the cash sale, the exact price received is known? Yes ___ No ___ 3. Once the cash sale is made, benefiting from upside price potential in the cash market is
eliminated? Yes ___ No ___ 4. The price offer for the cash sale is based upon the nearby futures contract plus or minus the basis?
Yes ___ No ___ Key: 1. Yes 2. Yes 3. Yes 4. Yes The Forward Cash Contract The forward contract is the second most common way to sell grain. This is a cash contract that allows the farmer to sell a specific quantity of grain for a specified cash price for delivery at a later date. It allows the farmer to set a price for a crop that is to be grown, growing in the field, harvested, or being held for later delivery. How does the Forward Contract Work?
• Forward contracts can be made with a local grain dealer (or end user) any time—before planting, during the growing season, at harvest, or after harvest.
• The contract can be written to allow the seller to take payment at the time the grain is delivered or to defer payment until a later date (see section on "Cash Sale with Deferred Payment").
• Forward contracts are made for a specific price, quantity, and delivery date. Advantages of Forward Contracting
• The exact price is known. • The exact quantity is known. • The date of delivery is known • Downside price risk is eliminated for the quantity contracted. • Any quantity can be contracted. • Premiums can be negotiated for large-volume contracts or special qualities. • Generally, farmers who irrigate can safely contract up to 100% of intended production.
Disadvantages to Forward Contracting
• The seller is obligated to fill the contract, even in the event of a production shortfall, depending on price and local conditions.
• Upside price potential is eliminated on the quantity contracted. • You give up flexibility in choosing your delivery point. • The seller must fill the contract even in the case of a production shortfall. As a result, farmers who
produce crops on dry land generally limit the amount they contract to 50% of intended production; crop insurance or the use of options may boost this amount.
Best Time to Use the Forward Contract
• When the contract price represents an acceptable profit.
9

• When basis is stronger than normal. • When you expect prices to fall.
Test Your Understanding of Forward Cash Contracts
1. A grain seller forward contracts 2,000 bushels of corn at $2.50/bu. for harvest delivery. When harvest time arrives, the price has moved to $3/bu. What is the price the seller receives for the bushels contracted? ___$/bu.
2. Forward contracting allows the grain seller to eliminate downside price risk? Yes ___ No ___ 3. When forward contracting, premiums are sometimes negotiated between the buyer and the seller
for large volume contracts? Yes ___ No ___ 4. When entering a forward contract, the seller is obligated to fill the contract, even in the event of a
production shortfall? Yes ___ No ___ 5. Forward contracting gives the grain seller added flexibility in getting the grain to a delivery point?
Yes ___ No ___ Key: 1. $2.50/bu. 2. Yes 3. Yes 4. Yes 5. No
The Cash Sale with Deferred Payment The cash sale for deferred payment—whether a spot sale or forward contract—is generally used for tax management, to defer income into the next tax year. Advantages of the Cash Sale with Deferred Payment
• The exact price is known. • Payment is taken in the tax year the seller chooses.
Disadvantages of the Cash Sale with Deferred Payment
• Deferred income can present a tax problem in the event production and commodity prices are higher—or income is up for other reasons—in the following year.
• Credit risk: Should the buyer go out of business, the seller may have trouble collecting his or her payment. Some, but not all, states have indemnity funds to protect farmers in the case of elevator bankruptcy, but coverage often is not 100% and the protection does not apply to direct sales to end users such as livestock producers. The credit risk with this contract is less, however, than one with "deferred pricing"—in which the price is not determined at time of delivery.
Test Your Understanding of Cash Sales with Deferred Payment
1. The cash sale with deferred payment is either a type of forward cash contract or spot sale? Yes ___ No ___
2. When making a cash sale with deferred payment the buyer chooses the time that payment is to be made? Yes ___ No ___
3. Deferring income from one tax year to the next always reduces the tax load? Yes ___ No ___ 4. When making a cash sale with deferred payment the exact price is known? Yes ___ No ___ 5. In the event the grain elevator goes bankrupt, the seller is guaranteed to receive full payment for
the bushels contracted using the deferred payment? Yes ___ No ___ Key: 1. Yes 2. Yes 3. No 4. Yes 5. No The Minimum Price Contract The minimum price contract allows the producer to lock in a minimum price and still have the opportunity to take advantage of higher prices that may occur later on. Its effect for the farmer is much like purchasing
10

a put option or selling the cash crop and buying a call option. Like the forward contract, it can be used before planting, during the growing season, at harvest or after harvest. How Does the Minimum Price Contract Work? A specific quantity is sold. The established price is specified as the minimum the seller has to accept. It is the seller’s responsibility to determine whether the minimum being offered is acceptable. The seller chooses a strike price, from which the grain dealer subtracts a fee (the option premium), and adds or subtracts the basis for the delivery month in question to determine the minimum sales price (MSP) offered. The grain dealer is basing this cash contract offer on the purchase of a call option. (If you were to create this strategy in the options market a put option is purchased (strike price – premium cost (+ or -) the basis = MSP). When using the minimum price contract offered in the cash market, the futures price must rise above the strike price by more than the premium cost for the seller to achieve a selling price that is greater than the MSP. Advantages to the Minimum Price Contract
• It reduces downside risk by setting the minimum the seller must accept. • The seller has the flexibility to set a higher price later, if the opportunity arises. • Upon delivery, grain condition and storage risk pass to the grain dealer. • Payment of the minimum price is received upon delivery. • Generally, you can contract for any quantity of grain. In some cases, minimum bushel amounts
may be required. Disadvantages to the Minimum Price Contract
• It is generally the seller’s responsibility to determine whether the basis and premium adjustments made to the futures price are acceptable. This requires the seller to be informed.
• It is generally the seller’s responsibility to notify the grain dealer in the event the futures market price moves above the initial agreed upon strike price to allow the seller to lock in a price above the MSP.
• Seller forfeits any future basis gain. • Seller incurs cost of the price insurance (fee or option premium).
Best Time to Use the Minimum Price Contract
• When a price decline is expected and there is a potential for higher prices to occur later on. • When the MSP is greater than USDA's loan rate. • When the basis offer and fee associated with the contract are appropriate.
Note: It is important for the grain seller to understand that the minimum price contract offered in the cash market is based upon the grain buyer purchasing a call. The minimum price offered to the grain seller = Call Strike Price – the call premium (+ or -) the basis (for the delivery month) = MSP. Therefore, the underlying futures price has to rise above the strike price plus the premium before any additional gain can be achieved from using this contract. Test Your Understanding of Minimum Price Contracts
1. A minimum price contract is offered at $5.50/bu. for soybeans. The option premium to the grain dealer (fee to the seller) is 25¢/bu. The basis is even. What is the strike price? ___ $/bu.
2. What is the minimum sales price the seller receives? ___ $/bu. 3. What price does the futures price have to rise to before the seller can realize any additional gain
from the minimum price contract? ___ $/bu.
11

4. After entering the minimum price contract at $5.50, the underlying futures price rises to $6/bu. What is the price received by the seller? ___ $/bu.
5. After entering the minimum price contract at $5.50, the underlying futures price declines to $5/bu. What is the price received by the grain seller? ___ $/bu.
Key: 1. $5.50 2. $5.25 3. $5.76 4. $5.75 5. $5.25 Other Cash Marketing Alternatives There are three other common cash marketing alternatives: the basis contract, the hedge-to-arrive contract and the no-price established or price-later contract. These contracts are more speculative in nature and some buyers offer them only to selected farmers or at certain times of the year. They may not be available in some grain-producing areas. The Basis Contract The seller locks in an acceptable basis, waiting until a later date to set the futures price component of the contract. The basis contract can be used as the only pricing decision or in conjunction with hedging in the futures market, in which case it is used to reduce the basis risk, which hedging in the futures market does not address. Does the Basis Contract Work? The basis contract allows the seller to lock in the basis offering on a specific quantity of grain. The futures price component is not initially specified and must be specified at a later date. In the event that the price is not specified prior to the expiration of the specific futures contract month, in some cases, the seller may elect to roll the basis contract forward. In the event the contract is rolled forward, the basis offering may be reduced (widened) because of the increase in the carrying charge between the futures contract months for a more distant delivery. For example, if a basis contract that was originally made for January delivery at 15¢ under January is rolled into March delivery, the contract may be rewritten at 20¢ or 30¢ under March. Again, it then becomes necessary for the seller to affix the futures price later. Advantages to the Basis Contract
• When used solely as a cash market alternative, the basis contract allows the seller the opportunity to affix a higher commodity price later.
• The basis contract is widely available. • Can be used to reduce or eliminate the basis risk involved in hedging.
Disadvantages to the Basis Contract
• Seller assumes price risk until the futures price is locked in. • Seller foregoes the opportunity for any further basis improvement. The extreme drought in many
production areas during the 2002 growing season demonstrated that locking in basis too early in the growing season, in what turns out to be a short-crop year, can cost the farmer money if the basis strengthens or improves from the time the contract was made. Therefore, it is important to remember that there are inherent risks in using the basis contract.
Best time to Use the Basis Contract
• When the commodity price is expected to rise. • When the basis bid is stronger than normal.
12

The No Price Established Contract The no price established contract is sometimes used to transfer title of stored grain to the grain dealer at harvest, with the seller and grain dealer agreeing to establish a price later. Ownership transfers to the grain dealer on the delivery date. It allows the seller to defer income. It also allows him or her to take advantage of higher prices later. The seller assumes the price and basis risk. In addition, because title has transferred and the value of the grain is unknown, this strategy carries the greatest credit risk, should the buyer default on payment due to bankruptcy or for some other reason. This contract is only available on a limited basis. The Hedge-to-Arrive Contract This alternative is also available only on a limited basis. The seller is allowed to lock in the futures price, affixing the basis later. Again, there are inherent risks to using the hedge-to-arrive (HTA) contract. Only experienced grain marketers are likely to choose to use the HTA contract when it is available. There are four basic types of hedge-to-arrive contracts, ranging from the relatively simple to the complex:
• Non-roll • Intra-year rolling • Inter-year rolling • Multi-year rolling
The risk exposure to the seller greatly increases as the HTA contract becomes more complex. Following huge losses on HTAs that allowed rolling delivery forward from one crop year to the next, most elevators reduced their offerings to no-roll or intra-year rolls. The scope of this discussion is limited to the non-roll HTA contract. The more complex HTA contracts are highly speculative in nature, and do not limit risk exposure. How does the Non-roll Hedge-to-Arrive Contract Work? The HTA contract allows the seller to lock in the futures contract price and affix the basis later in the marketing season. This type of HTA is the cash-market alternative to hedging in the futures market. The HTA contract requires a specific quantity and quality of grain to be delivered to a specific location at a later date. For example, in mid-June a corn producer decides to sign an HTA based on a December futures contract. The producer elects this contract due to an acceptable price being offered by the market and the basis bid being unusually weak at this point in time. Suppose December corn futures are $2.70 and the current cash bid is $2.60 (basis 10¢ under). The steps involved in an HTA are:
• Producer (seller) sells December corn at $2.70/bu. • Seller expects the basis to be 20¢ over at harvest. • Cash price would be $2.90.
On Oct. 1, the seller delivers the corn.
• December futures price was set at $2.70. • Basis turns out to be 30¢ over December. • Cash price equates to $3/bu.
Notice that if basis turns out to be 20¢ under at harvest, the seller would receive only $2.50. Advantages to the Non-roll Hedge-to-Arrive contract:
• Allows the seller to lock in the futures price, removing the risk of a price decline, yet not risking margin calls if prices rise.
13

• Basis risk is generally smaller and more predictable than price risk.. • Spread risk (the difference between prices in futures contract delivery months) is not involved in
the non-roll HTA contract. • The seller may be able to contract a smaller number of bushels than the 5,000 that would be
involved in a hedged futures position. However, 5,000 bushels units are generally required. Disadvantages to the Non-roll Hedge-to-Arrive contract:
• Seller affixes basis level at a later date and is therefore subject to basis risk, which can be sizeable in certain circumstances (for example, record crop leads to lack of storage space).
• Once price is locked, seller cannot benefit from the possibility of higher prices on the amount contracted.
• Seller gives up flexibility in location of delivery. Best Time to Use the Hedge-to-Arrive Contract
• When a price decline is expected. • When the price level being offered represents an acceptable profit. • When you expect that a better basis bid can be obtained later.
Test Your Understanding of Other Cash Marketing Alternatives
1. A basis contract allows a seller to take advantage of a strong basis offer, leaving the futures price open to lock-in later? Yes ___ No ___
2. Once a basis contract is placed, the seller is assuming the price risk until the price is assigned later? Yes ___ No ___
3. If one prices grain using a hedge-to-arrive contract, no further action is necessary on the seller’s part? Yes ___ No ___
4. When using the HTA, the seller can still benefit from higher prices in the cash market on the bushels contracted? Yes ___ No ___
5. Once a HTA contract is signed, the seller is subject to basis risk? Yes ___ No ___ Key: 1. Yes 2. Yes 3. No 4. No 5. Yes
Unit 3. Basis: The Economics of Where and When Introduction Basis is a key component of all grain marketing and sales decisions. It is the difference between the cash (spot) price and a futures market price at the time and place where delivery is to take place. In the case of grains, the futures price generally refers to the price quoted for a specific delivery month for a commodity traded on the Chicago Board of Trade or other futures market exchanges. Familiarity with the basis usually requires understanding the term and a way to track or record it for various locations. Basis is used in the grain marketing industry as a guide in making marketing decisions. Basis is important to grain and soybean farmers in that it affects and is involved in every grain sale and purchase decision. To effectively use the basis in planning their sales, farmers must have access to an historical basis record. Historical basis records are often available from state Extension systems. Farmers must strive to capture as much of the basis value as possible in order to increase their grain marketing profits.
14

Using Basis in Making Grain Marketing Decisions Basis is a term common to anyone involved in the grain industry, whether they are a farmer, grain merchant, miller, processor, broker, futures trader, etc. It is the difference between the local cash price and the futures price of a particular commodity (basis = cash – futures). The futures price is established in open bidding at the Chicago Board of Trade (corn, soybeans, and soft-red-winter wheat). Locally, the basis bid by grain buyers (end users and handlers) is affected by many factors. While these vary from time to time, and all of the factors are not necessarily reflected in a specific basis bid on a given day, they generally include transportation costs, availability and cost of storage, and local supplies relative to local demand. It takes large volumes of grain to be able to affect many of the grain marketing alternatives that are available to the farmer and to the industry as a whole. It also takes large volumes of grain to be able to affect a basis offer. Better basis bids are sometimes given for large sales volumes. The level of basis bids being offered can and often does adjust frequently. Basis is used throughout the grain industry as an indicator of local supply-demand factors for grain and soybeans. Farmers typically use the basis as their decision indicator to determine the best time to buy and sell grains, the type of marketing alternative to use (futures, options, and/or a cash sale), and when to accept a supplier’s offer or a buyer’s bid. Buyers use the basis to determine the cash price they are willing to offer on a given day and as an indicator to suppliers/sellers as to when the best and worst times might be for the buyer to receive the grain. Basis Movement Basis changes as the factors affecting cash and/or futures markets change. The two terms that are commonly used to describe a changing basis are strengthening and weakening. If basis becomes more positive or less negative, the basis is said to be strengthening; and if the basis becomes less positive or more negative, the basis is said to be weakening (Fig. 1). A strengthening basis occurs when the cash price increases relative to the futures and the cash price is observed as becoming stronger relative to the futures. A weakening basis occurs when the cash price decreases relative to the futures. In this case, the cash price is becoming weaker relative to the futures. Figure 1. Basis Strengthens -30 -20 -10 0 10 20 30 The basis becomes more positive (moving from left to right). Factors That Affect The Basis The factors that may have an effect on the basis are many and can vary greatly from year to year. Yet, the basis is not generally anticipated to change within the course of a marketing year nearly as much as the price level. Therefore, basis movement is generally more predictable than price level changes, within the framework of a marketing year. The factors impacting basis vary from one location to another, as basis varies from one location to the next. Typically, the factors that affect the basis include:
• Supply and demand – Basis is typically stronger in a given location when the available supply is scarce relative to demand. It is generally weaker when an area is experiencing ample or abundant production and availability.
• Inverse carrying charge market -- The market situation is considered to be at a discount with distant futures contract months selling at a discount to the near months. The underlying reasons commonly given for an existing discount market include an immediate strong demand, a short crop, or a large potential harvest following tight current supply. The basis is generally very strong in an inverse market. Cash sales are generally warranted.
15
• Transportation – The availability and costs of transporting the crop at harvest or during the marketing season can affect the basis. Rail, trucking, and shipping rates can affect the basis, as can road or river closings due to bad weather.
• Storage availability – When the demand for storage space exceeds the available supply, the basis will weaken.
• Stockpiling – Placing grain on the ground (in years of surplus) is expensive, risky, with increased handling costs.. This will weaken the basis.
• Storage costs – Generally are affected by the cost of money and the rate of inflation. If either increases, the basis for future sales will weaken.
• Seasonality – A short harvest season coupled with large production can cause the basis to weaken. Conversely, once the harvest "glut" is over, basis often strengthens.
• Location – Moving grain from point A to B costs money and long hauls are expensive. Grain that is grown closest to an end-use buyer typically has a stronger basis offer than that which has to be hauled to the point of use. Terminal elevators at shipping points on the ocean or major rivers also often have a stronger basis than buyers in remote locations.
• Protein supply/crop condition – Grain crops sometimes have quality problems that can cause the basis to weaken—or that lead to better offers for better quality.
• Industry consolidation – Has become common to almost every US industry, particularly within the last decade. End users such as exporters, livestock producers, and poultry processors are likely to become fewer and larger in the future. As the grain industry consolidates, the basis is likely to weaken over time, reflecting less competition.
• Uncertainty/psychology – From time to time, grain buyers are faced with conflicting crop reports or other pending news that can cause surges in grain prices (up or down). At those times, buyers are likely to take protection, which tends to change the basis for short periods of time.
Basis, the relationship between cash and futures prices, tends to be fairly steady while prices often fluctuate greatly. For example, it is not uncommon to find a production area where basis has changed for December corn by a total of 70¢/bu. over a period of time and the futures price has changed over $2/bu. or more over the same time period. Test Your Understanding of the Basis
1. Basis is the relationship between the nearby futures contract price and the spot (cash) price? Yes ___ No ___ Sometimes ___
2. The formula for calculating the basis is basis = cash – futures? Yes ___ No ___ 3. Grain sellers use basis as an indicator in deciding when to make grain sales? Yes ___ No ___ 4. Supply and demand for a specific commodity is the only factor that affects basis? Yes ___ No ___ 5. A rise in storage costs is likely to weaken or widen the basis? Yes ___ No ___
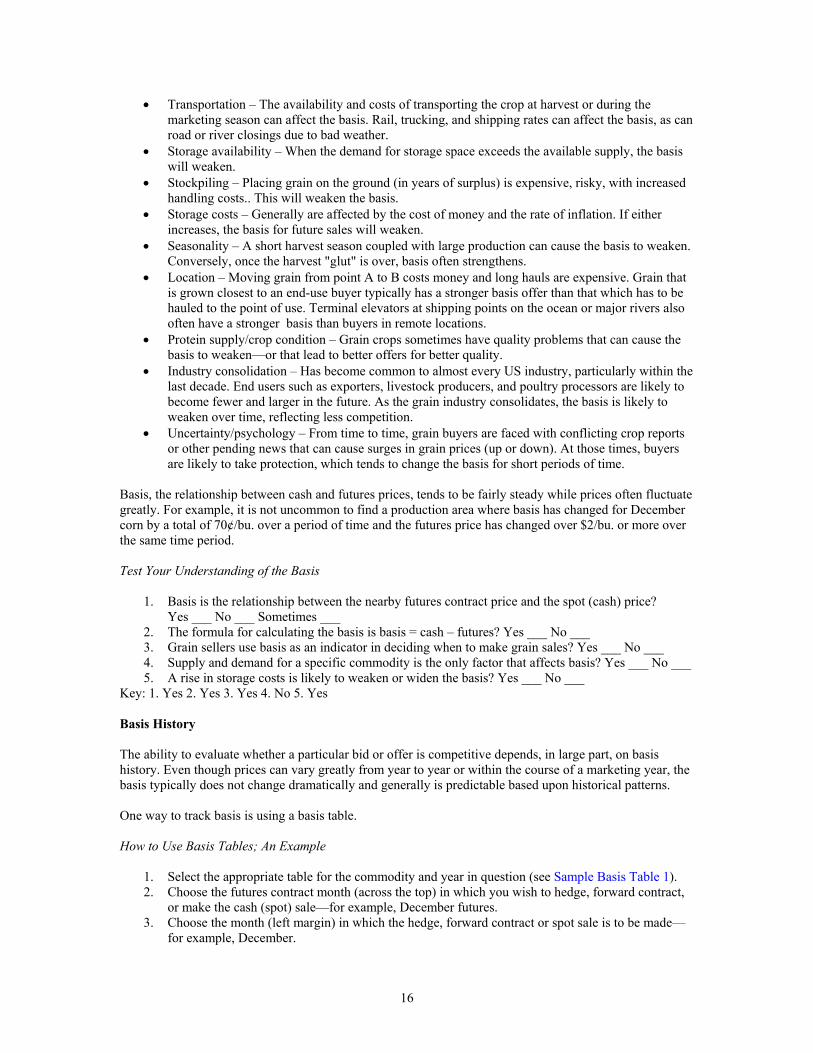
Key: 1. Yes 2. Yes 3. Yes 4. No 5. Yes Basis History The ability to evaluate whether a particular bid or offer is competitive depends, in large part, on basis history. Even though prices can vary greatly from year to year or within the course of a marketing year, the basis typically does not change dramatically and generally is predictable based upon historical patterns. One way to track basis is using a basis table. How to Use Basis Tables; An Example
1. Select the appropriate table for the commodity and year in question (see Sample Basis Table 1). 2. Choose the futures contract month (across the top) in which you wish to hedge, forward contract,
or make the cash (spot) sale—for example, December futures. 3. Choose the month (left margin) in which the hedge, forward contract or spot sale is to be made—
for example, December.
16

4. The figure corresponding to the contract month and the calendar month will be the correct historical basis to use in making the grain marketing decision at this location—for example, the basis for December futures and the December calendar month in the sample basis table is 11¢ over December (meaning the cash price, historically, is 11¢ greater than the futures price).
Note: Historical basis tables can also be used to calculate returns to options positions or production and storage hedges, discussed in the other units in this guide. The basis is used to localize the futures price.
Sample Basis Table 1. Northern Eastern Shore Average Corn Basis; Marketing Years 1996/97 – 2000/01
Futures Contract Month September December March May July August 13 10 0 -6 -10 (3 to 19) (-3 to 45) (-15 to 38) (-23 to 33) (-31 to 33) September 16 13 2 -4 -9 (-3 to 33) (-9 to 24) (-21 to 16) (-28 to 10) (-35 to 9) October 3 -6 -11 -18 (-21 to 16) (-31 to 7) (-39 to 10) (-47 to –2) November 4 -5 -12 -17 (-30 to 24) (-41 to 13) (-49 to 7) (-56 to 3) December 11 4 -2 -8 (-25 to 29) (-32 to 21) (-39 to 14) (-47 to 9) January 17 11 6 (-11 to 31) (-19 to 24) (-27 to 20) February 19 13 8 (-11 to 30) (-19 to 23) (-27 to 24) March 19 14 8 (-10 to 29) (-16 to 26) (-24 to 20) April 16 9 (-1 to 22) (-8 to 19) May 21 13 (16 to 30) (-4 to 22) June 14 (5 to 25) July 8 (-15 to 23) Source: University of Delaware Basis = Cash – Futures Price data: MD Grain & Livestock Report A basis bid stated as a positive number in the table means that the cash price is above the futures price for the time period recorded. This is typically referred to as a "premium market". A basis bid stated as a negative number in the table means that the cash price is below the futures price. Test Your Understanding Basis History
1. Historical basis records are necessary for determining whether current basis bids are acceptable? Yes ___ No ___
2. What is the historical basis record for corn to be harvested in the month of October, given in the sample basis table? ___ ¢/bu.
3. What is the historical basis for corn to be harvested in the month of September for the December futures contract? ___ ¢/bu.
4. What is the range in basis for corn to be harvested in the month of September for the December futures contract? ___ to ___ ¢/bu.
5. A basis bid of -15¢ for corn to be harvested in September for the December futures contract is better than usual in the Basis Table we show? Yes ___ No ___
Key: 1. Yes 2. +3¢/bu. 3. +13¢bu. 4. -9 to +24¢/bu. 5. No
17

Putting Basis to Work Knowing the usual basis and basis patterns for commodities that are bought and sold, within a given production area, can help a farmer make informed grain-marketing decisions. Basis is used regularly by grain traders and sellers for a variety of reasons:
• To localize a futures price Localized Futures Price – the expected cash price at delivery. The localized futures price is determined by adding or subtracting the anticipated basis to a specific futures price e.g., December Corn Futures $2.74 Basis (+ or -) +. 30 = Localized Futures Price $3.04
• To accept or reject a given price Historical basis information can help you decide whether a particular cash bid is attractive or whether it is better to hedge the price risk and wait for the basis to improve. An example might be during a harvest season when the basis being bid for new crop corn is weak (-30¢) and the historical record indicates that by storing and hedging, a 30¢ or 40¢ gain in the basis is possible to achieve. Another example is a spot sale at harvest that represents a very strong basis (30¢ over December). The historical record may indicate that a 20¢-over basis is more common during this time period. In this case, the market is telling the seller to make the sale now.
• Deciding which buyer or seller to use Cash market bids typically represent different basis levels being offered by different buyers. Grain sellers can sometimes receive better basis offers by calling and checking with several buyers. The price offer the seller receives can sometimes be improved in this manner. As the basis bid becomes more positive, the price offering to the seller and the profit potential improves.
• When to sell, store, or purchase a crop Does the current price offer reflect the average basis or is it stronger or weaker than normal? If the average basis in the month of September, from the historical record, is found to be 13¢ over December and the current basis offer is 45¢ over December, the local market is indicating strongly that an immediate sale is warranted.
• When to place or lift a hedge If the basis is weak during harvest, and basis improvement is likely to occur over the storage period (indicated by a basis bid of –30¢ under March at harvest for new-crop corn, for example), it may be wise to store grain and hedge. When the basis has improved (19¢ over March, for example, perhaps in February), it could be a sign to deliver and lift the hedge. Basis Summary Basis is simply the price difference between the local cash price of grain and the futures price. All grain sales and purchase decisions revolve around the basis. Profits can be improved considerably when marketing grain by learning to use the basis as a key indicator in all grain sales decisions
18

Definitions Inverse Carrying Charge – The market situation is considered to be at a discount with distant futures contract months selling at a discount to the near months. The underlying reasons commonly given for an existing discount market include an immediate strong demand, a short crop, or a large potential harvest following tight current supply. The basis is generally very strong in an inverse market. Cash sales are generally warranted. Localized Futures Price – the expected cash price at delivery. The localized futures price is determined by adding or subtracting the anticipated basis to a specific futures price e.g., December Corn Futures $2.74 Basis (+ or -) +. 30 = Localized Futures Price $3.04 If the delivery month in question is March, then the expected cash price at delivery is computed using that futures delivery month. The basis to be added or subtracted generally comes from the historical record. Test Your Understanding of the Basis 1. A grain seller makes a cash (spot) sale at $2.70/bu. when the nearby futures price is $2.50/bu. What is
the basis? ___/bushel 2. A weak basis at harvest may be an indication that the grain should be stored and hedged? Yes ___ No
___ 3. Basis is not a key indicator in making grain sales decisions? Yes ___ No ___ 4. A specific futures price plus or minus the basis = the localized futures price? Yes ___ No ___ 5. A basis bid stated as "30 over" means that the cash price is above the futures price? Yes ___ No ___ Key: 1. + 20¢bu. 2. Yes 3. No 4. Yes 5. Yes
Unit 4. Options on Agricultural Futures
Introduction Options on agricultural futures became available in 1983. Since then, options have become a common sales tool for grain sellers. A corn grower might buy a put option in June to establish a minimum selling price for the growing crop, while still retaining the opportunity to profit from a higher price that might occur over the course of the growing season. Other possibilities using options include buying a call option, or writing (selling) an option to enhance the net price received in the cash grain market. Options are also sometimes used to protect an expected government payment. Some of these uses are speculative in nature and are best considered by only the most savvy of grain marketers. The primary focus here is the price-risk-reducing uses of options. Some of the speculative uses of options are presented because they are commonly recommended to farmers by the grain trade and involve limited risk compared with taking positions in the futures market. It is important for grain sellers to know the difference. Those needing assistance in using options and in defining options strategies are encouraged to contact marketing educators. Options offer an alternative to futures hedging and forward contracting. Like futures hedging and forward contracting, buying options provides price protection. Unlike the other strategies, buying options does not involve a price commitment. Farmers, as grain sellers, can employ options to establish a minimum price for their crops months in advance without giving up the chance to profit from a price increase. Learning to use options provides an excellent opportunity for a grain seller to become familiar with the marketing opportunities that are directly
19

tied to the futures market while having limited risk exposure. The risk involved in using options is limited to the premium or the cost of the option. It is further noted that as long as the government employs loan rates, some feel the use of options for price protection purposes is somewhat limited. The loan rate offered in a given location is commonly considered in the grain trade as a ‘free’ put option for the grain seller. Nevertheless, it is important to obtain a basic understanding of options on futures before one ventures or graduates to hedging in futures. Why Consider Using Options as a Marketing Alternative? Grain sellers have three basic types of forward-pricing alternatives available: cash contracts, hedging in the futures market, and options. Options are noted as providing a limited-risk method of pricing crops. Options are also noted as not likely to provide the best possible net price per bushel when a price decline occurs. Example 1. Net Return When You Sell Your Crop
(Basis = 20¢ under) If Dec. futures Hedge or Do price in Nov. is Buy $2.40 Put forward Nothing for 25¢ contract premium @ $2.40 Dec futures $2.10 $1.95 $2.20 $1.90 $2.20 $1.95 $2.20 $2.00 $2.30 $1.95 $2.20 $2.10 $2.40 $1.95 $2.20 $2.20 $2.50 $2.05 $2.20 $2.30 $2.60 $2.15 $2.20 $2.40 $2.70 $2.25 $2.20 $2.50 $2.80 $2.35 $2.20 $2.60 $2.90 $2.45 $2.20 $2.70 $3.00 $2.55 $2.20 $2.80 This example illustrates put options' effect on profitability and how buying puts compares to hedging, forward contracting, and/or doing nothing. When buying a put with a $2.40 strike price – 20¢ basis – 25¢ premium, the minimum sales price that one can receive in the event of a price decline is $1.95/bu. However, as the December futures price increases above the $2.40 strike price, the return from the option begins to perform better than the $1.95 MSP established. The hedge or forward contract is outperformed at the $2.70 December futures price. Of course, one can readily see that in the event the price keeps rising, the purchase of the put option continues to outperform hedges and forward contracts. Doing nothing is the best alternative in the event that the futures price rises above the $2.40 strike price. It is only when the December futures price falls to $2.10/bu. that the put option outperforms doing nothing. Hedging and forward contracting outperform doing nothing when the December futures price is at $2.30 or less. This example simply illustrates the impact that a change in the futures price has on various contracting alternatives. Within a given marketing year, it often is necessary to use a combination of pricing strategies to do an effective job of marketing. Prices and basis levels often change. Sales decisions are made easy when desirable profit levels can be achieved and the market is operating under normal circumstances. The difficulty comes when prices, basis levels, and market fundamentals change within the context of a given marketing horizon. The commodities market should always be thought of as a moving target.
20

Perhaps the best reason to consider the use of options as a pricing mechanism is the flexibility an option affords a grain seller. Using options is typically compared to buying insurance. When using options to provide price protection, the farmer is guaranteeing a minimum price for a commodity while leaving upside price potential open. Options offer an alternative to hedging in futures and forward contracting. Buying options provides price protection; the option works to insure either the MSP for puts or the MBP for calls. Unlike futures hedging and forward contracting, buying options does not involve a price commitment. Unlike forward contracting, buying options does not involve a delivery commitment. Options are also used for price speculation. Farmers sometimes buy call options (offering a long futures position) to garner ‘staying power’ in the market (in place of storing grain). Another speculative use might be ‘to protect a government payment’. Speculative uses of options require caution on the user's part. Proper timing is imperative in order to achieve a profit. Furthermore, all of the rules that apply to the speculative uses of futures markets apply to the use of options. Among them, for every profit achieved by an individual using options there is another individual who acquires a loss. The two primary uses of options on futures described in this guide are as a way to establish minimum selling price(s), and as a method to achieve ‘staying power’ in the market. The following sections of this unit explain what options are and how they work. What is an Option? An option is a choice. An option buyer acquires the right, but not the obligation, to sell (for puts) or buy (for calls) a commodity under specific conditions in exchange for the payment of a premium. A put option gives the right to sell the underlying commodity. For example, a grain seller who buys a November put option on soybeans for a $7 strike price has the right to sell soybeans in the futures market at $7/bu. until a specified date a few weeks before the November futures contract expiration date. If the market price for soybeans at harvest is only $6, the put is worth about $1/bu. The farmer-owner can exercise the option or sell it. Conversely, if soybeans were bringing $8/bu. at harvest, the farmer would not exercise the right to sell at only $7. The option is allowed to expire worthless so that the seller can take advantage of the higher price, minus the premium cost and commission. Trading in put options is completely separate from trading in call options. Puts are used to provide price protection against declining prices and call purchases are used to protect against rising prices. Trading Options Options are traded on organized, regulated exchanges. Options for corn, SRW wheat, and soybeans are traded at the Chicago Board of Trade. Options for HRW wheat are traded at the Kansas City Board of Trade. At any given time, you can buy or sell puts and calls at a number of strike prices. Strike prices are given in per-bushel increments—generally 20¢ increments for soybeans and 10¢ increments for corn and wheat options. At times, soybean strike prices can be requested in 10¢ increments. Premiums are quoted in one-eighth increments. A premium reading as 25.5 would be 25 4/8¢/bu. Option quotes can be obtained on either a 10-minute time delay or in real time from various sources on the Internet. Some market information sources require the user to pay an annual subscription fee. To view options quotes go to <http://www.agweb.com/>. Options are traded the same way as futures contracts, via open outcry of competitive bids and offers. Public orders to buy and sell options also are handled the same way as futures contracts. You call a broker who
21

handles futures markets transactions. Once an order is received on the trading floor, it is immediately relayed to a broker in the appropriate trading pit for execution. Upon execution, a confirmation and details of the transaction are promptly communicated to the customer. Before trading can begin it is necessary to complete the appropriate forms. A broker/account executive can assist. See Unit 1 Market Planning – Selecting a Broker for further information. Option Pricing The determination of option premiums is explained in two parts for ease of understanding and illustration. The first part addresses the value of an option at expiration. The second part explains how premiums are arrived at on a day-to-day basis during the time prior to expiration. Figuring the option premium at expiration is simple: An option’s value at expiration will reflect whatever amount of money the holder could realize by exercising or offsetting the option. If nothing can be realized, the option has no value and it expires worthless. During the life of the option contract, intrinsic value + time value = premium. The time value is the sum of money that buyers are currently willing to pay for a given option in the anticipation that over time a change in the underlying futures price will cause the option to increase in value. At expiration there is no time value in so far as there is no remaining time.
Option Time Value
00.050.1
0.150.2
0.250.3
June Ju
ly
Augus
t
Septem
ber
Octobe
r
Novem
ber
Decem
ber
An option that has no intrinsic value and only time value remaining will erode in value as the date of expiration for the underlying future approaches. Due to the time value, option buyers are generally encouraged to offset their option positions 30 to 45 days prior to the date of expiration of the underlying futures contract. This allows the option buyer to recover part of the premium cost before the option expires. Basically, two factors affect an option's time value:
1. The length of time remaining until expiration 2. The volatility of the underlying futures price
All else being equal, the more time an option has remaining until expiration, the higher its premium. As expiration approaches, the option’s time value will erode. This is why options are sometimes called ‘wasting assets’. Intrinsic value – This is the amount of money, if any, that could be realized by exercising or offsetting an option with a given strike price. A put option has intrinsic value if its strike price is above the current futures price. For example, if a corn put option has a strike price of $3/bu. and the underlying futures price is $2.70/bu., the put option has an intrinsic value of 30¢/bu. The inverse is true for call options.
22

Grain sellers usually offset their options rather than exercising them. A grain seller who buys a $3 December put in June is likely to offset the option during early November (or sooner) as long as it has intrinsic value. The option may also be offset at this time to take advantage of remaining time value. Options that expire worthless are not worthwhile to offset or exercise. When an option expires worthless, the option buyer forfeits the entire amount of the premium paid. An option’s value at expiration is equal to its intrinsic value, the amount by which it is in the money. This holds true for puts and calls. Volatility — Option premiums are generally higher during periods of volatile futures prices. There is more price risk associated with market volatility and therefore a greater need for price protection. Therefore, the cost of obtaining the insurance associated with options is greater and the premiums are higher. The intrinsic value of an option has a better chance of increasing when futures are volatile than when prices are relatively stable, and buyers are willing to pay more for the option. At the Money – When the option strike price and the underlying futures price are equal, the option is at the money. At-the-money-options do not have intrinsic value and expire worthless. In the Money – An in-the-money option has intrinsic value. It is worth offsetting. Out of the Money – A put option is out of the money if the futures price is above the option strike price. For example, if the corn futures price were currently at $3.50/bu., a put option with a strike price of $3/bu. is out of the money by 50¢/bu. An out-of-the-money option has no intrinsic value. An option that is out of the money at expiration is allowed to expire worthless. The Three Most Important Things to Remember About Option Pricing:
• At expiration, an option can only have intrinsic value (the amount that can be realized by offsetting or exercising the option). An option with no intrinsic value at expiration expires worthless. In the event that an option buyer exercises the right to acquire a particular futures position at the option strike price, an opposite futures position is assigned to someone who has sold (written) an option.
• Prior to expiration, an option’s premium consists of intrinsic value (if any) plus time value. An option premium with no intrinsic value prior to expiration consists only of remaining time value. Therefore, options are generally offset 30 to 45 days prior to expiration to take advantage of any remaining time value.
• Intrinsic value + time value = option premium.
Option Deltas The term delta has to do with change. In the case of options, it has to do with the change in the option premium in response to a given change in the underlying futures price. The delta factor can be thought of as the measure between the relationship between the premium and the underlying future. The delta factor answers the question, “How many options contracts does it take to equal an equivalent position in the futures market?” In the case of an option (either put or call) that is deep in the money and no longer has time value (only intrinsic value), the relationship is likely to be one to one as a favorable change in the futures price increases the option’s intrinsic value and therefore, its premium. This means that the option has a delta of 1.0, such that for every 1¢ gain in the underlying futures contract, there is a corresponding 1¢ gain in the option. A delta of .5 means a 1¢ change in the futures price would result in only a 1/2¢ change in the option premium.
23

Test Your Understanding of Options
1. The risk involved when using options for price protection is limited to the premium? Yes ___ No ___
2. Put options are purchased to insure the minimum sales price for a commodity? Yes ___ No ___ 3. Options can be used for price speculation to garner staying power in the market? Yes ___ No ___ 4. Options for corn are traded at the Kansas City Board of Trade? Yes ___ No ___ 5. An in the money option does not have value? Yes ___ No ___
Key: 1. Yes 2. Yes 3. Yes 4. No 5. No Margin Requirements Buying options requires the buyer to deposit good faith money in the form of the premium cost of the option. Other than the premium paid, no margin account is required. The cost of the premium is the amount that the option buyer can lose on the option position. Margining rules are different for option sellers (writers). Option sellers must margin their accounts. Since option sellers face the same risk as participants in the futures market (hedgers and speculators), they must deposit and maintain adequate funds in a margin account to cover potential losses on a day-to-day basis. Options Used for Price Protection Either of the two kinds of options can be used for price risk protection:
1. Puts 2. Calls
The put option, used to establish minimum selling price(s), gives the buyer the right, but not the obligation, to sell ("go short") a particular futures contract at a specified price at any time during the life of the option. The buyer has the right to sell the underlying futures contract at the option strike price. The buyer of a put obtains protection against declining prices, virtually the same as if hedged in futures, without giving up the opportunity to benefit from higher prices. Generally, if forward contracting is used, the opportunity to benefit from higher prices is foregone. One of the main differences between buying options for price protection compared with hedging futures or using forward contracts is the cost of the premium involved in buying an option. A call option gives the option buyer the right, but not the obligation, to buy ("go long") a particular futures contract at a specified price at any time during the life of the option. The buyer of a call option has the right to buy the underlying futures contract at the option strike price. The buyer of a call obtains protection against rising prices, virtually the same as hedging futures, without giving up the chance to benefit from lower prices. Livestock producers can buy calls to protect against rising feed costs. Crop producers sometimes use call options to "re-own" grain that they have already sold, though this is regarded as a speculative use of call options because the producer no longer has the cash commodity to "protect." Advantages to Using Put Options for Price Protection
• Establishes a minimum sales price for a given amount of a commodity while retaining the opportunity to benefit from higher prices.
• The minimum price is known to the extent that basis may vary. • Offers a limited-risk marketing alternative; the buyer's loss is limited to the amount of the
premium paid when buying the put. • In the event of a production shortfall, delivery of the bushels contracted is not required; the option
is simply sold or allowed to expire. • Due to the limited risk involved, options offer a good tool for learning about risk-management
marketing alternatives other than those offered by the cash market.
24
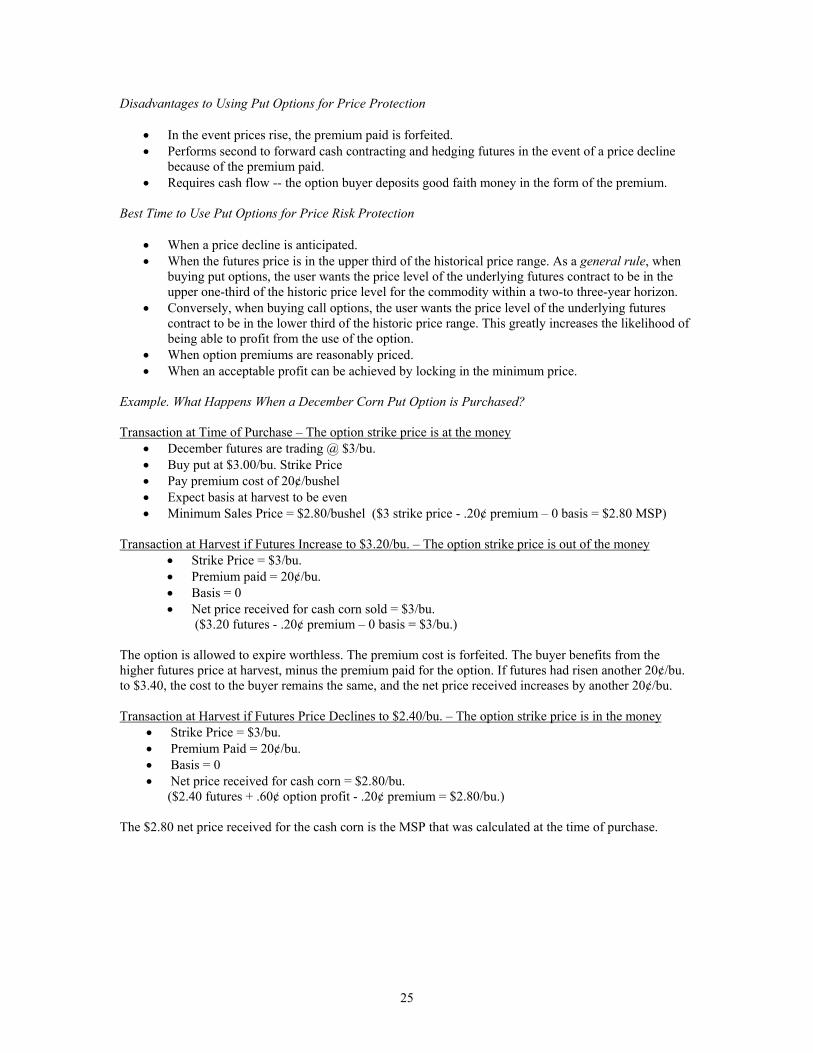
Disadvantages to Using Put Options for Price Protection
• In the event prices rise, the premium paid is forfeited. • Performs second to forward cash contracting and hedging futures in the event of a price decline
because of the premium paid. • Requires cash flow -- the option buyer deposits good faith money in the form of the premium.
Best Time to Use Put Options for Price Risk Protection
• When a price decline is anticipated. • When the futures price is in the upper third of the historical price range. As a general rule, when
buying put options, the user wants the price level of the underlying futures contract to be in the upper one-third of the historic price level for the commodity within a two-to three-year horizon.
• Conversely, when buying call options, the user wants the price level of the underlying futures contract to be in the lower third of the historic price range. This greatly increases the likelihood of being able to profit from the use of the option.
• When option premiums are reasonably priced. • When an acceptable profit can be achieved by locking in the minimum price.
Example. What Happens When a December Corn Put Option is Purchased? Transaction at Time of Purchase – The option strike price is at the money
• December futures are trading @ $3/bu. • Buy put at $3.00/bu. Strike Price • Pay premium cost of 20¢/bushel • Expect basis at harvest to be even • Minimum Sales Price = $2.80/bushel ($3 strike price - .20¢ premium – 0 basis = $2.80 MSP)
Transaction at Harvest if Futures Increase to $3.20/bu. – The option strike price is out of the money
• Strike Price = $3/bu. • Premium paid = 20¢/bu. • Basis = 0 • Net price received for cash corn sold = $3/bu.
($3.20 futures - .20¢ premium – 0 basis = $3/bu.) The option is allowed to expire worthless. The premium cost is forfeited. The buyer benefits from the higher futures price at harvest, minus the premium paid for the option. If futures had risen another 20¢/bu. to $3.40, the cost to the buyer remains the same, and the net price received increases by another 20¢/bu. Transaction at Harvest if Futures Price Declines to $2.40/bu. – The option strike price is in the money
• Strike Price = $3/bu. • Premium Paid = 20¢/bu. • Basis = 0 • Net price received for cash corn = $2.80/bu.
($2.40 futures + .60¢ option profit - .20¢ premium = $2.80/bu.) The $2.80 net price received for the cash corn is the MSP that was calculated at the time of purchase.
25

Test Your Understanding of Options
1. Using options for price protection is likened to buying price insurance? Yes ___ No ___ 2. In the event of a price decline, put options perform second to forward contracting and hedging
futures because of the premium paid? Yes ___ No ___ 3. The purchase of a put option allows the buyer to benefit from higher prices should they occur?
Yes ___ No ___ 4. The use of options requires the buyer to deposit good faith money in the form of the premium?
Yes ___ No ___ 5. The purchase of a put requires bushels to be delivered in the event of a production short fall? Yes
___ No ___ Key: 1. Yes 2. Yes 3. Yes 4. Yes 5. No
Settling Options Positions Option buyers have three courses of action that they can follow when it is time to settle their options positions. They can offset, exercise, or allow their options positions to expire. The action to be taken depends upon whether the option is in, at, or out-of-the money.
1.Offset – In the case of a put option, where the producer originally buys a put, the owner of the put sells it in order to close the position. In the case of a call, where the option buyer initially buys a call, the owner sells the call to offset or close the position. Options that are offset are in-the-money options that represent a profit to the buyer of the option. 2.Expire – The buyer can allow the option to expire. This often happens when the option buyer loses money in the option position, yet makes up the difference minus the premium cost in the cash commodity. An option that is allowed to expire is worthless and is typically out-of-the-money. 3.Exercise – The action taken by the buyer (holder) of an option who wishes to acquire a position in the underlying futures contract at the option strike price. Option buyers seldom choose to exercise; typically, the option is offset, thereby taking the profit earned.
Example: Buying and Offsetting a Put Option
This example illustrates buying a put option to establish protection against a decline between May and October. The illustration is presented in two parts. In May, a $3 December corn put option is bought and in October, it is offset (sold). Prices do not change in this example. Note the simultaneous cash and options market transactions and the corresponding basis relationship. Date Cash Options Basis May Min. selling price Dec. futures $3 -.20 Strike price $3.00 Buy $3 Dec. (expected) Exp. basis -.20 corn put @ $.18 Option premium -.18 = Est. MSP $2.62
October Sell cash corn @$ 2.80 Dec. futures $3 -.20 Sell $3 Dec. (actual) corn put @ $.02
Gain or loss -.16 Result Sell cash corn $2.80 Options -.16 Net price received $2.64
26
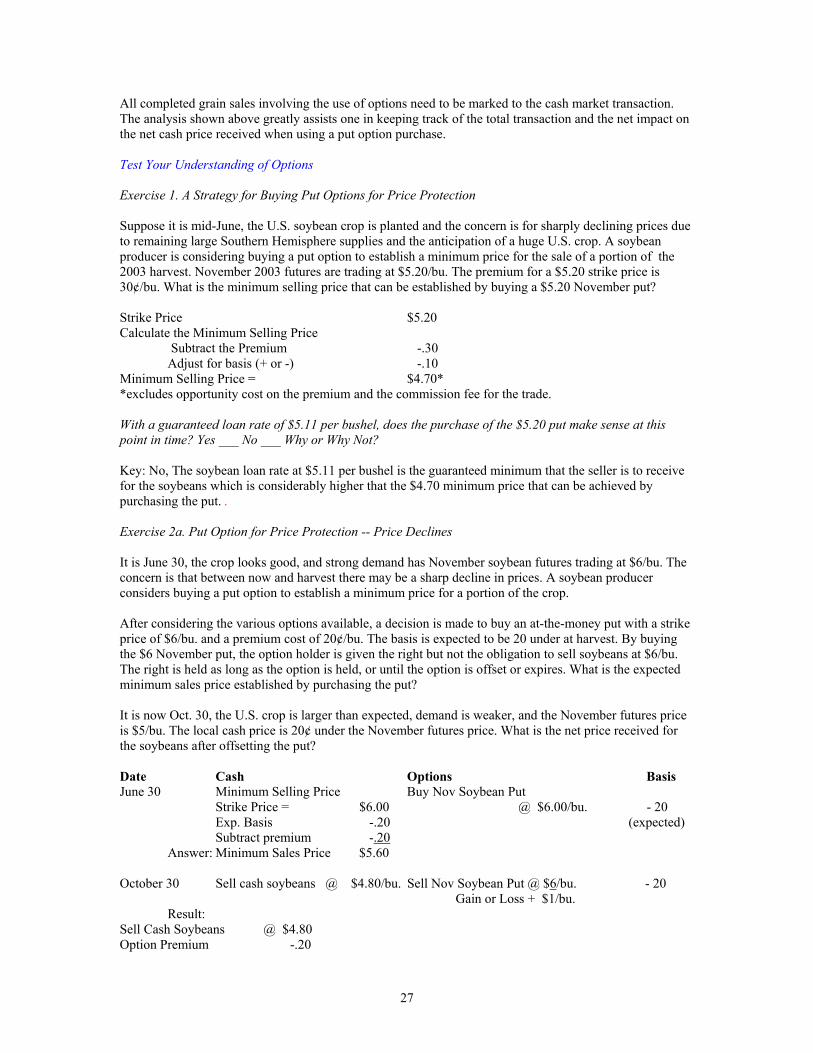
All completed grain sales involving the use of options need to be marked to the cash market transaction. The analysis shown above greatly assists one in keeping track of the total transaction and the net impact on the net cash price received when using a put option purchase. Test Your Understanding of Options Exercise 1. A Strategy for Buying Put Options for Price Protection Suppose it is mid-June, the U.S. soybean crop is planted and the concern is for sharply declining prices due to remaining large Southern Hemisphere supplies and the anticipation of a huge U.S. crop. A soybean producer is considering buying a put option to establish a minimum price for the sale of a portion of the 2003 harvest. November 2003 futures are trading at $5.20/bu. The premium for a $5.20 strike price is 30¢/bu. What is the minimum selling price that can be established by buying a $5.20 November put? Strike Price $5.20 Calculate the Minimum Selling Price
Subtract the Premium -.30 Adjust for basis (+ or -) -.10
Minimum Selling Price = $4.70* *excludes opportunity cost on the premium and the commission fee for the trade. With a guaranteed loan rate of $5.11 per bushel, does the purchase of the $5.20 put make sense at this point in time? Yes ___ No ___ Why or Why Not? Key: No, The soybean loan rate at $5.11 per bushel is the guaranteed minimum that the seller is to receive for the soybeans which is considerably higher that the $4.70 minimum price that can be achieved by purchasing the put. . Exercise 2a. Put Option for Price Protection -- Price Declines It is June 30, the crop looks good, and strong demand has November soybean futures trading at $6/bu. The concern is that between now and harvest there may be a sharp decline in prices. A soybean producer considers buying a put option to establish a minimum price for a portion of the crop. After considering the various options available, a decision is made to buy an at-the-money put with a strike price of $6/bu. and a premium cost of 20¢/bu. The basis is expected to be 20 under at harvest. By buying the $6 November put, the option holder is given the right but not the obligation to sell soybeans at $6/bu. The right is held as long as the option is held, or until the option is offset or expires. What is the expected minimum sales price established by purchasing the put? It is now Oct. 30, the U.S. crop is larger than expected, demand is weaker, and the November futures price is $5/bu. The local cash price is 20¢ under the November futures price. What is the net price received for the soybeans after offsetting the put? Date Cash Options Basis June 30 Minimum Selling Price Buy Nov Soybean Put Strike Price = $6.00 @ $6.00/bu. - 20 Exp. Basis -.20 (expected) Subtract premium -.20 Answer: Minimum Sales Price $5.60 October 30 Sell cash soybeans @ $4.80/bu. Sell Nov Soybean Put @ $6/bu. - 20 Gain or Loss + $1/bu.
Result: Sell Cash Soybeans @ $4.80 Option Premium -.20
27

Option Profit +$1.00 Answer: Net Price Received = $5.60/bu. --------------------------------------------------------------------------------------------------------------------------------- Exercise 2b. Put Option for Price Protection -- Price Increases Use assumptions in Exercise 2a. It is now harvest time, the U.S. crop is smaller than expected, demand is strong, and the November futures price is trading at $7/bu. The cash price is 20¢ under the November futures price. What is the net price received for the soybeans after allowing the put to expire? Date Cash Options Basis October 30 Sell cash soybeans @ $6.80 Nov Futures @ $7/bu., option expires - 20 Gain or Loss 0 Result: Sell Cash Soybeans @ $6.80 Option Premium - .20 Answer: Net Price Received = $6.60/bu. With the futures price at $7/bu., the put option is allowed to expire worthless. Deducting the 20¢/bu. premium paid from the cash market price of $6.80/bu. gives a total net price received of $6.60/bu. Exercise 3. Using Options as a Tool for Weather Markets A good use of options is as a tool for weather markets. The scenario might be prevailing dry conditions that are contributing to a summer rally about the same time an individual dry land farmer is at least 50% contracted on new crop corn production. The option can be used to price the additional 50% of intended production, thereby taking advantage of the higher price level being bid into the market without having to be concerned about making delivery on the bushels priced with options. In the event that a put option is purchased for this purpose and the bushels are not produced, depending upon the actual price outcome, the option will either be allowed to expire worthless or offset and a profit taken. In is July 15 and you have 50 % of intended corn production priced via forward contracting. Due to strong demand, an opportunity arises to make additional sales allowing one to lock in a very acceptable minimum price. Local conditions have turned dry and you are not sure whether it is safe to contract any more corn. A decision is made to purchase a $3.00 December Corn Put for a 20¢/bushel premium. Basis is expected to be even or better at harvest. The MSP is $2.80 per bushel. Price Declines – Adverse Weather Results in Short Crop Locally What is the outcome? Cash contracts are delivered and bushels are not available to sell against the option contract. Result on Put Option Position at Harvest – Price Decline Cash Market Options Basis July 15 Growing crop, production uncertain Buy Dec Corn Put @$3.00 0 (expected) October 15 once cash contracts are delivered harvest is finished, no more bushels available. Cash corn locally @$2.50 Sell Dec Corn Put @ $2.50 0 Gain or Loss + .50
Result: No Additional Cash Grain Available to Sell – Cash corn locally @$2.50/bu. Option Profit + .50¢/bu. Premium - .20¢/bu. Option Position + .30¢/bu.
28

A 30¢/bushel profit was achieved in the options market on this transaction even though the production was not available for delivery at harvest. The put option is in the money. The gain can be attributed to other cash grain sales. No further action is necessary. Price Increases – Adverse Weather Results in Short Crop Nationally Cash Market Options Basis July 15 Growing crop, production uncertain Buy Dec Corn Put @$3.00 0 October 15 cash contracts are delivered, harvest finished, no more bushels available. Cash corn @$3.50 Option Allowed to Expire 0 Worthless @$3.50 Gain or Loss 0
Result: No Additional Cash Grain Available to Sell – Cash corn locally @$3.50/bushel Option Premium - .20¢/bushel The option expires worthless. The put option is out of the money. A 20¢/bushel loss is achieved on the bushels not harvested. Therefore, this loss must be attributed to other cash grain corn sales. No further action is necessary. Exercise 4. A Speculative Strategy for Buying Call Options to Garner Staying Power
In late September, a producer is harvesting corn, and has decided to make harvest delivery at a basis of 45¢ over December futures. The thinking is that the basis level is extremely strong from an historical perspective and that basis is likely to weaken by 15¢ to 20¢/bu. as harvest progresses. The producer, whose cost of production is $2.25/bu., believes that corn futures may have a chance to make a comeback after harvest pressure subsides, perhaps to $3/bu. December corn futures are trading at $2.59. The premium for a $2.60 March call is trading at 18¢/bu. The producer figures that buying a March call gives the corn market a chance to work higher and that the time value of the May or July Call makes the strategy less appealing due to the higher cost of the premiums. What has to happen before the producer can make money on this strategy? Should the producer buy the March $2.60 call at this time? Yes ___ No ___ Key: No Why or Why Not? The producer should not purchase the call at this time. It is noted that the net sale price for the corn being harvested is $3.04/bu. ($2.59 + .45 = $3.04). The net price received in this example is profitable, and there is not any pressure on the producer to consider re-ownership of this corn sale in call options. Summary The examples used in this section are not intended to be all-inclusive. However, they are based upon actual decisions. The use of options requires the individual to be ahead of the game and not looking back. Unfortunately, farmers are often encouraged to chase bad marketing decisions with the use of options. Marketing decisions can be considered bad for many reasons, among them selling too early in the season in a dry year. Generally, once a marketing decision is made it should be viewed as a done deal. Using options to chase bad cash sales decisions usually amounts to throwing good money at bad decisions.
29

Common Terms When Using Options Buyer – The buyer of an option, also referred to as the "option holder". The buyer of an option, and only the buyer, has the right to exercise the option. Seller – One who sells an option (to the buyer), also referred to as the "writer" or "grantor" of the option. The seller receives the money the option buyer pays (the premium) and is obligated to take an opposite futures position if and when the option is exercised. Put – Gives the option buyer the right to sell (go short) a particular futures contract at a specific price. If the buyer exercises the put option, a short futures position is acquired at the strike price and someone who sold a put option is simultaneously assigned a long futures position. Options are seldom exercised. Call – Gives the option buyer the right to purchase (go long) a particular futures contract at a specific price. If the buyer exercises the call option, a long futures position is acquired at the strike price and someone who sold a call option is simultaneously assigned a short futures position. Options are seldom, exercised. Underlying Contract – The specific futures contract, such as the December futures contract for new-crop corn, which the buyer has the right to purchase (for calls) or sell (for puts). Strike Price – The price per bushel at which the buyer of a put has the right to sell, or the buyer of a call has the right to buy a futures contract. It is also the price per bushel at which the buyer of an option purchases the option. The strike price is also referred to as the "exercise price". Premium – The price of the option. The money the buyer pays and the seller receives for the rights conveyed by the option. The premium is the maximum amount an option buyer ‘margins’ and is the maximum the option buyer can lose in the event the option performs adversely. Option premiums are negotiated in the trading pit and change with time, price action and volatility Offset – The action taken by the buyer (holder) of an option who wishes to close an option position either to take a profit or to capture part of the premium paid as delivery date approaches. Expiration – The last day an option can be exercised or offset. Options are generally offset during the month prior to the futures contract, ahead of expiration. Exercise – The action taken by the buyer (holder) of an option who wishes to acquire a position in the underlying futures contract at the option strike price. Intrinsic value – This is the value determined by the difference in the strike price and the futures price at any given point in time. In the money – An option that has intrinsic value has a positive value if offset. Out of the money – An option that has no intrinsic value at expiration. At the money – The option strike price and the underlying futures price are equal. Time value – The value of an option represented by the length of time remaining until expiration. The more time an option has until expiration the higher its premium. An option’s time value erodes as the option approaches expiration. At expiration an option holds only intrinsic value, if any. Test Your Understanding of Using Options
1. Grain sellers buy puts to establish minimum selling prices for their commodities? ___ Yes ___ No 2. Livestock produces buy calls to establish maximum buying prices for their feed inputs?
___ Yes ___ No 3. When buying options the premium cost is the maximum amount that the buyer has to deposit on
account? ___ Yes ___ No 4. When selling options, the option seller is required to establish and maintain a margin account? ___
Yes ___ No 5. When buying options, the buyer may have to post addtional margin beyond the premium paid?
___ Yes ___ No 6. A wheat call has a strike price of $2.60. At expiration, the underlying futures price is $3. The
intrinsic value is ___. 7. A soybean put has a strike price of $5.80. At expiration, the underlying futures price is $5.50. The
intrinsic value is ___. 8. A wheat put has a strike price of $3. At expiration, the underlying futures price is $3.30. The
intrinsic value is ___. 9. An at-the-money December $2.60 corn put has a premium of 20¢/bu. in May. In August, the put is
still at the money; the premium is 10¢. The change most likely represents a change in: Time value ___, Volatility ____, Intrinsic value.
30

10. A corn put has a strike price of $3.00/bu., an even basis, and a 25cent/bu. premium. What is the MSP that the farmer can achieve? ___ /bu.
a. At expiration, if the futures price has increased to $3.50/bushel what is the net price received? ___ /bu.
b. At expiration, if the futures price declines to $2.50/bu. what is the net price received? ___ / bu.
Key: 1. Yes 2 Yes 3 Yes 4.Yes 5. No 6. 40¢/bu. ($3.00-$2.60) 7. 30¢/bu. ($5.80-$5.50) 8. 0 ($3.30 is more than $3) 9. Time value 10. $2.75/bu ($3.00 – 0 - .25 = $2.75) 10a. $3.25/bu. ($3.50 - .25=$3.25) 10b. $2.75/bu. ($3.00-0-.25=$2.75)
Unit 5. Hedging in the Futures Market
Introduction The first futures contracts were developed for the grain markets. Futures trading began in 1865 for wheat, corn, and oats at the Chicago Board of Trade. In the mid-1800s, an inadequate distribution system, coupled with deficiencies in storage facilities, caused major marketing problems and wide seasonal price swings for commodities. Futures markets were developed to offer orderly marketing alternatives for producers, warehouses, and grain processors. Over time, the number of investors in futures markets has increased. Simultaneously, the uses of futures markets have become more complicated and sophisticated. However, the use of futures in everyday grain marketing decisions need not be either. All that is required to consider incorporating hedging in futures, as part of the grain seller’s marketing plan, is an understanding of the basic concepts. Trading in futures is not suitable to some marketers’ objectives, needs, or limitations. Even so, understanding basic futures-market concepts is likely to help cash grain sellers do a better job of marketing. This section is designed to increase a grain seller’s understanding of hedging commodities in the futures market, primarily as a price-protecting marketing alternative. ‘Selective hedging’ is described so the grain seller can distinguish between using futures for price protection and using futures for speculative purposes. The uses of these marketing strategies are entirely different, requiring different goals and objectives on the part of the marketer. One strategy ‘locks in’ an acceptable price, while the other involves price-level speculation and increased price risk. In most cases, hedging commodities does not involve speculation. Futures Market Basics Mastering the use of the futures market for investment purposes has been compared to learning to master the game of chess. The rules are very simple and easily learned, yet it can take a lifetime to perfect strategies. This is especially true for the investor who wants to use the futures market as a speculative investment tool. It is much less true for the grain seller interested in learning to use futures as a tool for hedging purposes. A futures contract is a binding obligation to buy or sell a specific quality and quantity of a particular commodity at a specific location and time. The price of the contract is determined by open outcry on an organized exchange at a centralized location. The major exchanges exist to provide the trading place, set rules, and oversee the activities of their members. Members trade on the floor of the exchanges, commonly referred to as ‘the pit’, buying and selling for him or herself or as an agent for someone else. Floor trading on one of the exchanges such as the Chicago Board of Trade requires a membership or seat. Seats are sold to individuals. Occasionally, new issues of memberships are conducted. Much like real estate, memberships are generally only available
31

through a secondary market created by current owners who wish to sell their seats to others. The majority of investors trade through brokers or account executives and they trade through members of the exchanges. The Commodity Futures Trading Commission (CFTC) oversees the exchanges and enforces trading rules. Grain sellers should acquaint themselves with the CFTC. Additional information can be found at < http://www.cftc.gov/cftccustomer.htm/ >. Buying, Selling, Offsetting Buying in the futures market is not unlike any other investment buying opportunity. The investor’s goal is to buy a commodity, selling it later for a higher price. (Although speculators also may sell commodities.) There is another kind of action in the futures market directly related to hedging—selling a futures contract with the intention of buying it back at a later date at a lower price. When hedging, the grain seller takes a sold (short) position in the futures market and buys it back later in order to offset the futures position. The completion of a sell-buy is called a "round turn" and, once completed, the futures contract position is offset or closed. It is also important to note that to be considered a hedge, each position taken involves an equal, but opposite, position regarding the physical commodity in the cash market. One of the most difficult concepts for grain sellers to understand about hedging is the idea of entering a contract in a sold position. When selling a futures contract, a promise is made to deliver a specific commodity to a specific place on a certain date. Typically, however, delivery will not be made. The hedger is relieved of the promise by simply offsetting the initial sell order with a buy. Livestock producers hedge feed purchases by buying futures. Crop producers sometimes buy futures to “re-own” a crop they have already sold, or to “protect their loan deficiency payment.” These positions must be considered speculative, however, because they are not directly balanced by the cash commodity. The Margin To control a futures contract, margin must be put up on a portion of the contract’s face value. The margin is generally deposited in an interest-bearing account. The amount required varies among exchanges, brokers, commodities traded, and markets of varying volatility. Generally, the margin required ranges from 5% to 15% of the contract’s face value. In some cases, margin deposits required are less than 5% and in a few rare instances, the margin requirement reaches almost 100%. These events involve unusual circumstances. Margin accounts are typically lower for hedged accounts than for speculative accounts. The margin requirement is higher for the speculative account because hedgers own the physical commodity and the value of the commodity backs the hedged position. Speculators do not own the physical commodity, so the risk of loss is greater. Example: A farmer is hedging his corn crop. He sells a December corn futures contract (5,000 bu.) at $2.50/bu. The face value of the contract is $12,500, and a $550 margin is required. The farmer places a $550 margin deposit with his broker. In addition to being responsible for submitting the initial margin, the trader must maintain the margin level to keep control of the contract. The maintenance margin for this contract is also $550. This is the level below which the margin account will not be allowed to fall. Therefore, as the price of the December futures contract changes, so does the margin amount required. If the price increases over the next two days to $2.70/bu., the farmer has incurred a paper loss of 20¢/bu.—$1,000 per contract—and must add $1,000 to the margin account. The deposit brings the account balance back to the $550 maintenance margin. If the price were to decrease over the next several days to $2.40/bu., the farmer incurs a paper gain on the futures position of 10¢/bu.—$500 per contract. The $500 profit can be withdrawn, leaving $550 to maintain the futures position.
32

Financing Margin Accounts Most hedgers are able to self-finance the margin requirements for their hedge accounts. However, some hedgers may want to consider arranging a line of credit at their bank for this purpose. It sometimes is recommended that a tri-party agreement be signed between the hedger, banker and broker. Tri-party agreements specify the intentions on the part of the hedger and the broker involving the hedging account. They also specify the bank's willingness to margin the hedge account, from start to finish. Once set up, the banker can directly meet the margin calls. Difficulties sometimes arise in getting all parties on the same page—that is, knowledgeable and informed enough to make the agreement and then honor it. It may be necessary to do some shopping around among various banks to find one that understands hedging. Brokers/account executives can help get such an agreement established. Financial Tests In addition to the margin required on each contract, a brokerage firm requires the trader to show financial solvency. Opening an account with a firm requires some degree of financial liquidity. That is, a trader must have a financial base that can be converted to cash to pay any losses should they occur. Today brokerage firms typically require traders to deposit “good faith” money on account in order to be able to open an account. The amount varies, and may be as little as the margin required for a hedged contract or as much as $5,000 to $10,000 or more depending upon whether an individual is opening a hedge or speculative account and how much trading is to be done. The good faith money is assurance that the trader has the ability to make margin calls. You may want to shop around to compare brokers and brokerage firms and their policy on opening accounts, when they will release good-faith deposits, and whether interest is paid on the committed funds.
33

Worksheet # 1: Margining a Hedge Account Initial Margin $________ Maintenance Margin $________ Business Day Closing Date futures Gain or Old Margin call or Account price loss balance credit balance 1 ____ ____ None None ____ ____ 2 ____ ____ ____ ____ ____ ____ 3 ____ ____ ____ ____ ____ ____ 4 ____ ____ ____ ____ ____ ____ 5 ____ ____ ____ ____ ____ ____ 6 ____ ____ ____ ____ ____ ____ 7 ____ ____ ____ ____ ____ ____ 8 ____ ____ ____ ____ ____ ____ 9 ____ ____ ____ ____ ____ ____ 10 ____ ____ ____ ____ ____ ____ 11 ____ ____ ____ ____ ____ ____ 12 ____ ____ ____ ____ ____ ____ 13 ____ ____ ____ ____ ____ ____ 14 ____ ____ ____ ____ ____ ____ 15 ____ ____ ____ ____ ____ ____ 16 ____ ____ ____ ____ ____ ____ 17 ____ ____ ____ ____ ____ ____ 18 ____ ____ ____ ____ ____ ____ 19 ____ ____ ____ ____ ____ ____ 20 ____ ____ ____ ____ ____ ____ 21 ____ ____ ____ ____ ____ ____ 22 ____ ____ ____ ____ ____ ____ 23 ____ ____ ____ ____ ____ ____
Futures trade result: Deposits total $____ Ending account balance $____ Commission (-) $____ Profit or loss $____ Profit or loss/bu. on Futures Account $____/5,000 bu. = $____
34

The profit or loss in the futures market is only one piece of the financial standing of your production hedge. See Example 4. Known as a "T account," it records both the cash and futures position for a hedge transaction. This worksheet is designed for the purpose of recording the closing futures price for the contract being traded on a daily basis for one month. An additional worksheet is necessary for each month the contract is held. The margin account for the position held is debited or credited depending upon each day’s close. Margin calls occur when the account balance falls below the maintenance margin. Typically, there are 20 to 23 business days during a calendar month. To link to futures prices being traded at the Chicago Board of Trade go to < http://www.cbot.com/ >. For other links to futures prices see Unit 7. Selected Resources. Test Your Understanding of Margining a Hedge Account
1. Setting up a hedge account requires the grain seller to establish a margin account? Yes ___ No ___ 2. Margin accounts generally stipulate both the initial and maintenance margin requirement? Yes ___
No ___ 3. Assume that a grain seller has a hedged account that is sold at a futures price of $2.50/bu. and
requires an initial margin of $550 and a maintenance margin of $550 for a 5,000-bushel contract. What is the margin call if the futures price moves to $2.61/bushel? $ ___________.
4. What happens if the futures contract moves to $2.40/bushel? Please explain: _____________ ______________________________________________________________________________.
5. What happens if the futures contract price moves to $2.80/bushel? Please explain: ____________ ______________________________________________________________________________.
Key: 1. Yes 2. Yes 3. $550 4. The account is credited $500, which may be withdrawn from the account. 5. The account is debited -$1,500. Since the maintenance margin is $550, the account incurs a margin call of $1,500 to bring the maintenance margin back to $550. Hedging in the Futures Market Producers of grains and oilseeds have the risk of price changes while the crop is committed to production, growing, or placed in storage prior to making delivery. The two main types of hedges for grain producers are production and storage hedges. Advantages to hedging
• Allows the grain seller to “lock in” acceptable prices, regardless of price direction • The exact price is known, within the realm of basis error • Provides added flexibility to a grain seller’s marketing program • Provides the opportunity to benefit from basis gain (in storage hedging)
Disadvantages to hedging
• Reduces the opportunity to participate in higher cash prices if they occur • Requires an initial margin and “good faith” deposit • Must meet additional margin calls if prices move adversely
There is a commission charge The Production Hedge A production hedge is placed before or during the growing season for a specific crop to protect against price declines. It is used when an acceptable profit is offered by taking the hedged position. Production hedges are short hedges, whereby a sell position is taken in the selected futures contract month. The
35

example given below illustrates the basic concept of a corn producer who places a hedge a few days after planting, on May 10, and plans to sell the cash grain at harvest. In this example, the basis does not change. Example 1a. Corn Production Hedge – Price Declines Date Cash Position Futures Position Basis May 10
Crop planted, localized expected cash Sell December corn contract at price at harvest $2.50/bu. $2.30/bu. +.20
October 15
Harvest and sell cash corn for Buy December corn contract at $2.30/bu . $2.10/bu. +.20
+ .20/bu. Net result Sell cash at $2.30/ bu. Futures (+ or -) + .20/bu. Net price received $2.50/bu. Example 1b. — Price Increases October 15
Harvest and sell cash corn for Buy December corn contract at $2.70/bu. $2.50/bu. +.20
+ .20/bu. Result: Sell cash at $2.70/bu. Futures (+ or -) - .20/bu. Net price received $2.50/bu. excluding commission Note that regardless of whether futures prices rise or fall, the cash sale offsets that move, and the net price received is the same in either case. This example illustrates the importance of producers having a stated goal when employing a hedge position and sticking to it. The decision to hedge should be based mainly upon the ability to lock in an acceptable profit and less on the idea of which direction you think prices are headed. If a marketer is satisfied that $2.50/bu. for corn represents an acceptable profit, then price increases or decreases become less significant when hedging is used properly. Marketer dissatisfaction with futures losses when hedging as cash prices move higher is one of the most problematic elements of hedging with futures contracts. Best Time to Use the Production Hedge
When the futures price is in the upper third of the historical price range To lock in an acceptable price To provide price risk protection
The Storage Hedge A producer may decide to store grain rather than sell at harvest for two reasons—better prices offered in a later futures month and expectations that basis will be better later. The basis pattern for most storable commodities shows a narrowing or strengthening trend as time passes after harvest (Figure below). The price risk while grain is in storage is that the price will decrease, rendering storage unprofitable. A storage hedge can be used to capture the narrowing of the basis while providing protection against declining prices.
36

Figure. Basis Narrowing Over the Storage Period Basis +30 +20 +10 0 * July Futures * -10 * * -20 * * -30 * Jan Feb Mar April May June July Example 2. Storage Hedge for Corn – Price Declines Date Cash Position Futures Position Basis December 15
Place corn in storage, cash price Sell July futures contract at @ $2.20/bu. $2.70/bu. - .50
May 1 Sell cash corn at Buy July futures contract at $2.70 $2.55/bu. + .15
+ .15/bu. Net price received Sell cash at $2.70/bu. Futures (+ or -) + .15/bu. Net price received $2.85/bu. excluding commission Storage hedges are best employed when the opportunity exists to capture basis gain. Within the course of a harvest season, it is quite possible to get different signals from the market at different times. At times, the market signals (price level, basis level, and the spread or carry in the storage months) may indicate cash sales to be the proper course of action to follow, while at other times the market indicators may be that storage and hedging are the better course of action. Keep in mind that storing grain accumulates increased costs (both actual expenses associated with the physical product and interest or opportunity costs) with the passage of time, so a higher cash price is needed just to break even as time passes. Best Time To Use the Storage Hedge:
• To provide price risk protection against declining prices for stored grain • To capture potential basis gain • When the indicated net return to storage represents an acceptable profit (Worksheet #1)
37
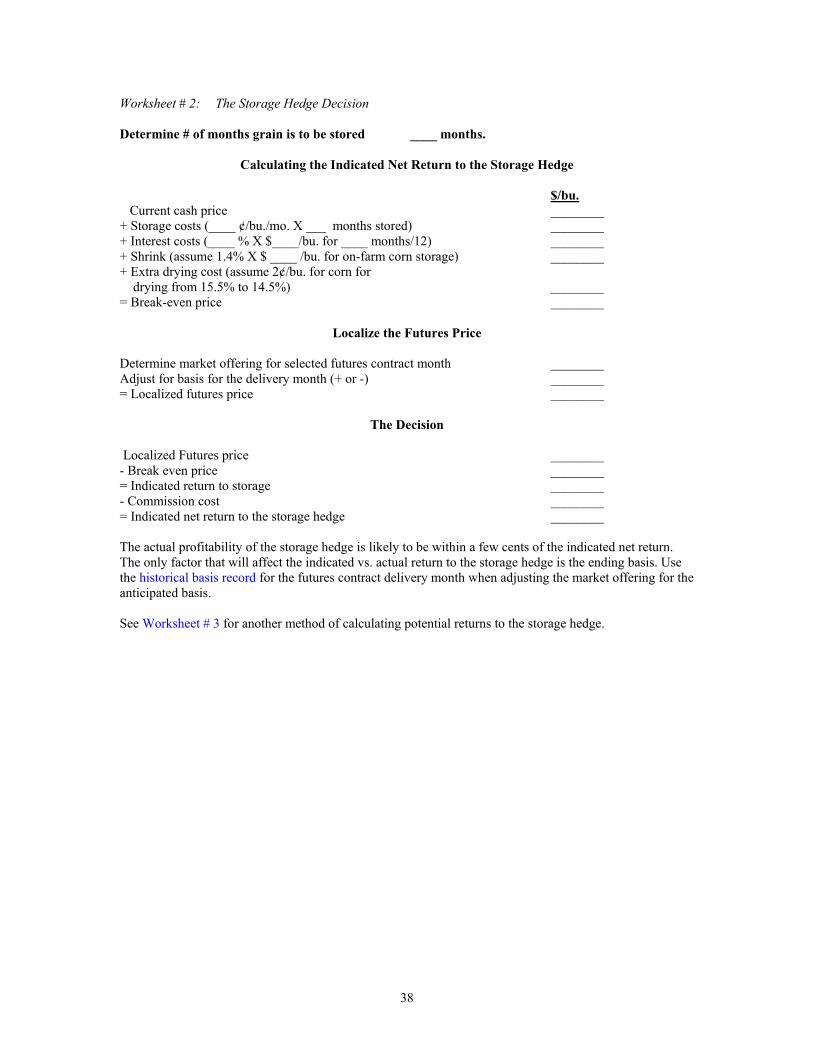
Worksheet # 2: The Storage Hedge Decision Determine # of months grain is to be stored ____ months.
Calculating the Indicated Net Return to the Storage Hedge
$/bu. Current cash price ________ + Storage costs (____ ¢/bu./mo. X ___ months stored) ________ + Interest costs (____ % X $____/bu. for ____ months/12) ________ + Shrink (assume 1.4% X $ ____ /bu. for on-farm corn storage) ________ + Extra drying cost (assume 2¢/bu. for corn for drying from 15.5% to 14.5%) ________ = Break-even price ________
Localize the Futures Price
Determine market offering for selected futures contract month ________ Adjust for basis for the delivery month (+ or -) ________ = Localized futures price ________
The Decision
Localized Futures price ________ - Break even price ________ = Indicated return to storage ________ - Commission cost ________ = Indicated net return to the storage hedge ________ The actual profitability of the storage hedge is likely to be within a few cents of the indicated net return. The only factor that will affect the indicated vs. actual return to the storage hedge is the ending basis. Use the historical basis record for the futures contract delivery month when adjusting the market offering for the anticipated basis. See Worksheet # 3 for another method of calculating potential returns to the storage hedge.
38

Worksheet # 3: Calculating Returns to the Storage Hedge Using the Basis A. Beginning basis $/bu. Spot cash price at harvest ________ Selected futures contract price for the delivery month ________ Calculate the beginning basis (B = C – F) ________ B. Storage costs Physical storage costs for storage period (___¢/bu. X ___ months stored) ________ Interest (___ % X _____$/bu. X ____ months stored/12) ________ Shrink (1.4% X $_____/bu. for on farm corn storage) ________ Extra drying cost (2¢/bu. for corn for drying from 15.5% to 14.5%) ________ Total storage costs ________ C. Ending basis Spot cash price for delivery ________ Futures contract price for the day delivered ________ Calculate the ending basis (B = C – F) ________ D. Basis calculations Beginning basis ________ Ending basis (can be taken from the historical record) ________ Change in basis (+ or -) ________ Storage costs (-) ________ Premium cost (-) (for the purchase of a put option only) ________ and/or Commission cost ________ Indicated Profit or Loss (+ or -) ________ Test Your Understanding of Hedging in the Futures Market
1. The Commodity Futures Trading Commission oversees and regulates the rules of the various commodity exchanges? Yes ___ No ___
2. A grain seller is hedged in futures once a sold position is taken in the futures market, even when no cash position exists? Yes ___ No ___
3. Hedging requires the grain seller to have an equal, but opposite, transaction of the physical commodity in the cash market? Yes ___ No ___
4. The act of selling a futures contract and buying it back later is not difficult for most people to understand? Yes ___ No ___
5. The two primary types of hedges available to the grain seller are production and storage hedges? Yes ___ No ___
6. Hedging is used to lock-in acceptable prices for commodities? Yes ___ No ___ 7. When hedging, a grain seller can end up with a loss in the futures position and still have a
successful hedge? Yes ___ No ___ Why or Why Not? _________________________________ 8. Grain sellers can elect to hedge stored grain when basis levels are indicating a profitable return to
the storage hedge? Yes ___ No ___ 9. Providing price risk protection is not a valid reason for hedging stored grain? Yes ___ No ___ 10. Hedging stored grain is a good way to attempt to capture basis gain? Yes ___ No ___
Key: 1. Yes 2. No 3. Yes 4. No 5. Yes 6. Yes 7. Yes, the value of the physical commodity increases. 8. Yes 9. No 10. Yes
39

True Hedgers Versus Selective Hedgers Hedging in the futures market requires discipline on the part of the marketer—deciding to stay with the hedge throughout the intended period. At times, prices may rise, resulting in futures losses. This requires the hedger to stand firm, making margin calls temporarily, and eventually offsetting the position for what turns out to be a successful hedge. True hedgers are said to not care whether prices rise or fall after placing a hedge, although there is a definite psychological factor that enters a hedger's mind when holding what might be viewed as an adverse futures position. The true hedger stands firm with a hedged position, knowing that gains in the cash value of the commodity offset any losses incurred in the futures market. Selective Hedging Selective hedgers are marketers who are more likely to offset a hedge ahead of squaring on the cash sale of the physical commodity, taking advantage of the flexibility afforded by hedging in the futures market. Selective hedgers need to be mindful of the fact that the practice of lifting hedges ahead of their maturity date can result in loss of price protection and, possibly, undesired results. The important point is to know the difference and be aware of the risk involved. Selective hedging is not recommended for the beginning commodity futures trader. It is speculative in nature and requires, among other things, accurate price forecasting and exceptional timing in order to effectively enter and exit the market. Selective hedging can be defined as the process of placing a hedge when price protection is needed and lifting the hedge when the protection is not needed. Grain sellers need to be hedged when prices are falling and not hedged when prices are rising. Selective hedging carries risks that are not involved with true hedges. One of the risks that selective hedgers face is the ‘double whammy’. This involves losses in both futures and the cash market. The Double Whammy The double whammy occurs when the hedger takes losses in both the cash market and the futures market. This mistake can be avoided by maintaining a true hedge position. The double whammy is best explained by example: Consider a soybean farmer who hedges the crop by using a November soybean futures contract. The farmer is initially concerned that prices will fall between now and harvest. However, after placing the hedge, prices begin to increase and continue rising for a couple of weeks. The soybean farmer’s hedged position is gaining in the cash market and simultaneously losing in the futures market. The farmer is receiving margin calls. The farmer then decides that the hedge is no longer working and is no longer necessary and lifts or offsets the hedge, realizing a loss in the futures market. The cash position is maintained through the growing soybean crop that is not yet harvested. At this point, the farmer is convinced that the right decision was made and, although taking a loss in the futures market, the cash value of the growing soybean crop is increasing. As it turns out, the price increase was brief and the market begins to plunge. The farmer rides the soybean price down and sells the soybeans in the cash market at a loss, magnifying the earlier loss taken in the futures market—a double whammy. If the farmer had maintained the hedge, the margin calls would have stopped when prices fell back to the hedge price and profits would have accrued in the futures position to offset the cash price losses. The hedge, left intact, would have protected the cash position.
40

Example 3. A Double Whammy Date Cash Position Futures Position Basis June 1 Soybeans are being grown, localized cash price Sell Nov soybeans @ @ $6 $6/bu. 0
Price Increases June 15 Cash soybeans @ Buy Nov soybeans @ $6.70 $6.70/bu. 0 - .70/bu. October 15 Soybeans sold at harvest at $5.50/bu. Nov soybeans @ $5.50 0 Net price received Cash price $5.50 Futures (+ or -) -.70 Net price received $4.80 excluding commission Had the hedge been left in place, an even (0) basis at harvest would have resulted in a net price received of $6/bu., excluding commission (cash price $5.50 + futures gain 50¢ = $6/ bu.). Test Your Understanding of Hedging in the Futures Market
1. True hedgers do not care whether futures prices rise or fall when hedged because of the corresponding gain in the value of the physical commodity? Yes ___ No ___
2. Selective hedgers are those that are likely to offset a hedge ahead of squaring the sale of the physical commodity in the cash market in order to take advantage of the flexibility afforded by hedging in the futures market? Yes ___ No ___
3. The risk involved in true hedging vs. selective hedging is the same? Yes ___ No ___ 4. Selective hedging is recommended for the beginning commodity futures trader? Yes ___
No ___ 5. Selective hedging, executed poorly, can result in losses in both the cash and futures
market transactions? Yes ___ No ___ 6. Hedging allows a grain seller to lock in acceptable prices when they are available,
regardless of price direction? Yes ___ No ___ 7. When hedging, the price to be received (aside from basis changes), once the futures and
the physical commodity positions are completed, remains uncertain? Yes ___ No ___ 8. It is possible to estimate the net price to be received from a hedged position within the
realm of basis error? Yes ___ No ___ 9. Technically speaking, the only risk involved in hedging is the basis risk or chance that the
basis will change from what is originally anticipated? Yes ___ No ___ 10. Done properly, hedging is a safe and reliable marketing alternative? Yes ___ No ___
Key: 1. Yes 2. Yes 3. No 4. No 5. Yes 6. Yes 7. No 8. Yes 9. Yes 10. Yes
41

Example # 4: The Production Hedge
Establishing a Price for a Growing Crop
Date Cash Futures Basis July Anticipated local cash Sell one contract price at harvest $2.60 Dec corn @ $2.40 + .20 October Sell cash corn @ $2.30 Buy one contract Dec corn @ $2.10 + .20 +.30 Net price received: Cash sale at delivery $2.30 Futures ( + or - ) + .30 Net Sales Price $2.60* *Excludes commission. The indicated profitability of the production hedge can be determined before taking a position in the futures market (Worksheet #2). The only factor that will affect the indicated vs. actual return to the production hedge is the ending basis. Keeping or referring to an historical basis record can help one to anticipate basis at the time when the hedge is to be offset.
42

Worksheet # 4: The Production Hedge Decision
Calculating the Indicated Net Price Offered by the Production Hedge
Costs per unit $/bu. Variable costs of production _______ + Fixed costs _______ = Total direct costs _______ + Return to management _______ = Total costs including return to management _______ + Profit _______ = Asking price _______
Localizing the Futures Price
Determine market offering for selected futures contract month _______ (+ or -) Anticipated basis adjustment for the delivery month _______ = Localized futures price _______
The Decision
Localized futures price _______ - Asking price _______ = Indicated return to the hedge _______ - Commission cost for a round turn _______ = Indicated net price _______
43

Types of Orders Once a trader has opened a brokerage account, the broker has to know the kind of order the trader wants to transact. The trader must specify the commodity to be traded, the type of trade (sell or buy) and the contract month. For a list of futures symbols and contract month abbreviations go to <http://www.cbot.com/>. Beyond telling your broker you want to sell two December '04 corn contracts, there are other types of orders you can use to be more specific, or to leave an order in place to be filled as the market moves. Different types of orders can be combined as traders become experienced. Brokers/account executives can provide assistance in defining proper orders. Traders can use stop orders to protect profits or limit losses, which is called a “stop loss” order. A stop for a sell position must be above the prevailing market price, and a stop for a buy position must be above in order to protect a profit in the position. Assume that a trader has previously sold a December corn futures contract at $2.50. The current price of December corn is $2.40, representing a 10¢ profit. The trader can then place a stop order to protect the profit, “buy one December corn at $2.41 stop”. If the market turns higher, the order will be filled as close to $2.41 as possible. If the market continues to fall, the original position will continue to gain value. It is important to note that it is not always possible to fill the stop. Markets can get into “lock limit” moves on a given day. When that happens, all trading in essence ceases until the next trading day. Losses can accumulate during “lock limit” trading days, particularly when a trader experiences consecutive lock limit days. Hedging Summary Hedging in agricultural futures requires a basic understanding of the mechanics involved in completing a hedging transaction. It is important that the grain seller does not lose sight of the fact that a hedge requires the ownership of the physical commodity and a short position in the futures market. When used properly, hedging can add flexibility and profitability to a grain seller's marketing program. However, not all grain sellers have the proper mind-set to be effective hedgers. Hedging in the futures market represents a relatively safe marketing alternative for grain farmers, as long as the principles involved in hedging grains are not confused or intertwined with selective hedging practices or speculative trading. Both for good financial management and for tax reasons, it is a good idea to keep hedging accounts that are geared to sound business decisions separate from speculative accounts. Test Your Understanding of Hedging in the Futures Market Exercise #1: Production Hedge Case Problem Situation: It is June 10 and USDA is projecting the size of the U.S. corn crop to be over 10 billion bushels. If realized, this would be a record U.S. corn crop. U.S. crop conditions are reported to be the best they have been in slightly over a decade. If this scenario develops, new-crop corn futures are expected to plummet from current levels. Historical corn yields on this farm have ranged from 50 bu. to 120 bu./acre, with the average yield at 100 bu./acre. Corn production is expected to be 15,000 bushels (+ or -). A marketing decision made in mid-December resulted in forward contracting 5,000 bushels of intended corn production at $2.59/bu. December futures on June 10 are trading at $2.34/bu. The local historical basis for December is recorded at 22¢ over Dec (ranging from 0 to 38¢ over). A nationally known weather expert has recently stated that prevailing crop conditions reported in the month of June do not mean much from an historical perspective. As a result, much uncertainty is prevailing, both in the market and in determining the need to acquire price risk protection for an additional amount of intended production.
44

In this case, there are three possible scenarios: Consider making additional sales using a forward cash contract, being offered at $2.56/bu. (22¢ over December); consider hedging some portion of the intended crop; or do nothing and wait to see what develops. Answer the following questions: a). Should one forward contract another portion of the crop? ___ Yes ___ No If one decides to forward contract an additional amount, how many bushels can comfortably be forward contracted? _______Bushels b). Should one decide to hedge an amount of the intended production? ____ Yes ____ No What is the indicated net price that one could receive if a hedge is used? $______/bu. c). Should one do nothing and wait to see how the crop develops? ____Yes ____No Why or Why not? Discussion: There isn’t necessarily a right or wrong answer to the above questions. The type of contract that an individual uses for price protection, if any, is entirely up to the individual. Much depends upon personal preferences concerning contracting methods. Since the price offer for both the forward contract and the hedge are virtually the same in the above scenario, it is the author’s opinion that an additional sale of 5,000 bushels should be made using the forward contract. The key to deciding which contracting method to use depends upon the reliability and accuracy of the weather forecast. The greater the uncertainty (his yield risk), the more likely the farmer would choose hedging another portion of the crop vs. forward contracting. Exercise #1, Part 2 Part 2 of this exercise is designed to increase one’s understanding of completing a production hedge. The scenario that is presented is the same as above, only this time, a decision is made to hedge one contract of December corn at $2.34/bu. on June 10. The hedge is to be lifted on Oct. 10 with December corn futures trading at $2.04/bu. and the local basis at 22¢ over December futures. Complete the hedge transaction using Worksheet # 5. The commission cost is 1¢/bu.
45
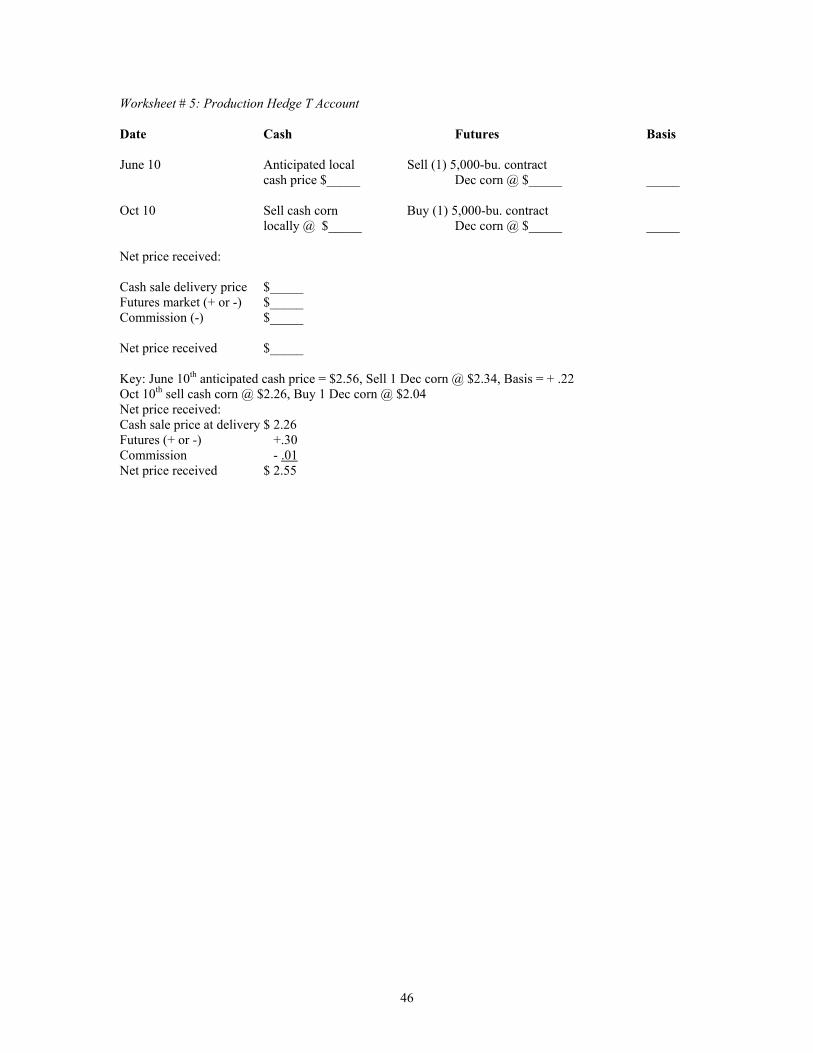
Worksheet # 5: Production Hedge T Account Date Cash Futures Basis June 10 Anticipated local Sell (1) 5,000-bu. contract cash price $_____ Dec corn @ $_____ _____ Oct 10 Sell cash corn Buy (1) 5,000-bu. contract locally @ $_____ Dec corn @ $_____ _____ Net price received: Cash sale delivery price $_____ Futures market (+ or -) $_____ Commission (-) $_____ Net price received $_____ Key: June 10th anticipated cash price = $2.56, Sell 1 Dec corn @ $2.34, Basis = + .22 Oct 10th sell cash corn @ $2.26, Buy 1 Dec corn @ $2.04 Net price received: Cash sale price at delivery $ 2.26 Futures (+ or -) +.30 Commission - .01 Net price received $ 2.55
46

Exercise # 2: To Store or Not to Store Situation: At the beginning of October, corn harvest is progressing rapidly. Yields are running approximately 100 bu./acre. Most of the harvest was forward contracted and it now seems apparent that a little more than 5,000 bushels of corn remains to be priced. December futures are trading at $2.61/bu. The decision to price the corn at harvest or to store and hedge requires the grain producer to analyze the basis offered at harvest, the carrying charge that is reflected in the market, and the potential for basis gain over the storage period if hedged. Only a 10¢ spread between the December/July futures contracts is noted. The next step involves an analysis of the basis. The beginning basis (cash harvest price – July futures) is duly noted as 41¢ over. The ending basis for July futures in the area (taken from the historical record) is noted as averaging 8¢ over. This reflects a 33¢ indicated decline in the basis over the storage period (41- 8=33). The storage cost is assumed to be 30¢/bu. for five months. It is further noted that the actual harvest basis is currently 50¢ over December. The decision to store can be made by using the basis calculations. One needs only to calculate the beginning basis, subtract the ending basis, and compare the change in basis to estimated storage costs. The profit or loss is a good indicator of a storage decision. Basis Calculations $/bu. Beginning basis + .41 Ending basis (from historical record) + .08 Change in basis (+ or -) - .33 Storage costs (-) - .30 Indicated profit or loss (+ or -) - .63 This scenario, which occurred in the fall of 2002 in some production areas, is easily decided. The cash sale at harvest should be made on the corn being harvested at 50¢ over December. Historically, this type of basis offer is seldom seen and represents a very strong indicator that the cash sale at harvest is likely to be the best sales decision. Test your understanding of the storage decision Question 1: There are several reasons given in the above situation that suggest that storing the remaining 5,0000 bushels of corn will not pay. Which of the following apply? A. The carry reflected in the market from December to July is only 10¢/bu. B. A 33¢ expected decline in the basis over the storage payment C. Change in basis will not cover storage cost D. All of the above A ___, B ____, C ____, D ____ Question 2: What is the net price received for the cash at harvest? $ _____/bu. Key: 1. D (The 10¢ carry is not enough to cover storage costs; basis is expected to decline rather than improve over the storage period, and basis change would not cover storage costs.) 2. $3.11/bu. (December futures $2.61 + 50¢ over basis = $3.11) Exercise #3: The Storage Hedge Situation: It is Oct. 31 and harvest is nearing completion. Decisions to forward contract a portion of the crop before harvest and a strong basis earlier in the harvest has moved corn crop sales to about 75% of production. However, at this point in time, the harvest basis has dropped to 30¢ under December futures, equating to a cash sale price of $2.30/bu.
47

The grain seller is seriously considering storing the remaining 5,000 bushels. December futures are trading at $2.60/ bu., and July futures are trading at $2.70. With only a 10¢ spread between the December and July futures contracts, returns from storing seem iffy based solely on the futures price component. The beginning basis is noted as 40¢ under July and the expected ending basis is recorded as 8¢ over, reflecting a 48¢ potential gain in the basis over the storage period. The decision is made to store and hedge the remaining corn production. Note: Decisions to hedge stored grain are generally based upon the desire to capture the potential basis gain over the storage period. This exercise is designed to provide practice in using the storage hedge as a marketing tool in forward pricing grain. Using Worksheet #6: Storage Hedge – T Account, hedge one contract of July corn on October 31. On July 1, with July futures trading at $2.50, offset the hedge and determine the net price received. The basis on July 1 is 20¢ over July futures. The commission fee is $50 per round turn or 1¢/bu.
48

Worksheet # 6: Storage Hedge – T Account Date Cash Futures Basis Oct 31 Local cash price Sell 5,000-bu. contract $_____ July corn @ $_____ _____ July 1 Sell cash corn @ Buy 5,000-bu. contract $_____ July corn @ $______ _____ Net price received: Cash sale delivery price $______ Futures market (+ or -) $______ Commission (-) $______ Net price/ bu. $______ Assumptions: Oct 31 local cash price = $2.30, Sell July future @ $2.70, basis = -.40July 1 sell cash corn @ $2.70, Buy July future @ $2.50, basis = +.20 Net price received: Cash sale delivery price $ 2.70 Futures (+ or -) +.20 Commission -.01 Net Price/bu. $2.89 Answer the following questions:
Did the hedge perform as well as expected? Yes____ No____ Explain:
(1) Yes, the hedge performed better than expected due to the basis improving more than anticipated, a 60¢/bushel gain in basis occurred as opposed to the 48¢/bu. gain that was originally anticipated.
49

Common Terms When Hedging Round Turn – A round turn is completed when one offsets a futures position that was taken earlier. For hedged commodities a round turn consists of a sell and a buy. A commission fee is charged for completing a round turn. Commission Fee – The cost of doing business in the futures market. Production Hedge – Establishing a price for a commodity that is committed for production by selling a futures contract for a specific price, to be delivered at a later date. The production hedge can be employed prior to or after planting. Ownership of the physical commodity is required. Storage Hedge – Establishing a price for a commodity that is stored by selling a futures contract for a specific price that is to be delivered at a later date. Ownership of the physical commodity is required. Double Whammy – A situation that sometimes develops for selective hedgers when a loss is incurred in both the cash and futures markets, due primarily to ineffective decisions. The double whammy occurs when the hedger takes losses in both the cash market and the futures market. This mistake can be avoided by maintaining a true hedge position. The double whammy is best explained by example: Consider a soybean farmer who hedges the crop by using a November soybean futures contract. The farmer is initially concerned that prices will fall between now and harvest. However, after placing the hedge, prices begin to increase and continue rising for a couple of weeks. The soybean farmer’s hedged position is gaining in the cash market and simultaneously losing in the futures market. The farmer is receiving margin calls. The farmer then decides that the hedge is no longer working and is no longer necessary and lifts or offsets the hedge, realizing a loss in the futures market. The cash position is maintained through the growing soybean crop that is not yet harvested. At this point, the farmer is convinced that the right decision was made and, although taking a loss in the futures market, the cash value of the growing soybean crop is increasing. As it turns out, the price increase was brief and the market begins to plunge. The farmer rides the soybean price down and sells the soybeans in the cash market at a loss, magnifying the earlier loss taken in the futures market—a double whammy. If the farmer had maintained the hedge, the margin calls would have stopped when prices fell back to the hedge price and profits would have accrued in the futures position to offset the cash price losses. The hedge, left intact, would have protected the cash position. Double Whammy -- – A situation that sometimes develops for selective hedgers when a loss is incurred in both the cash and futures markets, due primarily to ineffective decisions. The double whammy occurs when the hedger takes losses in both the cash market and the futures market. This mistake can be avoided by maintaining a true hedge position. Short – A grain seller is short in the market once a sell position is taken. Long – In futures, a grain seller is long in the market once a buy position is taken. Marketing Horizon – Generally considered about two years for each crop to be harvested, a year in advance of harvest and a year after harvest. Margin – The amount of money that must be placed on account to control a futures contract. The margin generally represents a portion of the contract’s face value and is generally placed into an interest bearing account. True Hedger – One who is not likely to offset a hedged sell position in the futures market ahead of squaring on the cash sale. Selective Hedger – One who offsets a hedge ahead of squaring on the cash sale of the physical commodity. Fill or Kill – If any part, such as the number of contracts cannot be filled, then the entire order is killed. For example, a trader issues an order to “sell two December corn contracts at $2.50”. If only one can be sold at $2.50, the entire order is killed. Open – Also known as a “good ‘til canceled” order, it remains in effect until canceled by the trader or until the contract expiration. Some firms will lift or cancel the order after 30 days. A major disadvantage of thise type of order is that traders have been known to forget about them. If one is holding a long or short position on a good 'til canceled order that does not get filled before expiration, the position will be exercised. Good through (date) or time of day – The main point is that traders can specify the date and time of the order. Perhaps one specifies “sell two July corn by March 20” or sell two July corn at the market by 10:30 a.m.” Traders can also specify orders “on the open” or “on the close.” Orders that do not get filled expire. Limit Order – Orders can be specified with a “limit”. A limit must be specified above the current market price if the order is a sell, or below the price if the order is a buy. A limit order allows the trader to develop
50

a more controllable trading plan. If the trader were to issue an order to “sell two December corn at $2.50 limit” and the price never reached $2.50 or higher, the order will not be filled. Test Your Understanding of Hedging in Futures
1. Hedging in the futures market always provides better results than forward cash contracting? Yes ___ No ___
2. Grain sellers take sell or short positions in the futures market when placing a hedge position? Yes ___ No ___
3. Production hedges are used when grain producers are expecting price increases over the course of a growing season? Yes ___ No ___
4. The storage hedge allows one to capture potential basis gain? Yes ___ No ___ 5. There is no difference between true hedging and selective hedging in the futures market? Yes ___ No ___ 6. A double whammy is one of the risks involved in selective hedging? Yes ___ No ___ 7. Hedging allows the grain seller to “lock in” acceptable prices, regardless of price direction? Yes ___ No ___ 8. Hedging requires the hedger to put up a good faith deposit when opening an account? Yes ___ No ___ 9. Hedging reduces the opportunity to benefit from higher prices if they occur? Yes ___ No ___ 10. Margin accounts are required on all hedging transactions? Yes ___ No ___ 11. Commodity traders use stop orders to increase losses? Yes ___ No ___ 12. The indicated profitability of a hedge can be calculated before taking a position in the futures
market? Yes ___ No ___ 13. The only factor that will affect the indicated vs. actual return to the hedge is the ending basis? Yes ___ No ___ 14. The best time to hedge for downside price risk protection is when the futures price is in the upper
one-third of the historical price range? Yes ___ No ___ 15. All grain sellers have the psychological mind set to be effective hedgers in the futures market? Yes ___ No ___
Key: 1. No 2. Yes 3. No 4. Yes 5. No 6. Yes 7. Yes 8. Yes 9. Yes 10. Yes 11. No 12. Yes 13. Yes 14. Yes 15. No
The Hedging Game
The purpose of this game is to gain experience in making marketing decisions that involve hedging in the futures market. Anyone interested in using advanced marketing alternatives, such as futures or options, can gain valuable insight from playing The Hedging Game. The scenarios presented here are hypothetical, yet they are based upon actual marketing decisions that individual grain marketers become involved in from time to time. The game is hypothetical in the sense that it does not coincide with the current marketing year. It is also hypothetical in the sense that corn futures do not move 20¢/bu. on a given day very often. Yet, 20¢/bu. price moves in corn futures contracts are within the realm of possibility. The decision scenarios presented in this game have occurred many times.
51

Situation It is now May 1. Planting conditions have been good, and U.S. growing conditions are predicted to be ideal. The concern is that December futures prices could fall between now and harvest. December corn is trading at $2.40/bu., with the historic basis in this location recorded at 22 over. Even though the $2.40 offering places the December corn futures price in the upper one-third of the historic price range Rich, the grain seller, is still concerned that by pricing corn this early, he may give up an opportunity to price new-crop corn at a higher price. Even so, the $2.40 price is recognized as being a good and profitable price. Rich considers the flexibility afforded by hedging as appealing. A hedge placed at this level would provide an indicated net price of $2.62/bu. ($2.40 + 22-over basis). The Maximum Sales Price Objective is noted as being calculated at $2.10/bu., much lower than the $2.62 price represented by the hedge. Rich does not want to use a forward contract because of the lack of flexibility afforded to him, should the market turn higher. It is also noted that the basis offer for new-crop corn is being bid at 15 over, and the forward cash contract offer is currently at $2.55/bu. Given the historical basis of 22 over, Rich believes that the basis level for new-crop corn is likely to improve between now and harvest. Rich considers an at-the-money put option with a strike price of $2.40 (a $2.40 Dec Put option - .18¢/bu. premium + .22¢/bu. expected basis = $2.44¢/bu. MSP). The local loan rate is noted at $2.20/bu. Rich doesn’t think that he would gain very much by purchasing the put option at this time. Long-term weather forecasts are for adequate to abundant rainfall in the weeks ahead. Rich is convinced that the right thing to do is to hedge one-half of intended production at the current price level. In this case, half of intended corn production = 10,000 bushels. In contemplating the need to hedge using the futures market Rich has previously established a hedge account with a brokerage firm. The margin for a corn futures hedging account is $500/contract and the maintenance margin is $350/contract. Rich sends $1,000 in margin money for two corn contracts to the brokerage firm. Here is the course of action taken on May 1: Hedge 1 - Enter Date Cash Futures Basis May 1 Corn crop planted, Sell 2 Dec futures intends to grow 20,000 bu. @ $2.40/bu. 22 0ver (Expected) Two Dec corn futures contracts are sold at $2.40/bu. The account is margined for $1,000. The maintenance margin is $350 per contract or $700. On May 15, the market remains unchanged at $2.40/bu. The long-term weather forecast has not changed. Rich keeps the hedge in place. On May 30, an interesting turn of events occurs. Rich gets a call from the broker saying there has been a change in the weather forecast, or at least a change in how traders are now viewing it. Nevertheless, commodity traders at the Chicago Board of Trade are now concerned that a dry 30-day forecast means that the size of the corn crop could be reduced substantially. The market takes an abrupt turn higher and Dec corn futures shoot up to $2.50/bu. The broker is calling because a margin call is now due, for a total of $700 ($1000 debit from the $1,000 initial margin = 0 remaining + $700 the amount of the maintenance margin). The $700 needs to be sent immediately in order to maintain the account. Rich hesitates on making
52

the payment. The broker maintains that in the event that Rich was satisfied with the ‘locked-in’ hedge price then the position should be maintained. Rich makes the margin call. What would you do? On June 10, USDA issues a crop report that basically says that the U.S. is on track for a huge crop this fall. The corn market barely notices this report and proceeds to be driven by the bulls, who are speculating that a dry growing season is materializing. The National Weather Service is still forecasting an extended dry weather pattern. The crop, although not hurt yet, is said to be beginning to show a little stress. The best information that Rich can get seems to indicate that rains have been spotty throughout the U.S. growing regions. The Dec corn futures price is now trading at $2.60/bu., representing another 10¢/bu. margin call or $500 per contract, for a total margin call of $1,000 (placing the total deficit on the futures position at $3,700, including the initial margin). Rich makes the margin call and sends the broker $1,000. On June 12 Dec corn futures close at $2.70/bu., representing another $1,000 margin call. Rich is beginning to get worried. The margin calls are adding up to some serious money. The broker maintains that the hedge should be left in place because lifting it now might only complicate matters further. It is further noted that a nationally renowned meteorologist has been pointing out that weather forecasts at this stage in the game generally don’t mean much in terms of the eventual size of the U.S. crop. A decision is made to maintain the hedge and make the margin call. Rich sends the broker $1,000. Over the next two weeks, the market stays in a sideways trading pattern and just prior to the July crop report Rich’s position hasn’t changed. He is still down 30¢/bu. on the futures position for the corn that he has hedged. Word has it that U.S. growing conditions are improving in the Corn Belt, but nothing is confirmed as yet. Then the unexpected happens—the July 10 crop report begins showing a reduction in the size of this year’s crop. The bulls take the market further north and Rich gets another call from his broker. Dec corn futures have now moved to $2.90/bu., Rich is faced with another margin call for $2,000 (20¢/bu. or $1,000 per contract). Rich has a tough decision to make. He is now down 50¢/bu. on his futures position, $2,500/contract, for a total of $5,000. Rich’s frustration builds. He isn’t sure what to do at this point in time. All he can think of is that he is losing money in the futures market, big time. He must not lose sight of his original hedge price objective. Rich’s broker isn’t quite as worried, although concerned as to whether Rich will do the right thing. The broker is convinced that if Rich lifts the hedges now that matters can turn much worse. The broker reminds Rich that even though the futures position is losing money the cash position is gaining in value and that if the hedges are kept that they will perform as originally planned. The net price received is likely to be in the ballpark of the $2.62 ‘lock in’ price. Although Rich isn’t totally convinced, he is familiar with the “double whammy” and realizes that if he bails out now the results could be bad. Rich can decide to make the margin call and hang in there or he can decide to bail out. Rich decides to make the margin call and sends the broker $2,000. Simultaneously, reports are beginning to trickle in that USDA underestimated the size of this year’s crop. By July 15, the news is full of stories about crop-saving rains received in the Corn Belt. The market begins to turn south and Dec corn closes at $2.80/bu. That move represents a 10¢ gain for each futures position, or $500/contract for a total of $1,000. The $1,000 is credited to Rich’s account and he now is down by 40¢/bu. in the futures market on his hedges. Rich begins to think that perhaps things are going to work out. Reports continue coming in that the U.S. crop is improving and is likely to be very large. The reports seem to have more authority and confirmation behind them at this point in time. Rich keeps his initial hedges in place and decides to hedge another 5,000 bushels of his intended production at $2.80/bu. Here is the course of action taken:
53

Hedge 2 - Enter Date Cash Futures Basis July 15 Corn crop growing Sell 1 contract
in the field Dec corn @ $2.80/bu 22 over (expected) On July 16, the corn market continues to plunge and declines another 10¢/bu. Rich’s hedge 1 account is credited another $500 per contract or $1,000. On July 17, the market drops another 10¢/bu., $500 per contract, crediting Rich’s account another $1,000. On July 18, the market moves to $2.40, where it practically stays for the rest of the summer, representing a credit of $1,000 per contract, for a total of $2,000. Rich keeps his hedge 1contracts in place. Of course Rich's hedge 2 contracts are gaining in value as well. He decides to take his profit on the hedge 2 account, where he has accrued 40¢/bu. minus commission. With commission included, Rich figures he’ll have 38¢/bu. to count toward the now long cash position he is re-establishing on the 5,000 bushels in the hedge 2 account. Here is the course of action taken: Hedge 2 - Offset Date Cash Futures Basis July 18 Corn crop growing Buy 1 contract in field Dec corn @ 2.40/bu. N/A Gain or loss + $.40/bu. Futures trade result: Deposits total $ (500) Ending account balance 2,500 Commission (-) - 80 Profit or Loss +$1,920 $1,920/5,000 bu. contracted = $.38/bu. At this point, Rich is still hedged on 10,000 bushels of intended corn production in the hedge 1 account. He holds a long cash position on another 10,000 bushels of intended production on which he has profited 38¢/bu. on 5,000 bushels of that amount through the hedge 2 account. The arrival of the July rains in the Corn Belt has kept a lid on price advances since that time. Prices have hovered in a sideways trading pattern from July 18 through Sept. 15. The uncertainty prevailing in the U.S. concerning the actual size of the crop and the resulting ending stocks has also kept prices from declining further. Rich has spent the first couple of weeks in September getting ready for harvest. Harvest basis is being bid much stronger than usual due to a production shortfall in his local area. Rich is lucky; he has had the rain he needed. From Sept. 16 to Sept. 30, Rich harvests 10,000 bushels of corn, which he sells at the spot price which is offered at 40 over Dec. Rich offsets his two Dec futures contracts on Sept. 20, when December futures are trading at $2.35/bu. Here is the course of action taken: Hedge 1 offset Date Cash Futures Basis Sept. 20 Sell 10,000 bu. Buy 2 Dec contracts @ Cash corn @ $2.75/bu. 2.35/bu. 40 over Gain or loss +.05/bu. Net price Received: Sell cash corn @ $2.75/bu. Futures gain +.05/bu. Commission (-) -.02/bu. Net price received $2.78/bu. on the hedge 1 account
54

The original estimated net price for the hedge 1 account was $2.62/bu. The actual net price received for the account is $2.80/bu., excluding commission. Why is the actual net price received 18¢/bu. better than the original indicated return? A. Futures prices improved B. Basis tightened more than expected C. Basis widened more than expected D. Futures prices fell Key: B. because the harvest basis is 18¢ better than originally expected. As harvest continues, the basis remains strong. The production shortage in the area is unusual and very large. Rich harvests the rest of his corn the first two weeks of October, selling the remaining portion of his crop out of the field at 45 over Dec. for a cash price received of $2.70 (Dec futures $2.25 + 45 over basis = $2.70/bu). If we attribute the $1,920 profit received from the hedge 2 account to the 10,000 bushels that Rich sells at the spot price the actual net price received for the remaining portion of Rich’s crop is $2.89/bu. What is Rich’s average net sales price received for his 20,000-bu. corn crop? A. $2.89 B. $2.62 C. $2.80 D. $2.84 Key: D., $2.84/bu.
55

Worksheet #1: Margining a Hedge Account – The Hedge 1 Account Initial margin $ 1,000 Maintenance margin $ 700 Closing Business futures Gain or Old Call or Account day Date price loss balance deposit balance May 1 2.40 None None (1,000) $1,000 May 30 2.50 -1,000 1,000 ( 700) 700 June 10 2.60 -1,000 700 (1,000) 700 June 12 2.70 -1,000 700 (1,000) 700 July 10 2.90 -2,000 700 (2,000) 700 July 15 2.80 +1,000 700 1,700 July 16 2.70 +1,000 1,700 2,700 July 17 2.60 +1,000 2,700 3,700 July 18 2.40 +2,000 3,700 5,700 Sept. 20 2.35 + 500 5,700 6,200 Futures trade result: Deposits total $ (5,700) Ending account balance $ 6,200 Commission (-) -160 Profit or loss $ 340 Profit or loss/bu. on futures account $340/10,000 bu. contracted = $.03/bu. The Hedge 2 Account: Initial Margin $ 500 Maintenance Margin $ 350 Business Closing Day Date futures Gain or Old Call or Account price loss balance deposit balance July 15 2.80 None None ( 500) 500 July 16 2.70 + 500 500 1,000 July 17 2.60 + 500 1,000 1,500 July 18 2.40 +1,000 1,500 2,500 Futures trade result: Deposits total $ ( 500) Ending account balance $ 2,500 Commission (-) $ 80 Profit or loss $ 1,920 Profit or loss/bu. on futures account $1,920/5,000 bushels contracted = $ .38/bu.
56

Unit 6. MANAGING FINANCIAL RISK WITH CROP INSURANCE
AND MARKETING TOOLS
By G. A. (Art) Barnaby, Jr. Professor, Department of Agricultural Economics K-State Research and Extension Kansas State University Manhattan, KS 66506 Phone 785-532-1515 e-mail: [email protected]. January 3, 2003 Managing Risk Large public policy changes were made in government agricultural support programs as a result of the 2002 farm bill. Although these agricultural price supports have been widely reported as an increase in payments, that is not necessarily the case. Nor do they ensure profits or remove risk. The farm program, administered by the Farm Service Agency (FSA), includes a direct payment, a counter-cyclical payment and a marketing loan. Click here for details. The direct payment is not tied to either yield or price. The payment is based on the growers’ historical base and FSA program yield that was set in 1985. Growers may not update the yield or base acres for the direct payment. They are allowed to add a soybean (oilseed) base using their planted soybean acres, however, and payments are based on “calculated” 1985 soybean yields. The counter-cyclical payment is subject to price risk but not yield risk. In 2003, growers are allowed to update base acres for the counter-cyclical payment. If they update base acres, they are allowed to update payment yields based on proven yields for the 1998 to 2001 production years. Regardless of whether the grower is using the historical payment yield or an updated yield for counter-cyclical payments, there is no payment if the 12-month weighted national average price exceeds the “strike price” or affects the counter-cyclical payment. For example, if the 12-month weighted national average price exceeds $2.32 for corn, there is no counter-cyclical payment for corn. The Loan Deficiency Payment (LDP) is based on the current posted county price and the loan rate. If the PCP (daily on most crops) is below the loan rate, growers may collect an LDP on each bushel (or pound for some crops) that is harvested and to which growers still hold the title. The LDP payment is subject to both price and yield risk. If the crop fails, then there is no LDP payment even if the price is low. If the price is above loan, then there is no LDP payment, regardless of yield. Under the new farm program, the worst outcome is a poor crop and a price that is above the counter-cyclical payment “strike price.” The theory of the new farm program is that if prices are “high,” growers don’t need much government support because they will sell their crop for money in the cash market. That is true if growers produce a crop. But if the crop fails, growers have
57

fewer or no bushels to sell at the higher price and they would collect no counter-cyclical or LDP payments because of the higher price. Farm program payments do not guarantee profits for growers. Yet many growers and their lenders are assuming additional risks, and most growers do not have a written marketing and yield risk management plan. The lack of a written plan does not eliminate price and yield risk. Growers who do not market their grain are simply saying they will accept whatever the market is offering at harvest, or when payment of a note or other expense is due. These growers also have not identified how they will cover yield losses caused by weather factors beyond hoping Congress will provide another ad hoc disaster program or relying on the limited coverage provided in the catastrophic crop insurance contract (CAT). The improved prices in 2002, combined with poor yields in a large number of states, have highlighted these risks, and many growers are now willing to consider alternatives for managing risk. Risk to Lenders Lenders have a secondary risk position compared with producers. If the crop fails, lenders may have additional protection from default on loan payments through holding a security interest in land and machinery. These assets are often difficult to turn into cash for loan payments, however. Crop insurance is easily converted to cash if the crop fails, and the lender can take a security interest in the contract. While crop insurance often will cover the cash cost of production, there are low-cash-flow situations that it does not protect against. It is possible for a grower to suffer a 25% yield loss combined with lower prices, yet not trigger a crop insurance payment, for example. Many growers and their lenders consider revenue insurance coverage to be a major improvement over multi-peril crop insurance (MPCI). Revenue insurance products guarantee dollars per acre, so payments are triggered by a wider range of conditions. In many cases, with direct payments, counter-cyclical payments, marketing loans, credit reserves, equity, and marketing, combined with revenue insurance payments, growers will be able to cover their loan service requirements. Keep in mind, however, that higher prices eliminate the counter-cyclical payments and the market loan gains or LDPs. Some forms of revenue insurance increase their coverage when prices increase, and can help offset some of the loss in government payments. However, risks remain and often affect repayment capacity. Basis risk Most revenue insurance products use the futures market for price discovery. It is possible for the grower to meet the policy's revenue guarantee, and still have a cash shortfall because of a weak basis. For this reason, many lenders count only 85% to 90% of the revenue guarantee as a liquid asset. Quality risk Quality losses are a much larger risk. The revenue products use the MPCI procedure for adjusting quality losses. The quality losses are converted to a "yield loss" and then the adjuster follows the normal loss adjustment procedure. There have been cases, however, in which the cash bids for damaged crops were substantially lower than the loss procedure calculation and growers were left with a cash shortfall after adding cash sales and indemnity payments. Often, the quality loss
58

adjustment calculates a higher salvage value for a damaged crop than the market is willing to pay for it. In summary, crop insurance can be a tool to help growers meet their loan servicing requirements during poor crop years. However, one needs to understand there are remaining risks that growers need to manage. Current Risk Management Tools Producers of major crops are able to protect their production against falling prices by hedging in the futures market, buying options, or signing cash contracts such as forward contracts, hedged-to-arrive or open basis contracts, or minimum price contracts. Crop insurance that covers specific disasters such as hail insurance has been available for some crops for many years. Multi-peril crop insurance based on actual production history (MPCI-APH) broadened protection to cover yield losses from many causes, in addition to the traditional hail covers. More recently, policies have been introduced that allow growers to insure gross revenue. These include Crop Revenue Coverage (CRC) insurance, Income Protection (IP), Revenue Assurance (RA), Group Risk Plan (GRP), and Group Risk Income Plan (GRIP). Even newer products such as Average Gross Revenue (AGR) and AGR-Lite are available on a more limited basis. To see where these products are available. Catastrophic disaster coverage (CAT) is low-level protection provided to producers for an administrative fee of $100. USDA pays the full premium cost of the CAT contract. Most CAT contracts are MPCI-APH with 50% coverage at 60% of the price election. But growers may also select an IP or GRP contract at CAT level and USDA will pay the entire premium and the grower pays the $100 administrative fee. Growers who combine CRC or RA-HPO (RA with harvest price option), which includes yield replacement coverage and a price "insurance" strategy, effectively guarantee revenue. For example, growers who forward contract all of their bushels guaranteed under a CRC contract will have guaranteed a minimum cash flow. GRP and GRIP are available to growers in selected states on selected crops. Both of these contracts are based on the county yield or revenue; it does not matter what happens at the farm level. It is possible for the grower to have a total loss but receive no payment because the county does not suffer a loss; it is also possible to produce a normal crop and receive an indemnity payment because the county suffers a loss. The yield basis risk (difference between the county loss and the farm level loss) in these county products is retained by the grower. Sometimes, the grower will gain from retaining the yield basis risk but other times, the grower will lose on the yield basis risk. Effective and affordable risk management will require growers to retain (self-insure) some risk, but the effective manager will also pass some price and yield risk to third parties. In addition to crop insurance and price risk tools, growers also transfer risk by using the government program, diversifying products, and maintaining a lower financial leverage ratio. The proper mix of risk management tools depends on the grower's tolerance for risk, rate of farm growth, and possibly a requirement by his or her lender. Following is a discussion of the available risk management tools, their limitations, and how to use them in combination to manage risk.
59

Yield-based insurance products With MPCI, the guarantee is measured in bushels or pounds only. The coverage is specified by the insurance company's historical records or the producer's actual history (APH). Growers choose the percent of the crop covered. The higher the percent (the lower the uncovered "deductible", the more costly the insurance). Pay-out example: A grower who can prove a 133.3-bu. APH and purchases a 75% MPCI contract is guaranteed 100 bushels. If the harvested per-acre yield is 100 bu. or more, the grower would receive no MPCI indemnity payment. If yields are below 100 bu.—for example, 80 bu.—the grower receives an indemnity payment equal to the lost bushels times the price election. In this example, the 100 guaranteed bushels less the 80 bu. of production means a covered yield loss of 20 bu. The 20 lost bu. are multiplied by the price election, assumed to be $2 here, for a gross indemnity payment of $40/acre. The net indemnity payment is made after the premium is subtracted (Table 1). Note: The grower's "deductible" 25% of his average 133.3 bu. yield (33.3) is not covered, even at the $2 level. Growers who elect to take CAT coverage as an MPCI-APH contract would have a 50% deductible on yield and 40% deductible on the price election, but would pay no premium. Pay-out example for CAT electing MPCI-APH: A CAT-insured grower who can prove a 133.3-bu APH is guaranteed 66.7 bu. If the harvested per-acre yield is 66.7 bu or more, the grower would receive no indemnity payment. If yields are below 66.7 bu.—for example, 56.7 bu.—the grower receives an indemnity payment equal to the lost bushels time the price election. In this example, the 66.7 guaranteed bushels less the 56.7 bu. of production means a covered yield loss of 10 bu. The 10 lost bushels are multiplied by 60% of the $2 price election, for a gross indemnity payment of $12/acre. Growers pay no premium, so that is the net indemnity payment. Note: MPCI-APH coverage does not really guarantee bushels. While it is often discussed in terms of bushels guaranteed, in fact, it only guarantees bushels if the price equals the price election. Pay-out example: Using the standard MPCI-APH example above, with coverage at $2/bu. and 100 bu./acre, assume coverage on 100 acres (10,000 bu.). The harvest price must be $2 to guarantee all 10,000 bu. Suppose the Chicago Board of Trade (CBOT) December futures price is $2.52 in October, when the grower has to deliver 10,000 bu. on a contract he signed at an elevator, and basis is 10¢ under (cash price $2.42). The producer has a total yield loss, qualifying for a $20,000 indemnity. If the grower has to buy 10,000 bu. in the market at $2.42 to fill his contract (or pay the elevator that much to cancel the contract), his indemnity payment is only enough to replace 8,264 bu. The remaining 1,736 bushels, at a cost of $4,201, must be bought from grower's equity or borrowed funds. Note what happens when prices fall: In our example, suppose harvest price drops to $1.82. A current yield of 100 bu. would generate no indemnity payment under MPCI-APH (Table 4). All growers would receive counter-cyclical payments based on their FSA yield and 85% of their base acres and loan deficiency payments on 100 bu. (which is 75% percent of expected production in this example). The 25% of the yield that was lost receives no LDP payment. Congress has heard numerous complaints about the federal crop insurance program. Many growers would prefer a policy that provides dollar protection rather than bushels. In addition,
60

many growers believe the current federal crop insurance program over compensates poor managers and under compensates the best growers. Crop Revenue Coverage (CRC) or Revenue Assurance with Harvest Price Option (RA-HPO) The CRC contract was developed in 1996 to address many of MPCI's coverage issues. CRC covers revenue losses caused by yield losses, low crop prices, or a combination of the two. In addition, CRC coverage automatically increases if the market value of the crop increases, without payment of additional premiums. Similar to MPCI-APH, growers may select different deductibles that range from a low of 15% to a high of 50%. Revenue Assurance originally offered fixed revenue guarantee per acre, but added the harvest price option (RA-HPO) in 2000, and now provides coverage similar to the CRC contract. Pay-out example: In 2002, corn growers with an average yield of 133.3 bu., choosing a 75% CRC or RA-HPO policy, would have purchased $232 of minimum coverage. Under a MPCI-APH contract with 75% coverage and a price election of $2, these growers would have $200 of coverage. Note: If this insured grower produced only 70 bu. of corn, the MPCI-APH contract would pay 30 bu. X $2, for a total of $60/acre. Because 2002 corn prices were higher in October, when CRC's fall price coverage is calculated, the CRC contract’s minimum dollar guarantee automatically increased from $232 to $252. The CRC-insured grower would have generated $176.40 of revenue (70 bu. produced X $2.52 market price) to count against the higher guarantee of $252. His or her resulting indemnity payment would have been $75.60/acre. (RA-HPO coverage also increased but only to $2.43 because corn's harvest price is measured in November rather than October for corn. The RA-HPO insured grower would have generated $170.10 of revenue (70 bu. produced X $2.43 market price) to count against the higher guarantee of $243. His or her resulting indemnity payment would have been $72.90/acre. Over the long run, the expected pay-out is the same for both products, but will differ within a single year. CRC or RA-HPO and Marketing. Because of the increased market value of the crop, the CRC payment was 26% higher than the MPCI-APH payment. And, if one divides the $75.60 indemnity payment by the harvest market price of $2.52, they payment will replace all of the 30 bu. that were lost at current market value if needed to fulfill a sales contract. As noted earlier, MPCI-APH coverage would leave the grower short. CRC and RA-HPO guarantee the inventory at replacement value. That will allow growers to sell the inventory when the price is good, rather than after the grain is harvested and put in storage. CRC or RA-HPO will extend the marketing window up to a year before harvest. Also, any indemnity caused by falling prices will not be reduced if the grower sells the crop at a higher price. There is no penalty for doing a good job of marketing. Revenue Assurance (RA) or Income Protection (IP) The government is also offering its version of revenue insurance, known as Income Protection (IP). It is offered in selected counties for soybeans, wheat, corn, grain sorghum, barley and cotton.
61

RA was developed by a private company under the same rules as CRC. It is offered on corn, soybeans, wheat, cotton, and sunflowers in selected states. Although IP and RA without the harvest price option may appear to be similar to CRC\RA-HPO, there are very real differences. Under IP and RA, the indemnity payment falls as market prices increase! Under the IP or RA (no HPO) revenue insurance design, when prices increase, it requires a larger yield loss than CRC, RA-HPO or MPCI to trigger payments. If the price were to increase by $1, using our earlier example, it will require a crop yield below 70 bu. to trigger IP or RA (no HPO) payments. By contrast, CRC, RA-HPO, and MPCI would only require a yield of less than 100 bu. to trigger payments. Growers with IP\RA would have had a $232 guarantee. The revenue-to-count would have been 70 bu. produced times $3.32 or $232.40 of revenue, and the indemnity payment is zero! Growers have lost 47% of their crop, they receive no loan deficiency payment or counter-cyclical payments because of the higher price, no IP\RA payment, and they must pay the crop insurance premiums. If they had forward contracted their expected production, they would likely have cancellation penalties or would suffer margins losses if they had hedged the crop on the futures markets (Table 3). For growers who only suffered losses in years like 1993, their IP and RA insurance indemnity payments would have fallen at the very time growers needed coverage. IP and RA policies do not limit payment reductions caused by higher market prices—i.e., the higher the price, the lower the payment. Many of the very best growers producing in the best growing regions often expect that if they suffer a crop yield loss, their neighbors will also suffer a crop yield loss. Under those conditions, growers often experience prices rising and under an IP or RA (no HPO) program, and they would suffer lower indemnity payments in the very year they have a crop loss. Note that the IP payment under most loss scenarios is reduced further because IP does not insure units or optional units independently but averages all of the grower's acres into one unit. Because the IP losses are averaged across the entire farm rather than a sub-farm unit, in most cases, the IP indemnity payment will suffer further reductions in a loss year. RA does offer basic, optional, enterprise, and whole-farm units. Pay-out example: Using the yield and price assumptions in the previous examples, if the corn market price increased to $2.52, it would have required a yield below 92 bu. for the 75% IP or RA (no HPO) to trigger an indemnity payment. Most growers would have suffered additional IP payment reductions because losses would have been averaged across the entire farm rather than a single sub-farm unit. CRC and RA-HPO, on the other hand, do exactly the opposite. They increase the indemnity payment when market prices are rising. That is extremely important for growers who have already sold their inventory ahead of harvest, and are now faced with margin calls or cancellation penalties on forward contracts. Growers insured with IP\RA will not receive enough indemnity payments to replace the inventory in a rising market. Also, any production is valued at the higher current market value and counted against the IP or RA guarantee and the result will be to replace even fewer of the lost bushels. GRP pay-out example: The GRP payment is based on the expected county yield. The grower selects a coverage level from 65% to 90%. The grower's payment would be based on the expected
62

county yield (117.6 bu. in this example) times selected coverage level (85%) less the current county yield (70 bu) divided by the guaranteed county yield (117.6 X 85% = 100 b.) [(117.6 bu. X 85%) - 70 bu.] / 100 = 30% GRP loss. The grower would then be paid 30% of the coverage dollars purchased. If the grower purchased $200 of coverage, the indemnity payment would be 30% X $200 = $60. The maximum dollars of coverage growers may buy is 150% of the MPCI-APH established price times the expected county yield. Comparison of Revenue and Yield Loss Policies If prices increase by 20¢, the CRC coverage would increase from $232 ($2.32 spring price X 133.3 APH X 75% coverage) to $252 ($2.52 harvest price X 133.3 APH X 75% coverage). (RA-HPO harvest price was $2.43, and the numbers are slightly less than the CRC harvest price but, with a small yield loss, the indemnity payment is very similar.) The yield would need to fall below 100 bu. to trigger a payment. If yields were 80 bu., for example, the revenue to count under CRC, IP, and RA would be 80 bu. times the harvest price: Revenue to count for CRC would equal $2.52 X 80 bu. = $201.60. The CRC contract would pay $252.00 (the higher fall guarantee) less the revenue to count of $201.60, generating a CRC indemnity payment of $50.40. The IP or RA (no HPO) payment would equal the lower guarantee of $232 less the revenue to count of $194.40, for an indemnity payment of $37.60. The premiums must be deducted to reach the net indemnity payment (Table 1). Here's what happens if fall prices are lower than the spring price: The minimum revenue guarantee is still $232 (133.3 bu. APH X $2.32 spring market price X 75% coverage). If the price falls by 32¢, to $2, the revenue to count would be $160 (80 bu. production X $2 harvest price). The indemnity payment would equal $232 minus $160, for a payment of $72 for IP, CRC, and RA. The premium must then be subtracted from the indemnity payment (Table 2). Under the scenario of low yields and high prices, CRC or RA-HPO pay the most. MPCI-APH would pay the next most. IP\RA (no HPO) would pay the least. In our example, CRC\RA-HPO would have paid $99.60, MPCI-APH would have paid $60 and IP\RA (no HPO) would have paid nothing (Table 3). Market Acceptance Crop Revenue Coverage was introduced in 1996. RA was introduced in 1997 without the harvest price option. The harvest price option was added to the RA contract in 2000. In 2002, CRC and RA generated over $1.4 billion in premiums, providing over $14.025 billion of minimum coverage on 92.5 million acres. MPCI-APH generated over $1.01 billion in premiums, providing over $11.854 billion of coverage on 73 million acres. On the major field crops of corn, soybeans, grain sorghum, wheat, rice and cotton an even larger share of the coverage is now revenue insurance because the MPCI-APH data include a large number of crops that have no revenue insurance policy. LIMITATIONS OF REVENUE INSURANCE Revenue Insurance Basis. The price used to calculate the revenue to count against the revenue insurance guarantee is often substantially higher than the local cash price. The reason for this is that the price used to calculate the revenue to count is based on the Chicago price (Kansas City or
63

Minneapolis price for some classes of wheat), which is normally higher than the local cash price in most locations. On the surface this seems unfair, but what growers often forget is that their guarantee is set on the higher futures price, and the net indemnity payment would be similar if a negative basis were subtracted from both the guarantee and revenue-to-count. Quality Losses. Quality losses are the major remaining risk. The revenue products use the MPCI procedure for adjusting quality losses. It is possible for the cash price to be substantially discounted for quality losses, and not trigger the indemnity payment. If the normal basis is 15¢ under, for example, but the grower is being bid 80¢ under for quality-damaged corn, that lower price is not used to adjust revenue losses. The revenue-to-count always uses the undamaged futures price. If the quality adjustment does not lower the yield to count enough to offset the lower value, the resulting sales plus indemnity payments will not equal expected cash flow. Macro Level Market Risk. MPCI-APH and revenue insurance coverage decrease when market prices are lower at the start of the growing season. For this reason, the current crop insurance program is not a good tool for income enhancement. Crop insurance is a good tool for managing revenue and yield risk within a year. Futures and put options allow for with-in-year price risk management but are of little help with between-year price declines. When market prices are low, futures and options offer very few opportunities to price the crop at a profit. In years with low prices, futures and options are not a good tool for income enhancement either. In addition, they insure only price, so farmers with weather-related yield losses will discover futures and options are of limited help. Excel Budget A budget and figure was developed to allow growers to see the impact on their farm. An example farm appears, but the values can be changed to reflect your personal situation (Table 5). In the example, the expected yield, on line 1, column c, was 133.3 bu. The current year’s crop, entered in line 1, column f, was 20 bu. The FSA direct program yield is based on the old historical base yield set in 1985. Typically, this yield is lower than the expected yield because yields have trended upward over time. In the example, on line 2, column c, a 110 bu. was entered for program yield. The FSA allows you to prove yields for the new counter-cyclical payment. In this example it was assumed the grower could prove a higher yield of 133.3 bu. (line 2, column f). The target price of $2.60 was entered for corn on line 3, column c. The direct payment for corn is 28¢ (line 3, column f). The national loan rate for corn is $1.98 (line 4, column c). The county loan rate is $1.98 in the example, but you would want to enter their your county loan rate on line 4, column f. Obviously, the target prices and county loan rates would need to be changed to fit other program crops. The posted county price (PCP) is generated daily and posted in the county FSA office. In the example, it was assumed that the posted county price was $2.38 on line 5, column c. The local cash price may often be lower or, in some cases, higher than the PCP. In the example, it was assumed the local cash harvest price was $2.42.
64

In the next section, you input a marketing plan for your farm. In the example, we assume the grower did not sell futures or buy put options. It assumes the grower forward contracted production at $2.72 (line 9, column f). The model applies any put, futures, or forward contracted bushels to the “insured production" field. The model does not allow you to sell futures and buy calls, but you can represent this by buying puts. On line 10, column c, enter your crop insurance APH yield, which is 133.3 bu. for the example farm. The coverage level selected can be from 65% to 85%. In this example, 75% is entered on line 10, column f. The MPCI price election is set by the Risk Management Agency (RMA) prior to sales closing. For 2002, the it was $2 (line 11, column c). The MPCI premium in the example was $6.46/acre for a 75% guarantee on 133.3 bu. average yield and a $2 price election (line 11, column f). You need to enter the premium that is appropriate for your farm. (This can be found by going to the RMA web page and running their premium calculator — http://www3.rma.usda.gov/apps/premcalc/) The CRC base price, which is the February average of December corn (the other base prices for other crops are located on the RMA web page) is entered on line 12, column c. CRC also has a maximum price change ($1.50 for corn and grain sorghum, $2 for wheat, $3 for soybeans, and 70¢ for cotton). The maximum CRC price change is entered on line 12, column f. The CRC harvest price is based on the October average of December corn (2002, the value was $2.52). It is entered on line 13, column c. This is also the liquidation price for futures contracts or put options, if purchased. The CRC premium entered on line 13, column f, can be generated for your farm by going to the RMA Web page. The RA contract that is available in many states has the same corn base price as CRC, defined as the February average of December corn for states with a sales closing date of March 15. The base prices for both RA and CRC for counties can be located on the RMA Web page and would be different for counties that have a sales closing date that is earlier than March 15. The RA base price is entered on line 14, column c. RA harvest price is defined as the November average of December corn. It was $2.43 for the 2002 RA contract (line 14, column f). The RA premium without the harvest price option is entered on line 15, column c and with the harvest price option is entered on line 15, column f. Once the data are entered, select the budget and it will you a comparison of no insurance, CAT coverage, MPCI, CRC, RA-HPO and RA (Table 6). The budget also calculates sales income based on the cash sales price. If sold with futures, it will use the futures price based on liquidation plus the basis. The cash sales price is based on the yield produced times the local cash harvest price. This was $2.42 in the example farm on line 4 in Table 6. The government payments are calculated on line 6 and 8. The total government payment is then calculated on line 9. The futures liquidation price is on line 11 and the loss or gain per bushel from the transaction is located on line 15. The put liquidation price is located on line 13, and the put loss or gain is located on line 15. The gain or loss from forward contracting is located on line 16. The model calculates the gain or loss as the difference between cash price on line 4 and the forward contract price. There was a 30¢/bu. gain on the forward contract in this example on line 16.
65

Line 19 shows the coverage level with the first option being no insurance. The second option is CAT coverage, followed by MPCI-APH, CRC, RA, and RA without the harvest price option. Outcomes of the example In the example, the CAT guarantee is 50% of the proven yield or 66.7 bu. X the base price election X 60%, which would provide $80.04 of CAT coverage. CAT would have lost 46.7 bu., which equals the guaranteed bushels less the 20 bu. that were produced. The indemnity payment is 46.7 bu. lost X the MPCI price election of $2 X 60%, generating a payment of $56.04. The premium for CAT is zero because farmers do not pay premium. They do, however; pay a $100 processing fee, which would be a very small amount per acre on a “large” farm. The 75% MPCI contract guarantees 100 bu. with a $2 price election. The grower produced 20 bu., meaning there were 80 bu. lost on line 26 and the indemnity payment is 80 bu. X $2, generating a payment of $160 on line 28. The 75% CRC contract generated an initial minimum revenue guarantee of $232; however the final price increased to $2.52 X 75% X 133.3, generating a final revenue guarantee of $252, which is higher than the minimum guarantee set at sign-up time of $232. The revenue-to-count would be 20 bu. X $2.52 or $50.40, which would be deducted from the higher $252 guarantee, generating an indemnity payment of $201.60 on line 28. RA-HPO had an initial guarantee of $232, the same as CRC, but it increased less in the fall in 2002 because the harvest price was measured in November rather than October. The harvest price was $2.43 X 133.3 bu. APH X 75%, which generates a final guarantee of $243. That is higher than the guarantee set at sales closing time and the grower always gets the higher guarantee. The grower would have 20 bu. X the harvest price of $2.43, generating a revenue-to-count of $48.60 to be deducted from the higher $243 guarantee, generating an indemnity payment of $194.40 on line 28. The grower who did not buy the harvest price option with RA would not have the guarantee increase based on the higher price at harvest. The final guarantee for RA without the harvest price is the same as the minimum guarantee of $232. The revenue-to-count would be $48.40, subtracted from $232, generating an indemnity payment of $183.60 reported on line 28. One would then need to deduct the insurance premiums to reach the net indemnity payments reported on line 30. The net revenue gain or loss is reported on line 31. This combines crop cash sales, government payments, gains and losses from marketing, and the crop insurance payments. This is the amount of cash available to cover the operating expenses including depreciation, direct cash costs and withdrawals for family living expenses.
66

Table 1. Indemnity Payments If Price Increases Indemnity Payment MPCI CRC RA-HPO RAAPH 133.3 133.3 133.3 133.3Coverage Level \Deduct 75% 75% 75% 75%Bushels Guaranteed 100.0Enter MPCI Price Election $2.00 $2.32 $2.32 $2.32$ of Coverage \ Acre 200.00Min Revenue Guarantee 232.00 232.00 232.00Max Revenue Guarantee 382.00 No Limit No LimitFinal Guarantee 252.00 243.00 232.00Current Year's Crop (bu) 80.0 80.0 80.0 80.0Lost Bushels 20.0Harvest Average Price 2.521 2.432 2.432
Revenue to Count 201.60 194.40 194.40Indemnity Payment 40.00 50.40 48.60 37.60Premium Cost per Acre 6.46 12.27 12.27 9.00Net Indemnity Payment 33.54 38.13 36.33 28.60
1Harvest Price Equals October average CBOT December 02 corn closing Price.2Harvest Price Equals November average CBOT December 02 corn closing Price. Table 2. Indemnity Payments If Price Decreases to $2 Indemnity Payment MPCI CRC RA-HPO RAAPH 133.3 133.3 133.3 133.3Coverage Level \Deduct 75% 75% 75% 75%Bushels Guaranteed 100.0Enter MPCI Price Election $2.00 $2.32 $2.32 $2.32$ of Coverage \ Acre 200.00Min Revenue Guarantee 232.00 232.00 232.00Max Revenue Guarantee 382.00 No Limit No LimitFinal Guarantee 232.00 232.00 232.00Current Year's Crop (bu) 80.0 80.0 80.0 80.0Lost Bushels 20.0Harvest Average Price $2.00 $2.00 $2.00Revenue to Count 160.00 160.00 160.00Indemnity Payment 40.00 72.00 72.00 72.00Premium Cost per Acre 6.46 12.27 12.27 9.00Net Indemnity Payment 33.54 59.73 59.73 63.00
67
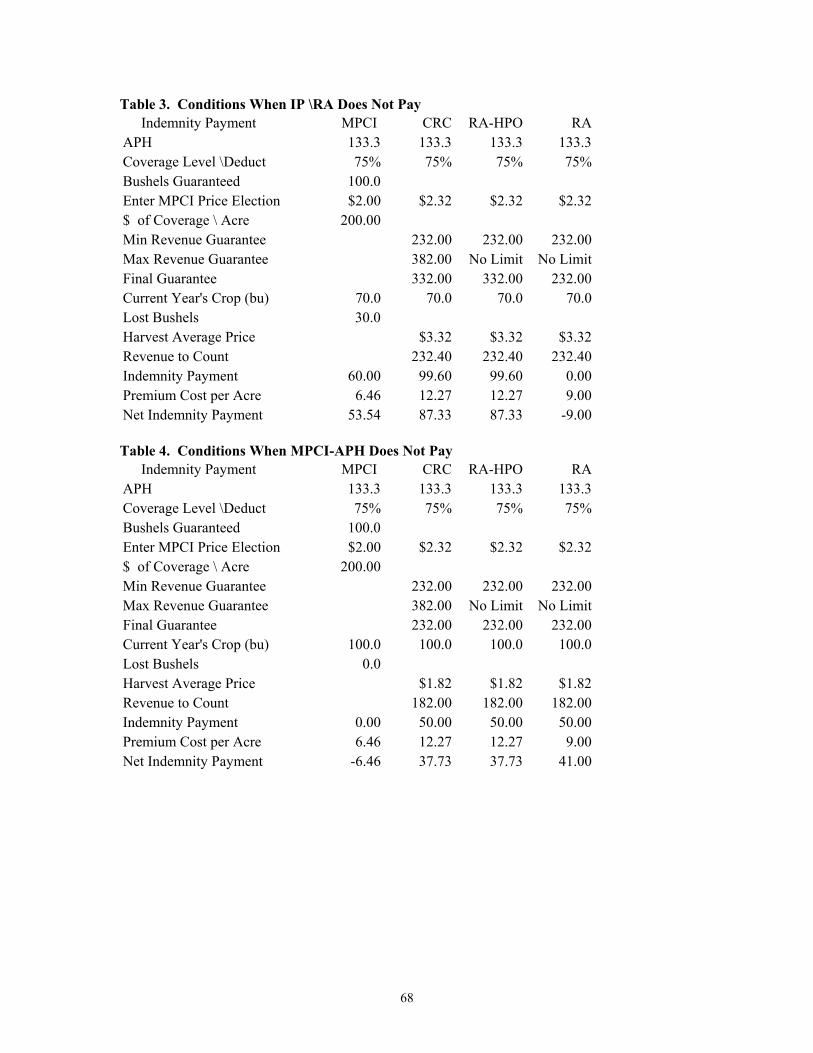
Table 3. Conditions When IP \RA Does Not Pay Indemnity Payment MPCI CRC RA-HPO RAAPH 133.3 133.3 133.3 133.3Coverage Level \Deduct 75% 75% 75% 75%Bushels Guaranteed 100.0Enter MPCI Price Election $2.00 $2.32 $2.32 $2.32$ of Coverage \ Acre 200.00Min Revenue Guarantee 232.00 232.00 232.00Max Revenue Guarantee 382.00 No Limit No LimitFinal Guarantee 332.00 332.00 232.00Current Year's Crop (bu) 70.0 70.0 70.0 70.0Lost Bushels 30.0Harvest Average Price $3.32 $3.32 $3.32Revenue to Count 232.40 232.40 232.40Indemnity Payment 60.00 99.60 99.60 0.00Premium Cost per Acre 6.46 12.27 12.27 9.00Net Indemnity Payment 53.54 87.33 87.33 -9.00 Table 4. Conditions When MPCI-APH Does Not Pay Indemnity Payment MPCI CRC RA-HPO RAAPH 133.3 133.3 133.3 133.3Coverage Level \Deduct 75% 75% 75% 75%Bushels Guaranteed 100.0Enter MPCI Price Election $2.00 $2.32 $2.32 $2.32$ of Coverage \ Acre 200.00Min Revenue Guarantee 232.00 232.00 232.00Max Revenue Guarantee 382.00 No Limit No LimitFinal Guarantee 232.00 232.00 232.00Current Year's Crop (bu) 100.0 100.0 100.0 100.0Lost Bushels 0.0Harvest Average Price $1.82 $1.82 $1.82Revenue to Count 182.00 182.00 182.00Indemnity Payment 0.00 50.00 50.00 50.00Premium Cost per Acre 6.46 12.27 12.27 9.00Net Indemnity Payment -6.46 37.73 37.73 41.00
68

Table 5. Input Form for Computer Model Input Data for Your Farm
Ln # Column Letter "C" "F"
Input Crop Data1 Expected Yield 133.3 Current Year's Crop (bu) 20.02 FSA Direct Progam Yield 110.0 FSA Counter Cyclical Yield 133.33 Target Price $2.60 Direct Payment $0.284 National Loan Rate $1.98 County Loan Rate $1.985 Posted County Price (PCP) $2.38 Local Cash Harvest Price $2.42
Input Marketing Plan6 Sale Futures Y/N n Buy Puts N7 Futures Price $2.82 Futures Price at Sale of Crop $2.528 Put Strike $2.50 Put Premium $0.189 Forward Contract (Y/N) y Forward Contract Price $2.72
Input Crop Insurance Data10 Crop Insurance APH Yield 133.3 Coverage Level 75%11 MPCI Price Election $2.00 MPCI Premium $6.4612 CRC Base Price $2.32 Max CRC Price Change $1.5013 CRC Harvest Price $2.52 CRC Premium $12.2714 RA Base Price $2.32 RA Harvest Price $2.4315 RA Premium $9.00 RA-HPO Premium $12.27
69

Table 6. Budget Results from Computer Model Net Revenue from Sales, Government Payments, Futures, and Crop Insurance
# No CAT MPCI CRC RA- RAProduction & Sales Ins. HPO
2 Expected Yield 133.3 133.3 133.3 133.3 133.3 133.33 Current Year's Crop (bu) 20.0 20.0 20.0 20.0 20.0 20.04 Harvest Average Price 2.42 2.42 2.42 2.42 2.42 2.425 Sales 48.40 48.40 48.40 48.40 48.40 48.40
Government Payments6 Counter Cyclical Pymt * 85% 0.00 0.00 0.00 0.00 0.00 0.007 Direct Pymt Yield (DPY) 110.0 110.0 110.0 110.0 110.0 110.08 Direct Pymt * 85% * DPY 26.18 26.18 26.18 26.18 26.18 26.189 Total Government Payments 26.18 26.18 26.18 26.18 26.18 26.18
Gain\Loss From Futures10 Futures Sales 2.82 2.82 2.82 2.82 2.82 2.8211 Futures Liquidation 2.52 2.52 2.52 2.52 2.52 2.5212 Put Strike 2.50 2.50 2.50 2.50 2.50 2.5013 Put Liquidation 2.52 2.52 2.52 2.52 2.52 2.5214 Put premium 0.18 0.18 0.18 0.18 0.18 0.1815 Futures-Put Gain\Loss Bu. 0.00 0.00 0.00 0.00 0.00 0.0016 Forward Contract Gain\Loss 0.30 0.30 0.30 0.30 0.30 0.3017 Gain\Loss per Ac. 29.99 29.99 29.99 29.99 29.99 29.99
Crop Insurance18 Crop Insurance APH 133.3 133.3 133.3 133.3 133.3 133.319 Coverage Level 50% 75% 75% 75% 75%20 Bushels Guaranteed 66.7 100.021 Price Election\Base Price 2.00 2.00 2.32 2.32 2.3222 Harvest Average Price 2.52 2.43 2.4323 $ of Coverage \ Acre 80.04 200.0024 Min Revenue Guarantee 232.00 232.00 232.0025 Final Guarantee 252.00 243.00 232.0026 Lost Bushels 46.7 80.027 Revenue to Count 50.40 48.60 48.4028 Indemnity Payment 56.04 160.00 201.60 194.40 183.6029 Less Farmer Paid Premium 0.00 6.46 12.27 12.27 9.0030 Net Indemnity Payment 56.04 153.54 189.33 182.13 174.6031 Net Revenue Lost\Gain 104.57 160.61 258.11 293.90 286.70 279.17
70

Unit 7. Selected Resources
Electronic Sources of Grain Marketing Information Introduction Grain marketing information is readily available on the Internet. Informational sites are available from government agencies and universities, private firms, associations, business and consulting firms. Information that can be found pertains to: current events; publications; charts; maps; price quotes; historical data on supply, demand and basis; searches; market news; and market information. Anyone can find specific information by conducting personalized searches. The list given below highlights just a few sources of electronic information currently available on the Internet. Market News, Quotes, Basis and Other Information Farm Journal Media http://www.agweb.com/ USDA's National Agricultural Statistics Service http://www.usda.gov/nass/ Chicago Board of Trade http://www.cbot.com/ American Soybean Association http://www.soybean.org/ Economic Research Service http://www.ers.usda.gov/ Farm Service Agency http://www.usda.gov/farmbill/ Food and Resource Economics, University of Delaware http://ag.udel.edu/departments/frec/ Commodity Futures Trading Commission http://www.cftc.gov/cftc/cftccustomer.htm National Futures Association http://www.nfa.futures.org/ Grain Marketing Discussion Group This is an electronic forum for the purpose of communicating/networking on the subject of grain marketing. This forum is an electronic grain-marketing club. The purpose of the discussion group is to provide grain and oilseed producers, merchandisers, traders, analysts, industry representatives, educators, and other interested parties a timely forum for addressing grain-marketing issues. Participants in the grain marketing discussion group can enter or receive information on any and all aspects of grain marketing, marketing alternatives, and marketing strategies.
71

To subscribe to the grain marketing discussion group send a message to < [email protected] > with the only message in the text that reads: subscribe [email protected] When completed the message sent to majordomo should read as follows: To: [email protected] Copy: Subject: Body of Text: subscribe [email protected] After successfully subscribing, a message is received from majordomo welcoming you to the grain marketing discussion group. To unsubscribe, send a message to [email protected] with the only message in the text: unsubscribe [email protected] This discussion group operates as a closed group, meaning the integrity of the site is maintained by listings to the group having to be approved by the list owner.
72