
The Evolution of Mutation Rates - Department of Zoology, …johnson/seminar.pdf · Evolution of new...
42
The Evolution of Mutation Rates Toby Johnson [email protected] University of British Columbia, Vancouver, Canada 1
Transcript of The Evolution of Mutation Rates - Department of Zoology, …johnson/seminar.pdf · Evolution of new...

The Evolution of Mutation Rates
Toby Johnson
University of British Columbia, Vancouver, Canada
1

Why are mutation rates interesting ?
(1) Mutations are the ultimate source of heritable variation
2
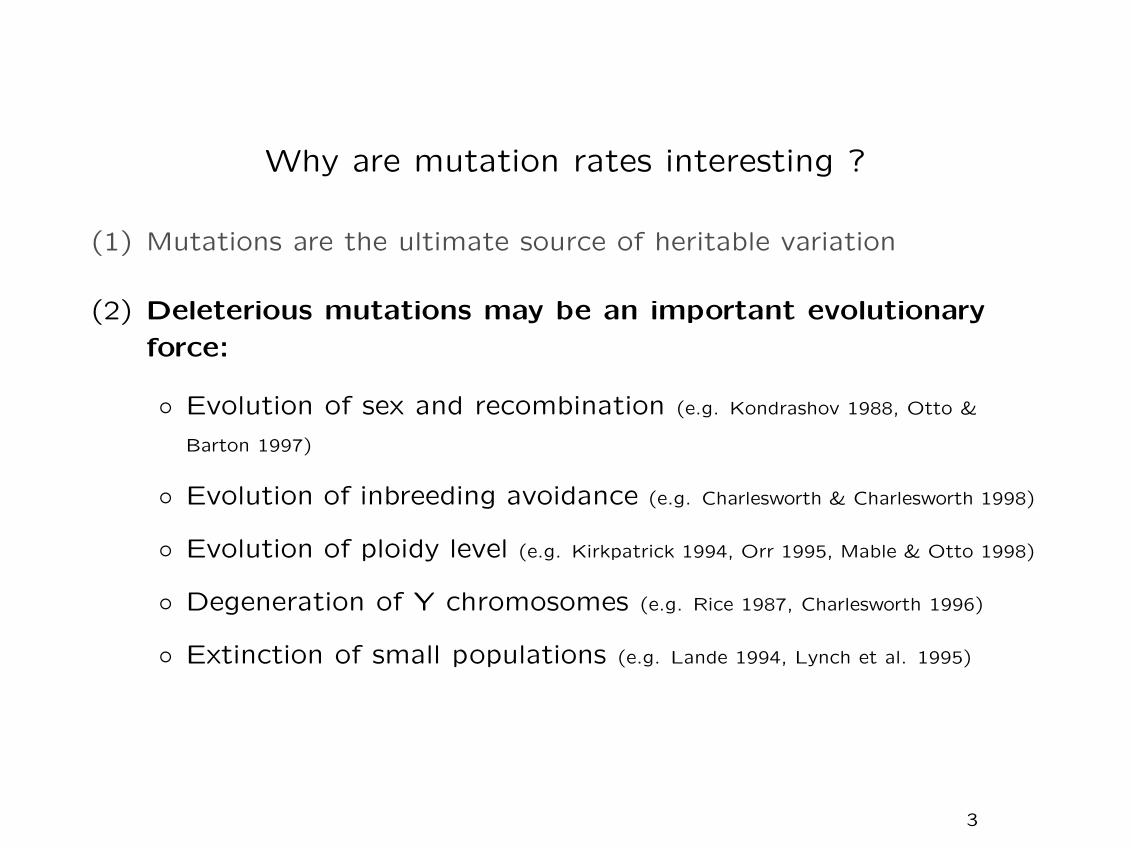
Why are mutation rates interesting ?
(1) Mutations are the ultimate source of heritable variation
(2) Deleterious mutations may be an important evolutionary
force:
◦ Evolution of sex and recombination (e.g. Kondrashov 1988, Otto &
Barton 1997)
◦ Evolution of inbreeding avoidance (e.g. Charlesworth & Charlesworth 1998)
◦ Evolution of ploidy level (e.g. Kirkpatrick 1994, Orr 1995, Mable & Otto 1998)
◦ Degeneration of Y chromosomes (e.g. Rice 1987, Charlesworth 1996)
◦ Extinction of small populations (e.g. Lande 1994, Lynch et al. 1995)
3
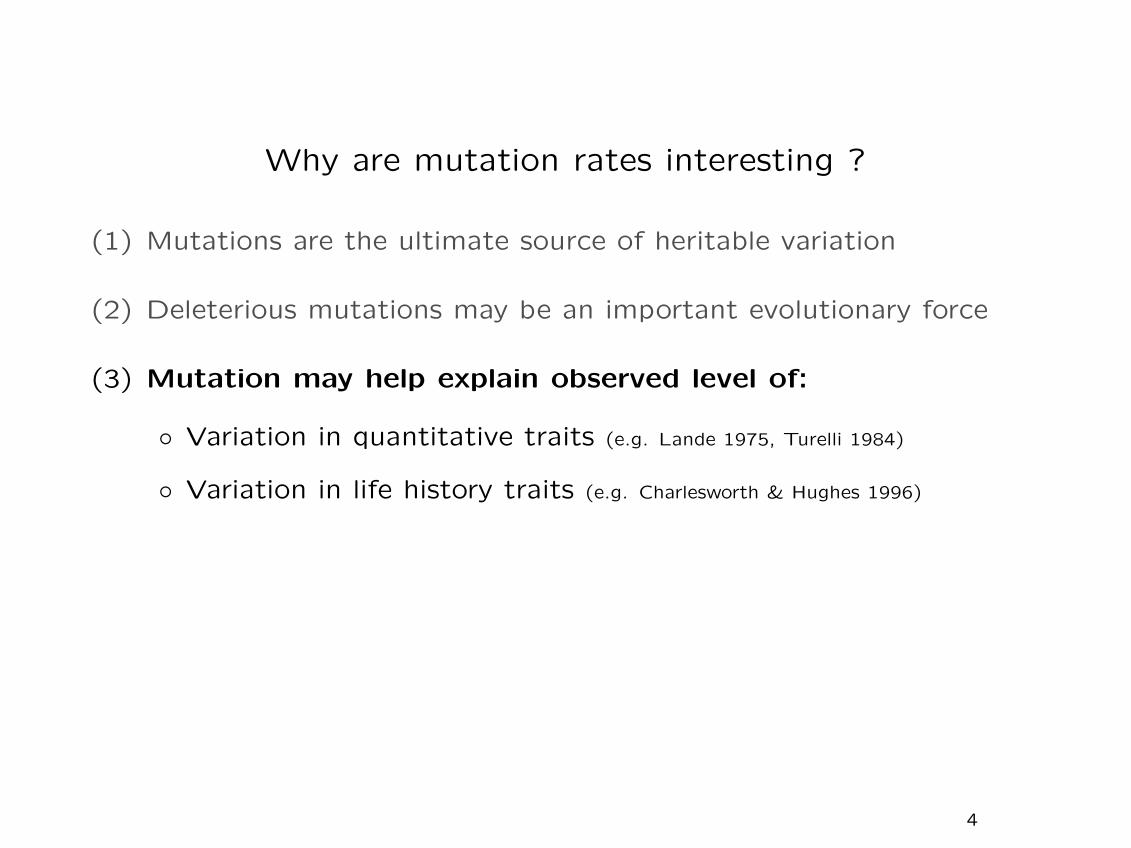
Why are mutation rates interesting ?
(1) Mutations are the ultimate source of heritable variation
(2) Deleterious mutations may be an important evolutionary force
(3) Mutation may help explain observed level of:
◦ Variation in quantitative traits (e.g. Lande 1975, Turelli 1984)
◦ Variation in life history traits (e.g. Charlesworth & Hughes 1996)
4

Why are mutation rates interesting ?
(1) Mutations are the ultimate source of heritable variation
(2) Deleterious mutations may be an important evolutionary force
(3) Mutation may help explain observed level of variation
(4) Cells with atypical mutation rates have been implicated in
◦ Cancer (e.g. Loeb and Loeb 2000)
◦ Evolution of new pathogenic strains of bacteria (e.g. LeClerc et al.
1996, Picard et al. 2001)
◦ Survival of bacteria in sterilised foods (Anderson et al. 1956, White et al.
1999)
5
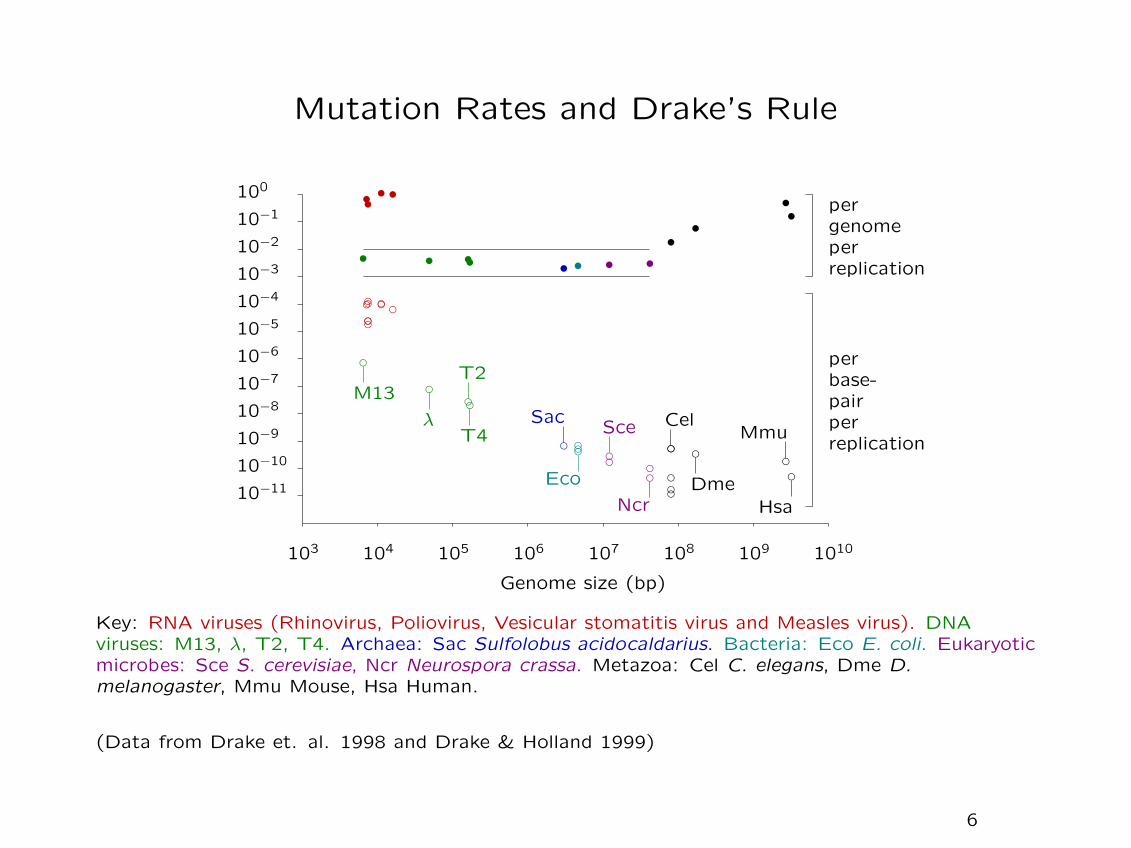
Mutation Rates and Drake’s Rule
103 104 105 106 107 108 109 1010
10−11
10−10
10−9
10−8
10−7
10−6
10−5
10−4
10−3
10−2
10−1
100
Genome size (bp)
perbase-pairperreplication
pergenomeperreplication
d
t
ddddd
t
dd
t
d
t
d
t
M13 d
t
λ
d
t
T2d
t
T4 d
t
Sac
ddd
t
Eco
dd
t
Sce
dd
t
Ncrddddd
t
Cel
d
t
Dme
d
t
Mmu
d
t
Hsa
Key: RNA viruses (Rhinovirus, Poliovirus, Vesicular stomatitis virus and Measles virus). DNAviruses: M13, λ, T2, T4. Archaea: Sac Sulfolobus acidocaldarius. Bacteria: Eco E. coli. Eukaryoticmicrobes: Sce S. cerevisiae, Ncr Neurospora crassa. Metazoa: Cel C. elegans, Dme D.melanogaster, Mmu Mouse, Hsa Human.
(Data from Drake et. al. 1998 and Drake & Holland 1999)
6

Genetic basis of mutation rates
Many loci involved in DNA replication, proofreading and mismatch
repair; they control the mutation rate over the whole genome
Example: In vitro analysis of DNA polymerase purified from phage T4
0.00 0.05 0.100.0
0.5
1.0
Error rate
NTPswastedperbasepolymerised
t
t
antimutatorT4
twildtypeT4
t t
mutatorT4
(Data from Bessman et al. 1974)
7

The Evolution of Mutation Rates
• “Why is the mutation rate not reduced to zero ?” (Sturtevante 1937)
• There is a large class of deleterious and lethal mutations, and
hence decreased mutation rates are favoured
• Forces which could oppose reduction in the mutation rate include
◦ Beneficial mutations
◦ Costs of high accuracy replication
• Question: Which of these forces are important . . .
◦ . . . in sexual populations ?
◦ . . . in asexual populations ?
8

How do Mutation Rates Evolve ?Group Selection ?
• There is a mutation rate which maximises population mean
fitness (Kimura 1960)
◦ Mean fitness is reduced by the load due to deleterious
mutations, but
◦ Mean fitness is increased by the potential to adapt to a
changing environment
• Competition between groups could lead to evolution of the
optimum mutation rate, BUT
◦ In sexual populations, group selection is likely to be
overwhelmed by individual selection (Leigh 1973)
◦ In asexual populations, group selection is equivalent to
inter-clone selection, so optimality arguments were thought to
apply (Maynard Smith 1978)
9

How do Mutation Rates Evolve ?Answers from Modifier Models
din��������
����
ModifierlocusM/m
SelectedlocusA/a
recombinationat rate r
• Suppose M causes a higher mutation rate than m
• Frequency of M allele may change by indirect selection, if there is:
◦ Selection at the A/a locus, and
◦ Linkage disequilibrium between the M/m and A/a loci
10

Example I. Effect of deleterious allele A
Population polymorphic for modifier M/m:
��
��M A
��
��M A
��
��M A
��
��M A�
���M a�
���M a �
���M a
��
��M a�
���M a�
���M a
��
��m A
��
��m A
��
��m a
��
��m a�
���m a
��
��m a�
���m a
��
��m a
��
��m a
��
��m a
11
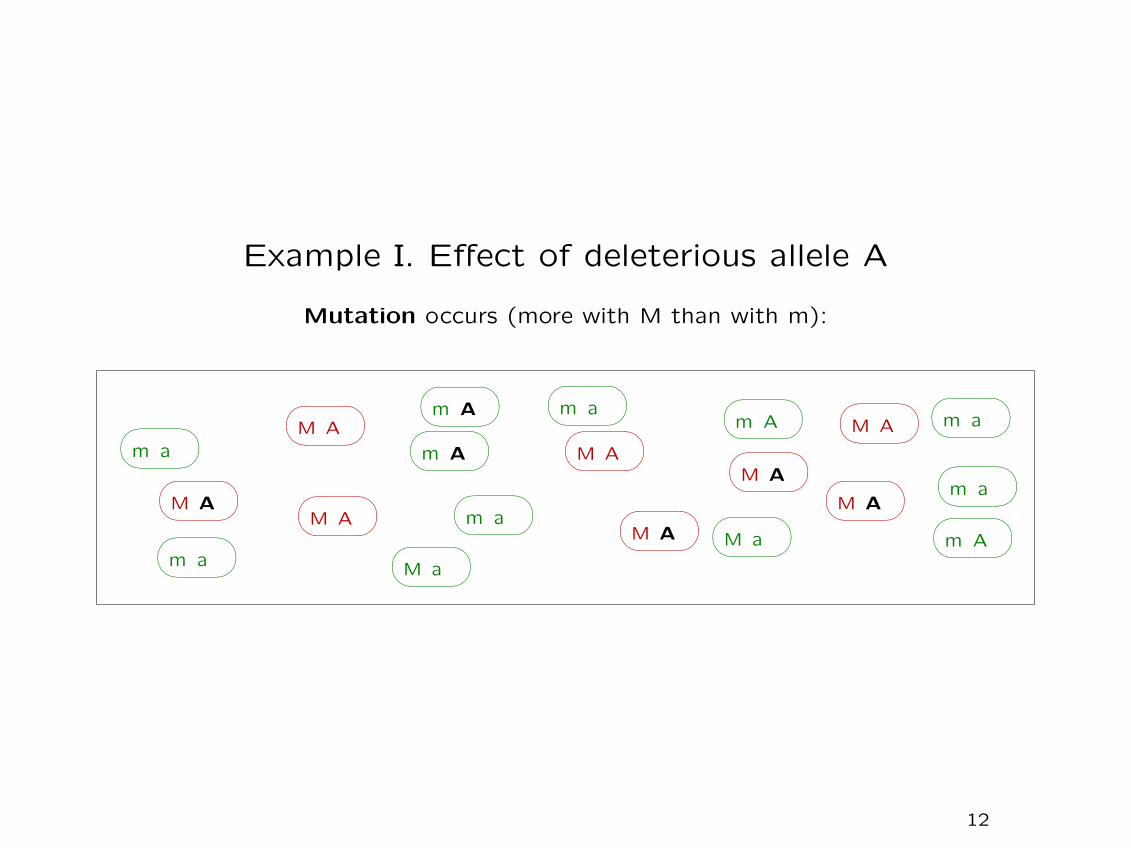
Example I. Effect of deleterious allele A
Mutation occurs (more with M than with m):
��
��M A
��
��M A
��
��M A
��
��M A�
���M A�
���M A �
���M A
��
��M A�
���M a�
���M a
��
��m A
��
��m A
��
��m A
��
��m A�
���m a
��
��m a�
���m a
��
��m a
��
��m a
��
��m a
12
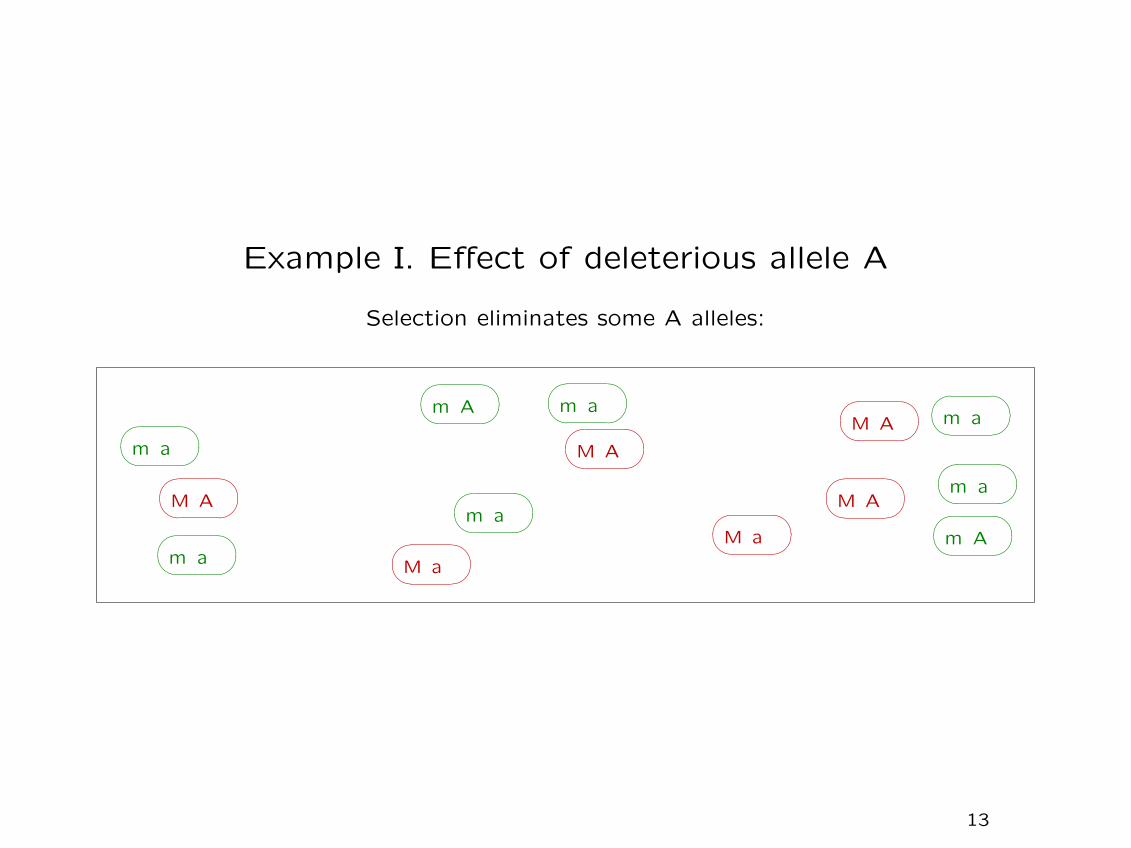
Example I. Effect of deleterious allele A
Selection eliminates some A alleles:
��
��M A
��
��M A
��
��M A
��
��M A�
���M a�
���M a
��
��m A
��
��m A�
���m a
��
��m a�
���m a
��
��m a
��
��m a
��
��m a
13
The effect of deleterious mutation is:
to indirectly select against a modifier which increases themutation rate
This effect is reduced by recombination
14

Example II. Effect of beneficial allele A in asexuals
Allele A arises in (say) M individual:
��
��
��
��M A
��
��M a �
���M a
��
��M a
��
��M a
��
��M a
��
��M a
��
��M a
��
��M a
��
��M a�
���m a
��
��m a
��
��m a
��
��m a
��
��m a
��
��m a
��
��m a
��
��m a
��
��m a
��
��m a
15

Example II. Effect of beneficial allele A in asexuals
Later:
��
��
��
��M A
��
��
��
��M A �
���
��
��M A
��
��
��
��M A
��
��M a
��
��M a
��
��M a
��
��M a �
���M a
��
��M a �
���M a
��
��M a�
���m a
��
��m a�
���m a
��
��m a
��
��m a
��
��m a
��
��m a
��
��m a
16
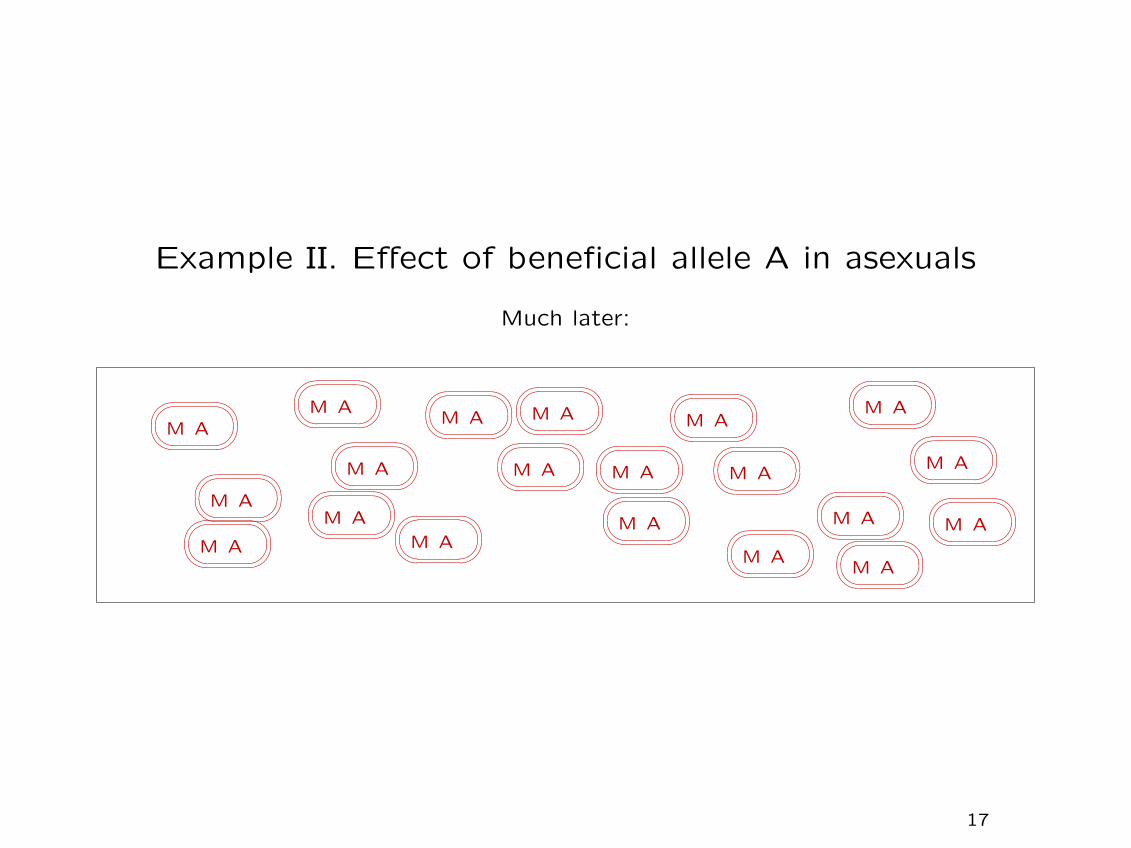
Example II. Effect of beneficial allele A in asexuals
Much later:
��
��
��
��M A
��
��
��
��M A
��
��
��
��M A �
���
��
��M A
��
��
��
��M A
��
��
��
��M A
��
��
��
��M A�
���
��
��M A
��
��
��
��M A
��
��
��
��M A
��
��
��
��M A
��
��
��
��M A
��
��
��
��M A
��
��
��
��M A
��
��
��
��M A �
���
��
��M A
��
��
��
��M A
��
��
��
��M A
��
��
��
��M A
��
��
��
��M A
17
The effect of beneficial mutation in asexuals is:
the modifier “responsible” hitchhikes to fixation;a modifier increasing the rate is more likely to be fixed.
This effect is very sensitive to recombination . . .
18
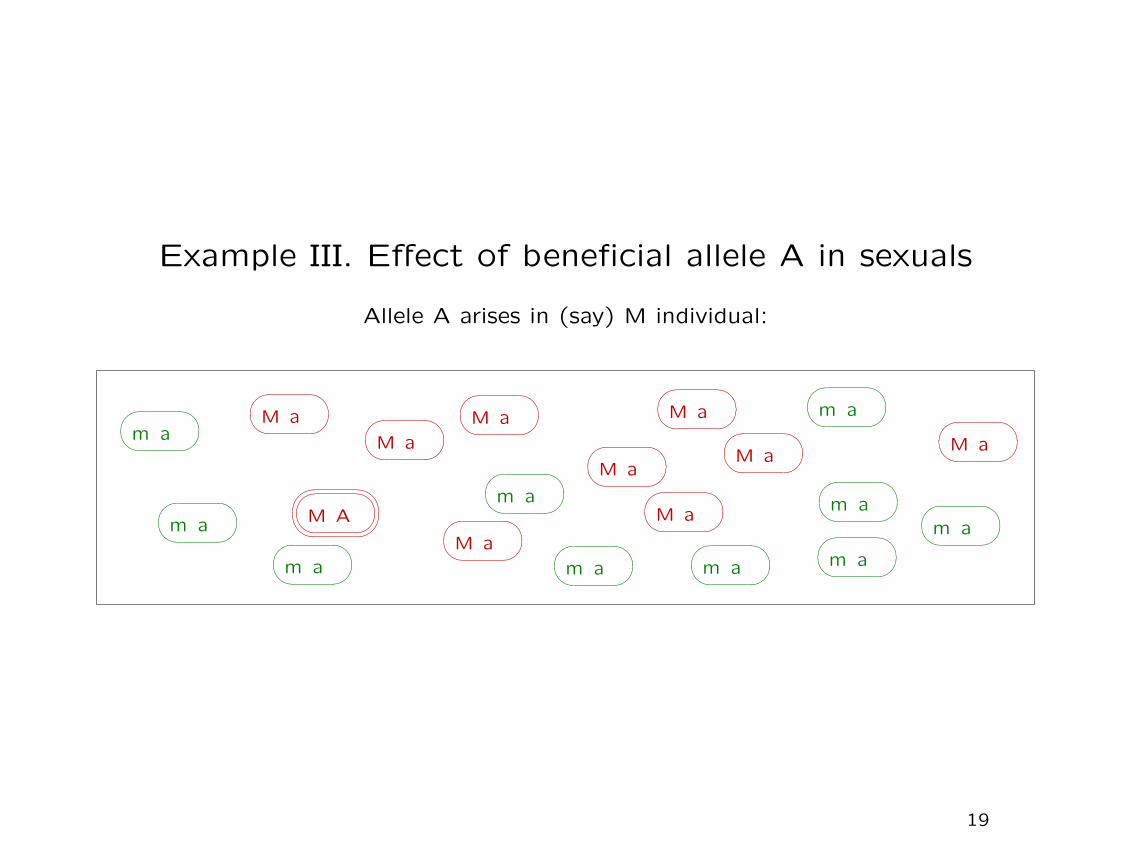
Example III. Effect of beneficial allele A in sexuals
Allele A arises in (say) M individual:
��
��
��
��M A
��
��M a
��
��M a
��
��M a
��
��M a
��
��M a
��
��M a
��
��M a
��
��M a�
���M a
��
��m a
��
��m a
��
��m a
��
��m a
��
��m a
��
��m a
��
��m a
��
��m a
��
��m a
��
��m a
19

Example III. Effect of beneficial allele A in sexuals
Later (recombination has occurred):
��
��
��
��M A
��
��
��
��M A �
���
��
��M A
��
��M a
��
��M a
��
��M a
��
��M a
��
��M a
��
��M a
��
��M a
��
��M a
��
��
��
��m A
��
��m a
��
��m a
��
��m a
��
��m a
��
��m a
��
��m a
��
��m a
��
��m a
20

Example III. Effect of beneficial allele A in sexuals
Much later (more recombination has occurred):
��
��
��
��M A
��
��
��
��M A
��
��
��
��M A
��
��
��
��M A�
���
��
��M A
��
��
��
��M A �
���
��
��M A
��
��
��
��M A�
���
��
��M A
��
��
��
��M A�
���
��
��M A
��
��
��
��M A
��
��
��
��M A �
���
��
��m A
��
��
��
��m A
��
��
��
��m A
��
��
��
��m A
��
��
��
��m A�
���
��
��m A
��
��
��
��m A
21

The effect of beneficial mutation in sexuals is:
the modifier “responsible” hitchhikes to higher frequency;a modifier increasing the rate is indirectly selected for.
This effect is negligible when r > s.
22
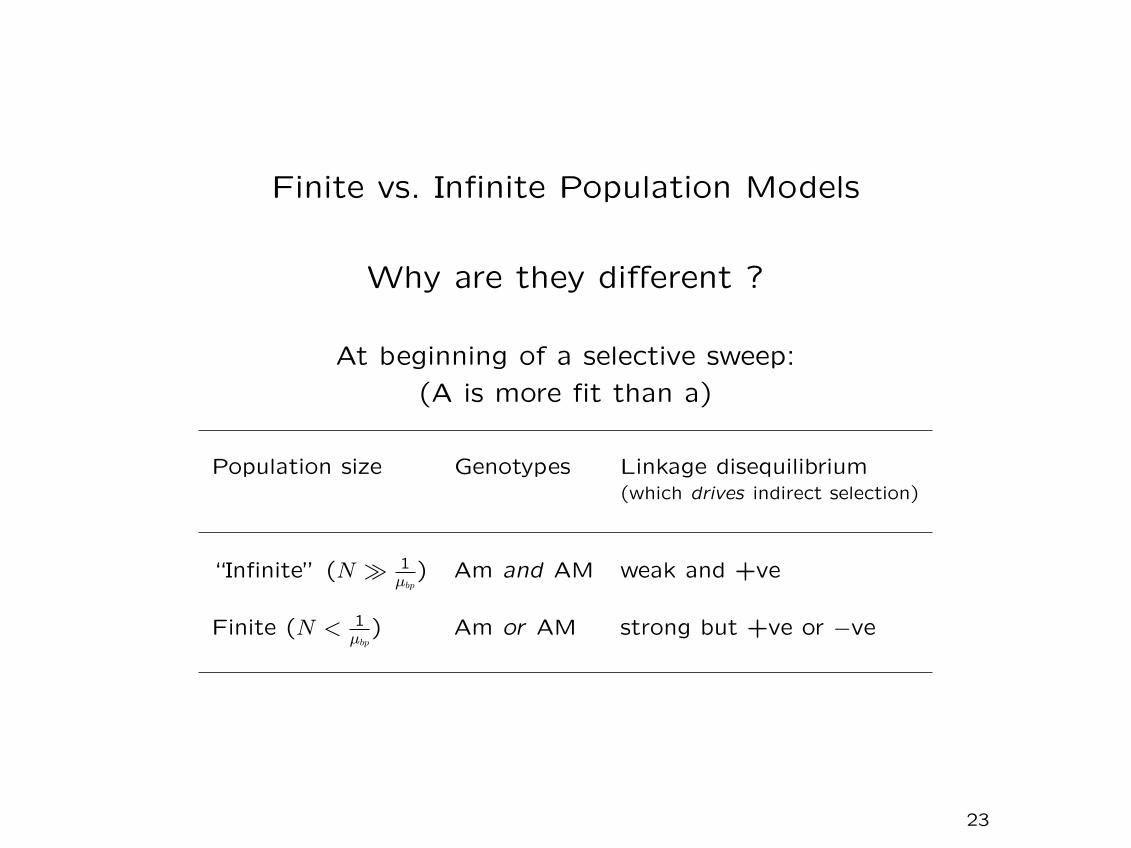
Finite vs. Infinite Population Models
Why are they different ?
At beginning of a selective sweep:
(A is more fit than a)
Population size Genotypes Linkage disequilibrium(which drives indirect selection)
“Infinite” (N � 1µbp
) Am and AM weak and +ve
Finite (N < 1µbp
) Am or AM strong but +ve or −ve
23
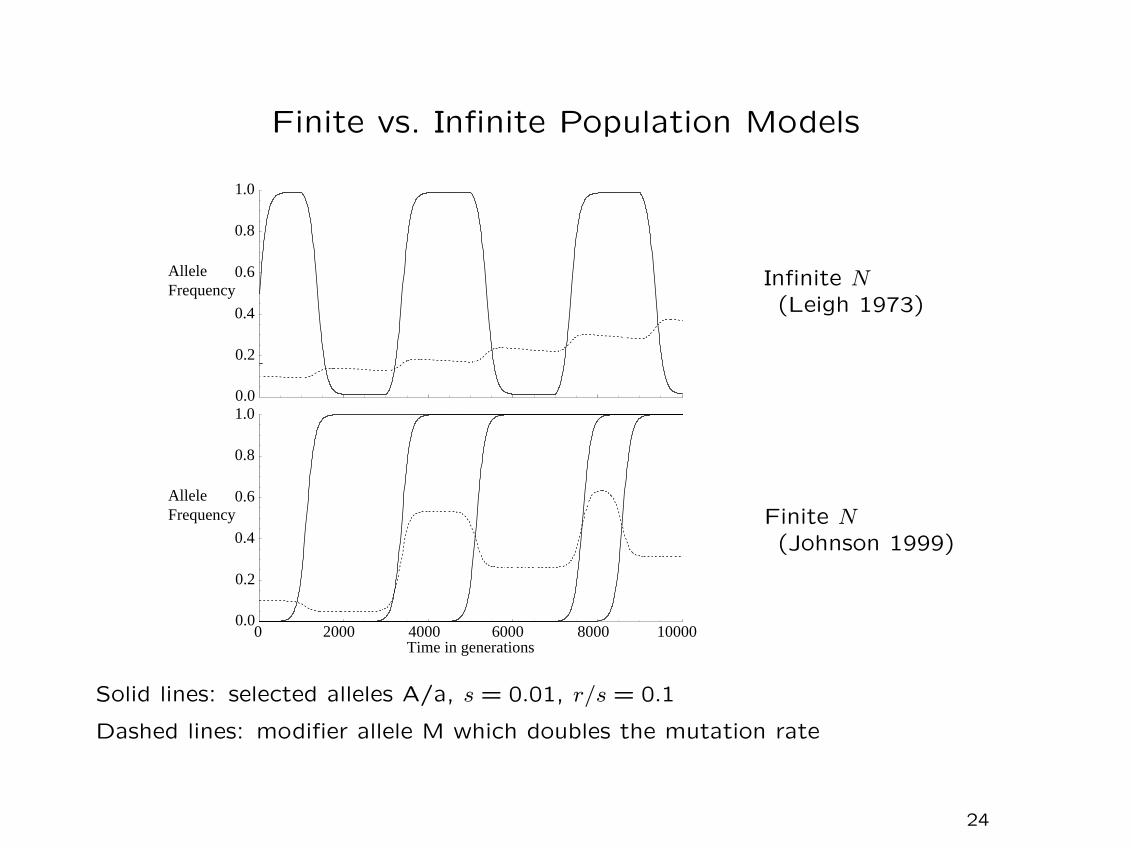
Finite vs. Infinite Population Models
0.2
0.4
0.6
0.8
1.0
2000 4000 6000 8000 10000
0.2
0.4
0.6
0.8
1.00.0
0.00
Allele Frequency
Allele Frequency
Time in generations
Infinite N(Leigh 1973)
Finite N(Johnson 1999)
Solid lines: selected alleles A/a, s = 0.01, r/s = 0.1
Dashed lines: modifier allele M which doubles the mutation rate
24

Question
When finite population effects are taken into account, can rare
beneficial mutations favor the evolution of higher mutation rates in
sexual populations ?
25

Stochastic model for the evolution of mutation rates insexual populations
(Johnson 1999 Genetics 151:1621–31)
• Model allows:
◦ Many loci scattered over n chromosomes each M Morgans
long
◦ Beneficial mutations and deleterious mutations and the cost
of accuracy
◦ Stochastic effects when beneficial alleles are rare or unique
• Find evolutionarily stable (ESS) mutation rate by invasion
analysis, assuming:
◦ Modifier M has weak effect ∆U
◦ Fate of modifier determined while rare
26

Stochastic model for the evolution of mutation rates insexual populations
• Analysis showed that ESS mutation rate depends on a function
describing the cost of accuracy, but there are no data about this
function
• Proceeded by ignoring the cost of accuracy altogether !!!
• When there is more than one crossover per genome per
generation, the “no cost” ESS mutation rate is
Unc ' K sbsd
1
ln [4Nesb](nM+ln
[1
2sd
]) � K
• Where:K is rate of selective sweepssb is selection coefficient for beneficial mutationsU is genomic deleterious mutation ratesd is selection coefficient against deleterious mutationsnM is map size of whole genome, assume nM > 1Ne is effective population size
27
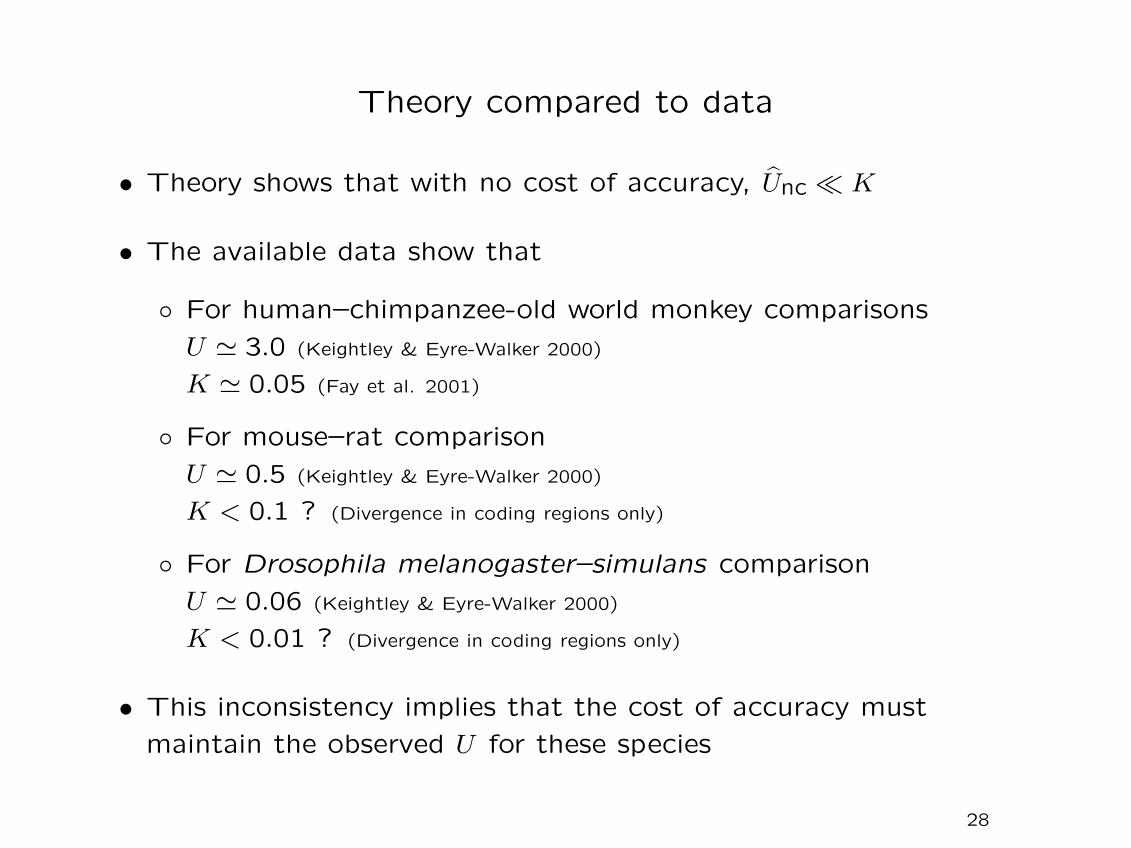
Theory compared to data
• Theory shows that with no cost of accuracy, Unc � K
• The available data show that
◦ For human–chimpanzee-old world monkey comparisons
U ' 3.0 (Keightley & Eyre-Walker 2000)
K ' 0.05 (Fay et al. 2001)
◦ For mouse–rat comparison
U ' 0.5 (Keightley & Eyre-Walker 2000)
K < 0.1 ? (Divergence in coding regions only)
◦ For Drosophila melanogaster–simulans comparison
U ' 0.06 (Keightley & Eyre-Walker 2000)
K < 0.01 ? (Divergence in coding regions only)
• This inconsistency implies that the cost of accuracy must
maintain the observed U for these species
28

Question
When finite population effects are taken into account, can rare
beneficial mutations favor the evolution of higher mutation rates in
sexual populations ?
Answer
The effect is negligible relative to the physiological costs of accuracy
29

How do Mutation Rates Evolve ?Group Selection ?
• There is a mutation rate which maximises population mean
fitness (Kimura 1960)
◦ Mean fitness is reduced by the load due to deleterious
mutations, but
◦ Mean fitness is increased by the potential to adapt to a
changing environment
• Competition between groups could lead to evolution of the
optimum mutation rate
◦ In sexual populations, group selection is likely to be
overwhelmed by individual selection (Leigh 1973)
◦ In asexual populations, group selection is equivalent to
inter-clone selection, so optimality arguments were
thought to apply (Maynard Smith 1978)
30
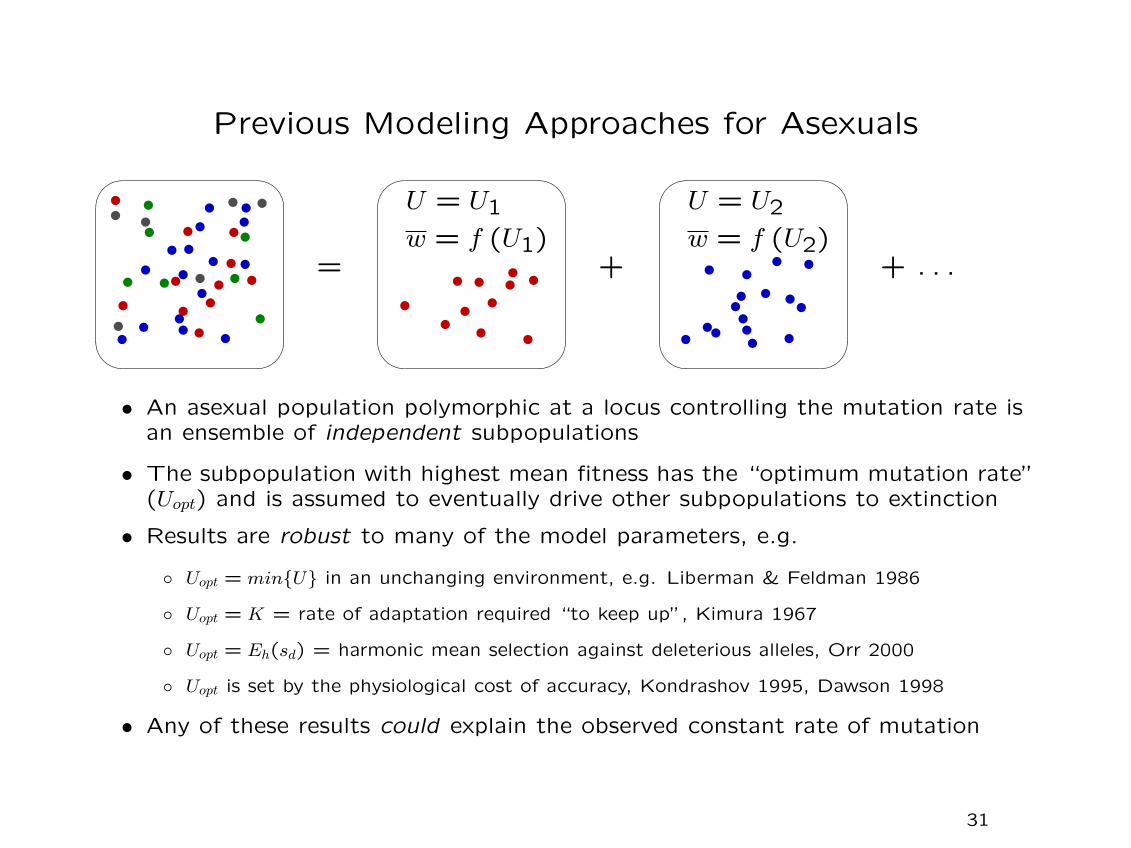
Previous Modeling Approaches for Asexuals
'
&
$
%
=
'
&
$
%
U = U1
w = f (U1)+
'
&
$
%
+ . . .
U = U2
w = f (U2)
v
vvvv vvv
vv
vv
vvv
vv
vv vv v
vv
v
v
vv
vvv v
vv
v
vv
vv
vvv
vv vvv
vvvv v vv
vv
vv
vv
vvv
vvv
v
• An asexual population polymorphic at a locus controlling the mutation rate isan ensemble of independent subpopulations
• The subpopulation with highest mean fitness has the “optimum mutation rate”(Uopt) and is assumed to eventually drive other subpopulations to extinction
• Results are robust to many of the model parameters, e.g.
◦ Uopt = min{U} in an unchanging environment, e.g. Liberman & Feldman 1986
◦ Uopt = K = rate of adaptation required “to keep up”, Kimura 1967
◦ Uopt = Eh(sd) = harmonic mean selection against deleterious alleles, Orr 2000
◦ Uopt is set by the physiological cost of accuracy, Kondrashov 1995, Dawson 1998
• Any of these results could explain the observed constant rate of mutation
31

Previous Modeling Approaches for Asexuals
'
&
$
%
=
'
&
$
%
U = U1
w = f (U1)+
'
&
$
%
+ . . .
U = U2
w = f (U2)
v
vvvv vvv
vv
vv
vvv
vv
vv vv v
vv
v
v
vv
vvv v
vv
v
vv
vv
vvv
vv vvv
vvvv v vv
vv
vv
vv
vvv
vvv
v
Problems:
• Previous approaches assumed no gene flow, BUT
◦ Mutation at modifier locus moves cells between subpopulations, so thesubpopulations do not evolve independently (Johnson 1999 Proc. R. Soc. B
266:2389–97)
• Previous approaches assumed infinite subpopulation sizes, BUT
◦ Subpopulations may be small, and the fate of a new modifier may bedetermined while it is rare
• Previous approaches only considered long term mean fitness, BUT
◦ Some subpopulations may go extinct in the short term
32

Questions
• Can beneficial mutations drive the evolution of higher wild type
mutation rates ?
(Experiments show that beneficial mutations can cause the evolution of
greatly elevated rates (mutator strains), but evolution of small increases has
never been observed )
• Will a finite asexual population evolve towards its optimum
mutation rate ?
• Can optimality based arguments explain Drake’s observation ?
(The organisms involved are, to an approximation, asexual)
33
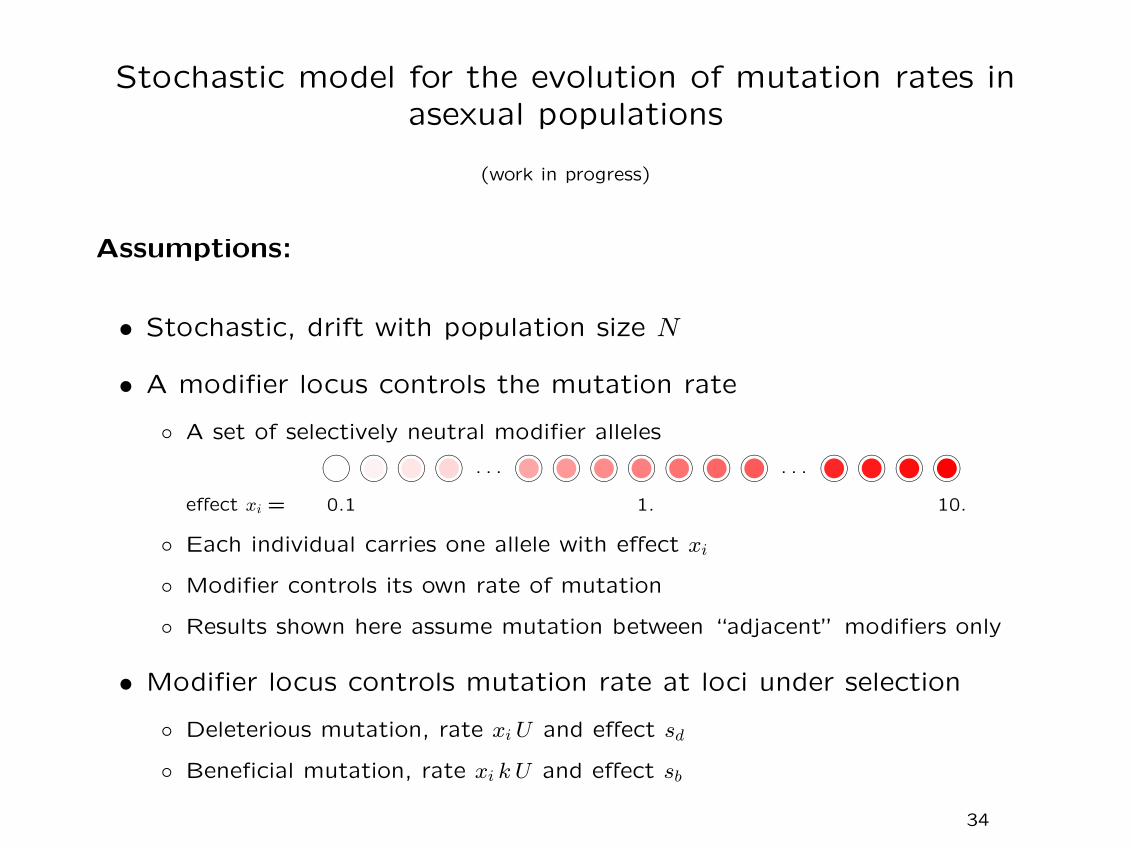
Stochastic model for the evolution of mutation rates inasexual populations
(work in progress)
Assumptions:
• Stochastic, drift with population size N
• A modifier locus controls the mutation rate
◦ A set of selectively neutral modifier alleles
effect xi = 0.1 1. 10.
. . . . . .~����~����~����~���� ~����~����~����~����~����~����~���� ~����~����~����~����
◦ Each individual carries one allele with effect xi
◦ Modifier controls its own rate of mutation
◦ Results shown here assume mutation between “adjacent” modifiers only
• Modifier locus controls mutation rate at loci under selection
◦ Deleterious mutation, rate xi U and effect sd
◦ Beneficial mutation, rate xi k U and effect sb
34

‘Typical’ simulation results
0 106
10-3
10-2
10-1
Population mean mutation rate
time (generations)
← Uopt
k = 10−8 N = 1010
sd = 10−2
sb = 10−2
mi i−1 = 10−9U
mi i+1 = 10−6U
10 replicates are shown for eachchoice of initial conditions
35
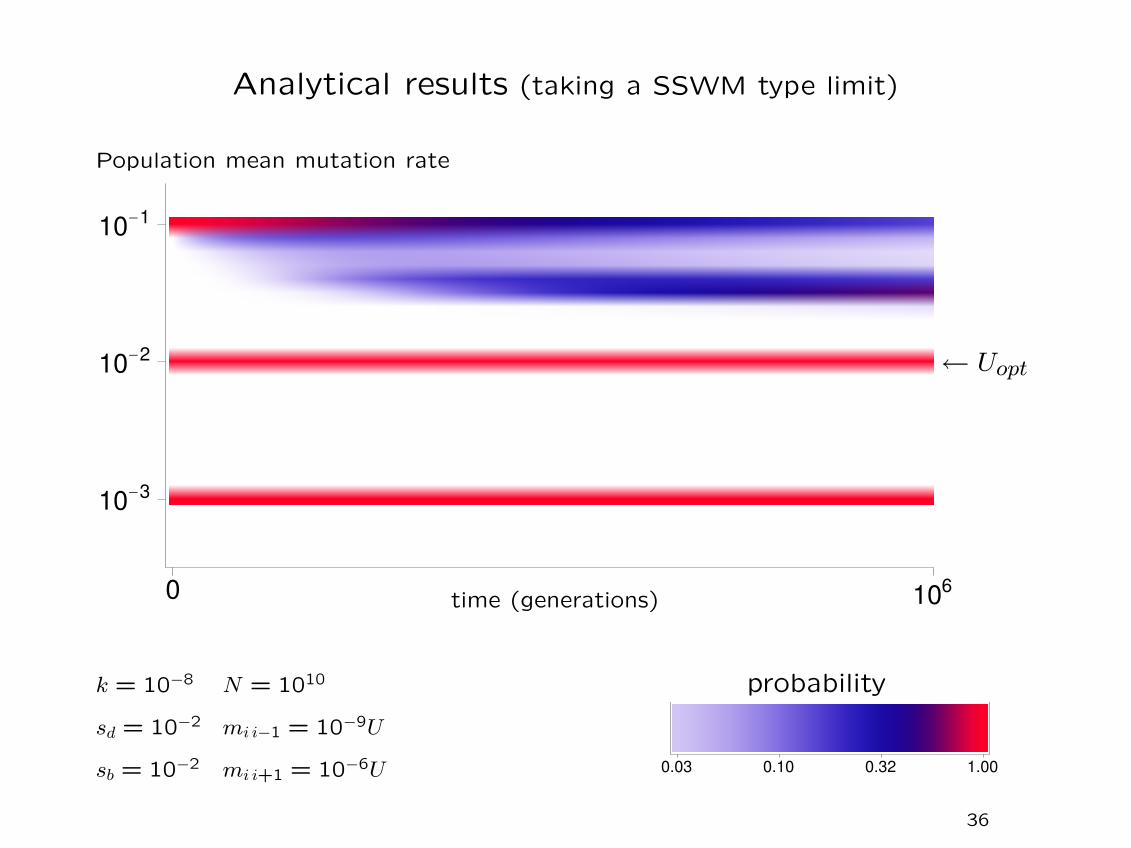
Analytical results (taking a SSWM type limit)
0 106
10-3
10-2
10-1
Population mean mutation rate
time (generations)
← Uopt
probability
0.03 0.10 0.32 1.00
k = 10−8 N = 1010
sd = 10−2
sb = 10−2
mi i−1 = 10−9U
mi i+1 = 10−6U
36
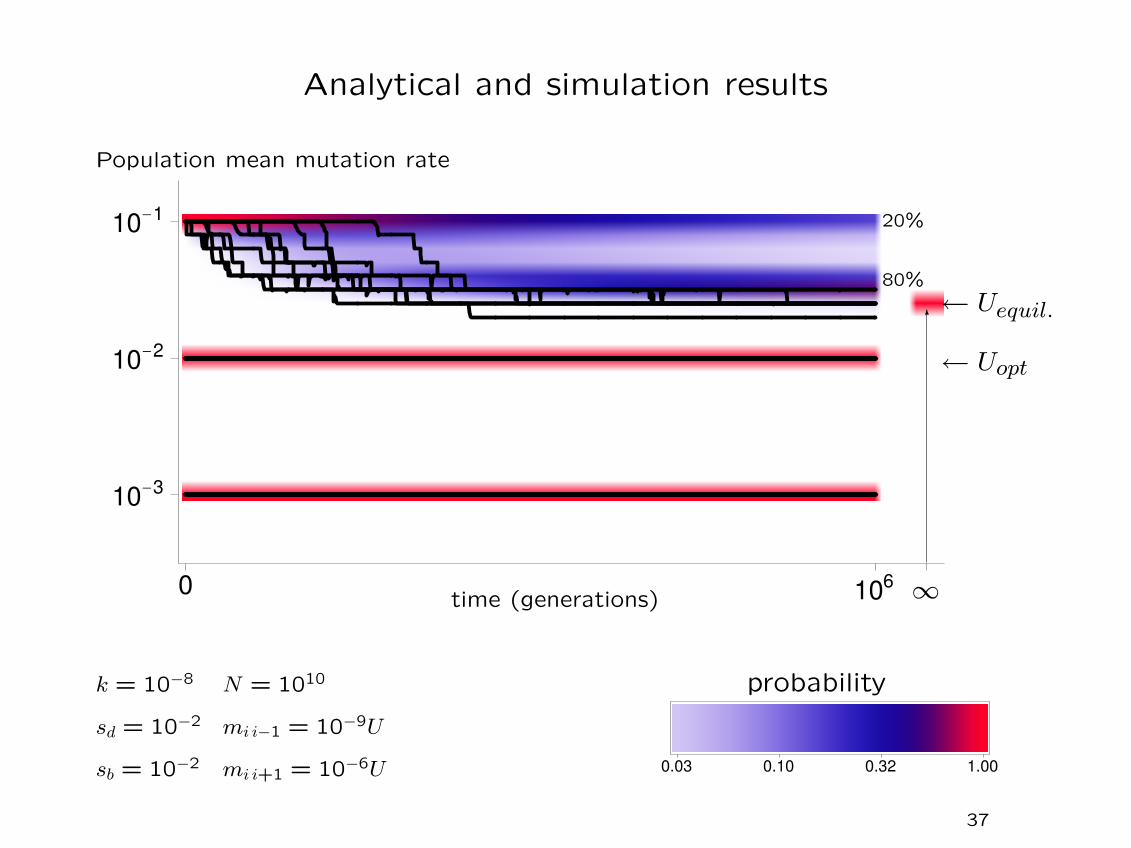
Analytical and simulation results
0 106°
10-3
10-2
10-1
Population mean mutation rate
time (generations)
← Uopt
probability
0.03 0.10 0.32 1.00
∞
6← Uequil.
80%
20%
k = 10−8 N = 1010
sd = 10−2
sb = 10−2
mi i−1 = 10−9U
mi i+1 = 10−6U
37

Predicted equilibrium distributions of mutation rates
106 108 1010 101210-3
10-2
10-1
10-4 10-3 10-210-3
10-2
10-1
Population meanmutation rate
Population meanmutation rate
population size N selection for beneficial mutations sb
← Uopt
probability
0.03 0.10 0.32 1.00
k = 10−8 N = 1010
sd = 10−2
sb = 10−2
mi i−1 = 10−9U
mi i+1 = 10−6U
38

Questions and Answers
• Can beneficial mutations drive the evolution of higher wild type
mutation rates ?
◦ Sort of – they can prevent the evolution of lower rates
• Will a finite asexual population evolve towards its optimum
mutation rate ?
◦ Probably not
• Can optimality based arguments explain Drake’s observation ?
◦ Probably not
39

Summary
• The mutation rate is under genetic control and can therefore
evolve. To understand its evolution I have studied theoretical
models of individual selection in finite sized populations.
• In sexual populations the mutation rate is set largely by a balance
between indirect selection due to deleterious mutations and direct
selection due to the cost of fidelity. The effect of beneficial
mutations is negligible.
• In asexual populations beneficial mutations may have a role in
setting the mutation rate, but the result is unlikely to be optimal.
• There is no plausible explanation for Drake’s observation !
40

Further work:
What is the explanation for Drake’s observation ?
• More empirical studies are needed
◦ Estimate mutation rates for a range of microbes with diverse
life histories
• Theoretical work
◦ Many microbes exchange genes at low rates, previous models
have ignored this
◦ Real populations are spatially structured, previous models have
ignored this
41

Acknowledgements
Philip AwadallaNick Barton
Brian CharlesworthKevin DawsonPeter KeightleyAlex Kondrashov
Gil McVeanSally Otto
Rosie RedfieldPaul SniegowskiOlivier Tenaillon
BBSRC (UK)NSERC (Canada)
Wellcome Trust (UK)
42


