The European offshore wind industry key 2011 trends … European offshore wind industry key trends...
23
The European offshore wind industry key 2011 trends and statistics January 2012 A report by the European Wind Energy Association
-
Upload
truongkhue -
Category
Documents
-
view
221 -
download
3
Transcript of The European offshore wind industry key 2011 trends … European offshore wind industry key trends...

The European offshore wind industry key 2011 trends and statistics
January 2012
A report by the European Wind Energy Association

2The European offshore wind industry key trends and statistics 2011
Contents
Contents
Executive summary 3
2011 annual market 5
Cumulative market 9
Market outlook 13
Trends: turbines, water depth and distance to shore 14
Financing highlights and developments in 2011 and 2012 outlook 17
New turbine announcements 19
Offshore grid developments 22
If you have a query on distribution or reproduction, contact EWEA communications Director Julian Scola at [email protected]. Contributors: Justin Wilkes (Policy Director, EWEA) Jacopo Moccia (Head of Policy Analysis, EWEA) - Co-ordinating authorAthanasia Arapogianni/Mihaela Dragan/Nikiforos Plytas (EWEA Research Group), Anne-Bénédicte Genachte (Regulatory Affairs Advisor, Offshore wind, EWEA) - Statistical research and analysis and Industry highlights
Jérôme Guillet (Green Giraffe Energy Bankers) – Financing highlights and developmentsPaul Wilczek (Senior Regulatory Affairs Advisor, Grids and Markets, EWEA)
Design: EWEACover photo: A2SEA - Hans BloombergPublished in January 2012

3The European offshore wind industry key trends and statistics 2011
Executive summary
Executive summary
2011 offshore wind power market
• 235 new offshore wind turbines, in nine wind farms, worth some €2.4 billion, were fully grid connected between 1 January and 31 December 2011, totalling 866 MW, 17 MW less than 2010.
• 246 turbines were erected during 2011, an average of 2.6 MW per day. 81 of these turbines are awaiting grid connection.
• Three experimental floating concepts were erected, one of which was a full-scale grid connected concept.
• Offshore work began on a further five projects and preparatory onshore work on nine new projects.
Cumulative offshore wind power market
• 1,371 turbines installed and grid connected, totalling 3,813 MW in 53 wind farms in ten European countries: up from 1,136 turbines, totalling 2,946 MW in 45 wind farms in nine European countries end 2010.
• 75% of substructures are monopiles, 21% gravity based, jackets 2% and tripiles 2%. There are also two full scale grid-connected floating turbines.
Market outlook • Once completed, the nine offshore projects currently under construction will increase installed capacity by a further 2,375 MW, bringing cumulative capacity in Europe to 6,188 MW.
• Preparatory work has started on nine other projects, these have a cumulative installed capacity of 2,910 MW.
Trends: turbines, foundations, water depth and distance to shore
• The average offshore wind farm size in 2011 was almost 200MW up 29% (45MW) on the previous year.
• Average water depth in 2011 reached 22.8m, substantially more than last year.
• Average distance to shore decreased, being 23.4km in 2011 compared to 27.1km the previous year. However, the distance of wind farms under construction is 33.2km.

Executive summary
Financing highlights and developments
• In 2011 non-recourse debt financing for offshore wind farms increased by 40% on the previous year, from €1.46 billion to €2.05 billion with three transactions (Meerwind, Globaltech I, Baltic 1) closing in 2011.
• In 2011 with equity finance, more than 3 GW in net planned capacity changed hands, in addition to the investment commitments announced by a number of utilities and developers on projects they already own. DONG Energy has continued to be the most active equity player, both on the acquisition and on the sale side.
New turbine announcements
• In 2011, 23 new wind turbine models were announced: 51 new models have been announced by 41 companies over the past two and a half years.
Offshore grid developments • The BritNed interconnector between Britain and the Netherlands was completed on time and within the established budget. Operation began in April 2011.
• East-West link between Ireland and Britain is on track, whilst NorGer and NordLink cables between Norway and continental Europe have been delayed. The Cobra cable between Denmark and the Netherlands is awaiting final investment decision.
• The European Commission is proposing €9.1 billion to accelerate planning and finance new energy infrastructure. Moreover, the EU’s TEN-E plan has offered a grant to the NorthConnect project between Scotland and Norway.
• A bottleneck in supply of High Voltage (HV) offshore cables is looming, but the prospects for supply of High Voltage Direct Current (HVDC) cables are brighter.
4The European offshore wind industry key trends and statistics 2010

5The European offshore wind industry key trends and statistics 2011
2011 annual market
2011 annual market
Wind farm name Status
Anholt (DK) First foundation installed
Avedøre (DK) Turbine installed and grid connected
Baltic 1 (DE) Fully grid connected in 2011, all construction work completed in 2010
BARD offshore 1 (DE) Turbines erected and grid connected, partially connected in 2010
Greater Gabbard (UK) Most turbines erected, over half of the project online
Lincs (UK) First foundations installed
London Array (UK) First foundations installed
Ormonde (UK) All turbines erected, over half grid connected
SeaTwirl (SE) Installed and tested, subsequently de-commissioned
Sheringham Shoal (UK) All foundations installed, most turbines erected, first turbines connected
SWAY (NO) Installed, the experimental concept is not grid-connected
Thornton Bank phase 2 (BE) First foundations installed
Walney 1 (UK) Fully grid connected
Walney 2 (UK) All foundations and turbines installed, partially grid connected
Windfloat (PT) Installed and grid connected
Aditionally, pre-piling has begun at Borkum West 2 in Germany and preparatory onshore work is beginning in eight further projects.
Offshore wind installations
During 2011, work was carried out on 15 offshore wind farms in Europe:• two full-scale farms were fully completed and grid
connected;• three experimental floating concepts were tested,
one of which full-scale and grid connected;
• five wind farms were partially completed and grid connected;
• one further turbine was installed at a pre-existing near-shore test site;
• in four other projects, offshore work has begun, but no turbines were connected during 2011.

6The European offshore wind industry key trends and statistics 2011
2011 annual market
FiG 1: iNSTALLED CAPACiTY: ShARE OF 2011 iNSTALLATiONS (MW)
With over 750 MW grid connected in British waters dur-ing 2011, 87% of new capacity was added in the United Kingdom. 108 MW were added in Germany (13%), a 3.6 MW turbine grid connected in Denmark.
Three experimental floating turbines were also installed in Norway, Sweden and Portugal. The latter being the only full-scale, grid connected model (2 MW) of the three and the first full-scale offshore turbine in south-ern European waters.
CountryUnited
KingdomGermany Denmark Portugal Total
No. of farms where turbines have been installed and connected in 2011
5 2 1 1 9
No. of wind turbines installed and connected in 2011
200 33 1 1 235
Capacity installed and grid connected in 2011 (MW)
752.45 108.30 3.60 2.00 866.35
FiG 2: WT MANUFACTURERS: ShARE OF 2011 iNSTALLATiONS (MW)
Siemens supplied the majority (80%) of the 2011 off-shore wind market. This confirms Siemens as a leading market player since the first offshore wind farms went online 20 years ago.
Siemens turbines accounted for almost 693 MW of grid connected capacity, followed by REpower (111.7 MW or 13% of the 2011 market) and BARD (60 MW, 7%). Vestas connected a full-scale 2 MW turbine on an ex-perimental floating substructure in Portugal. The other experimental concepts installed in 2011 used down-scaled turbines and were not connected to the grid.
2011 Annual market share – wind turbine manufacturers
Figure 1: Share of new offshore wind capacity in Europe per country in 2011
UK752.45 MW
87%
Germany 108.30 MW 13%
Portugal2 MW
0%
Denmark 3.60 MW 0%
Figure 2: Wind Turbine manufacturers: share of 2011 installations (MW)
Siemens 692.70 MW
80%
REpower 111.65 MW 13%
BARD 60 MW 7%
Vestas 2 MW
0%

7The European offshore wind industry key trends and statistics 2011
2011 annual market
FiG 3: WT MANUFACTURERS: ShARE OF 2011 GRiD CONNECTED TURBiNES (UNiTS)
Siemens installed and grid connected 200 turbines in 2011: 85% of all offshore turbines installed and con-nected during the year. REpower was in second place with 22 (9%), followed by BARD (12 turbines) and Ves-tas (one turbine).
The average capacity of offshore wind turbines grid connected during 2011 was 3.6 MW.
FiG 4: DEvELOPERS: ShARE OF 2011 OFFShORE MARKET iN MW
Together SSE renewables (28%), RWE (22%), DONG (19%), Vattenfall (13%) and ENBW (6%) installed 88% of new offshore capacity in 2011, respectively 245.9 MW, 190.8 MW, 168.1 MW, 111.7 MW and 48.3 MW. Including investments made by Statoil, Statkraft and EDP’s participation in an experimental project, over 90% of all offshore wind investments in 2011 were made by utilities. BARD (55.5 MW, 7%) is the only no-ticeable exception.
Wind turbine capacity
2011 Annual market share – developers/utilities1
1 The grid connected market shares are indicative only. Projects owned or developed by several companies have been split according to the respective shares. Where the shares are not known, they have been split in equal parts between the partners
Figure 3: Wind Turbine manufacturers: share of 2011 grid connected turbines (units)
Siemens 200 units
85%
REpower 22 units 9%
BARD 12 units 5%
Vestas1 unit
1%
Figure 4: Developers: share of new offshore wind capacity in 2011 (total 798,32 MW)
SSE 245.92 MW
28%
RWE 190.80 MW
22%
Dong 168.08 MW 19%
Vattenfall 111.65 MW 13%
BARD 55.50 MW 7%
ENBW 48.30 MW 6%
Statkraft 19.80 MW 2%
Statoil 19.80 MW 2%
Enovos 4.50 MW 1%
EDP 0.5 MW
0%
LDA0.5 MW
0%
Inovcapital0.5 MW
0%
Principle Power0.5 MW
0%

8The European offshore wind industry key trends and statistics 2011
2011 annual market
FiG 5: SUBSTRUCTURE TYPES iN 2011 OFFShORE WiND FARMS
With 233 units installed in 2011, monopile foundations remain the most common substructure for offshore tur-bines. Their share (69.3%) is similar to the previous year. After monopiles, jackets (66 units) were the most commonly used substructures, followed by tripiles (33). One gravity based structure was used on a near-shore project and three floating substructures were also in-stalled, more than in any other year.
The average water depth of offshore wind farms where work was carried out during 2011 was 22.8 metres. This is substantially more (+31%) than in 2010 when av-erage water depth was 17.4m.
The average distance to shore has decreased: 27.1 km in 2010, 23.4km in 2011. This is partly due to the
installation of one test turbine close to the harbour wall at Avedøre in Denmark. Removing the latter from the cal-culation, average distance to shore in 2011 was 25.3km.
Figure 6 shows average water depth and distance to shore of the wind farms under construction in 2011, their size in MW and colour coded per country.
Substructure type
Water depth and distance to shore
Figure 5: Substructure types in 2011 offshore wind farms
Monopile 23369%
Jacket 66 20%
Tripile 33 10%
Floating 3 1%
Gravity based1
1%
Aver
age
dist
ance
to
shor
e (k
m)
UK
10 20
20
40
60
80
100
120
30 40 50 600
Germany Portugal Denmark Belgium
Average water depth (m)
Figure 6: Average distance to share and water depth of offshore wind farms
UK
Germany
Portugal
Denmark
Belgium
FiG 6: AvERAGE DiSTANCE TO ShORE AND WATER DEPTh OF OFFShORE WiND FARMS

9The European offshore wind industry key trends and statistics 2011
Cumulative market
A total of 1,371 offshore turbines are now installed and grid connected in European waters totalling 3,812.6 MW spread across 53 wind farms in 10 countries. The offshore wind capacity installed by the end of 2011 will produce, in a normal wind year, 14 TWh of electricity, enough to cover 0.4% of the EU’s total consumption.
In 2010, Thanet, a 300 MW project in the UK, was the largest offshore wind farm completed and fully grid con-nected in the world. During 2011 over 380 MW were in-stalled at Greater Gabbard, also in the UK. Once com-pleted, Greater Gabbard’s total capacity will be 504
MW. However, construction has also started on the first phase of the London Array project. Once completed, it will be 630 MW.
The UK is by far the largest market with 2,094 MW in-stalled, representing over half of all installed offshore wind capacity in Europe. Denmark follows with 857 MW (23%), then the Netherlands (247 MW, 6%), Germany (200 MW, 5%), Belgium (195, 5%), Sweden (164, 4%), Finland (26 MW in near-shore projects) and Ireland 25 MW. Norway and Portugal both have a full-scale floating turbine (2.3 MW and 2 MW respectively).
Cumulative market
Country UK DK NL DE BE SE Fi iE NO PT Total
No. of farms 18 13 4 6 2 5 2 1 1 1 53
No. of turbines 636 401 128 52 61 75 9 7 1 1 1,371
Capacity installed (MW)
2,093.7 857.3 246.8 200.3 195 163.7 26.3 25.2 2.3 2 3,812.6
Figure 7: Cumulative and annual offshore wind installations (MW)
1993
1994
1995
1996
1997
1998
1999
2000
2001
2002
2003
2004
2005
2006
2007
2008
2009
2010
2011
0
500
1000
1500
2000
2500
3000
3500
4000
4500
100
200
300
400
500
600
700
800
900
1000
(MW
)
(MW
)
annual (left axis) cumulative (right axis)
FiG 7: CUMULATivE AND ANNUAL OFFShORE WiND iNSTALLATiONS (MW)
10The European offshore wind industry key trends and statistics 2011
Cumulative market
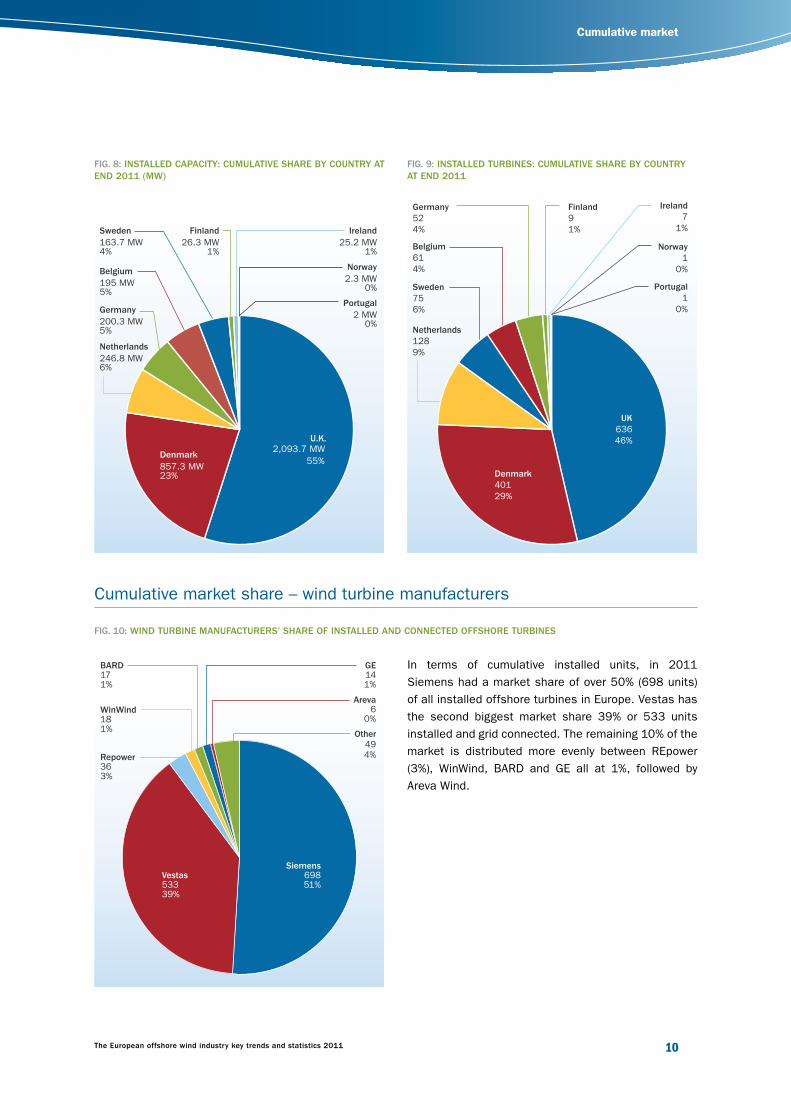
FiG. 8: iNSTALLED CAPACiTY: CUMULATivE ShARE BY COUNTRY AT END 2011 (MW)
FiG. 9: iNSTALLED TURBiNES: CUMULATivE ShARE BY COUNTRY AT END 2011
FiG. 10: WiND TURBiNE MANUFACTURERS’ ShARE OF iNSTALLED AND CONNECTED OFFShORE TURBiNES
Cumulative market share – wind turbine manufacturers
In terms of cumulative installed units, in 2011 Siemens had a market share of over 50% (698 units) of all installed offshore turbines in Europe. Vestas has the second biggest market share 39% or 533 units installed and grid connected. The remaining 10% of the market is distributed more evenly between REpower (3%), WinWind, BARD and GE all at 1%, followed by Areva Wind.
Figure 8: Installed capacity: cumulative share by country at end 2011 (MW)
2,093.7 MWDenmark
U.K.
857.3 MW 23%
55%
Netherlands 246.8 MW 6%
Germany 200.3 MW 5%
Belgium 195 MW 5%
Sweden163.7 MW4%
Finland 26.3 MW
1%
Ireland25.2 MW
1%
Norway2.3 MW
0%
Portugal 2 MW
0%
Figure 9: Installed turbines: cumulative share by country at end 2011
UK63646%
Denmark40129%
Netherlands1289%
Sweden756%
Belgium614%
Germany524%
Finland91%
Ireland7
1%
Norway1
0%
Portugal1
0%
Siemens69851%
Vestas 53339%
Repower 36 3%
WinWind 181%
BARD 171%
GE141%
Areva6
0%
Other494%
Figure 11: Wind turbine manufacturers’ share of installed and connected offshore turbines

11The European offshore wind industry key trends and statistics 2011
Cumulative market
FiG. 11: WiND TURBiNE MANUFACTURERS’ CUMULATivE MARKET ShARE AT END 2011 iN MW
Siemens also has the largest market share in terms of installed capacity (53%). Vestas, similarly, has the second biggest share (36%), followed by REpower (5%). However, although BARD has one less turbine installed than WinWind, its model’s higher capacity means it has a larger market share.
Cumulative market share – wind farm owners/developers
FiG. 12: OWNERS ShARE2 OF iNSTALLED CAPACiTY iN MW
The vast majority (around 80%) of installed offshore ca-pacity was developed and is owned by utilities. DONG, Vattenfall and E.On together have around 53% of the market: 21%, 19% and 12% respectively.
The Belgian Belwind consortium3 remains the biggest independent offshore developer in Europe with its Bligh Bank project whose first phase was completed in 2010 and second phase due to begin construction.
Projects owned or developed by several companies have been split according to the respective shares. Where the shares are not known, they have been split in equal parts between the partners.
2 N.B. Market shares are indicative only 3 The Belwind consortium is composed of Colruyt group, PMV, Rabobank and SHV
Figure 12: Wind turbine manufacturers’ cumulative market share at end 2011 (MW)
Siemens2,012 MW
53%Vestas 1,371 MW 36%
Repower 182 MW 5%
BARD 85 MW 2%
WinWind 54 MW 1%
GE36 MW
1%
Areva30 MW
1%
Other43 MW
1%
Figure 13: Owners share of installed capacity in MW
DONG 21%
Vattenfall 19%
E.ON 12%
SSE 7%
Centrica 6%
Belwind 4%
Noordzee-Wind 3%
Marubeni 2%
PensionDanmark 2%
BARD 2%
Econcern 2%
Enoco 2%
ENBW 1%
EWE
1%C-Power
1%
VindparkVärnen
1%
Other 5%
RWE 9%

12The European offshore wind industry key trends and statistics 2011
Cumulative market
Substructures
FiG 13: ShARE OF SUBSTRUCTURE TYPES FOR ONLiNE WiND FARMS END 2011
The main substructure technology used is monopile supporting 1,021 grid connected turbines (75%), fol-lowed by 286 gravity based foundations (GBF), 30 jack-ets, 23 tripiles and three floating structures.
Figure 14: Share of substructure types for online wind farms end 2011
Monopile 1021
75%
GBF 286 21%
Jacket 30 2%
Tripile 23 2%
Floating3
0%
N/A 6
0%

13The European offshore wind industry key trends and statistics 2011
Market outlook
Market outlook
Once completed, the 9 offshore projects under con-struction in 2011 will bring online a further 2,375 MW of capacity. These projects alone will bring total installed capacity in Europe to 6,188 MW, a 62% increase.
Furthermore, preparatory work started in 2011 on nine other projects, seven in Germany and two in the UK.
These projects have a cumulative capacity of 2,910 MW, 2,272 in Germany and 638 in the UK.
With these 18 projects completed, total installed off-shore wind capacity in Europe would reach 9 GW. Fur-thermore, EWEA has identified 18 GW of fully consent-ed projects in 12 European countries.
FiG 14: OFFShORE MARKET: PROjECTS ONLiNE, UNDER CONSTRUCTiON AND CONSENTED (MW)
FiG 15: ShARE OF CONSENTED OFFShORE CAPACiTY (MW)
Figure 15: Offshore market: projects online, under construction and consented (MW)
Online Underconstruction
Consented
2000
4000
6000
8000
10000
12000
14000
16000
18000
20000
MW
Germany 45%
Figure 16: Consented offshore capacity by country (MW)
UK5%
Sweden6%
Norway2%
Netherlands12%
Latvia1%
Italy1%
Ireland11%
Estonia 7%
Denmark0%
Belgium 5%
Finland 5%

14The European offshore wind industry key trends and statistics 2011
Trends: turbines, water depth and distance to shore
Trends: turbines, water depth and distance to shore
Wind farm size
Since 2009, the average size of offshore wind farms has been increasing steadily. In 2011, the average size of the projects, once fully completed, is just under 200 MW, 45 MW (+29%) more than in 2010.
This trend is expected to continue and, indeed, acceler-ate as the average size of offshore wind farms current-ly under construction is almost 300 MW, and the aver-age size of projects consented - but where construction
has not yet started - is 344 MW, 72% bigger than 2011 projects.
As the technology matures and it is expected that wind farms will continue to grow in size, the UK offshore wind “round 3” is an example of this. The average size of pro-jects being planned by developers increases to 555 MW.
FiG 16: AvERAGE WiND FARM SizE iN MW
Figure 17: Average online wind farm size (MW)
5 2 5 17 3 4 25
166
65 30
91
46 80 69 60
155
199
301
343
555
100
200
300
400
500
600
1991
1992
1993
1994
1995
1996
1997
1998
1999
2000
2001
2002
2003
2004
2005
2006
2007
2008
2009
2010
2011
U/C
Consented
Planned M
W

15The European offshore wind industry key trends and statistics 2011
Trends: turbines, water depth and distance to shore
Wind turbine capacity
The average capacity of offshore wind turbines was 2 MW at end 2011. Average size of turbines grid connect-ed during 2011 was 3.6 MW up from 3 MW in 2010.
The first offshore wind turbines deployed in the nineties were not of the MW scale. In 2000 a first offshore wind farm using 2 MW turbines was built and grid connect-ed. Since, the average size of offshore turbines has been increasing, albeit not linearly, and in the middle of the last decade turbines in the 3+ MW range were be-ing deployed.
The first 5 MW turbines were used in 2007 at Bea-trice in the UK and 2008 at Hooksiel in Germany. This
size turbine has, since, become more common and, by 2011 the average size of offshore turbines was 3.6 MW, 20% more than in 2010 (3 MW) and over 6 times more than the turbines used in the early nineties. More-over, in 2011 REpower installed the first turbines with a rated capacity above 5 MW (5.075 MW) at Ormonde in the UK.
Looking at the under construction offshore wind farm pipeline (4,583 MW), the Siemens 3.6 MW turbine will continue to be used extensively. However, roll-out of 5 – 6 MW turbines means that the under construction pipe-line averages 3.9 MW.
FiG 17: AvERAGE ANNUAL SizE OF OFFShORE WiND TURBiNES iN MWFigure 18: Average offshore wind turbine size (MW)
19
91
19
92
19
93
19
94
1995
19
96
19
97
19
98
19
99
20
00
2001
20
02
20
03
20
04
20
05
20
06
20
07
20
08
20
09
2010
2011
U/C
0
1
2
3
4
MW

16The European offshore wind industry key trends and statistics 2011
Trends: turbines, water depth and distance to shore
Substructure trends
Water depths and distance to shore
FiG 18: ShARE OF SUBSTRUCTURE TYPES iN WiND FARMS UNDER CONSTRUCTiON
Five different types of substructures were used in ful-ly connected offshore wind farms in 2011. Excluding floating concepts that are still at experimental or dem-onstration stage, four types of substructures have been used in offshore wind farms to date: monopile, gravity, jacket and tripile.
As fig. 18 shows, monopiles are by far the most com-mon substructure used in offshore wind farms. Looking at wind farms that are currently under construction, the trend remains the same with monopiles maintaining an over 60% share. Jackets and tripiles make up the rest with similar shares (20% and 18% respectively).
Currently, no gravity based foundations have been iden-tified in the under construction pipeline. The latter are generally used in wind farms closer to shore.
FiG 19: AvERAGE SizE, DiSTANCE TO ShORE AND WATER DEPTh
Offshore wind farms are increasingly being built fur-ther from the coast and in deeper waters. Analysis of the planned projects pipeline shows that this trend will
continue. In 2011 average water depth of wind farms was 22.8m and average distance to shore 23.4km. For projects under construction, average depth is 25.3m and distance to shore 33.2km.
Figure 19: Share of substructure types under construction
Monopile 62%
Jacket 20%
tripile/pod 18%
10 20 30 40 50
20
0
40
80
60
100
120
Dis
tanc
e to
sho
re (km
)
Waterdepth (m)
Figure 20: Average size, distance to shore and water depth of operational wind farms, wind farms under construction and consented wind farms
online
under construction
consented

17The European offshore wind industry key trends and statistics 2011
Financing highlights and developments in 2011 and 2012 outlook
Financing highlights and developments in 2011 and 2012 outlook
Financing activity in the offshore wind farm sector saw a number of pioneering transactions on both the debt
and equity sides during 2011, as well as an active pipe-line for 2012.
In 2011, several transactions involving the sale and non-recourse refinancing of offshore cables previously built and disposed of by their owners were closed (Rob-in Rigg in March, Gunfleet Sands in July, Barrow in Sep-tember, Walney 1 in November). They had an aggregate amount of over £250 million (€300 million).
Several similar transactions are pending and are like-ly to close in 2012, allowing more funding to come to the industry.
Three transactions (Meerwind, Globaltech I, Baltic 1) were closed in 2011. More than twenty commercial banks were involved, taking construction risk in the largest two of these projects, in a sign of the sector’s slowly increasing attractiveness to lenders. All trans-actions were in Germany, confirming its strong con-struction pipeline, and followed the major transactions signed in late 2010 (C Power, Belgium, 325 MW and Borkum West 2, Germany, 200 MW).
From 2010 and 2011 non-recourse debt financing for offshore wind farms (excluding the Offshore Transmis-sion Owner transactions described below) increased by 40% - from €1.46 billion to €2.05 billion, and from 525 MW to 736 MW). The trend is likely to continue in 2012 with several deals officially in the banking market as of end 2011, including Lincs and Walney in the UK, and Butendiek and Gode Wind II in Germany.
The offshore wind sector is now increasingly seen as a core activity for project finance banks, as evidenced by numerous banks confirming they will continue to sup-port the sector in 2012. Importantly, while no two pro-jects are alike, the requirements of the banks are in-creasingly consistent across the market. However,
general uncertainties as to the ability of the banks to continue to provide long term financing to the economy may also touch the sector.
The Meerwind project (288 MW, €863 million in long term debt), closed in August. It was the first to take advantage of the new €5 billion programme set up by KfW, Germany’s development bank, and the first to be brought to the market by a pure financial investor, Blackstone. It was supported by Eksport Kredit Fonden (EKF), the Danish export-credit agency.
The Globaltech 1 project followed. Developed by Win-dreich and owned by a group of German and Swiss util-ities, it was supported by both the KfW programme and the European Investment Bank (EIB). This was the first transaction for a 400 MW project (€1,047 million in long term debt).
In November, German power company EnBW an-nounced the successful post-completion refinancing of its Baltic 1 wind farm (48 MW, €138 million in long term debt), the first commercial offshore wind farm in Ger-many, again with EIB involvement.
Non-recourse debt
Offshore Transmission Owner (OFTO) transactions4
4 An additional sub-sector of activity for investors and financiers related to offshore wind is the OFTO process in the UK, whereby the offshore transmission cables need to be owned and operated by an entity distinct from the wind farm owners - and are then subject to specific regulation

18The European offshore wind industry key trends and statistics 2011
Financing highlights and developments in 2011 and 2012 outlook
EKF and the EIB continued to support non-recourse lend-ing to the sector, and were joined this year by KfW. The EIB also continued its policy of supporting offshore wind farms through corporate refinancing backed by the utili-ties. It provided a £150 million (€180 million) loan to Vat-tenfall to refinance the Thanet project (300 MW, UK) and joined the financing of the Walney 1 cable.
The UK’s new Green Investment Bank will actively sup-port the offshore wind sector. Some transactions should close during 2012, although it may only deploy its capi-tal on a commercial basis until the EU has approved the scheme under State aid rules.
DONG Energy has continued to be the most active play-er, both on the acquisition and on the sale side, continu-ing and expanding its policy to “recycle” minority stakes in existing assets to finance new investments:
• DONG Energy sold 50% of the Anholt project (Den-mark, 400 MW) to Danish pension fund PensionDan-mark and Danish company DKA (March); this was a ground-breaking transaction in that it took place be-fore the project is actually built (DONG Energy pro-vides completion guarantees to PensionDanmark and DKA);
• DONG Energy sold 49% of Gunfleet Sands (UK, 172 MW) to Marubeni, the Japanese company (September);
• DONG Energy purchased the Borkum Riffgrund West project (400 MW, Germany) from EnergiKontor (November);
• DONG Energy purchased projects at an earlier stage of development, including a 33% stake in the first two UK Round 3 projects (Heron and Njord, 500 MW each) developed by Mainstream Renewable Power and Siemens in the Hornsea concession (December);
• PNE Wind sold the Nautilus II project (560 MW) to Ventizz, a private equity fund (November);
• PNE Wind sold the Gode Wind II project (252 MW) to Brancor Capital Partners, a Danish financial investor (December);
• BARD sold the Buiten Zee project (600 MW, the Neth-erlands) to Typhoon Offshore and HVC;
• Blackstone continued to expand in its German off-shore wind assets by purchasing the Nördlicher Gr-und project (261 MW) (August);
• Repsol and EDP acquired SeaEnergy’s UK offshore wind assets (July);
• Vattenfall announced the acquisition of the Sand-bank 24 project (480 MW, Germany) (November);
Overall, more than 3 GW in net planned capacity changed hands during the year. Of course, this comes in addition to the investment commitments announced by a number of utilities and developers on projects they already own.It is likely that 2012 will continue to see an active equity market with very diverse transactions and investors. The 2011 transactions have taken place at all stages of pro-ject development (from pre-contractual development, pri-or to construction or as operating assets). They have al-lowed an increasing variety of players to enter the sector, including financial investors, pension funds, and non-Eu-ropean utilities with transactions matching their desired risk profiles.
In conclusion, 2011 has been a largely positive year for offshore wind financing. Continued support from the early players, including multilaterals like the EIB and EKF, is cou-pled with the arrival of new players both on the equity and lending side. Investors and banks are beginning to see the sector as becoming established and more mature. Equal-ly, they are beginning to better understand the risks.
Policy-driven lenders
Equity finance

19The European offshore wind industry key trends and statistics 2011
New turbine announcements
FiG 20: ORiGiN OF COMPANiES ANNOUNCiNG NEW OFFShORE WiND TURBiNE MODELS
Almost half of the companies announcing new models are based in Europe. China is second with 33%, then the US (8%), Japan, South Korea and Israel follow. This activity across the globe is creating a highly competi-tive environment.
The new models announced are mostly large machines with a rated capacity above 5 MW. Taking into account the models announced over the last two years, only 28% are less than 5MW, the rest (72%) consists of big-ger machines.
New turbine announcements
41 companies have, over the past two and a half years, announced their intention to launch new offshore-dedi-cated wind turbine models. In all, 51 new models were announced: 28 in 2010 and 23 in 2011. This indicates
that offshore wind energy is seen as a dynamic sector that will grow considerably in the future .
Interest in offshore wind has spread beyond Europe and is now global, with turbine announcements be-ing made by companies in China, Japan, South Korea, USA and Israel. However, Europe maintains the lead in terms of companies actively planning to develop off-shore wind turbines.
FiG 21: OFFShORE WiND TURBiNE ANNOUNCEMENTS BY SizE AND ORiGiN
Figure 23: Origin of companies announcing new offshore wind turbine models
Europe 46%
China33%
Japan5%
Korea5%
USA8%
Israel3%
Figure 24: Offshore wind turbine announcements by size and origin.
< 5MW28%
European 47%
Chinese32%
Japanese5%
South Korean8%
US8%
Israel0%
> 5MW72%

20The European offshore wind industry key trends and statistics 2011
New turbine announcements
In 2011 announcements, both in and outside of Eu-rope, the trend towards larger turbines is marked. Vestas is ready to test its 7MW model and Alstom will launch a 6MW prototype. Siemens is testing a 6MW model in Denmark. Mervento, a Finish company is working on a 5MW turbine that will be tested dur-ing 2012.
Two bladed offshore wind turbine designs are an-nounced by Condor as well as Aerodyn SCD who sup-plied Mingyang with 3 and 6MW rotors. Dutch com-pany MECAL has signed an agreement to build a 6MW turbine for Huayi Electric (CN). Mitsubishi has announced plans for a 7MW model and South Ko-rean Samsung has revealed plans for up-scaling its
2.5MW machine for offshore use and new models with rated capacity up to 6MW.
Goldwind, Guodian United Power and Sinovel are look-ing into wind turbines in the 10 MW to 12 MW range. Similarly, GE has announced plans for a 15 MW tur-bine. In the EU, the Azimuth Offshore Wind Energy 2020 project, led by Gamesa, is planning a 15MW offshore wind turbine.
A new comer, Israel Aerospace Industries has an-nounced a joint venture for the production of a 3MW offshore wind turbine, as a first step into the renewa-ble energy business.

New turbine announcements
European1
5G
ames
a
10
Win
dPow
erLi
mite
d /
Aero
gene
rato
r X
SW
AY
9 8 7Ve
stas
Gam
esa
6Ve
stas
Al
stom
/ C
onve
rtea
mN
orde
x
Sch
uler
2-B
Ene
rgy
Sie
men
sB
ARD
5G
ames
aS
WAY
STX
Mer
vent
oCon
dor
4 3W
inW
ind
Acci
ona
Win
Flo
SW
AY/M
etce
ntre
2N
orde
xTe
chni
p - V
ertiw
ind
HiP
Rw
ind
YEA
RS
20
11
2012
2013
2014
2015
20
16
20
17
20
18
20
19
20
20
Non-European
2S
amsu
ngH
yund
ai/H
yosu
ng
3M
ingy
ang
Tian
wei
Isra
el A
eros
pace
Indu
strie
s
Sha
ngha
i Ele
ctric
Envi
sion
ene
rgy
(GC
-1)
Yinh
e (A
vant
is)
4G
E
5
Dar
win
d XE
MC
Huy
ndai
Chi
na S
hipp
ing
Indu
stry
Zhei
jian
Win
dey
Don
gfan
g (A
MS
C)
6S
inov
elS
amsu
ngD
oosa
n
Min
gyan
gG
oldw
ind
Guo
dian
Uni
ted
Pow
erH
uayi
Ele
ctric
& M
ECAL
7M
itsub
ishi
8N
PS
9 10
Sin
ovel
Gol
dwin
dAM
SC S
ea T
itan
11
12
Guo
dian
Uni
ted
Pow
er
15
GE
21Th
e Eu
rope
an o
ffsh
ore
win
d in
dust
ry k
ey t
rends
and
stat
isti
cs 2
01
1
FiG
22: N
EW W
iND
TU
RB
iNE
AN
NO
UN
CEM
ENTS
iN
20
10
AN
D 2
01
1 –
PR
OTO
TYP
ES A
ND
PR
OD
UC
TS
Lege
ndDa
te n
ot
anno
unce
d
Capa
city
not
an
noun
ced
Prod
uct
Euro
pe
US
Chi
na
Japa
n
Sou
th K
orea
Isra
el

22The European offshore wind industry key trends and statistics 2011
Offshore grid developments
European Infrastructure Package
Interconnection work under way
Offshore grid developments
In October 2011, the European Commission proposed a regulation for guidelines for trans-European energy infrastructure to accelerate and finance for new en-ergy infrastructure. Support from the EU budget to priority projects is €9.1 billion, substantially more than was provided in the past TEN-E programme. The Commission plans to cut authorisation lead times for new priority European power lines by putting forward a binding timeline of three years for procedures con-cerning Projects of Common Interest (PCI). Priority ‘corridors’ will include, among others, the North Seas
(North and Baltic Sea). Regional project selection of the PCIs in this region will most likely be carried out by the North Seas Countries’ Offshore Grid Initiative (NSCOGI) set up by nine Member States, Norway and the Commission, with the involvement of concerned TSOs, regulators and project promoters.
The proposed legislation is now being negotiated with the European Parliament and Council, with an agree-ment foreseen by end 2012.
Various prominent interconnection projects are on track or have been recently completed. The ‘East-West Interconnector’ between Ireland and Wales is well under way and on track for completion in 2012. It will add 500 MW of interconnection capacity to Ire-land which currently only has one cable (Moyle) to Scotland.
BritNed between the UK and the Netherlands com-menced trading operations on 1 April 2011. The re-spective national TSOs, National Grid and TenneT, es-tablished a joint venture that funded and operates the interconnector with a capacity of 1000 MW, in-dependently from the TSO’s regulated businesses. BritNed was completed on time and within the es-tablished €600 million budget. Since it went online, electricity has flowed from the Netherlands to the UK most of the time.
The Cobra Cable - a planned 700 MW HVDC inter-connector between the Netherlands and Denmark –is still pending its final investment decision. After hav-ing received an €85 million grant from the Europe-an Economic Recovery Plan (EERP) as a particular-ly innovative project, the partners are obliged to look into the technical and economic options for connect-ing directly to wind farms in the German Bight. Tech-nical issues such as the voltage levels (320 kV) have been clarified, however, legal questions regarding the alignment of differing national regulatory frame-works are still under discussion. These will influence the project’s business case. If construction starts as planned, the connection is scheduled to be opera-tional by 2016, but a delay is to be expected.

23The European offshore wind industry key trends and statistics 2011
Offshore grid developments
Grid developments between Norway, UK and continental Europe
Supply bottleneck for HV cables looming while HVDC cable provision advances
Stricken with regulatory uncertainties and constant delays the investment decisions for two previous-ly planned interconnection projects between Nor-way and continental Europe – NorGer and NordLink – seem to have been delayed to the latter half of the decade. In contrast, five partners, including Vattenfall
and SSE established the NorthConnect project com-pany in February 2011, to build a merchant line be-tween Scotland and Norway. The current trans-Eu-ropean network for energy (TEN-E) programme has granted funding to support the planning phase.
With increasing project size and distance from shore demand for subsea cables and large high-voltage transformers is rising. A recent EWEA report5 found that without increased capacity in manufacturing a shortage of high voltage (HV) subsea cables could be-come a critical bottleneck for the offshore industry. However, the historically limited range of suppliers of
high-voltage direct current (HVDC) cables has expand-ed. The substantial deployment of HVDC technology gives further momentum towards the development of multi-terminal capability which still requires further demonstration efforts to gain investor and system operator confidence.
5 Wind in our sails – the coming of Europe’s offshore wind industry, EWEA, November 2011