The European Journal of Neuroscience - CORE · The European Journal of Neuroscience ... Received 20...
16
The European Journal of Neuroscience Volume 3 Number 7 July 1991 CONTENTS RESEARCH PAPERS Mediodorsal Thalamic Lesions Impair Long-Term Visual Associative Memory in Macaques D. Gaff an and S. Watkins 615 NMDA Actions on Rat Abducens Motoneurons J. Durand 621 Molecular Association of the Neural Adhesion Molecules L1 and N-CAM in the Surface Membrane of Neuroblastoma Cells is Shown by Chemical Cross-linking H. Simon, S. Klinz, T. Fahrig and M. Schachner 634 Innervation of Entorhinal Principal Cells by Neurons of the Nucleus Reuniens Thalami. Anterograde PHA-L Tracing Combined with Retrograde Fluorescent Tracing and Intracelluar Injection with Lucifer Yellow in the Rat F. G. Wouterlood 641 Auditory Pontine Grey: Connections and Response Properties in the Horseshoe Bat G. Schuller, Ε. Covey and J . H. Casseday 648 Modulation of Human Neurite Outgrowth by Serine Proteases: A Comparison of the Interaction of Thrombin and Prothrombin with Glia-Derived Nexin P. W. Grabham, D. Monard, P. H. Gallimore and R. J . A. Grand 663 Characterization and Regional Distribution of a Class of Synapses with Highly Concentrated cAMP Binding Sites in the Rat Brain A. Caretta, D. Cevolani, G. Luppino, M. Matelli and R. Tirindelli 669 Cells that Express Brain-Derived Neurotrophic Factor mRNA in the Developing Postnatal Rat Brain W. J . Friedman, L. Olson and H. Persson 688 Nerve Growth Factor is Required for Induction of c-Fos Immunoreactivity by Serum, Depolarization, Cyclic AMP or Trauma in Cultured Rat Sympathetic Neurons A. Buckmaster, C. D. Nobes, S. N. Edwards and A. M. Tolkovsky 698 SHORT COMMUNICATION Calcitonin Gene-related Peptide Stimulates the Induction of c-fos Gene Expression in Rat Astrocyte Cultures C. A. Haas, M. Reddington and G. W. Kreutzberg 708 ERRATUM 713 Published on behalf of the European Neuroscience Association by Oxford University Press
-
Upload
phungtuong -
Category
Documents
-
view
237 -
download
0
Transcript of The European Journal of Neuroscience - CORE · The European Journal of Neuroscience ... Received 20...
The European Journal of Neuroscience Volume 3 Number 7 July 1991
CONTENTS
RESEARCH PAPERS Mediodorsal Thalamic Lesions Impair Long-Term Visual Associative Memory in Macaques
D. Gaff an and S. Watkins 615
NMDA Actions on Rat Abducens Motoneurons J . Durand 621
Molecular Association of the Neural Adhesion Molecules L1 and N-CAM in the Surface Membrane of Neuroblastoma Cells is Shown by Chemical Cross-linking H. Simon, S. Klinz, T. Fahrig and M. Schachner 634
Innervation of Entorhinal Principal Cells by Neurons of the Nucleus Reuniens Thalami. Anterograde PHA-L Tracing Combined with Retrograde Fluorescent Tracing and Intracelluar Injection with Lucifer Yellow in the Rat F. G. Wouterlood 641
Auditory Pontine Grey: Connections and Response Properties in the Horseshoe Bat G. Schuller, Ε. Covey and J . H. Casseday 648
Modulation of Human Neurite Outgrowth by Serine Proteases: A Comparison of the Interaction of Thrombin and Prothrombin with Glia-Derived Nexin P. W. Grabham, D. Monard, P. H. Gallimore and R. J . A. Grand 663
Characterization and Regional Distribution of a Class of Synapses with Highly Concentrated cAMP Binding Sites in the Rat Brain A. Caretta, D. Cevolani, G. Luppino, M. Matelli and R. Tirindelli 669
Cells that Express Brain-Derived Neurotrophic Factor mRNA in the Developing Postnatal Rat Brain W. J . Friedman, L. Olson and H. Persson 688
Nerve Growth Factor is Required for Induction of c-Fos Immunoreactivity by Serum, Depolarization, Cyclic AMP or Trauma in Cultured Rat Sympathetic Neurons A. Buckmaster, C. D. Nobes, S. N. Edwards and A. M. Tolkovsky 698
SHORT COMMUNICATION Calcitonin Gene-related Peptide Stimulates the Induction of c-fos Gene Expression in Rat Astrocyte
Cultures C. A. Haas, M. Reddington and G. W. Kreutzberg 708
ERRATUM 713
Published on behalf of the European Neuroscience Association by Oxford University Press

European Journal of Neuroscience, Vol. 3, pp. 648 - 662 © European Neuroscience Association 0953-816x191 $3.00
Auditory Pontine Grey: Connections and Response Properties in the Horseshoe Bat
Gerd Schuller1, Ellen Covey2 and John H. Casseday2
Zoologisches Institut, Universität München, D-8000 München 2, FRG
department of Neurobiology, Box 3209, Duke University Medical Center, Durham, NC 27710, USA
Key words: Rhinolophus rouxi, electrophysiology, inferior colliculus, auditory cortex
Abstract This study investigates the role of the pontine grey as a link between the auditory system and the cerebellum in the bat, Rhinolophus rouxi. We recorded response properties of single neurons in the pontine grey and, in the same preparation, injected wheat germ agglutinin - horseradish peroxidase (WGA-HRP) in areas responsive to sound. Thus the functional evidence was correlated with retrograde and anterograde transport. The main results are: (i) all auditory neurons in the pontine grey are tuned within one of two harmonically related frequency ranges of the echolocation call. The upper range corresponds to the constant frequency and frequency modulated components of the second harmonic, but the lower range corresponds only to the frequency modulated component of the first harmonic. There is no systematic tonotopic organization; (ii) discharge patterns are extremely variable, latencies cover a wide range, and about half of the neurons are binaurally responsive with excitation from both ears; (iii) most pontine auditory neurons respond preferentially to frequency modulated stimuli; (iv) there is massive input to the pontine grey from the central nucleus of the inferior colliculus; (v) cortical input to the pontine grey does not originate in tonotopically organized auditory cortex. The input is from a dorsal belt area that is specialized for processing combinations of sounds with specific frequency ratios and delays; (vi) projections from the auditory region of the pontine grey are widespread within the cerebellar cortex. The data suggest that the pontine grey transmits to the cerebellum information contained in specific components of the bat's biosonar signal.
Introduction The nuclei of the pontine grey provide a major pathway through which sensory information is transmitted to the cerebellum. For example, it is well known that input from the visual cortex and superior colliculus is transmitted to the cerebellum via the pontine nuclei (Hashikawa and Kawamura, 1977; Mower et al., 1979; Glickstein et al., 1980; Kawamura and Hashikawa, 1981; Robinson et al., 1984; Mihailoff etal., 1989). This sensory information is then coordinated with motor feedback from eyes, head and body to control head and eye movements for fixation on moving targets (e.g. Robinson, 1976; Mower et al., 1979; Optican and Robinson, 1980; Keller and Crandall, 1983; Mustari et al., 1986; Sparks et al., 1987; Suzuki et al., 1990).
The present study addresses the question of whether there is an auditory pathway in the echolocating bat that resembles in its general organization the visual pontocerebellar pathway of other mammals. A number of studies indicate that there is a substantial auditory pathway to the cerebellum in bats. Anterograde tracing experiments demonstrate
a pathway from the inferior colliculus to the pontine grey in Rhinolophus ferrwnequinum (Schweizer, 1981). However, the sources of these pathways have not been demonstrated by retrograde transport techniques. A large number of neurons in the cerebellum respond to sound (Jen etal., 1981; Sun etal., 1983; Horikawa and Suga, 1986). There is no electrophysiological evidence in bats on the response of neurons in the pontine grey to sound; indeed, there is only one study on this topic in any mammal (cat: Aitkin and Boyd, 1978).
The first purpose of the present study was to demonstrate that the pontine grey contains neurons that respond to sound and to investigate their response properties. The second purpose was to identify the sources of auditory input to the pontine grey, as revealed by retrograde transport and determine which subdivisions of the inferior colliculus and auditory cortex contribute to the auditory pontine pathway. Anterograde transport was intended to demonstrate that the auditory pontine grey projects to the cerebellar cortex. Our overall aim was
Correspondence to: Ellen Covey, as above
Received 20 September 1990, revised 19 November 1990, accepted 13 March 1991
Auditory pontine grey in an echolocating bat 649
to provide basic information that could lead to further experiments on the role of the pontocerebellar pathway in auditory motor coordination.
The echolocating bat, Rhinolophus rouxi, is particularly appropriate for these studies because it relies largely or exclusively on auditory input to guide many motor actions, including flight, vocalization and prey capture. Its echolocation call is composed of a constant frequency (CF) portion and a terminal frequency modulated (FM) portion, each of which serves a different function for the bat. Rhinolophus adjusts the frequency of its vocalizations to compensate for Doppler shifts in the echoes and thus stabilize the frequency of the echo CF component (Schnitzler, 1968). The CF component is probably used for detection and identification of flying prey (Schnitzler, 1970; Schuller, 1979a). The broadband FM components are apparently used in neural encoding of pulse-echo delay for distance discrimination (Simmons, 1973; O'Neill and Suga, 1979, 1982). Our interest was in whether auditory neurons in the pontine grey would reflect these different sensory functions, for example, by a disproportionate representation of certain frequency ranges.
To achieve the above aims we used a combination of electrophysiological and anatomical methods in the same preparation. We first analysed the responses of pontine neurons to a variety of sound stimuli that mimic the basic properties of the echolocation signals of the horseshoe bat. In the same animals, we then injected wheat germ agglutinin-horseradish peroxidase (WGA — HRP) in the auditory parts of the pontine grey to identify the sources of auditory input and to confirm that these pontine areas project to the cerebellum. A brief report of these results has been presented (Covey et at., 1990).
Materials and methods The animals used in this study were six Sri Lankan rufous horseshoe bats (Rhinolophus rouxi). Previous publications describe in detail the techniques for surgery and stereotaxic measurement (Schuller et al., 1986). generation and presentation of acoustic stimuli (Schuller, 1979b) and anatomical tracing of connections with W G A - H R P (Casseday et al., 1988).
On the day before the first recording session, the animal was anaesthetized with halothane and a metal post was attached to the skull with cyanoacrylic adhesive and dental cement. This post allowed the animal to be placed in the same position in the stereotaxic apparatus for each recording session. While the animal was still under anaesthesia, a small opening was made in the skull for entry of the electrodes. All electrodes entered through the same opening, but the angle was varied. Animals were typically used for 6 -12 recording sessions. During recording, bats were awake. Local anaesthetic (Xylocaine) was applied to incisions and pressure points. Neural responses were recorded with fine-tipped KCl-filled glass micropipette electrodes with impedances of 5 - 12 ΜΩ. Electrodes were advanced with a Burleigh microdrive.
Auditory stimuli were presented via two custom-built earphones. Specula attached to the earphones provided a closed system by which sound was directly presented to the ear canals. The frequency response of the earphones, measured 1 mm in front of the speculum, was flat ± 5 dB from 10 kHz to 100 kHz. Acoustic isolation between the ears was better than 40 dB (Schlegel, 1977). Test stimuli were pure tones (CF), sinusoidally frequency modulated (SFM) tones, linear FM sweeps, CF —FM combinations to mimic natural pulses, and any of these stimuli with harmonics added. The CF and SFM tones were 30 ms in duration; the FM sweeps were 10 ms. The standard search stimulus
was intended to simulate the bat's echolocation signal and was a CF followed by a 10 kHz downward FM sweep.
Whenever a single unit was isolated, it was first tested with pure tones to determine its best frequency (BF) and excitatory threshold at BF. Some units did not respond well or at all to pure tones; these were tested with FM and SFM stimuli to determine the best stimulus type. Once the best stimulus was determined, the unit was categorized according to its monaural and binaural response properties, i.e. whether it was excited or inhibited by stimuli at either ear alone or in combination with stimuli at the other ear.
To analyse temporal response properties, i.e. latency, regularity of discharge, or distribution of spikes over time, we collected dot raster diagrams and post-stimulus time histograms (PSTHs) under various conditions determined by the unit's response characteristics.
On the last day of recording, an injection of W G A - H R P was placed in an area of the pontine grey where auditory responses were found. The injection electrode was a fine-tipped glass micropipette filled with a 5% solution of W G A - H R P (Sigma) in physiological saline. Neural responses were recorded with the injection electrode prior to injecting the tracer. Injections were made by iontophoresis, using a continuous current of 0.75 —1.00 μΑ, positive at the electrode, for 3 -5 min duration.
After a survival period of 24 h, animals were administered a lethal dose of Nembutal (pentobarbital) and perfused through the heart with 0.85% saline solution followed by a fixation solution of 1% paraformaldehyde and 1.25% glutaraldehyde in 0.1 Μ phosphate buffer. The fixative was washed out with a graded series of sucrose solutions, from 10 to 20%. Brains were stored overnight in a solution of 30% sucrose in phosphate buffer. Sections were cut at 42 μηι on a cryostat and collected in phosphate buffer. Alternate tissue sections were reacted with tetramethylbenzidine (Mesulam, 1978) for visualization of WGA —HRP transport; the remaining sections were reacted with diaminobenzidine (Adams, 1977) and stained with cresyl violet for localizing the centre of the injection site and for analysis of cytoarchitecture relative to recording sites. The locations of labelled cells, fibres and terminals were plotted on a standard series of frontal sections from an atlas of the brain of R. rouxi (Radtke-Schuller, unpublished). These data were then entered into a commercial CAD program (Cadkey) for 3-dimensional presentation. A database program (Reflex, Borland) was used to transform the coordinates of each recording site from the values read from the stereotaxic device to coordinates within the brain. We then verified the results by comparing the transformed coordinates of the injection site with those determined from the histological sections.
Results Physiology We recorded responses to auditory stimuli from 229 sites in the pontine grey of R.rouxi; of these, 69 were multiunit clusters and 160 were single units. Our analyses of response properties are based on data from the single units only.
^cation and extent of pontine auditory region
Figure 1 shows the location and cytoarchitectonic appearance of the pontine grey. As described and reviewed by Mihailoff et al. (1981), the pontine grey of most mammals does not have cytoarchitecturally distinct subdivisions. The pontine grey of R. rouxi is for the most part
650 Auditory pontine grey in an echolocating bat
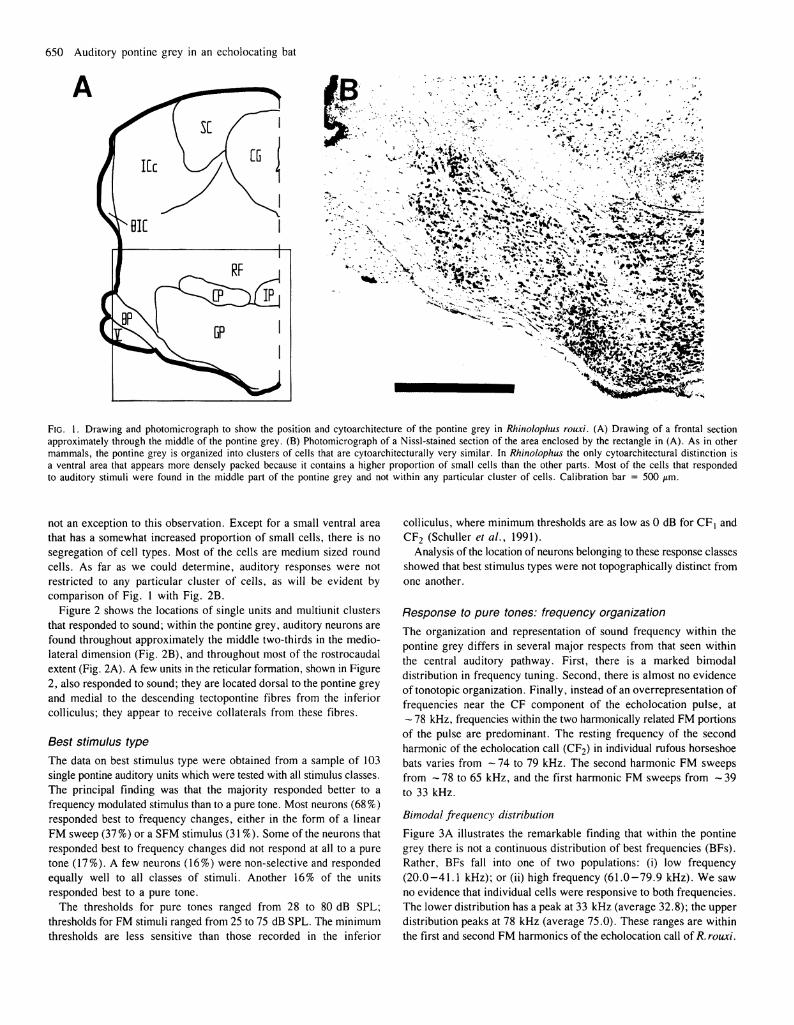
FIG. 1. Drawing and photomicrograph to show the position and cytoarchitecture of the pontine grey in Rhinolophus rouxi. (A) Drawing of a frontal section approximately through the middle of the pontine grey. (B) Photomicrograph of a Nissl-stained section of the area enclosed by the rectangle in (A). As in other mammals, the pontine grey is organized into clusters of cells that are cytoarchitecturally very similar. In Rhinolophus the only cytoarchitectural distinction is a ventral area that appears more densely packed because it contains a higher proportion of small cells than the other parts. Most of the cells that responded to auditory stimuli were found in the middle part of the pontine grey and not within any particular cluster of cells. Calibration bar = 500 μιη.
not an exception to this observation. Except for a small ventral area that has a somewhat increased proportion of small cells, there is no segregation of cell types. Most of the cells are medium sized round cells. As far as we could determine, auditory responses were not restricted to any particular cluster of cells, as will be evident by comparison of Fig. 1 with Fig. 2B.
Figure 2 shows the locations of single units and multiunit clusters that responded to sound; within the pontine grey, auditory neurons are found throughout approximately the middle two-thirds in the medio-lateral dimension (Fig. 2B), and throughout most of the rostrocaudal extent (Fig. 2A). A few units in the reticular formation, shown in Figure 2, also responded to sound; they are located dorsal to the pontine grey and medial to the descending tectopontine fibres from the inferior colliculus; they appear to receive collaterals from these fibres.
Best stimulus type The data on best stimulus type were obtained from a sample of 103 single pontine auditory units which were tested with all stimulus classes. The principal finding was that the majority responded better to a frequency modulated stimulus than to a pure tone. Most neurons (68%) responded best to frequency changes, either in the form of a linear FM sweep (37%) or a SFM stimulus (31%). Some of the neurons that responded best to frequency changes did not respond at all to a pure tone (17%). A few neurons (16%) were non-selective and responded equally well to all classes of stimuli. Another 16% of the units responded best to a pure tone.
The thresholds for pure tones ranged from 28 to 80 dB SPL; thresholds for FM stimuli ranged from 25 to 75 dB SPL. The minimum thresholds are less sensitive than those recorded in the inferior
colliculus, where minimum thresholds are as low as 0 dB for CFj and CF 2 (Schuller et al., 1991).
Analysis of the location of neurons belonging to these response classes showed that best stimulus types were not topographically distinct from one another.
Response to pure tones: frequency organization The organization and representation of sound frequency within the pontine grey differs in several major respects from that seen within the central auditory pathway. First, there is a marked bimodal distribution in frequency tuning. Second, there is almost no evidence of tonotopic organization. Finally, instead of an overrepresentation of frequencies near the CF component of the echolocation pulse, at - 7 8 kHz, frequencies within the two harmonically related FM portions of the pulse are predominant. The resting frequency of the second harmonic of the echolocation call (CF 2) in individual rufous horseshoe bats varies from - 7 4 to 79 kHz. The second harmonic FM sweeps from - 7 8 to 65 kHz, and the first harmonic FM sweeps from —39 to 33 kHz.
Bimodal frequency distribution
Figure 3A illustrates the remarkable finding that within the pontine grey there is not a continuous distribution of best frequencies (BFs). Rather, BFs fall into one of two populations; (i) low frequency (20.0-41.1 kHz); or (ii) high frequency (61.0-79.9 kHz). We saw no evidence that individual cells were responsive to both frequencies. The lower distribution has a peak at 33 kHz (average 32.8); the upper distribution peaks at 78 kHz (average 75.0). These ranges are within the first and second FM harmonics of the echolocation call of R. rouxi.

Auditory pontine grey in an echolocating bat 651
α οι
ΊΟ
\ / \ : 800 μι
12 r /c (mml
r / c : 7000 μηη
FIG. 2. Location of pontine neurons responsive to sound. The upper drawing shows a lateral view of the brain of Rhinolophus rouxi. The rectangle enclosed by the dotted line shows the extent of the parasagittal view shown in ( A ) below. The solid vertical line indicates the position of the frontal section shown in (B). ( A ) Rostrocaudal distribution as seen in a composite parasagittal view of all sites where auditory responses were recorded. Only in the most rostral and ventral parts were there no auditory responses. (B) Mediolateral distribution as seen in a composite frontal view of all sites where auditory responses were recorded. These are distributed throughout approximately the middle two-thirds of the pontine grey.
Unlike the central auditory pathway, there is not only overrepresentation of the CF 2 frequency but also overrepresentation of the two FM frequency bands (Fig. 3A).
We were interested in whether these two populations of neurons also differed in their breadth of tuning. A l l of the brainstem auditory nuclei in R. rouxi contain a disproportionately large number of neurons that are finely tuned to a narrow band centred around the CF 2 portion of the echolocation call. At the inferior colliculus, for example, these CF2-sensittve neurons all have high QiodB> values greater than 20, while neurons with BFs in the low frequency range have QiodBs °f less than 20 (Möller et aL, 1978). In Figure 3B, the plot of Q 1 0 d B
versus frequency shows that the highest QiodB values are for neurons with BFs between 70 and 80 kHz. Thus, breadth of tuning of pontine auditory neurons follows the same pattern as for neurons in the central auditory pathway. This observation suggests that breadth of frequency tuning in the pontine nuclei simply reflects the tuning properties of the neurons that provide their input.
10 20 30 40 50 60 70 80 90 100
10 20 30 40 50 60 70 80 90 100 Frequency (kHz)
FIG. 3. Bimodal distribution of best frequencies in the pontine grey. ( A ) Histogram of the number of neurons versus best frequency shows a clear bimodal distribution with neurons falling into a low frequency group or a high frequency group. ( B ) A plot of QJOJB values versus B F shows that high frequency neurons are more narrowly tuned than low frequency neurons.
Topographic distribution of BFs
Figure 4 shows the location of neurons with BFs in either the low or the high frequency range. In spite of the fact that these are two discontinuous populations in terms of frequency tuning, the two populations overlap considerably in their physical distribution within the pontine grey. There is some tendency for neurons with high BFs to be dorsolateral and neurons with low BFs to be ventromedial, but they are for the most part intermixed. This topographical mixing of BFs is in striking contrast to the strict tonotopic organization observed throughout the central auditory system. This lack of tonotopy was seen in both individual and pooled data.
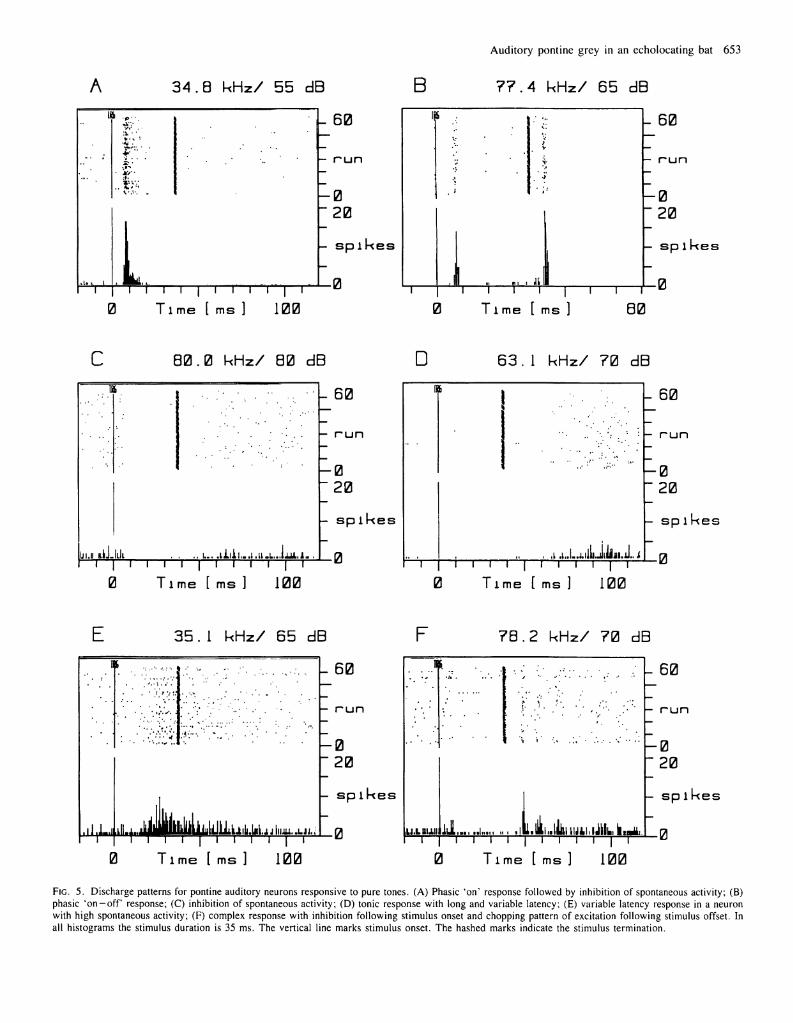
Response to pure tones: discharge patterns Pontine auditory neurons respond to pure tones with a variety of different discharge patterns ranging from inhibition of spontaneous activity to robust excitation (Table I ) . Some of these discharge patterns are illustrated in Figure 5. Figures 5 A and 5B are examples of neurons that discharged phasically to tone bursts, either to the onset (A), to the offset, or to both the onset and the offset (B) of a tone. In these phasic types of responses, excitation was tightly locked to the beginning of the tone or the beginning and end of the tone. Most units that
652 Auditory pontine grey in an echolocating bat
m / 1 : 8 0 0 pm r / c : 7 0 0 0 pm
° low f r e q u e n c y • h i g h f r e q u e n c y
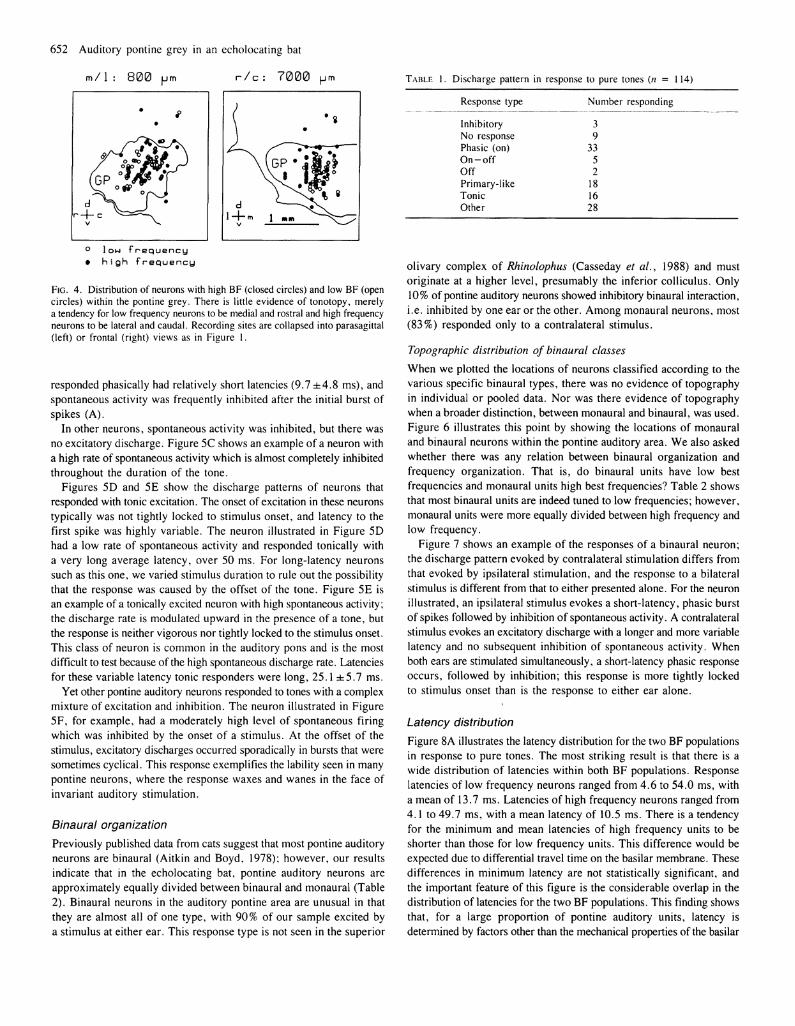
FIG. 4. Distribution of neurons with high BF (closed circles) and low BF (open circles) within the pontine grey. There is little evidence of tonotopy, merely a tendency for low frequency neurons to be medial and rostral and high frequency neurons to be lateral and caudal. Recording sites are collapsed into parasagittal (left) or frontal (right) views as in Figure 1.
responded phasically had relatively short latencies (9.7 ± 4 . 8 ms), and spontaneous activity was frequently inhibited after the initial burst of spikes (A).
In other neurons, spontaneous activity was inhibited, but there was no excitatory discharge. Figure 5C shows an example of a neuron with a high rate of spontaneous activity which is almost completely inhibited throughout the duration of the tone.
Figures 5D and 5E show the discharge patterns of neurons that responded with tonic excitation. The onset of excitation in these neurons typically was not tightly locked to stimulus onset, and latency to the first spike was highly variable. The neuron illustrated in Figure 5D had a low rate of spontaneous activity and responded tonically with a very long average latency, over 50 ms. For long-latency neurons such as this one, we varied stimulus duration to rule out the possibility that the response was caused by the offset of the tone. Figure 5E is an example of a tonically excited neuron with high spontaneous activity; the discharge rate is modulated upward in the presence of a tone, but the response is neither vigorous nor tightly locked to the stimulus onset. This class of neuron is common in the auditory pons and is the most difficult to test because of the high spontaneous discharge rate. Latencies for these variable latency tonic responders were long, 25.1 ± 5 . 7 ms.
Yet other pontine auditory neurons responded to tones with a complex mixture of excitation and inhibition. The neuron illustrated in Figure 5F, for example, had a moderately high level of spontaneous firing which was inhibited by the onset of a stimulus. At the offset of the stimulus, excitatory discharges occurred sporadically in bursts that were sometimes cyclical. This response exemplifies the lability seen in many pontine neurons, where the response waxes and wanes in the face of invariant auditory stimulation.
Binaural organization Previously published data from cats suggest that most pontine auditory neurons are binaural (Aitkin and Boyd, 1978); however, our results indicate that in the echolocating bat, pontine auditory neurons are approximately equally divided between binaural and monaural (Table 2). Binaural neurons in the auditory pontine area are unusual in that they are almost all of one type, with 90% of our sample excited by a stimulus at either ear. This response type is not seen in the superior
TABLE 1. Discharge pattern in response to pure tones (/? = 114)
Response type Number responding
Inhibitory 3 No response 9 Phasic (on) 33 O n - o f f 5 Off 2 Primary-like 18 Tonic 16 Other 28
olivary complex of Rhinolophus (Casseday et ai, 1988) and must originate at a higher level, presumably the inferior colliculus. Only 10% of pontine auditory neurons showed inhibitory binaural interaction, i.e. inhibited by one ear or the other. Among monaural neurons, most (83%) responded only to a contralateral stimulus.
Topographic distribution of binaural classes
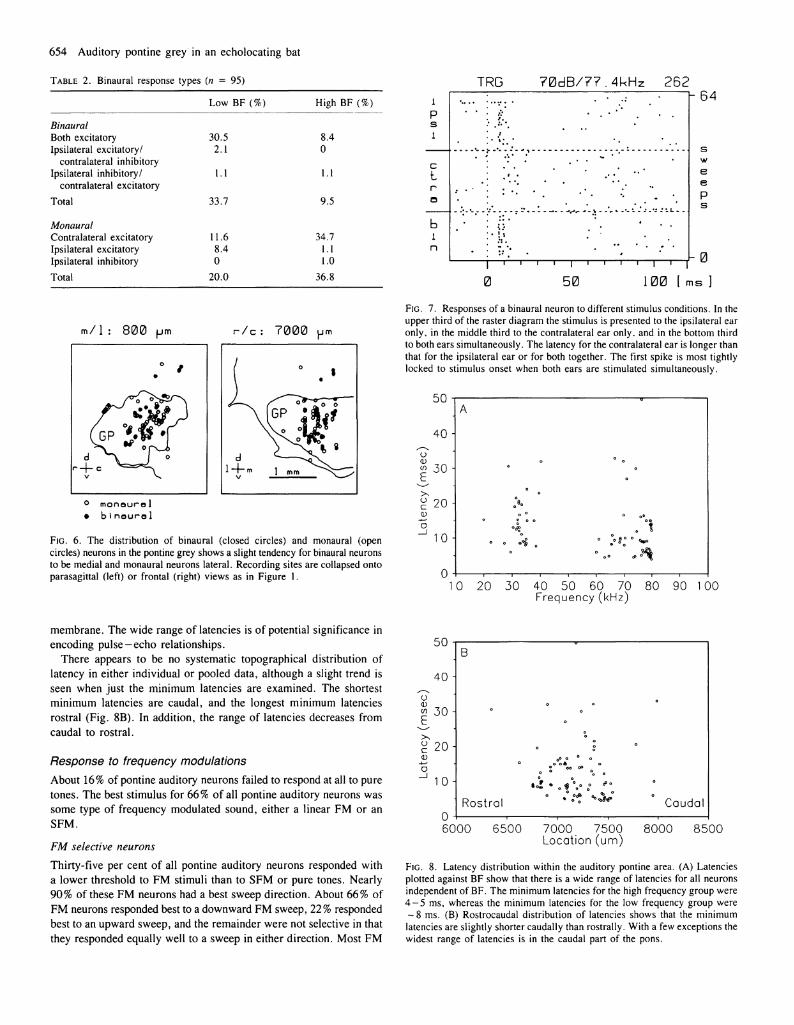
When we plotted the locations of neurons classified according to the various specific binaural types, there was no evidence of topography in individual or pooled data. Nor was there evidence of topography when a broader distinction, between monaural and binaural, was used. Figure 6 illustrates this point by showing the locations of monaural and binaural neurons within the pontine auditory area. We also asked whether there was any relation between binaural organization and frequency organization. That is, do binaural units have low best frequencies and monaural units high best frequencies? Table 2 shows that most binaural units are indeed tuned to low frequencies; however, monaural units were more equally divided between high frequency and low frequency.
Figure 7 shows an example of the responses of a binaural neuron; the discharge pattern evoked by contralateral stimulation differs from that evoked by ipsilateral stimulation, and the response to a bilateral stimulus is different from that to either presented alone. For the neuron illustrated, an ipsilateral stimulus evokes a short-latency, phasic burst of spikes followed by inhibition of spontaneous activity. A contralateral stimulus evokes an excitatory discharge with a longer and more variable latency and no subsequent inhibition of spontaneous activity. When both ears are stimulated simultaneously, a short-latency phasic response occurs, followed by inhibition; this response is more tightly locked to stimulus onset than is the response to either ear alone.
Latency distribution Figure 8A illustrates the latency distribution for the two BF populations in response to pure tones. The most striking result is that there is a wide distribution of latencies within both BF populations. Response latencies of low frequency neurons ranged from 4.6 to 54.0 ms, with a mean of 13.7 ms. Latencies of high frequency neurons ranged from 4.1 to 49.7 ms, with a mean latency of 10.5 ms. There is a tendency for the minimum and mean latencies of high frequency units to be shorter than those for low frequency units. This difference would be expected due to differential travel time on the basilar membrane. These differences in minimum latency are not statistically significant, and the important feature of this figure is the considerable overlap in the distribution of latencies for the two BF populations. This finding shows that, for a large proportion of pontine auditory units, latency is determined by factors other than the mechanical properties of the basilar
0
3 4 . θ k H z / 55 dB
Auditory pontine grey in an echolocating bat 653
Β 7 7 . 4 k H z / 65 dB
- 60
- run
Time [ ms ] 100 0 τ 1 Γ
Τ1 me [ ms ]
- s p 1 k e s
ι Γ
B0
C Θ0.0 k H z / 60 dB
ί—ι—ι—ι ι ι—ι—ρ 0 Time [ ms ] 100
• us
63.1 k H z / 70 dB
0 τ — ι — Γ
Τ ι
, λ .ι,.Ι.αιίίιJiliiiJ.. JJ τ — ι — ι — I I ι — ι — Γ
Ι- 60
run
h 0 20
- s p 1 k e s
0
me [ ms ] 100
iLL 0
35.1 k H z / 65 dB
Τ1 me [ ms ]
- 60
- run
-0 20
s p i k e s
-0
9
U,Lttllll T
7 8 . 2 k H z / 70 dB
ILL ι ι ι ι ι T~T 100 0 T i me [ ms ]
1 I 1
100
- 60
- run
- 0 " 20
- s p 1 k e s
- 0
FIG. 5. Discharge patterns for pontine auditory neurons responsive to pure tones. (A) Phasic 'on' response followed by inhibition of spontaneous activity; (B) phasic O n - o f f response; (C) inhibition of spontaneous activity; (D) tonic response with long and variable latency; (E) variable latency response in a neuron with high spontaneous activity; ( F ) complex response with inhibition following stimulus onset and chopping pattern of excitation following stimulus offset. In all histograms the stimulus duration is 35 ms. The vertical line marks stimulus onset. The hashed marks indicate the stimulus termination.
654 Auditory pontine grey in an echolocating bat
TABLE 2. Binaural response types (n — 95)
Low B F ( % )
Binaural Both excitatory Ipsilateral excitatory/
contralateral inhibitory Ipsilateral inhibitory/
contralateral excitatory
Total
Monaural Contralateral excitatory Ipsilateral excitatory Ipsilateral inhibitory Total
30.5 2.1
1.1
33.7
11.6 8.4 0
20.0
High B F ( % )
8.4 0
1.1
9.5
34.7 1.1 1.0
36.8
T R G 70dB/?7.4kHz 262 i Ρ s y. * ·
i • \ · · · , '
c L r ο
b i π • 7. *· · .*
I- 64
S W e e Ρ s
h 0
0 50 .00
° m o n o u r o l • b I n o u r o 1
FIG. 6. The distribution of binaural (closed circles) and monaural (open circles) neurons in the pontine grey shows a slight tendency for binaural neurons to be medial and monaural neurons lateral. Recording sites are collapsed onto parasagittal (left) or frontal (right) views as in Figure 1.
FIG. 7. Responses of a binaural neuron to different stimulus conditions. In the upper third of the raster diagram the stimulus is presented to the ipsilateral ear only, in the middle third to the contralateral ear only, and in the bottom third to both ears simultaneously. The latency for the contralateral ear is longer than that for the ipsilateral ear or for both together. The first spike is most tightly locked to stimulus onset when both ears are stimulated simultaneously.
10 20 30 40 50 60 70 80 90 100 Frequency(kHz)
membrane. The wide range of latencies is of potential significance in encoding pulse-echo relationships.
There appears to be no systematic topographical distribution of latency in either individual or pooled data, although a slight trend is seen when just the minimum latencies are examined. The shortest minimum latencies are caudal, and the longest minimum latencies rostral (Fig. 8B). In addition, the range of latencies decreases from caudal to rostral.
Response to frequency modulations About 16% of pontine auditory neurons failed to respond at all to pure tones. The best stimulus for 66% of all pontine auditory neurons was some type of frequency modulated sound, either a linear FM or an SFM.
FM selective neurons
Thirty-five per cent of all pontine auditory neurons responded with a lower threshold to FM stimuli than to SFM or pure tones. Nearly 90% of these FM neurons had a best sweep direction. About 66% of FM neurons responded best to a downward FM sweep, 22% responded best to an upward sweep, and the remainder were not selective in that they responded equally well to a sweep in either direction. Most FM
50
40
υ w 30
c <D
1 0 -
Β
° oo eP
•
Rostral Caudal 0 6000 6500 7000 7500 8000
Location (um) 8500
FIG. 8. Latency distribution within the auditory pontine area. ( A ) Latencies plotted against B F show that there is a wide range of latencies for all neurons independent of B F . The minimum latencies for the high frequency group were 4 - 5 ms, whereas the minimum latencies for the low frequency group were - 8 ms. (B) Rostrocaudal distribution of latencies shows that the minimum latencies are slightly shorter caudally than rostrally. With a few exceptions the widest range of latencies is in the caudal part of the pons.
Auditory pontine grey in an echolocating bat 655
t o n e : 7 6 . 4 k H z / 7 5
I I I I I ι I 0 T i m e [ ms
- run
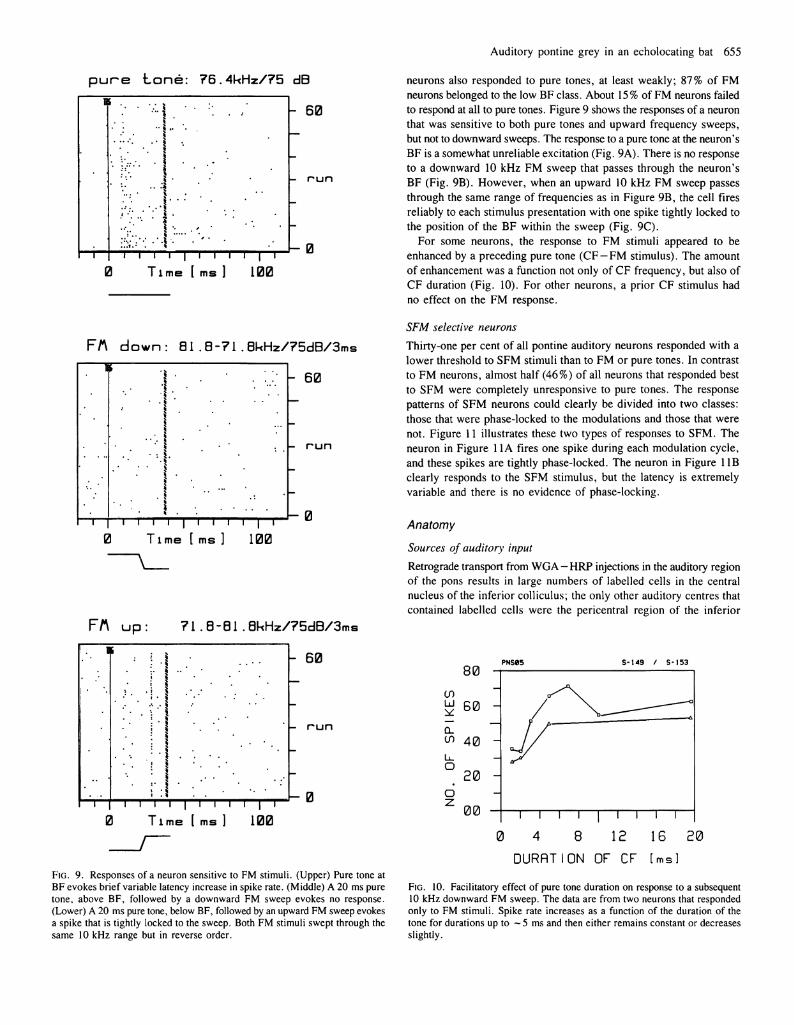
neurons also responded to pure tones, at least weakly; 87% of FM neurons belonged to the low BF class. About 15% of FM neurons failed to respond at all to pure tones. Figure 9 shows the responses of a neuron that was sensitive to both pure tones and upward frequency sweeps, but not to downward sweeps. The response to a pure tone at the neuron's BF is a somewhat unreliable excitation (Fig. 9A). There is no response to a downward 10 kHz FM sweep that passes through the neuron's BF (Fig. 9B). However, when an upward 10 kHz FM sweep passes through the same range of frequencies as in Figure 9B, the cell fires reliably to each stimulus presentation with one spike tightly locked to the position of the BF within the sweep (Fig. 9C).
For some neurons, the response to FM stimuli appeared to be enhanced by a preceding pure tone (CF —FM stimulus). The amount of enhancement was a function not only of CF frequency, but also of CF duration (Fig. 10). For other neurons, a prior CF stimulus had no effect on the FM response.
FA d o w n : 6 1 . 8 - 7 1 . 8 k H z / 7 5 d B / 3 m s
- 6 0
I I 1 I I I ] 100
\ - 0
FA up: 7 1 . B - B l . 8 k H z / 7 5 d B / 3 m s
- 6 0
- run
\ - 0
FIG. 9. Responses of a neuron sensitive to FM stimuli. (Upper) Pure tone at BF evokes brief variable latency increase in spike rate. (Middle) A 20 ms pure tone, above BF, followed by a downward FM sweep evokes no response. (Lower) A 20 ms pure tone, below BF, followed by an upward FM sweep evokes a spike that is tightly locked to the sweep. Both FM stimuli swept through the same 10 kHz range but in reverse order.
SFM selective neurons
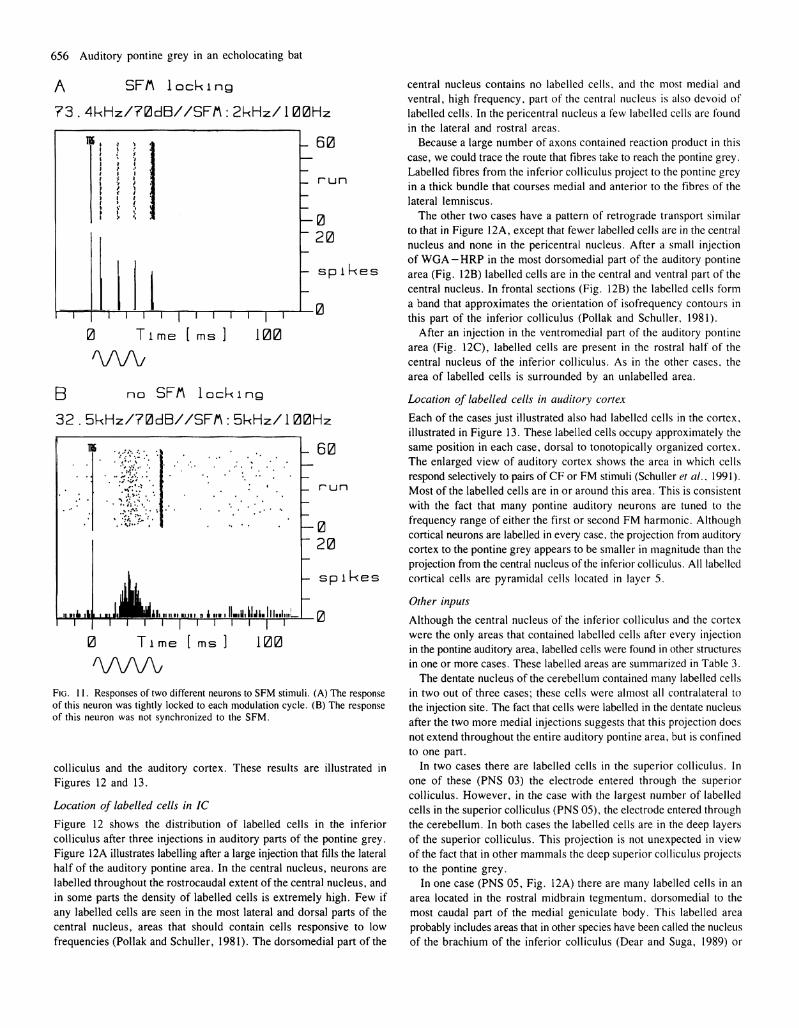
Thirty-one per cent of all pontine auditory neurons responded with a lower threshold to SFM stimuli than to FM or pure tones. In contrast to FM neurons, almost half (46%) of all neurons that responded best to SFM were completely unresponsive to pure tones. The response patterns of SFM neurons could clearly be divided into two classes: those that were phase-locked to the modulations and those that were not. Figure 11 illustrates these two types of responses to SFM. The neuron in Figure 11A fires one spike during each modulation cycle, and these spikes are tightly phase-locked. The neuron in Figure 1 IB clearly responds to the SFM stimulus, but the latency is extremely variable and there is no evidence of phase-locking.
Anatomy
Sources of auditory input
Retrograde transport from W G A - H R P injections in the auditory region of the pons results in large numbers of labelled cells in the central nucleus of the inferior colliculus; the only other auditory centres that contained labelled cells were the pericentral region of the inferior
S - M 9 / S - I53
Ί 1 1 1 1 1 1 1 Γ
0 4 8 12 IG 20 DURRTI ON DF CF [ms]
FIG. 10. Facilitatory effect of pure tone duration on response to a subsequent 10 kHz downward FM sweep. The data are from two neurons that responded only to FM stimuli. Spike rate increases as a function of the duration of the tone for durations up to ~5 ms and then either remains constant or decreases slightly.
656 Auditory pontine grey in an echolocating bat
Λ SFA l o c k i n g
7 3 . 4 k H z / 7 0 d B / / S F A : 2 k H z / 1 0 0 H Z
- 60
_ r u n
- sp i k e s
Ί — I — I — I — ι — I — I — I — I — ι — Γ
0 T ime [ ms ] 100
m
Β πα SFA l a c k i n g
3 2 . 5 k H z / 7 0 d B / / S F A : 5 k H z / 1 0 0 H z
Ί 1 1—I I I 1 1—Γ 0 T i m e [ m s ] 100
W W
FIG. 11. Responses of two different neurons to S F M stimuli. ( A ) The response of this neuron was tightly locked to each modulation cycle. ( B ) The response of this neuron was not synchronized to the S F M .
colliculus and the auditory cortex. These results are illustrated in Figures 12 and 13.
Location of labelled cells in IC
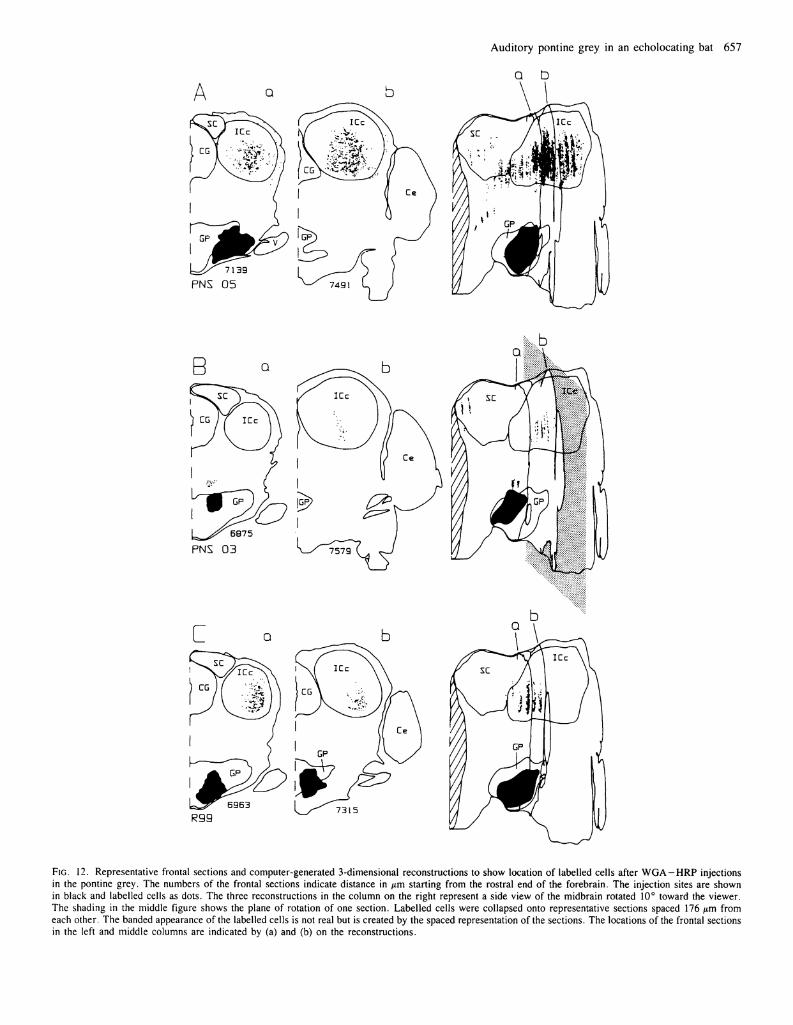
Figure 12 shows the distribution of labelled cells in the inferior colliculus after three injections in auditory parts of the pontine grey. Figure 12A illustrates labelling after a large injection that fills the lateral half of the auditory pontine area. In the central nucleus, neurons are labelled throughout the rostrocaudal extent of the central nucleus, and in some parts the density of labelled cells is extremely high. Few if any labelled cells are seen in the most lateral and dorsal parts of the central nucleus, areas that should contain cells responsive to low frequencies (Pollak and Schuller, 1981). The dorsomedial part of the
central nucleus contains no labelled cells, and the most medial and ventral, high frequency, part of the central nucleus is also devoid of labelled cells. In the pericentral nucleus a few labelled cells are found in the lateral and rostral areas.
Because a large number of axons contained reaction product in this case, we could trace the route that fibres take to reach the pontine grey. Labelled fibres from the inferior colliculus project to the pontine grey in a thick bundle that courses medial and anterior to the fibres of the lateral lemniscus.
The other two cases have a pattern of retrograde transport similar to that in Figure 12A, except that fewer labelled cells are in the central nucleus and none in the pericentral nucleus. After a small injection of W G A - H R P in the most dorsomedial part of the auditory pontine area (Fig. 12B) labelled cells are in the central and ventral part of the central nucleus. In frontal sections (Fig. 12B) the labelled cells form a band that approximates the orientation of isofrequency contours in this part of the inferior colliculus (Pollak and Schuller, 1981).
After an injection in the ventromedial part of the auditory pontine area (Fig. 12C), labelled cells are present in the rostral half of the central nucleus of the inferior colliculus. As in the other cases, the area of labelled cells is surrounded by an unlabelled area.
Location of labelled cells in auditory cortex
Each of the cases just illustrated also had labelled cells in the cortex, illustrated in Figure 13. These labelled cells occupy approximately the same position in each case, dorsal to tonotopically organized cortex. The enlarged view of auditory cortex shows the area in which cells respond selectively to pairs of CF or FM stimuli (Schuller et α/., 1991). Most of the labelled cells are in or around this area. This is consistent with the fact that many pontine auditory neurons are tuned to the frequency range of either the first or second FM harmonic. Although cortical neurons are labelled in every case, the projection from auditory cortex to the pontine grey appears to be smaller in magnitude than the projection from the central nucleus of the inferior colliculus. All labelled cortical cells are pyramidal cells located in layer 5.
Other inputs
Although the central nucleus of the inferior colliculus and the cortex were the only areas that contained labelled cells after every injection in the pontine auditory area, labelled cells were found in other structures in one or more cases. These labelled areas are summarized in Table 3.
The dentate nucleus of the cerebellum contained many labelled cells in two out of three cases; these cells were almost all contralateral to the injection site. The fact that cells were labelled in the dentate nucleus after the two more medial injections suggests that this projection does not extend throughout the entire auditory pontine area, but is confined to one part.
In two cases there are labelled cells in the superior colliculus. In one of these (PNS 03) the electrode entered through the superior colliculus. However, in the case with the largest number of labelled cells in the superior colliculus (PNS 05), the electrode entered through the cerebellum. In both cases the labelled cells are in the deep layers of the superior colliculus. This projection is not unexpected in view of the fact that in other mammals the deep superior colliculus projects to the pontine grey.
In one case (PNS 05, Fig. 12A) there are many labelled cells in an area located in the rostral midbrain tegmentum, dorsomedial to the most caudal part of the medial geniculate body. This labelled area probably includes areas that in other species have been called the nucleus of the brachium of the inferior colliculus (Dear and Suga, 1989) or
Auditory pontine grey in an echolocating bat 657
Q b
FIG. 12. Representative frontal sections and computer-generated 3-dimensional reconstructions to show location of labelled cells after W G A - H R P injections in the pontine grey. The numbers of the frontal sections indicate distance in μτη starting from the rostral end of the forebrain. The injection sites are shown in black and labelled cells as dots. The three reconstructions in the column on the right represent a side view of the midbrain rotated 10° toward the viewer. The shading in the middle figure shows the plane of rotation of one section. Labelled cells were collapsed onto representative sections spaced 176 μτη from each other. The banded appearance of the labelled cells is not real but is created by the spaced representation of the sections. The locations of the frontal sections in the left and middle columns are indicated by (a) and (b) on the reconstructions.

658 Auditory pontine grey in an echolocating bat
TABLE 3. Retrograde label
10 [mml c o u d o 1
4:6
• α
FIG. 13. Location of labelled cortical cells in the same cases illustrated in Figure 12. The locations of the labelled neurons have been projected onto the flattened cortical surface using a standard procedure in order to compare it with response properties in the auditory cortex of Rhinolophus rouxi (Schuller et al., 1991). The columnar appearance of the labelled cells is an artefact due to the fact that not all sections were used in the reconstruction. The upper drawing indicates, on a side view of the brain, the position of the flattened cortical area illustrated in the lower panel. In the lower panel, the dotted horizontal lines correspond to the oblique dotted lines on the view above; the dashed line corresponds to the ventral cytoarchitectonic border of the dorsal auditory field. Labelled cells from pontine injections are restricted to the dorsal auditory field. The figure is a composite of labelled cells from all three cases. The hatched area demarcates the dorsal field containing neurons that respond predominantly or exclusively to paired CF/CF or FM/FM stimuli (Schuller etal., 1991). Based on both physiological and cytoarchitectural criteria, the region containing labelled cells is definitely not part of the primary auditory cortex.
intercollicular area (Feng et al., 1978). This is a potentially important result because at least part of this area may correspond to a region that contains neurons sensitive to paired FM stimuli in other echolocating bat species (Feng et al., 1978; Dear and Suga, 1989). However, because the injection was large and because we only saw labelled cells in the above locations in one case, the finding needs to be substantiated.
Other areas that contained a few labelled cells after the largest injection (PNS 05) were the substantia nigra and the pontine grey contralateral to the injection.
Targets of the auditory pontine grey: location and bilaterality
Table 4 summarizes the distribution of anterograde label following injections of WGA—HRP in the pontine auditory area. In all cases
PNS 03 PNS 05 R 99
Inferior colliculus central nucleus + pericentral nucleus
Auditory cortex + Substantia nigra Superior colliculus + Intercollicular area Pontine grey (contralateral) Dentate nucleus of cerebellum +
+ + + + + +
+
+
+
+
TABLE 4. Anterograde label
PNS 03 PNS 05 R 99
Cerebellum Paraflocculus (ipsilateral) Paraflocculus (contralateral) Lateral lobe (ipsilateral) Lateral lobe (contralateral) Vermis
Medial geniculate body
+ + + + + +
+ +
virtually all of the anterograde label was in the cerebellum. However, after the largest injection (PNS 05) there was a small amount of anterograde label in the medial geniculate body. Because we know of no evidence to show that the pontine grey projects directly to the medial geniculate body, we raise the possibility that the label was the result of transport along axon collaterals of backfilled cells in the inferior colliculus. I f this is the case it would mean that individual cells in the inferior colliculus project to both the pontine nuclei and to the medial geniculate body.
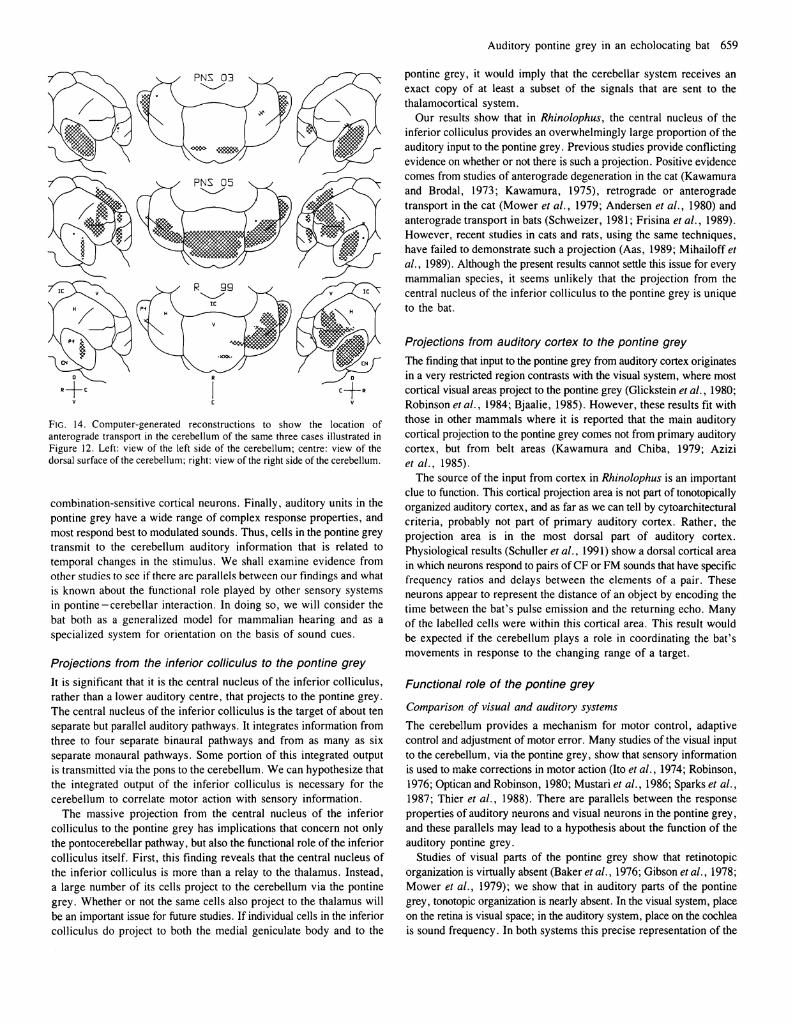
In every case, anterograde transport to the cerebellum was bilateral but the distribution differed from one case to another. These results are illustrated in Figure 14. In PNS 03 where the injection is small and dorsal, there is moderately dense label in the paraflocculus bilaterally; label in the lateral lobe and vermis is very sparse. After the largest injection (PNS 05) there is transport throughout large areas of the cerebellum bilaterally. In the most medial case (R 99) there is dense label contralateral^ in the paraflocculus and part of the lateral lobe; there is light label in the vermis. Ipsilateral to the injection site there is sparse label in the paraflocculus.
These results suggest that the most dense and widespread projection of the auditory pontine area is to the paraflocculus bilaterally and that medial regions project contralateral^ and lateral regions ipsilaterally.
Discussion Several findings in this study raise issues of particular importance for discussion. First, there is massive auditory input to the pontine grey from the inferior colliculus, mainly from the central nucleus. This finding not only helps define the origin and nature of auditory input to the cerebellum via the pontine grey, but also calls into question the traditional view of the central nucleus of the inferior colliculus as strictly a relay to the thalamus. Second, labelled cells were all in dorsal auditory belt cortex rather than tonotopically organized auditory cortex; this shows that auditory input to the pons comes partly from
Auditory pontine grey in an echolocating bat 659
FIG. 14. Computer-generated reconstructions to show the location of anterograde transport in the cerebellum of the same three cases illustrated in Figure 12. Left: view of the left side of the cerebellum; centre: view of the dorsal surface of the cerebellum; right: view of the right side of the cerebellum.
combination-sensitive cortical neurons. Finally, auditory units in the pontine grey have a wide range of complex response properties, and most respond best to modulated sounds. Thus, cells in the pontine grey transmit to the cerebellum auditory information that is related to temporal changes in the stimulus. We shall examine evidence from other studies to see if there are parallels between our findings and what is known about the functional role played by other sensory systems in pontine-cerebellar interaction. In doing so, we wil l consider the bat both as a generalized model for mammalian hearing and as a specialized system for orientation on the basis of sound cues.
Projections from the inferior colliculus to the pontine grey It is significant that it is the central nucleus of the inferior colliculus, rather than a lower auditory centre, that projects to the pontine grey. The central nucleus of the inferior colliculus is the target of about ten separate but parallel auditory pathways. It integrates information from three to four separate binaural pathways and from as many as six separate monaural pathways. Some portion of this integrated output is transmitted via the pons to the cerebellum. We can hypothesize that the integrated output of the inferior colliculus is necessary for the cerebellum to correlate motor action with sensory information.
The massive projection from the central nucleus of the inferior colliculus to the pontine grey has implications that concern not only the pontocerebellar pathway, but also the functional role of the inferior colliculus itself. First, this finding reveals that the central nucleus of the inferior colliculus is more than a relay to the thalamus. Instead, a large number of its cells project to the cerebellum via the pontine grey. Whether or not the same cells also project to the thalamus will be an important issue for future studies. I f individual cells in the inferior colliculus do project to both the medial geniculate body and to the
pontine grey, it would imply that the cerebellar system receives an exact copy of at least a subset of the signals that are sent to the thalamocortical system.
Our results show that in Rhinolophus, the central nucleus of the inferior colliculus provides an overwhelmingly large proportion of the auditory input to the pontine grey. Previous studies provide conflicting evidence on whether or not there is such a projection. Positive evidence comes from studies of anterograde degeneration in the cat (Kawamura and Brodal, 1973; Kawamura, 1975), retrograde or anterograde transport in the cat (Mower et al., 1979; Andersen et al., 1980) and anterograde transport in bats (Schweizer, 1981; Frisina et al., 1989). However, recent studies in cats and rats, using the same techniques, have failed to demonstrate such a projection (Aas, 1989; Mihailoff et al., 1989). Although the present results cannot settle this issue for every mammalian species, it seems unlikely that the projection from the central nucleus of the inferior colliculus to the pontine grey is unique to the bat.
Projections from auditory cortex to the pontine grey The finding that input to the pontine grey from auditory cortex originates in a very restricted region contrasts with the visual system, where most cortical visual areas project to the pontine grey (Glickstein et αϊ., 1980; Robinson et al., 1984; Bjaalie, 1985). However, these results fit with those in other mammals where it is reported that the main auditory cortical projection to the pontine grey comes not from primary auditory cortex, but from belt areas (Kawamura and Chiba, 1979; Azizi et al, 1985).
The source of the input from cortex in Rhinolophus is an important clue to function. This cortical projection area is not part of tonotopically organized auditory cortex, and as far as we can tell by cytoarchitectural criteria, probably not part of primary auditory cortex. Rather, the projection area is in the most dorsal part of auditory cortex. Physiological results (Schuller et al., 1991) show a dorsal cortical area in which neurons respond to pairs of CF or FM sounds that have specific frequency ratios and delays between the elements of a pair. These neurons appear to represent the distance of an object by encoding the time between the bat's pulse emission and the returning echo. Many of the labelled cells were within this cortical area. This result would be expected if the cerebellum plays a role in coordinating the bat's movements in response to the changing range of a target.
Functional role of the pontine grey
Comparison of visual and auditory systems
The cerebellum provides a mechanism for motor control, adaptive control and adjustment of motor error. Many studies of the visual input to the cerebellum, via the pontine grey, show that sensory information is used to make corrections in motor action (Ito et al., 1974; Robinson, 1976; Optican and Robinson, 1980; Mustari et al., 1986; Sparks et al., 1987; Thier et al., 1988). There are parallels between the response properties of auditory neurons and visual neurons in the pontine grey, and these parallels may lead to a hypothesis about the function of the auditory pontine grey.
Studies of visual parts of the pontine grey show that retinotopic organization is virtually absent (Baker et al., 1976; Gibson etal, 1978; Mower et al., 1979); we show that in auditory parts of the pontine grey, tonotopic organization is nearly absent. In the visual system, place on the retina is visual space; in the auditory system, place on the cochlea is sound frequency. In both systems this precise representation of the
660 Auditory pontine grey in an echolocating bat
receptor surface is faithfully preserved throughout the thalamocortical pathway. However, in both systems the pontocerebellar pathway apparently sacrifices this acuity in order to encode information about changes across the topographically mapped stimulus dimension-movement across the retina in the visual system, frequency modulation in the auditory system.
Visually responsive neurons in the pontine grey of cats and primates are selective for moving stimuli (Baker et al., 1976; Gibson et al., 1978; Mower et al., 1979; Keller and Crandall, 1983; Suzuki and Keller, 1984; Suzuki etal., 1990). In our results, the majority of pontine auditory neurons responded best to FM stimuli. Because the bat uses information from the FM part of its call to derive information about the range of a target, it may well be that the auditory pontocerebellar pathway of the bat is involved in regulating the motor behaviour for pursuit of a moving target.
Role of the auditory pontocerebellar pathway in echolocation
The echolocation call of R. rouxi is of variable duration (10—60 ms). It always consists of long CF components (CFj and CF 2) followed by short FM components (FMj and FM 2 ) that sweep downward — 13 — 16 kHz from the CF frequencies (Schuller, 1980). Auditory neurons in the pons were tuned within either a low frequency band from ~ 20 to 40 kHz, or a high frequency band from ~ 60 to 80 kHz; these frequency ranges correspond to CF 2 , FMj and F M 2 portions of the echolocation call.
In other parts of the central auditory system of horseshoe bats, only the resting frequency, i.e. CF 2 in a non-moving bat, and a few kHz above it are οverrepresented; the remaining frequency distribution is similar to that in other mammals. There is no overrepresentation of CFj or FMj . For example, in the inferior colliculus of R. ferrumequinum —50% of all neurons are tuned to a 10 kHz band around the CF 2 frequency; the remaining neurons are evenly distributed across all other frequencies (Schuller and Pollak, 1979). In the pontine grey, however, the only frequencies represented, other than the CF 2 , are those of FMj and F M 2 . There is virtually no representation of frequencies outside these ranges. Even though F M | is greatly overrepresented in spatial terms, there is no increase in sharpness of tuning for neurons tuned to these frequencies.
These results suggest that the pontine nuclei are specialized to process information contained in both FM] and F M 2 of echolocation sounds and in the frequency band at and just above the CF 2 resting frequency. In terms of the sensory-motor response of the bat, this specialization could either be related to Doppler shift compensation behaviour or to target ranging and regulation of pursuit movements.
During flight, the horseshoe bat lowers the frequency of its vocalizations to compensate for Doppler shifts in the echoes and keep them within the range of those auditory neurons tuned to a range a few hundred Hz above the resting frequency. Low frequency pontine neurons are tuned within a range with an upper limit just below the resting frequency of the first CF harmonic. Thus, when the bat Doppler shift compensates, these neurons wil l respond to the CF portion of the pulse; they will not respond to the Doppler-shifted first harmonic CF echo which, in any case, is faint ( < 5 0 d B SPL). High frequency pontine neurons are tuned to a range that extends up to a few kHz above the resting frequency of the second CF harmonic. These neurons will respond to the CF harmonic in the Doppler-shifted echo. One would predict that during Doppler shift compensation low frequency neurons will respond maximally to the CF component of the pulse and high frequency neurons will respond maximally to the CF component of the Doppler-shifted echo. This conclusion could be taken as additional
support for the suggestion of Horikawa and Suga (1986) that the pontocerebellar pathway in CF-FM bats is involved in Doppler shift compensation or its fine control.
However, the fact that the BF distribution of pontine neurons falls within the ranges of the two harmonics during Doppler shift compensation does not imply that the main function of the pontocerebellar pathway is Doppler shift compensation. It is more likely that the pontine nuclei play an important role in auditory—motor coordination of the bat's pursuit of a moving target and that the BF distribution of pontine neurons simply optimizes the processing of the FM portion of the vocalized echolocation pulse and Doppler-shifted FM portion of the echo.
The bimodal frequency distribution, taken together with the wide range of latencies of both low and high frequency neurons and the finding that many pontine neurons responded best to FM stimuli, suggests that the pontine grey might transmit information about pulse-echo delays which could additionally be used to derive target range. One could further speculate that the cerebellum receives both a copy of the 'raw data' on pulse-echo delay transmitted from the inferior colliculus and a copy of the computational output of the combination-sensitive cortical areas. The convergence of midbrain and cortical inputs could permit comparison of the last computed range measurement from the cortex with new range information from the inferior colliculus. This analysis suggests that delay tuned neurons might be found in the pontine grey. Additional experiments are needed to explore this possibility.
In summary, the above data suggest that pontine neurons are specialized to process the CF and FM components of the echolocation call. Both the CF and the FM component will activate low frequency neurons mainly during pulse vocalization. High frequency neurons will respond during both the pulse and the Doppler-shifted echo. Although this response pattern may be important for audiovocal coordination in Doppler shift compensation, an equally important function may be to transmit information related to target ranging. Thus, the present data suggest that the pontocerebellar auditory pathway plays a significant role in general auditory-motor coordination, and that in the bat the system is specialized for vocal control, prey tracking and pursuit.
Acknowledgements We thank Drs G. Neuweiler and S. Schmidt for their critical reading of the manuscript and for their helpful suggestions. We thank John Whitehead for his help in preparing illustrations. We particularly thank Dr M . Vater for the fortunate accident by which we first recorded auditory responses in the pontine grey and for permission to illustrate that case (R99). This research was supported by Deutsche Forschungsgemeinschaft SFB Gehör TP10 and NIH Grant DC287.
Abbreviations BIC brachium of inferior colliculus BP brachium pontis Ce cerebellum CF constant frequency CG central grey CN cochlear nucleus CP cerebral peduncle FM linear frequency modulation GP griseum pontis Η cerebellar hemisphere IC inferior colliculus ICc inferior colliculus, central nucleus IP interpeduncular nucleus Pf paraflocculus RF reticular formation
Auditory pontine grey in an echolocating bat 661
SC superior colliculus SFM sinusoidal frequency modulation V cerebellar vermis V trigeminal nerve
References Aas, J.-Ε. (1989) Subcortical projections to the pontine nuclei in the cat. J.
Comp. Neuroi, 282, 331-354. Adams, J. C. (1977) Technical considerations on the use of horseradish perox
idase as a neuronal marker. Neuroscience, 2, 142-145. Aitkin, L. M . and Boyd, J. (1978) Acoustic input to the lateral pontine nuclei.
Hearing Res., 1, 67-77 . Andersen, R. Α., Roth, G. C , Aitkin, L . M . and Merzenich, Μ. Μ. (1980)
The efferent projections of the central nucleus of the inferior colliculus in the cat. J. Comp. Neurol., 194 , 649 - 662.
Azizi , S. Α., Burne, R. A. and Woodward, D. J. (1985) The auditory corticopontocerebellar projection in the rat: inputs to the paraflocculus and midvermis, an anatomical and physiological study. Exp. Brain Res., 59, 36-49 .
Baker, J., Gibson, Α., Glickstein, M . and Stein, J. (1976) Visual cells in the pontine nuclei of the cat. J. Physiol., 255, 415—433.
Bjaalie, J. G. (1985) Distribution in areas 18 and 19 of neurons projecting to the pontine nuclei: a quantitative study in the cat with retrograde transport of H R P - W G A . Exp. Brain Res., 57, 585-597.
Casseday, J. H . , Covey, E. and Vater, Μ. (1988) Connections of the superior olivary complex in the rufous horseshoe bat, Rhinolophus rouxi. J. Comp. Neurol., 278, 313-329.
Covey, E., Casseday, J. H . and Schuller, G. (1990) Auditory pontine grey: connections and response properties in the horseshoe bat. Soc. Neurosci. Abst., 16, 723.
Dear, S. and Suga, N . (1989) Representation of target range in the dorsolateral midbrain tegmentum of the big brown bat. Neurosci. Abst., 15, 1293.
Feng, A. S., Simmons, J. A. and Kick, S. A. (1978) Echo detection and target-ranging neurons in the auditory system of the bat Eptesicus fuscus. Science, 202, 645-648.
Frisina, R. D. , O'Neill, W. E. and Zettel, Μ. L. (1989) Functional organization of mustached bat inferior colliculus. I I . Connections of the F M 2 region. J. Comp. Neurol., 284, 85-107.
Gibson, Α., Baker. J., Mower, G. and Glickstein, M . (1978) Corticopontine cells in area 18 of the cat. J. Neurophysiol, 41, 484-495.
Glickstein, M . , Cohen, J. L . , Dixon, B., Gibson, Α., Hol lins, Μ., Labossiere, Ε. and Robinson, F. (1980) Corticopontine visual projections in macaque monkeys. J. Comp. Neurol., 190, 209-229.
Hashikawa, T. and Kawamura, K. (1977) Identification of cells of origin of tectopontine fibers in the cat superior colliculus: an experimental study with the horseradish peroxidase method. Brain Res., 130, 65 -79 .
Horikawa, J. and Suga, N . (1986) Biosonar signals and cerebellar auditory neurons of the mustached bat. J. Neurophysiol., 55, 1247-1267.
Ito, M . , Shiida, T., Yagi, N . and Yamamoto, M . (1974) The cerebellar modification of rabbit's horizontal vestibulo-ocular reflex by sustained head rotation combined with visual stimulation. Proc. Jap. Acad., 50, 85 -89 .
Jen, P. H . S., Vater, Μ., Harnischfeger, G. and Rubsamen, R. (1981) Mapping of the auditory area in the cerebellar vermis and hemispheres of the little brown bat, Myotis lucifigus. Brain Res., 219, 156-161.
Kawamura, K. (1975) The pontine projection from the inferior colliculus in the cat. An experimental anatomical study. Brain Res., 95, 309-322.
Kawamura, K. and Brodal, A. (1973) The tectopontine projection in the cat: an experimental anatomical study with comments on pathways for teleceptive impulses to the cerebellum. J. Comp. Neurol., 149, 371—390.
Kawamura, K. and Chiba v M. (1979) Cortical neurons projecting to the pontine nuclei in the cat. An experimental study with the horseradish peroxidase technique. Exp. Brain Res., 35, 268-285.
Kawamura, K. and Hashikawa, T. (1981) Projections from the pontine nuclei proper and reticular tegmental nucleus onto the cerebellar cortex in the cat. An autoradiographic study. J. Comp. Neurol., 201, 395-413.
Keller, E. L . and Crandall, W. F. (1983) Neuronal responses to optokinetic stimuli in pontine nuclei of behaving monkey. J. Neurophysiol., 49, 169-187.
Mesulam, M . (1978) Tetramethyl benzidine for horseradish peroxidase neurohistochemistry: a non-carcinogenic blue reaction product with superior sensitivity for visualizing neural afferents and efferents. J. Histochem. Cytochem., 26, 106-117.
Mihailoff, G. Α., McArdle, C. B. and Adams, C. E. (1981) The cytoarchitecture, cytology, and synaptic organization of the basilar pontine nuclei in the rat. I . Nissl and Golgi studies. J. Comp. Neurol., 195, 181 - 2 0 1 .
Mihailoff, G. Α., Kosinski, R. J., Azizi, S. A. and Border, B. G. (1989) Survey of noncortical afferent projections to the basilar pontine nuclei: a retrograde tracing study in the rat. J. Comp. Neurol, 282, 617-643.
Möller, J., Neuweiler, G. and Zoller, Η. (1978) Response characteristics of inferior colliculus neurons of the awake CF-FM bat, Rhinolophus ferrumequinum: I . Single tone stimulation. J. Comp. Physiol, 125, 217-226.
Mower, G., Gibson, A. and Glickstein, M . (1979) Tectopontine pathway in the cat: laminar distribution of cells of origin and visual properties of target cells in dorsolateral pontine nucleus. J. Neurophysiol, 42, 1-15.
Mustari, M . J., Fuchs, A. F. and Wall man, J. (1986) The physiological response properties of single pontine units related to smooth pursuit in the trained monkey. In Keller, E. L . and Zee, D.S. (eds), Adaptive Processes in Visual and Oculomotor Systems. Pergamon, Oxford, pp. 253-260.
O'Neill, W. and Suga, N . (1979) Target range-sensitive neurons in the auditory cortex of the mustached bat. Science, 203, 69 -73 .
O'Neill, W. and Suga, N . (1982) Encoding of target range and its representation in the auditory cortex of the mustached bat. J. Neurosci., 2, 1 7 - 3 1 .
Optican, L . M . and Robinson, D. A. (1980) Cerebellar-dependent adaptive control of primate saccadic system. / . Neurophysiol, 44, 1058-1076.
Pollak, G. D. and Schuller, G. (1981) Tonotopic organization and encoding features of single units in inferior colliculus of horseshoe bats: functional implications for prey identification. J. Neurophysiol, 45, 208-226.
Robinson, D. A. (1976) Adaptive gain control of vestibuloocular reflex by the cerebellum. J. Neurophysiol. 39, 954-969.
Robinson, F. R., Cohen, J. L . , May, J., Sestokas, A. K. and Glickstein, M . (1984) Cerebellar targets of visual pontine cells in the cat. J. Comp. Neurol, 223, 471-482.
Schlegel, P. (1977) Directional coding by binaural brainstem units of the CF-FM bat, Rhinolophus ferrumequinum. J. Comp. Physiol, 118, 327-352.
Schnitzler, H. -U. (1968) Die Ultraschall-ortungslaute der Hufeisen-fledermause (Chiroptera-Rhinolophidae) in verschiedenen Orientierungssituationen. Ζ. Vergl Physiol, 57, 376-408.
Schnitzler, H . -U. (1970) Echoortung bei der Fledermaus Chilonycteris rubiginosa. Z. Vergl Physiol, 68, 25 -39 .
Schuller, G. (1979a) Coding of small sinusoidal frequency and amplitude modulations in the inferior colliculus of 'CF-FM' bat Rhinolophus ferrumequinum. Exp. Brain Res., 34, 117—132.
Schuller, G. (1979b) Vocalization influences auditory processing in collicular neurons of the CF-FM bat, Rhinolophus ferrumequinum. J. Comp. Physiol, 132, 39 -46 .
Schuller, G. (1980) Hearing characteristics and Doppler shift compensation in south Indian CF-FM bats. J. Comp. Physiol, 139, 349-356.
Schuller, G. and Pollak, G. D. (1979) Disproportionate frequency representation in the inferior colliculus of horseshoe bats: evidence for an 'acoustic fovea'. J. Comp. Physiol, 132, 47 -54 .
Schuller, G., Radtke-Schuller, S. and Betz, M . (1986) A stereotaxic method for small animals using experimentally determined reference profiles. J. Neurosci. Methods, 18, 339-350.
Schuller, G., O'Neill , W. E. and Radtke-Schuller, S. (1991) Facilitation and delay-sensitivity of neurons in the horseshoe bat auditory cortex evoked by combinations of pure tones or frequency modulations: Response properties and anatomical distribution. Eur. J. Neurosci., 3, in press.
Schweizer, Η. (1981) The connections of the inferior colliculus and the organization of the brainstem auditory system in the greater horseshoe bat (Rhinolophus ferrumequinum). J. Comp. Neurol, 201, 25-49.
Simmons, J. A. (1973) The resolution of target range by echolocating bats. J. Acoust. Soc. Am., 54, 157-173.
Sparks, D. L . , Mays, L . E. and Porter, J. D. (1987) Eye movement induced by pontine stimulation: interaction with visually triggered saccades. J. Neurophysiol., 58, 300 - 318.
Suga, N . and Horikawa, J. (1986) Multiple time axes for representation of echo delays in the auditory cortex of the mustached bat. J. Neurophysiol, 55, 776-805.
Suga, N . , O'Neil l , W. E., Kujirai, K. and Manabe, T. (1983) Specificity of combination-sensitive neurons for processing of complex biosonar signals in auditory cortex of the mustached bat. J. Neurophysiol, 49, 1573— 1626.
Sun, X . , Jen, P. H.-S. and Kamada, T. (1983) Mapping of the auditory area in the cerebellar vermis and hemispheres of the mustached bat, Pteronotus parnellii parnellii. Brain Res., 271, 162 — 165.
Suzuki, D. A. and Keller, E. L . (1984) Visual signals in the dorsolateral pontine

662 Auditory pontine grey in an echolocating bat
nucleus of the alert monkey: their relationship to smooth-pursuit eye movements. Exp. Brain Res., 53, 473—478.
Suzuki, D. Α., May, J. G., Keller, E. L . and Yee, R. D. (1990) Visual motion response properties of neurons in dorsolateral pontine nucleus of alert monkey.
J. Neurophysiol., 63, 37-59 . Thier, P., Koehler, W. and Buettner, U . W. (1988) Neuronal activity in the
dorsolateral pontine nucleus of the alert monkey modulated by visual stimuli and eye movements. Exp. Brain Res., 70, 496-512.