
Power-sharing or Ethnic Domination? Ethnic Representation ...
The Ethnic Economy: Cubans and Chinese ReconsideredAuthor(s): Suzanne ModelSource: The Sociological Quarterly, Vol. 33, No. 1 (Spring, 1992), pp. 63-82Published by: Blackwell Publishing on behalf of the Midwest Sociological SocietyStable URL: http://www.jstor.org/stable/4121488Accessed: 21/12/2009 20:48
Your use of the JSTOR archive indicates your acceptance of JSTOR's Terms and Conditions of Use, available athttp://www.jstor.org/page/info/about/policies/terms.jsp. JSTOR's Terms and Conditions of Use provides, in part, that unlessyou have obtained prior permission, you may not download an entire issue of a journal or multiple copies of articles, and youmay use content in the JSTOR archive only for your personal, non-commercial use.
Please contact the publisher regarding any further use of this work. Publisher contact information may be obtained athttp://www.jstor.org/action/showPublisher?publisherCode=black.
Each copy of any part of a JSTOR transmission must contain the same copyright notice that appears on the screen or printedpage of such transmission.
JSTOR is a not-for-profit service that helps scholars, researchers, and students discover, use, and build upon a wide range ofcontent in a trusted digital archive. We use information technology and tools to increase productivity and facilitate new formsof scholarship. For more information about JSTOR, please contact [email protected].
Blackwell Publishing and Midwest Sociological Society are collaborating with JSTOR to digitize, preserve andextend access to The Sociological Quarterly.
http://www.jstor.org

THE ETHNIC ECONOMY: Cubans and Chinese Reconsidered
Suzanne Model* University of Massachusetts
Using 1980 PUMS data for Miami Cuban and Bay Area Chinese immigrant males, this study operationalizes and tests three theories about the earnings of employees in ethnic economies. The results consistently show that the allocation of financial rewards in the ethnic economy closely resembles that found elsewhere. Although this finding merits more extensive confirmation in primary data, it implies that ethnic economy theories contribute little to the understanding of contemporary ethnic inequality within the working class.
Students of ethnic stratification increasingly research the causes and consequences of employment in ethnic economies. Although debate continues on an ethnic economy's definitive characteristics, in its least restrictive sense, the term refers to firms owned by members of an ethnic group. Until quite recently, efforts to identify the conditions that promote the formation of ethnic economies have dominated the scholarly agenda (Bonacich 1973; Wilson and Martin 1982; Waldinger 1984, 1986; Min and Jaret 1985; Aldrich, Zimmer, and McEvoy 1989). Now, however, researchers are turning to the outcomes associated with jobs in the ethnic economy, a highly controversial undertaking, especially with respect to the experiences of its working class.
At the level of theory lies sharp disagreement on whether ethnic economy employees constitute a privileged elite or a handicapped mass. Empirical attempts to settle this dispute have encountered several difficulties. Researchers disagree about how to define the ethnic economy, about how to operationalize its employees, as well as about how to select and measure the outcomes associated with such jobs. Another problem is the paucity of data developed specifically to examine this question.
Drawing on the work of Bonacich, Portes, and Jiobu, this article develops three sets of definitions and expectations for the ethnic economy. These concepts are operationalized and tested using 1980 PUMS data for two groups of male immigrant employees: Cubans in Miami and Chinese in San Francisco-Oakland. The results do not support a conclusion that ethnic economies produce either a privileged elite or a handicapped mass, at least with respect to earnings determination. Across definitions of ethnic economies and com-
*Direct all correspondence to: Suzanne Model, Social and Demographic Research Institute, Machmer Hall, University of Massachusetts, Amherst, MA 01003.
The Sociological Quarterly, Volume 33, Number 1, pages 63-82. Copyright 0 1992 by JAI Press, Inc. All rights of reproduction in any form reserved. ISSN: 0038-0253.

64 THE SOCIOLOGICAL QUARTERLY Vol. 33/No. 1/1992
parison groups, ethnic economy employees' earnings are determined in a way that differs only modestly from that in the dominant economy. At the same time, other studies show that the probability of opening a business is higher for ethnic than for dominant economy employees (Portes and Bach 1985; Waldinger 1986) and that the rewards of ethnic en-
trepreneurship are considerable (Bonacich and Modell 1980; Sanders and Nee 1987; Light and Bonacich 1988; Portes and Jensen 1989). Certainly, additional differences in out- comes remain undetected, given the shortcomings of census data.
DEFINITIONS AND EXPECTATIONS
Edna Bonacich's (1973) influential paper on middleman minorities was the first to exam- ine the definitive characteristics of the ethnic economy in advanced capitalist nations. She stresses the ways ethnic owners mobilize co-ethnic resources to enhance the profitability of small, liquidable enterprises. One of the most important of these resources is the formation of horizontal and/or vertical links with other co-ethnic firms. By limiting competition or by lowering the costs of inputs, these linkages create business advantages in a manner reminiscent of monopolies. "[T]he result is a tremendous degree of con- centration in, and domination of, certain lines of endeavor" (p. 587). A second, equally important way that ethnic owners exploit ethnic resources is by hiring co-ethnics paid very low wages in exchange for paternalistic benefits, such as on-the-job training or assistance in eventual self-employment.
Bonacich envisions a two-tier economy: dominant and ethnic. Group members em- ployed in the ethnic economy are expected to receive lower wages than in the dominant economy. Although she does not specifically so state, Bonacich implies that human capital deficits do not cause these lower wages. Rather, ethnic economy employees receive returns on at least some of their human capital that are inferior to the returns their compatriots receive in the dominant economy. This expectation is here termed the "mid- dleman minority hypothesis."
Alejandro Portes and his colleagues offer a second, influential perspective on the meaning of ethnic economy. While acknowledging the relevance of co-ethnic employees and co-ethnic linkages to a viable ethnic economy, they also stress "the spatial concentra- tion of immigrants who organize a variety of enterprises to serve their own ethnic market and the general population" (Portes and Bach 1985, p. 203). Perhaps to further emphasize the centrality of the ecological dimension of the economy, they term it the "ethnic enclave," a phrase previously used most frequently to describe ethnic residential segrega- tion (Wilson and Portes 1980; Wilson and Martin 1982; Portes and Manning 1986; Portes and Jensen 1987, 1989).
Despite this spatial emphasis, in the first systematic effort to measure enclave effects, Portes and Bach (1980, 1985) developed a definition of the enclave based on labor market segments rather than on geographic locations. According to labor market segmentation theorists, the labor market contains two distinct sectors: a primary sector of stable, well- paying jobs that offer chances for promotion and a secondary sector of unstable, poorly paying jobs with few prospects for advancement. In addition, labor market segmenta- tionists claim that immigrants, minorities, and women are disproportionately restricted to the secondary sector. Elaborating this view, Portes and Bach (1980, 1985) argue that the ethnic enclave constitutes a third sector, offering advantages equivalent to those of the primary sector.1
The Ethnic Economy 65
This sectoral interpretation of the enclave is scrutinized here both because several adequate tests of geographically based definitions of the enclave have already been under- taken (Sanders and Nee 1987; Zhou and Logan 1989; Portes and Jensen 1989) and because existing sectoral research fails to distinguish between entrepreneurs and em- ployees (Portes and Bach 1980, 1985). Even though Portes and Bach (1980, 1985) do not emphasize the distinction between enclave entrepreneurs and enclave employees, their writings certainly imply that enclave benefits hold for both classes. Thus, the enclave hypothesis is here interpreted to mean that ethnic enclave employees receive returns on their human capital that are comparable to the returns their compatriots receive in the primary sector. A corollary expects enclave employees to receive returns exceeding at least some of the returns their compatriots receive in the secondary sector.
Robert Jiobu offers yet a third perspective on the ethnic economy. Utilizing the Califor- nia Japanese as illustrative, Jiobu coined the term "ethnic hegemony" to describe "the situation in which an ethnic group achieves economic control over an important economic arena that interfaces with the majority" (1988a, p. 353). Ethnic hegemony occurs if five necessary conditions are met: an internal labor market, middleman minority activity, ethnic economic control, ethnic saturation, and an interface between minority output and majority customers. Ethnic economic control refers to the minority group's assumption of entrepreneurial and managerial roles. Ethnic saturation describes group members' tenden- cy to concentrate as labor in particular endeavors. Since hegemonized endeavors free ethnics from discrimination and dependence on the dominant group, these endeavors are especially desirable. Thus, Jiobu predicts that hegemonized employment yields "greater opportunity, income, and security" (p. 357) than ethnics would otherwise enjoy. Finally, he claims that ethnic saturation in the absence of ethnic economic control is associated with poor rewards, including "low pay, limited upward mobility, little job security, and episodic employment" (p. 356).
To translate these ideas into testable hypotheses, dominant economy workers are here defined as those lacking both ethnic economic control and ethnic saturation. And Jiobu is interpreted as claiming that employees in ethnically hegemonized endeavors receive re- turns on at least some of their human capital that are superior to the returns their compatriots receive in the dominant economy. This formulation is labeled the "ethnic hegemony hypothesis." Because Jiobu claims disadvantages for ethnic saturation (the concentration of group members only as employees), a corollary to the above hypothesis is that at least some of the returns hegemonized endeavors provide are superior to those offered in saturated endeavors.
Note that the definitions of both the ethnic and contrasting economies vary across the three perspectives, but not nearly as strongly as the proposed direction of the ethnic economy effects. Relative to the dominant economy, the middleman minority hypothesis expects a net earnings deficit for ethnic economy employees, while the ethnic hegemony hypothesis predicts a net earnings advantage. The ethnic enclave hypothesis anticipates that the ethnic economy and the primary sector reward workers equally. In the pages that follow, each of these positions is tested on its own terms.
OPERATIONALIZING THE HYPOTHESES IN SECONDARY DATA
As the above discussion reveals, most ethnic economy theory operates at the level of the firm. Knowledge about firm owners' ethnicities is necessary but not sufficient for placing a
66 THE SOCIOLOGICAL QUARTERLY Vol. 33/No. 1/1992
firm's workforce in the ethnic economy. Regrettably, this sort of information is not available in most existing data sets, and operationalizations developed for secondary data inevitably misclassify some individuals. Two sorts of information are used to distinguish the ethnic economy in secondary data analysis: geographic and industrial.
Drawing on the enclave perspective, the geographic approach relies on definitions based on work or residence in areas of heavy ethnic concentration. At times, the residual employment of the state in question defines the dominant economy. Using these geograph- ic definitions to study ethnic economy effects on Cubans in Miami and Chinese in San Francisco, researchers report that male employees in the ethnic versus the dominant economy suffer mild to extensive shortfalls in human capital translations (Sanders and Nee 1987; Portes and Jensen 1989). One problem with these studies is that the dominant economy consists of several labor markets, not necessarily homogeneous in worker char- acteristics or in job opportunities. An effort that overcomes this shortcoming is Zhou and Logan's (1989) research on Chinese immigrants in the tri-state New York City labor market. They use census data to explore effects of three different definitions of the ethnic economy: place of work, place of residence, and industrial location. This last defines the ethnic economy as those industries in which Chinese immigrants are overrepresented. The residual employment in the tri-state labor market constitutes the dominant economy. For present purposes, Zhou and Logan's most relevant finding is that the human capital returns of male employees are quite similar across definitions.
Their research is commendable, especially in its limitation to a geographically unified labor market, but the industrially based definition contains some problems. First, the basis on which Chinese industrial overrepresentation is defined is unclear. Second, failing to distinguish entrepreneurial from employee overrepresentation, Zhou and Logan's defini- tion risks classifying in the ethnic economy those industries where only overrepresentation of employees obtains. Both the ethnic enclave and the ethnic hegemony literature suggest that such industrial employees may suffer a disadvantage.
In the absence of firm-level data, this analysis seeks to circumvent these difficulties by assigning industries to different economies by whether or not an ethnic group is indus-
trially overrepresented as entrepreneurs and/or as employees. Which classes and which ethnicities define the required economies varies across the three hypotheses because each has a different view of how many economies exist and of their ethnic composition. But all the classifications share the same, statistically based definition of overrepresentation. An ethnic group is defined as overrepresented in an industry if its members appear in that industry in numbers significantly greater than predicted by a loglinear model of indepen- dence in the association between ethnicity and industry (see Wright, Costello, Hachen, and Sprague 1982).
To illustrate, consider the simplest case-operationalizing the dominant and ethnic economies in middleman minority theory. Following Bonacich's (1973) emphasis on specialization and domination, the ethnic economy is defined as those industries in which the group in question is overrepresented as entrepreneurs. The dominant economy is then the residual industries, those in which the group is not overrepresented as entrepreneurs. Assume this assignment operates in a single labor market with information on each worker's ethnicity, detailed industry, and class. The first step in determining those indus- tries in which the group holds entrepreneurial overrepresentation is to crosstabulate de- tailed industry by ethnicity (a two category variable, group member or not) in the en- trepreneurial class. Calculations based on the Chi-square distribution produce the
The Ethnic Economy 67
expected frequencies for each cell of the table under the assumption that ethnicity and industry are unrelated. The parameter ascertaining whether the number of cases in any cell exceeds that expected by chance is the standardized residual; that is, (O - E)//T-,
where O is the observed and E is the expected cell frequency. Standardized residuals are nor- mally distributed, and given that only residuals of overrepresentation are of interest, a one-directional hypothesis obtains. Hence, all cells composed of ethnic group members that contain standardized residuals larger than 1.645 (p < .05) describe ethnic economy industries. Since group members are not overrepresented as entrepreneurs in the remain- ing industries, these are relegated to the dominant economy. Once industries are assigned to their respective economies, individual employees are classified in the economy associ- ated with their industry of employment. Because the relevant crosstabulations vary across the three hypotheses, greater detail about the classification process accompanies the evaluation of each hypothesis.
DATA AND MODEL
The data come from the 1980 PUMS files (5%, A Sample) and include two sets of male immigrants: Cubans in Miami and Chinese in San Francisco-Oakland. These groups and locations are selected because they appear in previous debates about the economic effects of ethnic economy employment (Sanders and Nee 1987; Nee and Sanders 1987; Portes and Jensen 1987, 1989). Because the U.S. Census Bureau defines SMSAs as socially and economically integrated units, each hypothesis is studied at that level (U.S. Department of Commerce 1983). Note, however, that the geographic boundaries of the dominant econo- my do not necessarily delimit the ethnic economy. In the absence of survey data, the former reasonably approximates the latter.
Hypothesis testing is accomplished by estimating a model of earnings attainment for employees in each of the economies associated with a given perspective. T-tests then verify the expected differences between economies in the translation of human capital into earnings. Differences in other, less theoretically critical variables are also examined.
The dependent variable is the natural logarithm of 1979 wage and salary earnings. The independent variables, selected from equations used similarly in past research, include human capital characteristics and a set of controls. The former are years of grammar school, high school, college, work experience, and work experience squared; an index of
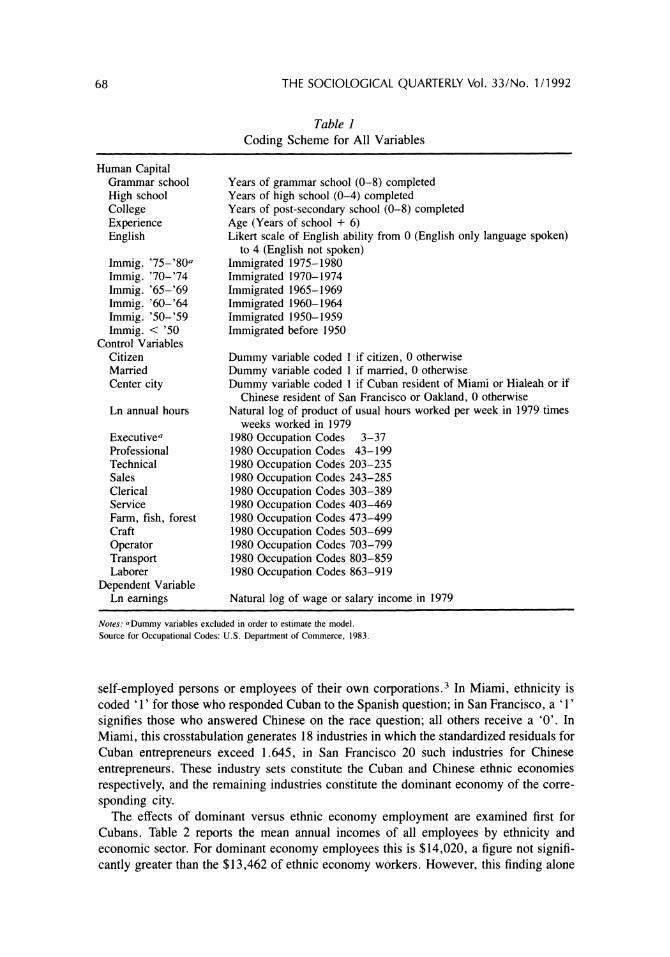
English speaking ability; and a set of dummy variables capturing years in this country. The control factors comprise citizenship, marital status, residential location, the natural log- arithm of annual hours worked, and a set of occupational dummy variables.2 Table 1 presents all variables and their coding schemes. To enhance comparability with previous efforts, only males ages 25-64, either Cuban immigrants in Miami or Chinese immigrants in San Francisco-Oakland, private sector employed in 1979 for at least 160 hours and earning at least $500, are analyzed.
THE MIDDLEMAN MINORITY HYPOTHESIS
To test the middleman minority hypothesis, first industries must be classified as either in the ethnic or dominant economy. Since the ethnic economy is defined as those industries in which the group in question is overrepresented as entrepreneurs, in each of the two SMSAs ethnicity is crosstabulated against detailed industry only for entrepreneurs; that is,
68 THE SOCIOLOGICAL QUARTERLY Vol. 33/No. 1/1992
Table 1 Coding Scheme for All Variables
Human Capital Grammar school Years of grammar school (0-8) completed High school Years of high school (0-4) completed College Years of post-secondary school (0-8) completed Experience Age (Years of school + 6) English Likert scale of English ability from 0 (English only language spoken)
to 4 (English not spoken) Immig. '75-'80a Immigrated 1975-1980 Immig. '70-'74 Immigrated 1970-1974 Immig. '65-'69 Immigrated 1965-1969 Immig. '60-'64 Immigrated 1960-1964 Immig. '50-'59 Immigrated 1950-1959 Immig. < '50 Immigrated before 1950
Control Variables Citizen Dummy variable coded 1 if citizen, 0 otherwise Married Dummy variable coded 1 if married, 0 otherwise Center city Dummy variable coded 1 if Cuban resident of Miami or Hialeah or if
Chinese resident of San Francisco or Oakland, 0 otherwise Ln annual hours Natural log of product of usual hours worked per week in 1979 times
weeks worked in 1979 Executivea 1980 Occupation Codes 3-37 Professional 1980 Occupation Codes 43-199 Technical 1980 Occupation Codes 203-235 Sales 1980 Occupation Codes 243-285 Clerical 1980 Occupation Codes 303-389 Service 1980 Occupation Codes 403-469 Farm, fish, forest 1980 Occupation Codes 473-499 Craft 1980 Occupation Codes 503-699 Operator 1980 Occupation Codes 703-799 Transport 1980 Occupation Codes 803-859 Laborer 1980 Occupation Codes 863-919
Dependent Variable Ln earnings Natural log of wage or salary income in 1979
Notes: a Dummy variables excluded in order to estimate the model. Source for Occupational Codes: U.S. Department of Commerce, 1983.
self-employed persons or employees of their own corporations.3 In Miami, ethnicity is coded '1' for those who responded Cuban to the Spanish question; in San Francisco, a '1' signifies those who answered Chinese on the race question; all others receive a '0'. In Miami, this crosstabulation generates 18 industries in which the standardized residuals for Cuban entrepreneurs exceed 1.645, in San Francisco 20 such industries for Chinese entrepreneurs. These industry sets constitute the Cuban and Chinese ethnic economies respectively, and the remaining industries constitute the dominant economy of the corre- sponding city.
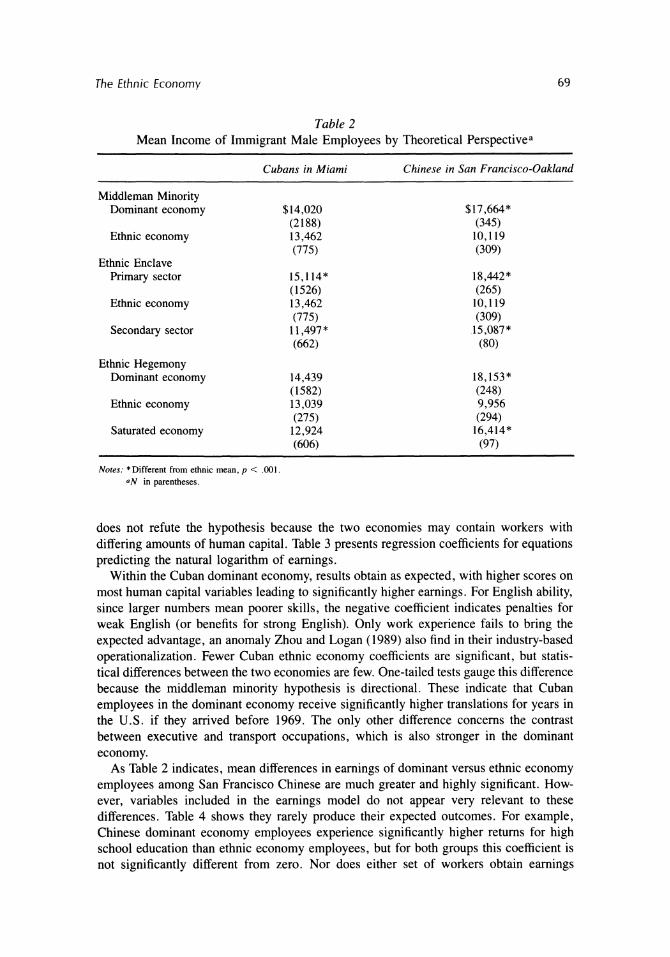
The effects of dominant versus ethnic economy employment are examined first for Cubans. Table 2 reports the mean annual incomes of all employees by ethnicity and economic sector. For dominant economy employees this is $14,020, a figure not signifi- cantly greater than the $13,462 of ethnic economy workers. However, this finding alone
The Ethnic Economy 69
Table 2 Mean Income of Immigrant Male Employees by Theoretical Perspectivea
Cubans in Miami Chinese in San Francisco-Oakland
Middleman Minority Dominant economy $14,020 $17,664*
(2188) (345) Ethnic economy 13,462 10,119
(775) (309) Ethnic Enclave
Primary sector 15,114* 18,442* (1526) (265)
Ethnic economy 13,462 10,119 (775) (309)
Secondary sector 11,497* .15,087* (662) (80)
Ethnic Hegemony Dominant economy 14,439 18,153*
(1582) (248) Ethnic economy 13,039 9,956
(275) (294) Saturated economy 12,924 16,414*
(606) (97)
Notes: * Different from ethnic mean, p < .001. aN in parentheses.
does not refute the hypothesis because the two economies may contain workers with
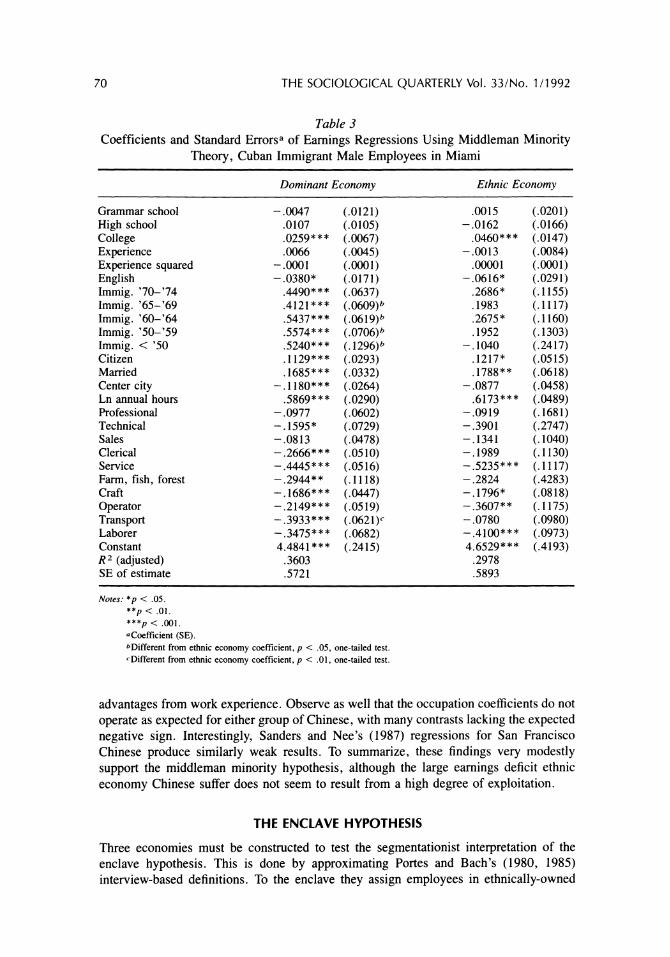
differing amounts of human capital. Table 3 presents regression coefficients for equations predicting the natural logarithm of earnings.
Within the Cuban dominant economy, results obtain as expected, with higher scores on most human capital variables leading to significantly higher earnings. For English ability, since larger numbers mean poorer skills, the negative coefficient indicates penalties for weak English (or benefits for strong English). Only work experience fails to bring the
expected advantage, an anomaly Zhou and Logan (1989) also find in their industry-based operationalization. Fewer Cuban ethnic economy coefficients are significant, but statis- tical differences between the two economies are few. One-tailed tests gauge this difference because the middleman minority hypothesis is directional. These indicate that Cuban employees in the dominant economy receive significantly higher translations for years in the U.S. if they arrived before 1969. The only other difference concerns the contrast between executive and transport occupations, which is also stronger in the dominant
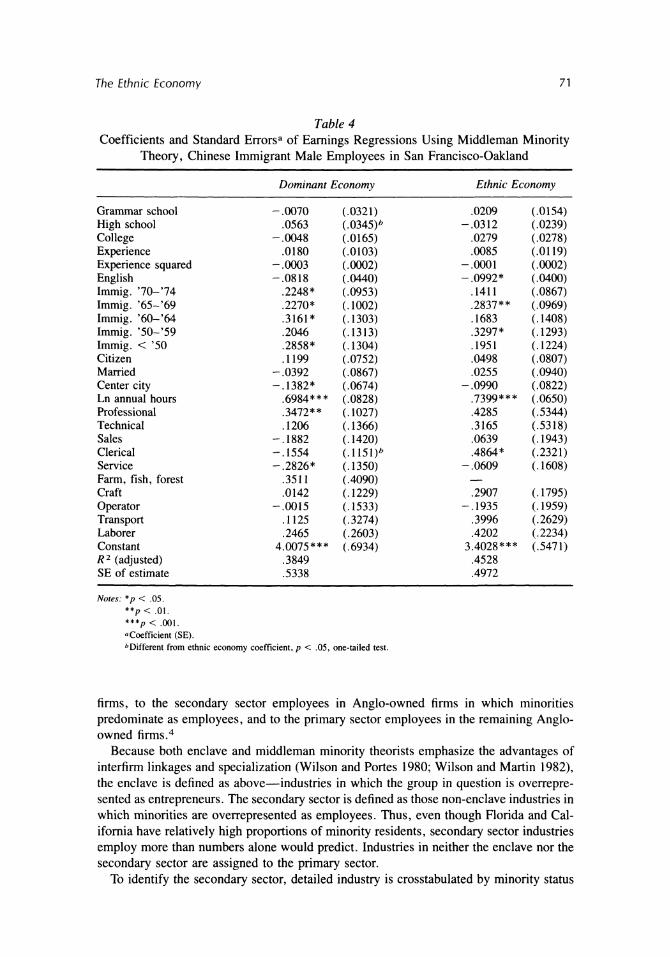
economy. As Table 2 indicates, mean differences in earnings of dominant versus ethnic economy
employees among San Francisco Chinese are much greater and highly significant. How- ever, variables included in the earnings model do not appear very relevant to these differences. Table 4 shows they rarely produce their expected outcomes. For example, Chinese dominant economy employees experience significantly higher returns for high school education than ethnic economy employees, but for both groups this coefficient is not significantly different from zero. Nor does either set of workers obtain earnings
70 THE SOCIOLOGICAL QUARTERLY Vol. 33/No. 1/1992
Table 3 Coefficients and Standard Errorsa of Earnings Regressions Using Middleman Minority
Theory, Cuban Immigrant Male Employees in Miami
Dominant Economy Ethnic Economy
Grammar school -.0047 (.0121) .0015 (.0201) High school .0107 (.0105) -.0162 (.0166) College .0259*** (.0067) .0460*** (.0147) Experience .0066 (.0045) -.0013 (.0084) Experience squared -.0001 (.0001) .00001 (.0001) English -.0380* (.0171) - .0616* (.0291) Immig. '70-'74 .4490*** (.0637) .2686* (.1155) Immig. '65-'69 .4121*** (.0609)b .1983 (.1117) Immig. '60-'64 .5437*** (.0619)b .2675* (.1160) Immig. '50-'59 .5574*** (.0706)b .1952 (.1303) Immig. < '50 .5240*** (.1296)b -.1040 (.2417) Citizen .1129*** (.0293) .1217* (.0515) Married .1685*** (.0332) .1788** (.0618) Center city -.1180*** (.0264) -.0877 (.0458) Ln annual hours .5869*** (.0290) .6173*** (.0489) Professional -.0977 (.0602) -.0919 (.1681) Technical -.1595" (.0729) -.3901 (.2747) Sales -.0813 (.0478) -.1341 (.1040) Clerical -.2666*** (.0510) -.1989 (.1130) Service -.4445*** (.0516) -.5235*** (.1117) Farm, fish, forest -.2944** (.1118) -.2824 (.4283) Craft -.1686*** (.0447) -.1796* (.0818) Operator -.2149*** (.0519) -.3607** (.1175) Transport -.3933*** (.0621)c -.0780 (.0980) Laborer -.3475*** (.0682) -.4100*** (.0973) Constant 4.4841*** (.2415) 4.6529*** (.4193) R2 (adjusted) .3603 .2978 SE of estimate .5721 .5893
Notes: *p < .05. **p < .01. ***p < .001. aCoefficient (SE). bDifferent from ethnic economy coefficient, p < .05, one-tailed test. cDifferent from ethnic economy coefficient, p < .01, one-tailed test.
advantages from work experience. Observe as well that the occupation coefficients do not
operate as expected for either group of Chinese, with many contrasts lacking the expected negative sign. Interestingly, Sanders and Nee's (1987) regressions for San Francisco Chinese produce similarly weak results. To summarize, these findings very modestly support the middleman minority hypothesis, although the large earnings deficit ethnic
economy Chinese suffer does not seem to result from a high degree of exploitation.
THE ENCLAVE HYPOTHESIS
Three economies must be constructed to test the segmentationist interpretation of the enclave hypothesis. This is done by approximating Portes and Bach's (1980, 1985) interview-based definitions. To the enclave they assign employees in ethnically-owned
The Ethnic Economy 71
Table 4 Coefficients and Standard Errorsa of Earnings Regressions Using Middleman Minority
Theory, Chinese Immigrant Male Employees in San Francisco-Oakland
Dominant Economy Ethnic Economy
Grammar school -.0070 (.0321) .0209 (.0154) High school .0563 (.0345)b -.0312 (.0239) College -.0048 (.0165) .0279 (.0278) Experience .0180 (.0103) .0085 (.0119) Experience squared -.0003 (.0002) -.0001 (.0002) English -.0818 (.0440) -.0992* (.0400) Immig. '70-'74 .2248* (.0953) .1411 (.0867) Immig. '65-'69 .2270* (.1002) .2837** (.0969) Immig. '60-'64 .3161* (.1303) .1683 (.1408) Immig. '50-'59 .2046 (.1313) .3297* (.1293) Immig. < '50 .2858* (.1304) .1951 (.1224) Citizen .1199 (.0752) .0498 (.0807) Married -.0392 (.0867) .0255 (.0940) Center city -.1382* (.0674) -.0990 (.0822) Ln annual hours .6984*** (.0828) .7399*** (.0650) Professional .3472** (.1027) .4285 (.5344) Technical .1206 (.1366) .3165 (.5318) Sales -.1882 (.1420) .0639 (.1943) Clerical -.1554 (.1151)b .4864* (.2321) Service -.2826* (.1350) -.0609 (.1608) Farm, fish, forest .3511 (.4090) Craft .0142 (.1229) .2907 (.1795) Operator -.0015 (.1533) -.1935 (.1959) Transport .1125 (.3274) .3996 (.2629) Laborer .2465 (.2603) .4202 (.2234) Constant 4.0075*** (.6934) 3.4028*** (.5471) R2 (adjusted) .3849 .4528 SE of estimate .5338 .4972
Notes: *p < .05. **p < .01. ***p < .001. aCoefficient (SE). bDifferent from ethnic economy coefficient, p < .05, one-tailed test.
firms, to the secondary sector employees in Anglo-owned firms in which minorities predominate as employees, and to the primary sector employees in the remaining Anglo- owned firms.4
Because both enclave and middleman minority theorists emphasize the advantages of interfirm linkages and specialization (Wilson and Portes 1980; Wilson and Martin 1982), the enclave is defined as above-industries in which the group in question is overrepre- sented as entrepreneurs. The secondary sector is defined as those non-enclave industries in which minorities are overrepresented as employees. Thus, even though Florida and Cal- ifornia have relatively high proportions of minority residents, secondary sector industries employ more than numbers alone would predict. Industries in neither the enclave nor the secondary sector are assigned to the primary sector.
To identify the secondary sector, detailed industry is crosstabulated by minority status

72 THE SOCIOLOGICAL QUARTERLY Vol. 33/No. 1/1992
for male employees in each SMSA. Employees are defined as persons either in the private sector or in unpaid family labor. In both SMSAs, minority status is coded '1' for males who are either non-white on race or Spanish on the Hispanic question; others are assigned a 'O'. In Miami this crosstabulation generates 34 industries in which the standardized residuals for minority employees exceed 1.645. The 6 exceptions belong to industries containing an overrepresentation of Cuban entrepreneurs, hence they are already part of the ethnic economy. Industries in which neither Cuban entrepreneurs nor minority em-
ployees are overrepresented are assigned to the primary sector. As Table 2 shows, Cuban employees in the ethnic economy earn significantly less than
in the primary sector but significantly more than in the secondary sector. As the ethnic
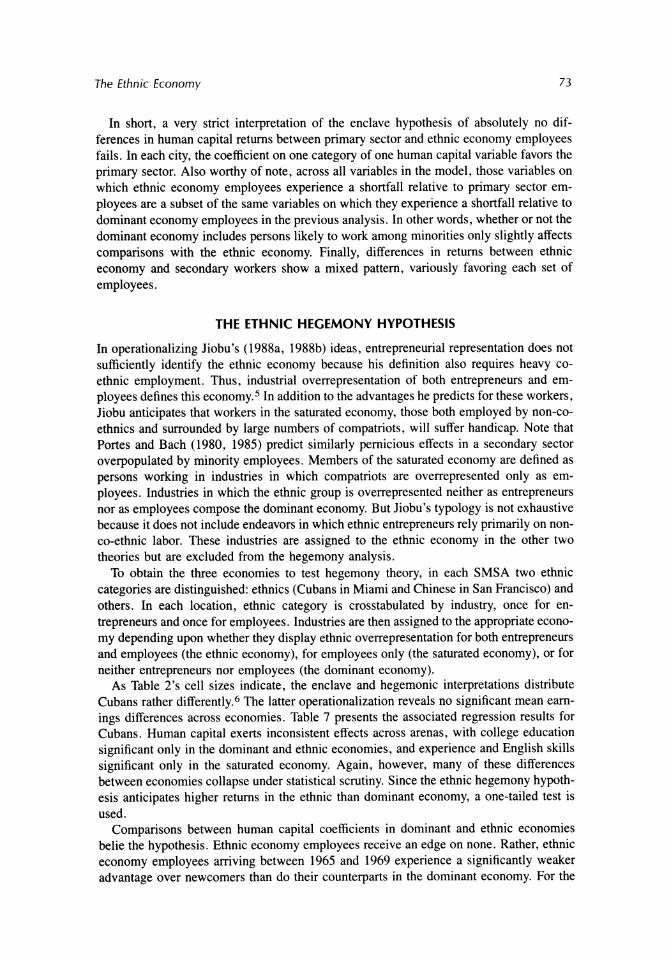
economy is operationalized in the same way in both the middleman and enclave perspec- tives, the outcomes for these two ethnic economies are identical. Table 5 depicts the results of the earnings regressions that test the enclave hypothesis in Miami.
In the ethnic economy, some variables do not behave as expected. Experience does not affect earnings and longer residence does not always reap advantages. Central city resi- dence falls just short of significantly depressing earnings, and the occupational contrasts
display the expected negative sign, but frequently do not differ from zero. The equations for both the primary and, to a lesser extent, the secondary sector are more theoretically consonant.
The comparison between the primary sector and the ethnic economy is of major in- terest. Since no differences in human capital returns are hypothesized, a two-tailed test is
appropriate. The only human capital variable with a significant difference in returns between these two settings is that pre-1950 immigrants receive stronger returns (relative to the omitted category of most recent arrivals) in the primary sector. On the controls, contrasts between the excluded executive occupations and transport workers again do not favor the former as strongly in the ethnic economy. With respect to the corollary hypoth- esis, that ethnic economy employees enjoy higher returns on some of their human capital than workers in the secondary sector, a one-tailed test uncovers little support. The latter obtain higher returns for their experience as well as for arrival prior to 1969. Although ethnic economy employees receive a significant return for college education and second-
ary sector workers do not, these two coefficients are statistically indistinguishable. Re- turns for the control, time worked, on the other hand, are significantly greater for ethnic
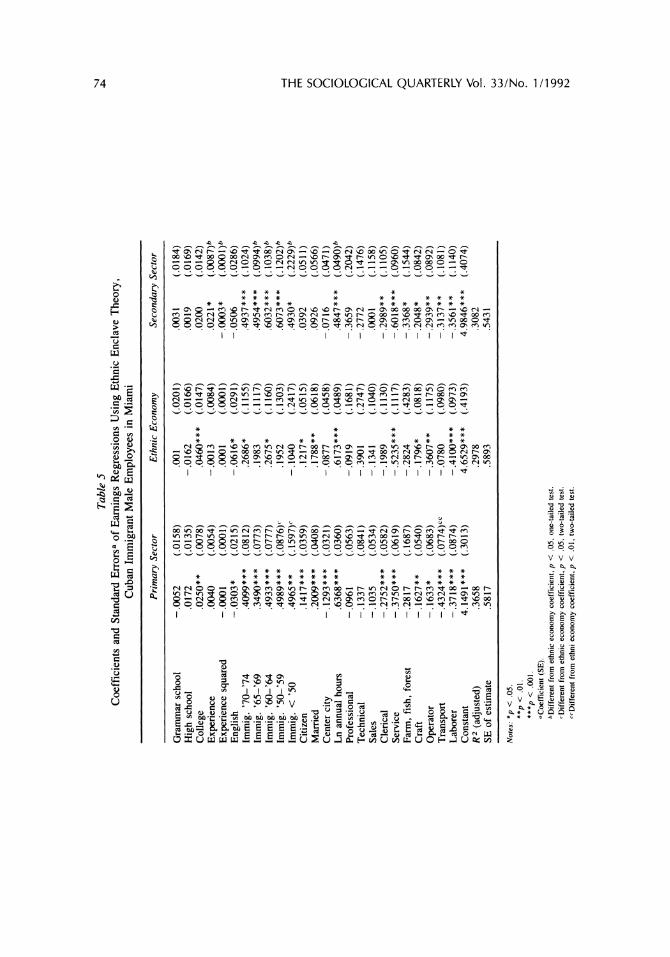
economy employees. The crosstabulations that classify industries by sector for the San Francisco Chinese
reveal 27 industries in which minorities are overrepresented. All but the 6 already part of the ethnic economy are placed in the secondary sector. Those assigned to neither the ethnic economy nor the secondary sector compose the primary sector.
Returning to Table 2, observe that primary sector employees earn significantly more than ethnic economy employees, but, surprisingly, secondary sector employees also earn more than the latter. Table 6 reports the ethnic enclave regressions for the Chinese. Again, few coefficients are significant, with the control, annual hours worked, displaying the most consistent effect. Table 6 also indicates the extent to which significant differences in coefficients underlie earnings variations. Comparing the primary sector and the ethnic economy, the salient differences match those that emerged for the middleman minority hypothesis, namely, disadvantageous returns to ethnic economy Chinese for one educa- tional and one occupational category. Comparing the enclave and secondary sectors, the advantage of arriving between 1950 and 1959 is stronger in the former, while that of executives over sales workers is stronger in the latter.
The Ethnic Economy 73
In short, a very strict interpretation of the enclave hypothesis of absolutely no dif- ferences in human capital returns between primary sector and ethnic economy employees fails. In each city, the coefficient on one category of one human capital variable favors the
primary sector. Also worthy of note, across all variables in the model, those variables on which ethnic economy employees experience a shortfall relative to primary sector em-
ployees are a subset of the same variables on which they experience a shortfall relative to dominant economy employees in the previous analysis. In other words, whether or not the dominant economy includes persons likely to work among minorities only slightly affects
comparisons with the ethnic economy. Finally, differences in returns between ethnic
economy and secondary workers show a mixed pattern, variously favoring each set of
employees.
THE ETHNIC HEGEMONY HYPOTHESIS
In operationalizing Jiobu's (1988a, 1988b) ideas, entrepreneurial representation does not
sufficiently identify the ethnic economy because his definition also requires heavy co- ethnic employment. Thus, industrial overrepresentation of both entrepreneurs and em-
ployees defines this economy.5 In addition to the advantages he predicts for these workers, Jiobu anticipates that workers in the saturated economy, those both employed by non-co- ethnics and surrounded by large numbers of compatriots, will suffer handicap. Note that Portes and Bach (1980, 1985) predict similarly pernicious effects in a secondary sector
overpopulated by minority employees. Members of the saturated economy are defined as
persons working in industries in which compatriots are overrepresented only as em-
ployees. Industries in which the ethnic group is overrepresented neither as entrepreneurs nor as employees compose the dominant economy. But Jiobu's typology is not exhaustive because it does not include endeavors in which ethnic entrepreneurs rely primarily on non- co-ethnic labor. These industries are assigned to the ethnic economy in the other two theories but are excluded from the hegemony analysis.
To obtain the three economies to test hegemony theory, in each SMSA two ethnic
categories are distinguished: ethnics (Cubans in Miami and Chinese in San Francisco) and others. In each location, ethnic category is crosstabulated by industry, once for en-
trepreneurs and once for employees. Industries are then assigned to the appropriate econo-
my depending upon whether they display ethnic overrepresentation for both entrepreneurs and employees (the ethnic economy), for employees only (the saturated economy), or for neither entrepreneurs nor employees (the dominant economy).
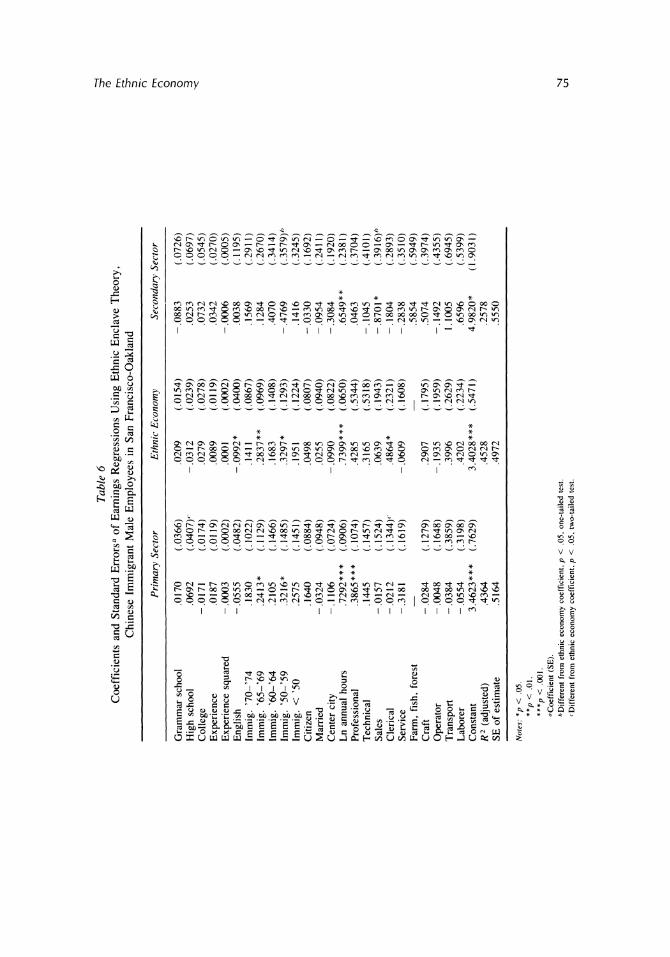
As Table 2's cell sizes indicate, the enclave and hegemonic interpretations distribute Cubans rather differently.6 The latter operationalization reveals no significant mean earn-
ings differences across economies. Table 7 presents the associated regression results for Cubans. Human capital exerts inconsistent effects across arenas, with college education
significant only in the dominant and ethnic economies, and experience and English skills
significant only in the saturated economy. Again, however, many of these differences between economies collapse under statistical scrutiny. Since the ethnic hegemony hypoth- esis anticipates higher returns in the ethnic than dominant economy, a one-tailed test is used.
Comparisons between human capital coefficients in dominant and ethnic economies belie the hypothesis. Ethnic economy employees receive an edge on none. Rather, ethnic economy employees arriving between 1965 and 1969 experience a significantly weaker advantage over newcomers than do their counterparts in the dominant economy. For the
-'
r)
O
r-
O
r)
-4
Z"" ;X
Table 5 Coefficients and Standard Errorsa of Earnings Regressions Using Ethnic Enclave Theory,
Cuban Immigrant Male Employees in Miami
Primary Sector Ethnic Economy Secondary Sector
Grammar school -.0052 (.0158) .001 (.0201) .0031 (.0184) High school .0172 (.0135) -.0162 (.0166) .0019 (.0169) College .0250** (.0078) .0460*** (.0147) .0200 (.0142) Experience .0040 (.0054) -.0013 (.0084) .0221* (.0087)b Experience squared -.0001 (.0001) .0001 (.0001) -.0003* (.0001)b English -.0303* (.0215) -.0616* (.0291) -.0506 (.0286) Immig. '70-'74 .4099*** (.0812) .2686* (.1155) .4937*** (.1024) Immig. '65-'69 .3490*** (.0773) .1983 (.1117) .4954*** (.0994)b Immig. '60-'64 .4933*** (.0777) .2675* (.1160) .6032*** (.1038)b Immig. '50-'59 .4989*** (.0876)' .1952 (.1303) .6073*** (. 1202)b Immig. < '50 .4965** (.1597)C -.1040 (.2417) .4930* (.2229)b Citizen .1417*** (.0359) .1217* (.0515) .0392 (.0511) Married .2009*** (.0408) .1788** (.0618) .0926 (.0566) Center city -.1293*** (.0321) -.0877 (.0458) -.0716 (.0471) Ln annual hours .6368*** (.0360) .6173*** (.0489) .4847*** (.0490)b Professional -.0961 (.0563) -.0919 (.1681) -.3659 (.2042) Technical -.1337 (.0841) -.3901 (.2747) -.2772 (.1476) Sales -.1035 (.0534) -.1341 (.1040) .0001 (.1158) Clerical -.2752*** (.0582) -.1989 (.1130) -.2989** (.1105) Service -.3750*** (.0619) -.5235*** (.1117) -.6018*** (.0960) Farm, fish, forest -.2817 (.1687) -.2824 (.4283) -.3368* (.1544) Craft -.1627** (.0540) -.1796* (.0818) -.2048* (.0842) Operator -.1633* (.0683) -.3607** (.1175) -.2939** (.0892) Transport -.4324*** (.0774)cc -.0780 (.0980) -.3137** (.1081) Laborer -.3718*** (.0874) -.4100*** (.0973) -.3561** (.1140) Constant 4.1491*** (.3013) 4.6529*** (.4193) 4.9846*** (.4074) R2 (adjusted) .3658 .2978 .3082 SE of estimate .5817 .5893 .5431
Notes: *p < .05. **p < .01. ***p < .001. aCoefficient (SE). bDifferent from ethnic economy coefficient, p < .05, one-tailed test. cDifferent from ethnic economy coefficient, p < .05, two-tailed test. "Different from ethni economy coefficient, p < .01, two-tailed test.
CD
C
(Sj
Table 6 Coefficients and Standard Errorsa of Earnings Regressions Using Ethnic Enclave Theory,
Chinese Immigrant Male Employees in San Francisco-Oakland
Primary Sector Ethnic Economy Secondary Sector
Grammar school .0170 (.0366) .0209 (.0154) -.0883 (.0726) High school .0692 (.0407)' -.0312 (.0239) .0253 (.0697) College -.0171 (.0174) .0279 (.0278) .0732 (.0545) Experience .0187 (.0119) .0089 (.0119) .0342 (.0270) Experience squared -.0003 (.0002) .0001 (.0002) -.0006 (.0005) English -.0555 (.0482) -.0992* (.0400) .0038 (.1195) Immig. '70-'74 .1830 (.1022) .1411 (.0867) .1569 (.2911) Immig. '65-'69 .2413* (. 1129) .2837** (.0969) .1284 (.2670) Immig. '60-'64 .2105 (.1466) .1683 (.1408) .4070 (.3414) Immig. '50-'59 .3216* (.1485) .3297* (.1293) -.4769 (.3579)'" Immig. < '50 .2575 (.1451) .1951 (.1224) .1416 (.3245) Citizen .1640 (.0884) .0498 (.0807) -.0330 (.1692) Married -.0324 (.0948) .0255 (.0940) -.0954 (.2411) Center city -.1106 (.0724) -.0990 (.0822) -.3084 (.1920) Ln annual hours .7292*** (.0906) .7399*** (.0650) .6549** (.2381) Professional .3865*** (.1074) .4285 (.5344) .0463 (.3704) Technical .1445 (.1457) .3165 (.5318) -.1045 (.4101) Sales -.0157 (.1524) .0639 (.1943) -.8701* (.3916)" Clerical -.0212 (. 1344)' .4864* (.2321) -. 1804 (.2893) Service -.3181 (.1619) -.0609 (.1608) -.2838 (.3510) Farm, fish, forest - - .5854 (.5949) Craft -.0284 (. 1279) .2907 (. 1795) .5074 (.3974) Operator -.0048 (.1648) -.1935 (.1959) -.1492 (.4355) Transport -.0384 (.3859) .3996 (.2629) 1.1005 (.6945) Laborer -.0554 (.3198) .4202 (.2234) .6596 (.5399) Constant 3.4623*** (.7629) 3.4028*** (.5471) 4.9820* (1.9031) R2 (adjusted) .4364 .4528 .2578 SE of estimate .5164 .4972 .5550
Notes: *p < .05.
**p < .01. ***p < .001. "Coefficient (SE). bDifferent from ethnic economy coefficient, p < .05, one-tailed test. cDifferent from ethnic economy coefficient, p < .05, two-tailed test.
--I
("I
O
0 --4 10 C
-I',
Table 7 Coefficients and Standard Errorsa of Earnings Regressions Using Ethnic Hegemony Theory,
Cuban Immigrant Male Employees in Miami
Dominant Economy Ethnic Economy Saturated Economy
Grammar school .0016 (.0150) -.0359 (.0386) -.0184 (.0204) High school .0111 (.0128) -.0117 (.0299) .0110 (.0187) College .0272*** (.0079) .0647** (.0235) .0181 (.0134)" Experience .0026 (.0054) -.0004 (.0141) .0200* (.0087) Experience squared -.00005 (.0001) -.00005 (.0002) -.0003* (.0001) English -.0316 (.0210) -.0973 (.0510) -.0554 (.0303) Immig. '70-'74 .4532*** (.0786) .2906 (.2090) .4418*** (.1109) Immig. '65-'69 .3951*** (.0743)b .1398 (.2000) .4469*** (.1085) Immig. '60-'64 .5360*** (.0747) .2806 (.2051) .5592*** (.1124) Immig. '50-'59 .5583*** (.0841) .2641 (.2229) .5332*** (.1338) Immig. < '50 .5275*** (.1477) .1683 (.3627) .4750 (.2952) Citizen .1280*** (.0353) .0742 (.0890) .0663 (.0531) Married .1799*** (.0401) .1380 (.1066) .1272* (.0603) Center city -.1188*** (.0319) -.0712 (.0768) -.1206* (.0477) Ln annual hours .6074*** (.0356) .4963*** (.0855) .5507*** (.0504) Professional -.1149 (.0680) -.0645 (.2298) -.0178 (.1592) Technical -.1087 (.0883) .1901 (.6092) -.2860* (.1300) Sales -.0732 (.0558) -.0368 (.1379) -.1327 (.1019) Clerical -.2566*** (.0624) -.1587 (.1694) -.3189*** (.0904) Service -.4410*** (.0589) -.4841** (.1458) -.3977* (.1655) Farm, fish, forest -.2752* (.1178) - Craft -. 1593** (.0548) -.2321 (.1338) -.2065** (.0785) Operator -.2052** (.0696) -.3248 (.1702) -.2502** (.0834) Transport -.4328*** (.0748)" -.0690 (.1967) -.3026** (.1134) Laborer -.3812*** (.0884) -.3390* (.1622) -.3337** (.1088) Constant 4.3019*** (.2960)b 5.900*** (.7862) 4.7997*** (.4239) R2 (adjusted) .3607 .2507 .3437 SE of estimate .5881 .5906 .5334
Notes: *p < .05. **p < .01.
***p < .001. -Coefficient (SE). bDifferent frbm ethnic economy coefficient, p < .05, one-tailed test.

---q
r-r,
r-r C
0 0
".4 ",
Table 8 Coefficients and Standard Errorsa of Earnings Regressions Using Ethnic Hegemony Theory,
Chinese Immigrant Males in San Francisco-Oakland
Dominant Economy Ethnic Economy Saturated Economy
Grammar school .0100 (.0395) .0281 (.0162) -.0102 (.0570) High school .0442 (.0440) -.0345 (.0248) .0828 (.0548) College -.0183 (.0207) .0272 (.0288) .0296 (.0282) Experience .0203 (.0123) .0079 (.0125) .0005 (.0197) Experience squared -.0004 (.0002) -.0001 (.0002) .00009 (.0004) English -.0843 (.0561) -.0970* (.0418) -.0289 (.0675) Immig. '70-'74 .2786* (. 1176) .1402 (.0897) -.0511 (.1706) Immig. '65-'69 .2944* (.1278) .3083** (.1017) .0519 (.1610) Immig. '60-'64 .2694 (.1564) .1400 (.1554) .5284* (.2576) Immig. '50-'59 .2634 (.1677) .3513** (.1322) -.2972 (.2063)"" Immig. < '50 .3050 (.1654) .2230 (.1264) .1833 (.2173) Citizen .1751 (.0965) .0241 (.0848) .1500 (.1194) Married -.0506 (.1031) .0229 (.0984) .0436 (.1650) Center city -.1745* (.0813)" -.1039 (.0840) .1820 (.1295) Ln annual hours .6520*** (.0992) .7411*** (.0677) .9589*** (.1643) Professional .3560** (.1260) .4812 (.5424) .4959** (.1720) Technical .1999 (.1670) .3716 (.5400) .1767 (.2401) Sales -.2507 (.1670) .1301 (.2037) .7139* (.3153) Clerical -.0497 (. 1473)b .5582* (.2534) -.2356 (. 1837)" Service -.3886* (.1725) -.0087 (.1684) -.2689 (.2210) Farm, fish, forest .2395 (.4387) - Craft .0748 (.1490) .3443 (.1936) -.2544 (.2110)h Operator .0850 (.1861) -.1415 (.2050) -.2837 (.2625) Transport .0575 (.3479) .4685 (.3377) Laborer .2226 (.2788) .4857* (.2367) Constant 4.2492*** (.8123) 3.3043*** (.5675) 1.7632 (1.1425) R 2 (adjusted) .3668 .4427 .5250 SE of estimate .5538 .5029 .4415
Notes: *p < .05. **p < .01.
***p < .001. aCoefficient (SE). bDifferent from ethnic economy coefficient, p < .05, one-tailed test. bbDifferent from ethnic economy coefficient, p < .01, one-tailed test.

78 THE SOCIOLOGICAL QUARTERLY Vol. 33/No. 1/1992
controls, the contrast between executive and transport occupations remains more favor- able in the dominant economy. Finally, examining the contrast between returns in the ethnic and saturated economies lends some support to the corollary hypothesis of ethnic economy superiority. College education is more highly rewarded in the ethnic economy.
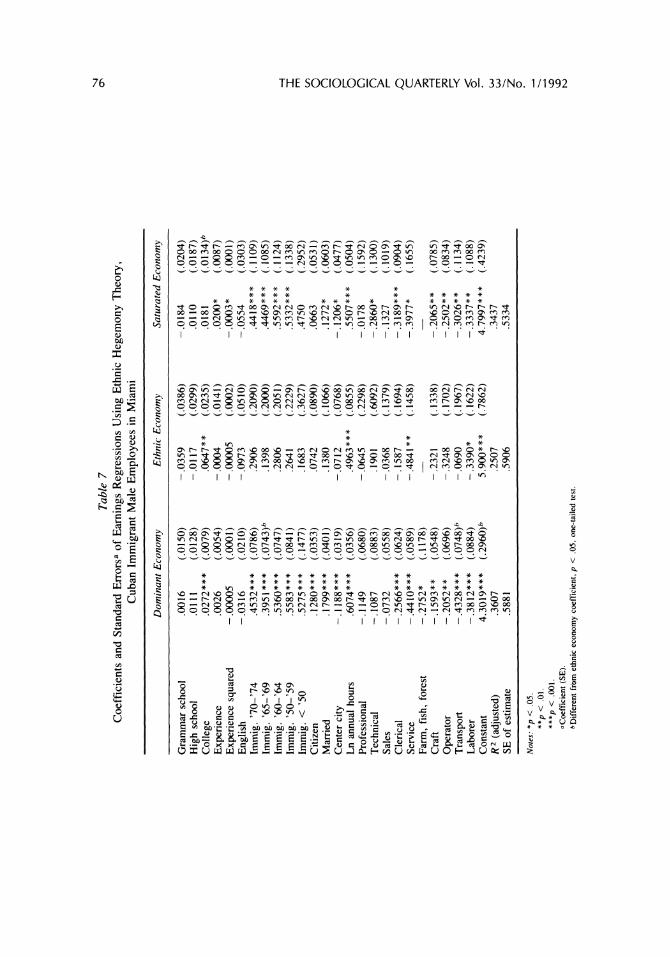
For the San Francisco Chinese, cell sizes in Table 2 show that shifting from an enclave to a hegemonic perspective creates only a few changes.7 These little diminish the earnings handicap of ethnic economy employment. In addition, any expectation that saturated economy workers earn least, just barely true for Miami Cubans, considerably misses the mark for San Francisco's Chinese. Table 8 presents the regression results. In the Chinese ethnic economy, human capital effects are limited to English and some immigration variables. In the other two economies, only the latter effects appear. A strong impact of hours worked and a smattering of significant occupational contrasts emerge throughout.
Contrary to the ethnic hegemony hypothesis, no differences in human capital coeffi- cients emerge between Chinese in the dominant and ethnic economies. For the controls, central city residence is significantly more deleterious for dominant than for ethnic econo- my employees, while executives fare better than clerical workers in the dominant econo- my. The deficit in translations expected for saturated versus ethnic economy employees does emerge, but only for immigrants arriving 1950-1959. At the same time, saturated economy executives reap stronger benefits relative to clerical and craft workers than do their ethnic economy counterparts.
To conclude, no human capital advantages emerge for ethnic versus dominant economy jobs within either immigrant group. However, a small number of coefficients on the controls do favor the ethnic economy employee. The negative consequences of saturated economy jobs also receive modest support. Still, the small coefficient differences un- covered here are not the primary cause of the earnings variations across the three economies.
DISCUSSION
The relevance of human capital variables to the earnings attainment of workers in this study appears uneven. Across equations, they prove more appropriate for Cubans than Chinese. The most likely explanation for weak human capital effects among the Chinese is discrimination. Interestingly, Sanders and Nee (1987) report similar outcomes for San Francisco Chinese, while Zhou and Logan (1989) report stronger effects for New York Chinese. Only further research can ascertain why Chinese immigrants experience such different receptions in these two locales.
For both Chinese and Cubans, however, the full model's explained variance runs quite high. Other patterns also emerge. Ethnic economy employees uniformly earn less than their dominant economy counterparts. But in most comparisons, ethnic economy em- ployees receive significantly lower returns in no more than one category of one poly- tomous human capital variable. The directions for the occasional differences in control variable returns are inconsistent, sometimes favoring the ethnic economy, sometimes not. Furthermore, complicating comparisons by defining additional, contrasting economies based on ethnic composition little affects the consistency of returns across economies. Thus, variations in worker characteristics appear to be the primary reason, especially in San Francisco, for ethnic economy employees' depressed earnings.8
Before pursuing the implications of these findings, several issues deserve mention. The
The Ethnic Economy 79
first is the appropriateness of selecting the natural log of earnings as the dependent variable. Other functional forms, particularly a real dollars specification, have become increasingly popular in the stratification literature. Hauser (1980) and Hodson (1985) have pointed out that if group means differ, and homogeneous slopes obtain between groups in one functional form, then heterogeneous slopes obtain in the other. Indeed, using dollar earnings as the dependent variable in an otherwise quite similar analysis reveals a very small net advantage to employment in the Cuban ethnic economy and a very large net disadvantage to employment in the Chinese ethnic economy (Model 1989). However, Petersen (1989) indicates that logged earnings are the appropriate choice when hours worked are a control variable.9
A second question is whether analyses of the earnings function provide the most relevant insights into the relative value of ethnic economy employment. As indicated above, ethnic economy theorists consider earnings only one of many outcome measures. Although they dispute about the earnings effects of ethnic economy employment, they agree that these workers enjoy advantages such as higher occupational status and job security. To the extent that the data set used here can illuminate these issues, however, little support accrues for these nonmonetary advantages.
For example, when weeks unemployed in 1979 is compared across the three perspec- tives, only the hegemony approach produces lower unemployment for ethnic than dominant economy employees. All other comparisons depict greater mean number of jobless weeks for ethnic economy employees. In addition, the coefficients of a model predicting Duncan SEI (not shown) vary only slightly across perspectives: For both Cubans and Chinese, the few statistically significant differences do not favor ethnic economy employees.10
A third question addresses consistency across time and space. Although the test results offered here are consistent with much recent research (Zhou and Logan 1989; Portes and Jensen 1989), that ethnic economy employees in other places/historical moments experi- ence quite different trajectories is both logically possible and empirically likely. This holds not only because the reward structures of ethnic economies can vary, but because domi- nant economies can vary in their treatment of immigrant groups. Group-specific factors, such as size, physical distinctiveness, and premigration skills, as well as economy-specific factors, such as the quality and quantity of local labor, the level of technology, and the strength of unions all interact to determine the reception accorded immigrant workers.
Despite these limitations, most secondary analyses conclude that today's ethnic econo- my employees are neither advantaged nor disadvantaged." At first glance, this conclu- sion appears to support the enclave hypothesis. But this generalization overlooks the function of comparison groups. Originally formulated, the enclave hypothesis implied that ethnic economy employees receive returns equivalent to primary sector employees and superior to secondary sector employees. Since both labor market segmentationists and enclave theorists assumed that most immigrants worked in the secondary sector, enclave theory was really claiming that groups that establish ethnic economies enjoy an advantage over those that do not. However, labor market segmentation theory has now fallen into disfavor, and tests of the enclave hypothesis distinguish only two arenas, dominant econo- my and ethnic economy. That few differences emerge from this comparison cannot, strictly speaking, be interpreted to confirm the enclave hypothesis. Put more strongly, the results of past studies coupled with the more complex comparisons offered here indicate that, with respect to employees, ethnic economy theories capture ethnic stratification no more accurately than labor market segmentation theories. Still, well-constructed and
80 THE SOCIOLOGICAL QUARTERLY Vol. 33/No. 1/1992
properly analyzed survey data might contradict this conclusion, or the key feature of today's ethnic economies could lie elsewhere. Perhaps ethnic economies provide en- trepreneurial opportunities to a significant proportion of group members at some time in the life cycle. Maybe the ethnic economy offers some less easily quantifiable advantages, such as better working conditions, employment benefits, flexible hours, or jobs for em- ployees' kin and friends. Given the considerable relevance of ethnic economies to social theory and to social policy, that so little data have been collected specifically to examine the consequences of ethnic economy employment is certainly surprising.
ACKNOWLEDGMENTS
The data utilized in this study were made available by the Inter University Consortium for Political and Social Research. The data for Census of Population and Housing, 1980: Public Use Microdata Samples were originally collected by the U.S. Department of Commerce, Bureau of the Census. Neither the collector of the original data nor the Consortium bear any responsibility for the analysis or interpretations presented here. The author wishes to thank Andy Anderson, Gene Fisher, Randy Hodson, and Eleanor Weber for technical assistance and Charles Hirschman, Chris Hum, Victor Nee, Jeffrey Reitz, and Jimy Sanders for helpful comments on an earlier draft.
NOTES
1. The enclave theorists' interpretation of labor market segmentation theory glosses over the confusion in the segmentation literature about the characteristics of primary and secondary jobs versus workers, and the linkages between jobs and workers of each type (Wallace and Kalleberg 1981; Hodson and Kaufman 1982).
2. The addition of a residential location variable represents the only change from the models of Sanders and Nee (1987) and Zhou and Logan (1989). The variable explores the possibility that residence in central cities means not only weaker human capital (Portes and Jensen 1987, 1989) but also poorer translations of that human capital into earnings.
3. Although the self-employed probably do not have employees, both theory and research suggest that within the ethnic economy of a particular group, entrepreneurs with and without employees will specialize in the same industries. Both types of entrepreneurs often begin as ethnic economy employees, gaining industry-specific skills. Both types benefit from the horizontal and vertical linkages that reinforce ethnic concentration in specific industries. Moreover, in small business, the boundary between zero and a few employees is highly permeable. Thus, to combine the self-employed and employees of their own corporation when assigning industries to an ethnic economy is appropriate.
4. Portes and Bach (1980, 1985) only vaguely define terms such as Anglo, minority, or pre- dominate, and do not discuss the appropriate sectoral classification for firms owned by neither Anglos nor Cubans.
5. This definition deemphasizes two of Jiobu's (1988a) requirements: the presence of internal labor markets and of middleman minority activity. Internal labor markets would seem a likely, if not inevitable, consequence of ethnic economic control and ethnic saturation. On the other hand, middleman minority activity, by which Jiobu means "mediating the economic transactions between retailers and producers" (p. 356), appears more an occasional than a required characteristic of hegemony.
6. Of the 1526 Cubans assigned to the primary sector under enclave theory, 1329 fall in the dominant economy under hegemony theory. In addition, the dominant economy gains 253 Cubans

The Ethnic Economy 81
formerly assigned to the secondary sector. The saturated economy consists of 197 former primary and 409 former secondary sector Cubans. Of the 775 Cubans in the ethnic economy under enclave theory, only 275 meet the hegemonic requirement of working in industries in which Cubans are
overrepresented as both entrepreneurs and employees. The remaining 500 Cubans are excluded from this portion of the analysis.
7. Of the 265 primary sector Chinese, 209 become dominant and 56 saturated economy mem- bers. Of the 80 in the secondary sector, 39 fall in the dominant economy and 41 in the saturated. Of the 309 in the enclave based ethnic economy, a full 294 remain there under the hegemony definition because only 15 work in industries in which Chinese are overrepresented only as entrepreneurs. Comparison suggests that San Francisco Chinese entrepreneurs rely more exclusively on co-ethnic
employees than Miami Cuban entrepreneurs. 8. One way to illustrate the relative contributions of characteristics and coefficients in earnings
determination is to examine the estimated earnings of someone assigned mean values on the
independent variables. For Cubans, the natural logarithm of this estimate ranges from a high of 9.355 (saturated economy) to a low of 9.253 (secondary economy); for Chinese, 9.496 (secondary economy) to 9.233 (ethnic economy of hegemony theory). In other words, within ethnic groups, predicted earnings across perspectives are quite similar, indicating that variations in real earnings across perspectives stem primarily from differences in characteristics.
9. Petersen (1989) further demonstrates that, when estimating logged earnings and controlling for hours worked, hours should be entered in log form and the hours coefficient should be restricted to equal 1. To enhance compatibility with previous studies of ethnic economy employees, however, only the first of these recommendations is implemented here.
10. The associated tables are available on request from the author. 11. Sanders and Nee's (1987) work, uncovering a significant shortfall in ethnic economy
employment, is the major exception.
REFERENCES
Aldrich, Howard, Katherine Zimmer, and David McEvoy. 1989. "Continuities in the Study of Ecological Succession: Asian Businesses in Three English Cities." Social Forces 67: 920- 944.
Bonacich, Edna. 1973. "A Theory of Middleman Minorities." American Sociological Review 38: 583-594.
Bonacich, Edna, and John Modell. 1980. The Economic Basis of Ethnic Solidarity. Berkeley: University of California Press.
Hauser, Robert M. 1980. "On Stratification in a Dual Economy." American Sociological Review 45: 702-712.
Hodson, Randy. 1985. "Some Considerations Concerning the Functional Form of Earnings." Social Science Research 14: 374-394.
Hodson, Randy, and Robert Kaufman. 1982. "Economic Dualism: A Critical Review." American Sociological Review 47: 727-739.
Jiobu, Robert M. 1988a. "Ethnic Hegemony and the Japanese of California." American Socio- logical Review 53: 353-367.
. 1988b. Ethnicity and Assimilation. Albany: SUNY Press. Light, Ivan, and Edna Bonacich. 1988. Immigrant Entrepreneurs: Koreans in Los Angeles, 1965-
1982. Berkeley: University of California Press. Min, Pyong Gap, and Charles Jaret. 1985. "Ethnic Business Success: The Case of Korean Small
Business in Atlanta." Sociology and Social Research 69: 412-435. Model, Suzanne. 1989. "The Ethnic Economy: Cubans and Chinese Reconsidered." Paper present-
ed at the annual meetings of the American Sociological Association, San Francisco.
82 THE SOCIOLOGICAL QUARTERLY Vol. 33/No. 1/1992
Nee, Victor, and Jimy Sanders. 1987. "On Testing the Enclave-Economy Hypothesis." American Sociological Review 52: 771-773.
Petersen, Trond. 1989. "The Earnings Function in Sociological Studies of Earnings Inequality: Functional Form and Hours Worked." Pp. 221-250 in Research in Social Stratification and
Mobility, vol. 8, edited by Arne Kalleberg. Greenwich, CT: JAI Press. Portes, Alejandro, and Robert L. Bach. 1980. "Immigrant Earnings: Cuban and Mexican Immi-
grants in the U.S." International Migration Review 14: 15-41. . 1985. Latin Journey: Cuban and Mexican Immigrants in the United States. Berkeley: University of California Press.
Portes, Alejandro, and Leif Jensen. 1987. "What's an Ethnic Enclave? The Case for Conceptual Clarity." American Sociological Review 52: 768-771.
•- . 1989. "The Enclave and the Entrants: Patterns of Ethnic Enterprise in Miami Before and After Mariel." American Sociological Review 54: 929-949.
Portes, Alejandro, and Robert D. Manning. 1986. "The Immigrant Enclave: Theory and Empirical Examples." Pp. 47-78 in Competitive Ethnic Relations, edited by Susan Olzak and Joane
Nagel. New York: Academic Press. Sanders, Jimy M., and Victor Nee. 1987. "Limits of Ethnic Solidarity in the Enclave Economy."
American Sociological Review 52: 745-767. U.S. Department of Commerce. 1983. Census of Population and Housing 1980: Public-Use Micro-
data Samples. Technical Documentation. Bureau of the Census. Washington: Government
Printing Office. Waldinger, Roger. 1984. "Immigrant Enterprise in the New York Garment Industry." Social Prob-
lems 32: 60-71.
•- . 1986. Through the Eye of the Needle: Immigrants and Enterprise in New York's Garment Trades. New York: New York University Press.
Wallace, Michael, and Arne L. Kalleberg. 1981. "Economic Organization of Firms and Labor Market Consequences: Toward a Specification of Dual Economy Theory." Pp. 77-117 in
Sociological Perspectives on Labor Markets, edited by Ivar Berg. New York: Academic Press.
Wilson, Kenneth, and W. Allen Martin. 1982. "Ethnic Enclaves: A Comparison of the Cuban and Black Economies in Miami." American Journal of Sociology 88: 135-160.
Wilson, Kenneth, and Alejandro Portes. 1980. "Immigrant Enclaves: An Analysis of the Labor Market Experience of Cubans in Miami." American Journal of Sociology 86: 295-319.
Wright, Erik, Cynthia Costello, David Hachen, and Joey Sprague. 1982. "The American Class Structure." American Sociological Review 47: 709-726.
Zhou, Min, and John R. Logan. 1989. "Returns on Human Capital in Ethnic Enclaves: New York
City's Chinatown." American Sociological Review 54: 809-820.


