An informed and empowered Hispanic America | The Hispanic ...
THE EMERGING HISPANIC HOMELAND OF THE PACIFIC NORTHWEST:
A CASE STUDY OF YAKIMA VALLEY, WASHINGTON
by
Laurie Darian
A thesis submitted in partial fulfillment of the requirements for the degree
of
Master of Science
in
Earth Sciences
MONTANA STATE UNIVERSITY
Bozeman, Montana
April, 2006

© COPYRIGHT
by
Laurie Darian
2006
All Rights Reserved
ii
APPROVAL
of a thesis submitted by
Laurie Darian
This thesis has been read by each member of the thesis committee and has been found to be satisfactory regarding content, English usage, format, citations, bibliographic style, and consistency, and is ready for submission to the Division of Graduate Education.
Dr. Jian-yi Liu
Approved for the Department of Earth Sciences
Dr. David Lageson
Approved for the Division of Graduate Education
Dr. Joseph J. Fedock
iii
STATEMENT OF PERMISSION TO USE
In presenting this thesis in partial fulfillment of the requirements for a master’s
degree at Montana State University, I agree that the Library shall make it available to
borrowers under rules of the Library.
If I have indicated my intention to copyright this thesis by including a copyright
notice page, copying is allowable for scholarly purposes, consistent with “fair use” as
prescribed in the U.S. Copyright Law. Requests for permission for extended quotation
from or reproduction of this thesis in whole or in parts may be granted only by the
copyright holder.
Laurie Darian
April, 2006
iv
ACKNOWLEDGEMENT
I would like to thank my advisor, Dr. Jian-yi Liu for taking me on as a graduate student
and as a friend. Many thanks to my committee members Dr. Joe Ashley and Dr. Bill
Wyckoff, for their helpful editorial comments and enduring enthusiasm for geography.
Much gratitude also extends to Stuart Challender, who freely dedicated his time and his
interest to the GIS aspect of this research. This work could not have been completed
without the interviewees of my research site, who offered their thoughts and ideas and
allowed themselves to be questioned by an out of state graduate student prodding through
their town. In particular, I owe a great deal of appreciation to Dr. Apanakhi Buckley,
who offered me not only her curiosity and expertise, but also her hospitality.
v
TABLE OF CONTENTS
LIST OF TABLES........................................................................................................... viii LIST OF MAPS ................................................................................................................. ix LIST OF FIGURES .............................................................................................................x INTRODUCTION ...............................................................................................................1
1. RESEARCH FRAMEWORK.........................................................................................5 Conceptual Structure.......................................................................................................8 Research Questions.......................................................................................................10 Methodology ................................................................................................................11 Data Sources .................................................................................................................13 Census Data ...........................................................................................................13 Field Investigations................................................................................................14 Secondary Sources .................................................................................................15 2. HISPANICS IN THE UNITED STATES ....................................................................16 The Mexican Origin Population....................................................................................17 Population Trends .........................................................................................................20 Geographic Trends........................................................................................................23 Future Projections .........................................................................................................26 3. EVOLUTION OF HISPANICS IN THE YAKIMA VALLEY ...................................29 World War II and the Farm Labor Shortage.................................................................31 The Bracero Program....................................................................................................41 Shift to Migrant Workers ..............................................................................................46 The Valley’s Hispanics Today......................................................................................51 Conclusion ....................................................................................................................56 4. CENSUS DATA ANALYSIS ......................................................................................58 County Level Data: 1980 ..............................................................................................62 County Level Data: 1980-2000.....................................................................................66 County Level Data: 2000 ..............................................................................................69 Place Level Data: 1980-2000........................................................................................70 Place Level Data: 2000 .................................................................................................75 Conclusion ....................................................................................................................81
5. GEOGRAPHIC INFORMATION SYSTEM ANALYSIS ..........................................82 Spatial Assimilation and GIS Studies ...........................................................................82
vi
TABLE OF CONTENTS CONTINUED Analysis.........................................................................................................................88 Results...........................................................................................................................92 6. THE YAKIMA VALLEY: CULTURAL LANDSCAPE AND SOCIAL INTEGRATION ..........................................................................................................101 Hispanic Imprints........................................................................................................102 Signage..................................................................................................................104 Shopping ...............................................................................................................111 Media ....................................................................................................................119 Newspaper.......................................................................................................119 Radio ...............................................................................................................121 Music.....................................................................................................................125 Housescapes..........................................................................................................127 Gang Graffiti .........................................................................................................130 Social Integration ........................................................................................................132 Religious Services.................................................................................................132 Hispanic Businesses..............................................................................................135 Education ..............................................................................................................138 Conclusion ..................................................................................................................143
7. THE EMERGING HISPANIC HOMELAND OF THE YAKIMA VALLEY: THEORIES AND PRACTICES.................................................................................145 Theories of the Immigrant and Ethnic Incorporation .................................................145 Multiculturalism/Pluralism ....................................................................................146 Cultural Citizenship ...............................................................................................147 Transnationalism....................................................................................................148 Translocalism: An Alternative...............................................................................148 The Case of the Yakima Valley ..................................................................................150 Economic Assimilation.........................................................................................150 Spatial Assimilation ..............................................................................................152 Cultural Assimilation ............................................................................................154 Structural Assimilation .........................................................................................155 Political/Social Organization ................................................................................160 Hispanic Imprint/Cultural Landscape ...................................................................161 Economic Spaces ............................................................................................162 Residential Spaces ..........................................................................................163 Cultural Spaces ...............................................................................................164 The Cultural Landscape as a Revealer of Social Dynamics ...........................165 Summary of Results....................................................................................................171
8. CONCLUSION...........................................................................................................173 Policy Implications ....................................................................................................177
vii
TABLE OF CONTENTS CONTINUED
REFERENCES ................................................................................................................181 APPENDICES .................................................................................................................186 Appendix A: GIS Data and Attributes .......................................................................187 Appendix B: Calculations of Residential Segregation and the Entropy Index.......................................................................................................198 Appendix C: Delineation of the Downtown Area for the Towns of Toppenish, Grandview, Sunnyside, and Wapato .........................................................................209
viii
LIST OF TABLES
Table Page
1. The percentage of Hispanics and Mexican immigrants living in the U.S. in 2000 by year of entry .........................................................................................22
2. Growth in the percentage of Hispanics in several towns in the Lower Yakima Valley .......................................................................................................49
3. General demographic characteristics of the Spanish origin
population of Yakima County in 1980...................................................................62
4. The Index of Dissimilarity for both the study area and Yakima County...............95 5. Summary of GIS analysis and results ....................................................................99
6. Survey responses to the race relations question...................................................159
ix
LIST OF MAPS
Map Page
1. Washington State with the Yakima Valley encircled ..............................................2
2. The Yakima Valley ................................................................................................11
3. Percent of persons who are Mexican by state, 2000..............................................24
4. Top 10 states with large Hispanic populations and growth, 2000 .........................25
5. Part of the Pacific Northwest with the Columbia Basin Irrigation Project encircled and the Grand Coulee Dam marked with a black triangle .....................30
6. Map of Mexico showing state boundaries with Michoacan encircled...................51
7. Change in the Percent Hispanic per block group 1990-2000 ................................92
8. Growth in Hispanic per capita income compared to growth in total per capita income by block group 1990-2000.............................................................93 9. Change in the entropy index from 1990-2000 .......................................................97
10. Change in linguistic isolation per block group 1990-2000....................................98
11. The street layout of the town of Toppenish .........................................................103
12. The Hispanic percentage in each census block in Toppenish..............................128
x
LIST OF FIGURES
Figure Page
1. Hispanics by country of origin, 2000.....................................................................17
2. Full-time, year round workers with annual earnings of $35,000 or more
by detailed Hispanic origin: 2001..........................................................................18
3. Population with at least a high school education by detailed Hispanic
origin: 2002............................................................................................................19
4. Immigrants as a percentage of the U.S. Population ...............................................20 5. The foreign born population by world region of birth, 2003.................................21
6. Population by Hispanic origin, age, and sex: 2002...............................................27
7. An image of the Food-for-Victory Campaign .......................................................32
8. An image of the Food-for-Victory Campaign .......................................................33
9. An image of the Food-for-Victory Campaign .......................................................34
10. An advertisement recruiting women into the fields...............................................35
11. Advertisements for farm labor ...............................................................................36
12. An article describing the labor shortage ................................................................37
13. An article describing the school schedule during the war .....................................38
14. A description of the demand for Mexican laborers ...............................................39
15. Farmers in Washington anticipate relief from the labor shortage..........................40
16. Descriptions of the newly arrived Mexican laborers .............................................43
17. Geographic relationship of census data .................................................................61
xi
LIST OF FIGURES - CONTINUED
Figure Page
18. Percent of employed persons older than 16 years who work in agriculture, forestry, or fisheries, 1980...........................................................63 19. Median income in Yakima County, 1980 ..............................................................64 20. Educational attainment for the population 25 years and older, 1980.....................................................................................................................65 21. Percent of families below the poverty level, 1980.................................................66
22. Demographic changes, 1980-2000.........................................................................67
23. Difference in median family income between Hispanics and the total population: change from 1980-2000...........................................................68 24. Difference between the percent of Hispanic families and total families below the poverty level: change from 1980-2000 ................................69 25. Growth of the Hispanic population, 1980-2000 ....................................................71
26. Growth of the foreign born population, 1980-2000...............................................72
27. Growth in the percentage of the population older than 4 years who speak Spanish, 1980-2000..........................................................................73 28. Difference between the percentage of all families and Hispanic families below the poverty level, 1980 and 2000 ..............................................74 29. Percent of the population 25 years and older with more than a high school education, 2000 ...............................................................................75 30. Educational attainment of the population 25 years and older, 2000......................76
31. Percent of families below the poverty level, 2000……………………………….78
32. Household income for Hispanic and non-Hispanic white householders, 2000 ...............................................................................................79 33. Age by sex and ethnicity, 2000.............................................................................80
xii
LIST OF FIGURES - CONTINUED
Figure Page
34. Flow chart of GIS analysis.....................................................................................90
35. Businesses transferring money to and from Mexico are Common in the Valley .........................................................................................104 36. A Mexican restaurant in Grandview....................................................................105 37. One of the many examples of Spanish language signage ....................................106 38. A convenience store in Toppenish oriented to Mexicans ....................................107
39. Businesses with names that are closely tied to Mexico .......................................108
40. Bilingual signage on a nationally owned business ..............................................109
41. Bilingual signage on a locally owned business....................................................110
42. Bilingual signage in a public library....................................................................110
43. Bilingual signage in a Wal-Mart in Sunnyside ....................................................111
44. The Hispanic goods section of Wal-Mart115 ......................................................112
45. The Wal-Mart in Sunnyside employs bilingual pharmacists...............................113
46. Tortilla makers and warmers in a smaller grocery store......................................114
47. Mexican food items in a medium sized store.......................................................115
48. The Mexican foods section of a Safeway in Toppenish ......................................116
49. Items in the Mexican foods section .....................................................................117
50. Cookies and piñatas in the Mexican foods section ..............................................118
51. Two murals encouraging Hispanic youth in their United States home adorn the walls outside of Radio KDNA.........................................123
52. Radio KDNA, Granger ........................................................................................124
xiii
LIST OF FIGURES - CONTINUED
Figure Page
53. A Mexican home adorned with bright colors, a chain link fence, and
colorful flowers in Toppenish..............................................................................129
54. A Mexican housescape in Toppenish ..................................................................129 55. Gang graffiti on a mailbox in a Mexican neighborhood, Toppenish...................130
56. Gang graffiti on a dumpster in a Mexican neighborhood, Toppenish .................131 57. Gang graffiti on a home in a Mexican neighborhood, Toppenish .......................131 58. A Reformed Christian church reaching out to the Hispanic
Community ..........................................................................................................133 59. A bilingual religious service ................................................................................134 60. A mass held in Spanish and one held in English, offered at different times .......134 61. One example of the bilingual nature of Lincoln Elementary School, Toppenish..........................................................................................................141 62. The Bracero mural in Toppenish, located on side street......................................166 63. The mural depicting the Bracero Program is hard to find and often blocked from view.............................................................................................................167 64. The story behind the Bracero mural.....................................................................168 65. The Bracero mural ...............................................................................................169 66. Scenes from the Bracero mural, Toppenish.........................................................170
xiv
ABSTRACT
The transition of spaces and places by the increasing number of Hispanics in the United States is a topic of growing importance in cultural geography. The degree to which Hispanics integrate, or assimilate, into Anglo culture plays a vital role in such transformations. This research examines the different avenues of Hispanic assimilation and non-assimilation in the Lower Yakima Valley in Washington State. These avenues consist of economic, structural, cultural, and spatial assimilation, as well as the Hispanic representation in the cultural landscape. Fieldwork in the Valley, combined with census data from the last two decades suggests that Hispanics are assimilating into Anglo culture structurally, spatially, and economically, but not culturally. Due to the fact that this area is majority Hispanic, the maintenance of this culture has a distinct impact on the cultural landscape, as well as the Anglo population. By defying the traditional model of assimilation, a new Hispanic homeland is emerging in the Pacific Northwest. Mexicans in the Valley have created a place that, in their own words, “feels like home.” The schools and businesses in these communities are faced with unique challenges, the solutions to which differ greatly from places where Hispanics are a minority. As the geographic distribution of Hispanics continues to change, it is likely that other communities will experience transformations similar to those in the Yakima Valley. This research serves to add to the growing literature aimed at benefiting such places.
1
INTRODUCTION
Ethnic culture regions have long been the focus of intense study. The Hispanic
borderlands of the southwest United States present unique case studies of situations in
which a national minority, Hispanics, have attained majority status. The society and
economics of these regions require policy solutions that may differ greatly from other
areas. Therefore, it is of national interest that these areas are extensively studied and
identified. While traditional ethnic concentrations have been given ample consideration,
new and emerging areas exhibiting similar characteristics have remained relatively
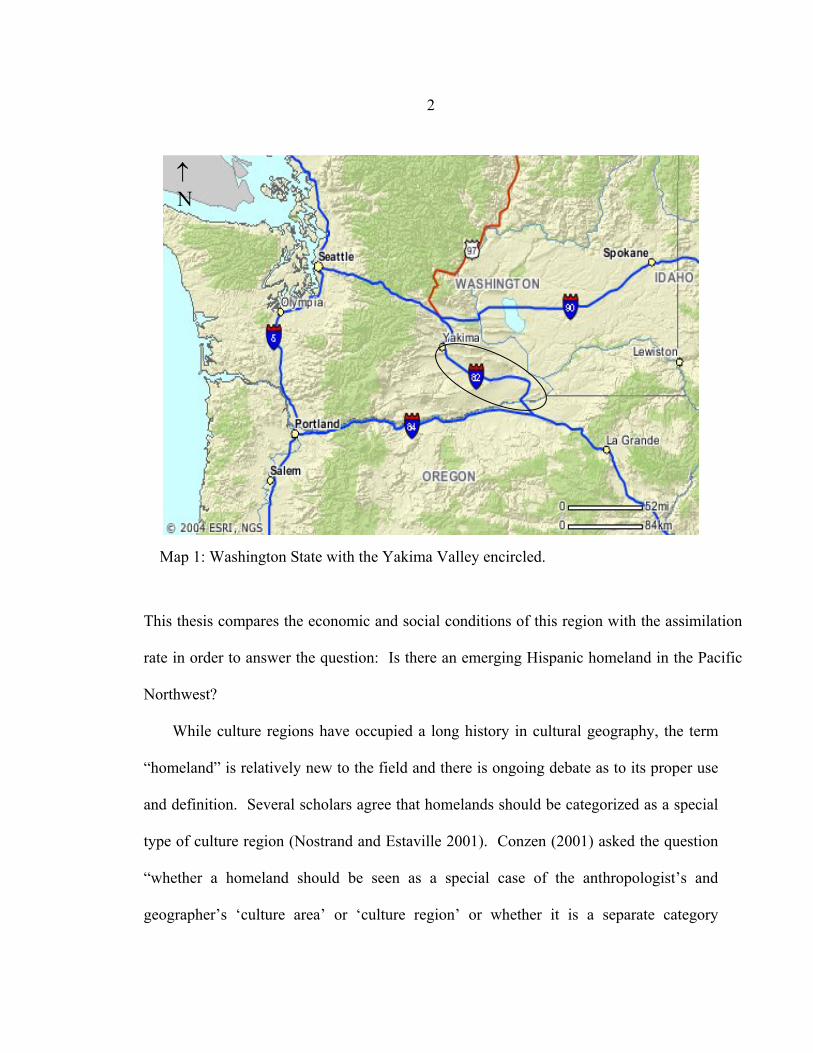
unexplored. This thesis explores one of those areas: the Yakima Valley of central
Washington (Map 1).
The Yakima Valley is located in the heart of Washington State, about 180 miles from
the metropolitan centers of Spokane, Seattle, and Portland, Oregon. The largest city in
the Valley is Yakima, located at the northwestern end of the Valley. Climatically, the
Yakima Valley is a desert, receiving approximately eight inches of rainfall a year. The
Valley however, is blessed with the Yakima River, which has its headwaters in the
Cascade Mountains to the west. Like much of central Washington, it is characterized by
volcanic soils, which are extremely fertile and thus ideal for agriculture. The Valley
ranks as one of the top ten most productive agricultural regions in the United States, and
ranks first in the production of hops, apples, and mint. In 2000 the population of Yakima
County was 222,500, with the majority of people located along the 60-mile stretch of the
Valley itself.
2
Map 1: Washington State with the Yakima Valley encircled.
This thesis compares the economic and social conditions of this region with the assimilation
rate in order to answer the question: Is there an emerging Hispanic homeland in the Pacific
Northwest?
While culture regions have occupied a long history in cultural geography, the term
“homeland” is relatively new to the field and there is ongoing debate as to its proper use
and definition. Several scholars agree that homelands should be categorized as a special
type of culture region (Nostrand and Estaville 2001). Conzen (2001) asked the question
“whether a homeland should be seen as a special case of the anthropologist’s and
geographer’s ‘culture area’ or ‘culture region’ or whether it is a separate category
↑ N
3
altogether” (Conzen 2001, 248). If the homeland concept is to be considered a special
type of culture region, exactly what defines a homeland as “special” must be identified.
Nostrand and Estaville (2001) and Conzen (2001) have all concluded that a group’s
relation to place is a key element, essential to the homeland concept, but not explicit to
culture regions in general. But even as Conzen recognizes this key element he also
expresses concern about its broad generality and claims that there are many kinds of
attachment to place. While the homeland concept has been partially identified and
certain key ingredients defined, it is still a term that is widely open to interpretation. For
the purpose of this thesis, the focus will be on the attachment to place that develops when
a people mark the landscape with their “cultural imprint.” As Nostrand and Estaville
have stated “a people shape an area with their culture, and the area in turn shapes them;
feelings of attachment and belonging develop” (Nostrand and Estaville 2001, xx).
Related to these feelings of attachment is a sense of community, which as Hurt suggests,
“is of utmost importance to the homeland concept” (Hurt 2003, 22). A deepening
cultural imprint likely represents a unified social community.
While an established homeland, such as Nostrand’s Hispaño homeland, may have
achieved a level of “attachment to place” that is heightened enough to warrant inclusion as a
homeland, there are other culture regions that are still undergoing the social and economic
processes contributing to such an attachment. These areas are therefore emerging
homelands. An emerging homeland will be defined in this thesis as a type of culture region
that is evolving through time and is thus defined by the social and economic processes, rather
than the static characteristics, it exhibits. An emerging homeland is fueled by continual chain

4
migration, which serves to reinforce the cultural identity of the immigrant group as well as
inhibit assimilation into the dominant society (Hardwick 2001).
5
CHAPTER 1
RESEARCH FRAMEWORK
In 1970, Nostrand regionalized the American Southwest by delimiting “America’s
Hispanic culture region.” Nostrand based his criteria on population data as well as cultural
characteristics. Defined by Nostrand, “the borderland is more than a population region. It is
a culture region because of the intensity of a distinctive subculture, the longtime existence of
Hispanic settlements, a rich Hispanic legacy, and the presence of Anglo-Americans who have
been ‘Hispanicized’”. In order for a county to be considered part of the culture region, it had
to meet two minimum requirements: a Hispanic population of 500 persons that comprised at
least 5% of the total population. Any counties that failed to meet both criteria were
considered to be outside of the borderland.
There were six non-southwestern counties that met Nostrand’s population criteria but
were not included as outliers of the borderland region because they had not yet been
Hispanicized (a term he defines as the influence of Hispanics on non-Hispanics). As
Nostrand states, “it is true that the Hispanic population concentrations and corresponding
cultural intensities of these counties were of greater relative importance, but the Hispanic
residents of Scotts Bluff County or Yakima County, unlike their counterparts in the
borderland counties, have settled there in relatively recent times. No earlier generations of
Hispanic people left a legacy in these counties. The local residents have not been
significantly influenced by the Hispanic-American” (Nostrand 1970, 659-660).
6
At the time when Nostrand delimited the borderland region, Yakima County had a
Mexican population of 6,266 persons, accounting for 4.3% of the non-southwestern
population (southwestern states include California, Arizona, New Mexico, and Colorado).
Nostrand recognized that Yakima County was “an exception” but it was not included in the
Hispanic culture region for reasons mentioned above. However, it has been nearly 40 years
since Nostrand’s Hispanic culture region was delimited and the Hispanic population of
Yakima County has continued to grow at a rate faster than the Anglo population. Is it
possible then, that the local Anglo population has been influenced by the Mexican
population? Does the Yakima Valley now represent a culturally distinct area of Hispanic
influence?
These questions were approached by Haverluk (1992) in his PhD dissertation “Mex-
America: The Maintenance and Expansion of an American Cultural Region”. Using
Nostrand’s 5% criteria, Haverluk redefined the Hispanic-American borderland for 1990
to include Yakima County. Yakima County has therefore been established as part of a
specific culture region, one Haverluk calls Mex-America. The terms Mex-America and
Hispanic borderland encompass the same general concept of a distinct area of cultural
influence, but they vary in the specific ingredients that define this influence. While
Nostrand required a Hispanic legacy for inclusion in his borderland, Haverluk focuses on
the Hispanic imprint (Haverluk 1992). As opposed to the Hispanic legacy, which
includes things such as Spanish missions, pueblos, and presidios, the Hispanic imprint is
a contemporary phenomenon. It is associated with Hispanic political and social
organizations, Spanish language media, Mexican food items, Mexican-American
7
housescapes, and Hispanic music (Haverluk 1992). This thesis will build upon the
foundation laid by Haverluk to take the next step in the study of Yakima Valley as a
culture region: is it characterized by an assimilation rate that may lead to an emerging
homeland?
Assimilation is defined as the process by which a minority group comes to resemble,
in a variety of ways, the larger society of which it is a part (Massey and Mullan 1984).
Assimilation can occur in a variety of ways. The traditional model established by
Gordon in 1964 involves seven stages. The first stage is cultural assimilation, whereby
the minority population adopts the language and cultural practices of the host society.
The second stage is structural assimilation, in which the minority group enters primary
level interaction with the host society, contributing to social interaction between the two.
This model assumes that once structural assimilation occurs, all other stages will follow
until the minority population becomes completely absorbed by the host society (Gordon
1964). The model of spatial assimilation, formally developed by Massey in 1985, adds to
the traditional model by suggesting that there is a direct connection between cultural,
economic, and spatial assimilation. The model is based on the assumption that as
immigrants become more familiar with the host country’s culture and begin to earn more
money, they become more geographically mobile. As their socio-economic status
improves, immigrants tend to move away from areas of ethnic concentration, into
neighborhoods dominated by a non-immigrant population. Once this residential
integration (or spatial assimilation) occurs it is possible for primary level interaction to
begin between the immigrants and non-immigrants (Allen and Turner 1996).
8
Spatial assimilation, like the other types of assimilation, has a negative correlation
with homeland formation. As Hurt describes, “if at least partial social or spatial
segregation is not achieved, exclusivity will be lost and the homeland group will
eventually assimilate into the dominant group.” Residential segregation enables an
ethnic group to keep their social life partially separated from the dominant culture, which
helps maintain a unified social community (Hurt 2003, 22).
Conceptual Structure
Haverluk (1998) classified three different types of Hispanic communities based on
their assimilation rates: continuous, discontinuous, and new. Continuous communities
are defined as those that were founded by Hispanics and in which Hispanics have always
been the majority population. Continuous communities correspond to the traditional
Hispanic homelands of Texas, New Mexico, Arizona, and California. Discontinuous
communities were originally settled by Hispanics, but eventually filled by a minority
population. New communities are those that are dominated by Anglos and in which
Hispanics are recent immigrants. New communities are assumed to have the highest rate
of assimilation in part because they do not maintain the use of Spanish in the home.
Haverluk classified the Hispanic settlement areas of Yakima Valley as new communities
based on settlement patterns, Hispanic elected officials, and the percentage of Hispanic
professionals. He therefore concluded that they would be characterized by a high rate of
assimilation. However, these communities are an exception to the model because, as
Haverluk admits, they have a high Spanish language retention rate, which is characteristic
9
of continuous communities. The question then remains as to whether or not the new
communities of the Yakima Valley are following the predicted model of growth and
assimilation. And, as Haverluk speculates, “if a new community can attain levels of
political and social influence equivalent to continuous communities, then many
assumptions about minority assimilation in the U.S. must be reevaluated” (Haverluk
1998, 479).
Williams and Ortega (1990) found that, contrary to other minority groups in the U.S.,
Mexican Americans tend to be much less culturally assimilated and somewhat more
structurally assimilated. This thesis will explore whether or not this is the situation in the
Yakima Valley. It is hypothesized that Hispanization of the Yakima Valley is increasing
(a condition that negates cultural assimilation), while at the same time, Hispanics in the
area may be assimilating structurally. This further supports the idea that in order for
Hispanization to increase, assimilation must not follow the traditional model. If, in fact,
Hispanics are not culturally assimilating, but are structurally assimilating, can the
Yakima Valley be considered an emerging homeland? Is it possible for Hispanics to
maintain a unified social identity while their interactions with the Anglo society are
increasing? There are two characteristics of the Yakima Valley that may serve to
strengthen Hispanic identity despite a degree of structural assimilation: continual
immigration and a Hispanic majority. As previously mentioned, continual immigration
reinforces cultural identity and inhibits assimilation (Hardwick 2001). A Hispanic
majority may foster community ties within the ethnic group and contribute to a stronger
support network that is purely Hispanic. Anglo residents may also be influenced by the
10
Mexican majority, contributing to a sense of place that is more closely tied to Hispanics
than to Anglos.
The expression of the Hispanic imprint in a community can be interpreted as a direct
measurement of the assimilation rate (Haverluk 2003). If assimilation is occurring
quickly, there is less likely to be a concrete, visible representation of the ethnic group as
being distinct from the host society. However, if the Hispanic population is retaining
their cultural characteristics as separate and apart from the host society, then this situation
will be apparent in the landscape of that community. The Hispanic imprint contributes to
the development of a homeland because as stated by Roark “a homeland is an area that is
identified by an ethnic group as its own” (Roark 1993, 6). The greater the Hispanic
imprint, the stronger the association between an ethnic group and the land.
Research Questions
The following questions are each expected to contribute to an assessment of
Hispanic assimilation and thus homeland development in the Yakima Valley.
1. Are Hispanics in the Yakima Valley culturally assimilating into Anglo society?
2. Are Hispanics in the Yakima Valley structurally assimilating into the Anglo society?
3. Has the Hispanic imprint changed over time with the growing Mexican population?
4. Does social integration lead to structural assimilation or to Hispanization?
5. Do Hispanics in these communities exhibit characteristics of an emerging homeland?
a. If so, what implications does this have for policy and planning considerations?
11
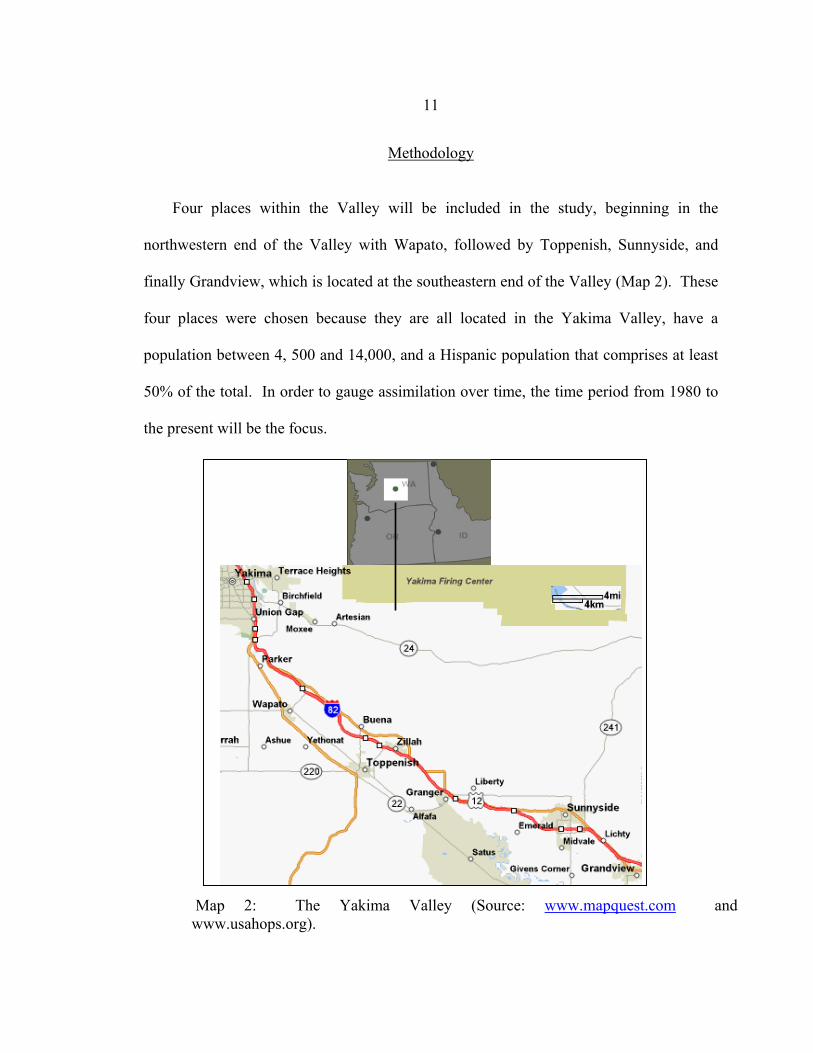
Methodology
Four places within the Valley will be included in the study, beginning in the
northwestern end of the Valley with Wapato, followed by Toppenish, Sunnyside, and
finally Grandview, which is located at the southeastern end of the Valley (Map 2). These
four places were chosen because they are all located in the Yakima Valley, have a
population between 4, 500 and 14,000, and a Hispanic population that comprises at least
50% of the total. In order to gauge assimilation over time, the time period from 1980 to
the present will be the focus.
Map 2: The Yakima Valley (Source: www.mapquest.com and www.usahops.org).
12
Five different aspects of each community will be analyzed: population
characteristics, economic conditions, social integration, cultural retention, and landscape
imprint. Population characteristics include general demographic conditions such as age
and sex structure, and country of birth. Economic conditions include downtown
businesses owned by Hispanics, education, and Hispanic income levels. Cultural
retention includes Spanish language retention and Hispanic social organizations. Social
integration will be based on spatial assimilation (residential segregation) and the degree
of social interaction between the Hispanic population and the Anglo population. The
Hispanic imprint, as defined by Haverluk (1992), includes Spanish language media,
Mexican food, music, Mexican-American housescapes, and Spanish language signage.
The objective in analyzing these variables is to establish a connection between them
and different types of assimilation of Hispanics in the above-mentioned communities of
the Yakima Valley. The variables will be analyzed through field investigations and GIS
analysis and an assessment will be made regarding their avenues of assimilation as a
whole. This analysis of the connections between the above mentioned variables and
different avenues of assimilation leads to a deeper understanding of how the residents of
these communities form an identity, which in turn leads to the creation and recreation of
space in these communities. For example, a high level of cultural retention, such as
Spanish language usage, creates a uniquely Hispanic space. This could exist physically,
as in the case of Hispanic businesses, or ephemerally, as in the case of Spanish language
radio programs. Either way, a social space is created that Hispanics, and only Hispanics,
identify with. This identification is a direct reflection of how assimilation is occurring or,
13
in the example described here, how it is not occurring. This creation of identity and place
explains how Hispanics relate to the broader communities in which they live, and also
gives a sense of the level of attachment they feel for such places. It is these dynamics
that lead to the viability of a place as an emerging homeland. If the communities studied
in this thesis exhibit pattern of assimilation that contributes to the creation of Hispanic
identity and Hispanic spaces, then the region of the Yakima Valley is steadily emerging
into a homeland for its growing Hispanic population.
Data Sources
Data will be obtained from the United States Bureau of the Census, independent field
investigations, as well as secondary sources.
Census Data
Information to be obtained from the U.S. Bureau of the Census includes economic,
educational, and demographic characteristics. The economic characteristics to be
researched are employment sector, median income, household income, per capita income,
and families below the poverty level. Information on education will be based on different
levels of educational attainment, ranging from less than a ninth grade education to a
graduate or professional degree. Demographic characteristics include country of origin,
foreign-born status, sex, age, and Spanish speaking. Data will be collected for the ethnic
categories of Hispanic, Mexican, non-Hispanic, and white-alone (which does not include
Hispanics). Census data will be collected from 1980, 1990, and 2000 at three different
14
spatial scales: block group, place, and county. Information used in the GIS analysis
portion of this research will also be collected from the United States Census at the block
group and census tract levels.
Field Investigations
Variables to be researched through field investigation include downtown businesses
owned by Hispanics, education, social interaction between Hispanics and non-Hispanics,
Hispanic media and the Hispanic imprint. Downtown businesses will be researched
based on the type and size of store, the clientele they serve, and signage. Educational
variables will consist of the methods used to deal with the volume of non-English
speaking students in most of the classrooms in the Valley. This information will be
obtained through personal interviews with schoolteachers as well as personal contact with
administrators. Interviews will be conducted with the chamber of commerce in each
town for information on changes in the number of Hispanic owned businesses and the
degree of social interaction between Hispanics and non-Hispanics in the business
community. Another avenue used to explore social integration will be through local
churches and restaurants. Hispanic media will be explored through personal interviews
with employees at the Valley’s Spanish language newspapers and the most long standing
Spanish language radio station, Radio KDNA. Issues of circulation, composition, and
community outreach will be discussed. Several different field approaches will be
undertaken to research the Hispanic imprint. A “shopping list” developed by Haverluk
will be used as a guide in local stores in each community to determine the availability of
15
Mexican food items. Mexican housescapes (a house and its immediate surroundings)
will be identified based on housing characteristics that have been established by Arreola
(1988) and Benedict and Kent (2004) to be uniquely associated with Mexicans. These
include fenced enclosures, bright colors, and a manicured flower garden. Spanish
language signage will also be noted.
Secondary Sources
In addition to the previously mentioned data sources, two newspaper series that
ran in the Yakima Herald Republic will provide supplementary information for this
thesis. The first one is titled “Neighbors/Vecinos” and ran for a week in 1995. The
second, titled “Race Relations in the Valley,” ran for a week in 2000. These two series
provide an in-depth look at the Hispanic population in the Valley as well as race relations
between Hispanics and non-Hispanics. They will be discussed in detail in later chapters.
Various websites will also be used to supplement information gathered through fieldwork
investigations such as Hispanic music, festivals, and art.
16
CHAPTER 2
HISPANICS IN THE UNITED STATES
The term Hispanic is a uniquely American word. A Cuban woman living in her
home country does not consider herself Hispanic, nor is it likely that any of her fellow
countrymen would. However, once she arrives on the shores of the United States, she is
classified as Hispanic. Hispanic is considered a pan-ethnic term, in that it groups
together people from various backgrounds and cultures into one umbrella description.
The term is sometimes criticized for blurring cultural distinctiveness because the only
commonality that really unites people from “Hispanic countries” is the Spanish language.
However, there have been efforts by Hispanics to unite under this pan-ethnic
identity. Sommers (1991) describes the use of local fiestas and other avenues of cultural
performance as a uniting force for Hispanics. She claims that the festival in particular
serves as a unifying event because street celebrations are common throughout Latin
America. Whatever the acceptance or rejection of this pan-ethnic term may be, it is
necessary to be aware that it may bring with it negative, as well as positive, connotations.
This is especially important as immigrant groups from Spanish speaking countries other
than Mexico begin to increase. Historically, Mexicans have dominated the immigrant
stream, followed by Puerto Ricans, then Cubans (Sandefur et al 2001).
This chapter will focus on Mexicans because they are the predominant background
of the Hispanics in the lower Yakima Valley. It will then progress to national and
regional trends, and broaden the scope to the Hispanic population. Where possible, this
17
discussion aims to be culturally specific and at least distinguish between Mexicans and
other Hispanics, but this is difficult because many population characteristics available
from the U.S. Census are classified under the term Hispanic. Because Hispanic is the
term employed by the U.S. Census Bureau it is also the term employed by a great deal of
the literature on immigration and ethnic change.
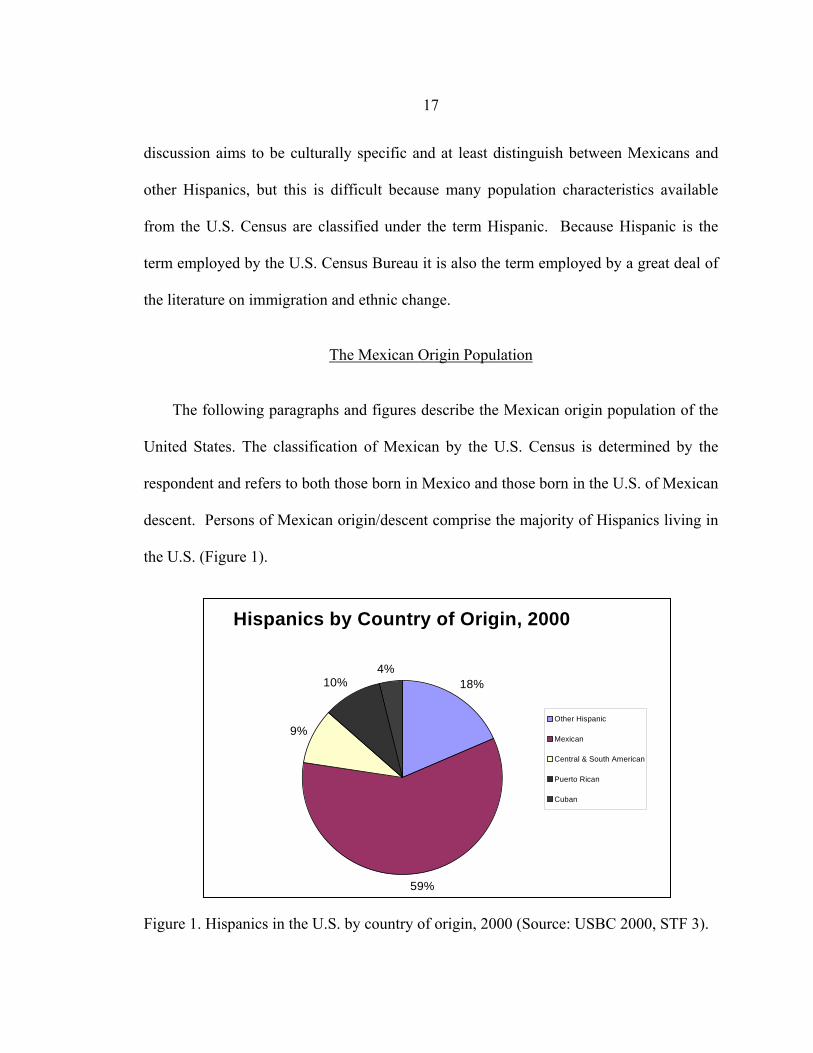
The Mexican Origin Population
The following paragraphs and figures describe the Mexican origin population of the
United States. The classification of Mexican by the U.S. Census is determined by the
respondent and refers to both those born in Mexico and those born in the U.S. of Mexican
descent. Persons of Mexican origin/descent comprise the majority of Hispanics living in
the U.S. (Figure 1).
Figure 1. Hispanics in the U.S. by country of origin, 2000 (Source: USBC 2000, STF 3).
Hispanics by Country of Origin, 2000
18%
59%
9%
10%4%
Other Hispanic
Mexican
Central & South American
Puerto Rican
Cuban
18
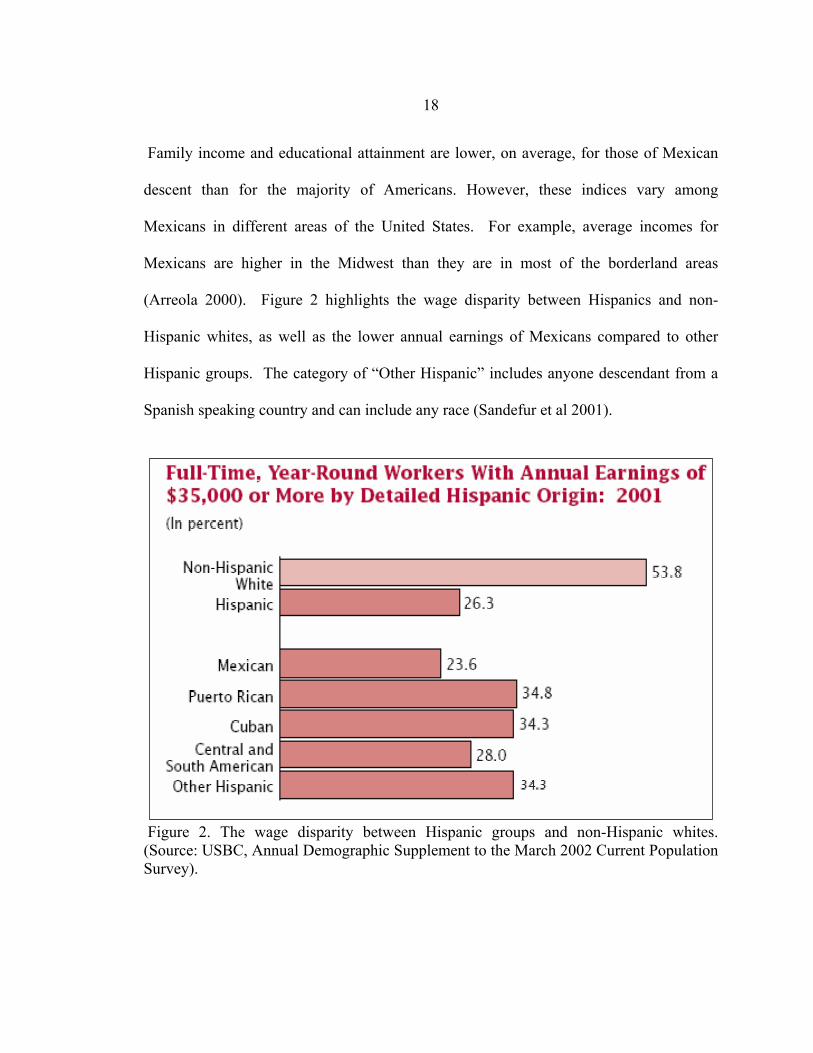
Family income and educational attainment are lower, on average, for those of Mexican
descent than for the majority of Americans. However, these indices vary among
Mexicans in different areas of the United States. For example, average incomes for
Mexicans are higher in the Midwest than they are in most of the borderland areas
(Arreola 2000). Figure 2 highlights the wage disparity between Hispanics and non-
Hispanic whites, as well as the lower annual earnings of Mexicans compared to other
Hispanic groups. The category of “Other Hispanic” includes anyone descendant from a
Spanish speaking country and can include any race (Sandefur et al 2001).
Figure 2. The wage disparity between Hispanic groups and non-Hispanic whites. (Source: USBC, Annual Demographic Supplement to the March 2002 Current Population Survey).
19
Data from the 1990s suggests the existence of a labor sector imbalance that has
changed little over the past fifteen years. Mexicans are underrepresented in managerial,
professional, technical, and administrative jobs, while they are overrepresented in
farming, forestry, and fishing occupations. Employment in these lower paying jobs helps
to explain the wage disparity (Camarota 2001).
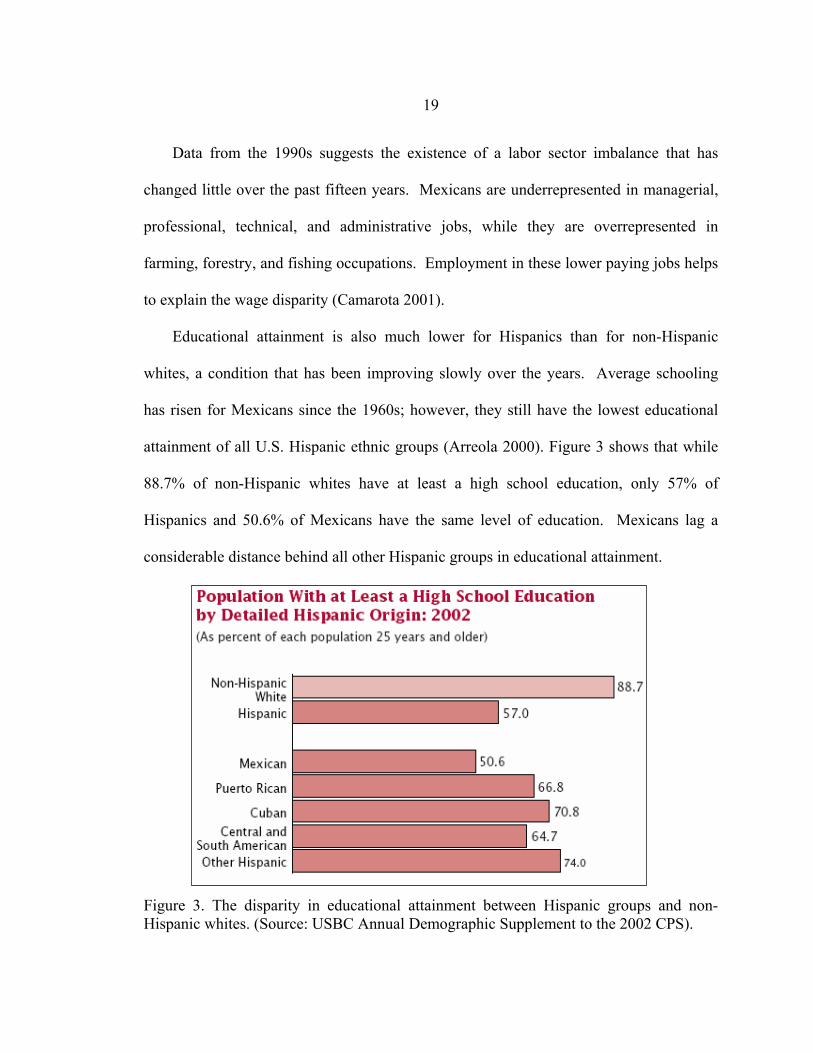
Educational attainment is also much lower for Hispanics than for non-Hispanic
whites, a condition that has been improving slowly over the years. Average schooling
has risen for Mexicans since the 1960s; however, they still have the lowest educational
attainment of all U.S. Hispanic ethnic groups (Arreola 2000). Figure 3 shows that while
88.7% of non-Hispanic whites have at least a high school education, only 57% of
Hispanics and 50.6% of Mexicans have the same level of education. Mexicans lag a
considerable distance behind all other Hispanic groups in educational attainment.
Figure 3. The disparity in educational attainment between Hispanic groups and non-Hispanic whites. (Source: USBC Annual Demographic Supplement to the 2002 CPS).
20
Immigrants as a Percentage of U.S. Population
13.614.7
13.211.6
8.86.9
5.4 4.76.2
7.9
10.4
0
2
4
6
8
10
12
14
16
1900 1910 1920 1930 1940 1950 1960 1970 1980 1990 2000
Year
Per
cent
age
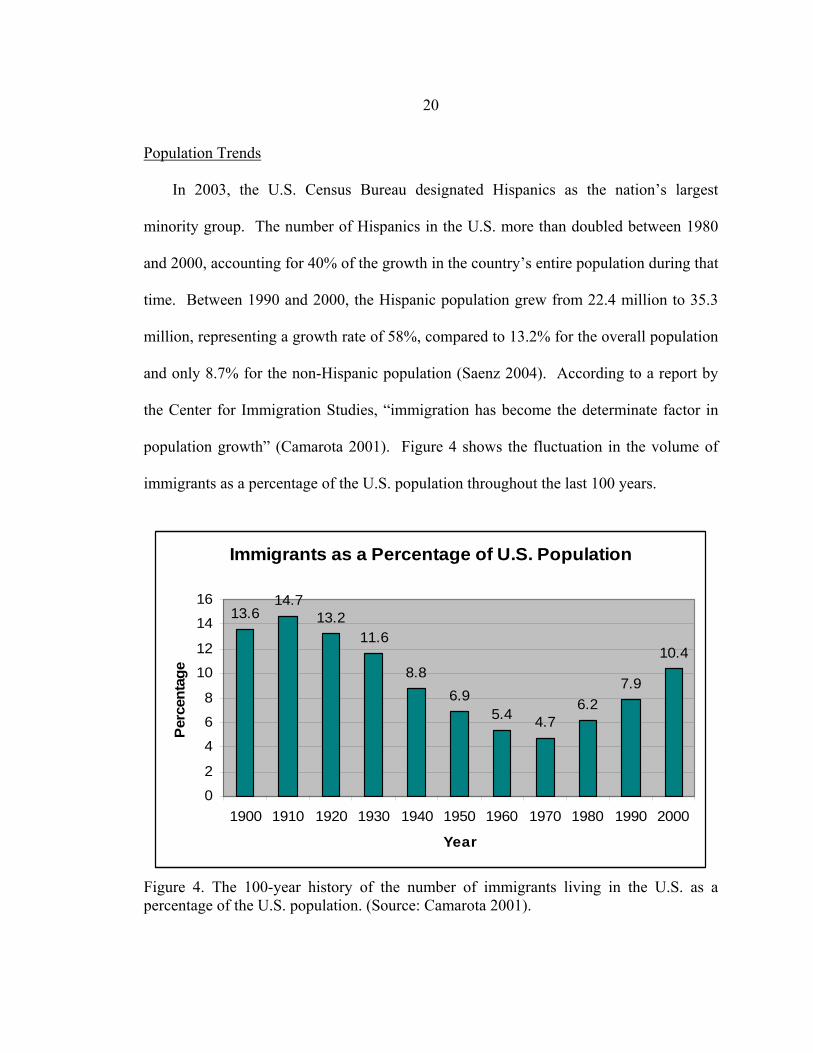
Population Trends In 2003, the U.S. Census Bureau designated Hispanics as the nation’s largest
minority group. The number of Hispanics in the U.S. more than doubled between 1980
and 2000, accounting for 40% of the growth in the country’s entire population during that
time. Between 1990 and 2000, the Hispanic population grew from 22.4 million to 35.3
million, representing a growth rate of 58%, compared to 13.2% for the overall population
and only 8.7% for the non-Hispanic population (Saenz 2004). According to a report by
the Center for Immigration Studies, “immigration has become the determinate factor in
population growth” (Camarota 2001). Figure 4 shows the fluctuation in the volume of
immigrants as a percentage of the U.S. population throughout the last 100 years.
Figure 4. The 100-year history of the number of immigrants living in the U.S. as a percentage of the U.S. population. (Source: Camarota 2001).
21
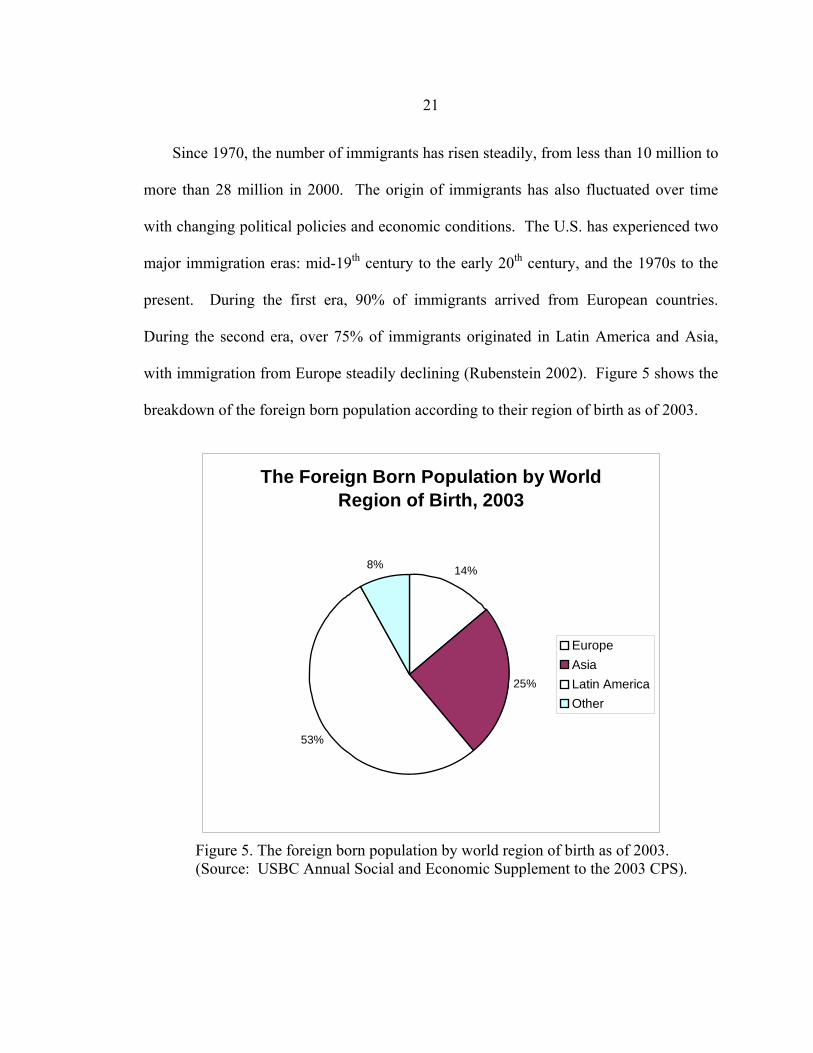
Since 1970, the number of immigrants has risen steadily, from less than 10 million to
more than 28 million in 2000. The origin of immigrants has also fluctuated over time
with changing political policies and economic conditions. The U.S. has experienced two
major immigration eras: mid-19th century to the early 20th century, and the 1970s to the
present. During the first era, 90% of immigrants arrived from European countries.
During the second era, over 75% of immigrants originated in Latin America and Asia,
with immigration from Europe steadily declining (Rubenstein 2002). Figure 5 shows the
breakdown of the foreign born population according to their region of birth as of 2003.
Figure 5. The foreign born population by world region of birth as of 2003. (Source: USBC Annual Social and Economic Supplement to the 2003 CPS).
The Foreign Born Population by World Region of Birth, 2003
14%
25%
53%
8%
EuropeAsiaLatin AmericaOther
22
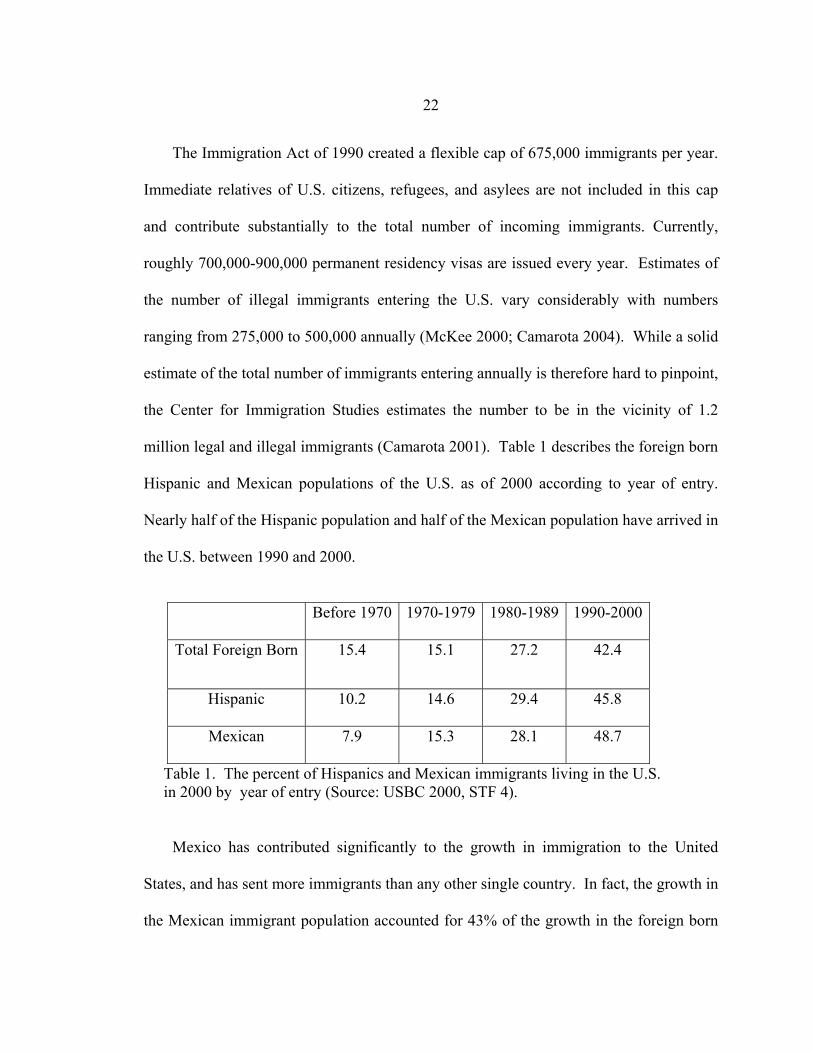
The Immigration Act of 1990 created a flexible cap of 675,000 immigrants per year.
Immediate relatives of U.S. citizens, refugees, and asylees are not included in this cap
and contribute substantially to the total number of incoming immigrants. Currently,
roughly 700,000-900,000 permanent residency visas are issued every year. Estimates of
the number of illegal immigrants entering the U.S. vary considerably with numbers
ranging from 275,000 to 500,000 annually (McKee 2000; Camarota 2004). While a solid
estimate of the total number of immigrants entering annually is therefore hard to pinpoint,
the Center for Immigration Studies estimates the number to be in the vicinity of 1.2
million legal and illegal immigrants (Camarota 2001). Table 1 describes the foreign born
Hispanic and Mexican populations of the U.S. as of 2000 according to year of entry.
Nearly half of the Hispanic population and half of the Mexican population have arrived in
the U.S. between 1990 and 2000.
Before 1970 1970-1979 1980-1989 1990-2000
Total Foreign Born 15.4 15.1 27.2 42.4
Hispanic 10.2 14.6 29.4 45.8
Mexican 7.9 15.3 28.1 48.7
Table 1. The percent of Hispanics and Mexican immigrants living in the U.S. in 2000 by year of entry (Source: USBC 2000, STF 4).
Mexico has contributed significantly to the growth in immigration to the United
States, and has sent more immigrants than any other single country. In fact, the growth in
the Mexican immigrant population accounted for 43% of the growth in the foreign born
23
population between 1990 and 2000. As a share of the number of immigrants in 2000,
Mexican immigrants account for nearly 30% of the total, almost double their 1980 share
of 16% (Camarota and McArdle 2003).
Geographic Trends
The geographic distribution of Mexicans is important to consider for several reasons.
Disparities in educational attainment and income between Mexicans and non-Hispanic
whites (See Figures 1 and 2) suggest that areas of high Mexican populations are the same
places that require more attention to education and job development. There are two
factors that greatly influence where Mexicans settle: economic opportunity and an
established Mexican population. Awareness of these factors may help indicate where
Hispanic populations may grow in the future and therefore where services may need to be
established.
Geographically, Mexican immigrants are a highly concentrated population. Almost
half (48.2%) live in California compared to 24.3% for non-Mexican immigrants.
Combined together, California, Texas, Arizona, and New Mexico account for 72.3% of
the Mexican immigrant population in the U.S. (Map 3).
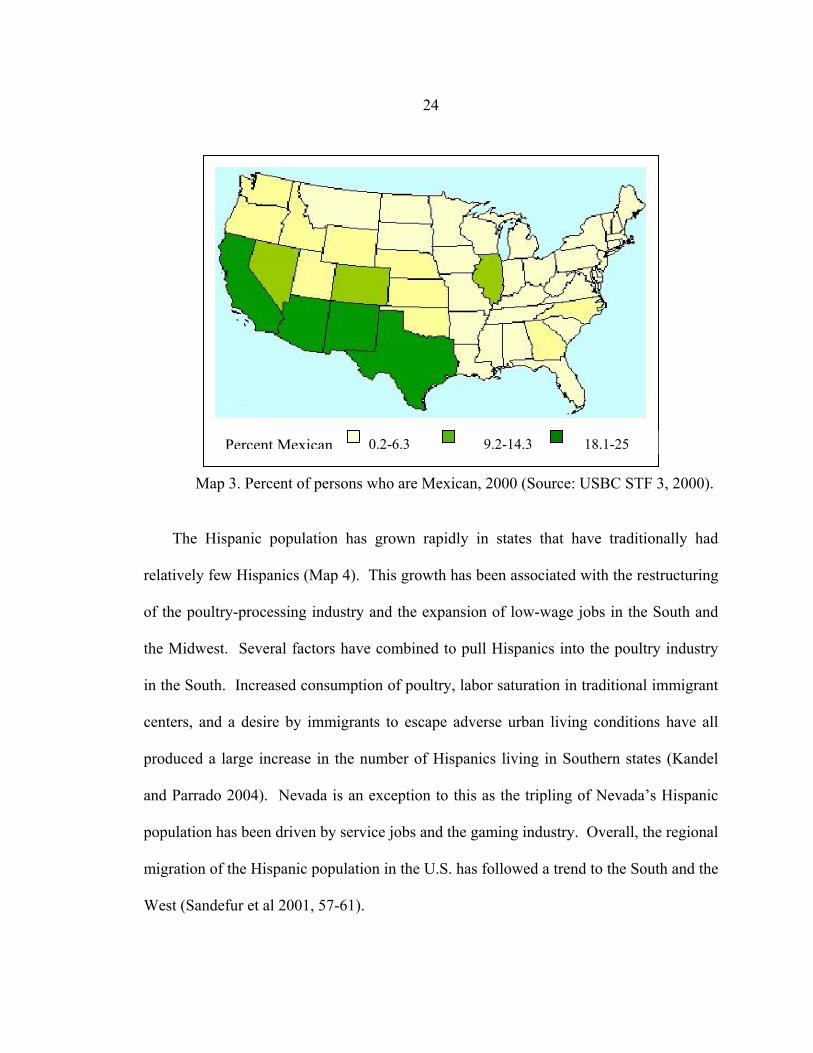
24
Map 3. Percent of persons who are Mexican, 2000 (Source: USBC STF 3, 2000).
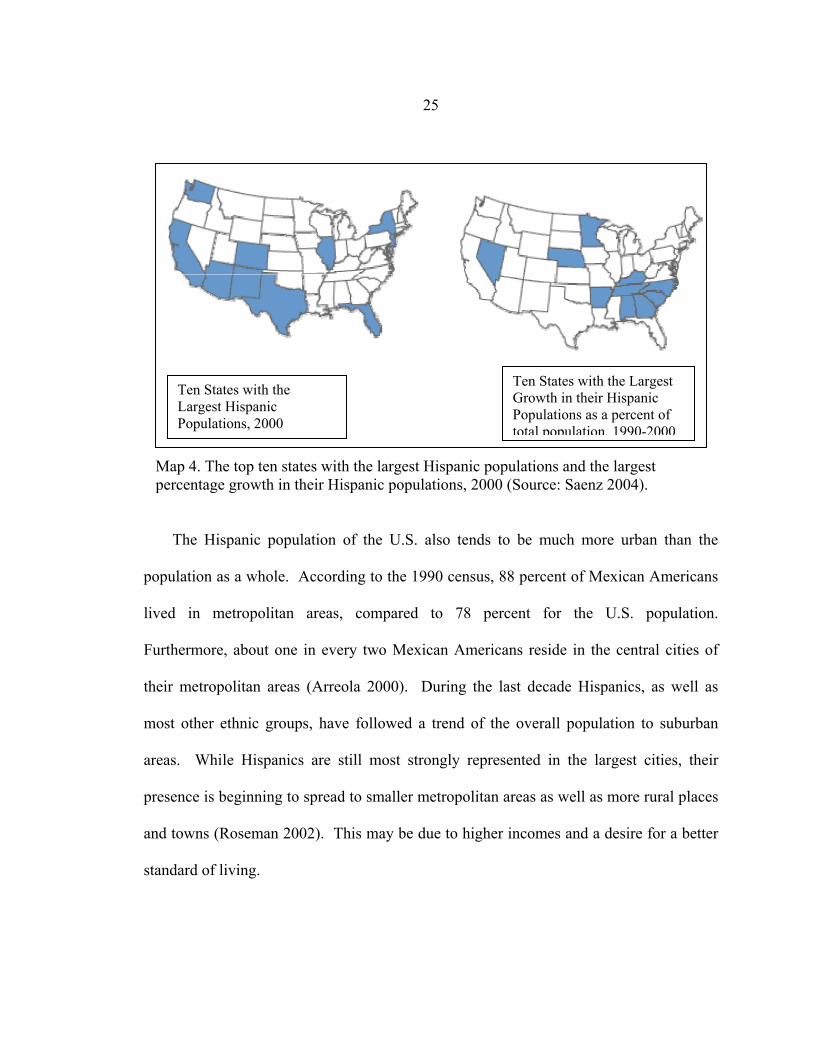
The Hispanic population has grown rapidly in states that have traditionally had
relatively few Hispanics (Map 4). This growth has been associated with the restructuring
of the poultry-processing industry and the expansion of low-wage jobs in the South and
the Midwest. Several factors have combined to pull Hispanics into the poultry industry
in the South. Increased consumption of poultry, labor saturation in traditional immigrant
centers, and a desire by immigrants to escape adverse urban living conditions have all
produced a large increase in the number of Hispanics living in Southern states (Kandel
and Parrado 2004). Nevada is an exception to this as the tripling of Nevada’s Hispanic
population has been driven by service jobs and the gaming industry. Overall, the regional
migration of the Hispanic population in the U.S. has followed a trend to the South and the
West (Sandefur et al 2001, 57-61).
Percent Mexican 0.2-6.3 9.2-14.3 18.1-25
25
Map 4. The top ten states with the largest Hispanic populations and the largest percentage growth in their Hispanic populations, 2000 (Source: Saenz 2004). The Hispanic population of the U.S. also tends to be much more urban than the
population as a whole. According to the 1990 census, 88 percent of Mexican Americans
lived in metropolitan areas, compared to 78 percent for the U.S. population.
Furthermore, about one in every two Mexican Americans reside in the central cities of
their metropolitan areas (Arreola 2000). During the last decade Hispanics, as well as
most other ethnic groups, have followed a trend of the overall population to suburban
areas. While Hispanics are still most strongly represented in the largest cities, their
presence is beginning to spread to smaller metropolitan areas as well as more rural places
and towns (Roseman 2002). This may be due to higher incomes and a desire for a better
standard of living.
Ten States with the Largest Growth in their Hispanic Populations as a percent of total population, 1990-2000
Ten States with the Largest Hispanic Populations, 2000
26
Future Projections The release of data from the 2000 Census caused a flurry of projections to be made
about the growth of the Hispanic community in the U.S. Prior to 2000, many
publications estimated that by 2050, Hispanics would constitute the nation’s largest
minority. However, data from the Current Population Survey revealed that in 2003,
Hispanics became the largest minority group in the U.S., a dramatic increase from
established estimates (Camarillo and Bonilla 2001).
Minority populations have been increasing their presence in the U.S. over the last
several decades, but it is Hispanics that are driving the demographic transformations
currently underway. Today, one of every eight residents of the U.S. is Hispanic, a
number that is predicted to rise to one of every four by 2055, and one of every three by
2100. Ongoing immigration, a high birth rate, and young age structure are responsible
for this unprecedented growth in the Hispanic population of the U.S. (Camarota 2001).
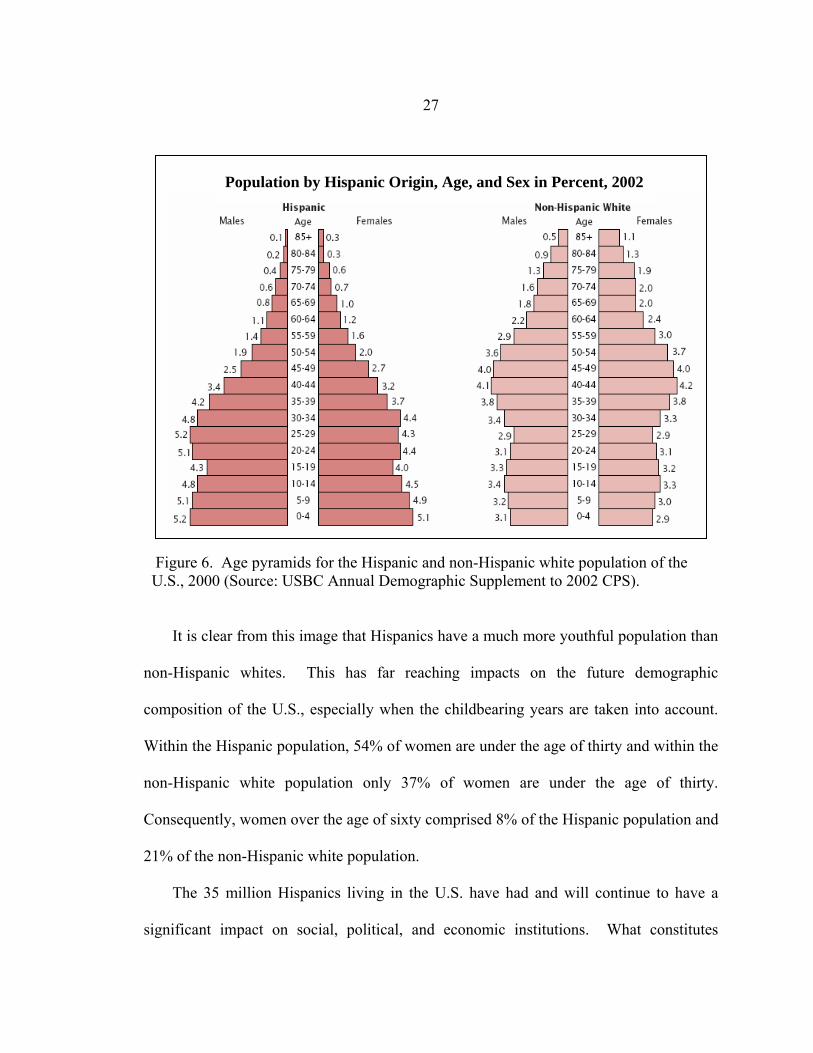
Figure 6 shows the difference between the age pyramid for Hispanics and non-Hispanic
whites. The numbers labeling each horizontal bar represent the percentage of each sex
and ethnicity in a particular age bracket.
27
Figure 6. Age pyramids for the Hispanic and non-Hispanic white population of the U.S., 2000 (Source: USBC Annual Demographic Supplement to 2002 CPS). It is clear from this image that Hispanics have a much more youthful population than
non-Hispanic whites. This has far reaching impacts on the future demographic
composition of the U.S., especially when the childbearing years are taken into account.
Within the Hispanic population, 54% of women are under the age of thirty and within the
non-Hispanic white population only 37% of women are under the age of thirty.
Consequently, women over the age of sixty comprised 8% of the Hispanic population and
21% of the non-Hispanic white population.
The 35 million Hispanics living in the U.S. have had and will continue to have a
significant impact on social, political, and economic institutions. What constitutes
Population by Hispanic Origin, Age, and Sex in Percent, 2002
28
“Hispanic” and the Hispanic experience itself is greatly influenced by continual
immigration, which reinforces the Spanish language and other cultural dimensions of
immigrant sending countries (Saenz 2004). As the Hispanic population in the U.S.
continues to grow, the Hispanic influence on American society will grow as well. It is
therefore imperative that we gain a stronger understanding and sensitivity to exactly what
this influence entails. This thesis is an attempt to do just that.
29
CHAPTER 3
EVOLUTION OF HISPANICS IN THE YAKIMA VALLEY In April 1943 a group of 250 Mexican laborers arrived by train in the Yakima
Valley. They were the first in a stream of thousands that entered the Valley under the
Bracero Program to alleviate the area’s agricultural labor shortage resulting from World
War II (Gamboa 1981). What these workers brought with them was more than just their
“helping hands”. With them came their language, cultural traditions, and social values
which were slowly transposed to the fields and communities in which they worked. This
chapter describes how the Bracero Program established a Mexican population in the
Yakima Valley, beginning a transformation of those communities that continues today.
The Yakima Valley is one of the nation’s top agricultural centers. However, this
area was not always so productive. When central Washington was first settled at the end
of the 19th century, homesteaders tried their luck with dry land farming. Despite
numerous small-scale irrigation schemes to increase productivity, most farmers did not
succeed and the population continued to decline for many years (United States
Department of the Interior 1964). In contrast to the failed attempts of the surrounding
region, residents of the Yakima Valley successfully negotiated the Yakima Project in
1903. The Project, which began in 1906, was a series of diversions and dams that
continued to be constructed through 1975. Overall, the Yakima Project reclaimed half a
million acres and set the Valley apart from the struggling region surrounding it.
30
The agricultural potential and population decline of the rest of central Washington
did not go unnoticed, however. Following the Great Depression, the hand of the federal
government began to re-shape the region with the construction of Grand Coulee Dam in
1933. Building of the dam provided an economic opportunity and rekindled the dream of
a land of endless possibilities that had died with the failure of dry land farming over the
preceding 40 years. Along with Grand Coulee Dam came population growth, economic
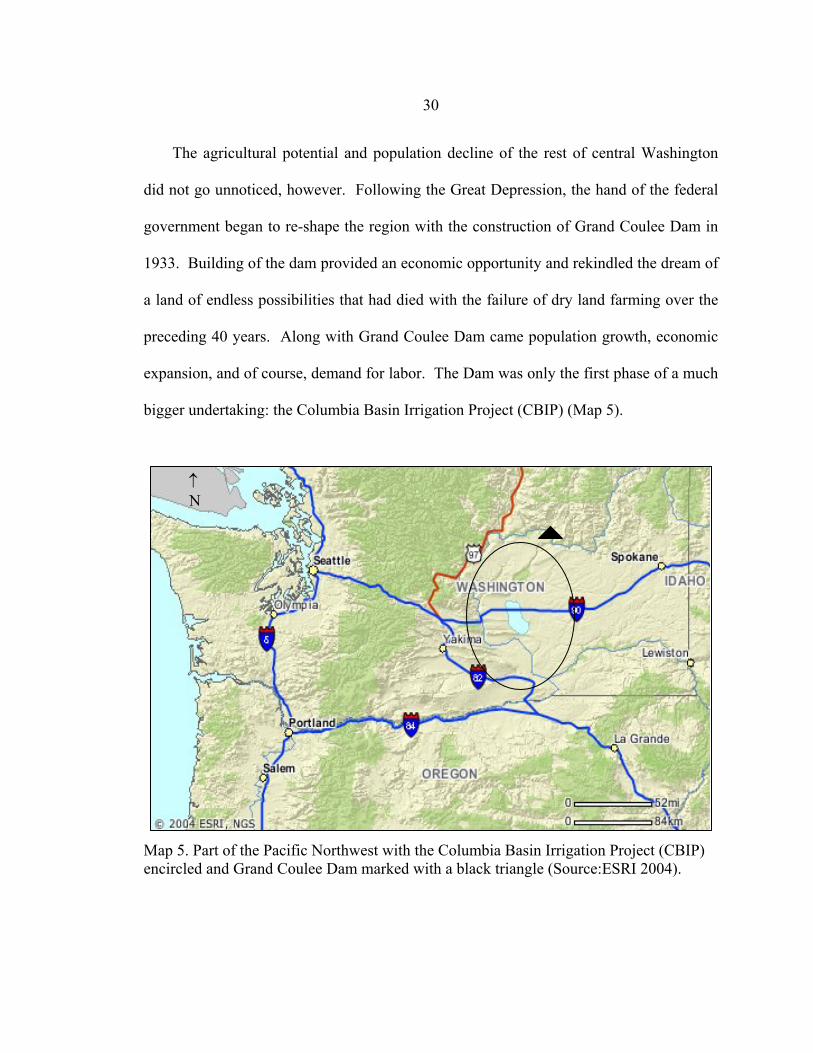
expansion, and of course, demand for labor. The Dam was only the first phase of a much
bigger undertaking: the Columbia Basin Irrigation Project (CBIP) (Map 5).
Map 5. Part of the Pacific Northwest with the Columbia Basin Irrigation Project (CBIP) encircled and Grand Coulee Dam marked with a black triangle (Source:ESRI 2004).
↑ N
31
In the words of the United States Department of Interior (1964), the purpose of the CBIP
was to “harness the power of a great river and reclaim a desert wasteland.” The CBIP has
been very successful in its goal of creating a productive agricultural region, irrigating
over a million acres since 1948. The construction boom spurred by Grand Coulee Dam
continued as the CBIP progressed and provided central Washington with continual
growth well into the 1950s (United States Department of the Interior 1964).
World War II and the Farm Labor Shortage
While the CBIP was instrumental to the transformation of central Washington, it of
course did not occur in isolation. Forces larger than the federal government entered the
picture when World War II began in 1939. The effort to win the war had two major
effects that were felt in agricultural areas throughout the Pacific Northwest: an increase in
the demand for agricultural products and a decrease in the supply of labor. The call for
increased farm production began roughly in the autumn of 1940 when the United States
increased their involvement in the war and the Lend Lease Act was passed, defining
agricultural commodities as munitions of war (Gamboa 1984). Various efforts were
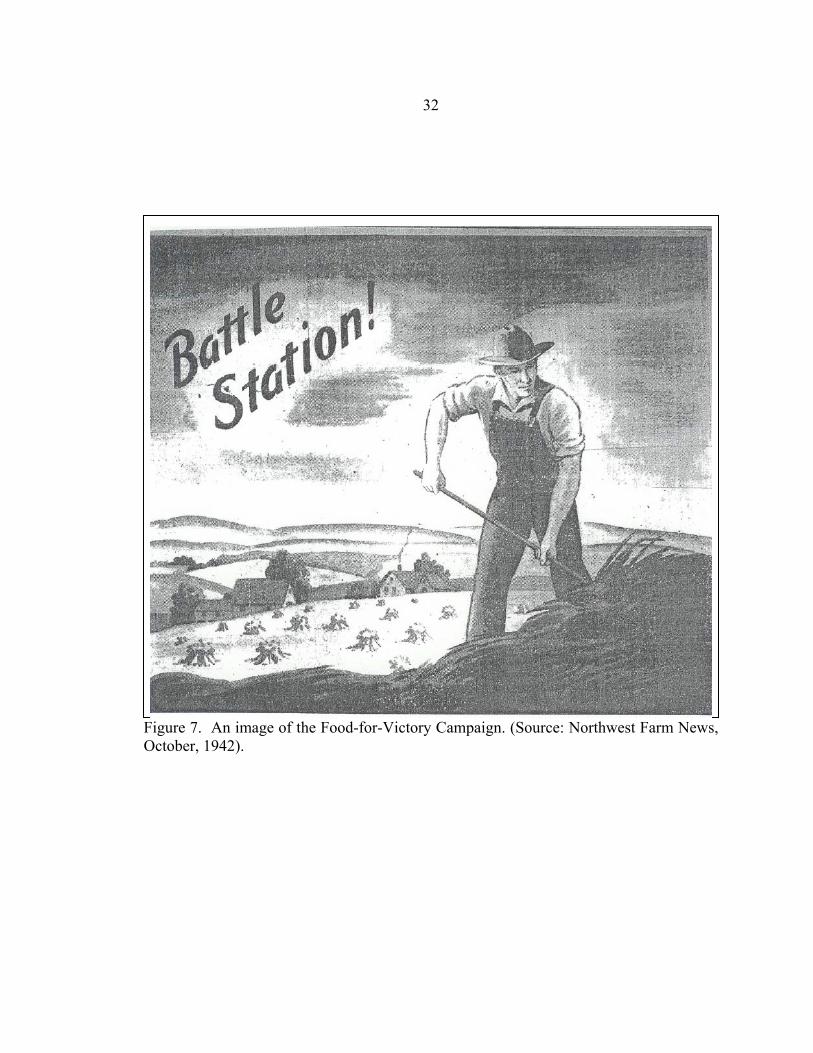
undertaken to encourage crop production for export to troops in Europe as well as
conservation of necessary war supplies on the domestic front. The Food-for-Victory
campaign was launched for these purposes and played upon a patriotic tone, paralleling
food production with winning the war. The images below reveal insight about the
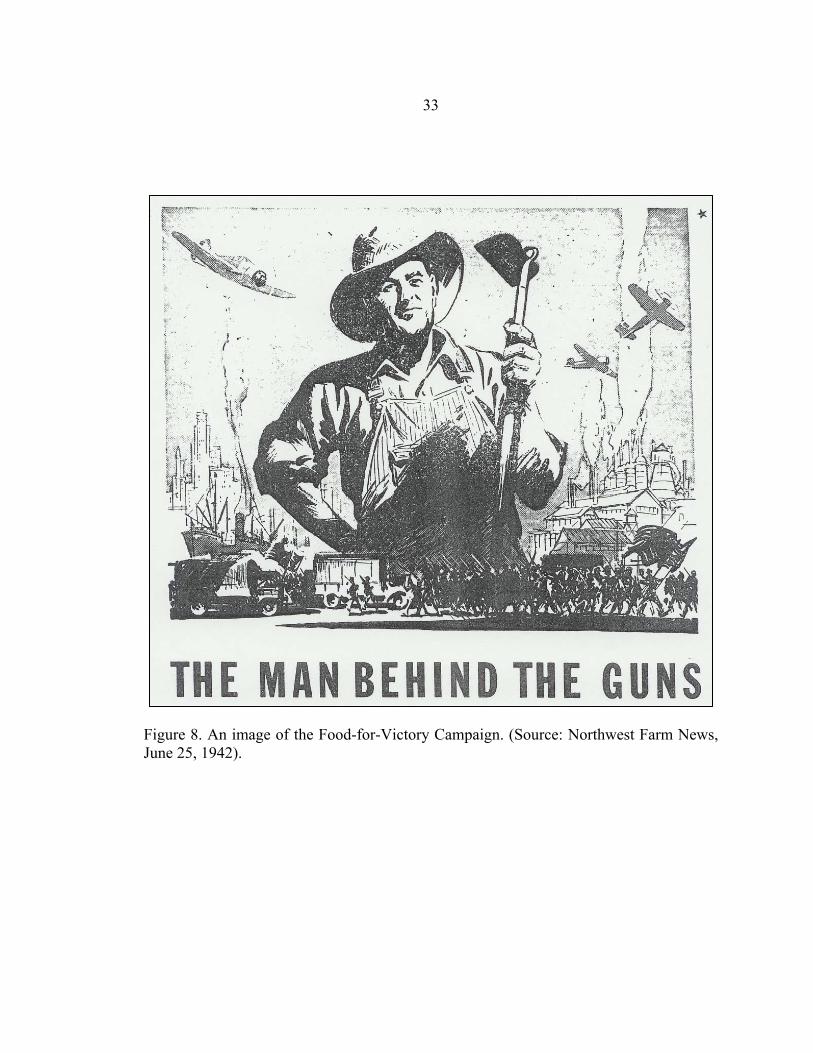
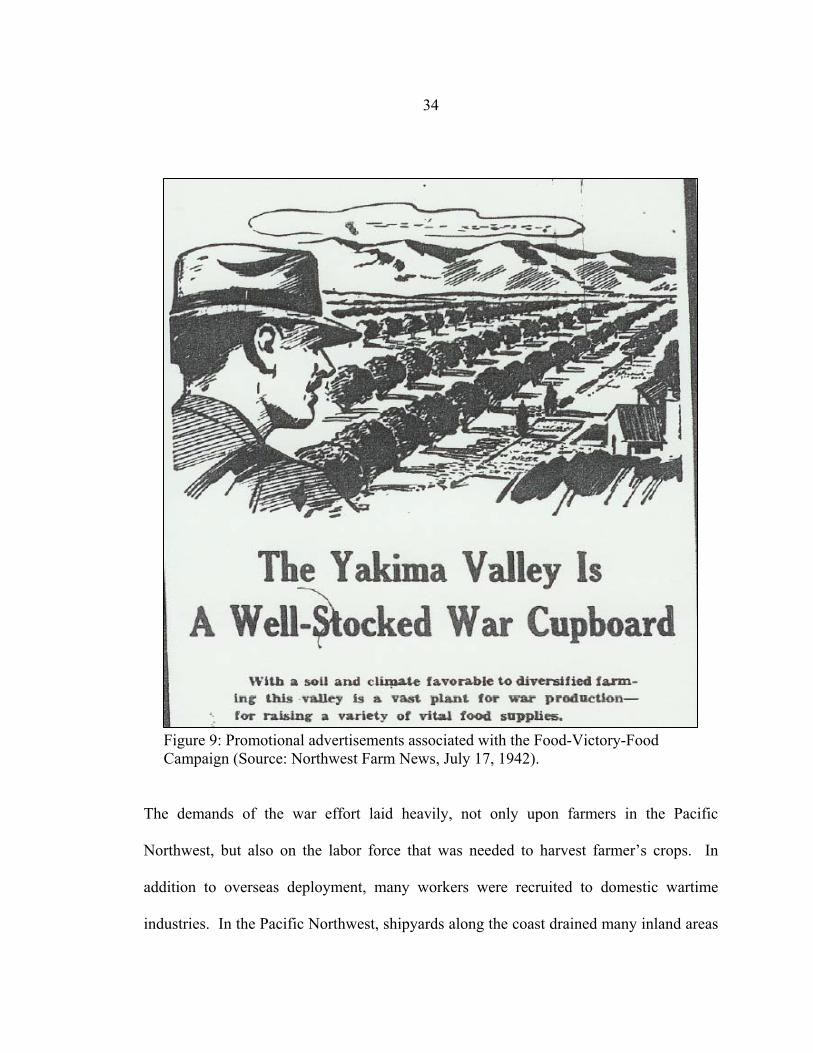
pressures placed on farmers during the war (Figures 7, 8, and 9).
32
Figure 7. An image of the Food-for-Victory Campaign. (Source: Northwest Farm News, October, 1942).
33
Figure 8. An image of the Food-for-Victory Campaign. (Source: Northwest Farm News, June 25, 1942).
34
Figure 9: Promotional advertisements associated with the Food-Victory-Food Campaign (Source: Northwest Farm News, July 17, 1942).
The demands of the war effort laid heavily, not only upon farmers in the Pacific
Northwest, but also on the labor force that was needed to harvest farmer’s crops. In
addition to overseas deployment, many workers were recruited to domestic wartime
industries. In the Pacific Northwest, shipyards along the coast drained many inland areas
35
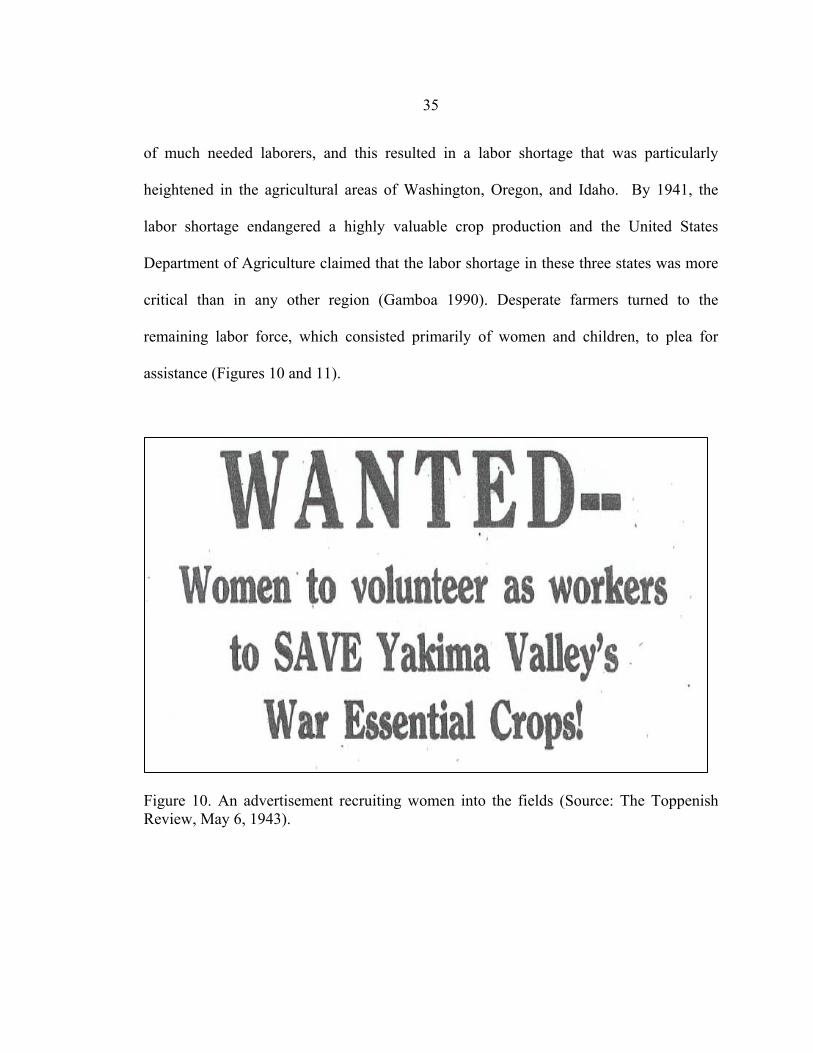
of much needed laborers, and this resulted in a labor shortage that was particularly
heightened in the agricultural areas of Washington, Oregon, and Idaho. By 1941, the
labor shortage endangered a highly valuable crop production and the United States
Department of Agriculture claimed that the labor shortage in these three states was more
critical than in any other region (Gamboa 1990). Desperate farmers turned to the
remaining labor force, which consisted primarily of women and children, to plea for
assistance (Figures 10 and 11).
Figure 10. An advertisement recruiting women into the fields (Source: The Toppenish Review, May 6, 1943).
36
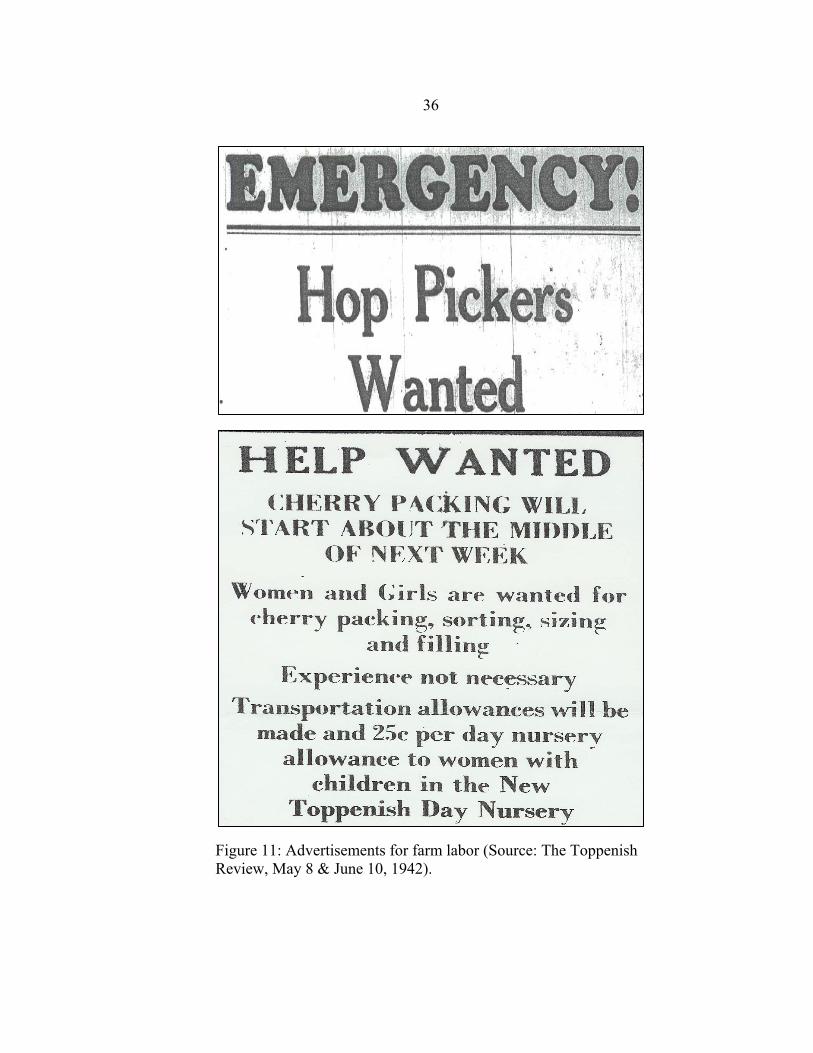
Figure 11: Advertisements for farm labor (Source: The Toppenish Review, May 8 & June 10, 1942).
37
Measures were taken to release prisoners early from jail, and Native Americans from the
nearby reservation were recruited as sources for farm labor. Local businesses
participated in the effort by shortening hours during the harvest season, with some
closing their doors entirely. The situation became so dire that during harvest time in
August 1941, all taverns and businesses in fruit producing communities within the
Yakima Valley were closed. Because youths were a remaining source of labor, schools
were operated on a wartime schedule in which holiday vacations were cut short and
classes were held on several Saturdays so that the children could aid in the harvest
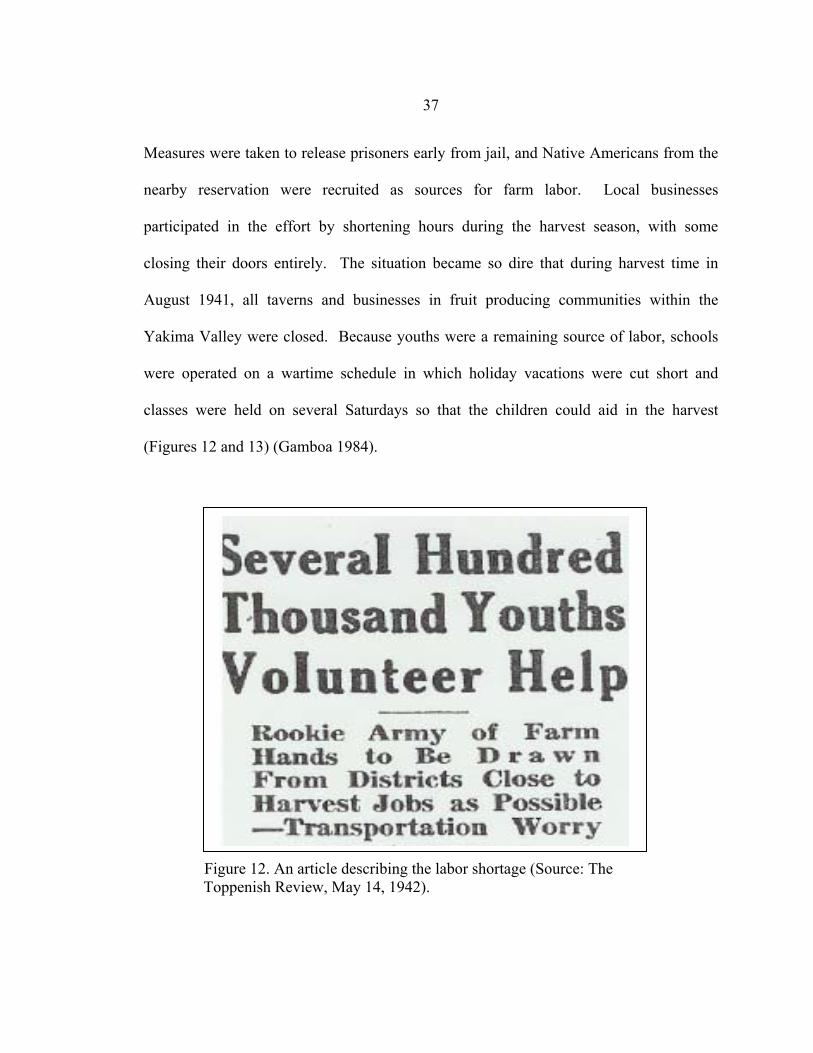
(Figures 12 and 13) (Gamboa 1984).
Figure 12. An article describing the labor shortage (Source: The Toppenish Review, May 14, 1942).
38
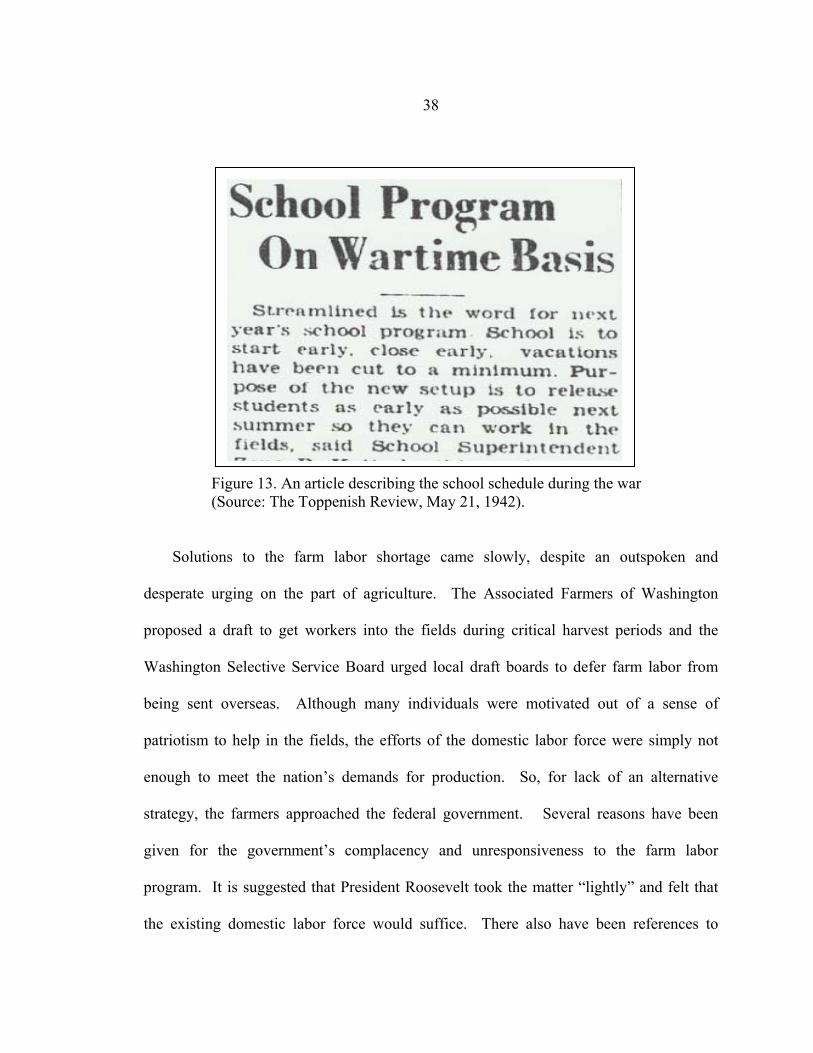
Figure 13. An article describing the school schedule during the war (Source: The Toppenish Review, May 21, 1942).
Solutions to the farm labor shortage came slowly, despite an outspoken and
desperate urging on the part of agriculture. The Associated Farmers of Washington
proposed a draft to get workers into the fields during critical harvest periods and the
Washington Selective Service Board urged local draft boards to defer farm labor from
being sent overseas. Although many individuals were motivated out of a sense of
patriotism to help in the fields, the efforts of the domestic labor force were simply not
enough to meet the nation’s demands for production. So, for lack of an alternative
strategy, the farmers approached the federal government. Several reasons have been
given for the government’s complacency and unresponsiveness to the farm labor
program. It is suggested that President Roosevelt took the matter “lightly” and felt that
the existing domestic labor force would suffice. There also have been references to
39
tensions between political entities, stalling a consensus on a resolution. Whatever the
details, the main problem existed with the fact that there was no central agency
responsible for finding a solution, so the farmers came up with one on their own. As
early as 1941, agricultural organizations were asking for the importation of Mexican
workers. Even before the Bracero Program had been written into law, the Agriculture
Secretary was bombarded with requests for the workers. While the United States was
still negotiating with Mexico, farmers in the Pacific Northwest were already preparing for
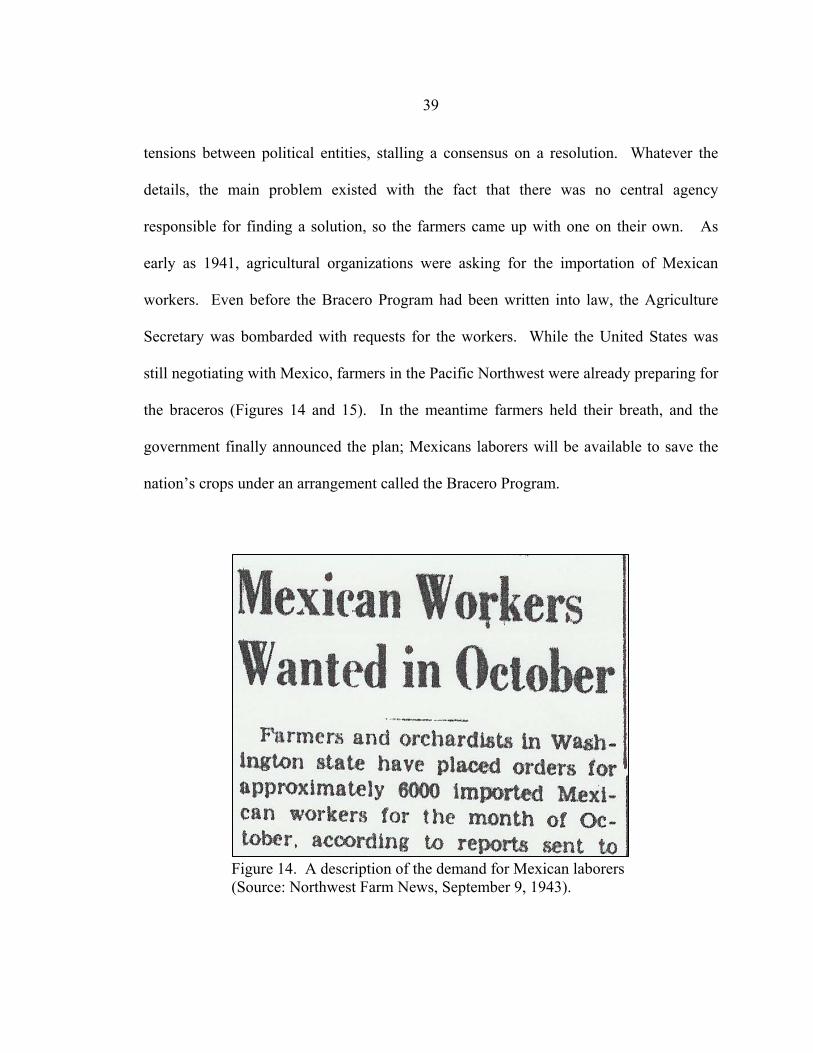
the braceros (Figures 14 and 15). In the meantime farmers held their breath, and the
government finally announced the plan; Mexicans laborers will be available to save the
nation’s crops under an arrangement called the Bracero Program.
Figure 14. A description of the demand for Mexican laborers (Source: Northwest Farm News, September 9, 1943).
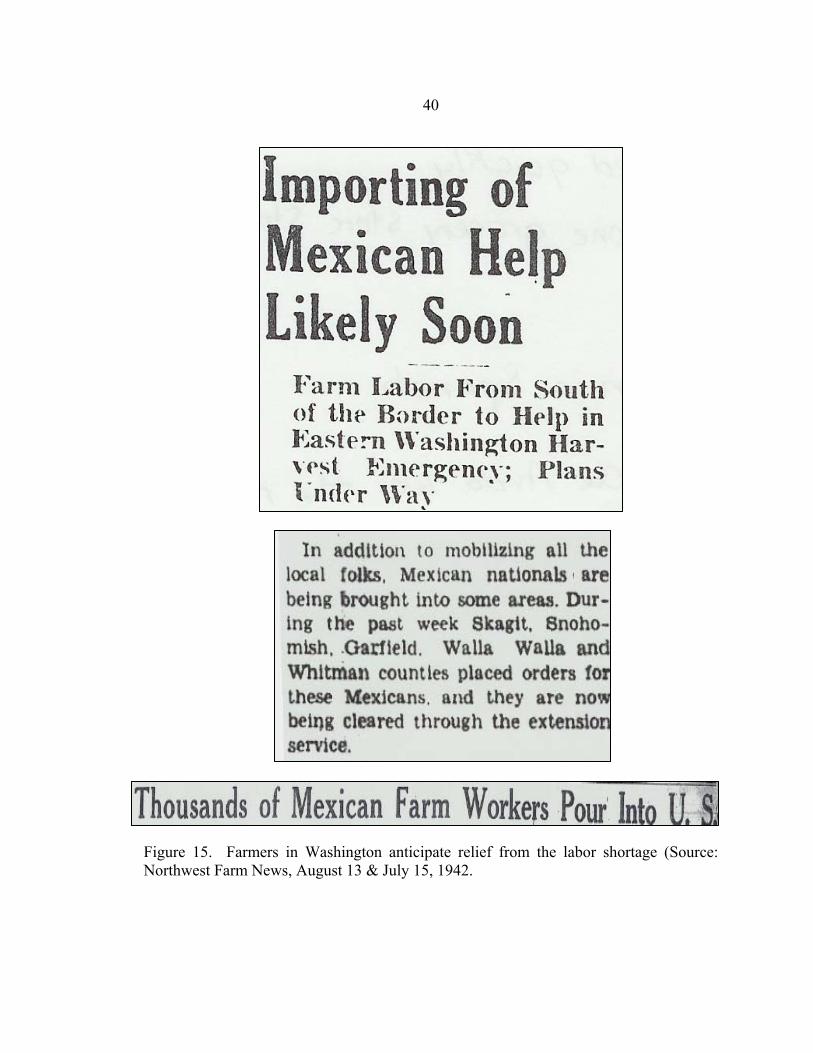
40
Figure 15. Farmers in Washington anticipate relief from the labor shortage (Source: Northwest Farm News, August 13 & July 15, 1942.
41
The Bracero Program The Bracero Program (also known as the Mexican Farm Labor Program) was a
bilateral agreement between Mexico and the United States, signed into effect on August
4th, 1942. The Bracero Program continued for 22 years until 1964, during which time 5
million Mexican laborers were brought into the United States. The Program existed in
two phases, the first being under Public Law 45 and the second under Public Laws 40 and
78. Public Law 45 spanned from 1942-1947 and was essentially a wartime measure. The
contracting of workers was done by the federal government, who assumed responsibility
for the recruitment, transportation, and housing of the braceros. The farmers simply
requested the number of braceros they wanted. In 1947, Public Law 40 replaced Public
Law 45, which extended the program until 1951 and also changed some of its provisions
(Public Law 78 simply extended the Program until 1964). Farmers were now responsible
for shouldering the burden that the government previously had. The change from Public
Law 45 to 40 brought significant changes to the contracting of labor in the Pacific
Northwest, which will be discussed later. It is first necessary to take a look at the
introduction of braceros into the Northwest, and the influences they had on the
communities receiving them.
The first record of Mexican presence in the Pacific Northwest dates back to the
1850s. Like many others, Mexicans were drawn north by the prospect of gold as well as
the demand for miners. However, records of the Mexican presence in this area indicate
that many of them worked as mule train packers and arrived either from California or the
42
Southwest. Most of these individuals were transient and passed through the area
(Gamboa 1984). It was not until after the Mexican Revolution in 1910 that a Mexican
presence began to establish itself in areas of the Pacific Northwest. It is estimated that
about one million Mexicans fled their country during the Revolution, which lasted until
1921. While the majority of these people settled in the Southwest, some made it as far
north as Yakima Valley, where they found ample employment in agriculture. During the
time of the Mexican Revolution, irrigated acreage in Yakima Valley was increasing,
contributing to economic expansion and an increased demand for labor. These factors,
combined with volatile conditions in Mexico and an open immigration policy in the
United States, created a push-pull situation that drew Mexicans northward. However, the
number of Mexicans recorded in the region was still fairly small. In 1930 the United
States Census reported 562 Mexicans in Washington, 1,568 in Oregon, and 1,278 in
Idaho. Of course it is likely that these figures do not truly reflect the actual Mexican
presence in the region. After the Great Depression in 1929, the Mexican presence in the
Pacific Northwest decreased considerably due to poor economic conditions and
repatriation measures. It was not until World War II that a significant Mexican presence
was again felt in the region, with the introduction of the Bracero Program (Maldonado
1995).
In essence, the Bracero Program marks the establishment of a migration stream and
the beginning of a demographic transformation that has continued to this day. When the
first group of braceros arrived in Yakima in 1943, local communities praised them as “the
salvation of the Valley” (Gamboa 1981, 124). Farmers quickly developed a dependence
43
on the Mexican laborers. Not only did they alleviate the labor shortages that endangered
the livelihood of many farmers, but they also proved to be willing and efficient workers
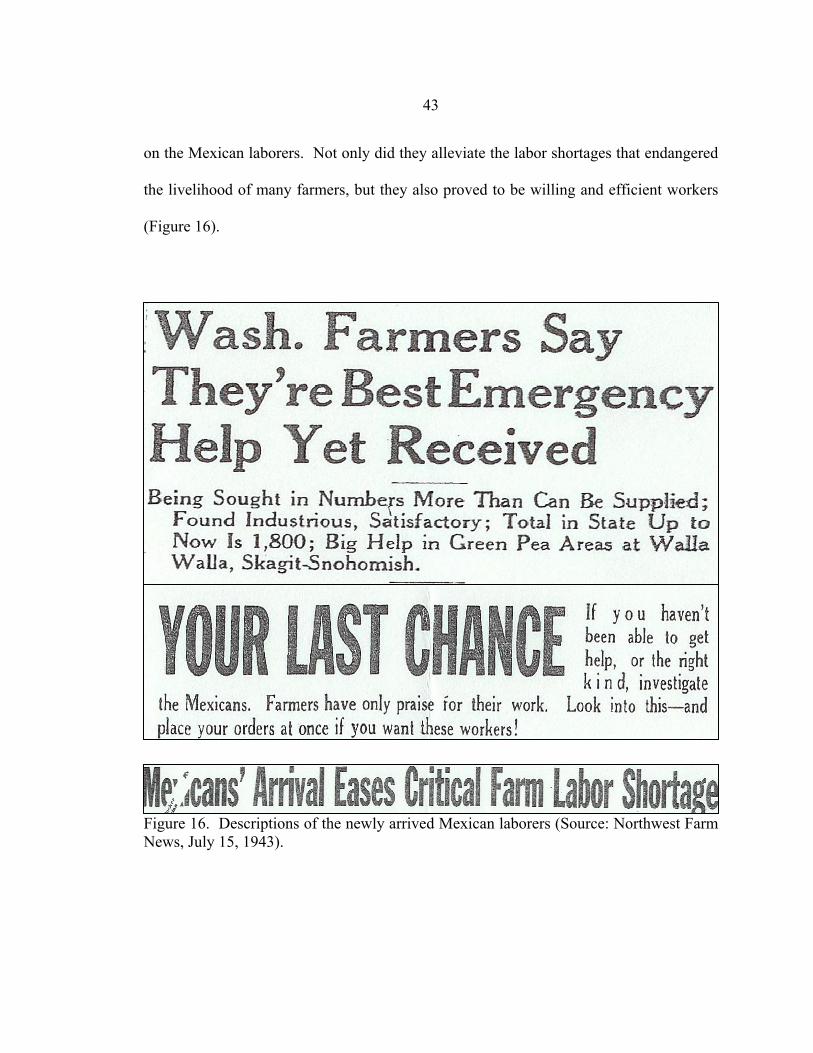
(Figure 16).
Figure 16. Descriptions of the newly arrived Mexican laborers (Source: Northwest Farm News, July 15, 1943).
44
At the start of the Bracero Program in 1943, individual farmers simply “ordered” the
number of braceros they wanted. However, due to labor hoarding and large amounts of
paperwork, farmers were required to organize into farmer associations in 1943. A
representative from each association would then request the number of braceros desired.
The process of bringing braceros north to their prospective employers started in the rural
towns and villages throughout Mexico. The War Food Administration, responsible for
initiating the recruitment process, advertised in various media channels to get the word
out in Mexico. It was then the job of the Mexican government to assemble prospective
braceros at a selection center in Mexico City. Once there, the applicants underwent
extensive health screening and physical examinations. All who qualified were
photographed, vaccinated against smallpox, and the conditions of the work contract were
explained to them. Once the contract was accepted and signed, the United States
immigration authorities issued the necessary permits and the Office of Labor dispersed
ration books to individuals. The braceros were then transported to their assigned
locations via train (Gamboa 1984).
Braceros were housed in labor camps established by the Farm Security
Administration. Many of these camps left a great deal to be desired; some were no more
than canvas tents ill-equipped to handle the early frosts of central Washington. Despite
uncomfortable living conditions and the physical demands of farm labor, the braceros
managed to create a place for themselves that was reminiscent of their homes in Mexico.
Priests were brought from Mexico so that the braceros could attend a church service in
45
their native language. The government published El Mexicano, a Spanish language
newsletter, which carried news from Mexico and was distributed throughout the camps.
Mexican Independence Day and Cinqo de Mayo (May 5th) were major happenings in the
camps, and the braceros were often given a break from work to participate in these
celebrations. Although the braceros were somewhat cut off from the surrounding
communities, they did interact with them. There are records of the Whitman College
Spanish class hosting dinners for the braceros, and on several occasions dances were held
at community halls. On one occasion, the local league of women voters organized an
event in which music was performed by several braceros and the program was broadcast
over the radio. The “Mexican Serenade” was held in 1945 and it is suggested that this
was the first Spanish language broadcast in the Pacific Northwest (Maldonado 1995).
It was in isolated events such as those above that the braceros slowly began to
influence the local communities, which were primarily Anglo at the time. While some
community good will was bestowed upon them, the braceros also experienced a degree of
animosity. Some of this hostility arose from a feeling that the braceros were stealing jobs
from the resident labor force. On their trips into town, the Mexicans were often banned
from movie theaters and taverns. However, for one reason or another, these
discriminatory acts were the worst in Idaho and not as noticeable in Washington. The
provisions of the Bracero Program explicitly prohibited discriminatory acts of any kind,
and the situation in Idaho actually endangered their supply of laborers (Gamboa 1984). It
was with mixed feelings that the braceros were received in local communities and it
46
could not have been easy for them to adjust to their new surroundings in the face of such
a varied welcome.
Shift to Migrant Workers
The first phase of the Bracero Program brought nearly 40,000 workers to the Pacific
Northwest, which was 21% of the total number contracted in the United States and
second only to California. As Erasmo Gamboa stated in his PhD Dissertation on the
subject, “In short, the second World War added Mexican-Americans to the Pacific
Northwest. After the war, migrant workers picked up where the braceros left off”
(Gamboa 1984, 385). When Public Law 40 replaced Public Law 45, the Bracero
Program was basically brought to an end in the Pacific Northwest. The cost of recruiting,
transporting, and housing the Mexican laborers became so great that it was prohibitive,
especially to farmers as far north as Washington. However, employers had developed a
preference for the braceros, who were both cheap and hard working. They therefore
turned to the next best source of labor: migrant workers. This group consisted mainly of
Tejanos (Mexican Americans from Texas) with some Mexicanos (Mexican Americans)
arriving from other parts of the Southwest. This post-war demand for labor created a
migrant stream between the Southwest and the Northwest and was one in which the
migrants had the option and the ability to remain permanently. While the labor shortage
in many areas was relieved after the war ended, Washington State experienced a
continual need for agricultural labor with the irrigation of the Columbia Basin in 1948.
The Columbia Basin Irrigation Project was also responsible for the establishment of
47
processing plants, which offered year-round employment, further encouraging migrant
workers to “settle out”. As their numbers increased, the agricultural areas of Washington
began to see the emergence of communities that were distinctively Hispanic. It was
during the decades of the 1950s and 1960s that these communities formed and solidified.
In the words of Gamboa:
In the process of recruiting workers to the Northwest, growers brought more than human labor. Mexican-American culture was transposed to the agricultural valleys of the region. In the beginning the outline of Mexican-American culture was meager, but by the 1950s it had changed the social landscape of many Pacific Northwest communities (Gamboa 1990, 130). The transformation of these communities occurred fairly rapidly, especially in the
Yakima Valley. Catholic parish records show that the number of Spanish surnamed
marriages and baptisms increased considerably between 1940 and 1950. In Toppenish,
for example, there were no Spanish surnamed baptisms in 1940 and by 1950 they
accounted for 40% of the total. To accommodate the growing Mexican population,
Spanish language films and Mexican eateries began to appear. In 1951, the first regularly
scheduled Spanish language radio program in the Pacific Northwest was broadcast on
Radio KREW from the Yakima Valley. This not only suggests the importance and
influence of the Mexican community, but also represents an avenue for communication
that existed only within the Spanish speaking community. In fact, most of the activities
enjoyed by the Mexican population were enjoyed by them alone; segregation from the
Anglo community was evident. As a result, the cultural values and practices that the
Tejanos and Mexicanos brought north remained and these tended to be very traditional.
48
This segregation was further enforced during the Chicano movement of the 1960s and
1970s (Gamboa 1984).
The social and political activism of the 1960s paved the way for the Chicano
movement, which was a struggle on the part of Hispanics for social, economic, and
political equality. During this time, many important social organizations were
established in the Yakima Valley, which is described as being “the seedbed for early
activism in the state” (Maldonado 1995). The United Farm-workers Co-op was created
in Toppenish in 1967 and is said to be the first activist group in Washington. The
Mexican American Federation was formed in Yakima in 1968 and is the predecessor to
the present day Washington State Commission on Hispanic Affairs (Gamboa 1990).
Since the 1960s and 1970s, the number of organizations in Washington that focus on
Hispanics has grown steadily alongside the increasing Mexican population of the area.
As of 1990, there were over 15 organizations and agencies working in the Yakima Valley
that are described specifically as being “pro-Hispanic” (Leek et al 1991).
The Bracero Program, along with the irrigation of the Columbia Basin region,
established the Yakima Valley (and the Pacific Northwest in general) as a major
destination for Mexican laborers. Once this area was put on the map there were two
changes to United States immigration laws that made employment and settlement in the
area more feasible. The first of these was the Immigration and Nationality Act
Amendments of 1965. Prior to these amendments, immigrants were admitted under the
national origins quota system, which was based on the number of foreign born already
residing in the United States; this system tended to favor Europeans. The 1965
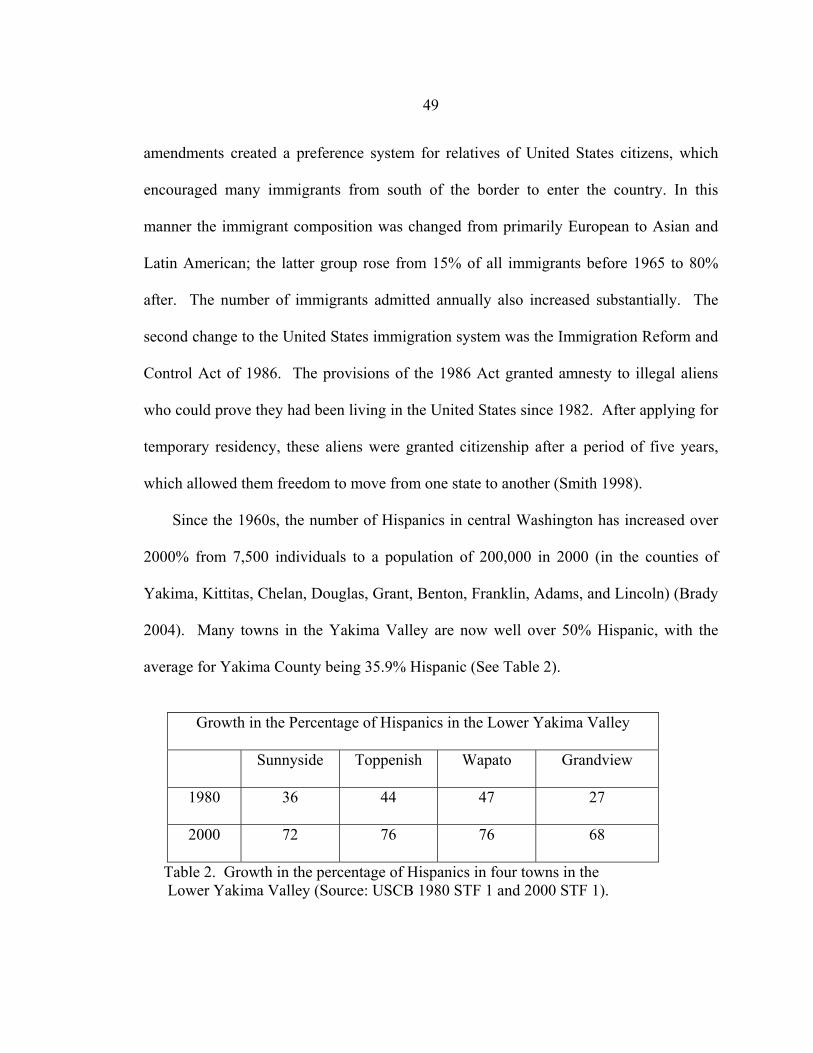
49
amendments created a preference system for relatives of United States citizens, which
encouraged many immigrants from south of the border to enter the country. In this
manner the immigrant composition was changed from primarily European to Asian and
Latin American; the latter group rose from 15% of all immigrants before 1965 to 80%
after. The number of immigrants admitted annually also increased substantially. The
second change to the United States immigration system was the Immigration Reform and
Control Act of 1986. The provisions of the 1986 Act granted amnesty to illegal aliens
who could prove they had been living in the United States since 1982. After applying for
temporary residency, these aliens were granted citizenship after a period of five years,
which allowed them freedom to move from one state to another (Smith 1998).
Since the 1960s, the number of Hispanics in central Washington has increased over
2000% from 7,500 individuals to a population of 200,000 in 2000 (in the counties of
Yakima, Kittitas, Chelan, Douglas, Grant, Benton, Franklin, Adams, and Lincoln) (Brady
2004). Many towns in the Yakima Valley are now well over 50% Hispanic, with the
average for Yakima County being 35.9% Hispanic (See Table 2).
Growth in the Percentage of Hispanics in the Lower Yakima Valley
Sunnyside Toppenish Wapato Grandview
1980 36 44 47 27
2000 72 76 76 68
Table 2. Growth in the percentage of Hispanics in four towns in the Lower Yakima Valley (Source: USCB 1980 STF 1 and 2000 STF 1).
50
This population growth is a combination of continual immigration and demographic
characteristics. So, what does this mean for the feel and identity of these towns? How do
the residents describe where they are from to outsiders? As Gamboa nicely summarized:
In these small towns a Latinization is evident. The Spanish language is heard everywhere in the streets, shops, restaurants, schools, radio and television, and public offices. Mexican food products have proliferated. These are signs that Mexican-American communities, born during the Second World War, are very much a part of the social and economic life of this region (Gamboa 1984, 385).
The “Latinization” that has proliferated in the Yakima Valley has affected its residents
differently. For immigrants from Mexico as well as Mexican migrants from other parts
of the United States, this area has come to represent the concept of “nuestro hogar del
norte” or “our northern home”. Many who arrive here already have family or friends to
greet them and help them adjust to their new surroundings (Maldonado 1995). The
plethora of organizations available to Mexicans also contributes to their level of comfort
in these communities. This network of social support further strengthens the ties within
the Mexican community and inhibits cultural assimilation and interaction with the Anglo
community. The Yakima Valley is also characterized by a high level of continual
immigration so there is constant reinforcement of the Mexican culture. Regarding social
conditions within the Valley in 1990, a local leader remarked, “this is a segmented
community” however, as the Hispanic population continues to increase, “the perception
and expectation is that things will begin to change” (Leek et al, 1991).
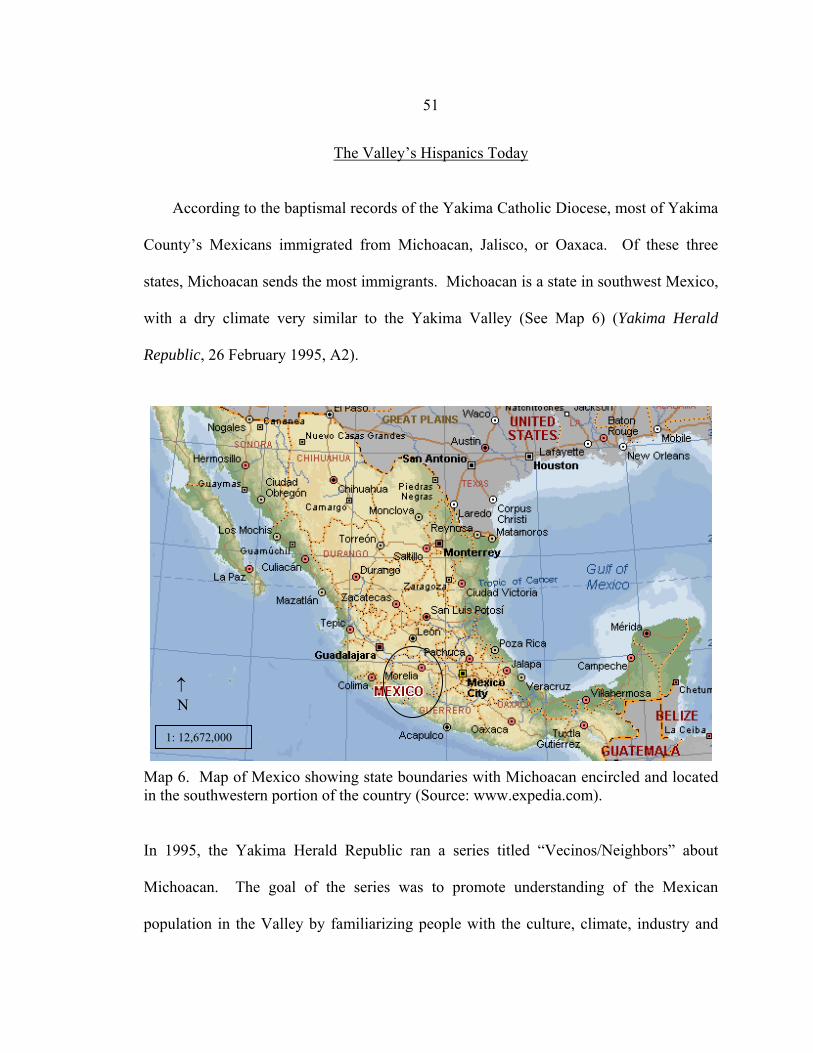
51
The Valley’s Hispanics Today According to the baptismal records of the Yakima Catholic Diocese, most of Yakima
County’s Mexicans immigrated from Michoacan, Jalisco, or Oaxaca. Of these three
states, Michoacan sends the most immigrants. Michoacan is a state in southwest Mexico,
with a dry climate very similar to the Yakima Valley (See Map 6) (Yakima Herald
Republic, 26 February 1995, A2).
Map 6. Map of Mexico showing state boundaries with Michoacan encircled and located in the southwestern portion of the country (Source: www.expedia.com).
In 1995, the Yakima Herald Republic ran a series titled “Vecinos/Neighbors” about
Michoacan. The goal of the series was to promote understanding of the Mexican
population in the Valley by familiarizing people with the culture, climate, industry and
1: 12,672,000
↑ N
52
various other aspects of the former home of their Mexican vecinos, or neighbors. The
next series was published in 2000 and is called “A look at Race Relations in the Yakima
Valley.” This series was undertaken as a response to negative comments received on the
Michoacan series; reporters wanted to explore this negative reaction, its causes, and its
prevalence. This series ran for six days and consisted of fifty articles on race relations in
Yakima County based on a public opinion survey of 800 households, 400 of Hispanic
residents and 400 of non-Hispanics of other racial and ethnic groups. “We sought to find
out how people describe what race relations are like here; how people compare race
relations in Yakima County with the rest of the country; to have people reflect on
whether race relations have improved; to make them predict whether race relations will
be better 10 years from now; and, more specifically, whether they had been a victim of
racial discrimination, and if so, how. We also sought answers to social questions, such as
attitudes toward living in mixed-race neighborhoods and toward interracial dating or
marriages,” wrote the reporters (Yakima Herald Republic, 10 December 2000).
After the first wave of Mexican workers came to the Valley during the Bracero
Program, the second largest wave came during the 1970s, to meet the demands of
continued agricultural expansion in the Valley. According to Erasmo Gamboa, a history
professor at the University of Washington, these more recent arrivals came primarily
from Michoacan. “The first wave of immigrants paved the way for the newer arrivals,
making their transition into America easier through a network of social-service agencies
that developed for Mexican migrants” says Gamboa. “They will continue to come as
long as the conditions continue in Mexico. People have to have a reason to migrate. In
53
the case of Mexico, they are coming largely because of economic reasons. It’s getting
terrible” (Yakima Herald Republic, 27 February 1995, C1).
In 1995, the average farm worker in Pajacuaran, a city in Michoacan, earned $6 per
day, compared to $5.45 an hour in Yakima County. An experienced cherry picker in
Yakima can make as much as $125 per day. It is for this reason that so many immigrants
head north. Carlos Reyes, a Mexican national who has recently gained citizenship says, “I
like it in the U.S. because the life is more comfortable. You have more opportunities.
You have more opportunities to support your family. That is the first reason people go to
the United States.” Juan Villafan, an immigrant from Michoacan who lives in Toppenish
and recently gained U.S. citizenship commented on the problems this can cause. “The
boys think they can leave school at the age of 14, head to the states and get a job. In
Pajacuaran, young people go to school because there aren’t any jobs. But in the states
very few will go to school. They think it’s more important to make money,” he said
(Yakima Herald Republic 1 March 1995, A2).
While the lure of job opportunities attracts young workers from Michoacan, the cost
of crossing the border and finding a job is not negligible. Many Mexicans who come to
Yakima do so because they have friends or family who are willing to board them while
they look for work. Migrants will often depend on a sponsor who loans them money to
cross the border and travel north, then boards them until they find a job. Continual chain
migration over the last few decades has forged a strong connection between the Yakima
Valley and Michoacan. An entire section of Pajacuaran is called Toppenish because so
54
many people either have relatives or had jobs in that city (Yakima Herald Republic, 26
February 1995, E1).
According to some immigrants, arriving in the Yakima Valley is a bit like arriving at
home. Juan Villafan estimates that more than half the people in Pajacuaran have relatives
in Yakima. Asked if anything in Pajacuaran is similar to Yakima, Villafan responded
“Yes, the Mexican people. When I’m in the U.S. I’m mostly around other Mexicans. I
don’t feel like part of the other culture. Maybe it’s because our cultures are so different.”
Families who have emigrated more recently sometimes find themselves torn between
Michoacan and Yakima. Many miss their country but say they’re here to seek a better
life (Yakima Herald Republic, 26 February 1995, A2). As these migrant families made
their homes in the area, the social and cultural landscape of the Valley began to change
and continues to change. “The presence of these early families has changed the Yakima
Valley community. Sunnyside is not what it was 20 years ago. The presence of Mexican
American culture has forced change within the non-Mexican American community,” said
Erasmo Gamboa (Yakima Herald Republic, 1 March 1995, C1).
Although slightly dated, the 1995 series that ran in the Herald tells a great deal about
the Hispanic community of the Yakima Valley and is still very pertinent today. In fact, in
2000 Yakima and Morelia, a city in Michoacan, became sister cities, an indication of the
strengthening connection between these places. Since Yakima and Morelia became sister
cities, there has been a steady exchange of ideas, art, music, and technology. Teachers
have been sent north, firefighters have gone south, and symphony conductors have been
swapped between the two cities. “We thought if we could get (Yakima residents) to see
55
the beauty and culture in Mexico, then they could have a better understanding of the
transition that was taking place in Yakima’s community,” commented Luz Bazan
Gutierrez, a volunteer at the Hispanic Chamber of Commerce. “We wanted others to see
the positive things that many people from Mexico brought to the Valley.” This year for
the first time, the association plans to offer an immersion program in Morelia for Yakima
Valley professionals such as medics, firefighters and police officers. The program will
include five weeks of living with a local family and studying at the Universidad Latina de
America. Being bilingual helps firefighters, police officers and others break down
communication barriers and build a rapport within Yakima’s Hispanic community
(Yakima Herald Republic, 22 May 2005, A2).
The “Race Relations in the Valley” series published by the Herald in 2000 describes
the social atmosphere according to the opinions of Hispanics and non-Hispanics alike.
The survey found that Hispanics appear to be more optimistic than non-Hispanics on the
subject of race relations. By far greater percentages than non-Hispanics, Hispanics
believe that race relations are better in this county than in the rest of the U.S., that race
relations have improved during the time they have lived here, and that relations will
continue to improve in the next 10 years. The survey also found that many Hispanics and
non-Hispanics believe that police use racial profiling in determining who to pull over in
traffic stops, and that neither group believes that the government does enough to stop
illegal immigration. On the subject of education, both groups say that parental and family
support, not the ability to speak English, is the greatest single factor in determining a
child’s chance to succeed in school. While a majority of non-Hispanics would like to see
56
bilingual education programs reduced or eliminated, a majority of Hispanics would like
to see the level of Spanish language instruction as a transition to English increased or
remain at the same level (Yakima Herald Republic, 10 December 2000).
The simple fact that the Yakima Valley’s leading newspaper dedicated two weeks to
the topic of Hispanics in the Valley hints at the dimensions of this issue. The
communities in the Valley have and will continue to experience changes as a result of
their growing Hispanic populations. It is obvious from the Herald’s articles that
promoting public discourse and cultural sensitivity are approaches that these communities
have undertaken to better handle these changes.
Conclusion
The transformation of the Yakima Valley from Anglo farming towns to Hispanic
enclaves may be representative of a trend occurring throughout agricultural areas of the
West. Not only is Hispanic population growth higher in the West than the rest of the
U.S., but 48% of Hispanics live in the Pacific states alone. Demand for agricultural
workers no doubt plays a part in the geographical distribution of Hispanics, as does
proximity to Mexico (Thilmany 2003). But perhaps the most telling factor is the location
of well-established Hispanic communities. As can be seen from the settlement pattern of
the Yakima Valley, most Hispanic immigrants are likely to settle and live in communities
in which a high concentration of residents are of their same ethnic identity (Englekirk and
Marín 2000). Does this indicate that these places throughout the West have and will
follow a development pattern similar to that of the Yakima Valley? While the answer to
57
that question is beyond the scope of this thesis, it is important to be aware of this
possibility and thus be familiar with the social and economic processes that an area such
as the Yakima Valley is undergoing. It is only by being mindful of the history of the
Valley that one can truly begin to understand these processes. As the ethnic diversity of
the West increases, the experience of the Yakima Valley is only one example of a
regional trend that is likely to continue, as the forces driving it were set in motion half a
century ago.
58
CHAPTER 4
CENSUS DATA ANALYSIS The United States Bureau of the Census is the most comprehensive and widely
published resource for information on demographic and economic characteristics of the
United States population. Every ten years the Census Bureau publishes the Decennial
Report, which is the most extensive of all reports issued by the Bureau. The census term
used to identify Hispanics has changed consistently over the years. The 1950 and 1960
censuses used the term “persons of Spanish surname.” This was changed to “Spanish
Origin” for the 1970 census, which also began the process of self-identification for this
group and established them as Mexican, Puerto Rican, Cuban, and those of other
Hispanic origin/descent. The term was again changed in 1990 to “Hispanic Origin” and
in the 2000 census the term “Hispanic/Latino” was used (United States Bureau of the
Census, hereafter USBC n.d.).
There are two methods of data collection for the decennial census and the type of
data released depends on which method is employed. The first is the short form, also
known as 100-percent data, which asks a limited number of questions of every person
and housing unit in the United States. Information from the short form is published in
Summary Tape File 1 (STF1) and is available on:
• Age
• Hispanic or Latino origin
• Household relationship
59
• Race
• Sex
• Tenure (whether the home is owned or rented)
• Vacancy Characteristics
The second method of data collection is called the long form, or sample data. The long
form asks additional questions of a sample of persons and housing units (generally 1 in 6
households). Data are published in Summary Tape File 3 (STF 3) and are provided on
various population and housing characteristics including:
• Ancestry
• Disability
• Grandparents as caregivers
• Income
• Labor force status
• Language spoken at home and ability to speak English
• Marital status
• Migration (residence in 1995)
• Occupation, industry, and class of worker
• Place of birth, citizenship, and year of entry
• Place of work and journey to work
• School enrollment and educational attainment
• Work status in 1999
60
• Veteran status
• Various housing characteristics (www.census.gov, 2000).
Different scales of analysis provide diverse perspectives as well as a platform for
comparison. Therefore, census data are examined in this chapter for two different spatial
units: county and place. County and place geographies will be analyzed based on 1980
and 2000 data, with comparisons made between the two decades where possible. Data
for the 1980, 1990, and 2000 censuses were obtained from Summary Tape Files 1 and 3.
Again, STF 1 is a 100% count of the population, while STF3 is a sample count.
With connecting lines, Figure 17 shows the hierarchical relationships between
geographic units. For example, a line extends from states to counties because a state is
comprised of many counties, and a single county can never cross a state boundary. If no
line joins two geographic types, then an absolute and predictable relationship does not
exist between them. For example, a place (such as New York City) can cross county
boundaries but not state boundaries. Blocks are the smallest geographic unit for which
the Census Bureau reports data, and most geographic types are a collection of blocks.
Information is categorized at a variety of different geographies, or scales, and different
types of information are available at each of these scales. For example, information at
the smallest unit of enumeration, the block, is very limited due to the potential of
identifying individuals. This chapter will use county data as the largest unit of
enumeration, followed by place data, and then block group data.
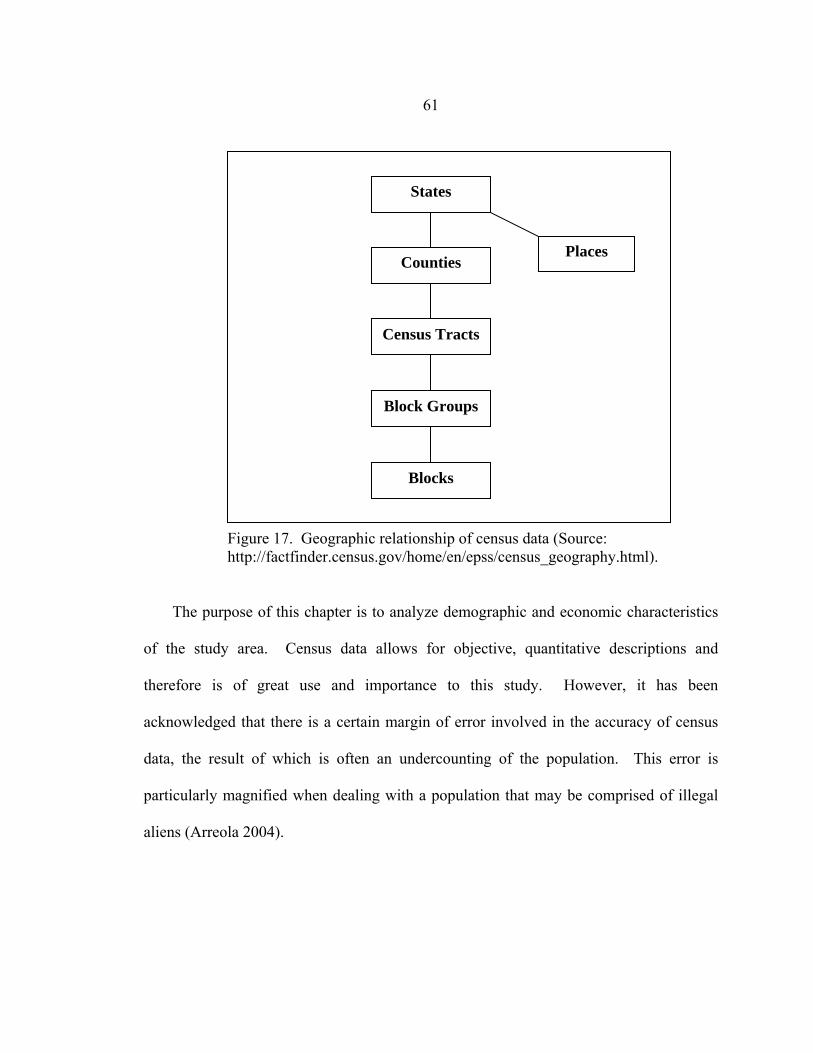
61
Figure 17. Geographic relationship of census data (Source: http://factfinder.census.gov/home/en/epss/census_geography.html). The purpose of this chapter is to analyze demographic and economic characteristics
of the study area. Census data allows for objective, quantitative descriptions and
therefore is of great use and importance to this study. However, it has been
acknowledged that there is a certain margin of error involved in the accuracy of census
data, the result of which is often an undercounting of the population. This error is
particularly magnified when dealing with a population that may be comprised of illegal
aliens (Arreola 2004).
Counties
Census Tracts
Block Groups
Blocks
States
Places
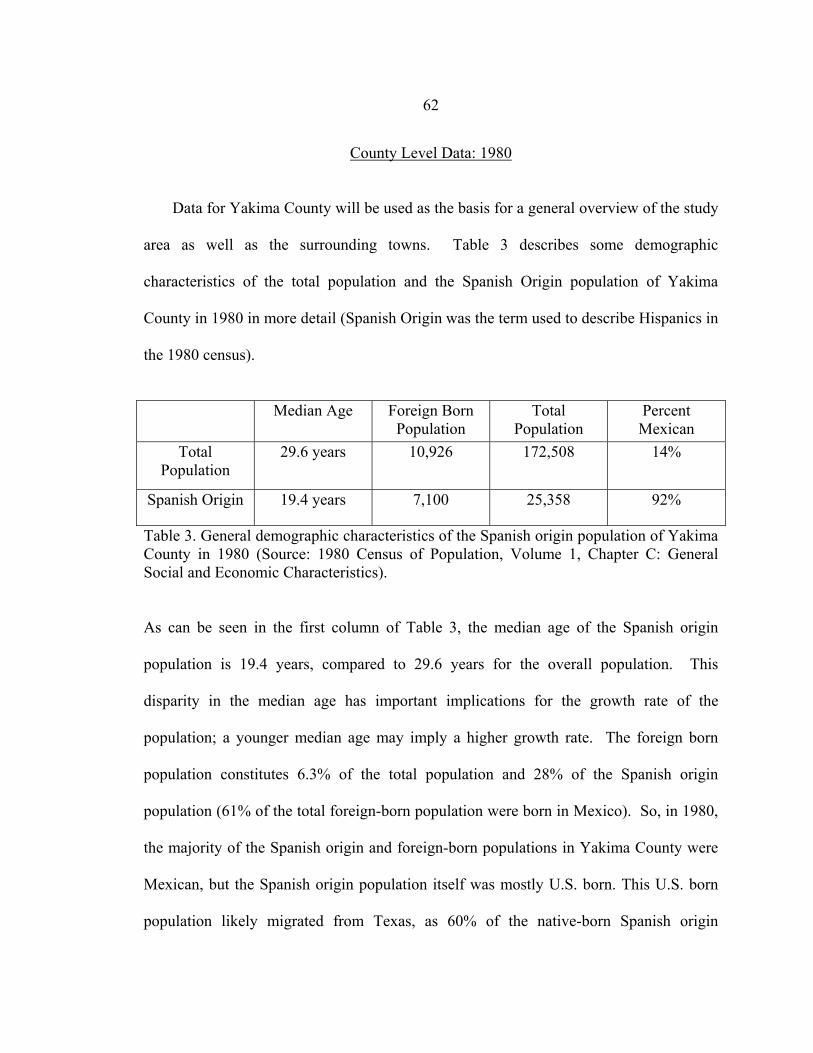
62
County Level Data: 1980 Data for Yakima County will be used as the basis for a general overview of the study
area as well as the surrounding towns. Table 3 describes some demographic
characteristics of the total population and the Spanish Origin population of Yakima
County in 1980 in more detail (Spanish Origin was the term used to describe Hispanics in
the 1980 census).
Median Age Foreign Born
Population Total
Population Percent Mexican
Total Population
29.6 years 10,926 172,508 14%
Spanish Origin 19.4 years 7,100 25,358 92%
Table 3. General demographic characteristics of the Spanish origin population of Yakima County in 1980 (Source: 1980 Census of Population, Volume 1, Chapter C: General Social and Economic Characteristics). As can be seen in the first column of Table 3, the median age of the Spanish origin
population is 19.4 years, compared to 29.6 years for the overall population. This
disparity in the median age has important implications for the growth rate of the
population; a younger median age may imply a higher growth rate. The foreign born
population constitutes 6.3% of the total population and 28% of the Spanish origin
population (61% of the total foreign-born population were born in Mexico). So, in 1980,
the majority of the Spanish origin and foreign-born populations in Yakima County were
Mexican, but the Spanish origin population itself was mostly U.S. born. This U.S. born
population likely migrated from Texas, as 60% of the native-born Spanish origin
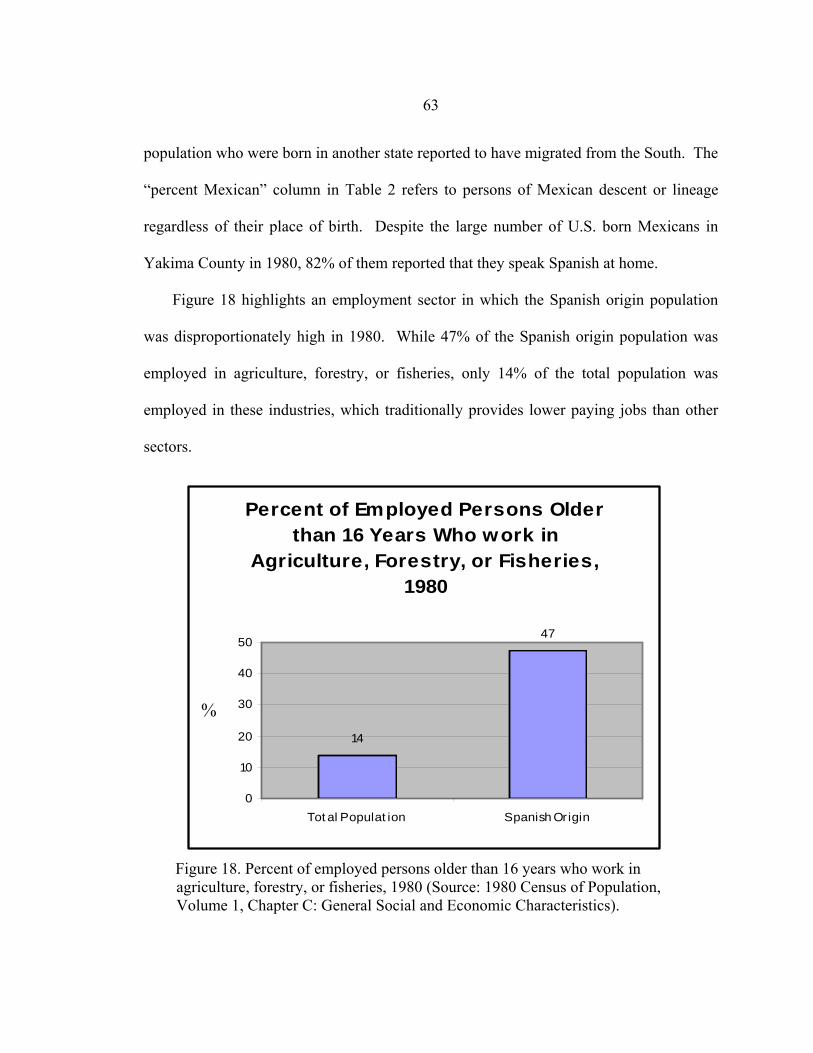
63
Percent of Employed Persons Older than 16 Years Who work in
Agriculture, Forestry, or Fisheries, 1980
14
47
0
10
20
30
40
50
Tot al Populat ion Spanish Origin
population who were born in another state reported to have migrated from the South. The
“percent Mexican” column in Table 2 refers to persons of Mexican descent or lineage
regardless of their place of birth. Despite the large number of U.S. born Mexicans in
Yakima County in 1980, 82% of them reported that they speak Spanish at home.
Figure 18 highlights an employment sector in which the Spanish origin population
was disproportionately high in 1980. While 47% of the Spanish origin population was
employed in agriculture, forestry, or fisheries, only 14% of the total population was
employed in these industries, which traditionally provides lower paying jobs than other
sectors.
Figure 18. Percent of employed persons older than 16 years who work in agriculture, forestry, or fisheries, 1980 (Source: 1980 Census of Population, Volume 1, Chapter C: General Social and Economic Characteristics).
%
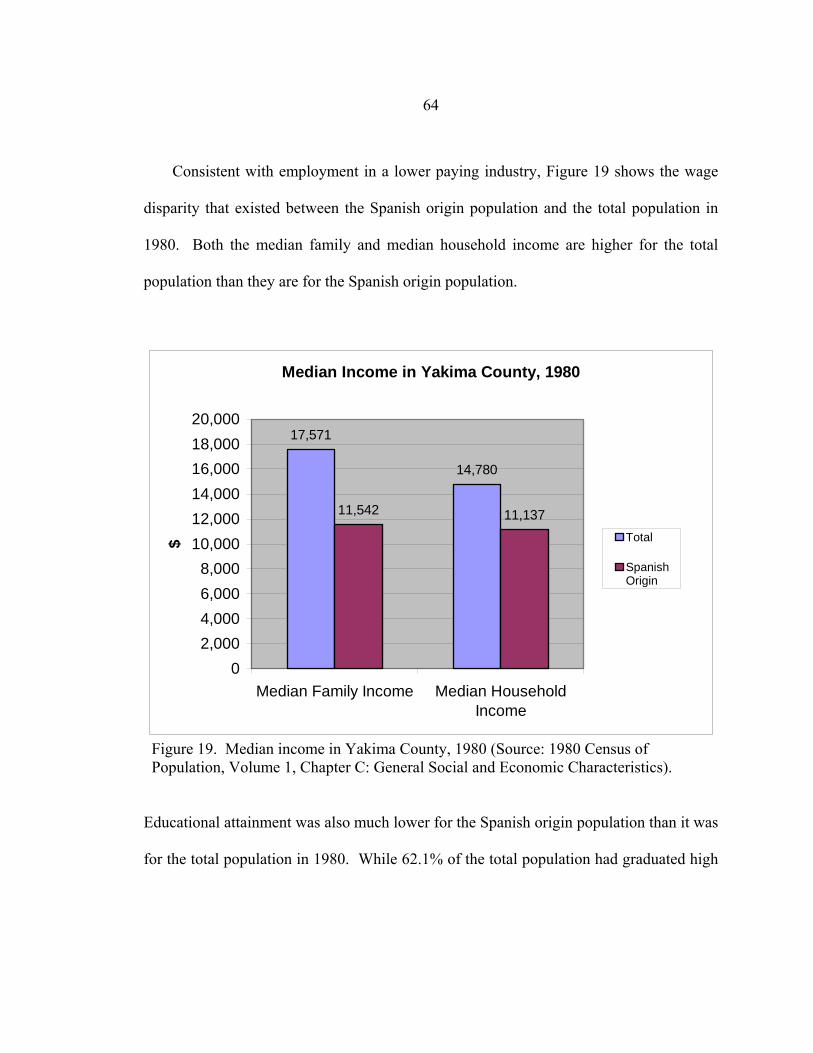
64
Consistent with employment in a lower paying industry, Figure 19 shows the wage
disparity that existed between the Spanish origin population and the total population in
1980. Both the median family and median household income are higher for the total
population than they are for the Spanish origin population.
Figure 19. Median income in Yakima County, 1980 (Source: 1980 Census of Population, Volume 1, Chapter C: General Social and Economic Characteristics). Educational attainment was also much lower for the Spanish origin population than it was
for the total population in 1980. While 62.1% of the total population had graduated high
Median Income in Yakima County, 1980
17,571
14,780
11,542 11,137
02,0004,0006,0008,000
10,00012,00014,00016,00018,00020,000
Median Family Income Median HouseholdIncome
$ Total
SpanishOrigin
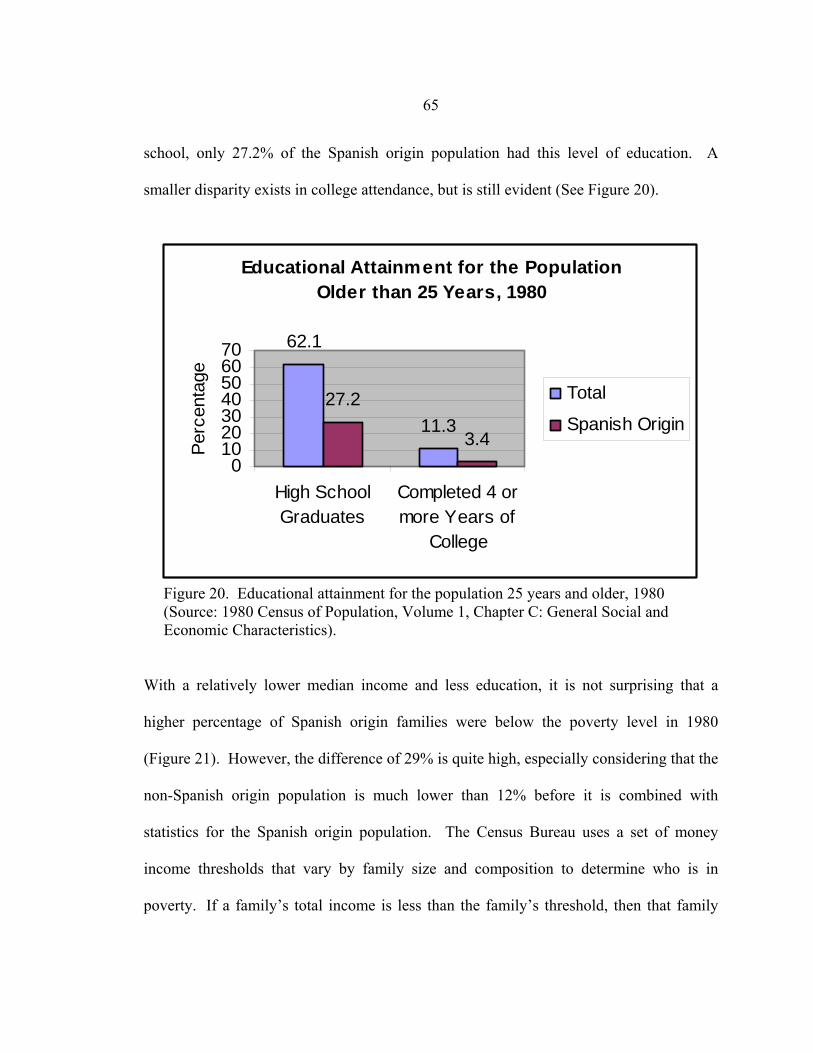
65
Educational Attainment for the Population Older than 25 Years, 1980
62.1
11.327.2
3.40
10203040506070
High SchoolGraduates
Completed 4 ormore Years of
College
Perc
enta
ge
Total
Spanish Origin
school, only 27.2% of the Spanish origin population had this level of education. A
smaller disparity exists in college attendance, but is still evident (See Figure 20).
Figure 20. Educational attainment for the population 25 years and older, 1980 (Source: 1980 Census of Population, Volume 1, Chapter C: General Social and Economic Characteristics).
With a relatively lower median income and less education, it is not surprising that a
higher percentage of Spanish origin families were below the poverty level in 1980
(Figure 21). However, the difference of 29% is quite high, especially considering that the
non-Spanish origin population is much lower than 12% before it is combined with
statistics for the Spanish origin population. The Census Bureau uses a set of money
income thresholds that vary by family size and composition to determine who is in
poverty. If a family’s total income is less than the family’s threshold, then that family
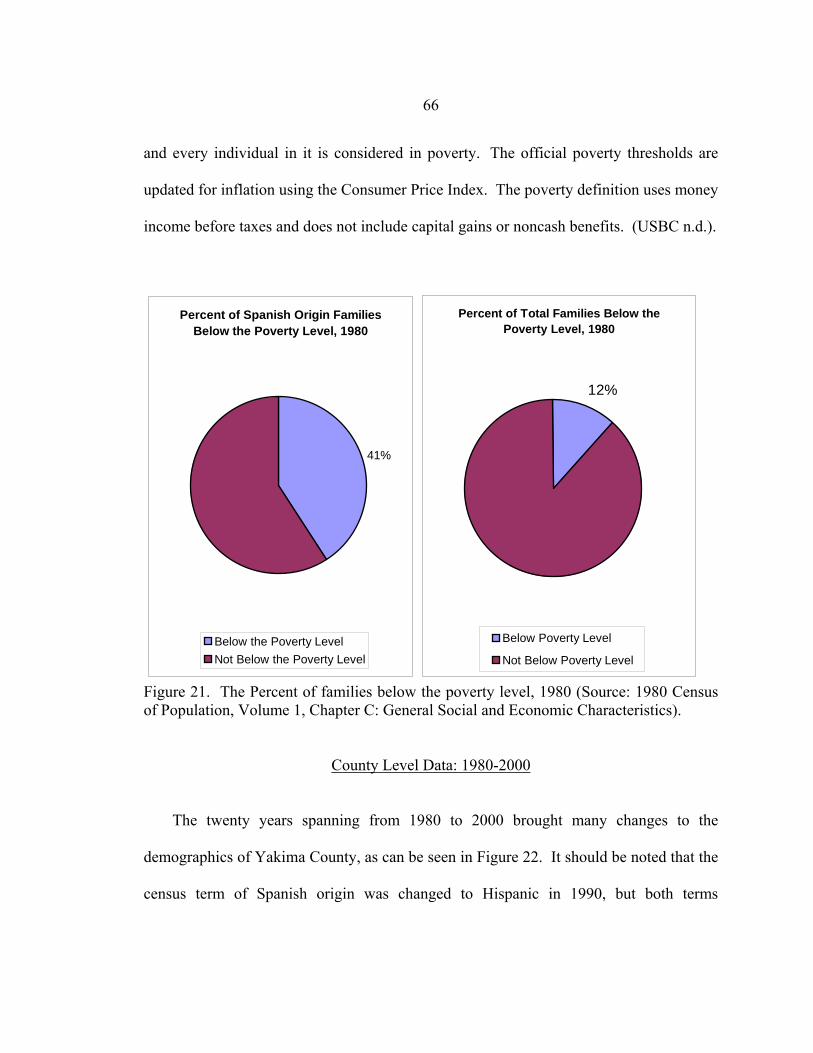
66
and every individual in it is considered in poverty. The official poverty thresholds are
updated for inflation using the Consumer Price Index. The poverty definition uses money
income before taxes and does not include capital gains or noncash benefits. (USBC n.d.).
Percent of Spanish Origin Families Below the Poverty Level, 1980
41%
Below the Poverty LevelNot Below the Poverty Level
Percent of Total Families Below the Poverty Level, 1980
12%
Below Poverty Level
Not Below Poverty Level
Figure 21. The Percent of families below the poverty level, 1980 (Source: 1980 Census of Population, Volume 1, Chapter C: General Social and Economic Characteristics).
County Level Data: 1980-2000 The twenty years spanning from 1980 to 2000 brought many changes to the
demographics of Yakima County, as can be seen in Figure 22. It should be noted that the
census term of Spanish origin was changed to Hispanic in 1990, but both terms
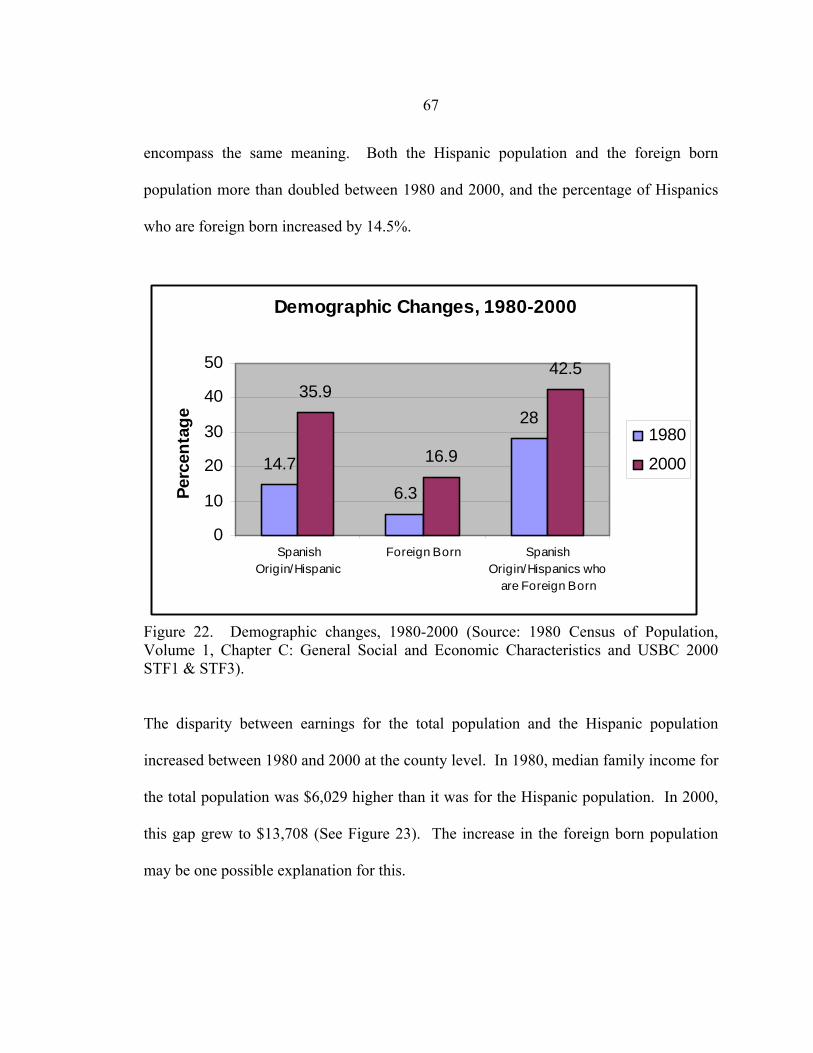
67
Demographic Changes, 1980-2000
14.7
6.3
2835.9
16.9
42.5
0
10
20
30
40
50
SpanishOrigin/Hispanic
Foreign Born SpanishOrigin/Hispanics who
are Foreign Born
Perc
enta
ge
1980
2000
encompass the same meaning. Both the Hispanic population and the foreign born
population more than doubled between 1980 and 2000, and the percentage of Hispanics
who are foreign born increased by 14.5%.
Figure 22. Demographic changes, 1980-2000 (Source: 1980 Census of Population, Volume 1, Chapter C: General Social and Economic Characteristics and USBC 2000 STF1 & STF3).
The disparity between earnings for the total population and the Hispanic population
increased between 1980 and 2000 at the county level. In 1980, median family income for
the total population was $6,029 higher than it was for the Hispanic population. In 2000,
this gap grew to $13,708 (See Figure 23). The increase in the foreign born population
may be one possible explanation for this.
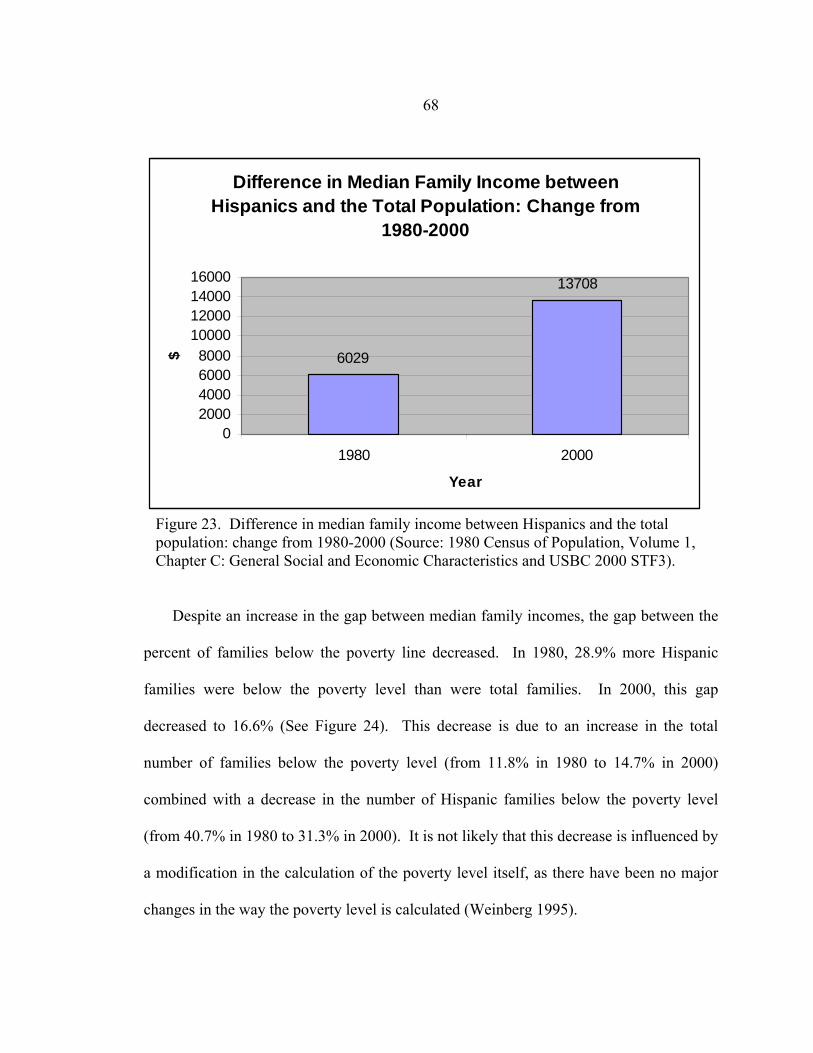
68
Difference in Median Family Income between Hispanics and the Total Population: Change from
1980-2000
6029
13708
02000400060008000
10000120001400016000
1980 2000
Year
$
Figure 23. Difference in median family income between Hispanics and the total population: change from 1980-2000 (Source: 1980 Census of Population, Volume 1, Chapter C: General Social and Economic Characteristics and USBC 2000 STF3). Despite an increase in the gap between median family incomes, the gap between the
percent of families below the poverty line decreased. In 1980, 28.9% more Hispanic
families were below the poverty level than were total families. In 2000, this gap
decreased to 16.6% (See Figure 24). This decrease is due to an increase in the total
number of families below the poverty level (from 11.8% in 1980 to 14.7% in 2000)
combined with a decrease in the number of Hispanic families below the poverty level
(from 40.7% in 1980 to 31.3% in 2000). It is not likely that this decrease is influenced by
a modification in the calculation of the poverty level itself, as there have been no major
changes in the way the poverty level is calculated (Weinberg 1995).
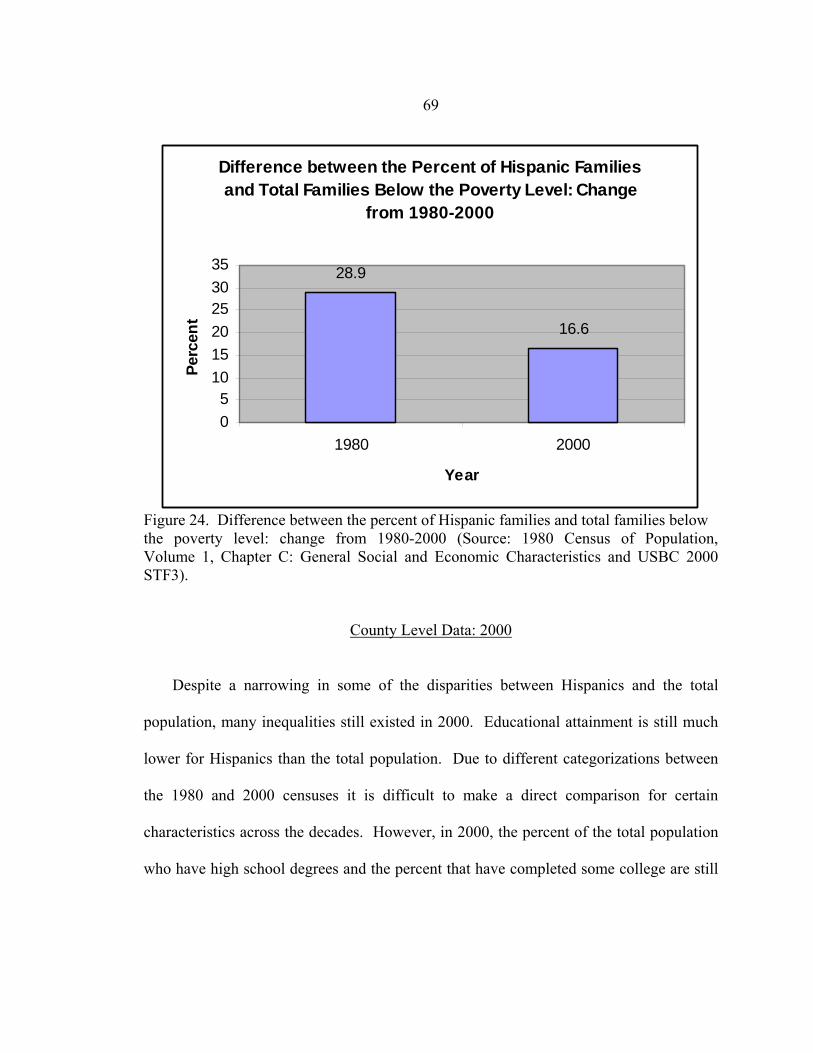
69
Difference between the Percent of Hispanic Families and Total Families Below the Poverty Level: Change
from 1980-2000
28.9
16.6
05
101520253035
1980 2000
Year
Perc
ent
Figure 24. Difference between the percent of Hispanic families and total families below the poverty level: change from 1980-2000 (Source: 1980 Census of Population, Volume 1, Chapter C: General Social and Economic Characteristics and USBC 2000 STF3).
County Level Data: 2000
Despite a narrowing in some of the disparities between Hispanics and the total
population, many inequalities still existed in 2000. Educational attainment is still much
lower for Hispanics than the total population. Due to different categorizations between
the 1980 and 2000 censuses it is difficult to make a direct comparison for certain
characteristics across the decades. However, in 2000, the percent of the total population
who have high school degrees and the percent that have completed some college are still
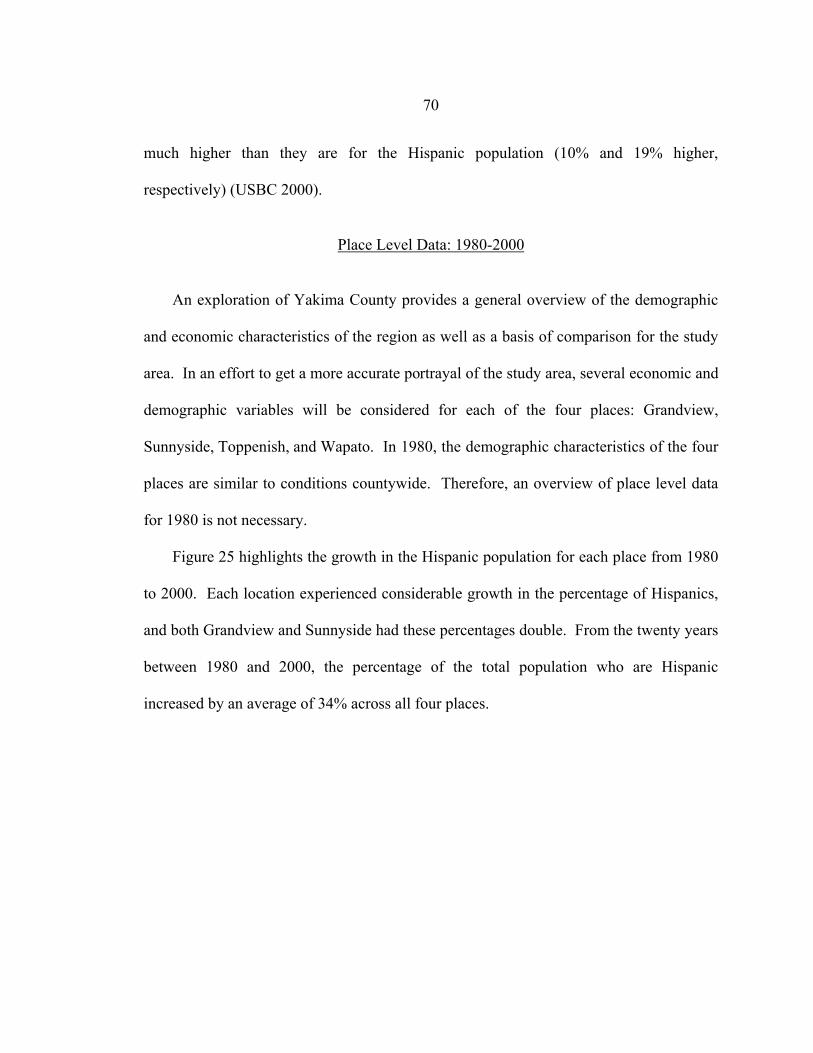
70
much higher than they are for the Hispanic population (10% and 19% higher,
respectively) (USBC 2000).
Place Level Data: 1980-2000
An exploration of Yakima County provides a general overview of the demographic
and economic characteristics of the region as well as a basis of comparison for the study
area. In an effort to get a more accurate portrayal of the study area, several economic and
demographic variables will be considered for each of the four places: Grandview,
Sunnyside, Toppenish, and Wapato. In 1980, the demographic characteristics of the four
places are similar to conditions countywide. Therefore, an overview of place level data
for 1980 is not necessary.
Figure 25 highlights the growth in the Hispanic population for each place from 1980
to 2000. Each location experienced considerable growth in the percentage of Hispanics,
and both Grandview and Sunnyside had these percentages double. From the twenty years
between 1980 and 2000, the percentage of the total population who are Hispanic
increased by an average of 34% across all four places.
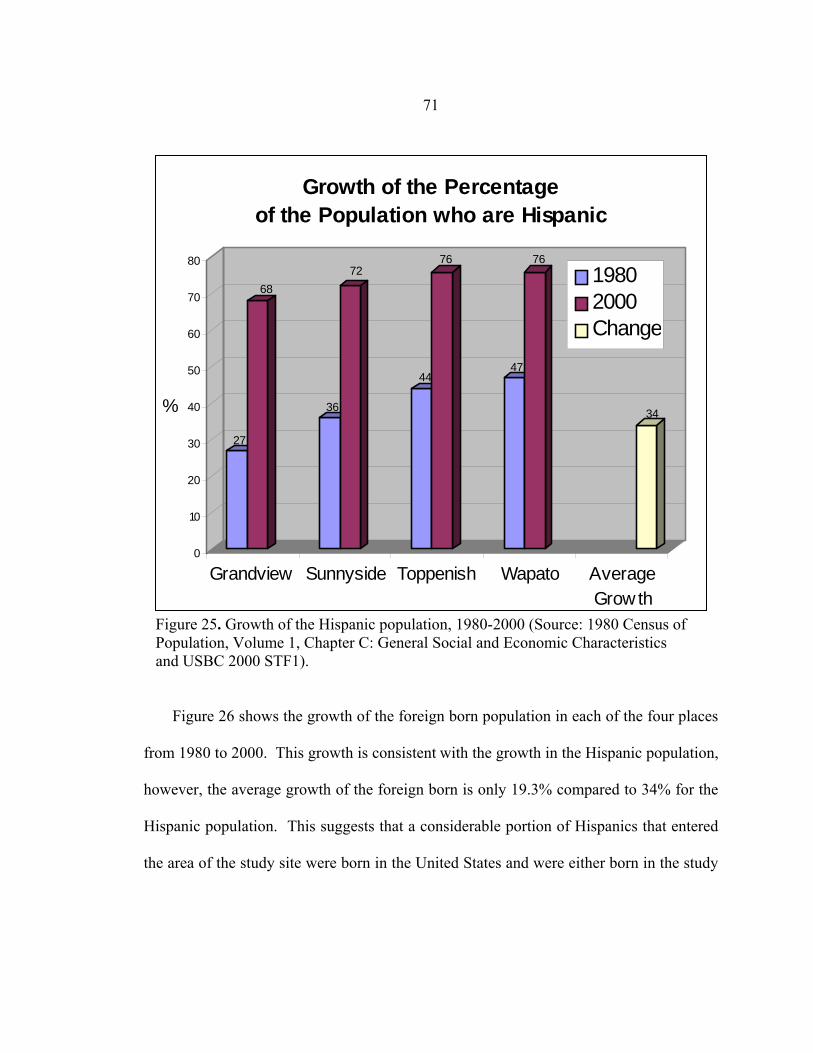
71
Figure 25. Growth of the Hispanic population, 1980-2000 (Source: 1980 Census of Population, Volume 1, Chapter C: General Social and Economic Characteristics and USBC 2000 STF1).
Figure 26 shows the growth of the foreign born population in each of the four places
from 1980 to 2000. This growth is consistent with the growth in the Hispanic population,
however, the average growth of the foreign born is only 19.3% compared to 34% for the
Hispanic population. This suggests that a considerable portion of Hispanics that entered
the area of the study site were born in the United States and were either born in the study
27
68
36
72
44
76
47
76
34
0
10
20
30
40
50
60
70
80
%
Grandview Sunnyside Toppenish Wapato AverageGrow th
Growth of the Percentage of the Population who are Hispanic
19802000Change
72
area or migrated from other areas of the country. Another less likely possibility is that
another ethnic group accounts for the growth in the foreign born population.
Figure 26. Growth of the foreign born population 1980-2000 (Source: 1980 Census of Population, Volume 1, Chapter C: General Social and Economic Characteristics and USBC 2000 STF3).
Accompanying the growth in the Hispanic percentage of the population is a change
in the linguistic orientation of the population. Figure 27 highlights the growth in the
percentage of the population of each place that speaks Spanish. Again, both Grandview
and Sunnyside had the percentage of their population who speak Spanish double in the
6.8
26.6
11.1
35
14.9
32.6
17.1
32.8
19.3
0
5
10
15
20
25
30
35
40
%
Grandview Sunnyside Toppenish Wapato AverageGrowth
Growth of the Foreign Born Population
1980
2000
Change
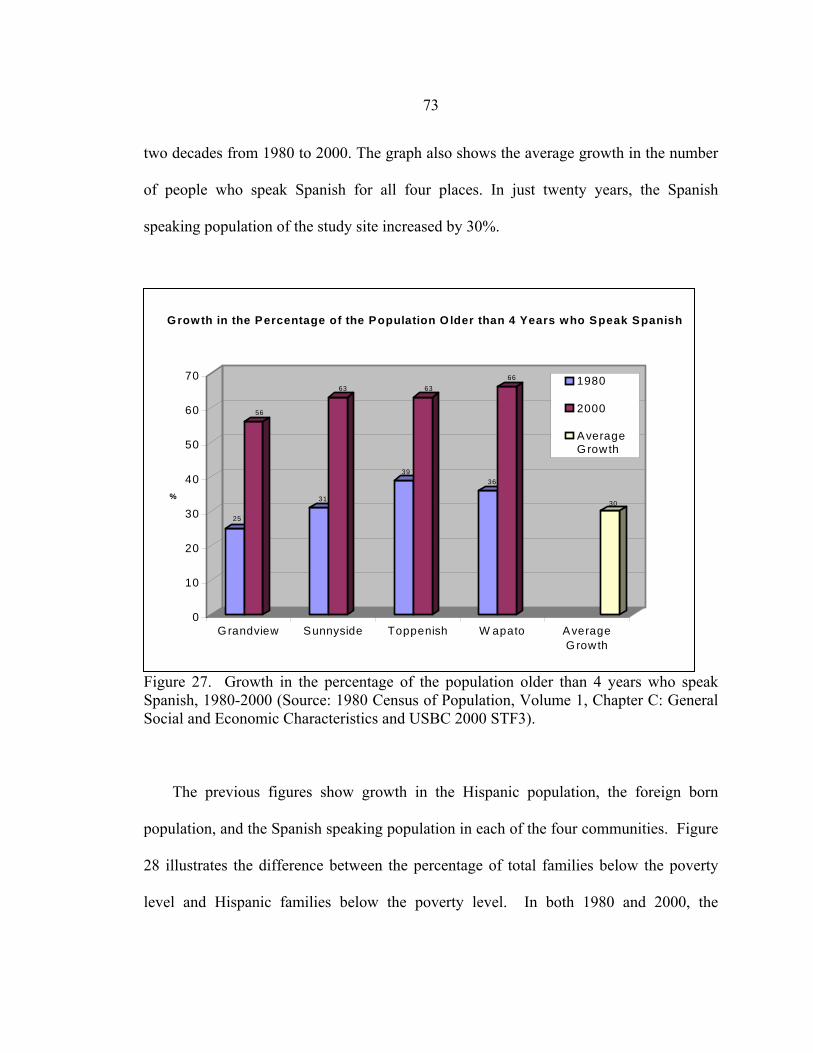
73
two decades from 1980 to 2000. The graph also shows the average growth in the number
of people who speak Spanish for all four places. In just twenty years, the Spanish
speaking population of the study site increased by 30%.
25
56
31
63
39
63
36
66
30
0
10
20
30
40
50
60
70
%
Grandview Sunnyside Toppenish W apato AverageGrowth
Growth in the Percentage of the Population O lder than 4 Years who Speak Spanish
1980
2000
AverageGrowth
Figure 27. Growth in the percentage of the population older than 4 years who speak Spanish, 1980-2000 (Source: 1980 Census of Population, Volume 1, Chapter C: General Social and Economic Characteristics and USBC 2000 STF3).
The previous figures show growth in the Hispanic population, the foreign born
population, and the Spanish speaking population in each of the four communities. Figure
28 illustrates the difference between the percentage of total families below the poverty
level and Hispanic families below the poverty level. In both 1980 and 2000, the
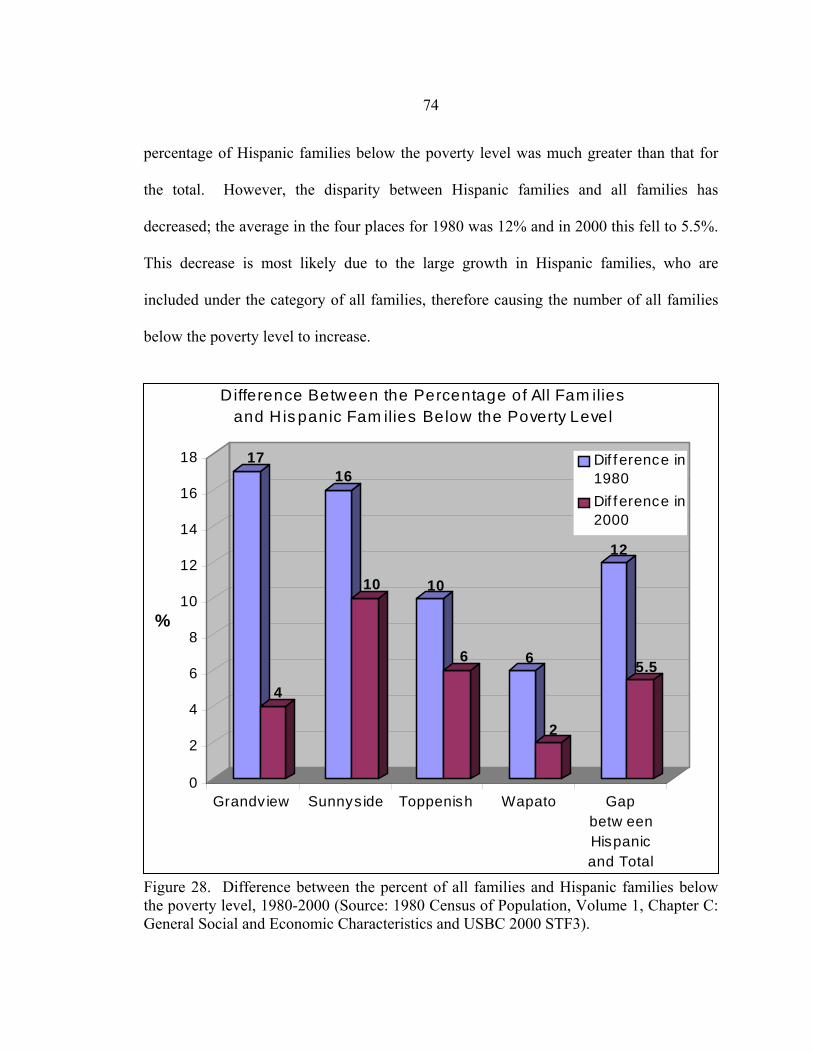
74
percentage of Hispanic families below the poverty level was much greater than that for
the total. However, the disparity between Hispanic families and all families has
decreased; the average in the four places for 1980 was 12% and in 2000 this fell to 5.5%.
This decrease is most likely due to the large growth in Hispanic families, who are
included under the category of all families, therefore causing the number of all families
below the poverty level to increase.
Figure 28. Difference between the percent of all families and Hispanic families below the poverty level, 1980-2000 (Source: 1980 Census of Population, Volume 1, Chapter C: General Social and Economic Characteristics and USBC 2000 STF3).
17
4
16
10 10
6 6
2
12
5.5
0
2
4
6
8
10
12
14
16
18
%
Grandview Sunnyside Toppenish Wapato Gapbetw eenHispanicand Total
D ifference Between the Percentage of All Fam ilies and His panic Fam ilies Below the Poverty Level
Dif f erence in1980Dif ference in2000
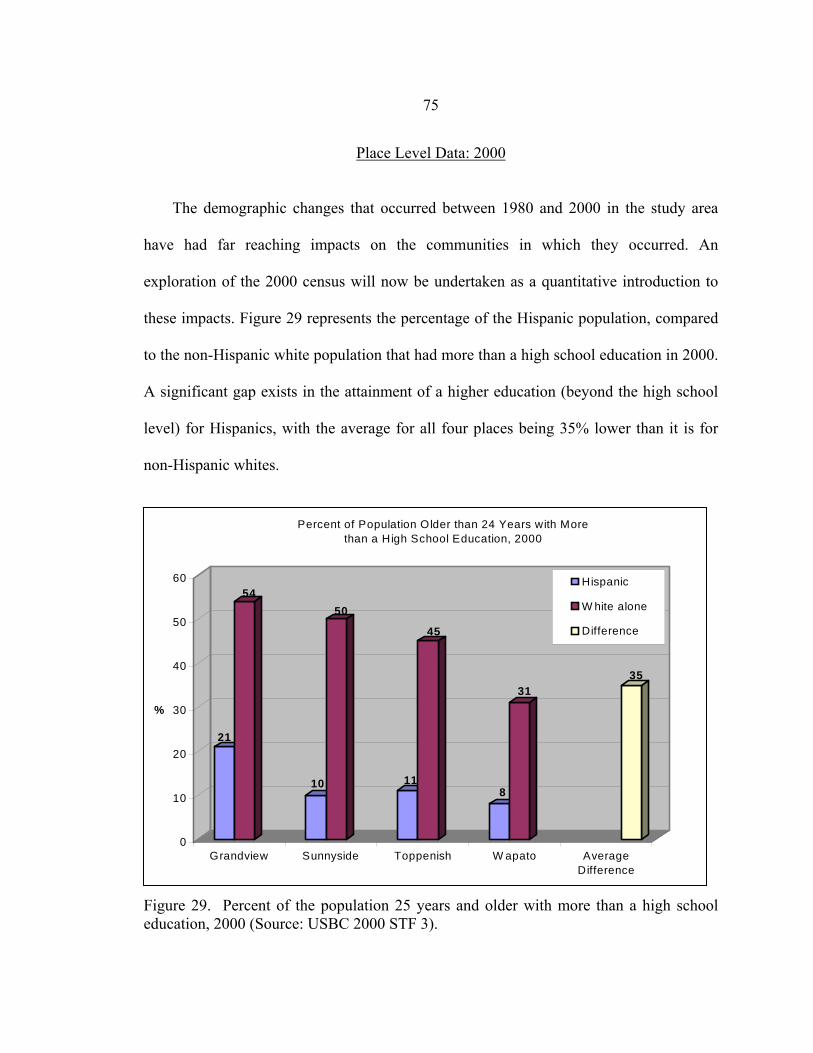
75
Place Level Data: 2000 The demographic changes that occurred between 1980 and 2000 in the study area
have had far reaching impacts on the communities in which they occurred. An
exploration of the 2000 census will now be undertaken as a quantitative introduction to
these impacts. Figure 29 represents the percentage of the Hispanic population, compared
to the non-Hispanic white population that had more than a high school education in 2000.
A significant gap exists in the attainment of a higher education (beyond the high school
level) for Hispanics, with the average for all four places being 35% lower than it is for
non-Hispanic whites.
Figure 29. Percent of the population 25 years and older with more than a high school education, 2000 (Source: USBC 2000 STF 3).
21
54
10
50
11
45
8
3135
0
10
20
30
40
50
60
%
Grandview Sunnyside Toppenish W apato AverageDifference
Percent of Population Older than 24 Years with More than a High School Education, 2000
Hispanic
W hite alone
Difference
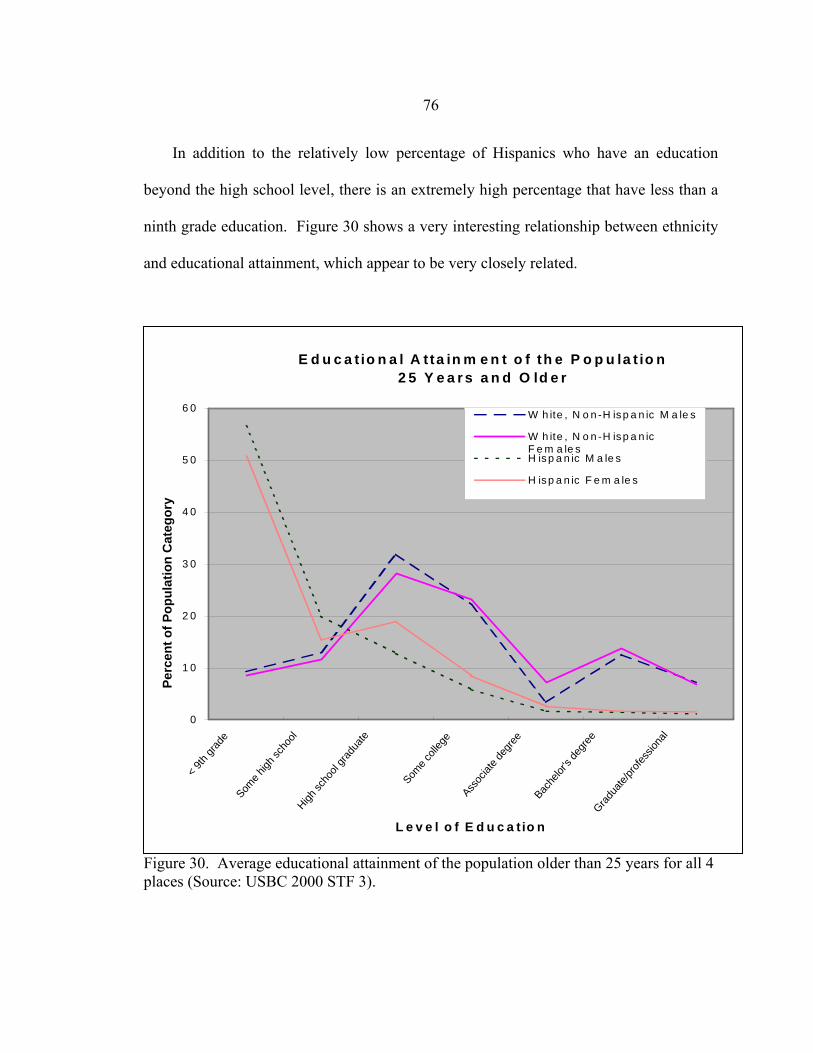
76
In addition to the relatively low percentage of Hispanics who have an education
beyond the high school level, there is an extremely high percentage that have less than a
ninth grade education. Figure 30 shows a very interesting relationship between ethnicity
and educational attainment, which appear to be very closely related.
E d u c a t io n a l A t ta in m e n t o f th e P o p u la t io n 2 5 Y e a r s a n d O ld e r
0
1 0
2 0
3 0
4 0
5 0
6 0
< 9th
grade
Some h
igh sc
hool
High sc
hool
gradu
ate
Some c
olleg
e
Ass
ociat
e deg
ree
Bac
helor
's de
gree
Gradua
te/pro
fessio
nal
L e v e l o f E d u c a t io n
Perc
ent o
f Pop
ulat
ion
Cat
egor
y
W h ite , N o n -H isp a n ic M a le s
W h ite , N o n -H isp a n icF e m a le sH isp a n ic M a le s
H isp a n ic F e m a le s
Figure 30. Average educational attainment of the population older than 25 years for all 4 places (Source: USBC 2000 STF 3).
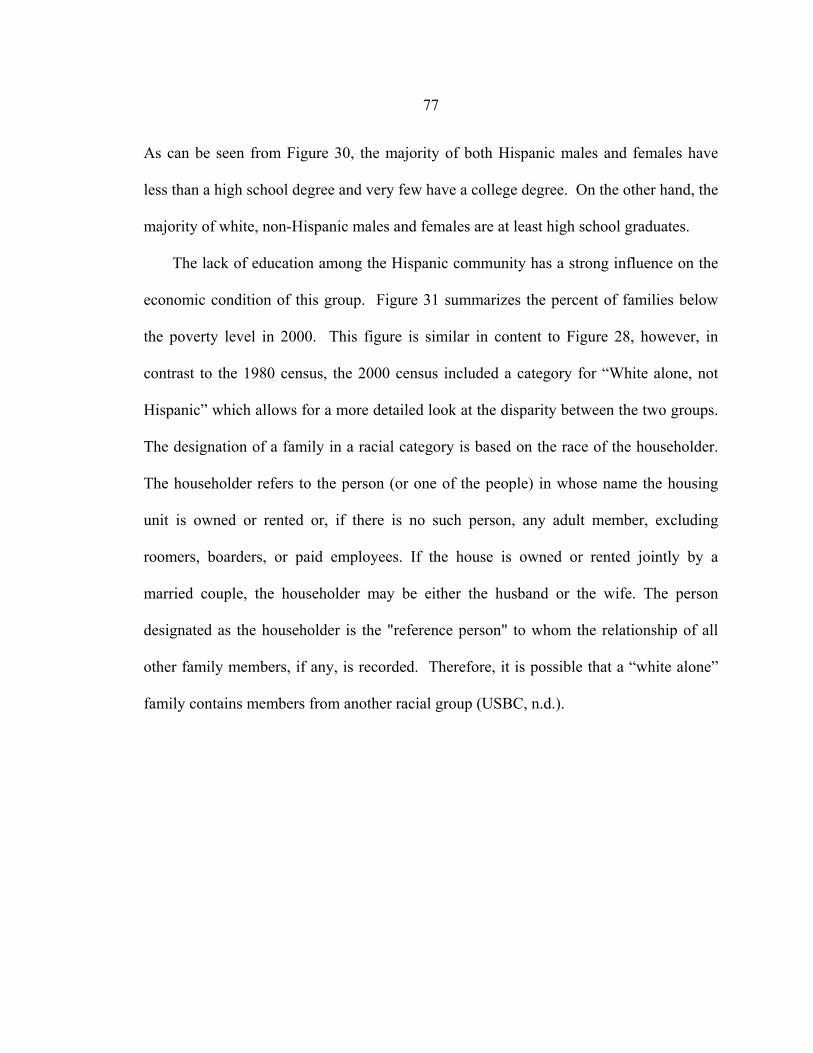
77
As can be seen from Figure 30, the majority of both Hispanic males and females have
less than a high school degree and very few have a college degree. On the other hand, the
majority of white, non-Hispanic males and females are at least high school graduates.
The lack of education among the Hispanic community has a strong influence on the
economic condition of this group. Figure 31 summarizes the percent of families below
the poverty level in 2000. This figure is similar in content to Figure 28, however, in
contrast to the 1980 census, the 2000 census included a category for “White alone, not
Hispanic” which allows for a more detailed look at the disparity between the two groups.
The designation of a family in a racial category is based on the race of the householder.
The householder refers to the person (or one of the people) in whose name the housing
unit is owned or rented or, if there is no such person, any adult member, excluding
roomers, boarders, or paid employees. If the house is owned or rented jointly by a
married couple, the householder may be either the husband or the wife. The person
designated as the householder is the "reference person" to whom the relationship of all
other family members, if any, is recorded. Therefore, it is possible that a “white alone”
family contains members from another racial group (USBC, n.d.).
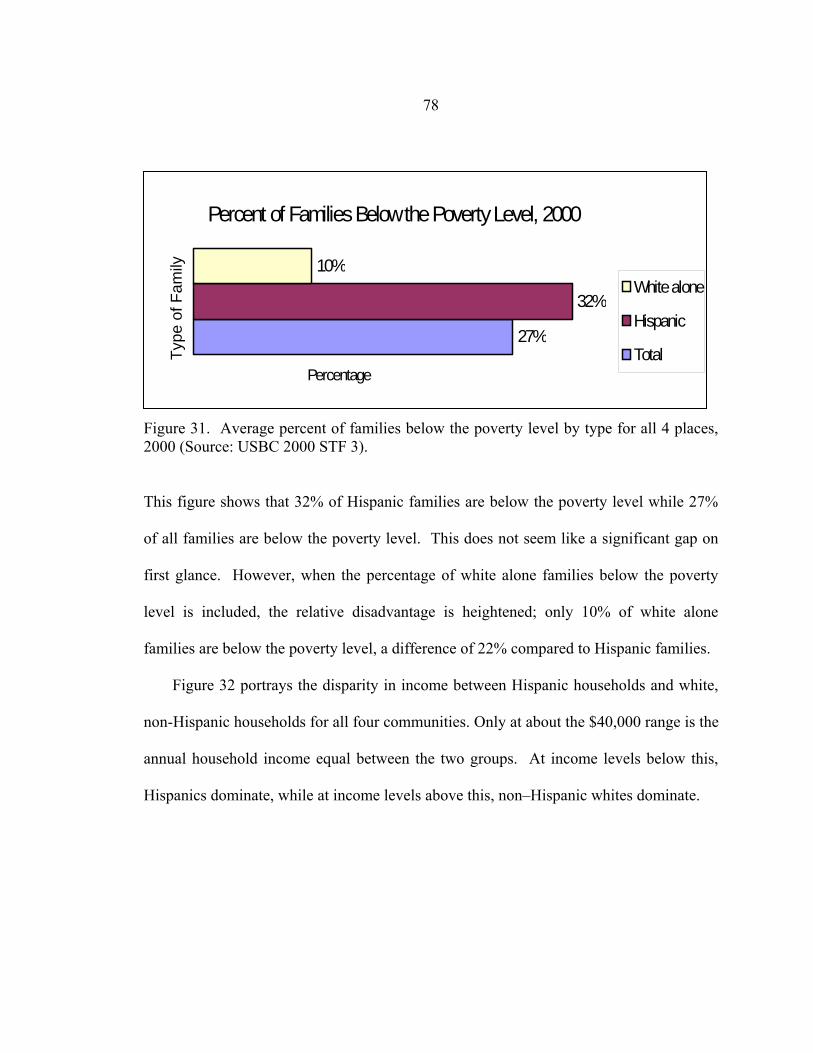
78
Percent of Families Below the Poverty Level, 2000
27%
32%
10%
Type
of F
amily
Percentage
White alone
Hispanic
Total
Figure 31. Average percent of families below the poverty level by type for all 4 places, 2000 (Source: USBC 2000 STF 3).
This figure shows that 32% of Hispanic families are below the poverty level while 27%
of all families are below the poverty level. This does not seem like a significant gap on
first glance. However, when the percentage of white alone families below the poverty
level is included, the relative disadvantage is heightened; only 10% of white alone
families are below the poverty level, a difference of 22% compared to Hispanic families.
Figure 32 portrays the disparity in income between Hispanic households and white,
non-Hispanic households for all four communities. Only at about the $40,000 range is the
annual household income equal between the two groups. At income levels below this,
Hispanics dominate, while at income levels above this, non–Hispanic whites dominate.
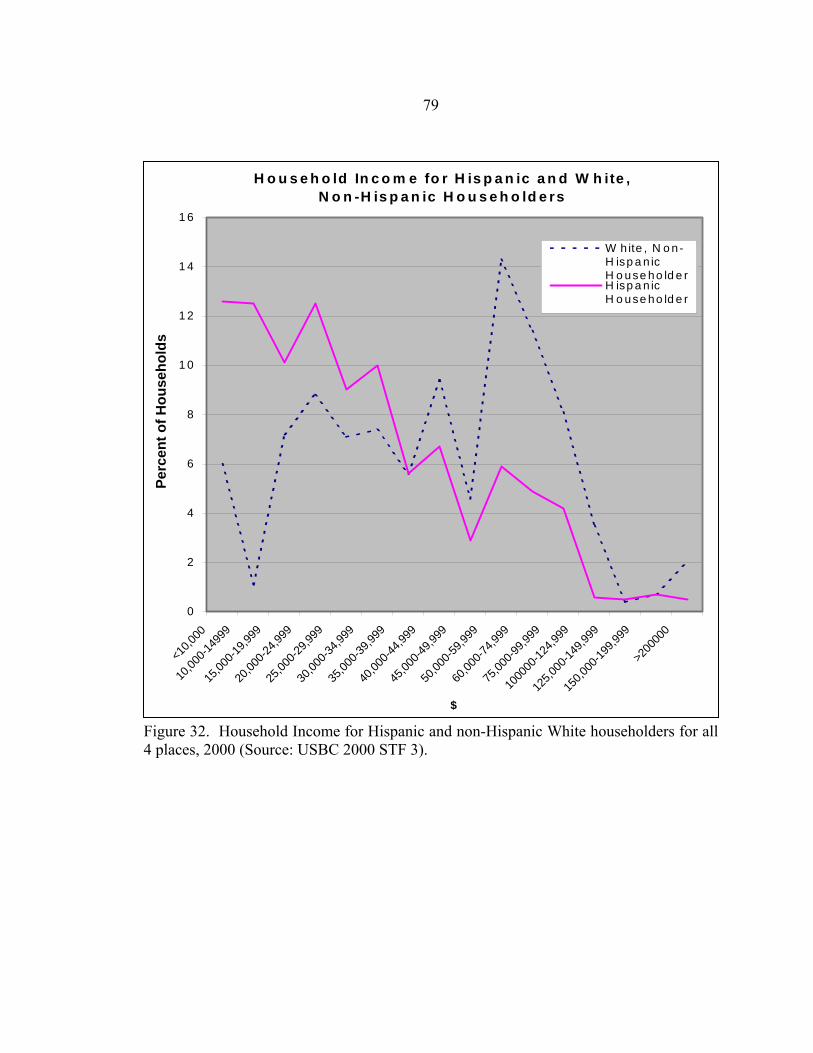
79
Figure 32. Household Income for Hispanic and non-Hispanic White householders for all 4 places, 2000 (Source: USBC 2000 STF 3).
H o u s e h o ld In c o m e fo r H is p a n ic a n d W h ite , N o n -H is p a n ic H o u s e h o ld e rs
0
2
4
6
8
1 0
1 2
1 4
1 6
<10,0
00
10,00
0-149
99
15,00
0-19,9
99
20,00
0-24,9
99
25,00
0-29,9
99
30,00
0-34,9
99
35,00
0-39,9
99
40,00
0-44,9
99
45,00
0-49,9
99
50,00
0-59,9
99
60,00
0-74,9
99
75,00
0-99,9
99
1000
00-12
4,999
125,0
00-14
9,999
150,0
00-19
9,999
>200
000
$
Perc
ent o
f Hou
seho
lds
W hite , N o n -H isp a n icH o use ho ld e rH isp a n icH o use ho ld e r
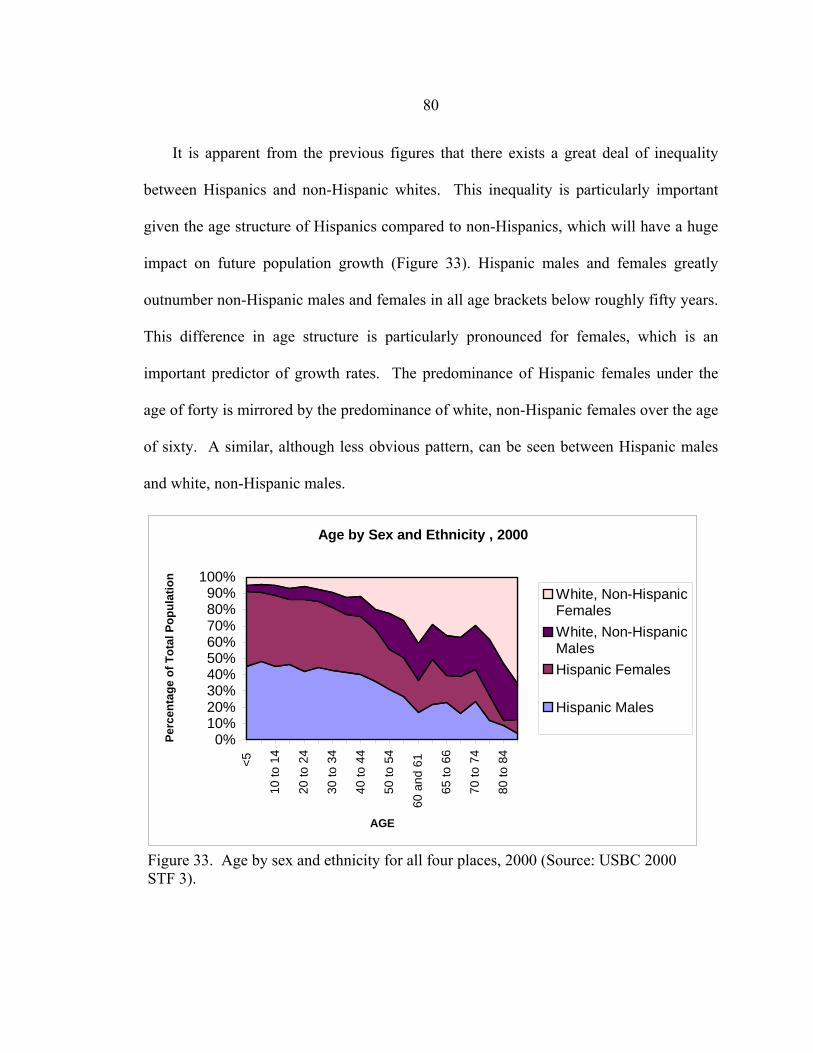
80
It is apparent from the previous figures that there exists a great deal of inequality
between Hispanics and non-Hispanic whites. This inequality is particularly important
given the age structure of Hispanics compared to non-Hispanics, which will have a huge
impact on future population growth (Figure 33). Hispanic males and females greatly
outnumber non-Hispanic males and females in all age brackets below roughly fifty years.
This difference in age structure is particularly pronounced for females, which is an
important predictor of growth rates. The predominance of Hispanic females under the
age of forty is mirrored by the predominance of white, non-Hispanic females over the age
of sixty. A similar, although less obvious pattern, can be seen between Hispanic males
and white, non-Hispanic males.
Age by Sex and Ethnicity , 2000
0%10%20%30%40%50%60%70%80%90%
100%
<5
10 to
14
20 to
24
30 to
34
40 to
44
50 to
54
60
and
61
65 to
66
70
to 7
4
80
to 8
4
AGE
Perc
enta
ge o
f Tot
al P
opul
atio
n
White, Non-HispanicFemalesWhite, Non-HispanicMalesHispanic Females
Hispanic Males
Figure 33. Age by sex and ethnicity for all four places, 2000 (Source: USBC 2000 STF 3).
81
Conclusion An analysis of census data from the last two decades shows that change has occurred
over time in the population composition, educational attainment, and income levels of
Hispanics in the Yakima Valley. It is clear from this data that Hispanics still lag far
behind non-Hispanic whites in educational attainment and income levels. This
examination of U.S. Census data provides a good foundation for an initial look at the
communities of the lower Yakima Valley. However, quantitative data provides only a
glimpse of the more complicated, qualitative aspects of these communities. The
information in this chapter therefore serves as a basis for later chapters.
82
CHAPTER 5
GEOGRAPHIC INFORMATION SYSTEM ANALYSIS This chapter will explore the spatial relationships and impacts of certain social
characteristics of the Hispanic population of the lower Yakima Valley. Data from the
1990 census and 2000 census have been put into a Geographic Information System for
analysis and the results are presented in several different choropleth maps. Each of these
maps represents a different aspect of assimilation: economic, spatial, and cultural. For
purposes of simplification, each stage of assimilation is based on one census variable.
Economic assimilation is based on per capita income, spatial assimilation is based on
residential segregation, and cultural assimilation on linguistic isolation.
Spatial Assimilation and GIS Studies
The residential settlement pattern of immigrant groups in the United States is the
subject of much research. Where and how immigrants choose to reside has significant
impacts on the communities in which they settle. These communities are responsible for
overcoming cultural barriers that may require actions that range from government
policies to educational modifications. These actions are particularly challenging when a
foreign language inhibits communication, as is the case with many recent Hispanic
immigrants. Yakima Valley is an example of an area that has undergone a demographic,
as well as a cultural transformation, and has been forced to confront these issues. It is
83
within the context of this location that the topics of residential segregation and immigrant
assimilation will be explored.
It is suggested that the more immigrant groups are concentrated together, the less
interaction they will have with members of their host society. This level of interaction
greatly influences how quickly and to what extent immigrants will adopt the practices of
their host society. The connection between immigrant assimilation and residential
location was formally developed by Massey in 1985 and is known as the model of spatial
assimilation/residential segregation (Massey 1985). The model is based on the
assumption that as immigrants become more familiar with their host country’s culture
and begin to earn more money, they become more geographically mobile. As their socio-
economic status improves, immigrants tend to move away from areas of ethnic
concentration, into neighborhoods dominated by a non-immigrant population. Once this
residential integration (or spatial assimilation) occurs it is possible for primary level
interaction to begin between the immigrants and their host society, facilitating a process
of assimilation. Indeed, many studies highlight a tendency for immigrants to cluster
together initially for support and then disperse from these areas over time as they become
more familiar with their new country’s culture and find better jobs (Allen and Turner
1996).
The model of spatial assimilation adds to the traditional model of assimilation, which
was developed by Gordon in 1964 (Massey 1985). Gordon’s model established seven
stages of assimilation, each of which corresponds to an increasing level of interaction
between the immigrant group and the host society and thus integration of the former
84
group into U.S. society. The first stage is cultural assimilation, whereby the immigrant
group adopts the language and cultural practices of the host society. The second stage is
structural assimilation, which involves both primary level interaction between the two
groups (such as clubs and social organizations) as well as economic advancement (such
as increased income and occupational status). Gordon’s model assumes that once cultural
and structural assimilation occur, all other stages will follow until the immigrant group
becomes completely absorbed by the host society (Gordon 1964). According to these
two models, spatial assimilation will occur alongside structural assimilation, but only
after cultural assimilation.
Studies of residential segregation involve at least two ethnic groups. Results have
generally supported the model of spatial assimilation; lower segregation corresponds to
greater cultural and structural assimilation and immigrants with higher levels of
education and income are less segregated than their cohorts of lower socio-economic
status. In addition to immigrant groups, many studies have focused on residential
segregation between blacks and non-blacks, as this has been a long-standing problem in
many urban areas of the United States (Allen and Turner 1996). Research is primarily
performed at the tract level and results are given as a general measure over an entire
region. For this reason, levels of residential segregation have been heavily criticized as
being “global” rather than “local”. The lack of consideration given to issues of spatial
variability and scale within segregation studies has prompted some scholars to develop
GIS techniques that address these deficiencies (Downey 2003). One of the statistical
methods used to calculate residential segregation will be introduced first, followed by a
85
description of an alternative method. Two scholars and their corresponding contributions
to the field of residential segregation through GIS techniques will also be described.
The index of dissimilarity, also referred to as the ‘D’ index, is the most widely
adopted statistical method used to compute segregation. The value of D ranges from zero
(indicating no segregation) to one (indicating complete segregation) and is a measure of
whether one particular group is distributed across areal units (such as block groups or
census tracts) in a given area in the same way as another group. A high value indicates
that the two groups tend to live in different tracts. D is usually converted into a
percentage and a value of 60 or above is considered very high. It means that 60% or more
of the members of one group would need to move to a different unit in order for the two
groups to be equally distributed. A value of 40 or 50 is considered a moderate level of
segregation, and a value of 30 or below is considered to be fairly low. The index of
dissimilarity is limited in that it can only analyze segregation between two population
groups (Wong 1996). Studies have also shown that the value of D increases when the
size of the enumeration unit becomes smaller and therefore using smaller units produces
relatively high segregation measures (Wu and Sui 2002).
The entropy based diversity index, also known as the spatial diversity index, or H,
reflects whether an areal unit is diverse in its population composition, and is not a
measure of residential segregation. A value of zero indicates complete dominance by one
group, while a high value (this index is open-ended) suggests a relatively even
distribution of population among groups. This index has several advantages over the
index of dissimilarity; it can be used for multiple groups, mapped (each areal unit is
86
assigned a value), and therefore can reflect local variations in diversity. However, as
with the index of dissimilarity, the spatial diversity index still fails to truly capture the
influence of interaction between groups (Wong 1996).
In an effort to overcome the aspatial nature of many of the indexes used to measure
residential segregation, Wong (2002) formulated an index called the local spatial
segregation index. Wong modified the spatial diversity index to account for interaction
between groups across boundaries. Wong’s index can be calculated in several ways, each
of which produces a slightly different result. An analysis may include only units that are
adjacent to the areal unit under consideration, or it may include units that are within a
specified distance from that areal unit. The latter of these two methods is based on the
exposure concept and can be considered as a distance-decay function in which different
weights are assigned to different locations based on their distance from a given areal unit.
While this technique is easily implemented in GIS, results are very sensitive to the
boundary effect, and are therefore less reliable (Wong 2002).
The topic of which index is most suitable for measuring residential segregation
dominates the literature on this issue and it is therefore important to be aware of the
differences between each method. One topic that is relatively less explored but just as
important is the use of GIS to correct for the deficiencies of the previously described
statistical measures. Studies of residential segregation are primarily based on
calculations performed in statistical packages rather than in a GIS. While many results
may be displayed on maps created in a GIS, few have used GIS as the primary method of
analysis. The most common complaint about the previously described statistical methods
87
is that they are global in nature and therefore do not accurately portray spatial variation
within regions nor do they account for interaction between groups which greatly effects
the level of segregation. Through analysis, GIS has the capabilities to perform various
operations that are explicitly spatial in nature, and thus of great benefit to the field of
segregation studies. As Wong (1996) has suggested, one can analyze numerous
socioeconomic variables in the census database to explore if segregation is related to any
particular variable. This ability can help a researcher to identify factors that may be
pertinent to the issue of residential segregation. Indeed, as Wong (1996) has pointed out,
“we may learn more about the spatial aspects of segregation through GIS.”
Two studies that have analyzed residential segregation through the use of GIS were
performed by Downey (2003) and Wu and Sui (2002). Both of these studies attempted to
produce a more accurate portrayal of segregation levels through spatial analysis. Wu and
Sui developed a multi-scale lacunarity analysis using ArcView Spatial Analyst to capture
multiple dimensions of segregation patterns at multiple scales. Downey introduced a
variable construction technique to measure the distance between social groups and
hazardous manufacturing facilities. Both of these studies were performed in raster data
models and relied primarily on techniques and functions supplied by the Spatial Analyst.
Through their research, these scholars have demonstrated that GIS is an invaluable tool
for use in segregation studies.
Given the value that GIS analysis has to offer to the field of segregation studies, the
lack of research specifically addressing this topic is perplexing. However, the literature
does suggest that as a focus on the spatial aspects of residential segregation continues to
88
be emphasized, there is a slow emergence in the incorporation of GIS analysis into this
field. Wong (1996) has suggested that this lack of connection between GIS and
segregation studies may be due in part to the nature of census data. He claims that
because the calculation of indices for measures of segregation only requires data from
Summary Tape Files, the “spatial domain” or cartographic aspect of the data is
completely overlooked. Another possible explanation may be that many studies of
segregation are performed by sociologists, who are less concerned (than geographers are)
in the spatial dimension.
In addition to the multitude of benefits that GIS analysis brings to the field of
segregation studies, there also exists the simple ability to display results visually on a
map. The use of maps can help deepen our understanding of segregation issues by
adding a visual dimension to statistical analysis that is often absent.
Analysis
Two of the formulas described in the literature review were used in this analysis: the
index of dissimilarity and the entropy index. The index of dissimilarity was used to
calculate residential segregation and the entropy index was used to calculate diversity.
Although both these methods have problems associated with them, they are widely
incorporated measure used in this field. As a result, some accuracy may be sacrificed,
but at the same time the legitimacy of using methods that are widely accepted in the field
is gained.
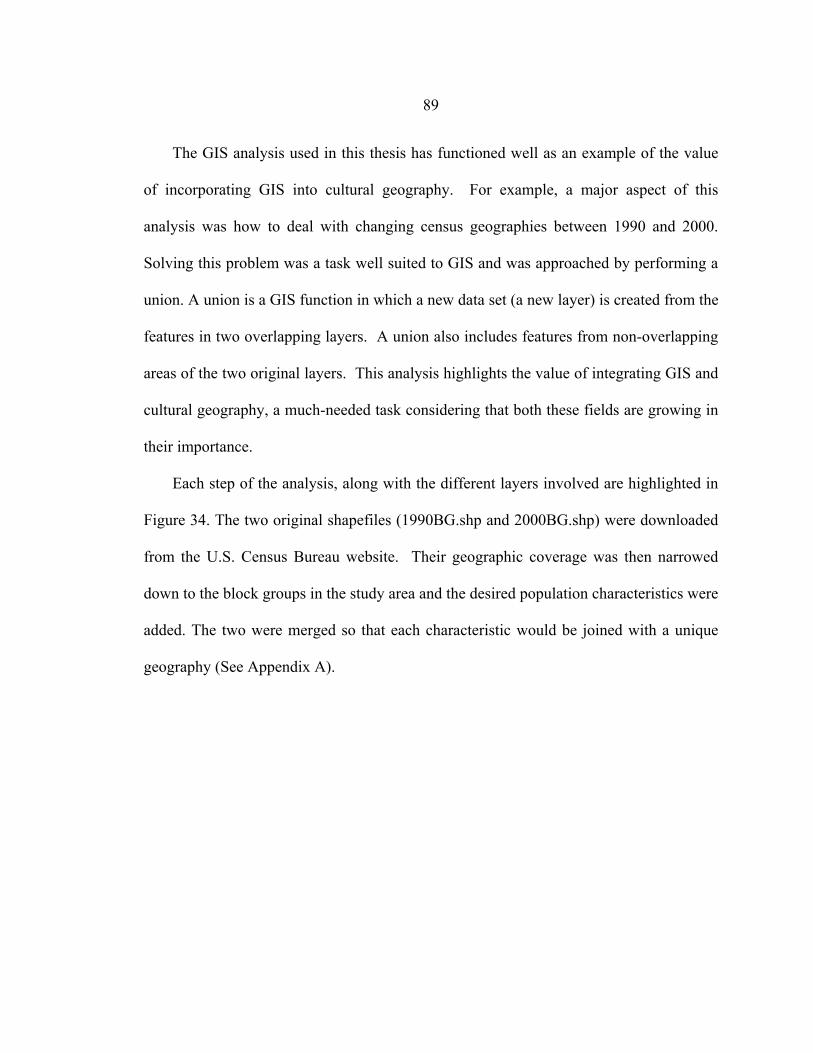
89
The GIS analysis used in this thesis has functioned well as an example of the value
of incorporating GIS into cultural geography. For example, a major aspect of this
analysis was how to deal with changing census geographies between 1990 and 2000.
Solving this problem was a task well suited to GIS and was approached by performing a
union. A union is a GIS function in which a new data set (a new layer) is created from the
features in two overlapping layers. A union also includes features from non-overlapping
areas of the two original layers. This analysis highlights the value of integrating GIS and
cultural geography, a much-needed task considering that both these fields are growing in
their importance.
Each step of the analysis, along with the different layers involved are highlighted in
Figure 34. The two original shapefiles (1990BG.shp and 2000BG.shp) were downloaded
from the U.S. Census Bureau website. Their geographic coverage was then narrowed
down to the block groups in the study area and the desired population characteristics were
added. The two were merged so that each characteristic would be joined with a unique
geography (See Appendix A).
90
Figure 34. Flow Chart of GIS Analysis.
1990BG.shp 2000BG.shp
Join to 1990 table
1990targetBG.shp
1990Layer.shp 2000Layer.shp
2000targetBG.shp
Select by attributes
Join to 2000 table
Union
Union.shp
Unionselection.shp
UnionSel.shp
Demographic_Ch.shp
Removed uncoincident geographies through attribute selection
Cultural.shp Economic.shp Spatial.shp
Removed unwanted slivers
Added fields for the change from 1990 to 2000 and calculated values for each new field
Symbolization and export
91
One of the major issues that arose from the temporal dimension of this analysis is
referred to as the modifiable areal unit problem (MAUP). The MAUP exists because
census boundaries, such as those for block groups or tracts, change over time with
shifting populations. Therefore, the geographic extent covered by a block group in 1990
for example, may not be the same in 2000. Correcting for this problem is time
consuming, yet well suited to GIS. First, all numerical data was converted into
percentages, so that these numbers would still pertain to a new geography. After
performing a Union, which overlapped the 1990 and 2000 layers, there was a new layer
consisting of various new units of enumeration. Some of these units were the actual
merger of a 1990 and 2000 block group, which created a unique geographic area that
could then be tied to socioeconomic data. The rest of the resulting units were either
geographies that were un-coincident between 1990 and 2000, or were tiny slivers where
census boundaries did not quite meet up. The un-coincident geographies were identified
in the attribute table and removed through attribute selection. The slivers were identified
manually and removed through additional attribute selection.
Each of the three final layers (Cultural.shp, Economic.shp, and Spatial.shp) is
displayed with the urban areas layer in separate data frames (Maps 7-10). The urban
areas layer was also downloaded from the Census Bureau website. Each block group
was symbolized using the choropleth technique.
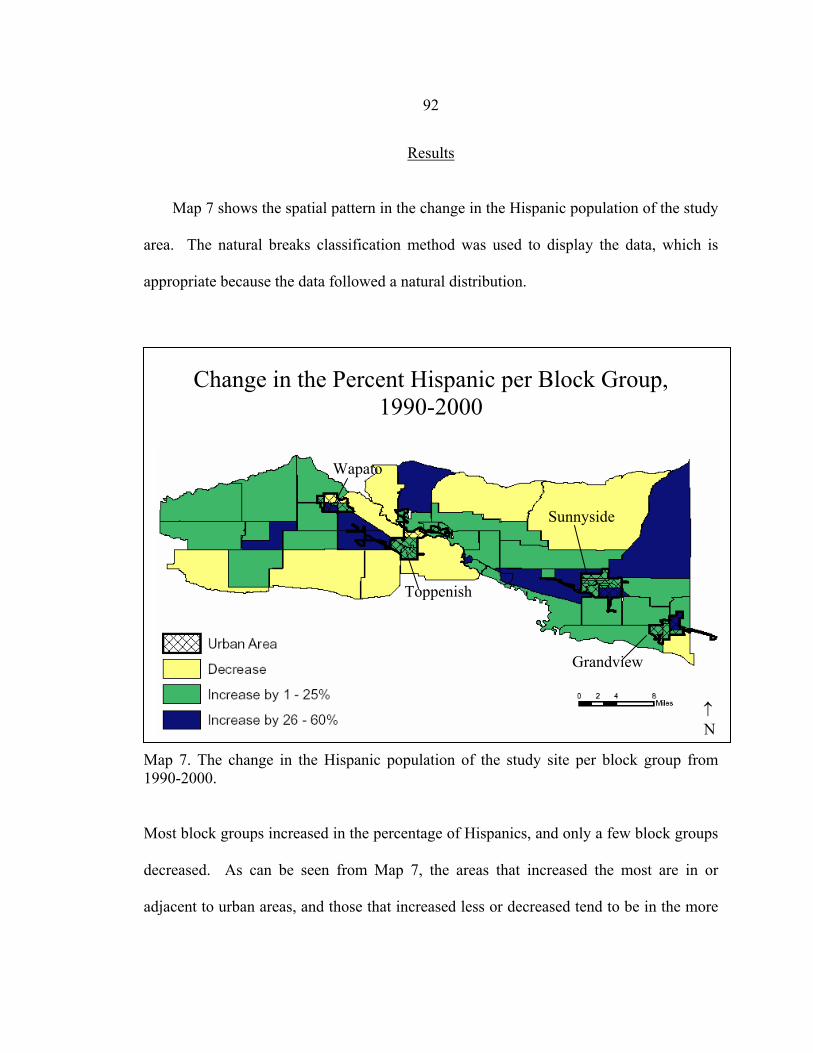
92
Results Map 7 shows the spatial pattern in the change in the Hispanic population of the study
area. The natural breaks classification method was used to display the data, which is
appropriate because the data followed a natural distribution.
Map 7. The change in the Hispanic population of the study site per block group from 1990-2000.
Most block groups increased in the percentage of Hispanics, and only a few block groups
decreased. As can be seen from Map 7, the areas that increased the most are in or
adjacent to urban areas, and those that increased less or decreased tend to be in the more
Change in the Percent Hispanic per Block Group, 1990-2000
Wapato
Sunnyside
↑ N
Toppenish
Grandview
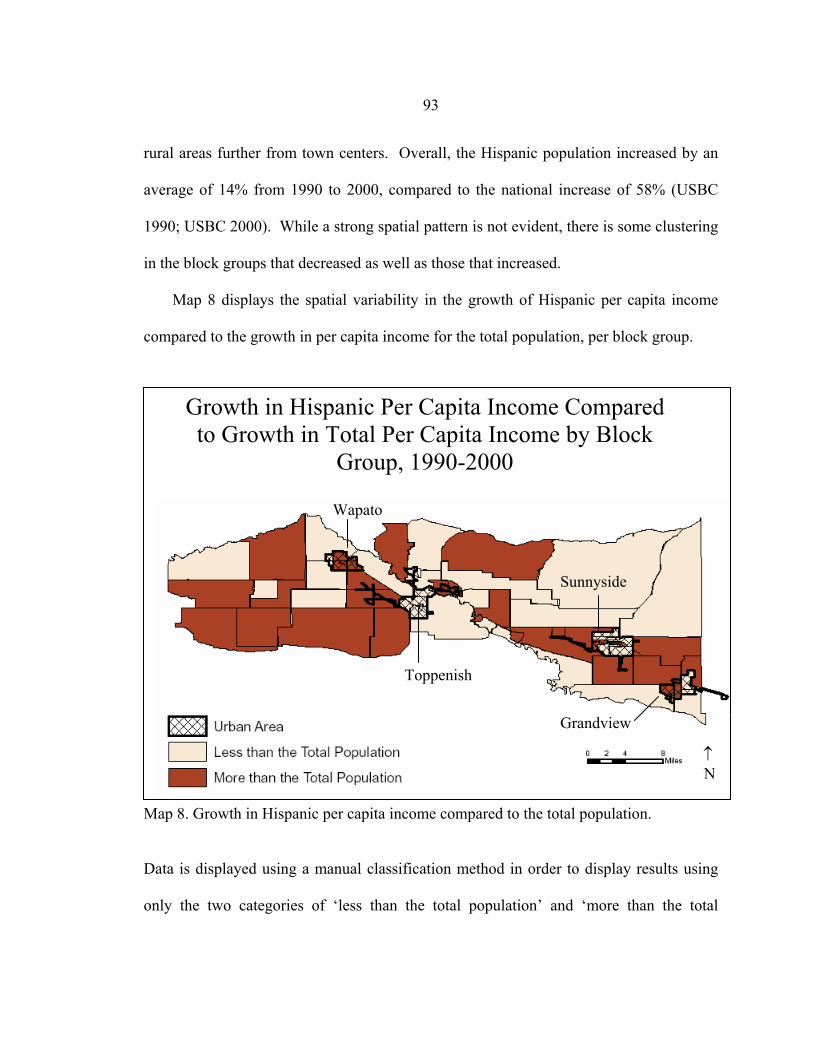
93
rural areas further from town centers. Overall, the Hispanic population increased by an
average of 14% from 1990 to 2000, compared to the national increase of 58% (USBC
1990; USBC 2000). While a strong spatial pattern is not evident, there is some clustering
in the block groups that decreased as well as those that increased.
Map 8 displays the spatial variability in the growth of Hispanic per capita income
compared to the growth in per capita income for the total population, per block group.
Map 8. Growth in Hispanic per capita income compared to the total population.
Data is displayed using a manual classification method in order to display results using
only the two categories of ‘less than the total population’ and ‘more than the total
Growth in Hispanic Per Capita Income Compared to Growth in Total Per Capita Income by Block
Group, 1990-2000
Wapato
Sunnyside
Toppenish
Grandview
↑ N
94
population.’ Hispanic per capita income grew by an average of $3,247 from 1990 to
2000, while total per capita income grew at an average of $3,142. Again, while no
striking spatial pattern is discernable, there does appear to be an association between
block groups where Hispanic per capita income grew more than the total population and
those where it grew less.
The change in the amount of residential segregation between Hispanics and non-
Hispanics from 1990 to 2000 was calculated using the dissimilarity index discussed
earlier in this chapter. Residential segregation for the study area was calculated using the
standard equation: D=1/2 ∑ Xi –Yi where Xi= the percent of population X in area i and
Yi= the percent of the population Y in area i. In this case, area i is each individual block
group, and populations X and Y are the percent Hispanic and the percent not Hispanic in
each block group out of the sum of all block groups. An absolute value is calculated for
each block group and then each individual result is summed together to give a general
measure over the entire study site (See Appendix B). In 1990, the index of dissimilarity
was 37.1% at the block group level, suggesting that 37.1% of one group would have to
move to a different block group in order for the two groups to be equally distributed.
Between 1990 and 2000, residential segregation decreased slightly from 37.1% to 36.3%.
A map portraying residential segregation is not included here because there is only one
value for the entire study area.
The index of dissimilarity, as previously mentioned, is very sensitive to the size of
the enumeration unit and tends to increase with smaller units. This is true in the case of
the study area, which shows lower levels of segregation at the census tract level. In 1990,
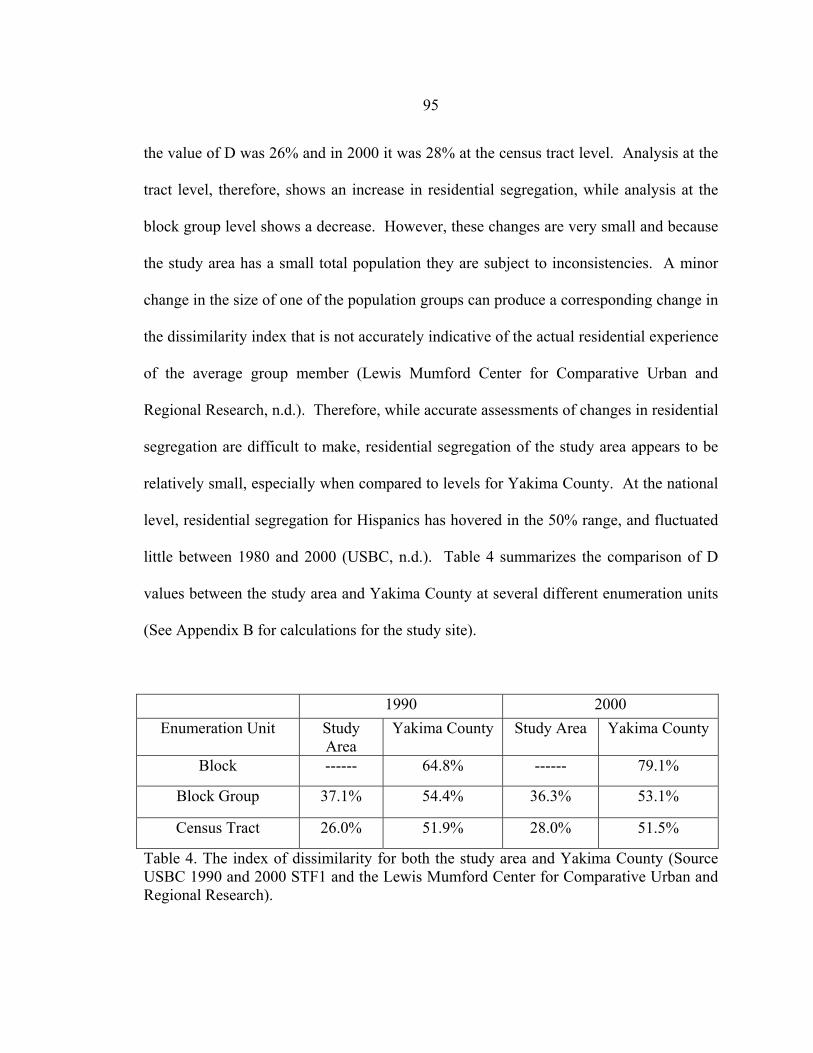
95
the value of D was 26% and in 2000 it was 28% at the census tract level. Analysis at the
tract level, therefore, shows an increase in residential segregation, while analysis at the
block group level shows a decrease. However, these changes are very small and because
the study area has a small total population they are subject to inconsistencies. A minor
change in the size of one of the population groups can produce a corresponding change in
the dissimilarity index that is not accurately indicative of the actual residential experience
of the average group member (Lewis Mumford Center for Comparative Urban and
Regional Research, n.d.). Therefore, while accurate assessments of changes in residential
segregation are difficult to make, residential segregation of the study area appears to be
relatively small, especially when compared to levels for Yakima County. At the national
level, residential segregation for Hispanics has hovered in the 50% range, and fluctuated
little between 1980 and 2000 (USBC, n.d.). Table 4 summarizes the comparison of D
values between the study area and Yakima County at several different enumeration units
(See Appendix B for calculations for the study site).
Table 4. The index of dissimilarity for both the study area and Yakima County (Source USBC 1990 and 2000 STF1 and the Lewis Mumford Center for Comparative Urban and Regional Research).
1990 2000 Enumeration Unit Study
Area Yakima County Study Area Yakima County
Block ------ 64.8% ------ 79.1%
Block Group 37.1% 54.4% 36.3% 53.1%
Census Tract 26.0% 51.9% 28.0% 51.5%
96
Changes between 1990 and 2000 appear to be minor for both the study area and Yakima
County. However, data for the study area from 1980 shows that a much greater increase
occurred between 1980 and 1990 than between 1990 and 2000. In 1980, the index of
dissimilarity at the census tract level was 18% for the study area. Therefore, the rate of
growth in residential segregation at the tract level has decreased considerably, from an
increase of 8% between 1980 and 1990 to an increase of only 2% from 1990 to 2000.
The entropy based diversity index, also known as H, was calculated for each block
group. This was done so by using the standard formula: H= -∑ Pk * Log Pk, where
Pk=the proportion of the population in the areal unit that belongs to population group k.
The two population groups used in this calculation were Hispanic and not Hispanic.
Calculations were performed for each block group for 1990 and 2000 (See Appendix B
for all calculations). The maximum possible value of H, or the maximum possible
diversity, is achieved when both population groups have an equal distribution in each
block group. It is therefore important to insure that the results are normalized, so that
they can be described on a scale of 0 to 100, with 0 representing no diversity and 100
representing complete diversity. This was done by performing the log function when
each group is equally represented, or Log base 2 of .5. The resulting sum for the
Hispanic and not Hispanic population groups equaled one (See Appendix B). Therefore,
the entropy index for each block group can be interpreted as a value on a scale between 0
and 100. Map 9 shows the change in the entropy value between 1990 and 2000 for each
block group in the study area. The data is displayed using a manual classification
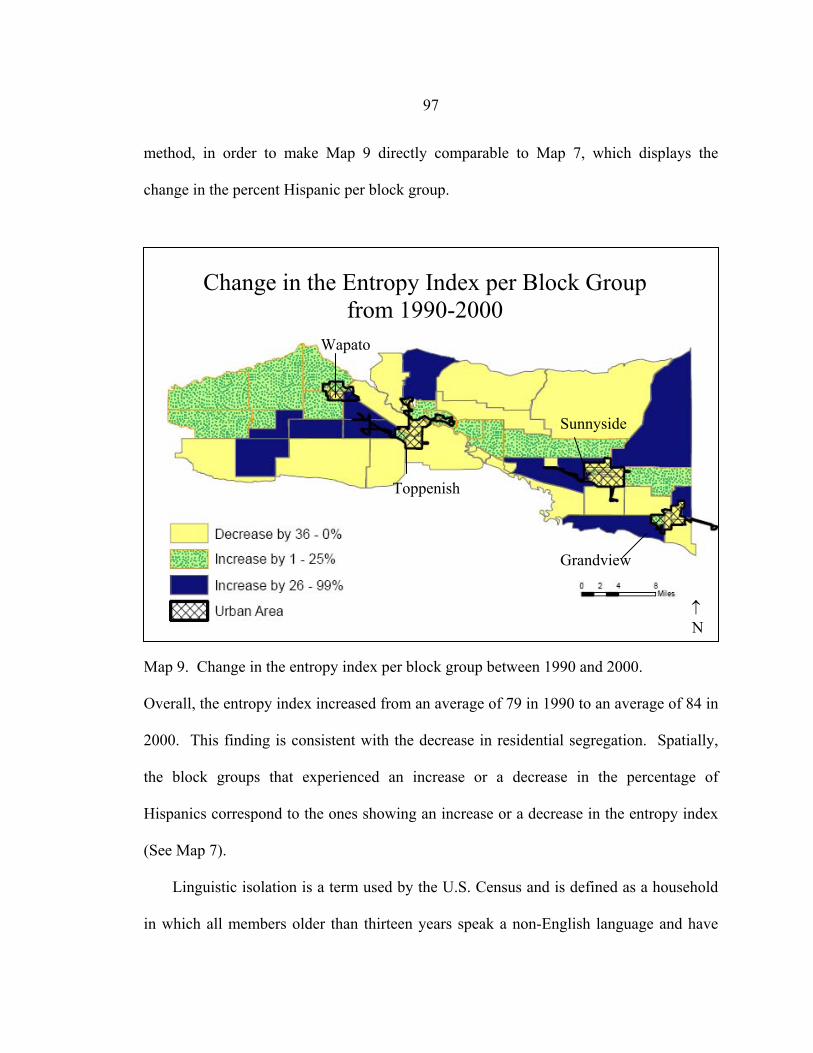
97
method, in order to make Map 9 directly comparable to Map 7, which displays the
change in the percent Hispanic per block group.
Map 9. Change in the entropy index per block group between 1990 and 2000.
Overall, the entropy index increased from an average of 79 in 1990 to an average of 84 in
2000. This finding is consistent with the decrease in residential segregation. Spatially,
the block groups that experienced an increase or a decrease in the percentage of
Hispanics correspond to the ones showing an increase or a decrease in the entropy index
(See Map 7).
Linguistic isolation is a term used by the U.S. Census and is defined as a household
in which all members older than thirteen years speak a non-English language and have
↑ N
Wapato
Sunnyside
Toppenish
Grandview
Change in the Entropy Index per Block Group from 1990-2000
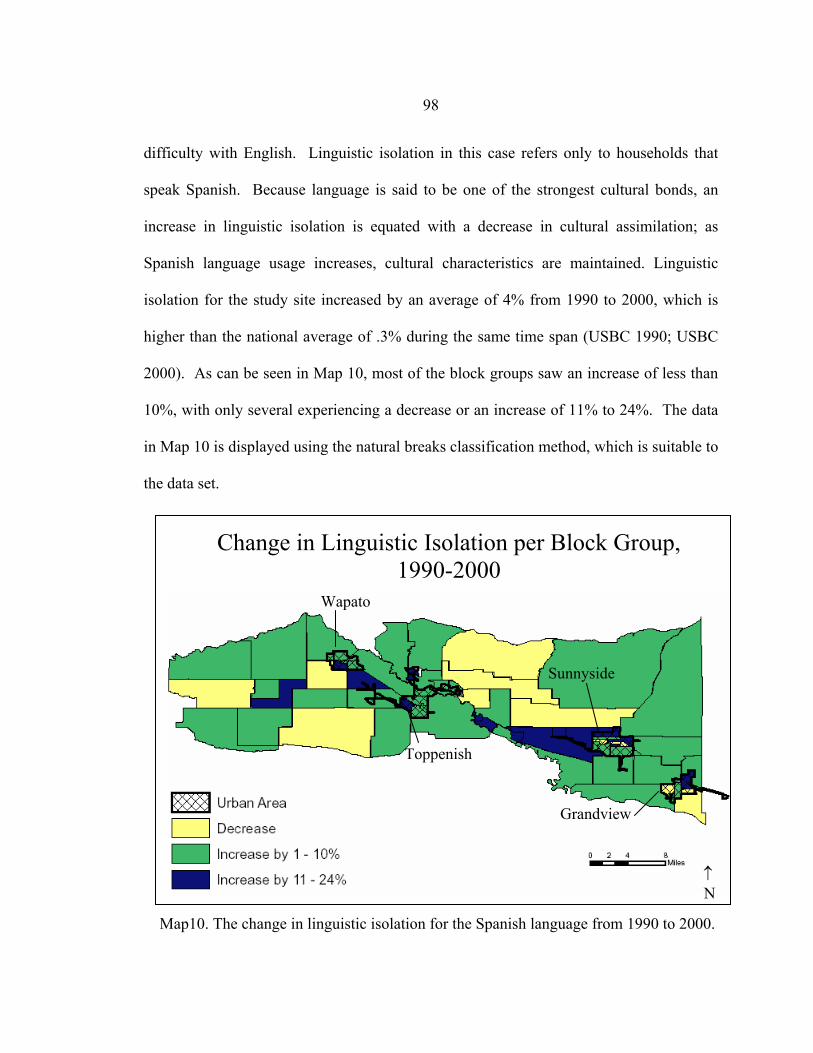
98
difficulty with English. Linguistic isolation in this case refers only to households that
speak Spanish. Because language is said to be one of the strongest cultural bonds, an
increase in linguistic isolation is equated with a decrease in cultural assimilation; as
Spanish language usage increases, cultural characteristics are maintained. Linguistic
isolation for the study site increased by an average of 4% from 1990 to 2000, which is
higher than the national average of .3% during the same time span (USBC 1990; USBC
2000). As can be seen in Map 10, most of the block groups saw an increase of less than
10%, with only several experiencing a decrease or an increase of 11% to 24%. The data
in Map 10 is displayed using the natural breaks classification method, which is suitable to
the data set.
Map10. The change in linguistic isolation for the Spanish language from 1990 to 2000.
Change in Linguistic Isolation per Block Group, 1990-2000
Wapato
Sunnyside
Toppenish
Grandview
↑ N
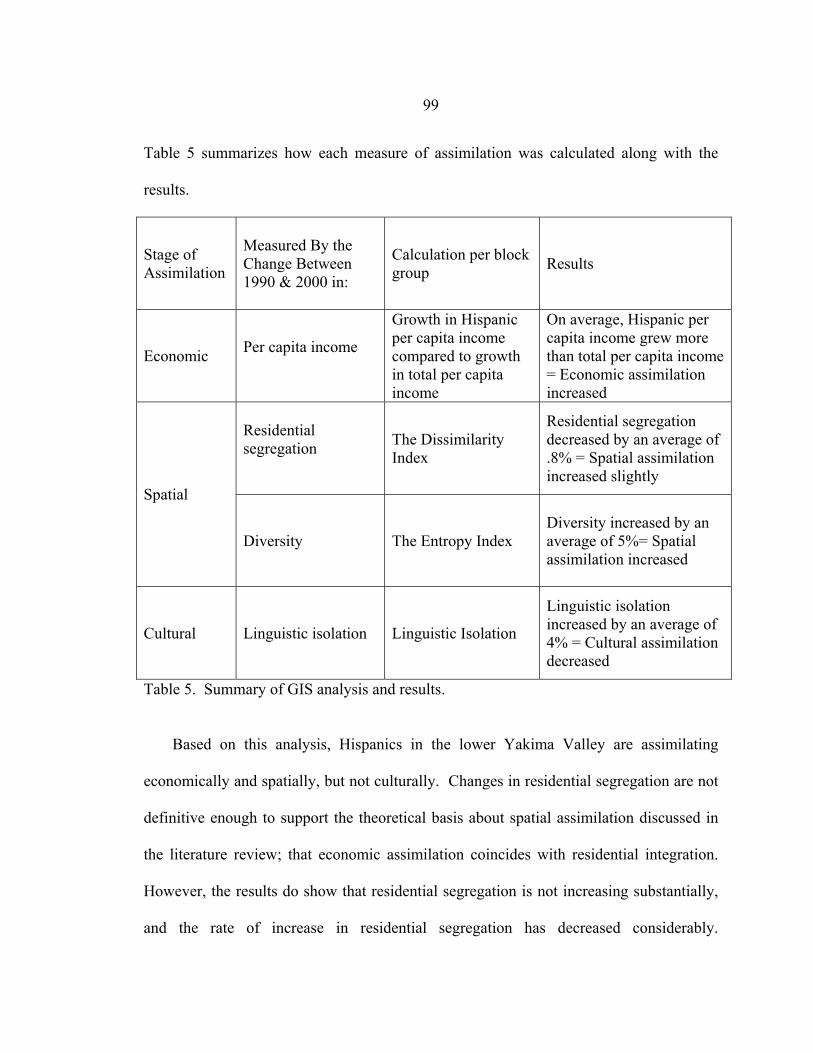
99
Table 5 summarizes how each measure of assimilation was calculated along with the
results.
Stage of Assimilation
Measured By the Change Between 1990 & 2000 in:
Calculation per block group Results
Economic Per capita income
Growth in Hispanic per capita income compared to growth in total per capita income
On average, Hispanic per capita income grew more than total per capita income = Economic assimilation increased
Residential segregation
The Dissimilarity Index
Residential segregation decreased by an average of .8% = Spatial assimilation increased slightly
Spatial
Diversity The Entropy Index Diversity increased by an average of 5%= Spatial assimilation increased
Cultural Linguistic isolation Linguistic Isolation
Linguistic isolation increased by an average of 4% = Cultural assimilation decreased
Table 5. Summary of GIS analysis and results.
Based on this analysis, Hispanics in the lower Yakima Valley are assimilating
economically and spatially, but not culturally. Changes in residential segregation are not
definitive enough to support the theoretical basis about spatial assimilation discussed in
the literature review; that economic assimilation coincides with residential integration.
However, the results do show that residential segregation is not increasing substantially,
and the rate of increase in residential segregation has decreased considerably.
100
Furthermore, diversity has increased for the study area. Cultural assimilation decreased,
despite a slight decrease in residential segregation, which indicates that Hispanics are
maintaining a unique cultural identity despite a possible increase in their interactions with
non-Hispanics. Further research is needed in order to qualify these findings, but this
analysis of census data provides a good initial look at the dynamics of communities in the
lower Yakima Valley.
101
CHAPTER 6
THE YAKIMA VALLEY: CULTURAL LANDSCAPE AND SOCIAL INTEGRATION
This chapter is based largely on fieldwork that was undertaken for seven days in
June and July of 2005. Each of the four towns in the study area were visited, and
fieldwork consisted of a combination of personal observations, interviews, and archival
research.
The term cultural landscape refers to the visible expression of human settlement on
the physical landscape. The idea of the cultural landscape was first introduced by Carl
Sauer in his seminal publication “The Morphology of Landscape.” Contrary to the ideas
of environmental determinism so popular at the time, Sauer granted primacy to culture as
a changing force. His beliefs are summed nicely in his famous quote: “the natural
landscape is being subject to transformation at the hands of man, the last and for us the
most important morphologic factor” (Sauer 1963, 344). Intrinsic to this term is the idea
that different cultures transform their landscapes in different ways and therefore much
can be inferred about a culture simply by observing the landscape that culture occupies
(Rowntree et al 2003).
Haverluk (1992) described a type of cultural landscape that is associated uniquely
with Hispanics, one he terms the “Hispanic imprint.” The Hispanic imprint is a
contemporary phenomenon and includes things such as Hispanic social organizations,
Spanish language media, Mexican food, Mexican-American housescapes, music, and art.
102
According to Haverluk, as the Hispanic imprint of an area increases, so does the
likelihood that the non-Hispanic population of that area will become influenced by
Hispanic cultural traits or “Hispanicized.” Therefore, an assessment of the cultural
landscape of the study area provides valuable insight about the dynamics of assimilation
in these communities. For example, if Hispanics did not have an obvious visible
representation on the landscape, it is less likely that Anglos are being strongly influenced
by the Hispanic culture. If, on the other hand, the Hispanic imprint is dominant in a
community, it is probable that Anglos are at least in some way exposed to Hispanic
culture. Language is the most visible representation of this influence. As stated by
Haverluk, “language is a significant aspect of the Hispanic imprint and may be an
appropriate diagnostic variable of regional change and/or maintenance” (Haverluk 1992,
98).
Hispanic Imprints
Research on the cultural landscape of the Yakima Valley involved personal
observation of each of the 4 communities. Data was initially collected by walking
through the main streets of each place, taking pictures and notes. Next, interviews were
conducted with the Chamber of Commerce for each place, which helped provide data on
how the cultural landscape has changed in the past two decades. Interviewees were also
very helpful in pointing out things that may not have been recognizable to an outsider.
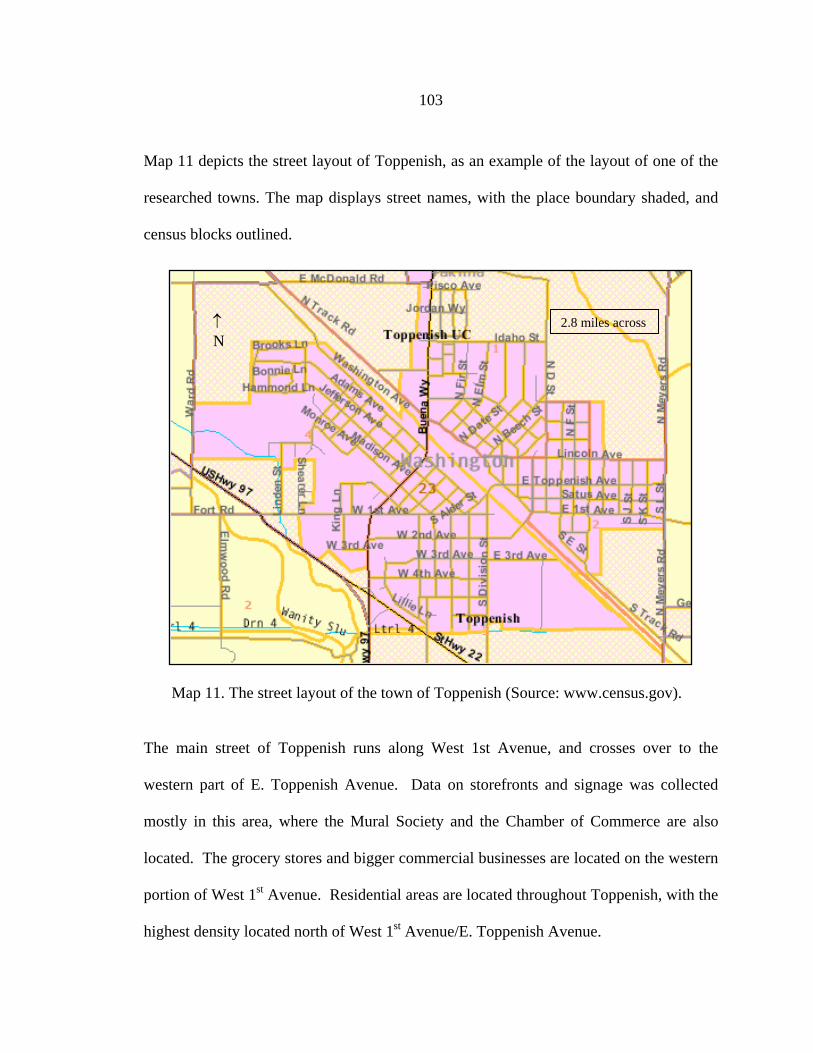
103
Map 11 depicts the street layout of Toppenish, as an example of the layout of one of the
researched towns. The map displays street names, with the place boundary shaded, and
census blocks outlined.
↑ N
2.8 miles across
Map 11. The street layout of the town of Toppenish (Source: www.census.gov). The main street of Toppenish runs along West 1st Avenue, and crosses over to the
western part of E. Toppenish Avenue. Data on storefronts and signage was collected
mostly in this area, where the Mural Society and the Chamber of Commerce are also
located. The grocery stores and bigger commercial businesses are located on the western
portion of West 1st Avenue. Residential areas are located throughout Toppenish, with the
highest density located north of West 1st Avenue/E. Toppenish Avenue.
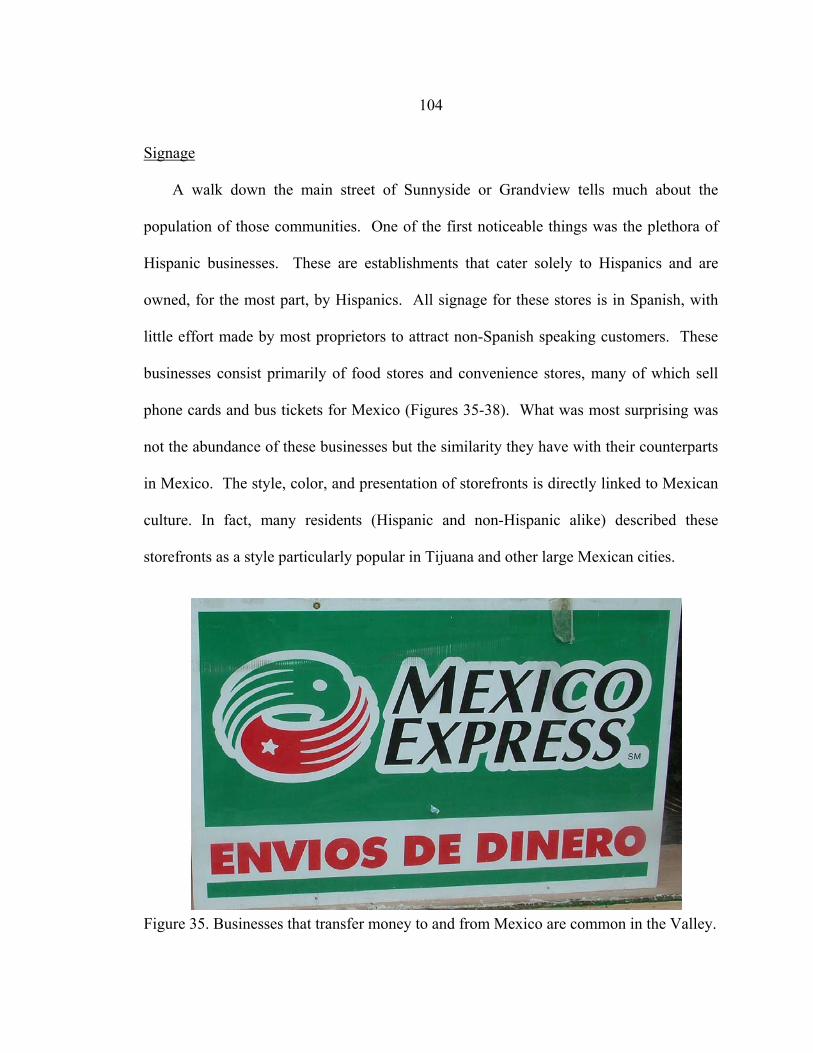
104
Signage A walk down the main street of Sunnyside or Grandview tells much about the
population of those communities. One of the first noticeable things was the plethora of
Hispanic businesses. These are establishments that cater solely to Hispanics and are
owned, for the most part, by Hispanics. All signage for these stores is in Spanish, with
little effort made by most proprietors to attract non-Spanish speaking customers. These
businesses consist primarily of food stores and convenience stores, many of which sell
phone cards and bus tickets for Mexico (Figures 35-38). What was most surprising was
not the abundance of these businesses but the similarity they have with their counterparts
in Mexico. The style, color, and presentation of storefronts is directly linked to Mexican
culture. In fact, many residents (Hispanic and non-Hispanic alike) described these
storefronts as a style particularly popular in Tijuana and other large Mexican cities.
Figure 35. Businesses that transfer money to and from Mexico are common in the Valley.
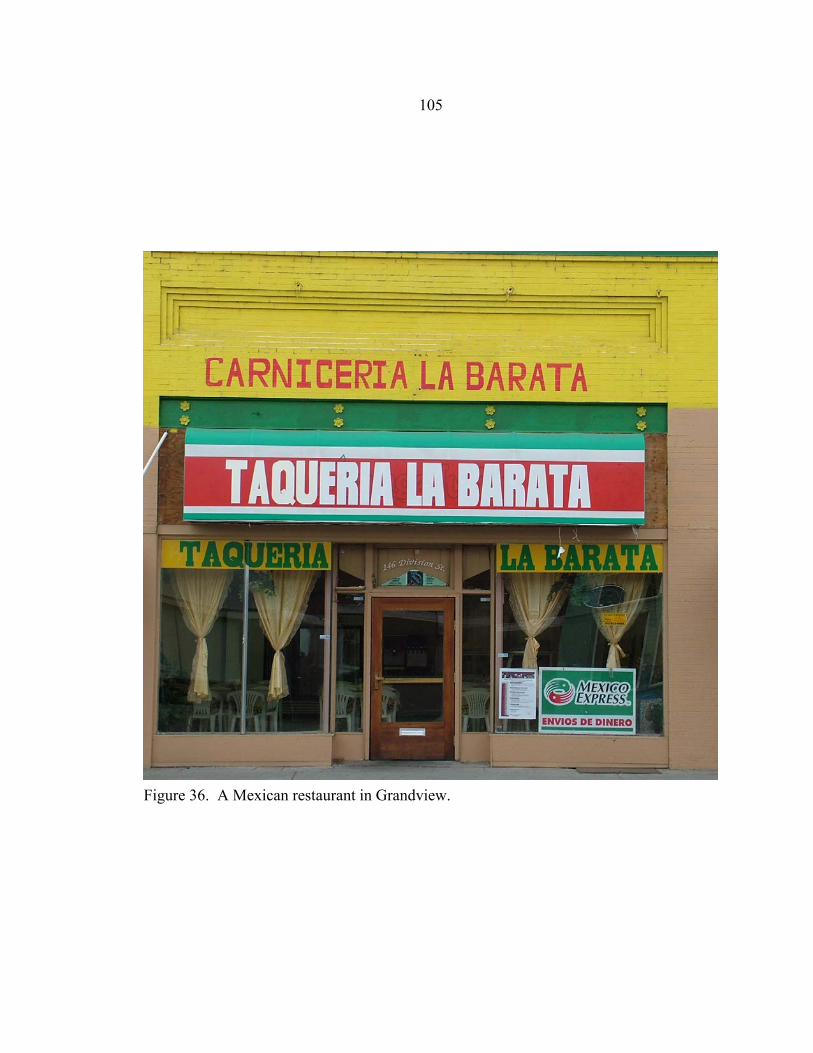
105
Figure 36. A Mexican restaurant in Grandview.
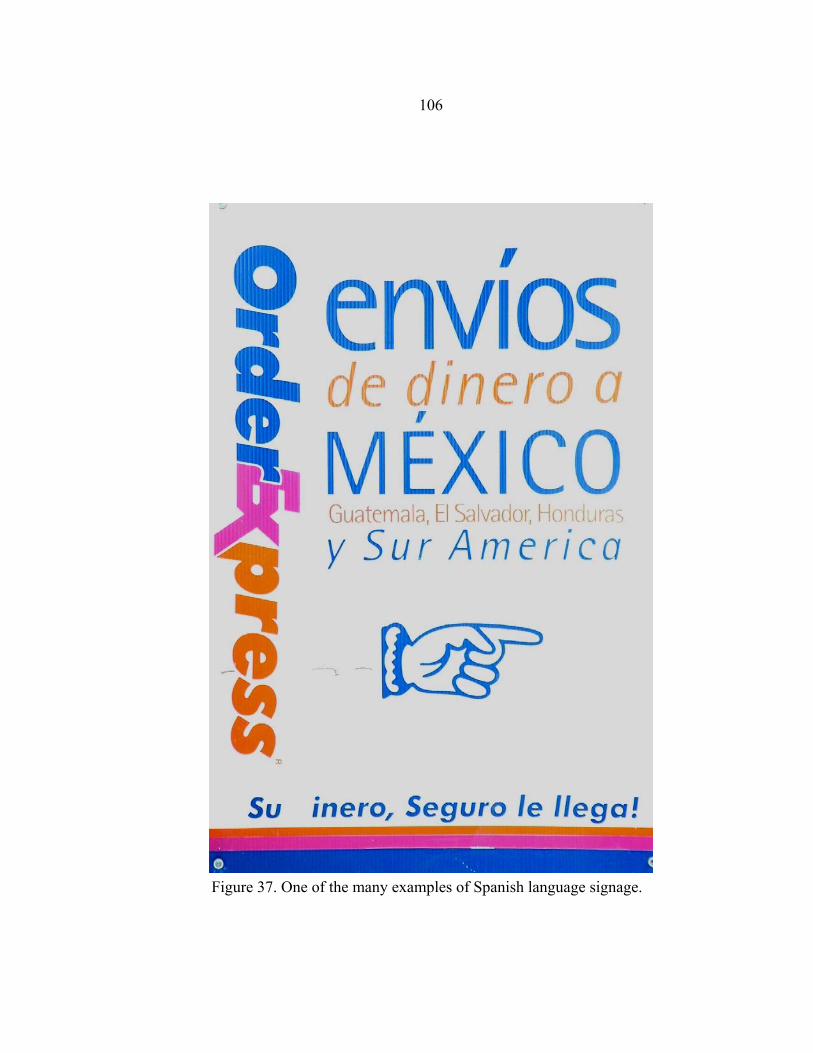
106
Figure 37. One of the many examples of Spanish language signage.
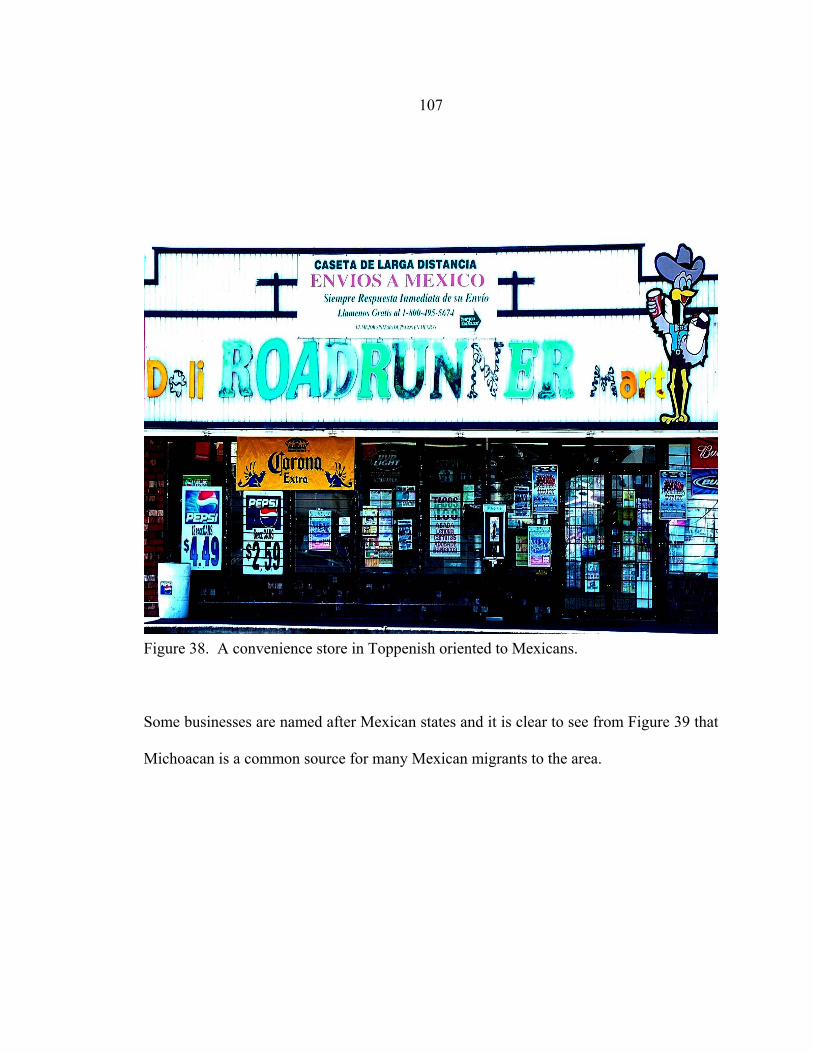
107
Figure 38. A convenience store in Toppenish oriented to Mexicans.
Some businesses are named after Mexican states and it is clear to see from Figure 39 that
Michoacan is a common source for many Mexican migrants to the area.
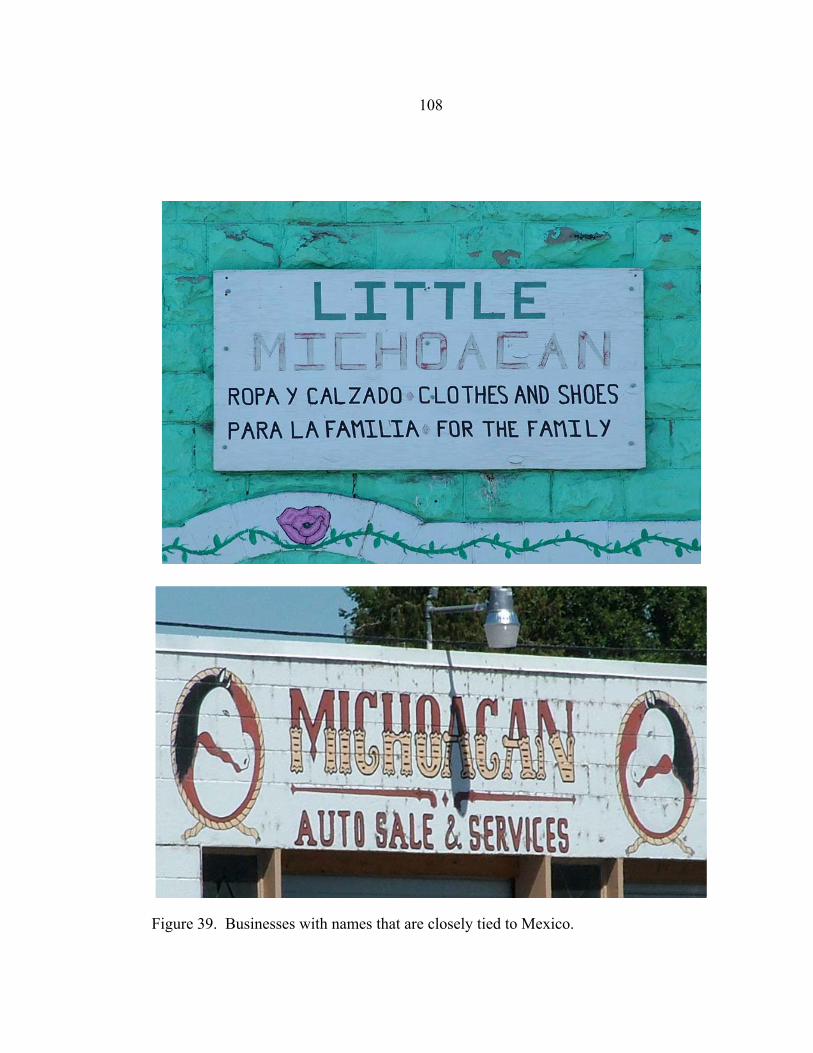
108
Figure 39. Businesses with names that are closely tied to Mexico.
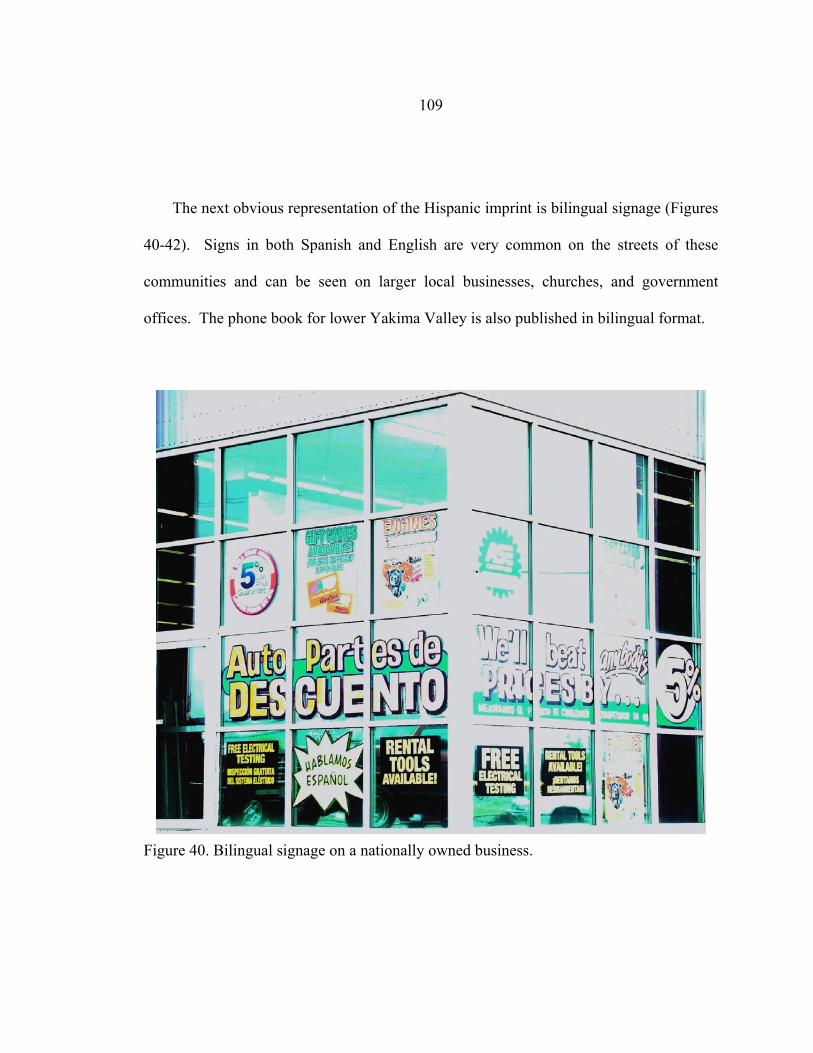
109
The next obvious representation of the Hispanic imprint is bilingual signage (Figures
40-42). Signs in both Spanish and English are very common on the streets of these
communities and can be seen on larger local businesses, churches, and government
offices. The phone book for lower Yakima Valley is also published in bilingual format.
Figure 40. Bilingual signage on a nationally owned business.
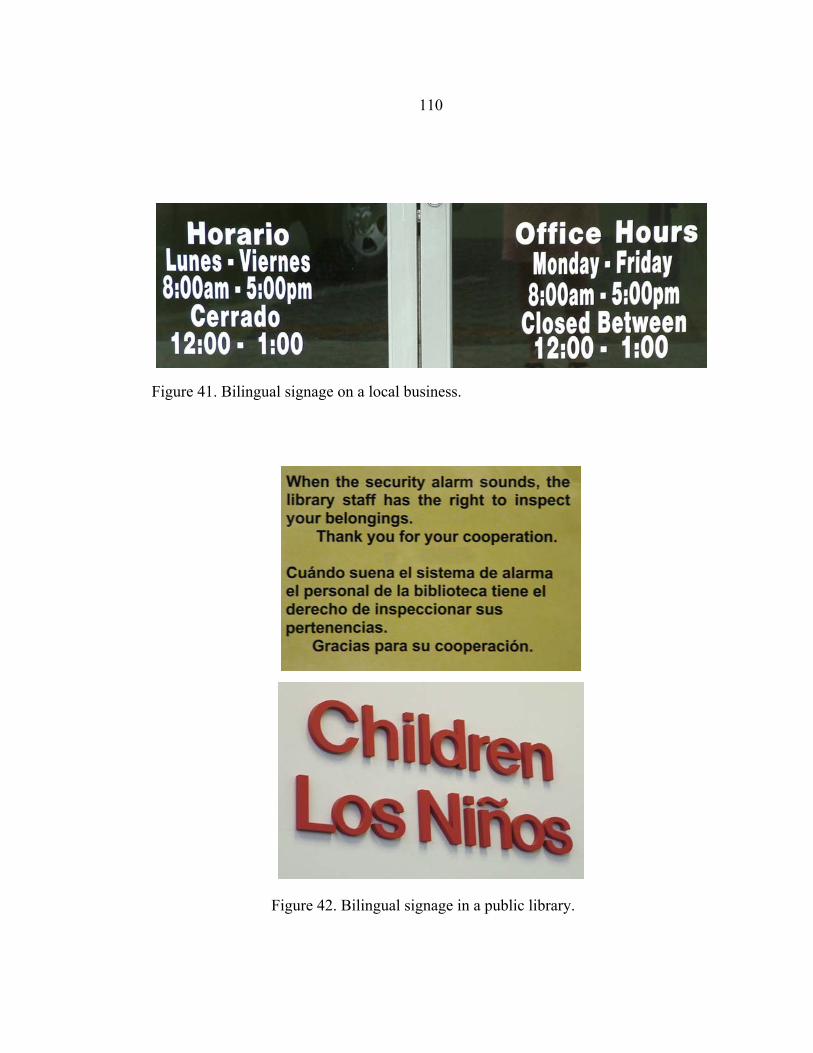
110
Figure 41. Bilingual signage on a local business.
Figure 42. Bilingual signage in a public library.
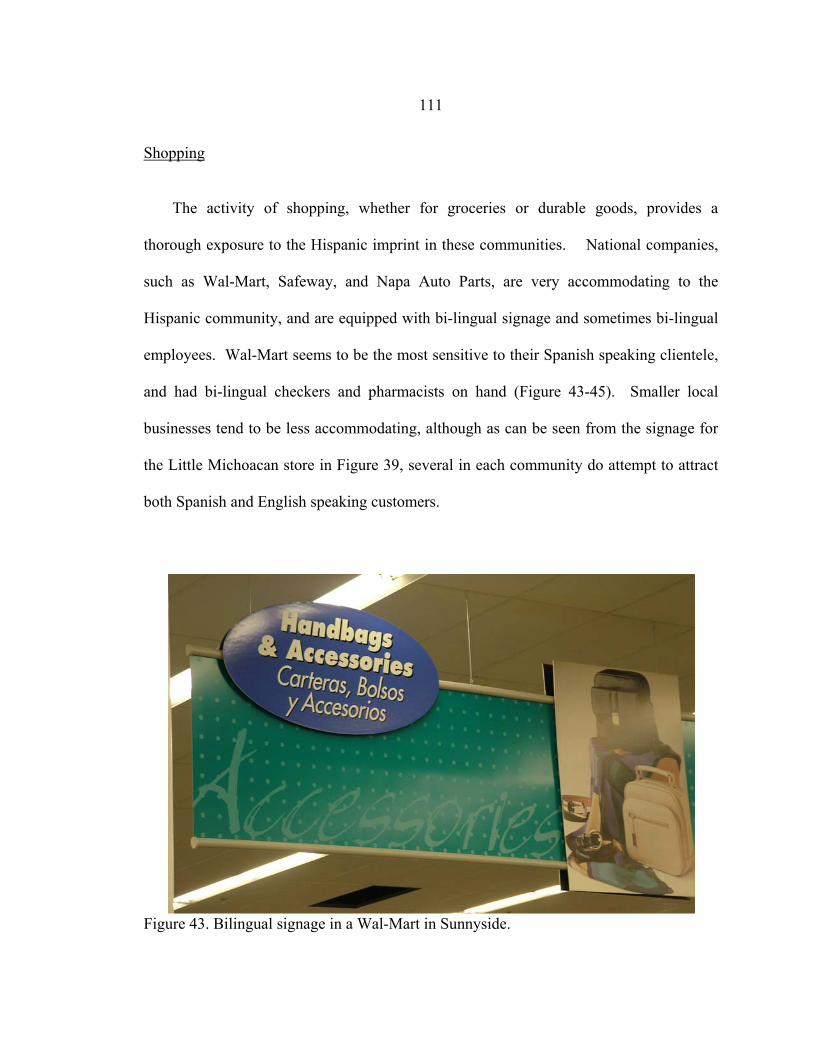
111
Shopping The activity of shopping, whether for groceries or durable goods, provides a
thorough exposure to the Hispanic imprint in these communities. National companies,
such as Wal-Mart, Safeway, and Napa Auto Parts, are very accommodating to the
Hispanic community, and are equipped with bi-lingual signage and sometimes bi-lingual
employees. Wal-Mart seems to be the most sensitive to their Spanish speaking clientele,
and had bi-lingual checkers and pharmacists on hand (Figure 43-45). Smaller local
businesses tend to be less accommodating, although as can be seen from the signage for
the Little Michoacan store in Figure 39, several in each community do attempt to attract
both Spanish and English speaking customers.
Figure 43. Bilingual signage in a Wal-Mart in Sunnyside.
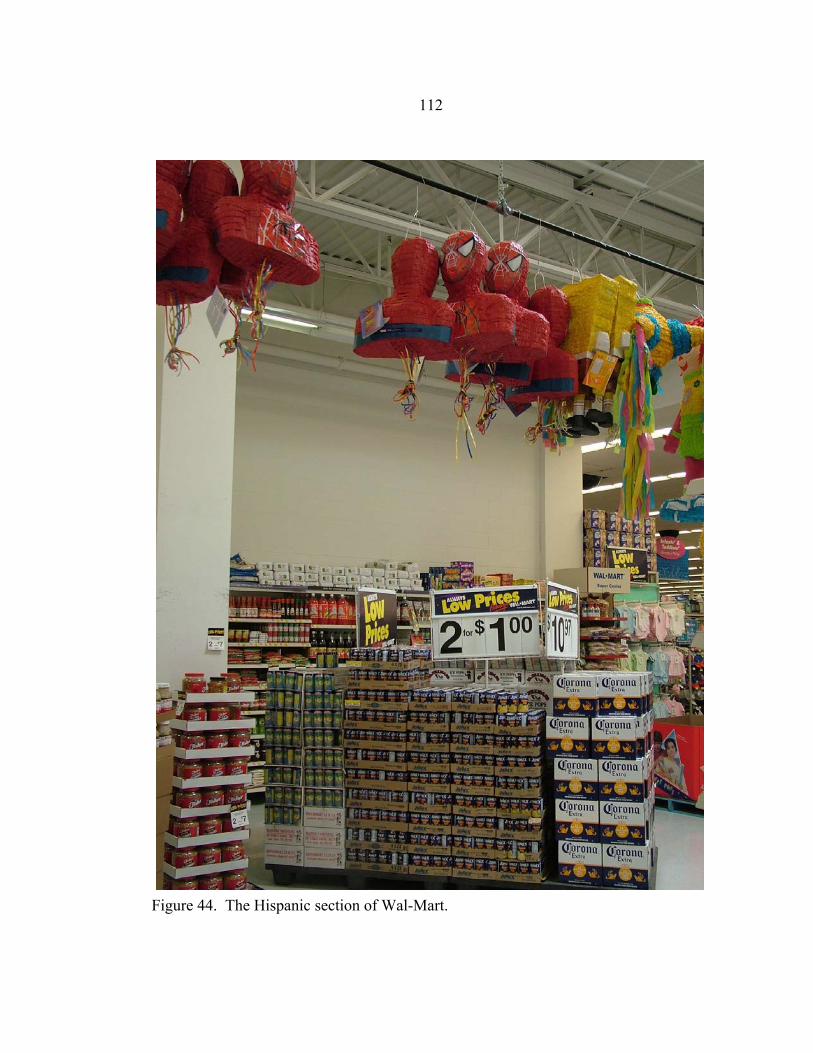
112
Figure 44. The Hispanic section of Wal-Mart.
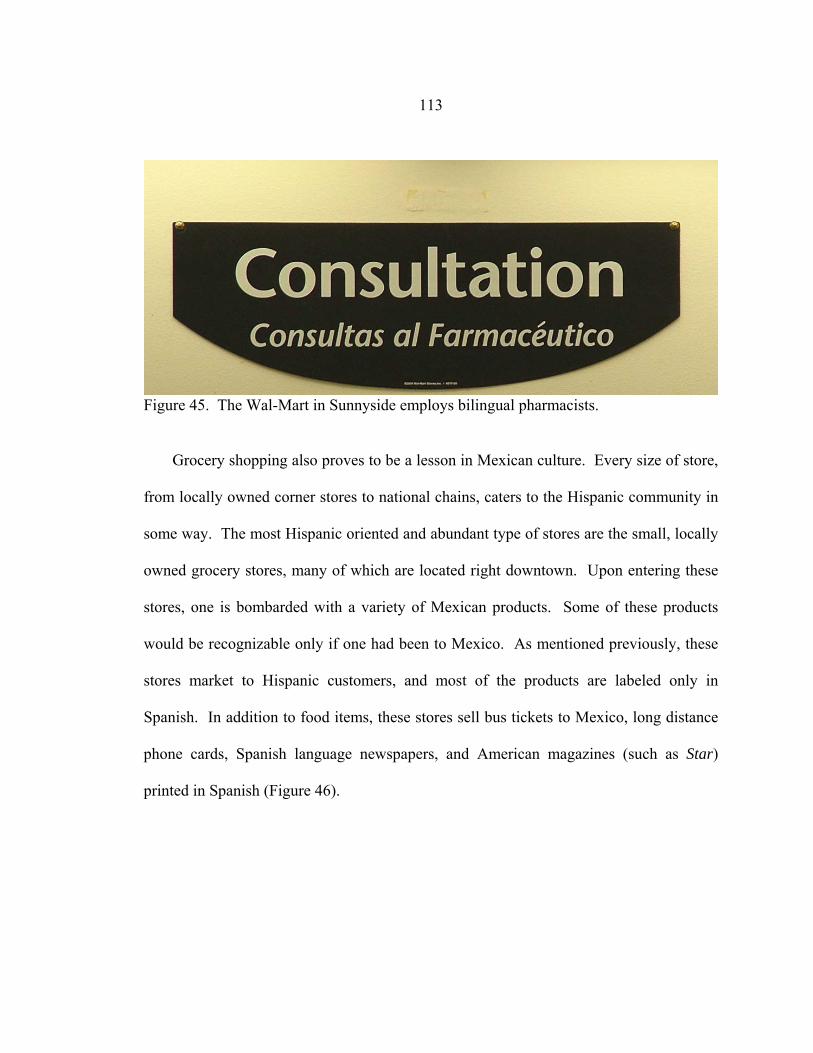
113
Figure 45. The Wal-Mart in Sunnyside employs bilingual pharmacists. Grocery shopping also proves to be a lesson in Mexican culture. Every size of store,
from locally owned corner stores to national chains, caters to the Hispanic community in
some way. The most Hispanic oriented and abundant type of stores are the small, locally
owned grocery stores, many of which are located right downtown. Upon entering these
stores, one is bombarded with a variety of Mexican products. Some of these products
would be recognizable only if one had been to Mexico. As mentioned previously, these
stores market to Hispanic customers, and most of the products are labeled only in
Spanish. In addition to food items, these stores sell bus tickets to Mexico, long distance
phone cards, Spanish language newspapers, and American magazines (such as Star)
printed in Spanish (Figure 46).
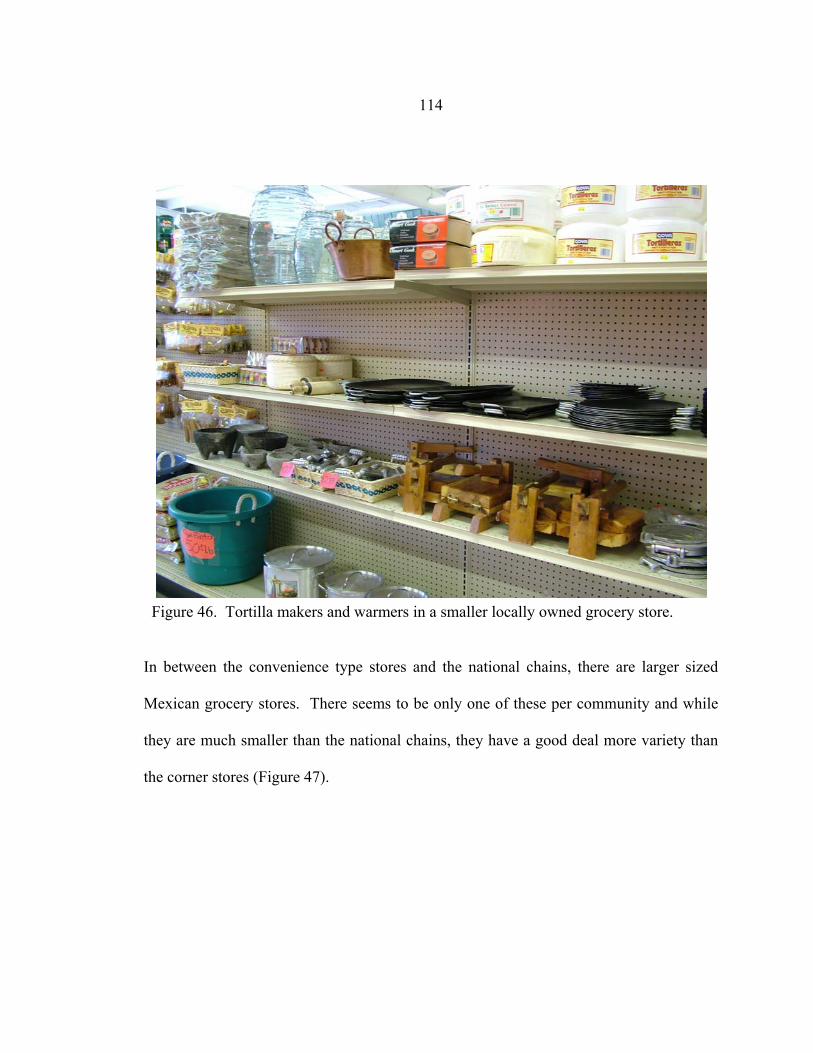
114
Figure 46. Tortilla makers and warmers in a smaller locally owned grocery store. In between the convenience type stores and the national chains, there are larger sized
Mexican grocery stores. There seems to be only one of these per community and while
they are much smaller than the national chains, they have a good deal more variety than
the corner stores (Figure 47).
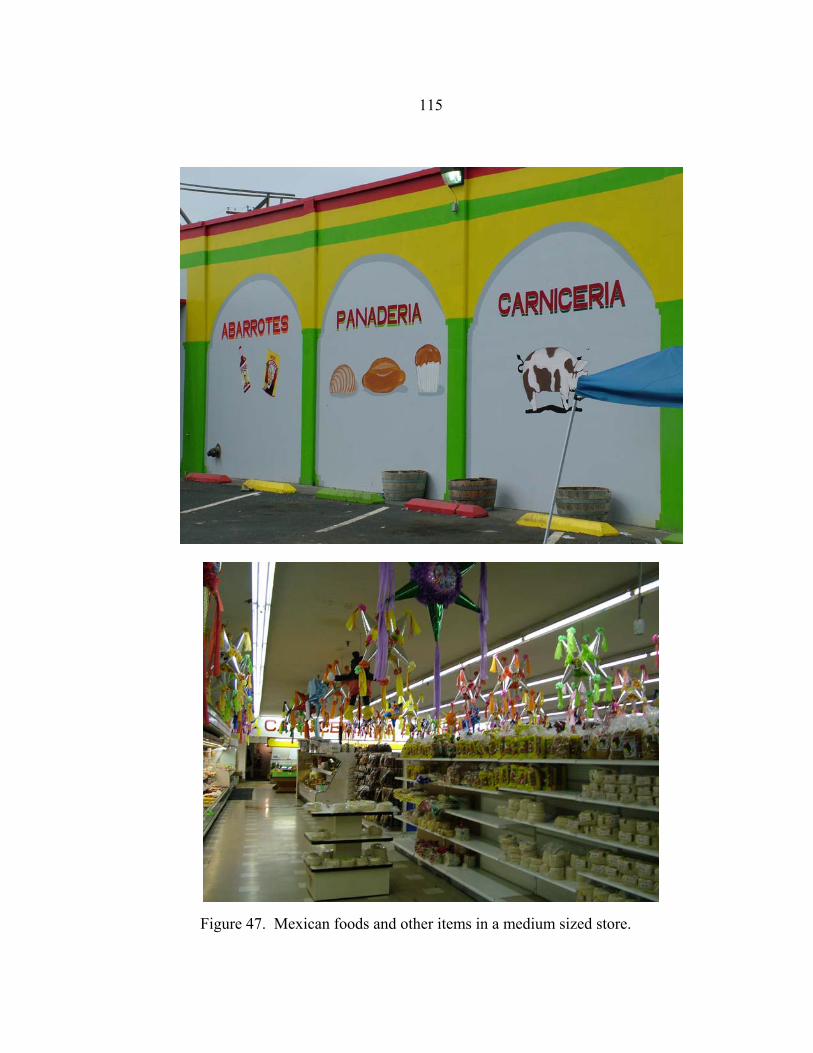
115
Figure 47. Mexican foods and other items in a medium sized store.
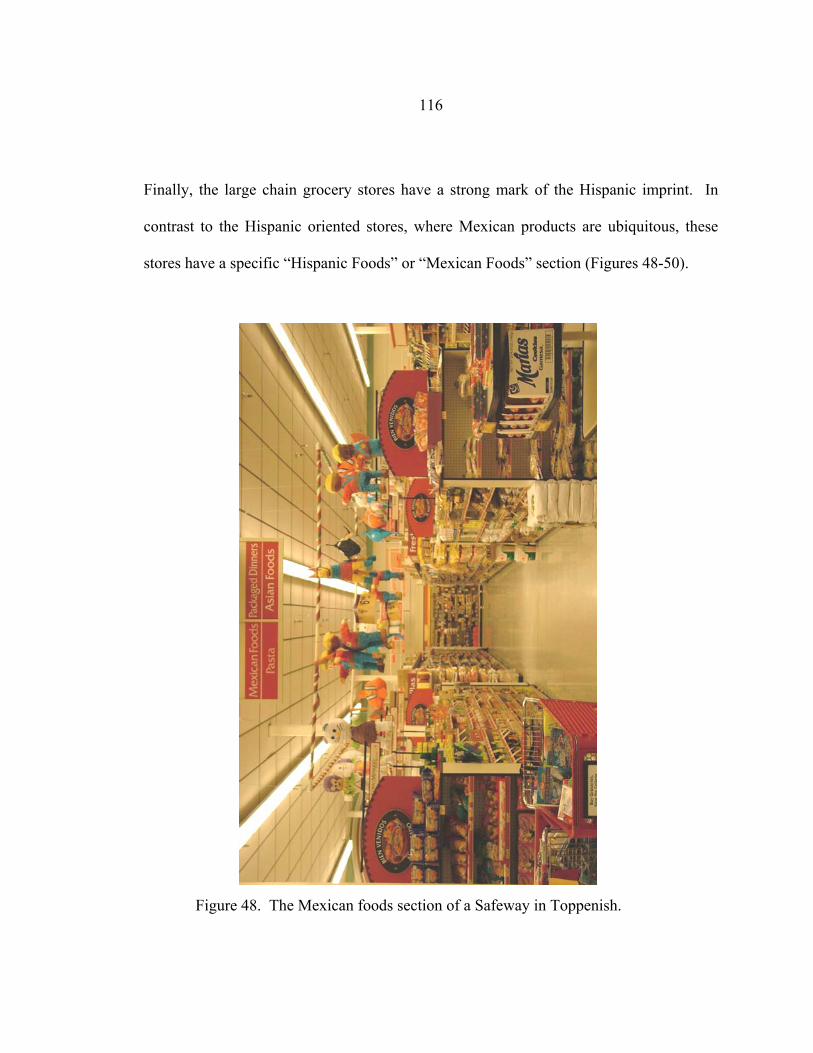
116
Finally, the large chain grocery stores have a strong mark of the Hispanic imprint. In
contrast to the Hispanic oriented stores, where Mexican products are ubiquitous, these
stores have a specific “Hispanic Foods” or “Mexican Foods” section (Figures 48-50).
Figure 48. The Mexican foods section of a Safeway in Toppenish.
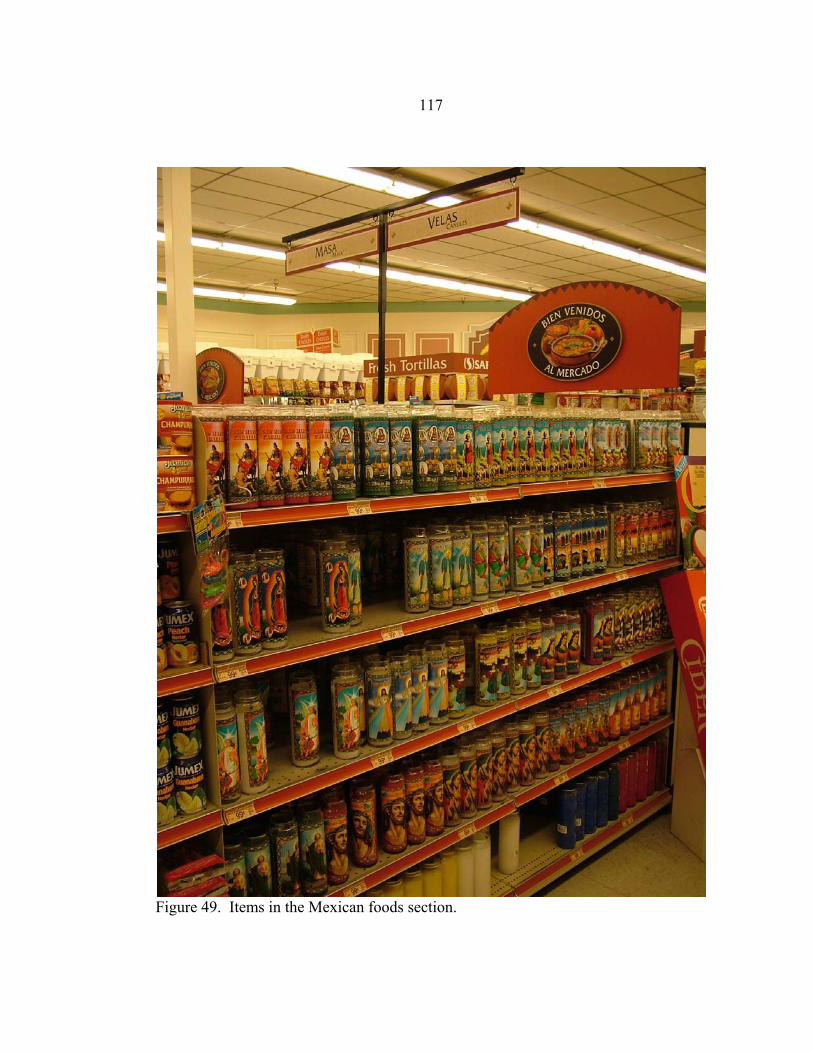
117
Figure 49. Items in the Mexican foods section.
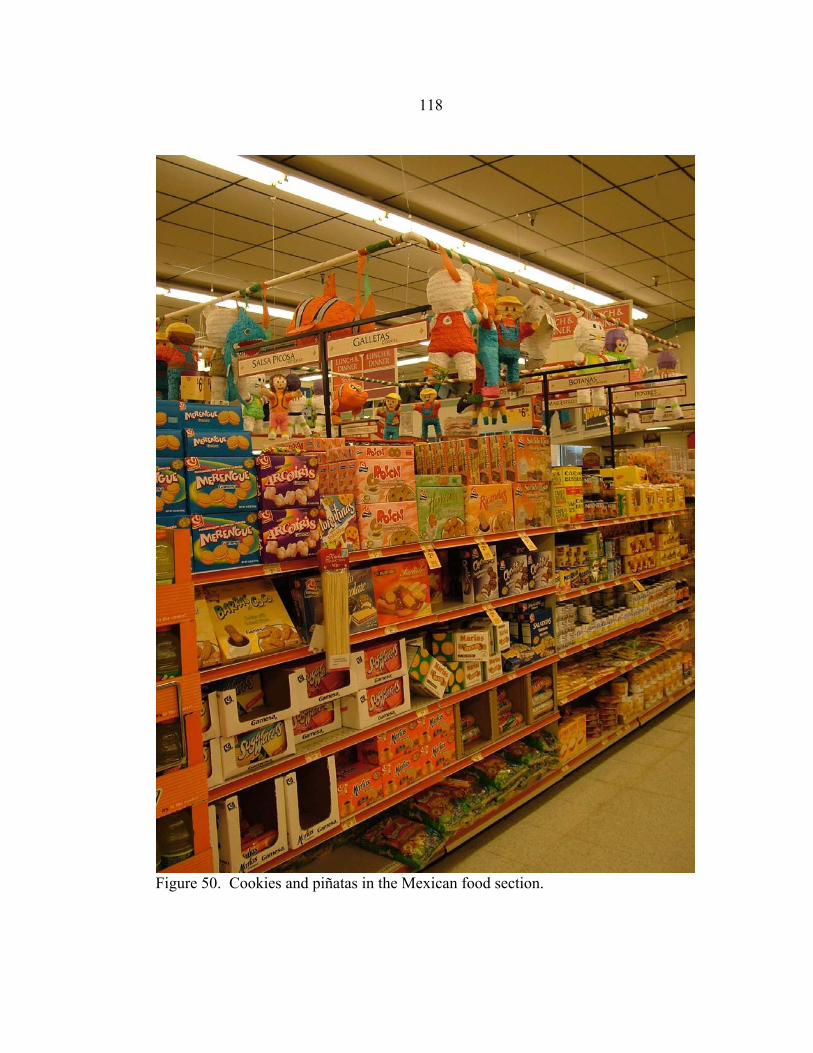
118
Figure 50. Cookies and piñatas in the Mexican food section.
119
While it is true that many Safeway stores across the country have a Hispanic foods isle,
the Hispanic foods section of the stores in the Lower Yakima Valley are
disproportionately large (especially given the small population size of this area). They
also have a considerably larger variety of products, especially products that Anglos are
less familiar with. Note the detail of items in Figures 49 and 50.
Media. The maintenance and growth of both the Spanish language and Mexican culture is
greatly promoted by the availability of Spanish language media (Haverluk 1992).
Hispanic media has a very strong and diversified presence in the lower Yakima Valley,
including newspapers and radio stations. These Spanish language media range from
programs that have been present for 40 years to ones that are still developing.
Newspaper. The Yakima Valley currently has three Spanish language weekly
newspapers circulating, while Seattle only has one. The list includes El Sol de Yakima,
Viva, and El Mundo. An interview was arranged with Jean Dibble, the head of
administration for El Sol de Yakima, to learn about the nature of Spanish language
weeklies. El Sol de Yakima started in December of 2003, and is a branch of the Yakima
Herald Republic. According to Dibble, the Herald started El Sol partly for profit but also
as a way to be involved in the Hispanic community, as she says, “to have a foot in the
door of the growing Hispanic community” (Dibble, personal communication, 2005).
They had initially thought to put a Spanish language page in the Yakima Herald
120
Republic, but predicted that the readership would be enough to warrant a separate
publication. While circulation has been fluctuating in the first years of El Sol’s
distribution, circulation throughout the Yakima Valley averages 9,000 subscribers a
month. This amounts to nearly 25% of the readership of the Yakima Herald Republic,
which circulates 40,000 papers a month. El Sol is a free publication, supported by
advertisements and partially subsidized by the Herald. However, Dibble expects El Sol
to be financially independent in the near future. Advertisements appearing in El Sol are a
mix of local and national advertisers (the national ones sought out the paper to advertise
to Hispanics). The goal of the paper is to get to 40% advertisements, which is a
challenge in the Hispanic community. El Sol has a Hispanic salesman who goes door to
door to Hispanic businesses to convince them to advertise, but they are not used to
advertising, so they have no market plan and are hesitant to spend the money.
The structure of El Sol is modeled after Mexican newspapers in style and format.
Stories do not overlap between pages and the pages are more colorful and have bigger
print than U.S. newspapers. El Sol consists of six pages of local news and the rest is “off
the wire” from newspapers in Mexico. The paper’s content usually consists of a large
amount of immigration stories, some general international news, and a strong focus on
soccer and boxing. El Sol also has a free social page, where people can discuss and
promote local happenings (there is a charge for this in the Herald). El Sol participates in
a story share with a newspaper in Michoacan, the state in Mexico where most of the
Yakima Valley’s Hispanic population originated from. The story share involves the
121
exchange of several articles each week through email (Dibble, personal communication,
2005).
Dibble says that El Sol is growing quickly and expects to be hiring more staff soon.
She is the only non-Hispanic employee working for El Sol, and says she could not have
got the job if she was not bi-lingual. Just a few days before the interview with her,
Dibble received a phone call from a newspaper in a small town in Idaho; they were
asking for any advice El Sol could give them on starting their own Spanish language
newspaper.
Viva! is another Spanish language weekly newspaper, published in Toppenish. A
woman who has worked there for twenty years says the paper’s circulation has doubled in
the last eight years and they now cover a larger area than they previously did. Viva!
circulates 15,000 copies each month and is a free paper, similar to El Sol.
Radio. The Yakima Valley is serviced by several Spanish language radio stations,
some of which are backed by big, national networks such as Clear Channel. The radio
station with the longest history and most interactive presence in the surrounding
communities is Radio KDNA (pronounced Cadeña by locals). Radio KDNA is similar to
National Public Radio in that it has no commercials and is supported solely by
fundraising and donations. The station began broadcasting in 1979 and was the first
Spanish language radio station in the Pacific Northwest.
Gabriel Martinez, the Station Manager at Radio KDNA, was interviewed. Gabriel
has been at the station for twenty-five years and stated that Radio KDNA is more
122
traditional, geared to older adults, and more local and family oriented than the other
Spanish language stations in the area (Figures 51 and 52). He described some of the
programs aired on the station, as well as ways in which the station is a service to the
Hispanic community. Radio KDNA is truly a source of support for Hispanics, especially
those that are new to the area. The station often receives phone calls with questions
about everything from health services to bank accounts. They host a trade in program
that airs for 45 minutes every day during which time callers advertise houses for rent,
various items for sale, and a multitude of other things. The program is very popular and
high in demand, with callers often on hold well before the program is scheduled to air.
KDNA also airs public service announcements for social service agencies, but Gabriel
said this can cause problems when the station sends people to those agencies and there is
no one present that can speak Spanish.
In addition to being a unifying force in the Hispanic community, KDNA also
addresses many issues which other agencies feel uncomfortable tackling. The Youth
Issues Program hosted by the station has revealed that Hispanic students still feel
segregated from their Anglo counterparts in school. According to Gabriel, drug
trafficking and domestic violence are major problems in the Hispanic community in the
Valley and while the main media channels avoid addressing these problems, KDNA has a
program that encourages the community to discuss them.
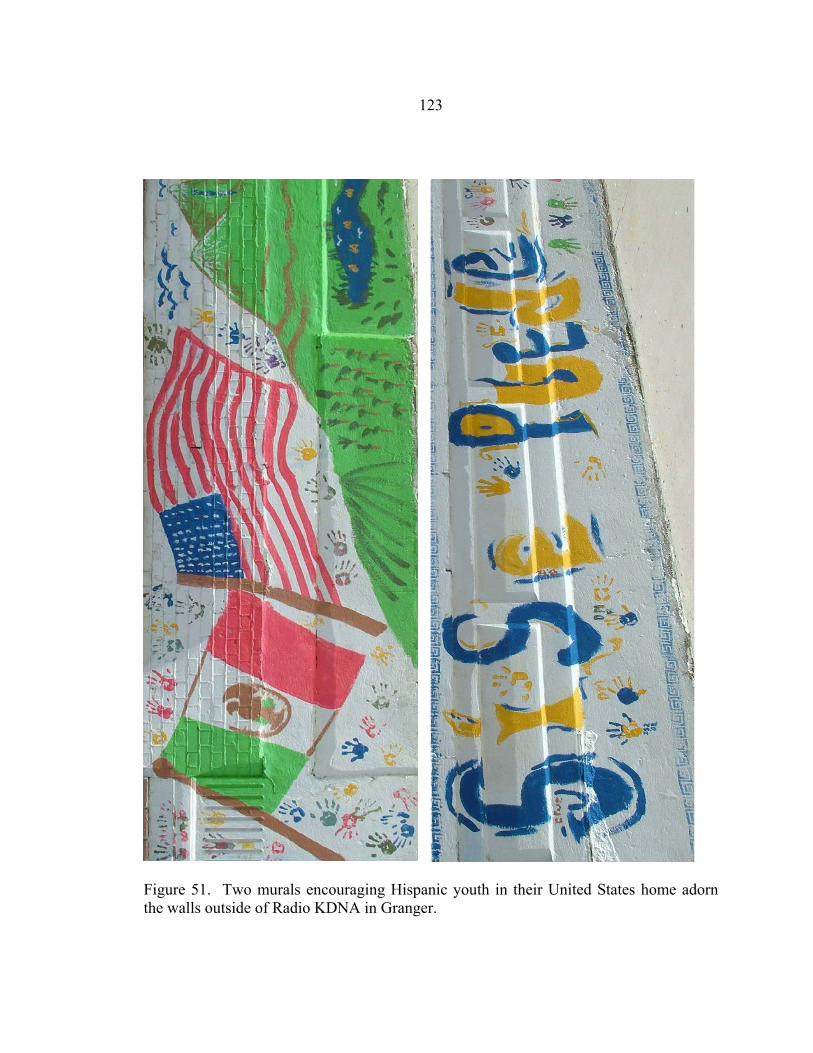
123
Figure 51. Two murals encouraging Hispanic youth in their United States home adorn the walls outside of Radio KDNA in Granger.
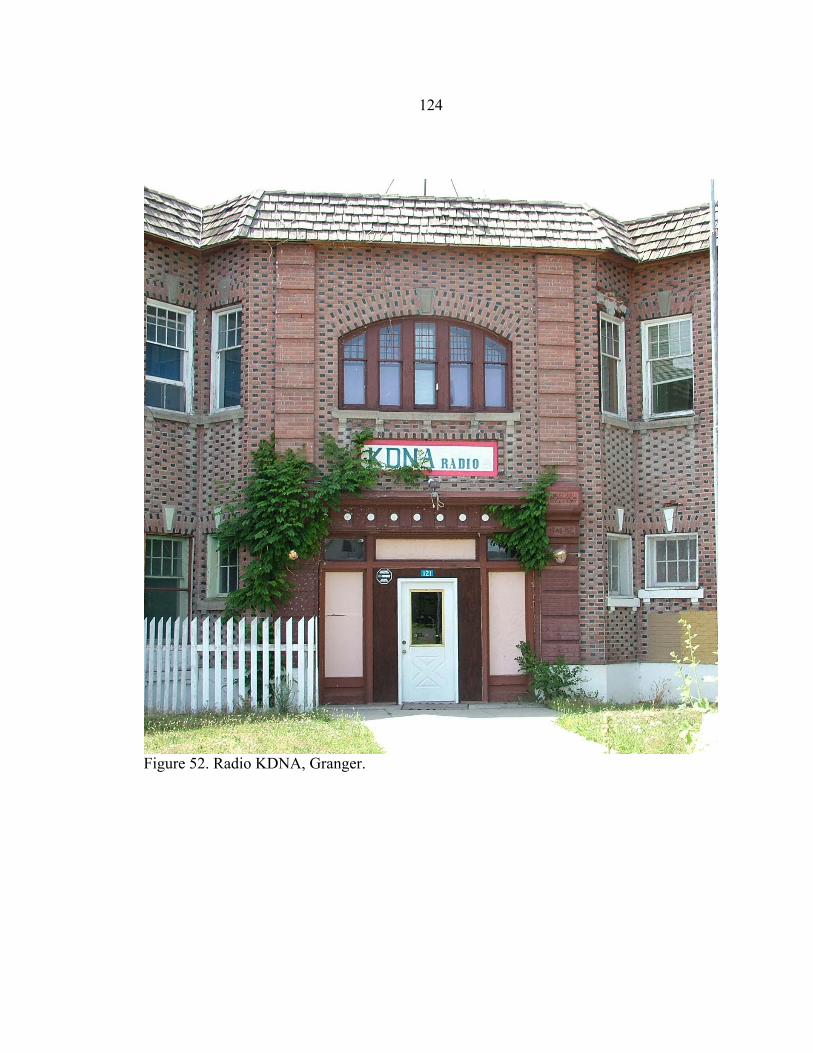
124
Figure 52. Radio KDNA, Granger.
125
Music Mexican music in the Yakima Valley is made up of a variety of different styles, each
of which reflects different groups within the Mexican community. The two styles that
are the most popular are known as conjunto and norteno. The first style of Mexican
music to arrive and remain in the Valley came with Mexican migrant workers from Texas
and other parts of the Southwest who settled in the Valley in the 1940s and 1950s. This
style, known as conjunto, is based on a lively polka rhythm centered on the accordian.
Conjunto has been described as a “strong symbol of ethnic identity among Chicanos and
Texas-Mexicans alike” (Ragland, n.d.).
The second style, norteño, arrived after conjunto, with the more recent influx of
immigrants from Mexico that has occurred over the past twenty-five to thirty years. It is
associated with traditions in Northern Mexico rather than the American Southwest.
Norteño is popular in many Mexican immigrant communities throughout the United
States. Like conjunto, norteño is also accordian based, but has a faster rhythm and a
different subject matter. A typical norteño song is a narrative ballad about a specific
event or local hero, while conjunto tends to feature romantic ballads (Ragland, n.d.).
Although these distinct styles of music represent communities that are separate, they also
serve to reinforce a common identity, as all these styles are tied to Mexican culture. As
described by Gamboa:
Today the music of the Valley Mexicanos influences a wide spectrum of generations, classes, age and gender. From the songs of the early arrieros [mule packers] to today’s newest banda sound, the Yakima Valley has a long heritage of Mexican music. It is a musical repository of the common life experiences, whether tragic,
126
romantic, humorous, or political. Moreover, this music has served to inspire, to entertain, and to bond the Valley’s Mexican community (Gamboa, n.d.).
The influence and representation of the Hispanic community on music in the Yakima
Valley is best understood by examining the Gritos del Alma project. Gritos del Alma,
which translates as “cries of the soul,” was a project that began in 1992 as the result of a
desire by the Washington State Arts Commission to recognize and honor the diverse
traditions of the people of Mexican descent who reside in Washington. The project
brought together eight local music groups to play at an afternoon concert at Radio KDNA
in Granger. A Gritos del Alma cassette and booklet were also released as part of the
project. Some of the bands that participated in the event are agricultural laborers who
work in the fields during the day and play in local venues at night. For this reason, many
local songs were about the life of a campesino (farm worker). Another subject matter
played frequently at the event was the traditional Mexican folk song, which varies with
each region of Mexico. This music is a form of nostalgia, which can reinforce memories
of family and friends who may have been left behind in Mexico.
The Mexican population in the Yakima Valley has had a strong imprint on the music
of the area. There are four or five Spanish language radio stations that can be heard from
the Valley, making the sounds of Mexican music fairly familiar. Popular Mexican bands
often make a stop in the Valley while on tour and some of the Valley’s musicians are
well known throughout Mexico (Washington State Arts Commission, n.d.).
127
Housescapes Driving through an unfamiliar town, it is nearly impossible to distinguish a home
that is influenced by a unique cultural trait from one that is the neighborhood standard.
This was the case for the fieldwork on Hispanic housescapes. While the beautifully
manicured gardens and radiant flowers catch attention, there is little way to know
undoubtedly if this is due simply to the climate, or influenced by Mexican culture. A
professor from Heritage University, Dr. Apanakhi Buckley, was interested in this
research and contributed greatly by giving a tour of her neighborhood in Toppenish.
From her familiarity with her community, Buckley described the immaculate lawns and
gardens as a very Hispanic characteristic (Buckley, personal communication, 2005). She
herself lives in a Hispanic area, located in northeastern Toppenish. Map 12 displays the
percent of the total population in each census block in Toppenish that is Hispanic,
according to the 2000 Census. There are five data classes, based on an equal interval
classification system. There are several clusters of census blocks in which the percentage
of Hispanics reaches above 80%, marking the existence of Hispanic neighborhoods.
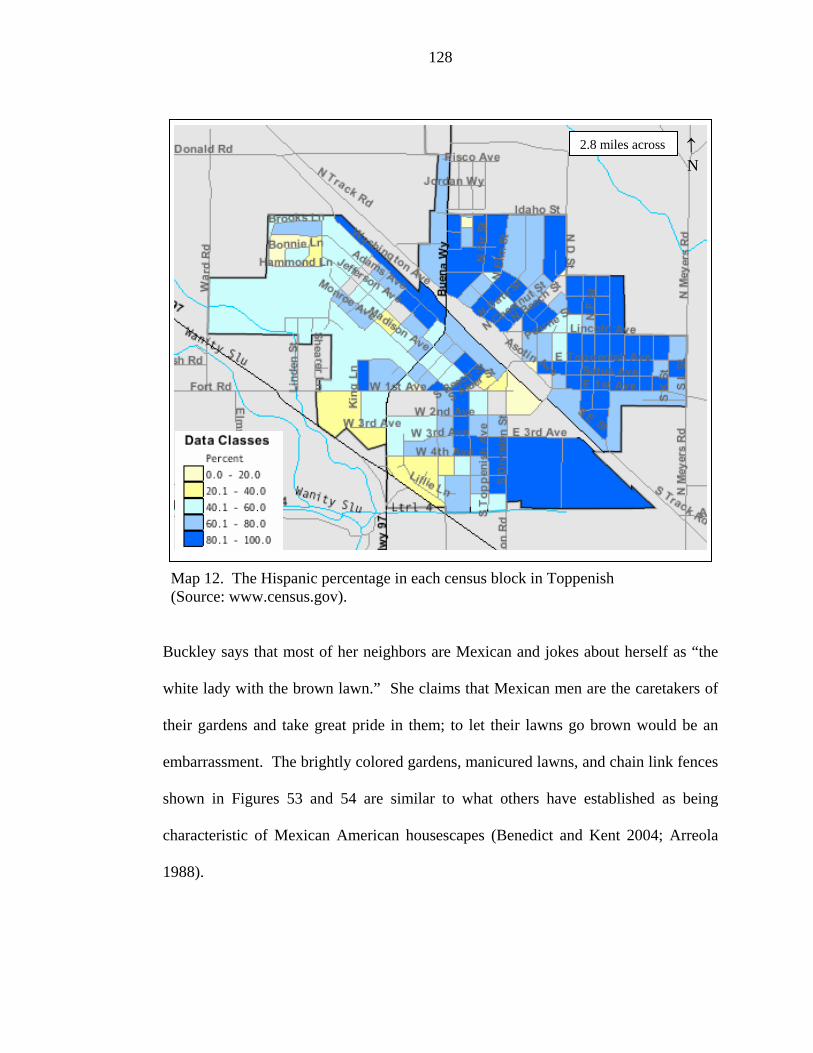
128
2.8 miles across ↑ N
Map 12. The Hispanic percentage in each census block in Toppenish (Source: www.census.gov).
Buckley says that most of her neighbors are Mexican and jokes about herself as “the
white lady with the brown lawn.” She claims that Mexican men are the caretakers of
their gardens and take great pride in them; to let their lawns go brown would be an
embarrassment. The brightly colored gardens, manicured lawns, and chain link fences
shown in Figures 53 and 54 are similar to what others have established as being
characteristic of Mexican American housescapes (Benedict and Kent 2004; Arreola
1988).
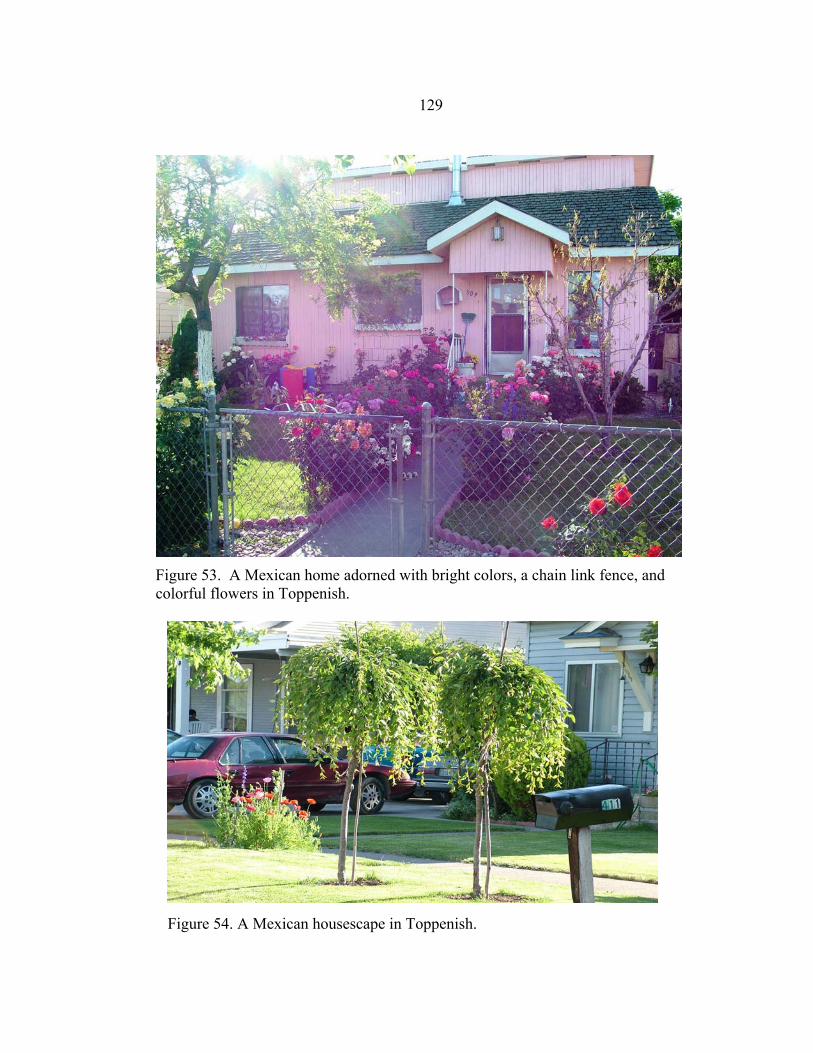
129
Figure 53. A Mexican home adorned with bright colors, a chain link fence, and colorful flowers in Toppenish.
Figure 54. A Mexican housescape in Toppenish.
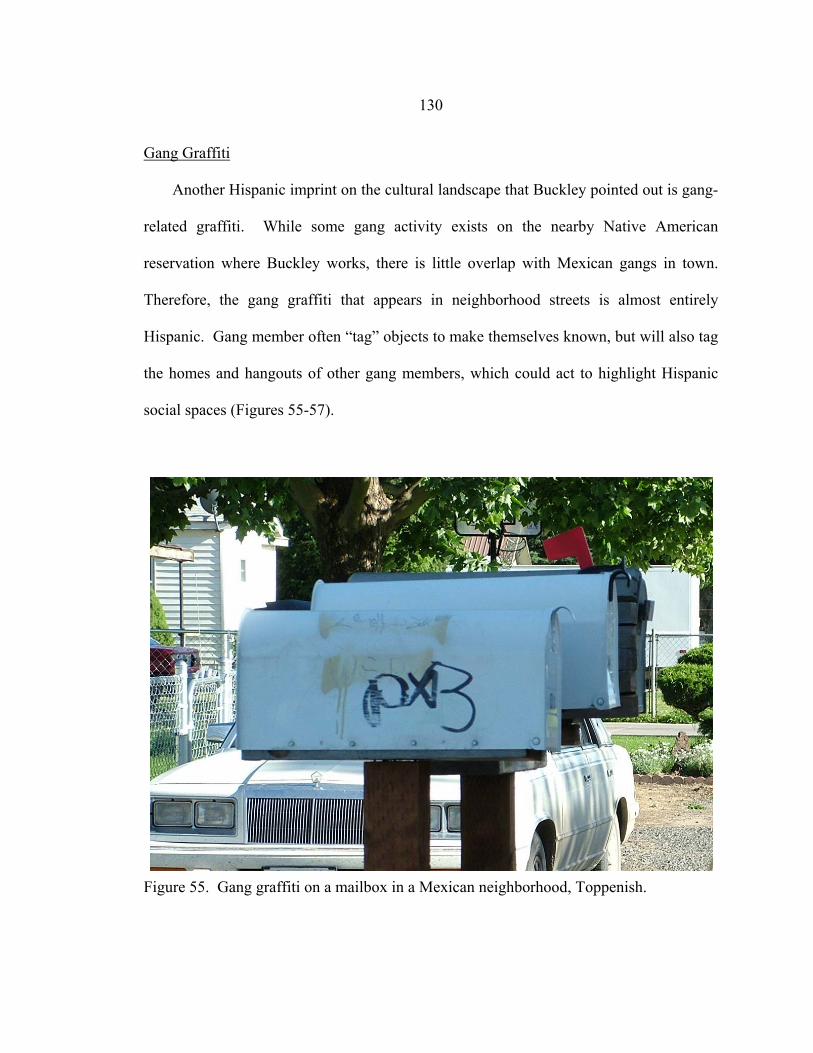
130
Gang Graffiti
Another Hispanic imprint on the cultural landscape that Buckley pointed out is gang-
related graffiti. While some gang activity exists on the nearby Native American
reservation where Buckley works, there is little overlap with Mexican gangs in town.
Therefore, the gang graffiti that appears in neighborhood streets is almost entirely
Hispanic. Gang member often “tag” objects to make themselves known, but will also tag
the homes and hangouts of other gang members, which could act to highlight Hispanic
social spaces (Figures 55-57).
Figure 55. Gang graffiti on a mailbox in a Mexican neighborhood, Toppenish.
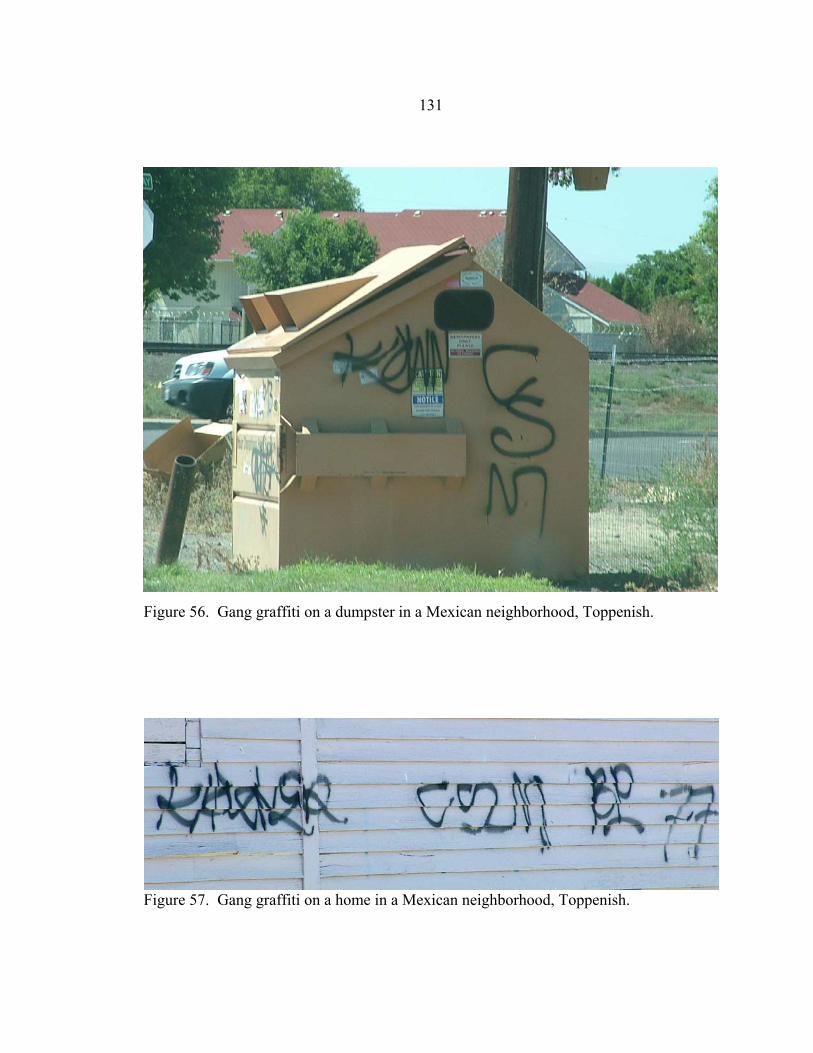
131
Figure 56. Gang graffiti on a dumpster in a Mexican neighborhood, Toppenish.
Figure 57. Gang graffiti on a home in a Mexican neighborhood, Toppenish.
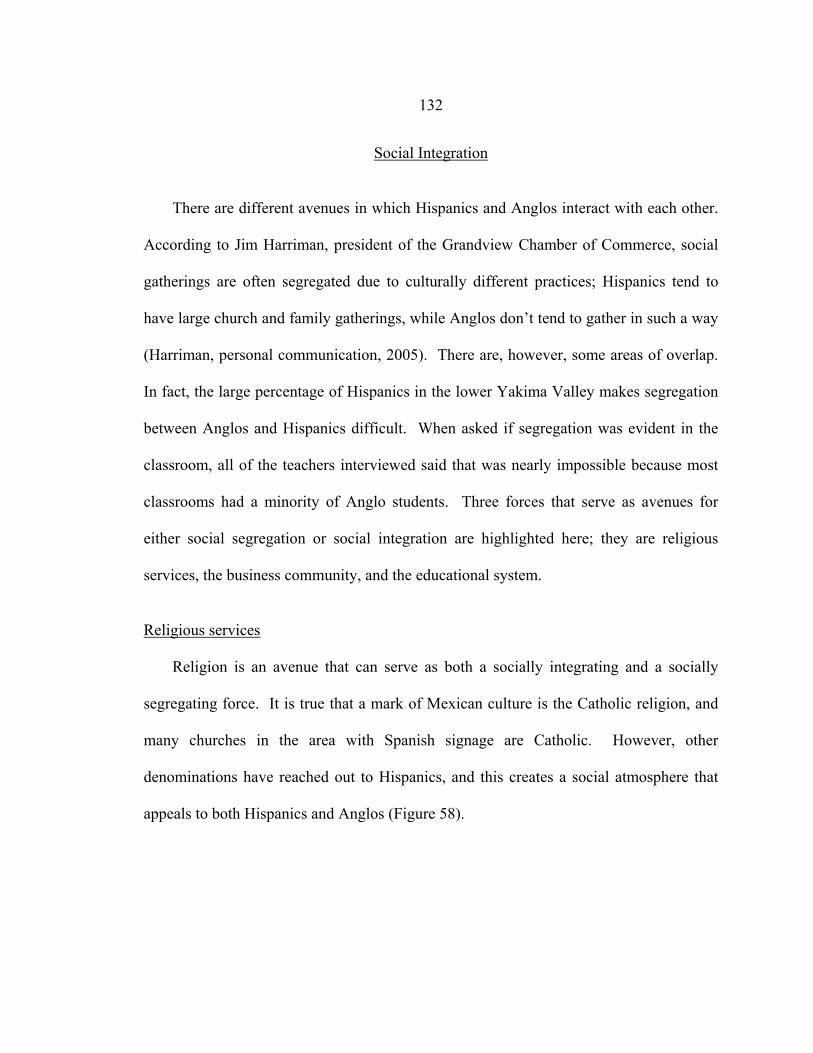
132
Social Integration
There are different avenues in which Hispanics and Anglos interact with each other.
According to Jim Harriman, president of the Grandview Chamber of Commerce, social
gatherings are often segregated due to culturally different practices; Hispanics tend to
have large church and family gatherings, while Anglos don’t tend to gather in such a way
(Harriman, personal communication, 2005). There are, however, some areas of overlap.
In fact, the large percentage of Hispanics in the lower Yakima Valley makes segregation
between Anglos and Hispanics difficult. When asked if segregation was evident in the
classroom, all of the teachers interviewed said that was nearly impossible because most
classrooms had a minority of Anglo students. Three forces that serve as avenues for
either social segregation or social integration are highlighted here; they are religious
services, the business community, and the educational system.
Religious services
Religion is an avenue that can serve as both a socially integrating and a socially
segregating force. It is true that a mark of Mexican culture is the Catholic religion, and
many churches in the area with Spanish signage are Catholic. However, other
denominations have reached out to Hispanics, and this creates a social atmosphere that
appeals to both Hispanics and Anglos (Figure 58).
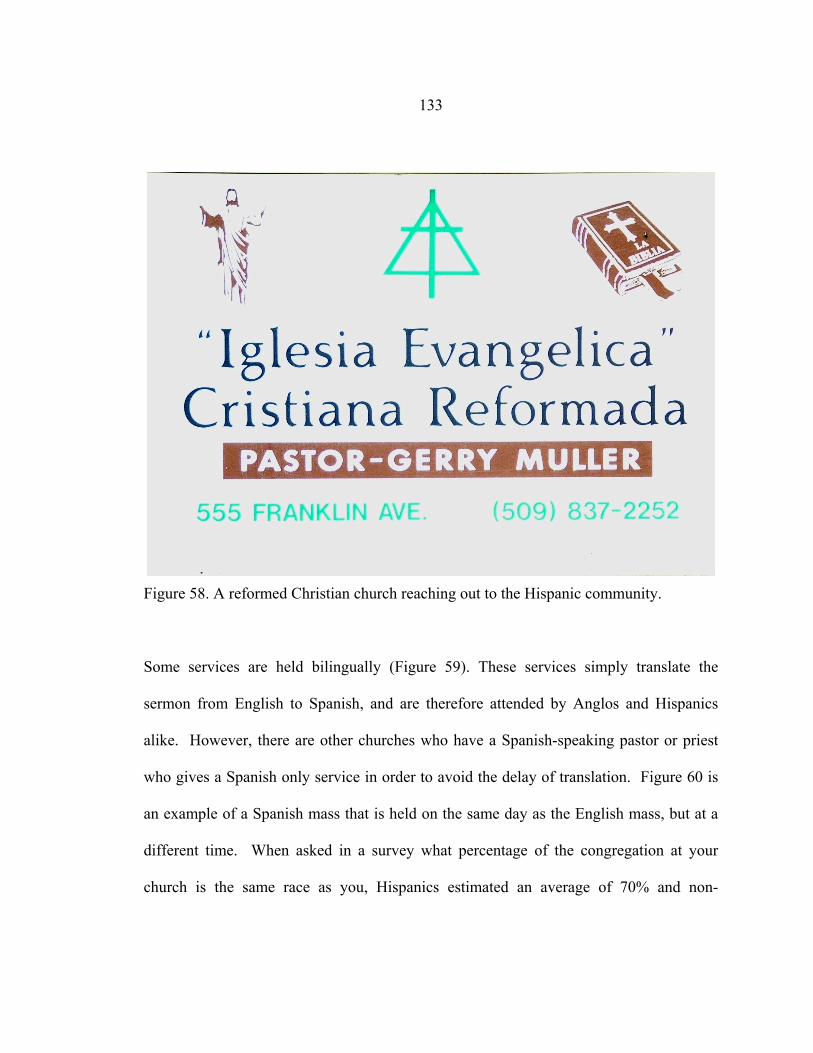
133
Figure 58. A reformed Christian church reaching out to the Hispanic community.
Some services are held bilingually (Figure 59). These services simply translate the
sermon from English to Spanish, and are therefore attended by Anglos and Hispanics
alike. However, there are other churches who have a Spanish-speaking pastor or priest
who gives a Spanish only service in order to avoid the delay of translation. Figure 60 is
an example of a Spanish mass that is held on the same day as the English mass, but at a
different time. When asked in a survey what percentage of the congregation at your
church is the same race as you, Hispanics estimated an average of 70% and non-
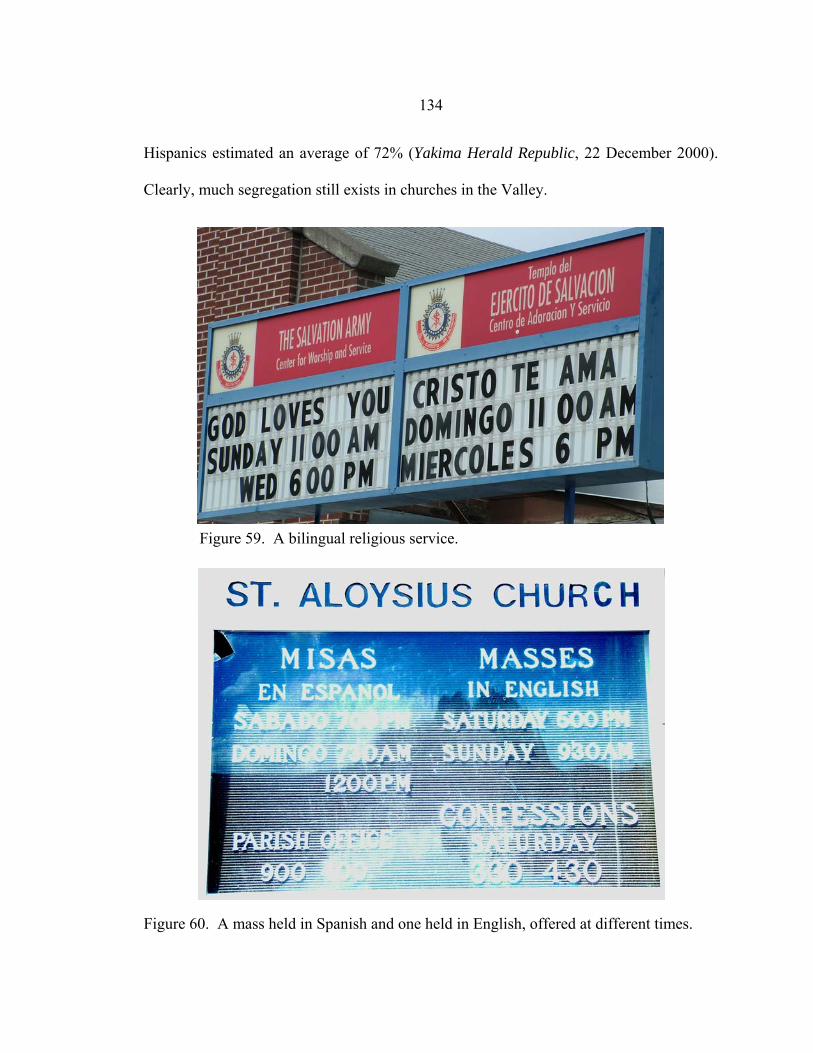
134
Hispanics estimated an average of 72% (Yakima Herald Republic, 22 December 2000).
Clearly, much segregation still exists in churches in the Valley.
Figure 59. A bilingual religious service.
Figure 60. A mass held in Spanish and one held in English, offered at different times.
135
Hispanic Businesses One of the greatest concerns to the Chamber of Commerce (COC) of each of the four
towns researched was the separation between Hispanic owned/oriented businesses and
non-Hispanic owned or oriented businesses. There appears to be a dichotomy between
the two, which creates an atmosphere of social segregation within these communities.
The use of bilingual signs encourages both Hispanics and non-Hispanics to enter a store.
However, advertising in one language only is likely to dissuade, if only slightly,
customers that do not speak the language endorsed. In both Sunnyside and Grandview,
the Hispanic owned stores are clustered in the downtown area, while the Anglo owned
stores have been pushed to the periphery. This creates a social space that exists primarily
around shopping. In addition to segregating customers from different shops and locales,
business owners themselves are also segregated from each other. Interviews were
conducted with Jim Harriman, president of the Grandview COC, and Rado Harrington,
president of the Sunnyside COC to get an idea about the greatest challenges in these
communities (Harriman, personal communication, 2005; Harrington, personal
communication, 2005). Both replied that it is a struggle to integrate the Hispanic
business owners with Anglo business owners. Harriman, a young man of about thirty,
grew up in Grandview, and remembers when there were no Mexican businesses in the
entire town. Now downtown Grandview is dominated by Hispanic businesses and
Harriman has tried unsuccessfully to get them involved in the COC meetings. He tried
sending out bilingual announcements to encourage participation, and also had translators
at several COC meetings, but the Hispanic business owners showed little interest.
136
Harriman feels that the COC needs to establish a sense of trust within the Hispanic
community in order to get them more involved. He also feels that Hispanics who do not
assimilate linguistically and culturally hinder themselves as well as Anglo businesses and
they need to market appropriately to the community as a whole. While Harriman says,
“it is a struggle to get both sides involved,” his goal as president of the COC and a
lifelong resident of his hometown is “to get the community integrated to represent the
whole community” (Harriman, personal communication, 2005).
Rado Harrington expressed many similar sentiments. Sunnyside is a town with a
population more than twice that of Grandview, and therefore has a much larger Chamber
of Commerce. However, Harrington said that he also has a hard time getting Hispanics
to attend COC meetings, despite having Spanish speakers hand out flyers in Spanish to
advertise the meetings and encourage Hispanics to attend. Despite the plethora of
Hispanic owned businesses and the large Hispanic population in Sunnyside, only two out
of ten city council members are Hispanic. Many Hispanic business owners feel that
ethnicity is an issue in Sunnyside’s businesses. They claim that they have not been
included in the mainstream business community and haven’t been listened to. Paul
Mendez, a Hispanic business man, feels that although business owners should learn
English, he resents that past chamber meetings were held in English only. His opinion is
that learning a language takes time and the fact of the matter is that many business
owners only speak Spanish. “They’re just like any other business person,” says Mendez.
“They want to get ahead, they want to make money” (Yakima Valley Herald, 15 May
2005, B1).
137
Harrington says that downtown Sunnyside has steadily degraded over the last three
to five years, as sprawl has increased on the fringes. He stated that some Anglos feel as if
they have been run out of the downtown, and that its been taken over by Hispanics.
About 90% of Sunnyside’s downtown businesses are Hispanic owned and the majority of
these are not bilingual. The Hispanic population in Sunnyside is so large that these
businesses don’t need to accommodate for Anglos at all and can survive solely on
Hispanic consumers. In fact, the majority of Sunnyside’s entrepreneurship is undertaken
by Hispanics, most of whom are business owners that have moved from Texas or
California. Harrington said that the labor force of these businesses tends to be family
based. He also said that there are some local Mexicans who are very wealthy but chose
to conceal it and this economic status is therefore unrevealed in census data.
Harrington described the annual Cinqo de Mayo Festival held in Sunnyside. In the
Pacific Northwest, it is second in size only to Seattle and is attended by both Anglos and
Hispanics alike, but most tourists coming from out of town are Hispanic. Harrington was
responsible for the festival this year and he feels that it hasn’t been very well undertaken
due what he calls a “cultural thing.” The event, a huge tourist attraction for the City, is
less attractive than it could be due to the use of “lean too’s and the abundance of trash
scattered throughout.” He thinks that this tendency, along with the crime and Hispanic
gang-related activity that plagues Sunnyside, has created a tension within the community.
Harrington’s goal as the newly appointed COC President is to revitalize the downtown
area. The City is currently trying to pass an ordinance to make the downtown more
attractive, and this is primarily aimed at the Hispanic owned businesses that employ
138
“garish colors” and excessive banners on their storefronts. Harrington employs two
Hispanic secretaries in his office mainly because of their ability to speak Spanish. He
recognizes that he cannot reach out to the Hispanic community if he does not have
bilingual capabilities in his own office. When Harrington applied for his current position,
his competition was a Hispanic man. When asked if he thought if a Hispanic leader
could be more successful in uniting the community and getting Hispanic businesses
involved, his response was that a Hispanic leader in his position “may produce an us
versus them” attitude (Harrington, personal communication, 2005).
Harrington’s goals and approaches to those goals were discussed in an article printed
in the Yakima Herald on May 15, 2005. The article, entitled “His Business Plan is
Unflinching,” describes Harrington’s attention to what he calls the “race problem” in
Sunnyside. He is quoted as saying “we have 81 percent of our community that is
underrepresented in the majority of our activities, I think its time we changed that.” The
article goes on to describe some reactions to Harrington’s direct approach to dealing with
this division. City Councilwoman Bengie Anguilar, expressed the feeling that Harrington
is “attempting to build a bridge that might be difficult to build,” but “I hope it gets done,
it needs to get done” (Yakima Valley Herald, 15 May 2005, B1).
Education
Schools in the Lower Yakima Valley face the challenges of cultural and linguistic
barriers. Many children entering elementary and middle school have little or no English
language ability, and often times their parents don’t either. This creates an even greater
139
challenge to students, parents, and the school district as academic standards have become
more rigorous with the No Child Left Behind Act, which encourages schools to eliminate
the achievement gap between diverse populations (Yakima Herald Republic, 27 January
2000). In response to these challenges, several schools in the Valley have turned to the
Dual Language Enrichment Program, a controversial yet promising approach.
The Dual Language Program is new to Washington schools. It is a model that Dr.
Richard Gomez, the Director of Bilingual and Migrant Programs for Washington State,
introduced from Texas. In 2003, a group of teachers and administrators from Yakima
Valley visited several schools in Texas to observe the Dual Language Program and
design curriculum. Now roughly twenty-two of Washington’s schools use some form of
the Dual Language Program. Out of those twenty-two schools, eleven are in Yakima
County and seven are in the study area. There are two versions of the Dual Language
Program used in Yakima Valley schools; the two teacher model and the alternate days
model. With the two teacher model, subjects are divided between a teacher who is
dominant in English and one who is dominant in Spanish. The students (who are equally
divided between English speakers and Spanish speakers) attend a morning session in
several subjects in one language and an afternoon session in other subjects in another
language. For example, math, reading, and art may be taught in English to both groups,
while science, reading, and social studies are taught in Spanish to both groups. In this
model, each teacher can greater specialize in a smaller group of subjects. The drawback
is that certain subjects are only taught in one language, so for example, an English
speaking student is forced to learn science in Spanish, which can be a major obstacle
140
(Office of the Superintendent of Public Instruction, n.d.). However, the two teacher
model successfully avoids one of the greatest problems with the Dual Language Program,
which is a lack of bi-lingual teachers.
In contrast to language by subject with the two teacher model, the alternate day
model varies language by day. For example, in many schools using this approach, the
first half of the school year consists of speaking Spanish for two days out of the week.
For the second half of the school year, Spanish is spoken for three days of the week.
Students in each classroom are divided the same way they are for the two teacher model;
half are dominant in English and the other half are dominant in Spanish. In this way,
students work together to help each other as “bilingual peer partners”. The drawback to
the alternate day model is the lack of bi-lingual teachers. According to Blanca Manrique,
reading coach at an elementary school in the Valley, many teachers who teach the
alternate day model are not bi-lingual, but “they try” (El Hispanic News, 13 January
2005).
In a 1997 study, the Dual Language approach proved to be the most effective
bilingual education model for addressing the academic needs of students. Research from
the Dual Language Program in Texas has indicated that students who participate in this
type of education outperform peers who are not in such programs, and this holds true for
English and Spanish speaking students alike. Netty Hull, a teacher in one of Yakima
Valley’s Dual Language schools, supports the program and says that “the academic piece
is really great, but it also builds the cultural consciousness” (El Hispanic News, 13
January 2005). Emelda Miranda is a fourth grade Dual Language teacher who was
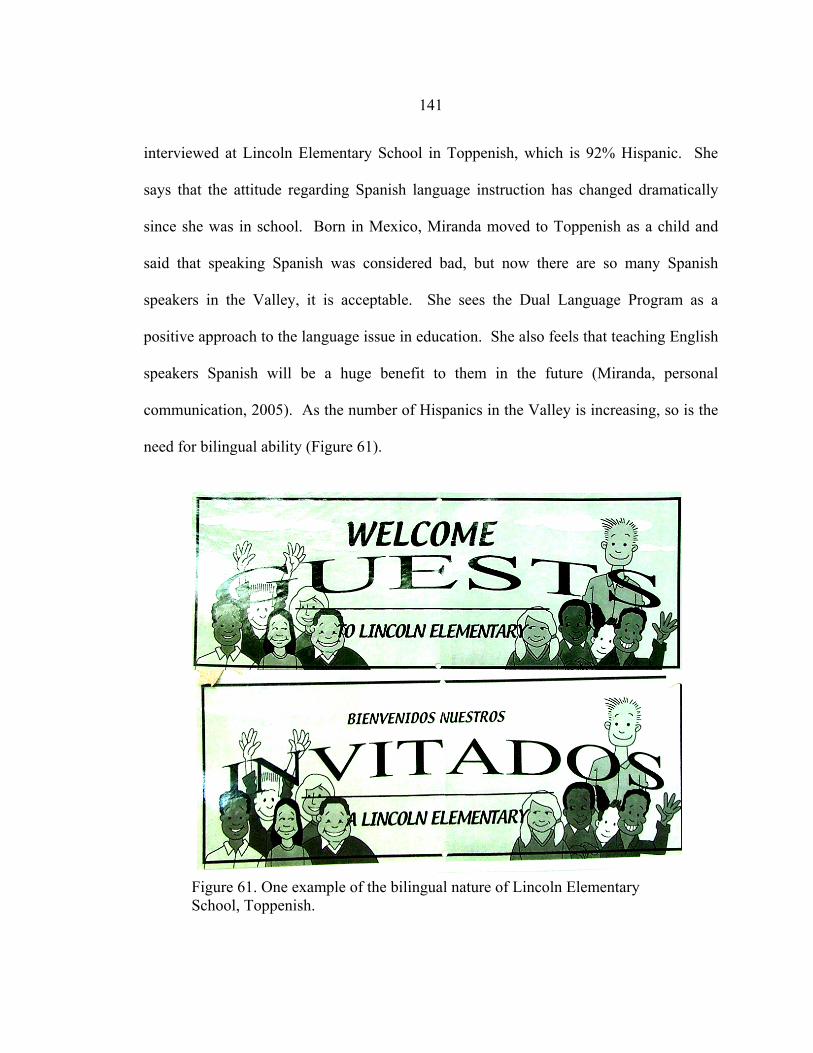
141
interviewed at Lincoln Elementary School in Toppenish, which is 92% Hispanic. She
says that the attitude regarding Spanish language instruction has changed dramatically
since she was in school. Born in Mexico, Miranda moved to Toppenish as a child and
said that speaking Spanish was considered bad, but now there are so many Spanish
speakers in the Valley, it is acceptable. She sees the Dual Language Program as a
positive approach to the language issue in education. She also feels that teaching English
speakers Spanish will be a huge benefit to them in the future (Miranda, personal
communication, 2005). As the number of Hispanics in the Valley is increasing, so is the
need for bilingual ability (Figure 61).
Figure 61. One example of the bilingual nature of Lincoln Elementary School, Toppenish.
142
There are two alternatives to the Dual Language Program: Transitional Bilingual
Education and Sheltered Immersion. Some schools have abandoned these approaches in
favor of the Dual Language Program, but they are still in use by the majority of schools
in Yakima County. The Transitional Bilingual Education model is designed for English
Language Learners (ELL) exclusively. The student’s native language is used throughout
the primary grades, with English being implemented according to the student’s ability.
The Sheltered Immersion approach uses English as a Second Language (ESL) to teach
ELL children in the same classroom as English speaking students. Teachers are trained in
ESL techniques and need only speak English. There are several types of Sheltered
Immersion Programs and the most commonly utilized in Washington is the ESL Pull-Out
Program. The Pull-Out Program separates ELL students from the mainstream classroom
for 45 minutes each day, during which time assistance is given in either English language
development or academic concerns. Unfortunately, this approach is the least effective
(Office of the Superintendent of Public Instruction, n.d).
Bilingual education programs do not come without criticism. Many parents of
English speaking children feel that their child’s education is slowed by the time dedicated
to learning Spanish. Some also believe that education should be an English only
endeavor. In a survey performed by the Yakima Herald Republic of 800 Yakima Valley
residents, 56% of non-Hispanics in Yakima County said that offering instruction in
Spanish to Spanish-speaking students should be reduced or eliminated altogether, 16% of
Hispanics felt the same way (Yakima Herald Republic, 13 January 2000).
143
Another major concern in Yakima Valley’s schools is parental involvement and the
migrant lifestyle. Three Hispanic teachers from different elementary schools were
interviewed and all of them said that one of the biggest problems inhibiting education in
their classrooms is migrant parents who take their children for extended trips to Mexico
during the school year. This creates an obvious disadvantage for a student who is not
only struggling to learn a new language, but must also try to catch-up on a large amount
of coursework. Miranda sympathizes with the desire for Mexican nationals to visit their
families at home. However, she attributes the lack of parental attentiveness to their
child’s education as a cultural issue. She said that in Mexico, parental involvement is
non-existent, as the Mexican education system is much stricter and more formal than the
U.S. system. Through personal outreach with migrant parents, she has managed to
decrease the amount of time some of her students spend away from the classroom
(Miranda, personal communication, 2005).
Conclusion
This chapter has taken an in-depth look at the various Hispanic imprints in the study
area, as well as avenues that exist in these communities for social integration or for social
segregation between Hispanics and non-Hispanics. The volume and visibility of the
numerous Hispanic imprints suggests a strong Hispanic presence in the Valley that is
separate from the Anglo population. Through business signage, religious services, and
various media outlets, the Spanish language creates a common identity within the
Hispanic community. Mexican food items, housing style, and musical preference are
144
ways in which the Mexican community displays this common identity. The existence
and strength of a common identity within the Mexican community combines with the
degree to which this identity is segregated from the Anglo community to shape how
assimilation occurs. For example, if more businesses operate in Spanish, then Spanish
speakers are more likely to retain their language, as it can be advantageous to do so,
especially in the case of employment. This situation creates a level of comfort and
acceptance with Spanish, which could prevent the quick adoption of English, thus
preventing cultural assimilation. Taking these factors into consideration, the pattern of
assimilation of Hispanics in the Yakima Valley will be addressed in the next chapter.
145
CHAPTER 7
THE EMERGING HISPANIC HOMELAND IN THE YAKIMA VALLEY: THEORIES AND PRACTICES
Theories of Immigrant and Ethnic Incorporation
Assimilation is defined as the process by which an immigrant population (often a
minority one) absorbs the culture and practices of their new host society, which is usually
a majority. There are many factors that inhibit assimilation, and some are more
prominent in the Mexican origin population than in other immigrant groups. For
example, the close proximity of Mexico and the 2,000 mile border it shares with the
United States puts Mexican immigrants and Mexican Americans in a unique position.
Past immigrants arriving from Europe had little opportunity to travel the great distance
back home, and present immigrants from Asia require a substantial financial commitment
to return to their countries of origin. Mexicans, however, are able to maintain strong
cultural ties through contact with friends and family in Mexico, as a trip there is only a
bus ride away from practically anywhere in the U.S. (Englekirk and Marín 2000).
Continual immigration is another factor contributing to the lack of assimilation that
has been noted in the Mexican population residing in the U.S. (Williams and Ortega
1990). Contact with newly arriving immigrants reinforces cultural identity, language,
and ties to the homeland, which may prevent or at least slow down assimilation into the
dominant society (Hardwick 2001).
146
The theory of immigrant assimilation is one that has always been contested and
compared to the theories of pluralism and multiculturalism. When Gordon established
seven distinct stages of assimilation in 1964, the debate did not end completely, but the
academic world accepted a theoretical framework that guided a great deal of research on
this topic. Gordon’s theory and the theory of assimilation in general has faced
considerable challenges over the last several decades, concurrent with the huge increase
in the number of immigrants now living in the U.S. since the 1970s (Williams and Ortega
1990). The theories of multiculturalism/pluralism, cultural citizenship, transnationalism,
and translocalism will be briefly discussed here to present alternatives to the traditional
model of assimilation.
Multiculturalism and Pluralism
Pluralism and multiculturalism are two distinct models that differ in their approach
to diversity. While the model of assimilation assumes a single cultural core, both the
multicultural and pluralist models strive to explain how different ethnic groups are able to
maintain their cultural distinctiveness and that society benefits from understanding and
appreciating the many cultures that constitute the larger society. Pluralism states that
ethnic and racial differences should thrive, as long as the values and norms of the
dominant culture are upheld. At its core, pluralism promotes a tolerance of diversity,
rather than an acceptance of it. Multiculturalism, on the other hand, promotes the
existence of multiple cultural norms. Rather than various cultural traditions blending into
one core culture, the emphasis is on the co-existence of many heritages within one single
147
country (Kottak and Kozaitis 1999). Both of these models promote cultural democracy,
but neither adequately explains how immigrant ethnic groups can actually change a
society’s social, cultural, and political norms (Camarillo and Bonilla 2001). Flores and
Benmayor criticize both multiculturalism and pluralism because they assume “a stable
and basically unchanging country where immigrants add color and spice,” and go on to
say that “analogies of a ‘salad bowl’ picture minorities as condiments or additives to the
basic ingredients of lettuce, but fail to consider a whole new salad” (Flores and
Benmayor 1997, 9).
Cultural Citizenship
The idea of cultural citizenship was developed by two Hispanic scholars, William
Flores and Rina Benmayor in 1997. This theory focuses on understanding how Hispanics
and other groups not only make cultural contributions to a plural society, but also how
they alter society. As Flores and Benmayor state, “in our opinion, what makes cultural
citizenship so exciting is that it offers us an alternative perspective to better comprehend
cultural processes that result in community building and in political claims raised by
marginalized groups in the broader society” (Flores and Benmayor 1997, 15). Cultural
citizenship has been increasing in relevancy as the influence of Hispanics in the U.S.
continues to grow. The theory has provided valuable insights into the relationship
between Hispanics and U.S. society and how the dynamic interactions between the two
produce continual change. Cultural citizenship describes how immigrant groups, or other
minorities that have typically been marginalized in society, build communities, develop
148
identities, and lay claim to cultural spaces, which can help elevate various subcultures to
a level where no one culture dominates. As opposed to national or even legal citizenship,
cultural citizenship describes a sense of belonging that is derived from shared cultural
characteristics. This idea of a shared identity ties in closely with homeland formation
because, according to Roark, “critical to the concept is a sense of group identity, a sense
of nationalism” (Roark 1993, 6).
Transnationalism
Transnationalism refers to an ambivalence of national identity often associated with
immigrants. A transnational identity is one in which an immigrant identifies with both
their country of origin and their country of residence. There are different levels of
transnational identity, ranging from the U.S. born child who is raised with only
descriptions of their ancestral homeland, to the immigrant grandmother who speaks no
English and identifies very little with American culture (Greene and Pick 2005).
Transnational identities can also differ with varying degrees of geographical proximity to
the country of origin. For example, identifying with two cultures is more prominent
along border communities where residents are confronted with both cultures on a daily
basis (Arreola 2002).
Translocalism: An Alternative The previously described theories are only a handful in the attempt to create a model
that can accurately describe and predict immigrants’ incorporation into American society.
Most likely, immigrant experiences always have and always will be much more
149
complicated and varied than any one model can represent. The rejection of one single
theory has been termed translocalism by Barkan who describes his theory:
Rather than one combined arena of social action embracing homeland and host society, we most likely observe dual arenas in a binary relationship wherein immigrants preserve varying degrees of overlap in terms of their activities, associations, networks, identity, etc… Nevertheless, in translocalism, while the homeland ties may be sporadic, even superficial, they retain some relevance and meaning for the immigrants, be they symbolic or tangible. Put another way, translocal newcomers are looking over their shoulder toward their homelands but have not entirely turned their backs on them (Barkan 2004, 340).
Barkan goes on to say that in order to preserve homeland ties, immigrants must struggle
to determine how far to go in adapting to their new host society, which involves
balancing the cultural and social bonds between two different countries. However, what
happens when the new host society provides the immigrant with many cultural and social
comforts of their homeland? What kind of identity is the immigrant assuming then? Is it
more closely tied to the homeland, to the host society, or to a unique ethnic island that
represents aspects of the two? These questions pertain intimately to the communities of
the lower Yakima Valley, which are dominated by Mexicans and therefore often bear a
closer resemblance to their immigrants’ homeland than their new land. So, if an
immigrant identifies with a predominately Hispanic community located in the U.S., are
they identifying with a new homeland? The following paragraphs will attempt to answer
this question by exploring different avenues of assimilation, as well as transnationalism,
in the communities of the lower Yakima Valley.
150
The Case of the Yakima Valley
The general theories discussed in the previous paragraphs establish a framework
within which the case of the Yakima Valley can be explored. It will now be determined
which theory best applies to the Valley based on how immigrants are assimilating there.
The possibility and likelihood of this area being considered an emerging homeland will
then be presented.
Economic Assimilation
When immigrants arrive in the U.S., they are often faced with the challenge of
finding employment and earning a suitable wage. Historically, the foreign born
population has been economically disadvantaged compared to the native born population.
This is still the case today with the poverty rate for immigrants being 50% higher than
that for natives and the annual median income of immigrants being about 76% of what it
is for natives. However, there is a temporal connection between wages and year of entry
for the foreign born; the longer immigrants are present in the U.S., the greater their
income tends to be (Camarota 2001). This evidence supports the idea of economic
assimilation and that, as immigrants become more familiar with the language and other
aspects of their host society, they become more occupationally mobile. Only after they
achieve higher incomes can immigrants leave ethnic enclaves and enter into other aspects
of American culture.
Economic assimilation in the Yakima Valley was based on Hispanic businesses,
income, and education. Data on Hispanic businesses were collected through personal
151
observation and interviews with the Chamber of Commerce of each community (See
Chapter 6). According to individuals within this organization, Hispanic businesses
occupy a significant place in the business community and often dominate the downtown
area. This opinion is easily confirmed simply by walking along the main streets of these
communities and observing the Hispanic storefronts and Spanish language signage (See
Chapter 6). An article by the Yakima Herald Republic described this changing business
atmosphere by quoting one local resident’s comment on the growing Hispanically
oriented stores: “if you’re in business, you better go that way, because that’s your
population” (Yakima Herald Republic, 10 December 2000).
Data on Hispanic income was collected through the U.S. Bureau of the Census (See
Chapter 4). The gap between the percentage of Hispanic families below the poverty level
compared to the total number of families below the poverty level has decreased in each
community, with an overall average decreasing from 12% to 5.5% between 1980 and
2000 (See Chapter 4, Figure 28). This suggests some degree of economic assimilation on
the part of Hispanics. However, a great deal of income inequality still exists between
Hispanics and non-Hispanic whites. In 2000, only 10% of non-Hispanic white families
were below the poverty level, while 32% of Hispanic families were below the poverty
level (See Chapter 4, Figure 31). Furthermore, Hispanic households dominate the
income bracket below $40,000 while white alone households dominate the income
bracket above $40,000 (See Chapter 4, Figure 32).
Education for Hispanics follows a similar course as income levels; disparities have
decreased but a great deal of inequality still exists. The white alone population averages
152
35% higher than Hispanics in the attainment of education beyond the high school level
(See Chapter 4, Figure 29). Comparing educational attainment at all levels between
Hispanics and non-Hispanic whites reveals that Hispanics are much more likely to have
less than a high school education and much less likely to have a Bachelor’s degree (See
Chapter 4, Figure 30).
Based on this data, Hispanics in the Yakima Valley have not fully assimilated
economically into the host society, which is reflective for the nation as a whole.
However, they have integrated themselves very successfully into the business community
and achieved some degree of economic mobility. Hispanics have, in a way, exhibited a
certain degree of cultural citizenship within the business community of the Valley. They
have created an identity based on shared cultural characteristics. This identity does more
than just add businesses to the existing economy; it alters the economic system by re-
orienting it to a culture that is quite different from the mainstream. Recalling the salad
bowl analogy on page 152, it is possible to see how Hispanics are no longer just additives
to the existing economy, but are in fact changing the very fabric of it.
Spatial Assimilation
Spatial assimilation was discussed earlier in Chapter 5 and is often described as the
precursor to structural assimilation; relocation by Hispanics into Anglo neighborhoods
increases interaction between the two groups. The underlying assumption is that
education, income, and occupational mobility facilitate this movement, which in turn
153
increases Anglo-Hispanic contact causing Hispanics to assimilate into Anglo culture
(Haverluk 1998).
Spatial assimilation for the lower Yakima Valley was estimated using the
Dissimilarity Index at the block group level and the census tract level (see Chapter 5).
Analysis revealed that a change residential segregation from 1990 to 2000 depended on
the unit of enumeration: segregation decreased slightly at the block group level but
increased slightly at the census tract level. However, personal observations and
interviews revealed a general consensus: Hispanics are less residentially segregated than
they used to be, and while purely Hispanic neighborhoods still exist, more of these areas
are integrated. This seems to be the result of the high growth in the number of Hispanics,
which makes segregation less possible. This is certainly the case when comparing the
growth in the percentage of Hispanics at the block group level with the change in the
value of diversity (See Maps 7 and 10).
The “Race Relations in the Valley” series published by the Yakima Herald Republic
revealed some attitudes of residents toward the issue of residential segregation. When
asked if they would feel comfortable living in a racially integrated neighborhood, 65% of
Hispanics and 64% of non-Hispanics answered yes. When asked if they currently live in
an area surrounded mostly by persons of the same race or ethnic background 51% of
Hispanics and 44% of non-Hispanics said yes. While two-thirds of respondents said
they’d be comfortable living in a racially integrated neighborhood, less than half of them
actually do. On similar social matters, less than ¼ of respondents said they prefer to
socialize with people of their own race, and more than ¾ said they have “close friends” of
154
a race or ethnic background different from theirs (Yakima Herald Republic, 10 December
2000). So, while residential segregation still exists, it is decreasing, and people seem to
be receptive to this.
Cultural Assimilation
Immigrants adopt some degree of cultural assimilation in order to become
economically assimilated. However, only after a large degree of interaction occurs
between immigrants and members of the host society, are immigrants truly able to
culturally assimilate. Language has been described as being one of the strongest cultural
bonds that exists and the retention of which is therefore an appropriate indication of
cultural assimilation (Sommers 1991). The cultural landscape is the most obvious
indicator of the preponderance of the Spanish language, which is strongly represented in
all four communities (See Chapter 6). Census data is another indicator of Spanish
language usage. Linguistic isolation, defined in Chapter 5, increased by an average of
4% from 1990 to 2000 for all four communities. The percentage of the population in the
study area older than 4 years who speak Spanish also increased by an average of 30%
(Chapter 4, Figure 27). Personal comments from long time residents confirmed that the
use of Spanish language signage as well as familiarity with Spanish has increased notably
over the last twenty years. Furthermore, Spanish language media has increased in
volume and circulation for both printed media and radio. It can therefore be concluded
that Hispanics in the study area have maintained a strong connection with their language
and, hence, their culture.
155
Many Valley residents also claim there is a difference between more recent
immigrants and ones that arrived twenty years ago. Some insist that Mexican immigrants
arriving today “come not with a quest for assimilation but more with a drive to maintain
heritage” while others argue that “Hispanic families who have lived in the Valley for
generations embrace the white culture better than new arrivals do” (Yakima Herald
Republic, 10 December 2000). Some Mexican Americans feel that an immigrant’s
inability to speak English (especially if the immigrant is illegal) can reflect badly upon
the Hispanic community as a whole and foster further prejudice against them. Miranda, a
Hispanic teacher in Toppenish, recalled that when she was in school about twenty years
ago, speaking Spanish was viewed negatively. “Now there are so many Hispanics, it is
acceptable,” she said (Miranda, personal communication, 2005). This shift in linguistic
assimilation suggests that the use of Spanish will continue to grow in the future.
Structural Assimilation
Structural assimilation is defined by Gordon (1964) as a stage in which the
immigrant group enters large scale, primary level interaction with the host society such as
cliques, clubs, and institutions. For the purpose of this thesis, the focus has been more on
the social integration aspect of this stage in order to gauge the level of interaction
between the two groups. Fieldwork revealed some cases in which Hispanics are socially
segregated from the non-Hispanic community, mainly in the business community and
church services (See Chapter 6). Interviews with teachers in the local schools revealed a
common theme that had not been considered prior to incorporating the idea of structural
156
assimilation into this thesis: social segregation is difficult in the classroom where
Hispanics commonly constitute close to 70% of the classroom. Therefore, while a certain
level of social integration is inevitable given the demographic composition of these
communities, purely Hispanic spaces still exist. These spaces span several avenues
including food, religion, shopping, and Mexican celebrations. The non-Hispanic
population has entered these spaces to a certain degree, but they are not the core
foundation or focus of these spaces; Mexican culture is.
Mexican restaurants are a good example of a Hispanic space. While there are many
Americanized Mexican restaurants in the Valley, there are also a few Yakima Valley
restaurants owned by families from Michoacan that cater specifically to the Michoacan
population. One example is Taqueria Mexicana in Toppenish which serves a clientele
that is 97% Mexican and primarily Spanish speaking. Ruben Romero, who owns
Sunnyside’s La Fogata Restaurant decorates his restaurant based on restaurants in
Michoacan with the solitary goal of making his customers feel more at home. In contrast,
another Mexican restaurant, called Anguililla describes their customers as 70% white and
30% Mexican (Yakima Herald Republic, 1 March 1995, C1). And still another Mexican
oriented restaurant, Los Girasoles, says “we get both Anglos and Latinos in here”
(Yakima Herald Republic, 14 December 2000).
On the issue of inter-ethnic friendships and dating, a survey conducted by the
Yakima Herald Republic found that the majority of Hispanics and non-Hispanics claim to
have close friends who are of a different race or ethnic background than themselves. The
response was similar to the issue of inter-racial dating and marriage: 81% of Hispanics
157
and 66% of non-Hispanics claimed to be comfortable with the issue (Yakima Herald
Republic, 22 December 2000).
While segregation between Hispanics and non-Hispanics is decreasing and the
general social atmosphere is more tolerant, rampant prejudice still exists. This prejudice
surfaced in response to a series of articles on the immigration path between the Yakima
Valley and the state of Michoacan in Mexico. The Yakima Herald Republic published a
weeklong series on various aspects of life in Michoacan as well as the lives of Mexican
immigrants in the Valley. The series was titled “Vecinos/Neighbors” and ran from
February 26, 1995 to March 5, 1995. The goal of the series was to promote a better
understanding of why so many immigrants are attracted to the area and to familiarize
Valley residents with the cultural background of the Mexican immigrant population in the
Yakima Valley. This series was first brought to attention when an employee at the
Herald Republic was asked if she knew of any stories they had published that were
focused specifically on the Hispanic population in the Valley. Discussion of the
Michoacan series prompted comments from several nearby employees, which initiated a
discussion of the controversy that it had caused. The Herald Republic had encouraged
readers to use their phone-in line and leave messages commenting on the series. While
some opinions were positive, many were so negative and offensive that the Hispanic
woman whose job it was to record the comments became so upset that she had to be
removed from the job. Many people also threatened to cancel their subscriptions to the
paper. In response, the Herald Republic moved the story off of the cover page on March
3rd and published a sampling of these responses under a Commentary section as part of
158
the series on March 4th and 5th. Many people expressed anger and a feeling that they are
being invaded or pushed out of their communities. One person commented that “I think
your articles on Mexico are out of line. This is the United States of America,” while
another said, “I don’t like this because the whole paper is taken up with Mexico and
we’re overrun with Mexico now” (Yakima Herald Republic, 5 March 1995, F5). Other
readers were delighted by the Herald’s efforts to promote cultural sensitivity in a place
that obviously experiences ethnic intolerance. One reader declared “maybe this will help
other Mexican people, such as ourselves, live better lives here in town and maybe give
other people positive influence of the Hispanic culture” and another stated “I’m glad the
paper is doing this project and I think it’s great. I think too many people in this area are
ignorant and fearful about people from Mexico.” (Yakima Herald Republic, 5 March
1995, F5). Unfortunately, the overwhelming majority of responses printed in the two
commentary sections were negative.
In response to this discontent, the Herald sought to explore the attitudes of local
residents on social issues by publishing a weeklong series entitled “Race Relations in the
Valley” in 2000 (See Chapter 4). The articles in the series were based on a survey of 800
respondents that was equally divided between Hispanic and non-Hispanic households.
The survey found that many residents, both Hispanic and non-Hispanic alike feel that
they have been discriminated against or are unhappy with changes in their communities
associated with the increasing Hispanic population. The respondents were asked how
they would rate the condition of race relations since they have lived in Yakima County.
Approximately 18% of Hispanics and 31% of non-Hispanics felt the conditions had
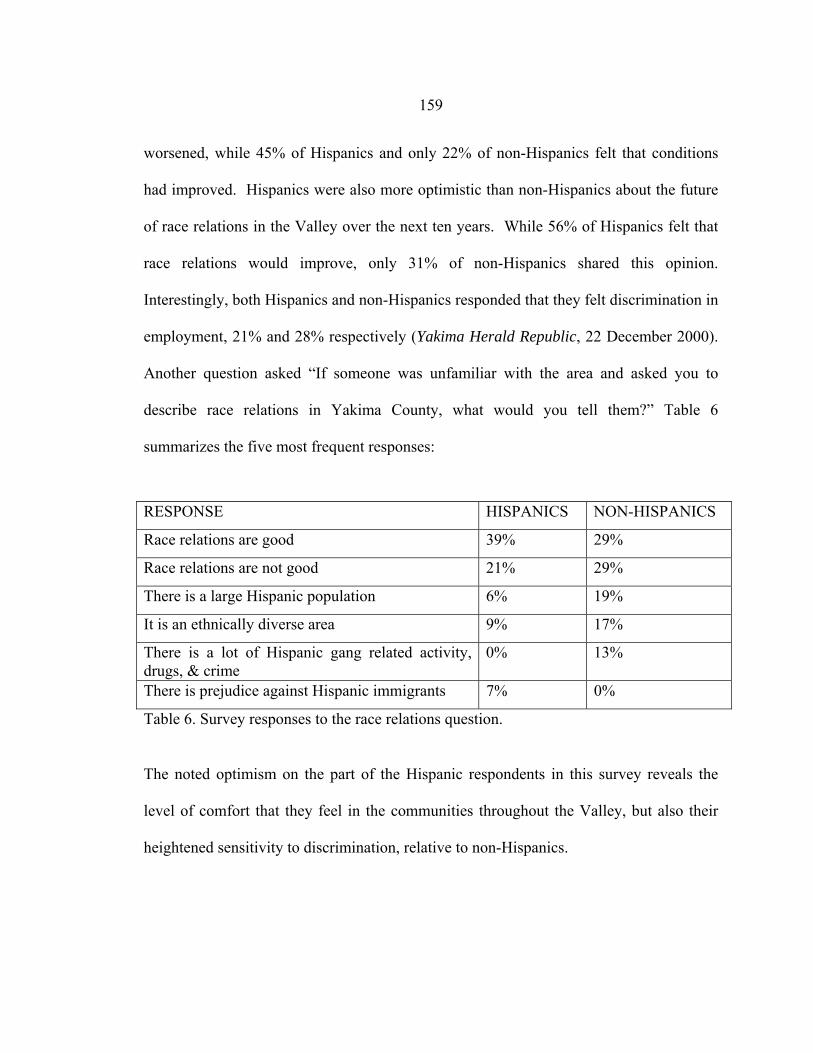
159
worsened, while 45% of Hispanics and only 22% of non-Hispanics felt that conditions
had improved. Hispanics were also more optimistic than non-Hispanics about the future
of race relations in the Valley over the next ten years. While 56% of Hispanics felt that
race relations would improve, only 31% of non-Hispanics shared this opinion.
Interestingly, both Hispanics and non-Hispanics responded that they felt discrimination in
employment, 21% and 28% respectively (Yakima Herald Republic, 22 December 2000).
Another question asked “If someone was unfamiliar with the area and asked you to
describe race relations in Yakima County, what would you tell them?” Table 6
summarizes the five most frequent responses:
RESPONSE HISPANICS NON-HISPANICS
Race relations are good 39% 29%
Race relations are not good 21% 29%
There is a large Hispanic population 6% 19%
It is an ethnically diverse area 9% 17%
There is a lot of Hispanic gang related activity, drugs, & crime
0% 13%
There is prejudice against Hispanic immigrants 7% 0%
Table 6. Survey responses to the race relations question.
The noted optimism on the part of the Hispanic respondents in this survey reveals the
level of comfort that they feel in the communities throughout the Valley, but also their
heightened sensitivity to discrimination, relative to non-Hispanics.
160
Political/Social Organizations
Haverluk (1994) describes the rise of political and social organizations that serve the
Hispanic population as a specific stage in the process of Hispanization. He suggests that
these organizations form “as soon as the Hispanic population is large enough to organize
and continue almost interminably” (Haverluk 1994, 30). In 1994, he described Yakima
County as being in between the stages of “Creation of a Hispanic middle class and
Hispanic organization” and “Political and Social Contestation.” It appears that this is
still the case today. While Hispanics have undoubtedly increased their political clout,
they still have a long way to go before their numbers are accurately reflected in the
political process. A sample survey showed that while 84% of non-Hispanics are
registered to vote, only 59% of Hispanics are (Yakima Herald Republic, 22 December
2000). In terms of political positions, the majority are still held by Anglos, but a growing
number are being acquired by Hispanics. For example, in the towns of Sunnyside,
Toppenish, Grandview, and Granger, Hispanics held nine of twenty-eight elected city
offices in 2000. During the Bush/Gore campaign, both offices advertised through
Spanish language media to attract the Hispanic vote. In 1990, the City of Toppenish had
two Hispanic members elected to the city council (Yakima Herald Republic, 16
December 2000). The population of Toppenish almost doubled between 1990 and 2000,
yet the number of Hispanic city council members remained the same in 2000.
While Hispanics remain underrepresented in the political process, the number of
organizations supporting them is extraordinary. Ranging from health service
organizations to legal counseling, there are a variety of organizations whose primary goal
161
is to aid Hispanics. At the local scale, social service organizations dominate, while
organizations whose goal is to empower Hispanics exist primarily at the regional or
national scale.
Hispanic Imprint/Cultural Landscape The Hispanic imprint in the communities of the lower Yakima Valley was described
in detail in Chapter 6. It is evident from field research that the Hispanic imprint has
increased dramatically in the past twenty-five years and is highly visible today. This
strong imprint in each of the four communities suggests that Hispanics have maintained
their culture as a unique identity separate from Anglo culture. The Anglo reaction to this
imprint is an interesting aspect of the dynamics of these communities. Personal
interviews with both Hispanics and non-Hispanics suggest that Anglos have mixed
reactions to the Hispanic imprint. Some fully appreciate the diversity it affords these
rural communities in the way of culture, food, and language. Others associate this
imprint with the wave of crime that has accompanied increased Mexican immigration.
As described in Chapter 6, the presence of a Mexican population in the lower
Yakima Valley is also apparent in the cultural landscape. The different ways in which
this population occupies different aspects of the cultural landscape and what this reveals
about the social processes that are occurring will now be explored. When observing how
the Mexican population occupies the cultural landscape, it became clear that spaces exist
which are more closely tied to Hispanics than to Anglos. The most obvious of these are
economic spaces, residential spaces, and cultural spaces.
162
Economic Spaces. Hispanic owned businesses are the strongest representation of the
economic space that the Mexican population occupies in the cultural landscape of the
four studied communities. When observing this space, it is important to note several
characteristics:
• Type of business
• Abundance and growth of these businesses
• The spatial cluster in downtown areas
• Orientation to Spanish speaking clientele
These characteristics are described in detail with accompanying examples in Chapter 6.
They will only briefly be discussed here. The most apparent Hispanic owned businesses
are grocery stores of various sizes, corner stores selling bus tickets and phone cards to
Mexico, and money transfer/check cashing services. The abundance of these businesses
is disproportionately large, given the relatively small population size of the towns in
which they are located. Personal anecdotes also revealed that this is a fairly recent
phenomenon, with almost no Hispanic owned businesses existing fifteen years ago. Also
of note is the spatial concentration of these businesses in the downtown area. The larger
towns of Sunnyside and Toppenish have experienced some sprawl in the last ten years,
and many businesses therefore moved to peripheral locations. Consequently, with the
growth of the Mexican population, Hispanic business owners took advantage of the lower
rents available in downtown areas and created a very Hispanic economic space there.
Furthering the existence of this space is the strong orientation these businesses have to
163
Spanish speaking customers. Due to the high number of Spanish speakers in these towns
(an average of 62% in 2000) these businesses are able to advertise solely to Spanish
speakers. Most in fact make no effort to cater to non-Spanish speaking customers,
although exceptions exist (See Chapter 6). Due to these four characteristics, a very
Hispanic, economic space exists in the downtown areas. What does this reveal about the
social dynamics occurring in these communities? Interviews with the chamber of
commerce of each town confirm what the cultural landscape suggests; an ethnically
segregated business community exists in the lower Yakima Valley. According to the
chamber of commerces, this is the greatest obstacle facing these towns and their main
goal in economic development is to try to integrate the business community (See Chapter
6 for more detail).
Residential Spaces. Another way in which Mexicans occupy the cultural landscape
is in residential spaces. The GIS analysis performed suggested that residential
segregation decreased from 1990 to 2000 (See Chapter 5). However, survey results from
the Yakima Herald Republic reveal that 51% of Hispanics and 44% of non-Hispanics still
live in ethnically segregated neighborhood (Yakima Herald Republic, 22 December
2000). Therefore, it is logical to conclude that Hispanic residential spaces exist and an
exploration of the cultural landscape confirms this. Hispanic neighborhoods are
identifiable by the existence of colorful gardens, manicured lawns, and chain link fences
(See Chapter 7). These descriptions are consistent with findings by others as being
characteristically Mexican (Benedict and Kent 2004). The existence of these Mexican
164
housescapes represents a Hispanic residential space and suggests the degree to which
residential segregation still exists.
Cultural Spaces. Language has been described as “the glue that holds
Hispanic/Latino populations together and that gives them a common bond and unifies
them as an ethnic population” (Arreola 2004, 16). Therefore, the use of Spanish that has
been focused on in this thesis as a representation of the existence of a Hispanic cultural
space in the landscape. As mentioned previously, the use of Spanish is evident in the
business spaces of downtown areas. However, a more dynamic representation of Spanish
language usage can be deduced via an analysis of two proliferating forces: the media and
the educational system (both of which have been discusses in detail in Chapter 6). The
use of Spanish language programming in the media, as well as the Dual Language
Program used in some of the lower Valley’s schools suggest the existence of a Hispanic
cultural space. This space has been growing in volume and influence, with the increasing
percentage of Spanish speakers in the four study communities, which has grown by an
average of 30% between 1980 and 2000 (See Figure 27). This cultural space that arises
from the Spanish language can serve to bond groups together within the Mexican
community that may be disparate (i.e. Mexican Americans versus new immigrants).
Such is the case for one description of the integrating force of music in the Yakima
Valley, offered by Cathy Ragland, an ethnomusicologist: “It is music that helps these
communities maintain their connection to one another, to experience significant lifetime
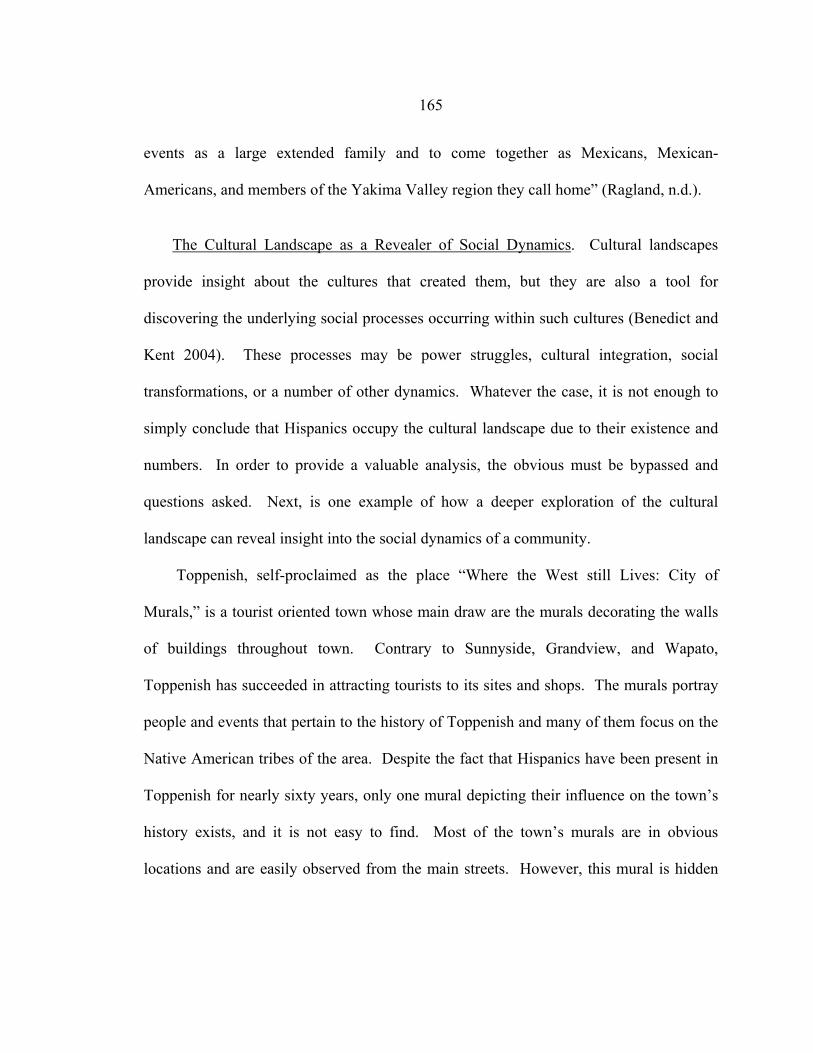
165
events as a large extended family and to come together as Mexicans, Mexican-
Americans, and members of the Yakima Valley region they call home” (Ragland, n.d.).
The Cultural Landscape as a Revealer of Social Dynamics. Cultural landscapes
provide insight about the cultures that created them, but they are also a tool for
discovering the underlying social processes occurring within such cultures (Benedict and
Kent 2004). These processes may be power struggles, cultural integration, social
transformations, or a number of other dynamics. Whatever the case, it is not enough to
simply conclude that Hispanics occupy the cultural landscape due to their existence and
numbers. In order to provide a valuable analysis, the obvious must be bypassed and
questions asked. Next, is one example of how a deeper exploration of the cultural
landscape can reveal insight into the social dynamics of a community.
Toppenish, self-proclaimed as the place “Where the West still Lives: City of
Murals,” is a tourist oriented town whose main draw are the murals decorating the walls
of buildings throughout town. Contrary to Sunnyside, Grandview, and Wapato,
Toppenish has succeeded in attracting tourists to its sites and shops. The murals portray
people and events that pertain to the history of Toppenish and many of them focus on the
Native American tribes of the area. Despite the fact that Hispanics have been present in
Toppenish for nearly sixty years, only one mural depicting their influence on the town’s
history exists, and it is not easy to find. Most of the town’s murals are in obvious
locations and are easily observed from the main streets. However, this mural is hidden
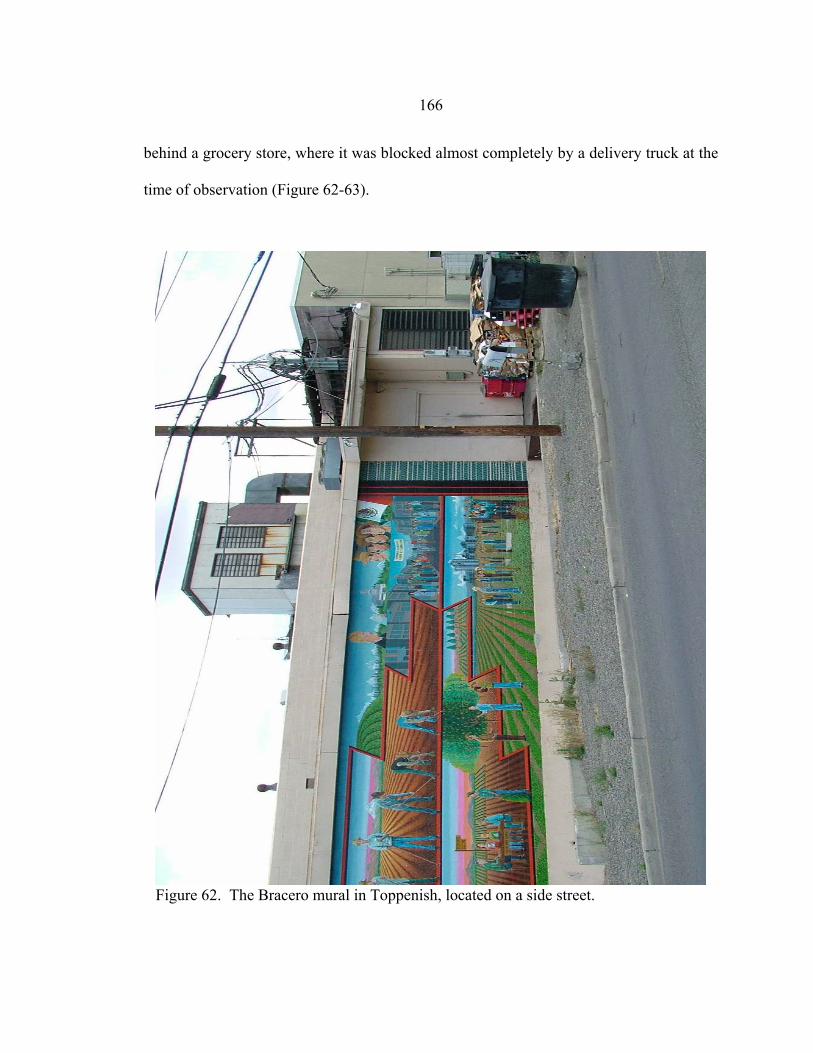
166
behind a grocery store, where it was blocked almost completely by a delivery truck at the
time of observation (Figure 62-63).
Figure 62. The Bracero mural in Toppenish, located on a side street.
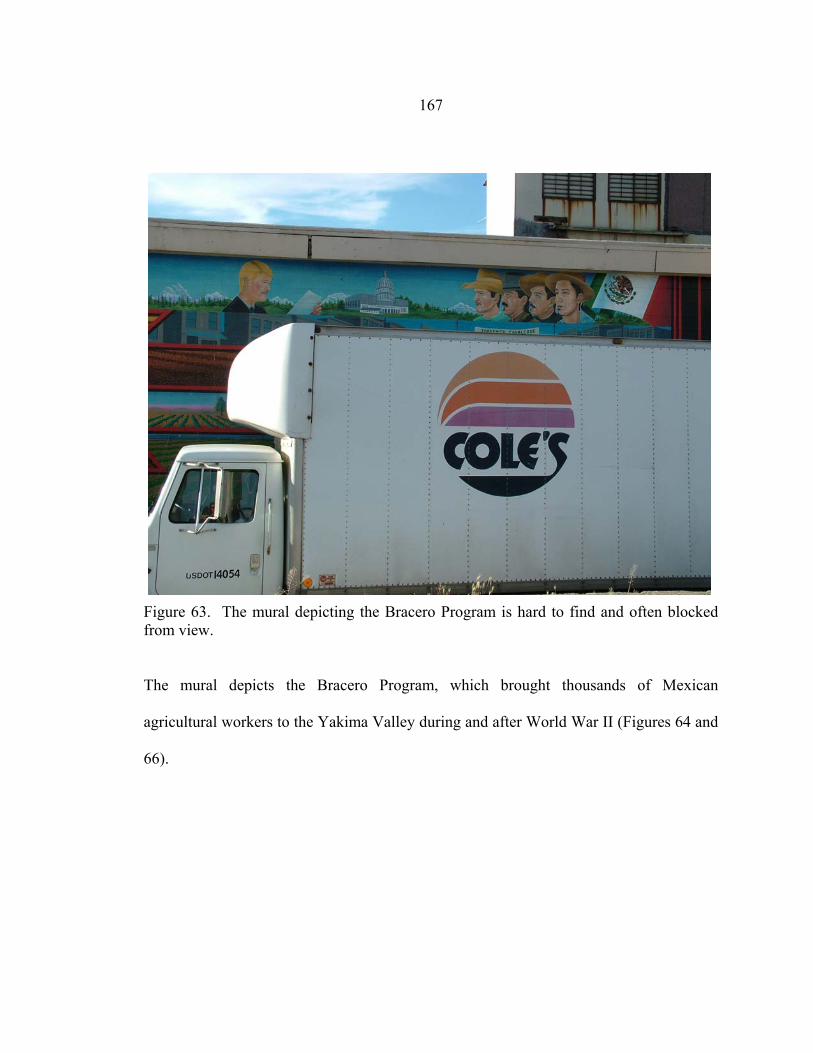
167
Figure 63. The mural depicting the Bracero Program is hard to find and often blocked from view.
The mural depicts the Bracero Program, which brought thousands of Mexican
agricultural workers to the Yakima Valley during and after World War II (Figures 64 and
66).
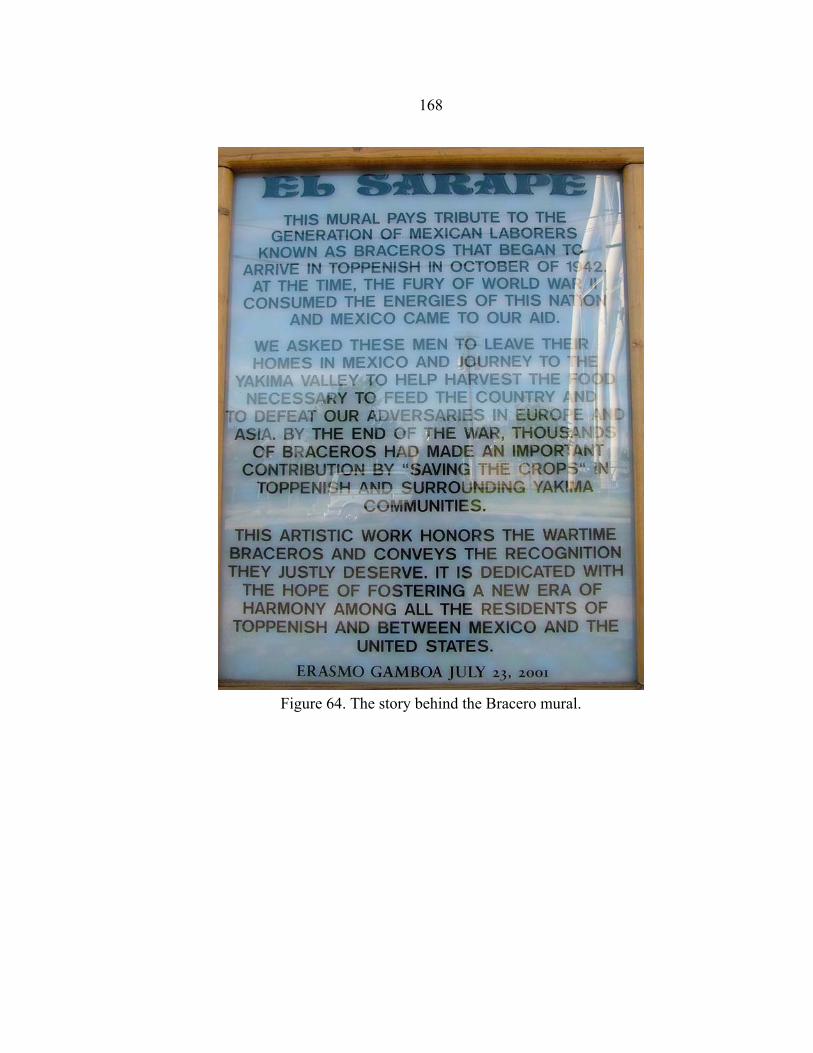
168
Figure 64. The story behind the Bracero mural.
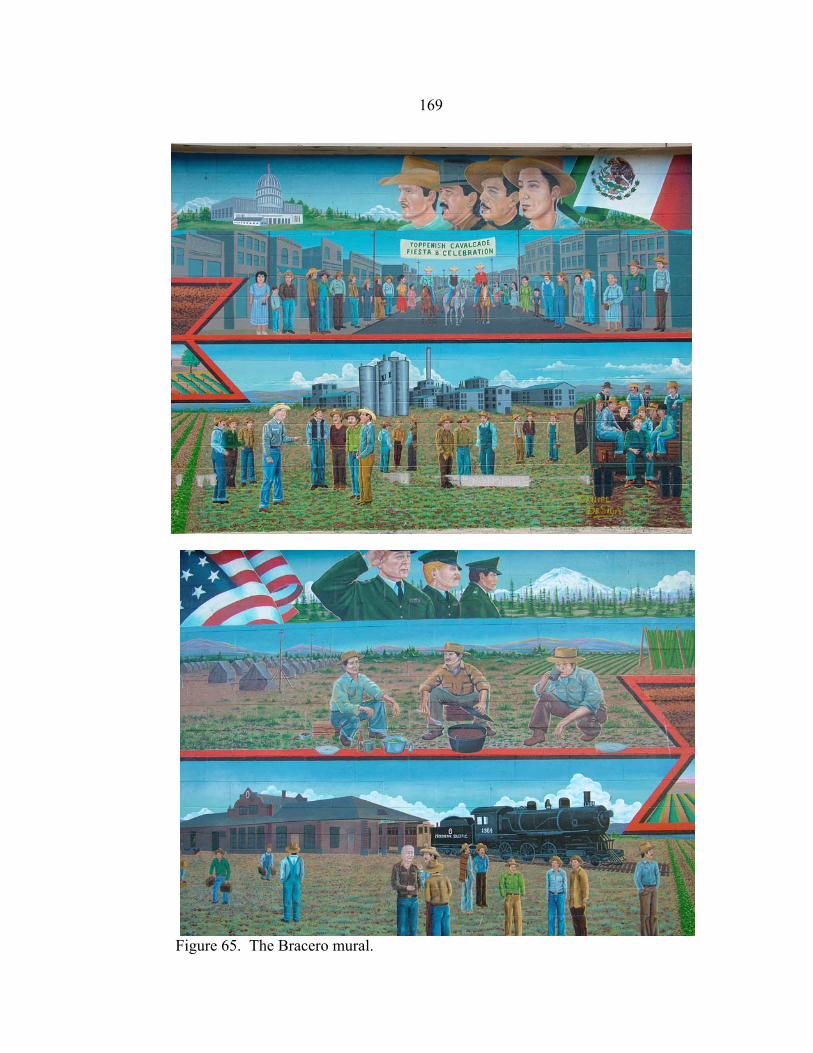
169
Figure 65. The Bracero mural.
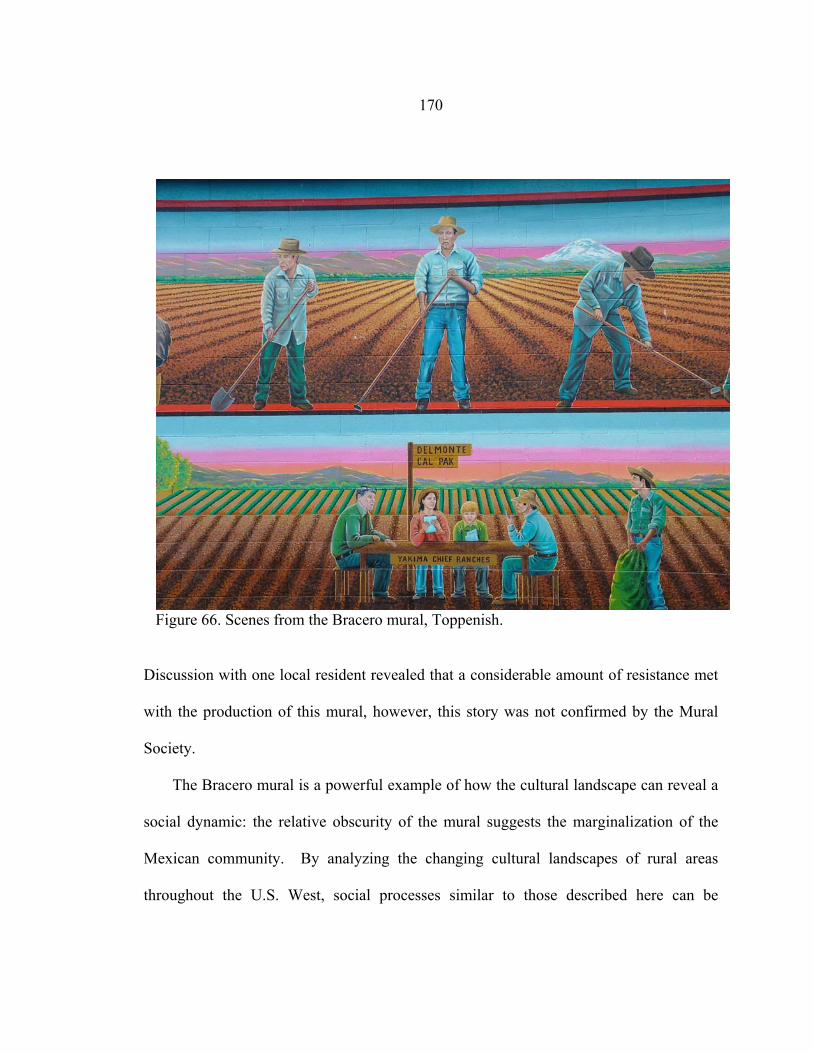
170
Figure 66. Scenes from the Bracero mural, Toppenish.
Discussion with one local resident revealed that a considerable amount of resistance met
with the production of this mural, however, this story was not confirmed by the Mural
Society.
The Bracero mural is a powerful example of how the cultural landscape can reveal a
social dynamic: the relative obscurity of the mural suggests the marginalization of the
Mexican community. By analyzing the changing cultural landscapes of rural areas
throughout the U.S. West, social processes similar to those described here can be
171
identified. A deeper analysis of the cultural landscape is invaluable to a deeper
understanding of the identity and social undercurrents of places as well as place making.
Summary of Results
Hispanics in the lower Yakima Valley show indications that they are assimilating
economically, spatially, and structurally, but not culturally. Many Hispanics in the lower
Yakima Valley feel that it provides all the comforts of their homes in Mexico and claim
to be very attached to the feeling of the place. However, many still refer to Mexico as
home. They are therefore characterized by a transnational identity. The question that
remains is: does a transnational identity inhibit the development of an ethnic homeland in
the host country? If we return to the key homeland ingredients discussed in the first
chapter, it is clear that Hispanics in the lower Yakima Valley have fulfilled enough of the
requirements to be considered an emerging homeland. They have clearly bonded with
the land, as can be seen throughout the cultural landscape. They also exhibit a certain
degree of control of place; while political control is still developing, home ownership by
Hispanics has increased considerably in the last ten years (Yakima Herald Republic, 14
December 2000). One of the early definitions of the homeland concept, offered by
Nostrand (1992), is applicable to the communities researched for this thesis:
The concept of a ‘homeland,’ although abstract and elusive, has at least three basic elements: a people, a place, and identity with place. The people must have lived in a place long enough to have adjusted to its natural environment and to have left their impress in the form of a cultural landscape. And from their interactions with the natural and cultural totality of the place they must have developed an identity with the land- emotional feelings of attachment, desire to posses, and even compulsion to defend (Nostrand 1992, 214).
172
Both Hurt (2003) and Conzen (2001) stress the importance of a sense of community and
a feeling of belonging as essential elements in a homeland. The Hispanics in the Yakima
Valley describe an emotional attachment to their communities that fits those elements.
They also portray a physical sense of attachment to place in the cultural landscape that is
a necessary precursor to the development of a homeland. Both of these attachments are
extremely transnational in nature and, while they create a bond between Hispanics and
their new homes in the Yakima Valley, they also serve to reinforce ties with homes in
Mexico. Contrary to the Highland Hispano homeland, in which Hispanics created a new
homeland for themselves, Hispanics in the Yakima Valley are, in a way, creating a
surrogate homeland that may serve only as a temporary replacement until they return to
their country of origin. The existence and formation of this surrogate homeland is
strengthened by the sense of cultural citizenship that Hispanics in the Valley exhibit.
Furthermore, chain migration and a majority population may contribute to Hispanization,
a process by which non-Hispanics are influenced by and adopt Hispanic cultural traits.
Over time, this Hispanization will contribute further to a sense of place that is more
closely tied to Hispanics than to Anglos, increasing the viability of this emerging
homeland.
173
CHAPTER 8
CONCLUSION
An exploration of the Hispanic population of Yakima Valley reveals different
avenues as well as different degrees of assimilation by an immigrant population into their
host society. The situation in the Valley is unique because in all the towns researched
Hispanics are a majority. This fact shapes and controls the way in which Hispanics
assimilate and also results in Hispanization, or reverse assimilation in which non-
Hispanics are influenced by the Hispanic population. Their numbers have allowed them
to maintain a cultural cohesiveness necessary to retain an identity that is separate from
the Anglo community. This has also afforded them a level of comfort that is further
strengthened by a strong sense of belonging, contributing to a unified cultural citizenship.
The result is a place that closely resembles the immigrants’ home and is steadily
emerging into a new homeland for its Hispanic population. Consistent with the theory of
transnationalism, this population is emotionally tied to their country of origin, yet
physically committed to their country of destination.
The value of this research lies in its ability to serve as an example to non-
metropolitan areas throughout the American West that are experiencing, or may soon
experience, similar demographic changes. Thilmany (2003) has established a positive
correlation between growth in the agricultural sector and growth in the Hispanic
population in the Western mountain states of Montana, Idaho, Washington, Oregon,
Utah, Nevada, Colorado, and Wyoming (Thilmany 2003). Combined with production
174
agriculture are the allied fields of ornamental plant production, golf course maintenance,
and landscaping. Similar to the agricultural sector, these jobs employ a large number of
immigrants, most of whom are Hispanic. The use of Hispanic immigrant labor is also
closely tied to the service industry, which is growing rapidly in the West as amenity
driven tourism increases in places such as Montana, Wyoming, Utah, and Nevada. As
these industries expand, it is very likely that demand for immigrant labor will continue to
grow (Thilmany 2003). Combined with this demand is the increasing supply of Hispanic
immigrants. Between January 2000 and March 2005, 7.9 million new immigrants (legal
and illegal) arrived in the United States, making it the highest five-year period of
immigration in history (Camarota 2005). Therefore, it is appropriate to assume that more
and more towns throughout the Western mountain states will undergo the same
demographic changes that the Yakima Valley has.
This case study of the Yakima Valley reveals three main areas of contention that
have accompanied an increasing Hispanic population. Many studies aim to predict the
influence of a large Hispanic population on a community via an analysis of general
economic impacts or the use of social services (Kritz and Gurak 2004). However, this
thesis provides a unique perspective by examining how the local residents feel about the
demographic changes in their communities and, more importantly, how they react to
those changes. It is through those feelings and reactions that social processes, be them
Hispanization or assimilation, create and transform not only identity, but also place.
Through this place making process, the three areas of contention arise: a segregated
business community, educational challenges, and disparate socioeconomic conditions.
175
A glance at the growth of Hispanic businesses in any of the studied towns would
suggest a positive situation for Hispanics. By simply analyzing the numbers, one could
conclude that Hispanics in these towns are integrating into the business community and
assimilating economically. However, as this study has demonstrated, the growth in
Hispanic businesses has not translated into an integrated business community but has, in
fact, lead to a very segregated economic system. Hispanic businesses in Sunnyside, for
example, are clustered in the downtown area, while many Anglo owned businesses have
moved out of downtown, and are now located on peripheral areas. This physical
segregation may be partially dependent on the size of each town. For example, the
smaller towns of Wapato and Grandview have experienced less sprawl than the larger
town of Sunnyside and therefore still retain some Anglo businesses in their downtown
areas. Cultural and linguistic barriers have added to these differing degrees of
geographical segregation to create two distinct business communities based on ethnicity.
While this may not be detrimental to Hispanic business owners per se, it is a drawback to
the community as a whole because this situation prevents the business community from
uniting and working together to strengthen the economic development of Sunnyside (see
Chapter 6 for more detail). With the gift of hindsight, it is possible to identify approaches
that could have prevented these obstacles from arising. Such an approach could range
from zoning laws to the formation of interethnic committees to simple communication
between Anglo and Hispanic business owners. It is important to keep in mind of course,
that such approaches are site specific and depend on a variety of factors. However, the
176
case of the Yakima Valley provides a blueprint for the possible problems other
communities may encounter as Hispanic businesses increase.
Another area of contention that the towns of the Yakima Valley have faced is the
challenge of a monolingual Spanish speaking student body. As the number of Spanish
only speakers has increased, schools throughout Washington State have reacted with
different strategies and programs aimed at accounting for this issue (see Chapter 6).
These programs range from segregating Spanish only speakers from the mainstream
classroom for intensive English classes to the Dual Language Program, which teaches all
students both Spanish and English simultaneously. While the problem is far from being
resolved, the Dual Language Program has exhibited promising results. This program, of
course, does not come without criticism, but it does have the potential to serve as a
common ground between the Spanish and English speaking populations as a whole. It is
a program that is not only sensitive to the specific needs of the community, but also aims
to develop cooperation within the classroom that can hopefully extend to the world
outside.
The final area of contention is the disparate socioeconomic conditions between
Hispanics and Anglos. Census data for the Yakima Valley reveals a considerable gap
across a number of economic indicators including educational attainment, income, and
poverty status (see Chapter 4). Data does suggest a narrowing of these disparities, but it
is slow in coming. On a discouraging note, these disparities reflect the national trend and
therefore may require policy approaches that operate on a larger scale than the local level.
The important issue here is that the challenges of solving these areas of contention and
177
strengthening a community are greatly magnified in the presence of inequality. It is with
this rhetoric in mind that policy implications will now be addressed.
Policy Implications
Immigration policy is currently a very timely subject and it no doubt will continue to
be in the years to come. At the time of writing this thesis the number of immigrants
arriving in the U.S. annually reached historic highs prompting the introduction of
comprehensive immigration reform bills. The debate over which policies are adequate
and appropriate is extremely complicated and beyond the scope of this thesis. However,
case studies such as the one performed in this thesis, can serve to inform discussions by
providing historical anecdotes about the multitude of consequences policies can have.
In 2004, the Bush Administration proposed a temporary guest worker program. The
Administration cited a plethora of benefits to such a program, including a more
prosperous economy, a reduction in the amount of illegal immigrants, and decreased
pressure on the border. The program would provide guest workers with an economic
incentive to return home, in the form of tax incentives and retirement credits (Office of
the Press Secretary 2004). However, historical examples provide sufficient proof that
“there is nothing more permanent than temporary workers” (Martin 2001, 1). A study of
a rural town in Mexico found that 64% of its residents who worked as braceros between
1942 and 1949 eventually reentered the U.S. (Gamboa 1990). The Bracero Program,
enacted as a temporary wartime measure, initiated a migration stream to the Yakima
178
Valley that has transformed the economy and culture of that area (See Chapter 3 for
details on the Bracero program). The program also had a large impact on Mexico. The
cost of transportation encouraged potential braceros to move to the border, resulting in a
rural to urban shift that effectively established impoverished border cities. This in turn
has fed into illegal immigration, as an abundance of unemployed workers have settled
along the U.S.-Mexican border (Martin 2001). It is a powerful reminder of how the past
can inform the present and is extremely pertinent to the current debate concerning
immigration reform.
In addition to national immigration policies, state and local policies can also be
informed by this case study. As mentioned in Chapter 6, educational considerations
differ greatly in a community that is a majority Hispanic. It is vital that these differences
be considered if they are to be addressed appropriately. Furthermore, as the Hispanic
presence in rural areas of the U.S. West continues to increase, research that can be used
in a comparable way will be important as a guideline for development and to function as
an outline for what works and what doesn’t. The issues of language, education, and
political involvement that are just beginning to appear in many places can be tackled
more effectively only by a better understanding of similar communities. In the words of
Roseman, “Micro studies of ethnic communities will further our understanding of ethnic
change in the United States by weaving together a more complete picture of changing
ethnic settlement patterns, and the processes contributing to those patterns” (Roseman
2002, 36).
179
An analysis of the cultural landscape is one technique that can be used to steer
economic development in a successful direction, which in the case of the lower Yakima
Valley involves integrating and considering both Spanish and English speaking clientele.
The frequent use of the Spanish language in the cultural landscape can inform
educational policies that benefit the entire community, such as the Dual Language
Program does the study area.
The changing ethnicity of the lower Yakima Valley brings with it changes not only
to the cultural landscape, but also to the social fabric of the area. Issues of social
inequality, income disparity, and increasing crime are just a handful of considerations
that are facing these communities, as well as many others throughout the Western United
States. The growing number of Hispanics in the communities researched in this thesis
suggests policy solutions that may begin to change as Hispanics increase what is already
majority status. In his classification of different types of Hispanic communities, Haverluk
(1998) described Yakima County as a ‘new community’ where Hispanics are relatively
new immigrants; they lack political control and assimilate relatively quickly. However,
contrary to other new communities, Hispanics in the Valley are not faced with the same
pressure to assimilate, as are Hispanics in many other areas of the U.S., and therefore
have chosen to assimilate in certain ways but not in others. Research on Hereford Texas,
another “new community” that has become a majority Hispanic, shows similar results.
As described by Arreola (2004), “we may be witnessing a fundamentally new process of
Hispanic place making, in which former Anglo-dominant towns transform entirely into
180
Latino places, hybridizing with non-Hispanic populations” (Arreola 2004, 11). What
impact does this new type of place making have on local policy?
One example is job discrimination. Due to the high number of Spanish speakers in
the Yakima Valley, bilingual skills have become a priority for many businesses. As a
consequence, more non-Hispanics than Hispanics claim to have felt discrimination in
employment (28% and 21% respectively) (Yakima Herald Republic, 22 December 2000).
Despite a clear income disparity that still favors non-Hispanic whites, this response
points to a changing situation that policy makers will need to consider if they are to
provide for the majority Mexican population as well as the minority Anglo population of
these places. The Dual Language Program is one attempt to integrate these ethnic groups
linguistically and therefore reduce language barriers that exist on both sides of the
spectrum (i.e. for Spanish and non-Spanish speakers alike). However, it is important that
such efforts accompany the changes these towns are experiencing and aim to eliminate
any imbalance of power that exists. By advancing equality, discrimination and prejudice,
be it on the part of either ethnicity, are more likely to decrease. In the words of Haverluk
(2004), “towns … are living laboratories for a number of the contemporary social,
economic, demographic, and cultural issues facing Hispanic Americans” (Haverluk 2004,
291).
181
REFERENCES Allen, J., and Eugene Turner. 1996. “Spatial patterns of immigrant assimilation.” Professional Geographer 48 (1): 140-155. Arreola, D. 1988. “Mexican American Housescapes.” Geographical Review 78 (3): 299- 315. −−−. 2000. “Mexican Americans”. In Ethnicity in Contemporary America: A Geographical Appraisal, 111-138. Oxford: Rowman & Littlefield. −−−. 2002. Tejano South Texas: A Mexican American Cultural Province. Austin:
University of Texas Press. −−−. 2004. “Hispanic American Legacy, Latino American Diaspora”. In Hispanic
Spaces, Latino Places, ed. Daniel Arreola, 13-35. Austin: University of Texas Press.
Barkan, E. 2004. “America in the Hand, Homeland in the Heart: Transnational and
Translocal Immigrant Experiences in the American West.” Western Historical Quarterly 35 (3): 331-354.
Benedict, A. and Robert Kent. 2004. “The Cultural Landscape of a Puerto Rican Neighborhood in Cleveland, Ohio”. In Hispanic Spaces, Latino Places, ed.
Daniel Arreola, 187-205. Austin: University of Texas Press.
Brady, S. 2004. Central Washington’s Emerging Hispanic Landscape. FOCUS on Geography 47 (4): 15-20.
Buckley, A. 2005. Interview by Laurie Darian. Toppenish, Washington. Camarillo, A. and Frank Bonilla. 2001. Latinos and the Changing Face of America. Population Reference Bureau. www.prb.org. Camarota, S. 2001. Immigrants in the United States-2000: A Snapshot of America’s Foreign-Born Population. Center for Immigration Studies. www.cis.org. −−−. 2005. Immigrants at Mid-Decade: A Snapshot of America’s Foreign-Born
Population in 2005. Center for Immigration Studies. www.cis.org.
Camarota, S. and Nora McArdle. 2003. Where Immigrants Live: An Examination of State Residency of the Foreign Born by Country of Origin in 1990 and 2000.
Center for Immigration Studies. www.cis.org.
Conzen, M. 2001. “American Homelands: A Dissenting View”. In Homelands: A
182
Geography of Culture and Place across America, ed. Richard Nostrand and Lawrence Estaville, 238-271. Baltimore: Johns Hopkins University Press.
Dibble, J. 2005. Interview by Laurie Darian. Yakima, Washington. Downey, L. 2003. “Spatial Measurement, Geography, and Urban Racial Inequality.” Social Forces 81 (3): 16-26. Englekirk, A. and Marguerite Marín. 2000. “Mexican Americans”. Gale Encyclopedia
of Multicultural America, Volume 2, 2nd Edition. Ed. Jeffrey Lehman, 1190- 1222. Detroit: Gale.
Flores, W. and Rina Benmayor. 1997. “Constructing Cultural Citizenship.” In Latino Cultural Citizenship: Claiming Identity, Space, and Rights, ed. W. Flores and R. Benmayor, 1-23. Boston: Beacon Press. Gamboa, E. 1981. “Mexican Migration into Washington State: A History, 1940-1950.” Pacific Northwest Quarterly 72 (3): 121-131. −−−. 1984. Under the Thumb of Agriculture: Bracero and Mexican American Workers in
the Pacific Northwest, 1940-1950. PhD dissertation, University of Washington. −−−. 1990. Mexican Labor and World War II: Braceros in the Pacific Northwest, 1942-1947. Austin: University of Texas Press. −−−. n.d. Notes on the Music of the Yakima Valley’s Mexican American Community.
Mexican-American Traditions of Washington State. Washington State Arts Commission. www.arts.wa.gov.
Gordon, M. 1964. Assimilation in American Life. New York: Oxford University Press. Greene, R. and James Pick. 2005. Exploring the Urban Community: A GIS Approach. Ed. Keith Clarke. New Jersey: Pearson Prentice Hall. Hardwick, S. 2001. California’s Emerging Russian Homeland. In Homelands: A
Geography of Culture and Place across America, ed. Richard Nostrand and Lawrence Estaville, 210-224. Baltimore: Johns Hopkins University Press.
Harriman, J. 2005. Interview by Laurie Darian. Grandview, Washington. Harrington, R. 2005. Interview by Laurie Darian. Sunnyside, Washington. Haverluk, T. 1992. Mex-America: the Maintenance and Expansion of an American Cultural Region. PhD dissertation, University of Minnesota. −−−. 1994. A Descriptive Model for Understanding the Wider Distribution and
183
Increasing Influence of Hispanics in the American West. Hispanic Research Center Working Paper 04, University of Texas at San Antonio.
−−−. 1998. “Hispanic community types and assimilation in Mex-America.” Professional Geographer 50 (4): 465-480.
−−−. 2003. “Mex-America: From Margin to Mainstream”. Western Places, American Myths: How we think about the West, ed. Gary Hausladen, 166-183. University of Nevada Press, Las Vegas.
−−−. 2004. Hispanization of Hereford, Texas. Hispanic Spaces, Latino Places, ed. Daniel Arreola, 277-291. Austin: University of Texas Press.
Hurt, D. 2003. “Defining American homelands: a Creek Nation example, 1828-1907.” Journal of Cultural Geography 21: 19-25. Kandel, W. and Emilio Parrado. 2004. “Hispanics in the American South and the
Transformation of the Poultry Industry”. Hispanic Spaces, Latino Places, ed. Daniel Arreola, 255-276. Austin: University of Texas Press.
Kottak, C. and Kathryn Kozaitis. 1999. On Being Different: Diversity and
Multiculturalism in the North American Mainstream. McGraw-Hill College. Kritz, M. and Douglas Gurak. 2004. Immigration and a Changing America. Russell Sage Foundation/Population Reference Bureau. www.cis.org. Leek, M., Mark Vandekamp, and Susan Kinne. 1991. A Community Analysis of the Hispanic Population in Yakima County. Fred Hutchinson Research Center,
Seattle. Lewis Mumford Center for Comparative Urban and Regional Research. n.d.
http://mumford1.dyndns.org/cen2000/WholePop/WPsort.html. Maldonado, C. 1995. An Overview of the Mexicano/Chicanos in the Pacific Northwest. In The Chicano Experience in the Northwest, ed. Carlos Maldonado and Gilberto Garcia, 1-33. Iowa: Kendall/Hunt. Massey, D. 1985. Ethnic residential segregation: A theoretical synthesis and empirical
review. Sociology and Social Research 65: 311-322. Massey, D., and Brendan Mullan. 1984. “Processes of Hispanic and black spatial assimilation.” American Journal of Sociology 89 (4): 836-873. McKee, J. 2000. “Humanity on the Move”. Ethnicity in Contemporary America: A
Geographical Appraisal, ed. Jesse McKee, 19-45. Oxford: Rowman and Littlefield.
184
Miranda, E. 2005. Interview by Laurie Darian. Toppenish, Washington. Nostrand, R. 1970. “The Hispanic-American Borderland: Delimitation of an American
Cultural Region.” Annals of the Association of American Geographers 60 (4): 638-661.
−−−. 1992. The Hispano Homeland. Norman: University of Oklahoma Press. Nostrand, R. and Lawrence Estaville. 2001. “Free Land, Dry Land, Homeland”. In Homelands: A Geography of Culture and Place across America, ed. Richard
Nostrand and Lawrence Estaville. Baltimore: The Johns Hopkins University Press.
Office of Superintendent of Public Instruction, Washington. n.d. Description of Bilingual
Education Instructional Models. www.k12.wa.us. Ragland, C. n.d. Gritos del Alma: Introduction. Mexican-American Traditions of
Washington State. Washington State Arts Commission. www.arts.wa.gov.
Roark, M. 1993. “Homelands: A Conceptual Essay.” Journal of Cultural Geography 13 (2): 5-11. Roseman, C. 2002. “The Changing Ethnic Map of the United States”. Geographical
Identities of America- Race, Space, and Place, 15-37. Reno, Nevada: University of Nevada Press.
Rowntree, L., Martin Lewis, Marie Price, and William Wyckoff. 2003. Diversity Amid Globalization: World Regions, Environment, Development. Upper Saddle River,
New Jersey: Prentice Hall. Rubenstein, J. 2002. The Cultural Landscape: An Introduction to Human Geography. Upper Saddle River, New Jersey: Prentice Hall. Saenz, R. 2004. Latinos and the Changing Face of America. Population Reference Bureau. www.prb.org. Sandefur, G, Molly Martin, Jennifer Eggerling-Boeck, Susan Mannon, and Ann Meier.
2001. An Overview of Racial and Ethnic Demographic Trends. America Becoming: Racial Trends and Their Consequences, Volume 1. Ed. Neil Smelser, William Wilson, and Faith Mitchell. Washington D.C.: National Academy Press.
Sauer, C. 1963. The Morphology of Landscape. Ed. John Leighly. Los Angeles: University of California Press.
185
Smith, M. 1998. A Historical Guide to the U.S. Government. London: Oxford University Press. Sommers, L. 1991. “Inventing Latinismo: The creation of “Hispanic” panethnicity in the United States.” The Journal of American Folklore 104 (411): 32-53. Thilmany, D. 2003. Exploring trend and interdependence for the agricultural workforce and Hispanic population growth in western mountain states. www.migration.ucdavis.edu/cf. United States Bureau of the Census. 1980. Census of Population, Volume 1, Chapter C:
General Social and Economic Characteristics. −−−. 1990. Summary Tape Files 1 and 3. www.census.gov. −−−. 2000. Summary Tape Files 1 and 3. www.census.gov. −−−. n.d. www.census.gov. United States Department of the Interior. 1964. The Story of the Columbia Basin Irrigation Project. Washington, D.C. Washington State Arts Commission. n.d. Folk Arts Project: Gritos del Alma. www.arts.wa.gov. Weinberg, D. 1995. Measuring Poverty: Issues and Approaches. United States Bureau of the Census, Washington D.C. Williams, A. and Suzanne Ortega. 1990. “Dimensions of Ethnic Assimilation: An
Empirical Appraisal of Gordon’s Typology.” Social Science Quarterly 71 (4): 697-710.
Wong, D. 1996. “Enhancing Segregation Studies Using GIS.” Computers, Environment, and Urban Systems 20 (2): 99-109. −−−. 2002. “Modeling Local Segregation: A Spatial Interaction Approach.”
Geographical and Environmental Modeling 6 (1): 81-97. Wu, X. and Daniel Sui. 2002. “GIS-Based Lacunarity Analysis for Assessing Urban Residential Segregation.” Proceedings of the 22nd Annual ESRI User Conference. www.GIS.ESRI.com.

186
APPENDICES
187
APPENDIX A
GIS DATA AND ATTRIBUTES
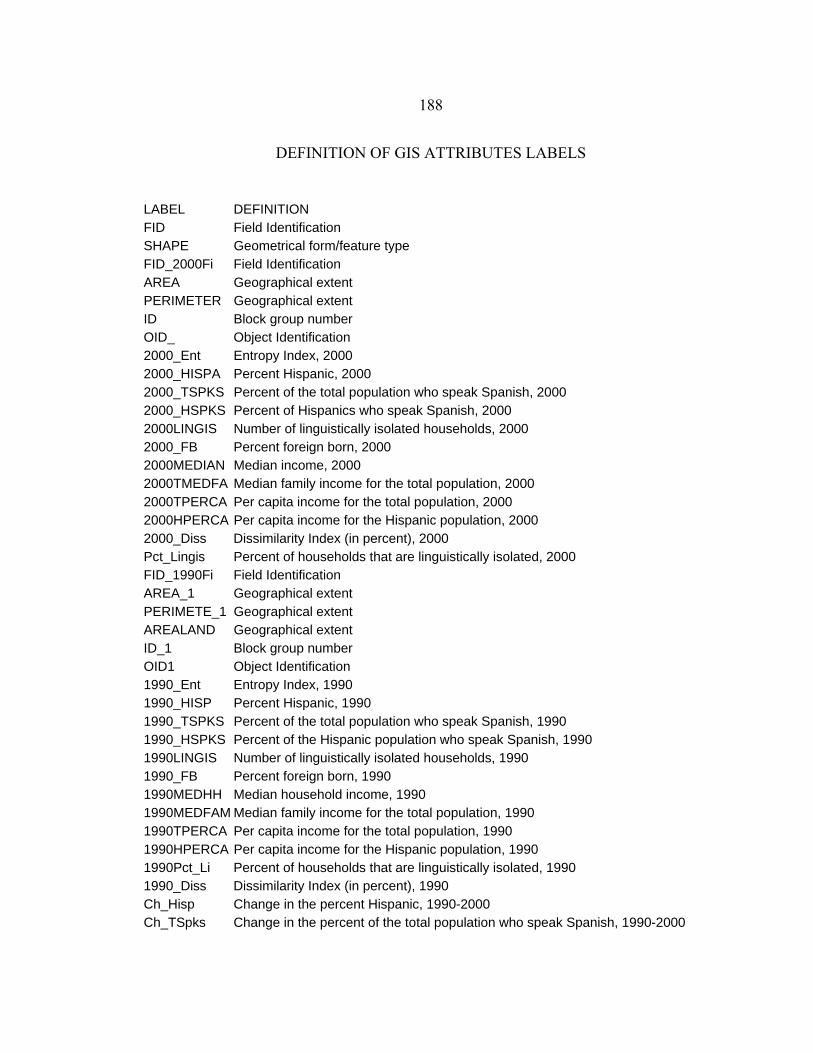
188
DEFINITION OF GIS ATTRIBUTES LABELS
LABEL DEFINITION FID Field Identification SHAPE Geometrical form/feature type FID_2000Fi Field Identification AREA Geographical extent PERIMETER Geographical extent ID Block group number OID_ Object Identification 2000_Ent Entropy Index, 2000 2000_HISPA Percent Hispanic, 2000 2000_TSPKS Percent of the total population who speak Spanish, 2000 2000_HSPKS Percent of Hispanics who speak Spanish, 2000 2000LINGIS Number of linguistically isolated households, 2000 2000_FB Percent foreign born, 2000 2000MEDIAN Median income, 2000 2000TMEDFA Median family income for the total population, 2000 2000TPERCA Per capita income for the total population, 2000 2000HPERCA Per capita income for the Hispanic population, 2000 2000_Diss Dissimilarity Index (in percent), 2000 Pct_Lingis Percent of households that are linguistically isolated, 2000 FID_1990Fi Field Identification AREA_1 Geographical extent PERIMETE_1 Geographical extent AREALAND Geographical extent ID_1 Block group number OID1 Object Identification 1990_Ent Entropy Index, 1990 1990_HISP Percent Hispanic, 1990 1990_TSPKS Percent of the total population who speak Spanish, 1990 1990_HSPKS Percent of the Hispanic population who speak Spanish, 1990 1990LINGIS Number of linguistically isolated households, 1990 1990_FB Percent foreign born, 1990 1990MEDHH Median household income, 1990 1990MEDFAM Median family income for the total population, 1990 1990TPERCA Per capita income for the total population, 1990 1990HPERCA Per capita income for the Hispanic population, 1990 1990Pct_Li Percent of households that are linguistically isolated, 1990 1990_Diss Dissimilarity Index (in percent), 1990 Ch_Hisp Change in the percent Hispanic, 1990-2000 Ch_TSpks Change in the percent of the total population who speak Spanish, 1990-2000
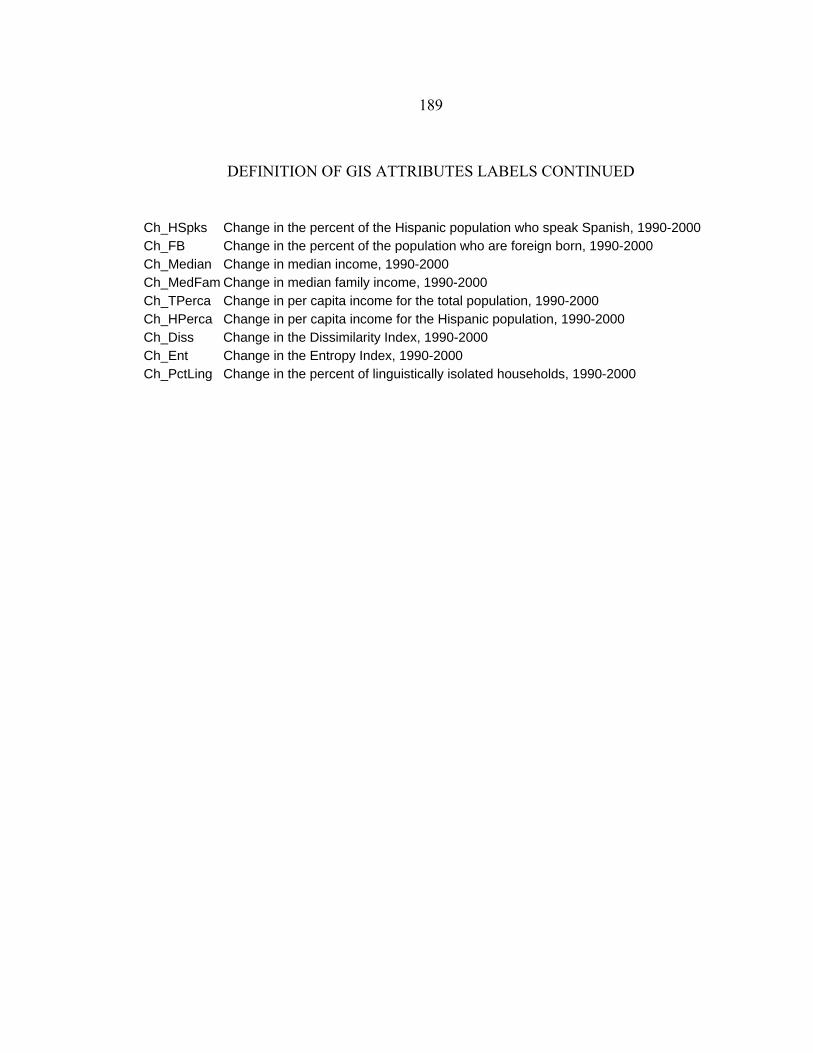
189
DEFINITION OF GIS ATTRIBUTES LABELS CONTINUED
Ch_HSpks Change in the percent of the Hispanic population who speak Spanish, 1990-2000Ch_FB Change in the percent of the population who are foreign born, 1990-2000 Ch_Median Change in median income, 1990-2000 Ch_MedFam Change in median family income, 1990-2000 Ch_TPerca Change in per capita income for the total population, 1990-2000 Ch_HPerca Change in per capita income for the Hispanic population, 1990-2000 Ch_Diss Change in the Dissimilarity Index, 1990-2000 Ch_Ent Change in the Entropy Index, 1990-2000 Ch_PctLing Change in the percent of linguistically isolated households, 1990-2000
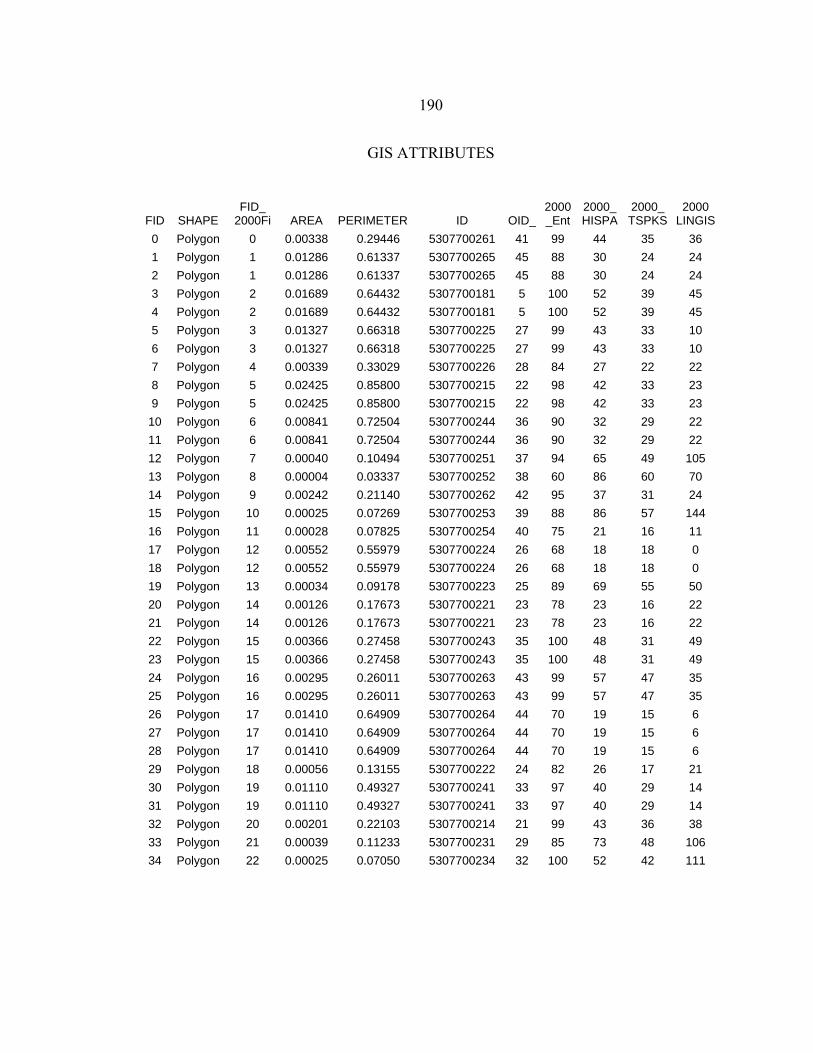
190
GIS ATTRIBUTES
FID SHAPE FID_
2000Fi AREA PERIMETER ID OID_2000_Ent
2000_ HISPA
2000_ TSPKS
2000 LINGIS
0 Polygon 0 0.00338 0.29446 5307700261 41 99 44 35 36 1 Polygon 1 0.01286 0.61337 5307700265 45 88 30 24 24 2 Polygon 1 0.01286 0.61337 5307700265 45 88 30 24 24 3 Polygon 2 0.01689 0.64432 5307700181 5 100 52 39 45 4 Polygon 2 0.01689 0.64432 5307700181 5 100 52 39 45 5 Polygon 3 0.01327 0.66318 5307700225 27 99 43 33 10 6 Polygon 3 0.01327 0.66318 5307700225 27 99 43 33 10 7 Polygon 4 0.00339 0.33029 5307700226 28 84 27 22 22 8 Polygon 5 0.02425 0.85800 5307700215 22 98 42 33 23 9 Polygon 5 0.02425 0.85800 5307700215 22 98 42 33 23
10 Polygon 6 0.00841 0.72504 5307700244 36 90 32 29 22 11 Polygon 6 0.00841 0.72504 5307700244 36 90 32 29 22 12 Polygon 7 0.00040 0.10494 5307700251 37 94 65 49 105 13 Polygon 8 0.00004 0.03337 5307700252 38 60 86 60 70 14 Polygon 9 0.00242 0.21140 5307700262 42 95 37 31 24 15 Polygon 10 0.00025 0.07269 5307700253 39 88 86 57 144 16 Polygon 11 0.00028 0.07825 5307700254 40 75 21 16 11 17 Polygon 12 0.00552 0.55979 5307700224 26 68 18 18 0 18 Polygon 12 0.00552 0.55979 5307700224 26 68 18 18 0 19 Polygon 13 0.00034 0.09178 5307700223 25 89 69 55 50 20 Polygon 14 0.00126 0.17673 5307700221 23 78 23 16 22 21 Polygon 14 0.00126 0.17673 5307700221 23 78 23 16 22 22 Polygon 15 0.00366 0.27458 5307700243 35 100 48 31 49 23 Polygon 15 0.00366 0.27458 5307700243 35 100 48 31 49 24 Polygon 16 0.00295 0.26011 5307700263 43 99 57 47 35 25 Polygon 16 0.00295 0.26011 5307700263 43 99 57 47 35 26 Polygon 17 0.01410 0.64909 5307700264 44 70 19 15 6 27 Polygon 17 0.01410 0.64909 5307700264 44 70 19 15 6 28 Polygon 17 0.01410 0.64909 5307700264 44 70 19 15 6 29 Polygon 18 0.00056 0.13155 5307700222 24 82 26 17 21 30 Polygon 19 0.01110 0.49327 5307700241 33 97 40 29 14 31 Polygon 19 0.01110 0.49327 5307700241 33 97 40 29 14 32 Polygon 20 0.00201 0.22103 5307700214 21 99 43 36 38 33 Polygon 21 0.00039 0.11233 5307700231 29 85 73 48 106 34 Polygon 22 0.00025 0.07050 5307700234 32 100 52 42 111
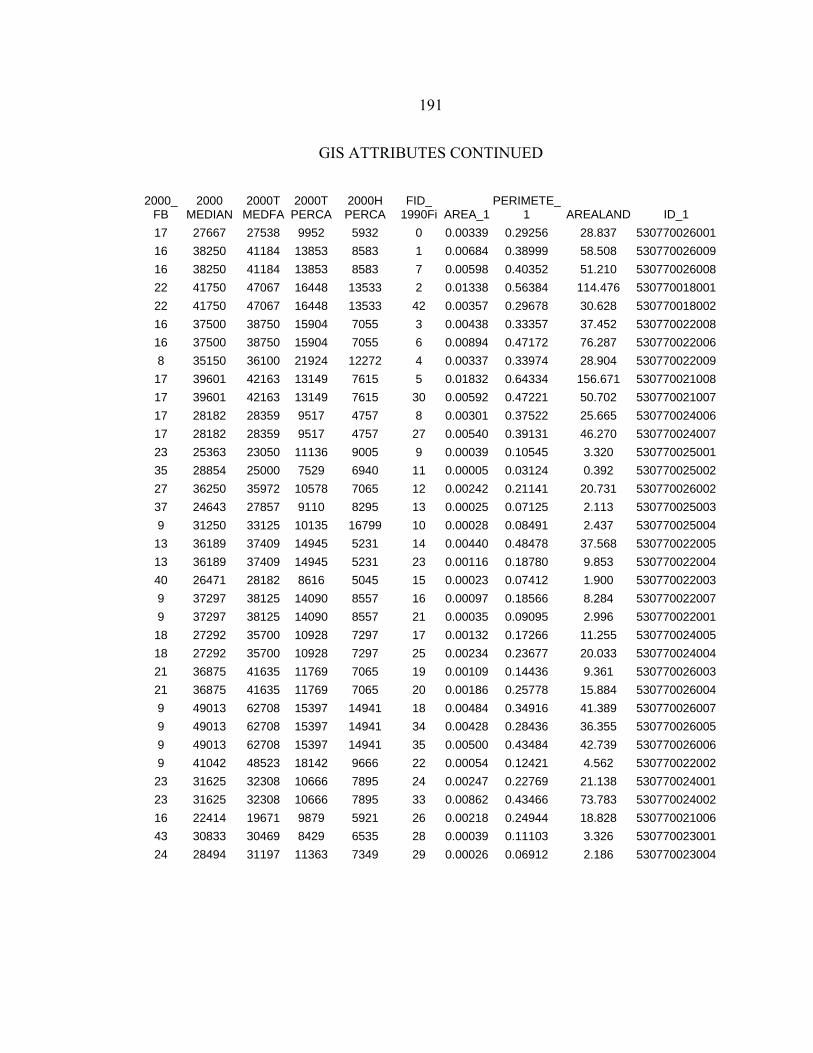
191
GIS ATTRIBUTES CONTINUED
2000_FB
2000 MEDIAN
2000T MEDFA
2000T PERCA
2000H PERCA
FID_ 1990Fi AREA_1
PERIMETE_1 AREALAND ID_1
17 27667 27538 9952 5932 0 0.00339 0.29256 28.837 53077002600116 38250 41184 13853 8583 1 0.00684 0.38999 58.508 53077002600916 38250 41184 13853 8583 7 0.00598 0.40352 51.210 53077002600822 41750 47067 16448 13533 2 0.01338 0.56384 114.476 53077001800122 41750 47067 16448 13533 42 0.00357 0.29678 30.628 53077001800216 37500 38750 15904 7055 3 0.00438 0.33357 37.452 53077002200816 37500 38750 15904 7055 6 0.00894 0.47172 76.287 5307700220068 35150 36100 21924 12272 4 0.00337 0.33974 28.904 530770022009
17 39601 42163 13149 7615 5 0.01832 0.64334 156.671 53077002100817 39601 42163 13149 7615 30 0.00592 0.47221 50.702 53077002100717 28182 28359 9517 4757 8 0.00301 0.37522 25.665 53077002400617 28182 28359 9517 4757 27 0.00540 0.39131 46.270 53077002400723 25363 23050 11136 9005 9 0.00039 0.10545 3.320 53077002500135 28854 25000 7529 6940 11 0.00005 0.03124 0.392 53077002500227 36250 35972 10578 7065 12 0.00242 0.21141 20.731 53077002600237 24643 27857 9110 8295 13 0.00025 0.07125 2.113 5307700250039 31250 33125 10135 16799 10 0.00028 0.08491 2.437 530770025004
13 36189 37409 14945 5231 14 0.00440 0.48478 37.568 53077002200513 36189 37409 14945 5231 23 0.00116 0.18780 9.853 53077002200440 26471 28182 8616 5045 15 0.00023 0.07412 1.900 5307700220039 37297 38125 14090 8557 16 0.00097 0.18566 8.284 5307700220079 37297 38125 14090 8557 21 0.00035 0.09095 2.996 530770022001
18 27292 35700 10928 7297 17 0.00132 0.17266 11.255 53077002400518 27292 35700 10928 7297 25 0.00234 0.23677 20.033 53077002400421 36875 41635 11769 7065 19 0.00109 0.14436 9.361 53077002600321 36875 41635 11769 7065 20 0.00186 0.25778 15.884 5307700260049 49013 62708 15397 14941 18 0.00484 0.34916 41.389 5307700260079 49013 62708 15397 14941 34 0.00428 0.28436 36.355 5307700260059 49013 62708 15397 14941 35 0.00500 0.43484 42.739 5307700260069 41042 48523 18142 9666 22 0.00054 0.12421 4.562 530770022002
23 31625 32308 10666 7895 24 0.00247 0.22769 21.138 53077002400123 31625 32308 10666 7895 33 0.00862 0.43466 73.783 53077002400216 22414 19671 9879 5921 26 0.00218 0.24944 18.828 53077002100643 30833 30469 8429 6535 28 0.00039 0.11103 3.326 53077002300124 28494 31197 11363 7349 29 0.00026 0.06912 2.186 530770023004
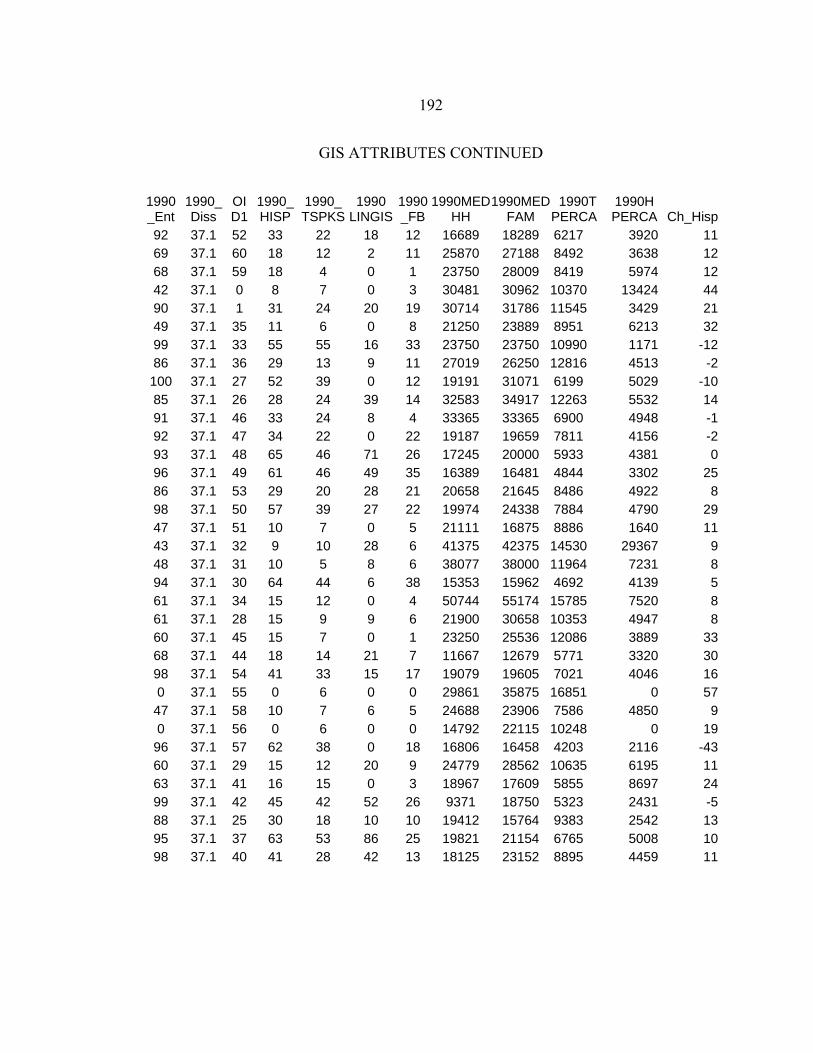
192
GIS ATTRIBUTES CONTINUED
1990_Ent
1990_Diss
OID1
1990_ HISP
1990_ TSPKS
1990 LINGIS
1990_FB
1990MEDHH
1990MEDFAM
1990T PERCA
1990H PERCA Ch_Hisp
92 37.1 52 33 22 18 12 16689 18289 6217 3920 1169 37.1 60 18 12 2 11 25870 27188 8492 3638 1268 37.1 59 18 4 0 1 23750 28009 8419 5974 1242 37.1 0 8 7 0 3 30481 30962 10370 13424 4490 37.1 1 31 24 20 19 30714 31786 11545 3429 2149 37.1 35 11 6 0 8 21250 23889 8951 6213 3299 37.1 33 55 55 16 33 23750 23750 10990 1171 -1286 37.1 36 29 13 9 11 27019 26250 12816 4513 -2100 37.1 27 52 39 0 12 19191 31071 6199 5029 -1085 37.1 26 28 24 39 14 32583 34917 12263 5532 1491 37.1 46 33 24 8 4 33365 33365 6900 4948 -192 37.1 47 34 22 0 22 19187 19659 7811 4156 -293 37.1 48 65 46 71 26 17245 20000 5933 4381 096 37.1 49 61 46 49 35 16389 16481 4844 3302 2586 37.1 53 29 20 28 21 20658 21645 8486 4922 898 37.1 50 57 39 27 22 19974 24338 7884 4790 2947 37.1 51 10 7 0 5 21111 16875 8886 1640 1143 37.1 32 9 10 28 6 41375 42375 14530 29367 948 37.1 31 10 5 8 6 38077 38000 11964 7231 894 37.1 30 64 44 6 38 15353 15962 4692 4139 561 37.1 34 15 12 0 4 50744 55174 15785 7520 861 37.1 28 15 9 9 6 21900 30658 10353 4947 860 37.1 45 15 7 0 1 23250 25536 12086 3889 3368 37.1 44 18 14 21 7 11667 12679 5771 3320 3098 37.1 54 41 33 15 17 19079 19605 7021 4046 160 37.1 55 0 6 0 0 29861 35875 16851 0 57
47 37.1 58 10 7 6 5 24688 23906 7586 4850 90 37.1 56 0 6 0 0 14792 22115 10248 0 19
96 37.1 57 62 38 0 18 16806 16458 4203 2116 -4360 37.1 29 15 12 20 9 24779 28562 10635 6195 1163 37.1 41 16 15 0 3 18967 17609 5855 8697 2499 37.1 42 45 42 52 26 9371 18750 5323 2431 -588 37.1 25 30 18 10 10 19412 15764 9383 2542 1395 37.1 37 63 53 86 25 19821 21154 6765 5008 1098 37.1 40 41 28 42 13 18125 23152 8895 4459 11
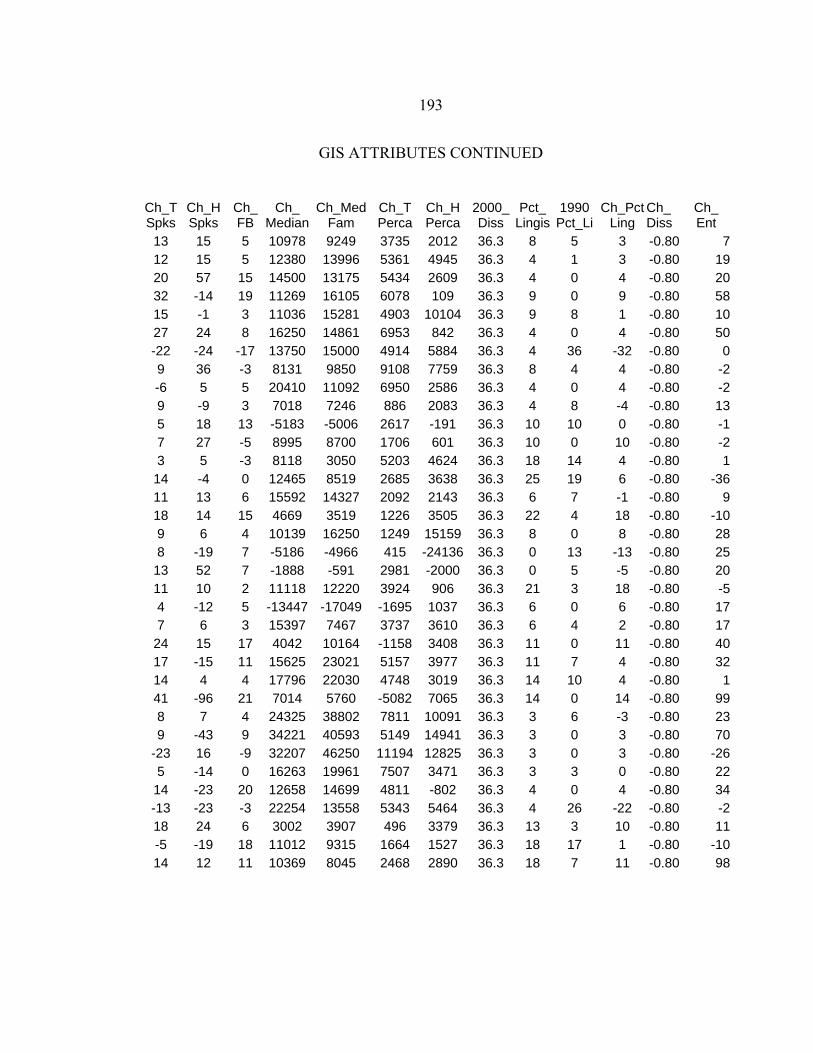
193
GIS ATTRIBUTES CONTINUED
Ch_TSpks
Ch_H Spks
Ch_ FB
Ch_ Median
Ch_Med Fam
Ch_T Perca
Ch_H Perca
2000_Diss
Pct_ Lingis
1990 Pct_Li
Ch_PctLing
Ch_ Diss
Ch_ Ent
13 15 5 10978 9249 3735 2012 36.3 8 5 3 -0.80 712 15 5 12380 13996 5361 4945 36.3 4 1 3 -0.80 1920 57 15 14500 13175 5434 2609 36.3 4 0 4 -0.80 2032 -14 19 11269 16105 6078 109 36.3 9 0 9 -0.80 5815 -1 3 11036 15281 4903 10104 36.3 9 8 1 -0.80 1027 24 8 16250 14861 6953 842 36.3 4 0 4 -0.80 50-22 -24 -17 13750 15000 4914 5884 36.3 4 36 -32 -0.80 09 36 -3 8131 9850 9108 7759 36.3 8 4 4 -0.80 -2-6 5 5 20410 11092 6950 2586 36.3 4 0 4 -0.80 -29 -9 3 7018 7246 886 2083 36.3 4 8 -4 -0.80 135 18 13 -5183 -5006 2617 -191 36.3 10 10 0 -0.80 -17 27 -5 8995 8700 1706 601 36.3 10 0 10 -0.80 -23 5 -3 8118 3050 5203 4624 36.3 18 14 4 -0.80 1
14 -4 0 12465 8519 2685 3638 36.3 25 19 6 -0.80 -3611 13 6 15592 14327 2092 2143 36.3 6 7 -1 -0.80 918 14 15 4669 3519 1226 3505 36.3 22 4 18 -0.80 -109 6 4 10139 16250 1249 15159 36.3 8 0 8 -0.80 288 -19 7 -5186 -4966 415 -24136 36.3 0 13 -13 -0.80 25
13 52 7 -1888 -591 2981 -2000 36.3 0 5 -5 -0.80 2011 10 2 11118 12220 3924 906 36.3 21 3 18 -0.80 -54 -12 5 -13447 -17049 -1695 1037 36.3 6 0 6 -0.80 177 6 3 15397 7467 3737 3610 36.3 6 4 2 -0.80 17
24 15 17 4042 10164 -1158 3408 36.3 11 0 11 -0.80 4017 -15 11 15625 23021 5157 3977 36.3 11 7 4 -0.80 3214 4 4 17796 22030 4748 3019 36.3 14 10 4 -0.80 141 -96 21 7014 5760 -5082 7065 36.3 14 0 14 -0.80 998 7 4 24325 38802 7811 10091 36.3 3 6 -3 -0.80 239 -43 9 34221 40593 5149 14941 36.3 3 0 3 -0.80 70
-23 16 -9 32207 46250 11194 12825 36.3 3 0 3 -0.80 -265 -14 0 16263 19961 7507 3471 36.3 3 3 0 -0.80 22
14 -23 20 12658 14699 4811 -802 36.3 4 0 4 -0.80 34-13 -23 -3 22254 13558 5343 5464 36.3 4 26 -22 -0.80 -218 24 6 3002 3907 496 3379 36.3 13 3 10 -0.80 11-5 -19 18 11012 9315 1664 1527 36.3 18 17 1 -0.80 -1014 12 11 10369 8045 2468 2890 36.3 18 7 11 -0.80 98
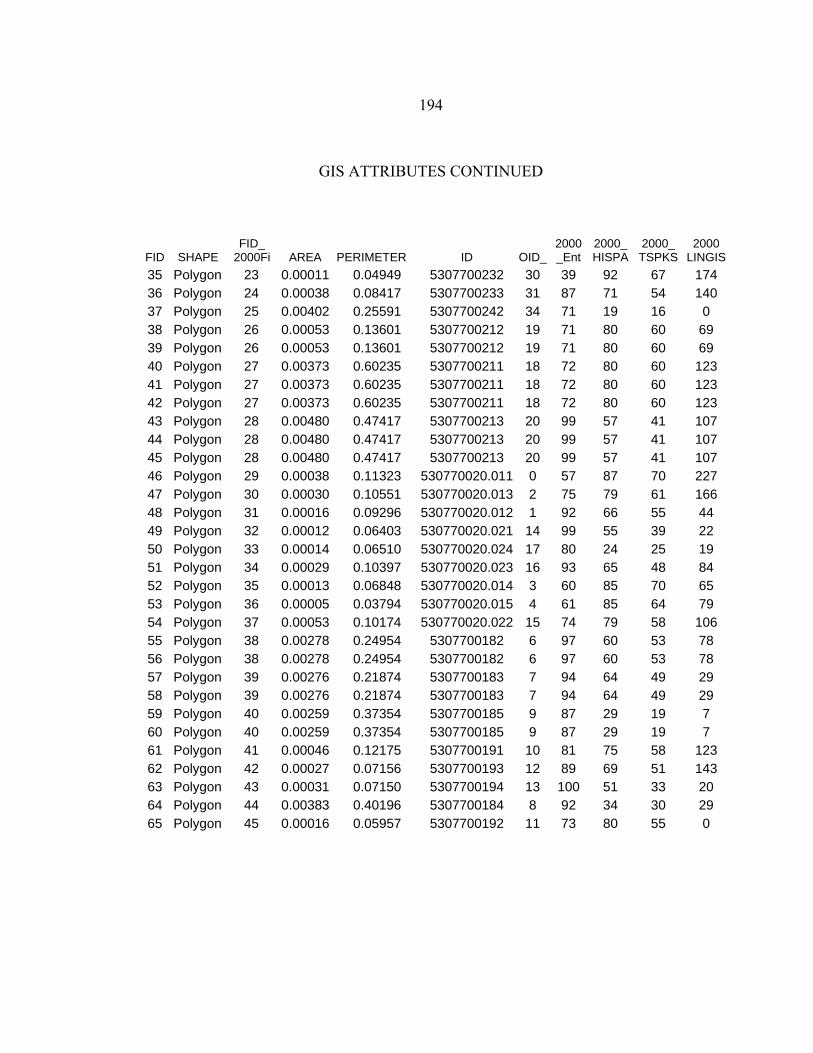
194
GIS ATTRIBUTES CONTINUED
FID SHAPE FID_
2000Fi AREA PERIMETER ID OID_2000_Ent
2000_ HISPA
2000_ TSPKS
2000 LINGIS
35 Polygon 23 0.00011 0.04949 5307700232 30 39 92 67 174 36 Polygon 24 0.00038 0.08417 5307700233 31 87 71 54 140 37 Polygon 25 0.00402 0.25591 5307700242 34 71 19 16 0 38 Polygon 26 0.00053 0.13601 5307700212 19 71 80 60 69 39 Polygon 26 0.00053 0.13601 5307700212 19 71 80 60 69 40 Polygon 27 0.00373 0.60235 5307700211 18 72 80 60 123 41 Polygon 27 0.00373 0.60235 5307700211 18 72 80 60 123 42 Polygon 27 0.00373 0.60235 5307700211 18 72 80 60 123 43 Polygon 28 0.00480 0.47417 5307700213 20 99 57 41 107 44 Polygon 28 0.00480 0.47417 5307700213 20 99 57 41 107 45 Polygon 28 0.00480 0.47417 5307700213 20 99 57 41 107 46 Polygon 29 0.00038 0.11323 530770020.011 0 57 87 70 227 47 Polygon 30 0.00030 0.10551 530770020.013 2 75 79 61 166 48 Polygon 31 0.00016 0.09296 530770020.012 1 92 66 55 44 49 Polygon 32 0.00012 0.06403 530770020.021 14 99 55 39 22 50 Polygon 33 0.00014 0.06510 530770020.024 17 80 24 25 19 51 Polygon 34 0.00029 0.10397 530770020.023 16 93 65 48 84 52 Polygon 35 0.00013 0.06848 530770020.014 3 60 85 70 65 53 Polygon 36 0.00005 0.03794 530770020.015 4 61 85 64 79 54 Polygon 37 0.00053 0.10174 530770020.022 15 74 79 58 106 55 Polygon 38 0.00278 0.24954 5307700182 6 97 60 53 78 56 Polygon 38 0.00278 0.24954 5307700182 6 97 60 53 78 57 Polygon 39 0.00276 0.21874 5307700183 7 94 64 49 29 58 Polygon 39 0.00276 0.21874 5307700183 7 94 64 49 29 59 Polygon 40 0.00259 0.37354 5307700185 9 87 29 19 7 60 Polygon 40 0.00259 0.37354 5307700185 9 87 29 19 7 61 Polygon 41 0.00046 0.12175 5307700191 10 81 75 58 123 62 Polygon 42 0.00027 0.07156 5307700193 12 89 69 51 143 63 Polygon 43 0.00031 0.07150 5307700194 13 100 51 33 20 64 Polygon 44 0.00383 0.40196 5307700184 8 92 34 30 29 65 Polygon 45 0.00016 0.05957 5307700192 11 73 80 55 0
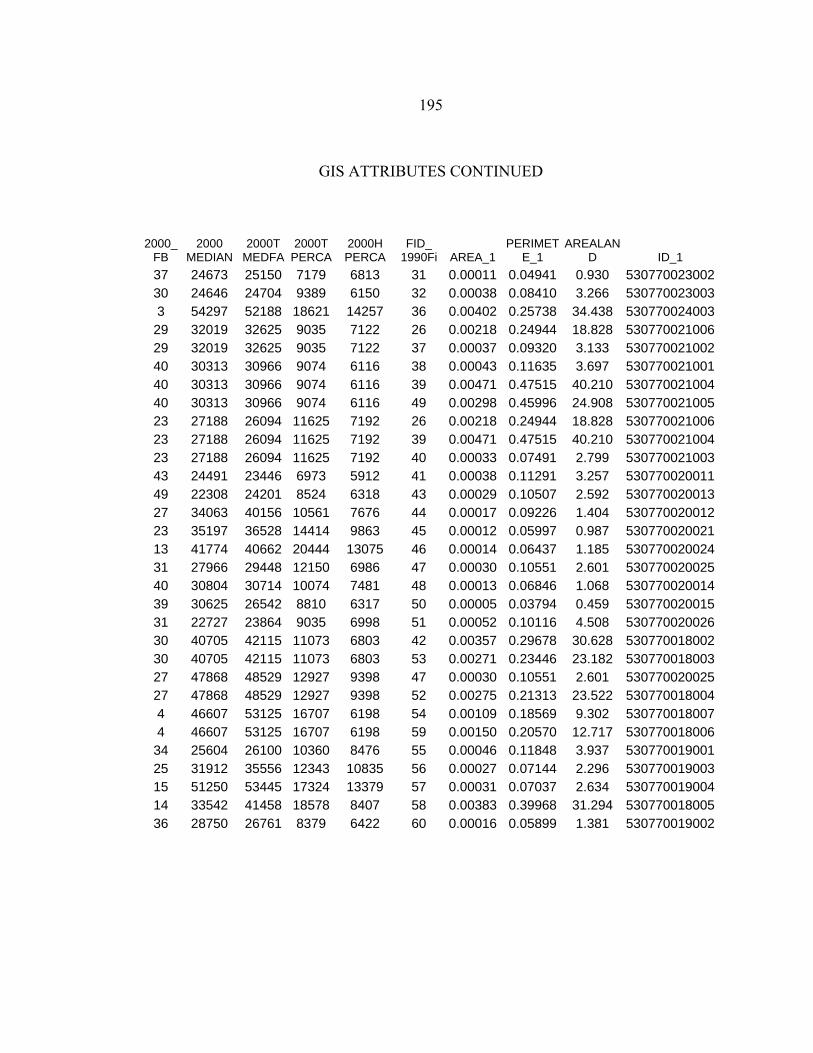
195
GIS ATTRIBUTES CONTINUED
2000_FB
2000 MEDIAN
2000T MEDFA
2000T PERCA
2000H PERCA
FID_ 1990Fi AREA_1
PERIMETE_1
AREALAND ID_1
37 24673 25150 7179 6813 31 0.00011 0.04941 0.930 53077002300230 24646 24704 9389 6150 32 0.00038 0.08410 3.266 5307700230033 54297 52188 18621 14257 36 0.00402 0.25738 34.438 530770024003
29 32019 32625 9035 7122 26 0.00218 0.24944 18.828 53077002100629 32019 32625 9035 7122 37 0.00037 0.09320 3.133 53077002100240 30313 30966 9074 6116 38 0.00043 0.11635 3.697 53077002100140 30313 30966 9074 6116 39 0.00471 0.47515 40.210 53077002100440 30313 30966 9074 6116 49 0.00298 0.45996 24.908 53077002100523 27188 26094 11625 7192 26 0.00218 0.24944 18.828 53077002100623 27188 26094 11625 7192 39 0.00471 0.47515 40.210 53077002100423 27188 26094 11625 7192 40 0.00033 0.07491 2.799 53077002100343 24491 23446 6973 5912 41 0.00038 0.11291 3.257 53077002001149 22308 24201 8524 6318 43 0.00029 0.10507 2.592 53077002001327 34063 40156 10561 7676 44 0.00017 0.09226 1.404 53077002001223 35197 36528 14414 9863 45 0.00012 0.05997 0.987 53077002002113 41774 40662 20444 13075 46 0.00014 0.06437 1.185 53077002002431 27966 29448 12150 6986 47 0.00030 0.10551 2.601 53077002002540 30804 30714 10074 7481 48 0.00013 0.06846 1.068 53077002001439 30625 26542 8810 6317 50 0.00005 0.03794 0.459 53077002001531 22727 23864 9035 6998 51 0.00052 0.10116 4.508 53077002002630 40705 42115 11073 6803 42 0.00357 0.29678 30.628 53077001800230 40705 42115 11073 6803 53 0.00271 0.23446 23.182 53077001800327 47868 48529 12927 9398 47 0.00030 0.10551 2.601 53077002002527 47868 48529 12927 9398 52 0.00275 0.21313 23.522 5307700180044 46607 53125 16707 6198 54 0.00109 0.18569 9.302 5307700180074 46607 53125 16707 6198 59 0.00150 0.20570 12.717 530770018006
34 25604 26100 10360 8476 55 0.00046 0.11848 3.937 53077001900125 31912 35556 12343 10835 56 0.00027 0.07144 2.296 53077001900315 51250 53445 17324 13379 57 0.00031 0.07037 2.634 53077001900414 33542 41458 18578 8407 58 0.00383 0.39968 31.294 53077001800536 28750 26761 8379 6422 60 0.00016 0.05899 1.381 530770019002
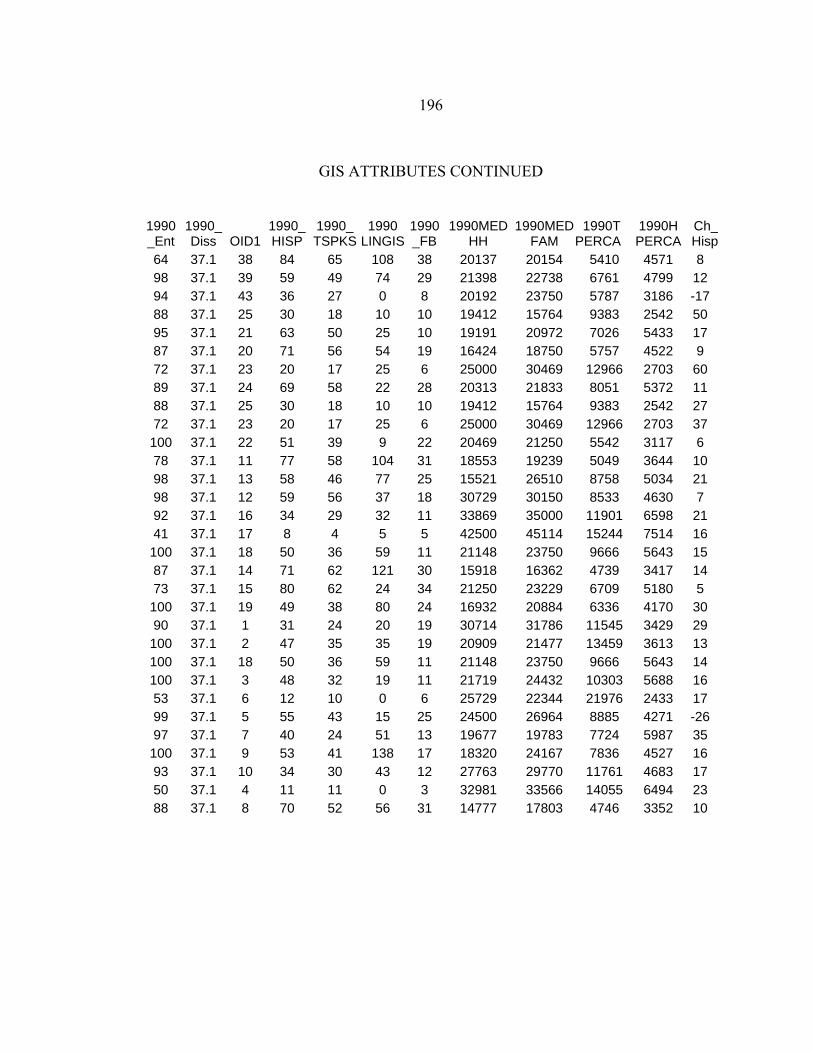
196
GIS ATTRIBUTES CONTINUED
1990_Ent
1990_Diss OID1
1990_ HISP
1990_ TSPKS
1990 LINGIS
1990_FB
1990MED HH
1990MED FAM
1990T PERCA
1990H PERCA
Ch_Hisp
64 37.1 38 84 65 108 38 20137 20154 5410 4571 8 98 37.1 39 59 49 74 29 21398 22738 6761 4799 12 94 37.1 43 36 27 0 8 20192 23750 5787 3186 -17 88 37.1 25 30 18 10 10 19412 15764 9383 2542 50 95 37.1 21 63 50 25 10 19191 20972 7026 5433 17 87 37.1 20 71 56 54 19 16424 18750 5757 4522 9 72 37.1 23 20 17 25 6 25000 30469 12966 2703 60 89 37.1 24 69 58 22 28 20313 21833 8051 5372 11 88 37.1 25 30 18 10 10 19412 15764 9383 2542 27 72 37.1 23 20 17 25 6 25000 30469 12966 2703 37 100 37.1 22 51 39 9 22 20469 21250 5542 3117 6 78 37.1 11 77 58 104 31 18553 19239 5049 3644 10 98 37.1 13 58 46 77 25 15521 26510 8758 5034 21 98 37.1 12 59 56 37 18 30729 30150 8533 4630 7 92 37.1 16 34 29 32 11 33869 35000 11901 6598 21 41 37.1 17 8 4 5 5 42500 45114 15244 7514 16 100 37.1 18 50 36 59 11 21148 23750 9666 5643 15 87 37.1 14 71 62 121 30 15918 16362 4739 3417 14 73 37.1 15 80 62 24 34 21250 23229 6709 5180 5 100 37.1 19 49 38 80 24 16932 20884 6336 4170 30 90 37.1 1 31 24 20 19 30714 31786 11545 3429 29 100 37.1 2 47 35 35 19 20909 21477 13459 3613 13 100 37.1 18 50 36 59 11 21148 23750 9666 5643 14 100 37.1 3 48 32 19 11 21719 24432 10303 5688 16 53 37.1 6 12 10 0 6 25729 22344 21976 2433 17 99 37.1 5 55 43 15 25 24500 26964 8885 4271 -26 97 37.1 7 40 24 51 13 19677 19783 7724 5987 35 100 37.1 9 53 41 138 17 18320 24167 7836 4527 16 93 37.1 10 34 30 43 12 27763 29770 11761 4683 17 50 37.1 4 11 11 0 3 32981 33566 14055 6494 23 88 37.1 8 70 52 56 31 14777 17803 4746 3352 10
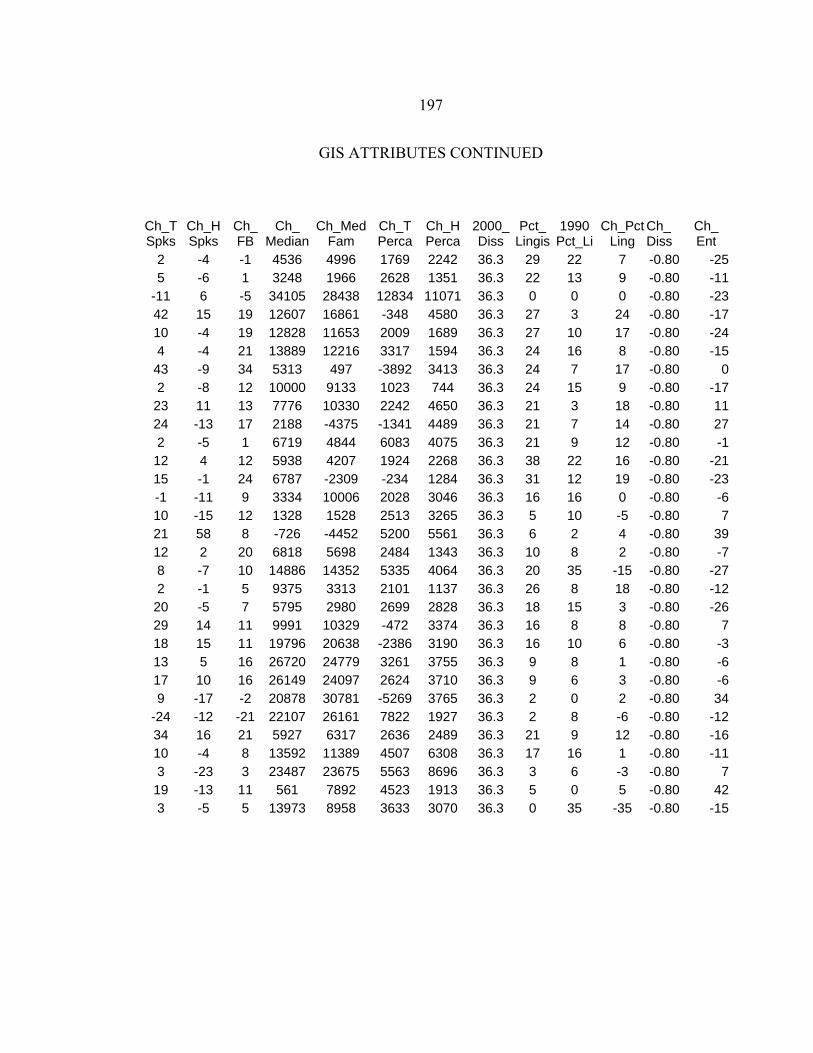
197
GIS ATTRIBUTES CONTINUED
Ch_TSpks
Ch_H Spks
Ch_ FB
Ch_ Median
Ch_Med Fam
Ch_T Perca
Ch_H Perca
2000_Diss
Pct_ Lingis
1990 Pct_Li
Ch_PctLing
Ch_ Diss
Ch_ Ent
2 -4 -1 4536 4996 1769 2242 36.3 29 22 7 -0.80 -255 -6 1 3248 1966 2628 1351 36.3 22 13 9 -0.80 -11
-11 6 -5 34105 28438 12834 11071 36.3 0 0 0 -0.80 -2342 15 19 12607 16861 -348 4580 36.3 27 3 24 -0.80 -1710 -4 19 12828 11653 2009 1689 36.3 27 10 17 -0.80 -244 -4 21 13889 12216 3317 1594 36.3 24 16 8 -0.80 -15
43 -9 34 5313 497 -3892 3413 36.3 24 7 17 -0.80 02 -8 12 10000 9133 1023 744 36.3 24 15 9 -0.80 -17
23 11 13 7776 10330 2242 4650 36.3 21 3 18 -0.80 1124 -13 17 2188 -4375 -1341 4489 36.3 21 7 14 -0.80 272 -5 1 6719 4844 6083 4075 36.3 21 9 12 -0.80 -1
12 4 12 5938 4207 1924 2268 36.3 38 22 16 -0.80 -2115 -1 24 6787 -2309 -234 1284 36.3 31 12 19 -0.80 -23-1 -11 9 3334 10006 2028 3046 36.3 16 16 0 -0.80 -610 -15 12 1328 1528 2513 3265 36.3 5 10 -5 -0.80 721 58 8 -726 -4452 5200 5561 36.3 6 2 4 -0.80 3912 2 20 6818 5698 2484 1343 36.3 10 8 2 -0.80 -78 -7 10 14886 14352 5335 4064 36.3 20 35 -15 -0.80 -272 -1 5 9375 3313 2101 1137 36.3 26 8 18 -0.80 -12
20 -5 7 5795 2980 2699 2828 36.3 18 15 3 -0.80 -2629 14 11 9991 10329 -472 3374 36.3 16 8 8 -0.80 718 15 11 19796 20638 -2386 3190 36.3 16 10 6 -0.80 -313 5 16 26720 24779 3261 3755 36.3 9 8 1 -0.80 -617 10 16 26149 24097 2624 3710 36.3 9 6 3 -0.80 -69 -17 -2 20878 30781 -5269 3765 36.3 2 0 2 -0.80 34
-24 -12 -21 22107 26161 7822 1927 36.3 2 8 -6 -0.80 -1234 16 21 5927 6317 2636 2489 36.3 21 9 12 -0.80 -1610 -4 8 13592 11389 4507 6308 36.3 17 16 1 -0.80 -113 -23 3 23487 23675 5563 8696 36.3 3 6 -3 -0.80 7
19 -13 11 561 7892 4523 1913 36.3 5 0 5 -0.80 423 -5 5 13973 8958 3633 3070 36.3 0 35 -35 -0.80 -15
198
APPENDIX B
CALCULATIONS OF RESIDENTIAL SEGREGATION AND
THE ENTROPY INDEX
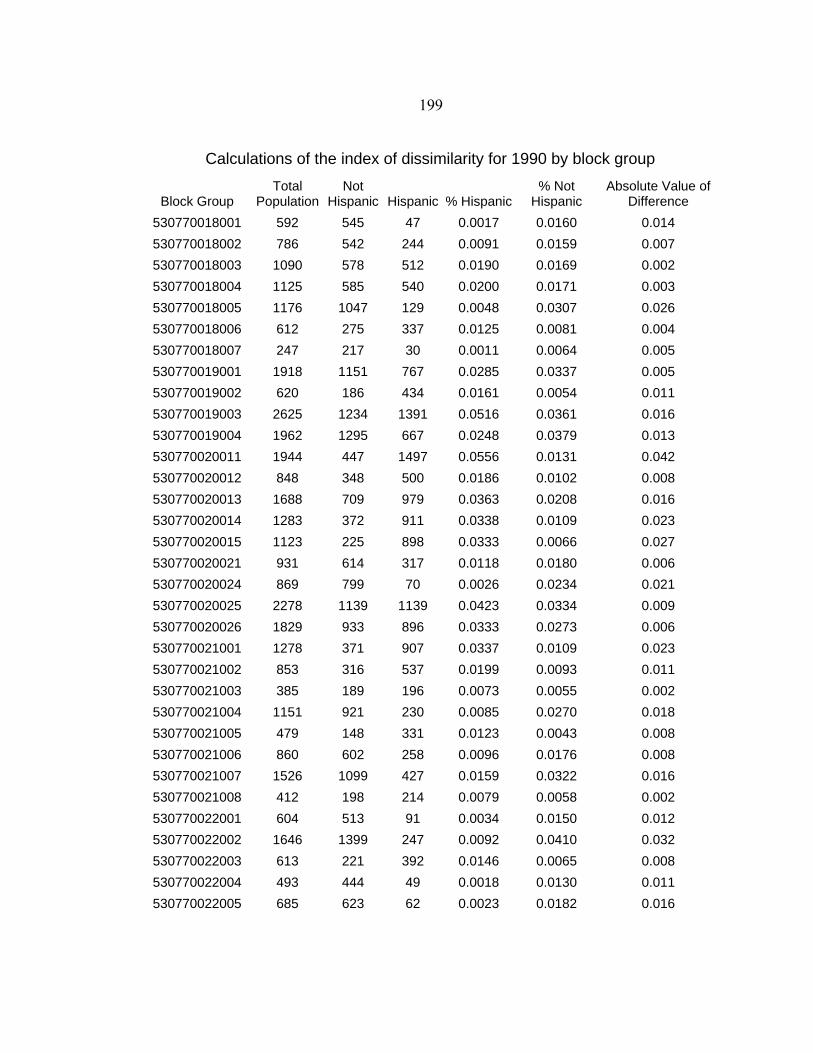
199
Calculations of the index of dissimilarity for 1990 by block group
Block Group Total
Population Not
Hispanic Hispanic % Hispanic% Not
Hispanic Absolute Value of
Difference 530770018001 592 545 47 0.0017 0.0160 0.014 530770018002 786 542 244 0.0091 0.0159 0.007 530770018003 1090 578 512 0.0190 0.0169 0.002 530770018004 1125 585 540 0.0200 0.0171 0.003 530770018005 1176 1047 129 0.0048 0.0307 0.026 530770018006 612 275 337 0.0125 0.0081 0.004 530770018007 247 217 30 0.0011 0.0064 0.005 530770019001 1918 1151 767 0.0285 0.0337 0.005 530770019002 620 186 434 0.0161 0.0054 0.011 530770019003 2625 1234 1391 0.0516 0.0361 0.016 530770019004 1962 1295 667 0.0248 0.0379 0.013 530770020011 1944 447 1497 0.0556 0.0131 0.042 530770020012 848 348 500 0.0186 0.0102 0.008 530770020013 1688 709 979 0.0363 0.0208 0.016 530770020014 1283 372 911 0.0338 0.0109 0.023 530770020015 1123 225 898 0.0333 0.0066 0.027 530770020021 931 614 317 0.0118 0.0180 0.006 530770020024 869 799 70 0.0026 0.0234 0.021 530770020025 2278 1139 1139 0.0423 0.0334 0.009 530770020026 1829 933 896 0.0333 0.0273 0.006 530770021001 1278 371 907 0.0337 0.0109 0.023 530770021002 853 316 537 0.0199 0.0093 0.011 530770021003 385 189 196 0.0073 0.0055 0.002 530770021004 1151 921 230 0.0085 0.0270 0.018 530770021005 479 148 331 0.0123 0.0043 0.008 530770021006 860 602 258 0.0096 0.0176 0.008 530770021007 1526 1099 427 0.0159 0.0322 0.016 530770021008 412 198 214 0.0079 0.0058 0.002 530770022001 604 513 91 0.0034 0.0150 0.012 530770022002 1646 1399 247 0.0092 0.0410 0.032 530770022003 613 221 392 0.0146 0.0065 0.008 530770022004 493 444 49 0.0018 0.0130 0.011 530770022005 685 623 62 0.0023 0.0182 0.016
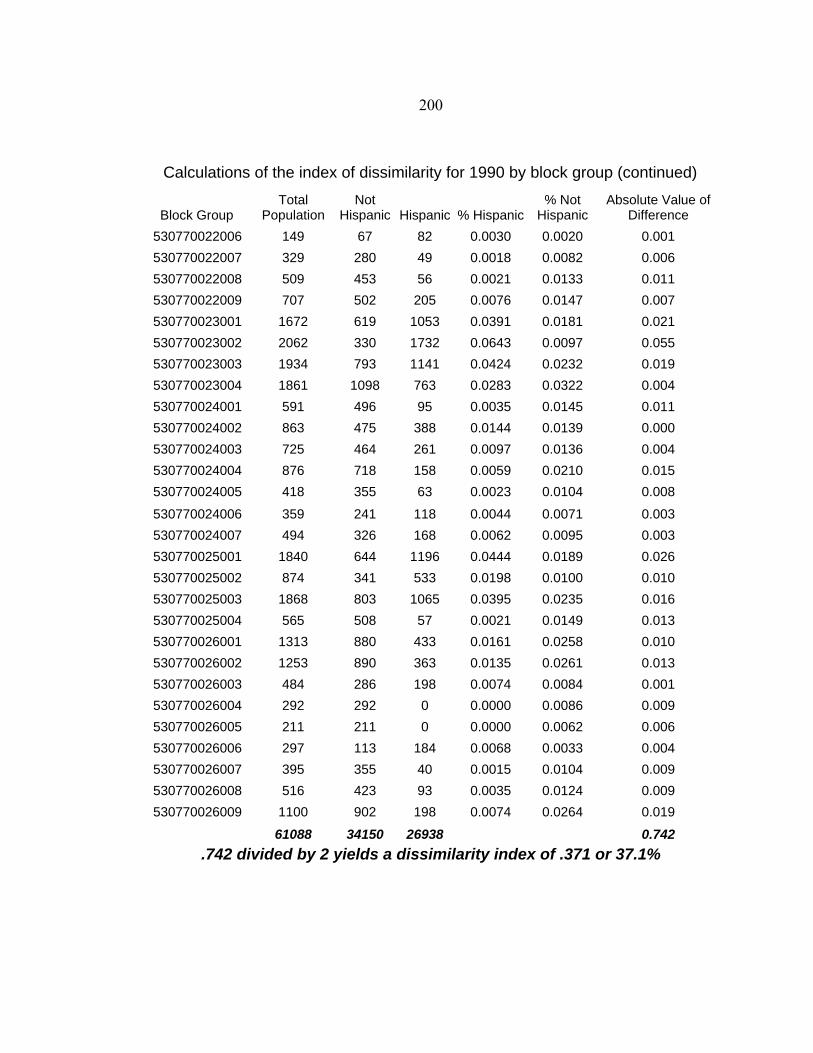
200
Calculations of the index of dissimilarity for 1990 by block group (continued)
Block Group Total
Population Not
Hispanic Hispanic % Hispanic% Not
Hispanic Absolute Value of
Difference 530770022006 149 67 82 0.0030 0.0020 0.001 530770022007 329 280 49 0.0018 0.0082 0.006 530770022008 509 453 56 0.0021 0.0133 0.011 530770022009 707 502 205 0.0076 0.0147 0.007 530770023001 1672 619 1053 0.0391 0.0181 0.021 530770023002 2062 330 1732 0.0643 0.0097 0.055 530770023003 1934 793 1141 0.0424 0.0232 0.019 530770023004 1861 1098 763 0.0283 0.0322 0.004 530770024001 591 496 95 0.0035 0.0145 0.011 530770024002 863 475 388 0.0144 0.0139 0.000 530770024003 725 464 261 0.0097 0.0136 0.004 530770024004 876 718 158 0.0059 0.0210 0.015 530770024005 418 355 63 0.0023 0.0104 0.008
530770024006 359 241 118 0.0044 0.0071 0.003 530770024007 494 326 168 0.0062 0.0095 0.003 530770025001 1840 644 1196 0.0444 0.0189 0.026 530770025002 874 341 533 0.0198 0.0100 0.010 530770025003 1868 803 1065 0.0395 0.0235 0.016 530770025004 565 508 57 0.0021 0.0149 0.013 530770026001 1313 880 433 0.0161 0.0258 0.010 530770026002 1253 890 363 0.0135 0.0261 0.013 530770026003 484 286 198 0.0074 0.0084 0.001 530770026004 292 292 0 0.0000 0.0086 0.009 530770026005 211 211 0 0.0000 0.0062 0.006 530770026006 297 113 184 0.0068 0.0033 0.004 530770026007 395 355 40 0.0015 0.0104 0.009 530770026008 516 423 93 0.0035 0.0124 0.009 530770026009 1100 902 198 0.0074 0.0264 0.019
61088 34150 26938 0.742 .742 divided by 2 yields a dissimilarity index of .371 or 37.1%
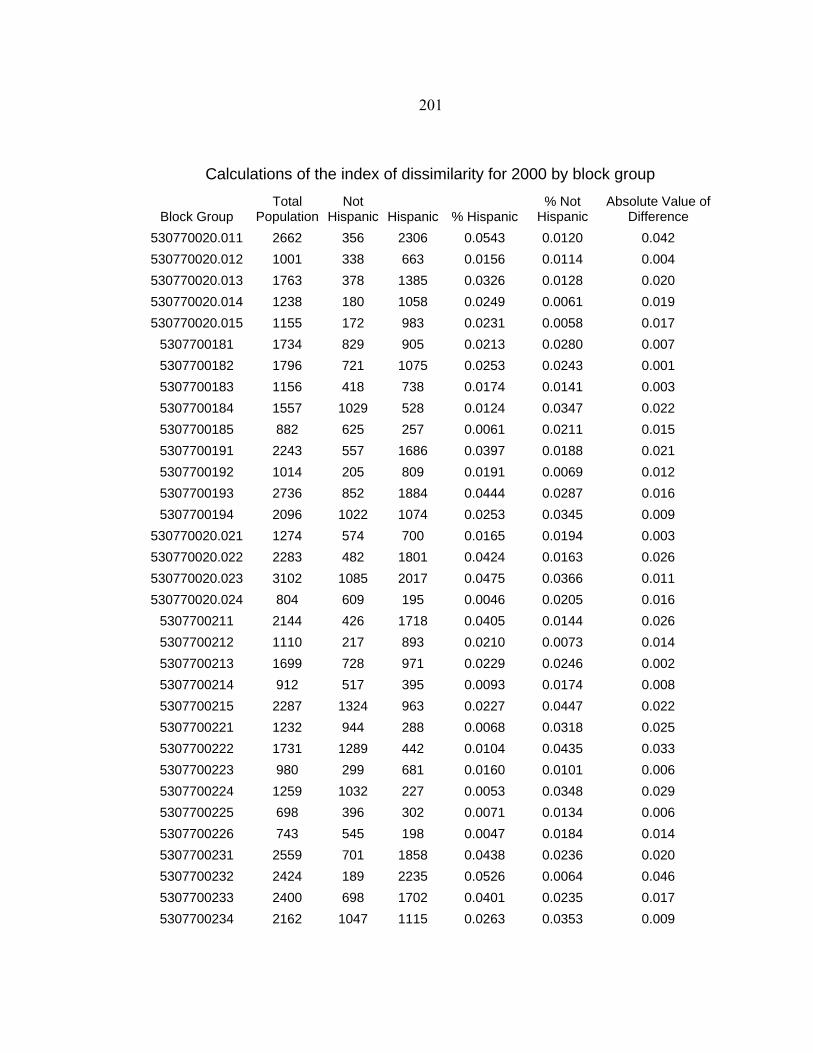
201
Calculations of the index of dissimilarity for 2000 by block group
Block Group Total
Population Not
Hispanic Hispanic % Hispanic % Not
Hispanic Absolute Value of
Difference 530770020.011 2662 356 2306 0.0543 0.0120 0.042 530770020.012 1001 338 663 0.0156 0.0114 0.004 530770020.013 1763 378 1385 0.0326 0.0128 0.020 530770020.014 1238 180 1058 0.0249 0.0061 0.019 530770020.015 1155 172 983 0.0231 0.0058 0.017
5307700181 1734 829 905 0.0213 0.0280 0.007 5307700182 1796 721 1075 0.0253 0.0243 0.001 5307700183 1156 418 738 0.0174 0.0141 0.003 5307700184 1557 1029 528 0.0124 0.0347 0.022 5307700185 882 625 257 0.0061 0.0211 0.015 5307700191 2243 557 1686 0.0397 0.0188 0.021 5307700192 1014 205 809 0.0191 0.0069 0.012 5307700193 2736 852 1884 0.0444 0.0287 0.016 5307700194 2096 1022 1074 0.0253 0.0345 0.009
530770020.021 1274 574 700 0.0165 0.0194 0.003 530770020.022 2283 482 1801 0.0424 0.0163 0.026 530770020.023 3102 1085 2017 0.0475 0.0366 0.011 530770020.024 804 609 195 0.0046 0.0205 0.016
5307700211 2144 426 1718 0.0405 0.0144 0.026 5307700212 1110 217 893 0.0210 0.0073 0.014 5307700213 1699 728 971 0.0229 0.0246 0.002 5307700214 912 517 395 0.0093 0.0174 0.008 5307700215 2287 1324 963 0.0227 0.0447 0.022 5307700221 1232 944 288 0.0068 0.0318 0.025 5307700222 1731 1289 442 0.0104 0.0435 0.033 5307700223 980 299 681 0.0160 0.0101 0.006 5307700224 1259 1032 227 0.0053 0.0348 0.029 5307700225 698 396 302 0.0071 0.0134 0.006 5307700226 743 545 198 0.0047 0.0184 0.014 5307700231 2559 701 1858 0.0438 0.0236 0.020 5307700232 2424 189 2235 0.0526 0.0064 0.046 5307700233 2400 698 1702 0.0401 0.0235 0.017 5307700234 2162 1047 1115 0.0263 0.0353 0.009
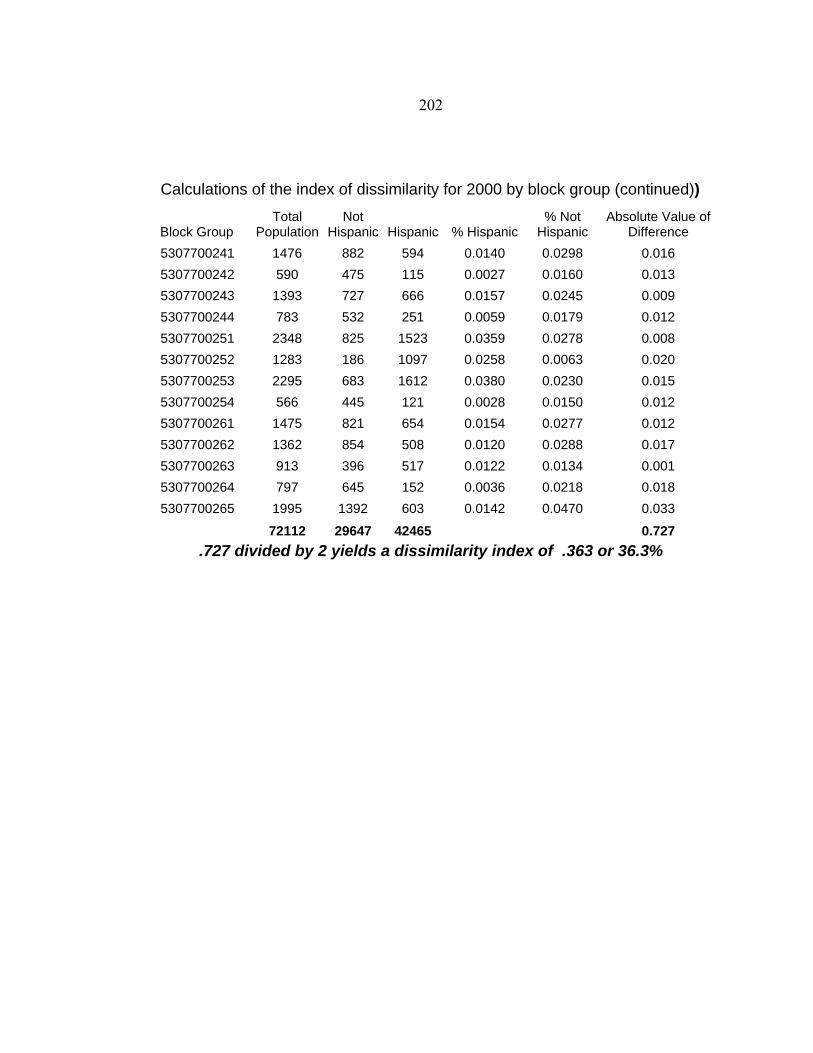
202
Calculations of the index of dissimilarity for 2000 by block group (continued))
Block Group Total
Population Not
Hispanic Hispanic % Hispanic % Not
Hispanic Absolute Value of
Difference 5307700241 1476 882 594 0.0140 0.0298 0.016 5307700242 590 475 115 0.0027 0.0160 0.013 5307700243 1393 727 666 0.0157 0.0245 0.009 5307700244 783 532 251 0.0059 0.0179 0.012 5307700251 2348 825 1523 0.0359 0.0278 0.008 5307700252 1283 186 1097 0.0258 0.0063 0.020 5307700253 2295 683 1612 0.0380 0.0230 0.015 5307700254 566 445 121 0.0028 0.0150 0.012 5307700261 1475 821 654 0.0154 0.0277 0.012 5307700262 1362 854 508 0.0120 0.0288 0.017 5307700263 913 396 517 0.0122 0.0134 0.001 5307700264 797 645 152 0.0036 0.0218 0.018 5307700265 1995 1392 603 0.0142 0.0470 0.033
72112 29647 42465 0.727 .727 divided by 2 yields a dissimilarity index of .363 or 36.3%
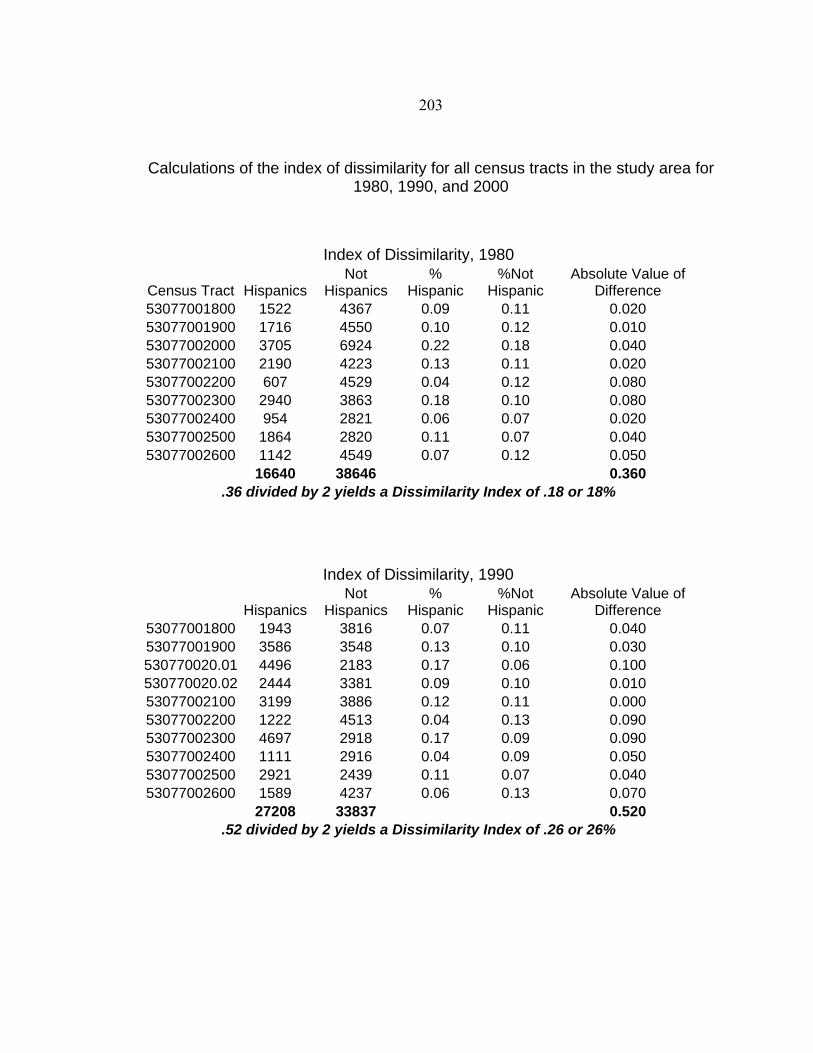
203
Calculations of the index of dissimilarity for all census tracts in the study area for
1980, 1990, and 2000
Index of Dissimilarity, 1980
Census Tract Hispanics Not
Hispanics %
Hispanic%Not
Hispanic Absolute Value of
Difference 53077001800 1522 4367 0.09 0.11 0.020 53077001900 1716 4550 0.10 0.12 0.010 53077002000 3705 6924 0.22 0.18 0.040 53077002100 2190 4223 0.13 0.11 0.020 53077002200 607 4529 0.04 0.12 0.080 53077002300 2940 3863 0.18 0.10 0.080 53077002400 954 2821 0.06 0.07 0.020 53077002500 1864 2820 0.11 0.07 0.040 53077002600 1142 4549 0.07 0.12 0.050
16640 38646 0.360 .36 divided by 2 yields a Dissimilarity Index of .18 or 18%
Index of Dissimilarity, 1990
Hispanics Not
Hispanics %
Hispanic%Not
Hispanic Absolute Value of
Difference 53077001800 1943 3816 0.07 0.11 0.040 53077001900 3586 3548 0.13 0.10 0.030 530770020.01 4496 2183 0.17 0.06 0.100 530770020.02 2444 3381 0.09 0.10 0.010 53077002100 3199 3886 0.12 0.11 0.000 53077002200 1222 4513 0.04 0.13 0.090 53077002300 4697 2918 0.17 0.09 0.090 53077002400 1111 2916 0.04 0.09 0.050 53077002500 2921 2439 0.11 0.07 0.040 53077002600 1589 4237 0.06 0.13 0.070
27208 33837 0.520 .52 divided by 2 yields a Dissimilarity Index of .26 or 26%
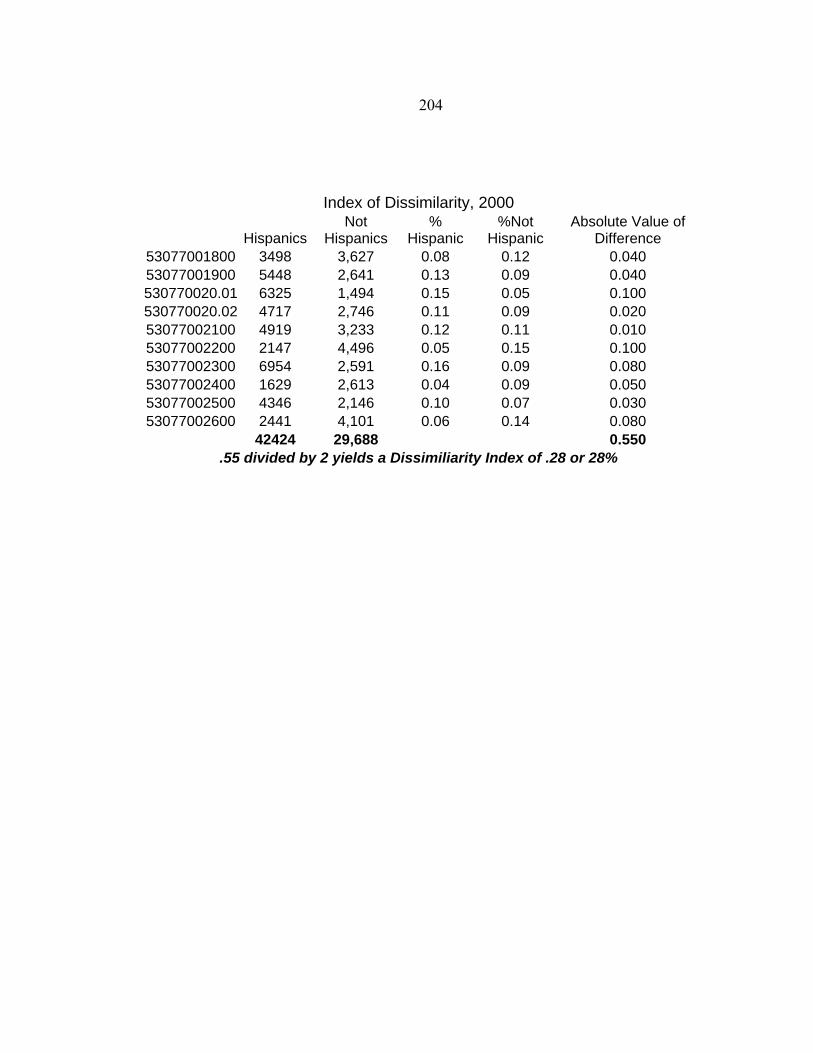
204
Index of Dissimilarity, 2000
Hispanics Not
Hispanics %
Hispanic%Not
Hispanic Absolute Value of
Difference 53077001800 3498 3,627 0.08 0.12 0.040 53077001900 5448 2,641 0.13 0.09 0.040 530770020.01 6325 1,494 0.15 0.05 0.100 530770020.02 4717 2,746 0.11 0.09 0.020 53077002100 4919 3,233 0.12 0.11 0.010 53077002200 2147 4,496 0.05 0.15 0.100 53077002300 6954 2,591 0.16 0.09 0.080 53077002400 1629 2,613 0.04 0.09 0.050 53077002500 4346 2,146 0.10 0.07 0.030 53077002600 2441 4,101 0.06 0.14 0.080
42424 29,688 0.550 .55 divided by 2 yields a Dissimiliarity Index of .28 or 28%
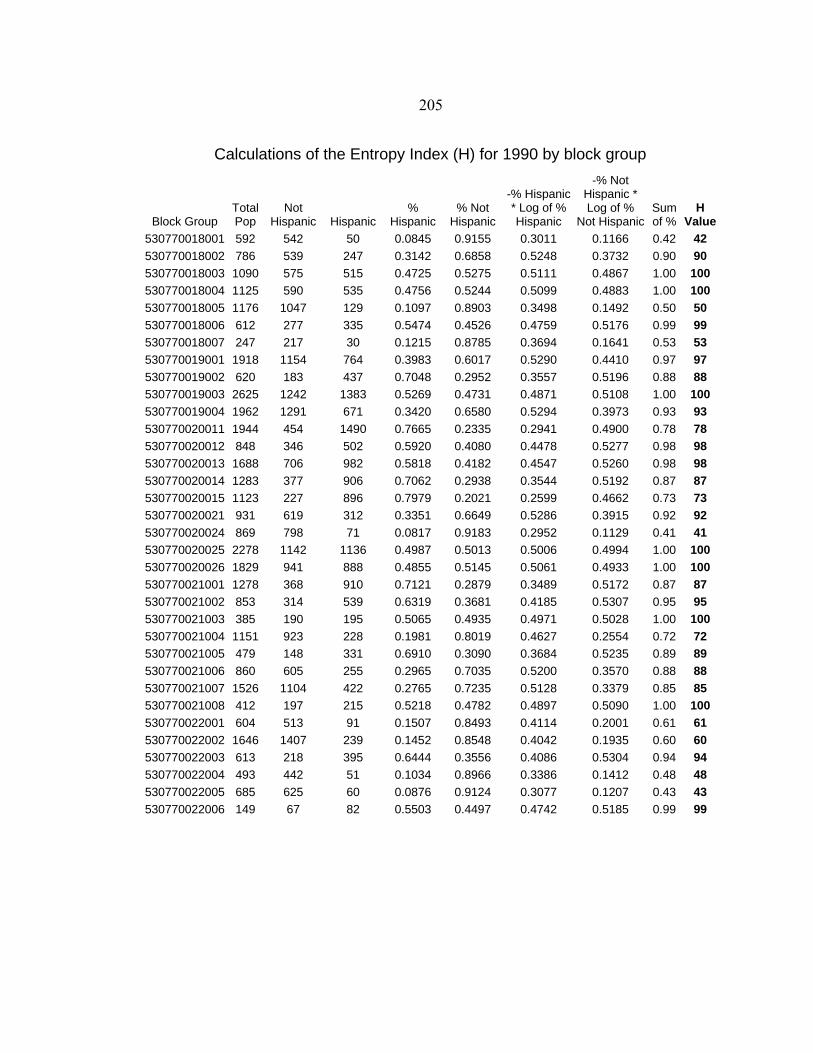
205
Calculations of the Entropy Index (H) for 1990 by block group
Block Group Total Pop
Not Hispanic Hispanic
% Hispanic
% Not Hispanic
-% Hispanic * Log of % Hispanic
-% Not Hispanic * Log of %
Not Hispanic Sum of %
H Value
530770018001 592 542 50 0.0845 0.9155 0.3011 0.1166 0.42 42 530770018002 786 539 247 0.3142 0.6858 0.5248 0.3732 0.90 90 530770018003 1090 575 515 0.4725 0.5275 0.5111 0.4867 1.00 100 530770018004 1125 590 535 0.4756 0.5244 0.5099 0.4883 1.00 100 530770018005 1176 1047 129 0.1097 0.8903 0.3498 0.1492 0.50 50 530770018006 612 277 335 0.5474 0.4526 0.4759 0.5176 0.99 99 530770018007 247 217 30 0.1215 0.8785 0.3694 0.1641 0.53 53 530770019001 1918 1154 764 0.3983 0.6017 0.5290 0.4410 0.97 97 530770019002 620 183 437 0.7048 0.2952 0.3557 0.5196 0.88 88 530770019003 2625 1242 1383 0.5269 0.4731 0.4871 0.5108 1.00 100 530770019004 1962 1291 671 0.3420 0.6580 0.5294 0.3973 0.93 93 530770020011 1944 454 1490 0.7665 0.2335 0.2941 0.4900 0.78 78 530770020012 848 346 502 0.5920 0.4080 0.4478 0.5277 0.98 98 530770020013 1688 706 982 0.5818 0.4182 0.4547 0.5260 0.98 98 530770020014 1283 377 906 0.7062 0.2938 0.3544 0.5192 0.87 87 530770020015 1123 227 896 0.7979 0.2021 0.2599 0.4662 0.73 73 530770020021 931 619 312 0.3351 0.6649 0.5286 0.3915 0.92 92 530770020024 869 798 71 0.0817 0.9183 0.2952 0.1129 0.41 41 530770020025 2278 1142 1136 0.4987 0.5013 0.5006 0.4994 1.00 100 530770020026 1829 941 888 0.4855 0.5145 0.5061 0.4933 1.00 100 530770021001 1278 368 910 0.7121 0.2879 0.3489 0.5172 0.87 87 530770021002 853 314 539 0.6319 0.3681 0.4185 0.5307 0.95 95 530770021003 385 190 195 0.5065 0.4935 0.4971 0.5028 1.00 100 530770021004 1151 923 228 0.1981 0.8019 0.4627 0.2554 0.72 72 530770021005 479 148 331 0.6910 0.3090 0.3684 0.5235 0.89 89 530770021006 860 605 255 0.2965 0.7035 0.5200 0.3570 0.88 88 530770021007 1526 1104 422 0.2765 0.7235 0.5128 0.3379 0.85 85 530770021008 412 197 215 0.5218 0.4782 0.4897 0.5090 1.00 100 530770022001 604 513 91 0.1507 0.8493 0.4114 0.2001 0.61 61 530770022002 1646 1407 239 0.1452 0.8548 0.4042 0.1935 0.60 60 530770022003 613 218 395 0.6444 0.3556 0.4086 0.5304 0.94 94 530770022004 493 442 51 0.1034 0.8966 0.3386 0.1412 0.48 48 530770022005 685 625 60 0.0876 0.9124 0.3077 0.1207 0.43 43 530770022006 149 67 82 0.5503 0.4497 0.4742 0.5185 0.99 99
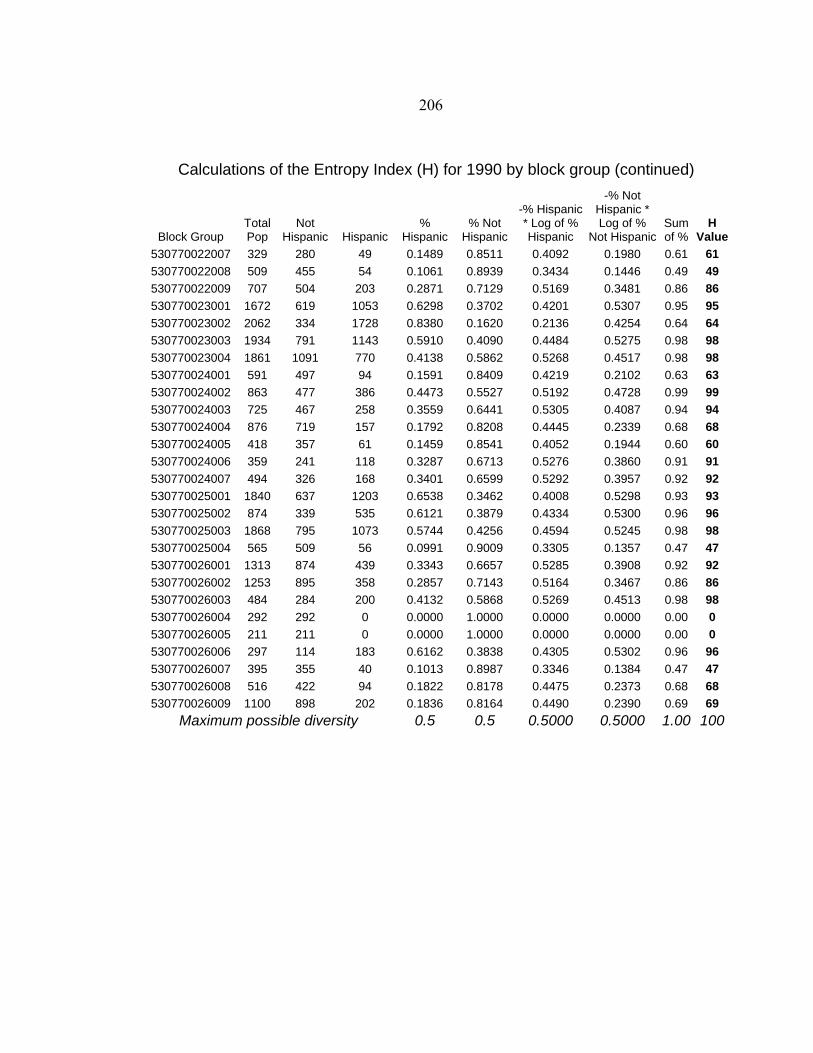
206
Calculations of the Entropy Index (H) for 1990 by block group (continued)
Block Group Total Pop
Not Hispanic Hispanic
% Hispanic
% Not Hispanic
-% Hispanic * Log of % Hispanic
-% Not Hispanic * Log of %
Not HispanicSum of %
H Value
530770022007 329 280 49 0.1489 0.8511 0.4092 0.1980 0.61 61 530770022008 509 455 54 0.1061 0.8939 0.3434 0.1446 0.49 49 530770022009 707 504 203 0.2871 0.7129 0.5169 0.3481 0.86 86 530770023001 1672 619 1053 0.6298 0.3702 0.4201 0.5307 0.95 95 530770023002 2062 334 1728 0.8380 0.1620 0.2136 0.4254 0.64 64 530770023003 1934 791 1143 0.5910 0.4090 0.4484 0.5275 0.98 98 530770023004 1861 1091 770 0.4138 0.5862 0.5268 0.4517 0.98 98 530770024001 591 497 94 0.1591 0.8409 0.4219 0.2102 0.63 63 530770024002 863 477 386 0.4473 0.5527 0.5192 0.4728 0.99 99 530770024003 725 467 258 0.3559 0.6441 0.5305 0.4087 0.94 94 530770024004 876 719 157 0.1792 0.8208 0.4445 0.2339 0.68 68 530770024005 418 357 61 0.1459 0.8541 0.4052 0.1944 0.60 60 530770024006 359 241 118 0.3287 0.6713 0.5276 0.3860 0.91 91 530770024007 494 326 168 0.3401 0.6599 0.5292 0.3957 0.92 92 530770025001 1840 637 1203 0.6538 0.3462 0.4008 0.5298 0.93 93 530770025002 874 339 535 0.6121 0.3879 0.4334 0.5300 0.96 96 530770025003 1868 795 1073 0.5744 0.4256 0.4594 0.5245 0.98 98 530770025004 565 509 56 0.0991 0.9009 0.3305 0.1357 0.47 47 530770026001 1313 874 439 0.3343 0.6657 0.5285 0.3908 0.92 92 530770026002 1253 895 358 0.2857 0.7143 0.5164 0.3467 0.86 86 530770026003 484 284 200 0.4132 0.5868 0.5269 0.4513 0.98 98 530770026004 292 292 0 0.0000 1.0000 0.0000 0.0000 0.00 0 530770026005 211 211 0 0.0000 1.0000 0.0000 0.0000 0.00 0 530770026006 297 114 183 0.6162 0.3838 0.4305 0.5302 0.96 96 530770026007 395 355 40 0.1013 0.8987 0.3346 0.1384 0.47 47 530770026008 516 422 94 0.1822 0.8178 0.4475 0.2373 0.68 68 530770026009 1100 898 202 0.1836 0.8164 0.4490 0.2390 0.69 69
Maximum possible diversity 0.5 0.5 0.5000 0.5000 1.00 100
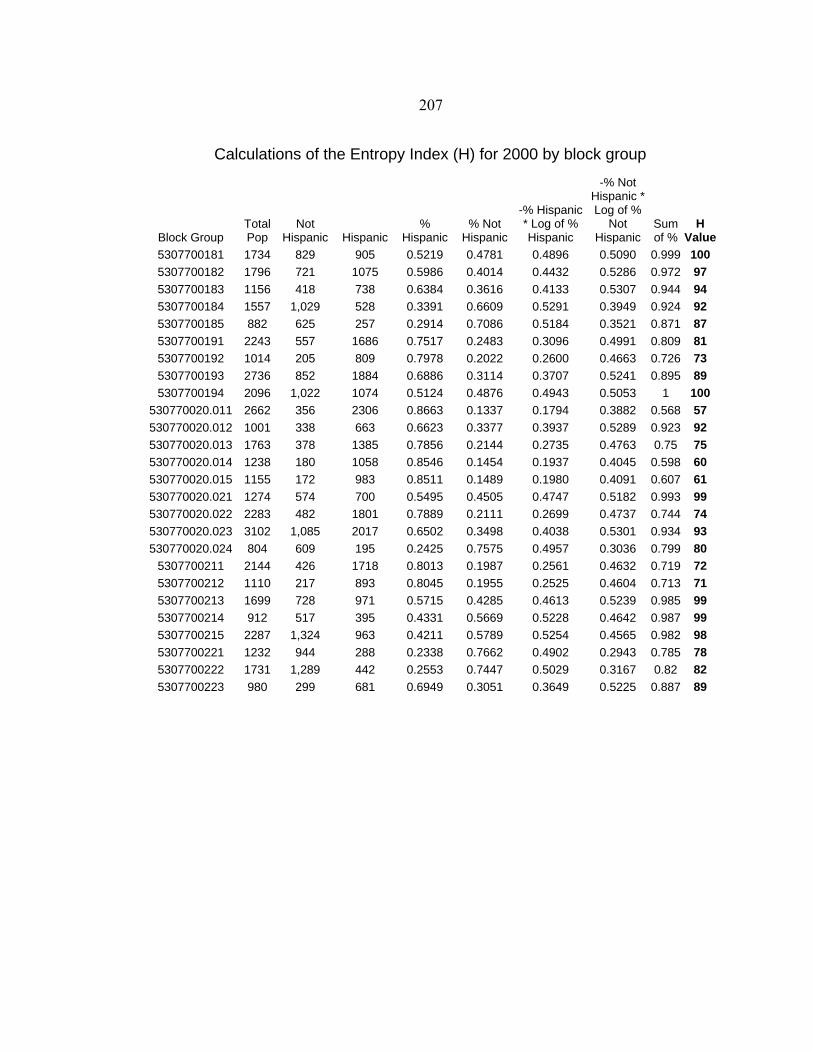
207
Calculations of the Entropy Index (H) for 2000 by block group
Block Group Total Pop
Not Hispanic Hispanic
% Hispanic
% Not Hispanic
-% Hispanic * Log of % Hispanic
-% Not Hispanic * Log of %
Not Hispanic
Sum of %
H Value
5307700181 1734 829 905 0.5219 0.4781 0.4896 0.5090 0.999 100 5307700182 1796 721 1075 0.5986 0.4014 0.4432 0.5286 0.972 97 5307700183 1156 418 738 0.6384 0.3616 0.4133 0.5307 0.944 94 5307700184 1557 1,029 528 0.3391 0.6609 0.5291 0.3949 0.924 92 5307700185 882 625 257 0.2914 0.7086 0.5184 0.3521 0.871 87 5307700191 2243 557 1686 0.7517 0.2483 0.3096 0.4991 0.809 81 5307700192 1014 205 809 0.7978 0.2022 0.2600 0.4663 0.726 73 5307700193 2736 852 1884 0.6886 0.3114 0.3707 0.5241 0.895 89 5307700194 2096 1,022 1074 0.5124 0.4876 0.4943 0.5053 1 100
530770020.011 2662 356 2306 0.8663 0.1337 0.1794 0.3882 0.568 57 530770020.012 1001 338 663 0.6623 0.3377 0.3937 0.5289 0.923 92 530770020.013 1763 378 1385 0.7856 0.2144 0.2735 0.4763 0.75 75 530770020.014 1238 180 1058 0.8546 0.1454 0.1937 0.4045 0.598 60 530770020.015 1155 172 983 0.8511 0.1489 0.1980 0.4091 0.607 61 530770020.021 1274 574 700 0.5495 0.4505 0.4747 0.5182 0.993 99 530770020.022 2283 482 1801 0.7889 0.2111 0.2699 0.4737 0.744 74 530770020.023 3102 1,085 2017 0.6502 0.3498 0.4038 0.5301 0.934 93 530770020.024 804 609 195 0.2425 0.7575 0.4957 0.3036 0.799 80
5307700211 2144 426 1718 0.8013 0.1987 0.2561 0.4632 0.719 72 5307700212 1110 217 893 0.8045 0.1955 0.2525 0.4604 0.713 71 5307700213 1699 728 971 0.5715 0.4285 0.4613 0.5239 0.985 99 5307700214 912 517 395 0.4331 0.5669 0.5228 0.4642 0.987 99 5307700215 2287 1,324 963 0.4211 0.5789 0.5254 0.4565 0.982 98 5307700221 1232 944 288 0.2338 0.7662 0.4902 0.2943 0.785 78 5307700222 1731 1,289 442 0.2553 0.7447 0.5029 0.3167 0.82 82 5307700223 980 299 681 0.6949 0.3051 0.3649 0.5225 0.887 89
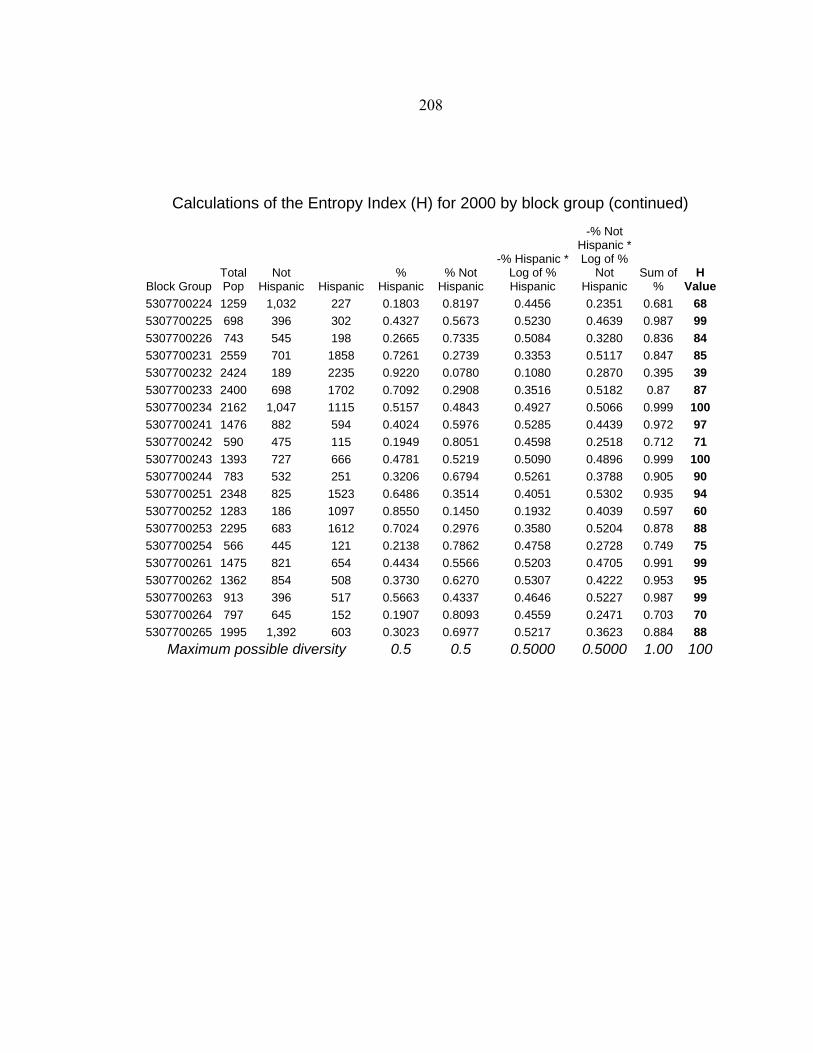
208
Calculations of the Entropy Index (H) for 2000 by block group (continued)
Block Group Total Pop
Not Hispanic Hispanic
% Hispanic
% Not Hispanic
-% Hispanic * Log of % Hispanic
-% Not Hispanic * Log of %
Not Hispanic
Sum of %
H Value
5307700224 1259 1,032 227 0.1803 0.8197 0.4456 0.2351 0.681 68 5307700225 698 396 302 0.4327 0.5673 0.5230 0.4639 0.987 99 5307700226 743 545 198 0.2665 0.7335 0.5084 0.3280 0.836 84 5307700231 2559 701 1858 0.7261 0.2739 0.3353 0.5117 0.847 85 5307700232 2424 189 2235 0.9220 0.0780 0.1080 0.2870 0.395 39 5307700233 2400 698 1702 0.7092 0.2908 0.3516 0.5182 0.87 87 5307700234 2162 1,047 1115 0.5157 0.4843 0.4927 0.5066 0.999 100 5307700241 1476 882 594 0.4024 0.5976 0.5285 0.4439 0.972 97 5307700242 590 475 115 0.1949 0.8051 0.4598 0.2518 0.712 71 5307700243 1393 727 666 0.4781 0.5219 0.5090 0.4896 0.999 100 5307700244 783 532 251 0.3206 0.6794 0.5261 0.3788 0.905 90 5307700251 2348 825 1523 0.6486 0.3514 0.4051 0.5302 0.935 94 5307700252 1283 186 1097 0.8550 0.1450 0.1932 0.4039 0.597 60 5307700253 2295 683 1612 0.7024 0.2976 0.3580 0.5204 0.878 88 5307700254 566 445 121 0.2138 0.7862 0.4758 0.2728 0.749 75 5307700261 1475 821 654 0.4434 0.5566 0.5203 0.4705 0.991 99 5307700262 1362 854 508 0.3730 0.6270 0.5307 0.4222 0.953 95 5307700263 913 396 517 0.5663 0.4337 0.4646 0.5227 0.987 99 5307700264 797 645 152 0.1907 0.8093 0.4559 0.2471 0.703 70 5307700265 1995 1,392 603 0.3023 0.6977 0.5217 0.3623 0.884 88
Maximum possible diversity 0.5 0.5 0.5000 0.5000 1.00 100
209
APPENDIX C
DELINEATION OF THE DOWNTOWN AREA FOR THE TOWNS OF
TOPPENISH, GRANDVIEW, SUNNYSIDE, AND WAPATO
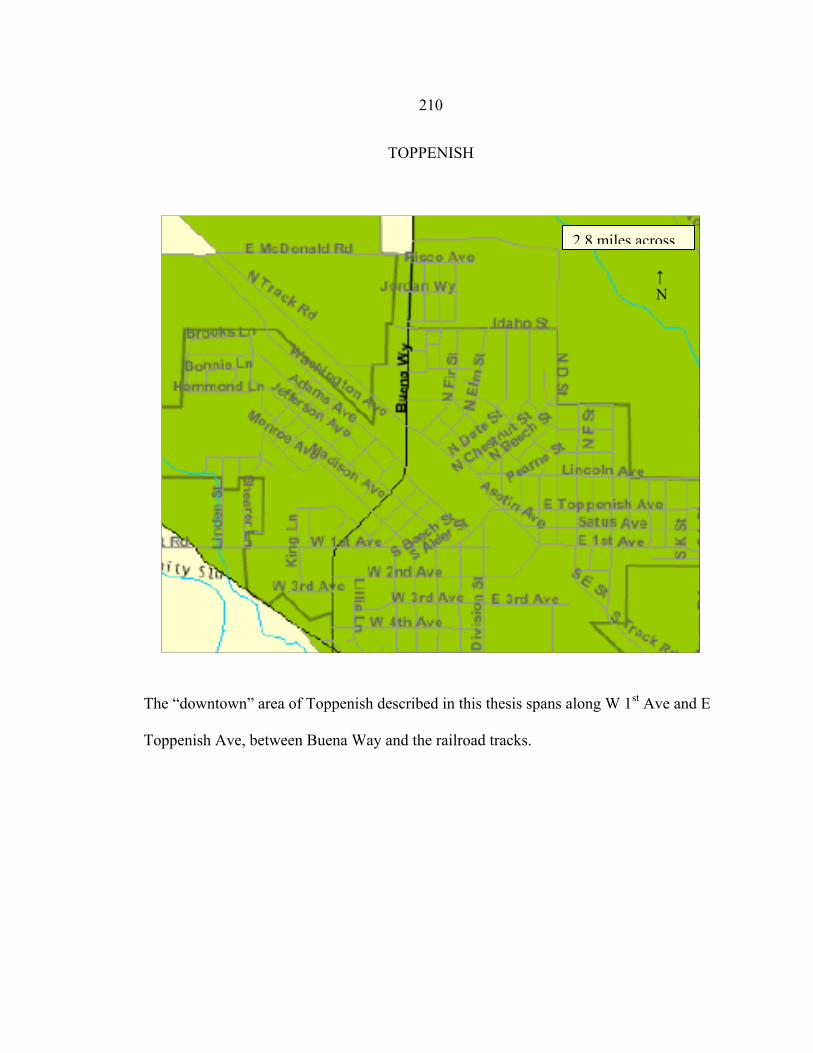
210
TOPPENISH
The “downtown” area of Toppenish described in this thesis spans along W 1st Ave and E
Toppenish Ave, between Buena Way and the railroad tracks.
2.8 miles across
↑N
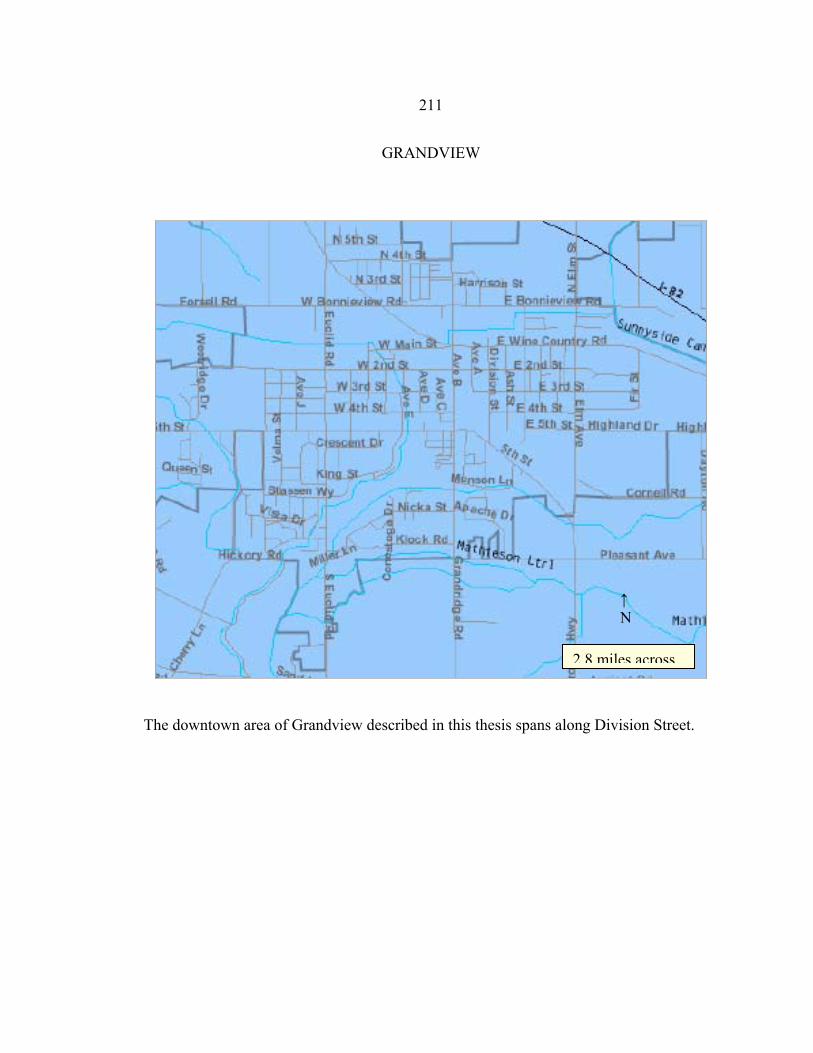
211
GRANDVIEW
The downtown area of Grandview described in this thesis spans along Division Street.
2.8 miles across
↑N
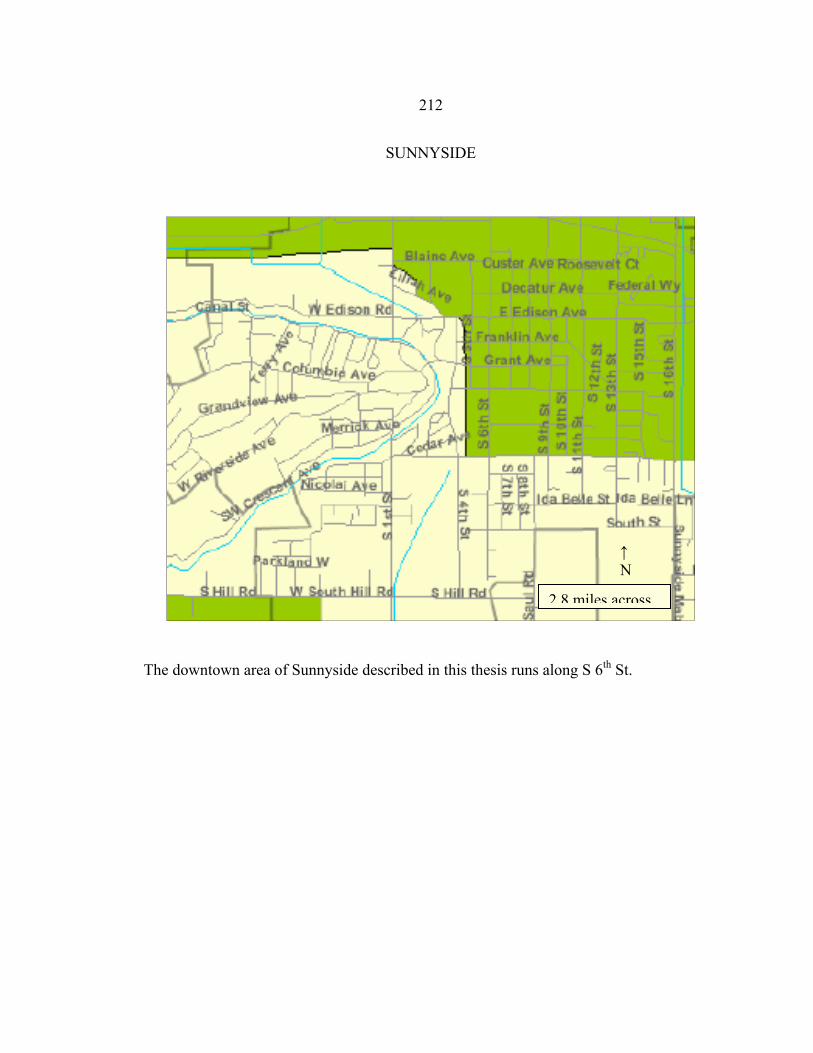
212
SUNNYSIDE
The downtown area of Sunnyside described in this thesis runs along S 6th St.
2.8 miles across
↑N
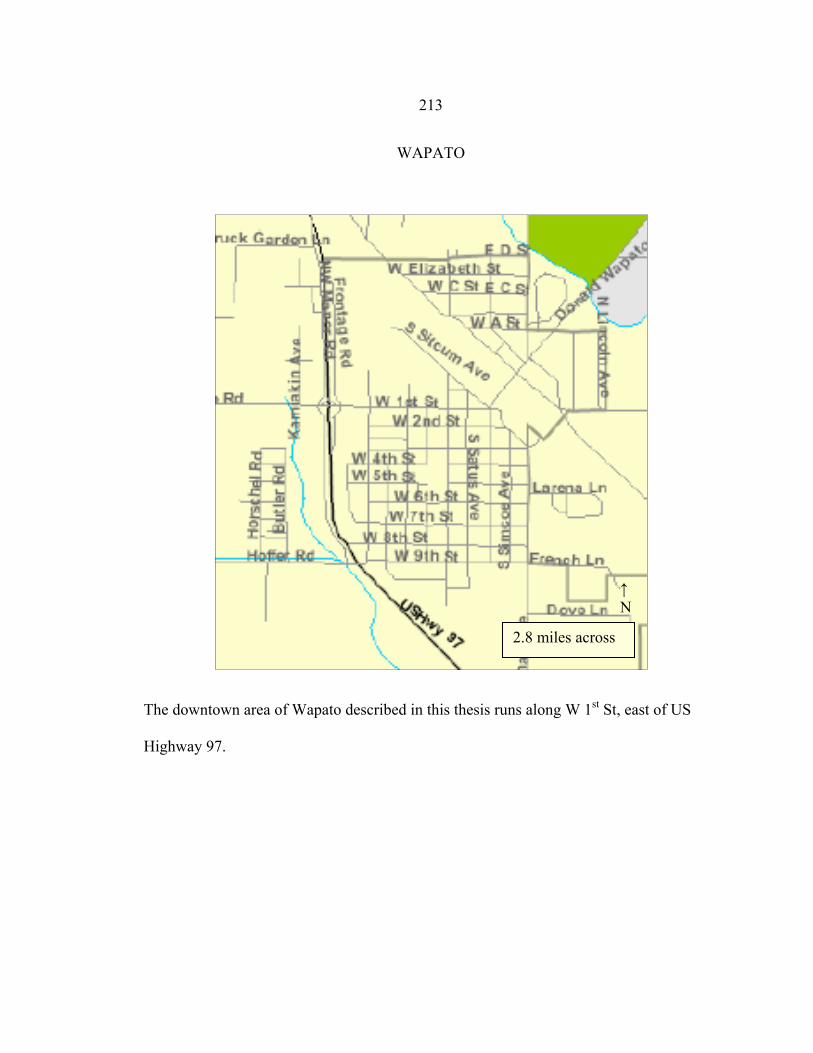
213
WAPATO
The downtown area of Wapato described in this thesis runs along W 1st St, east of US
Highway 97.
2.8 miles across
↑N