Ohio Hispanic Business Owners: An Emerging Economic …ochla.ohio.gov/Portals/0/Public...
22
Latino Community Report 2015 Ohio Hispanic Business Owners: An Emerging Economic Force
-
Upload
truongtram -
Category
Documents
-
view
213 -
download
0
Transcript of Ohio Hispanic Business Owners: An Emerging Economic …ochla.ohio.gov/Portals/0/Public...

Latino Community Report 2015
Ohio Hispanic Business Owners:
An Emerging Economic Force
Page 1
Latino Community Report
tino Community Report
This report was issued by the Ohio Commission on Hispanic/Latino Affairs on July 2, 2015 and was composed by:
Andrea Magaña Lewis, Public Policy Officer Jessica Bolter, Intern – Kenyon College Tim Fisher, Intern – Ohio University The best efforts were made to gather and provide accurate and current information. Data presented from previous years indicates the latest research available. OCHLA will provide any additional information or data upon request as it becomes available.
For more information, please contact:
Ohio Commission on Hispanic/Latino Affairs 77 South High Street, 18th Floor Columbus, Ohio 43215 (614) 466-8333 http://ochla.ohio.gov

Page 2
2015
Table of Contents
I. Introduction ................................................................................................................................... 3
II. Hispanic Entrepreneurship in the U.S. ...................................................................................... 5
Ownership Rates by Sector ....................................................................................................... 5
Economic Implications ............................................................................................................. 6
III. Hispanic Entrepreneurship in Ohio ............................................................................................ 8
Ownership Rates by Sector ....................................................................................................... 8
The MBE and EDGE Programs ................................................................................................ 8
Barriers to Certification Process ................................................................................. 10
Economic Implications ........................................................................................................... 10
IV. Local Entrepreneurship Rates ................................................................................................... 12
V. Contributing Factors to Latino Business Growth ................................................................... 13
VI. Economic Barriers to Business Growth & Capital .................................................................. 15
VII. Latina Business Owners ............................................................................................................. 16
National Trends....................................................................................................................... 16
State Trends ............................................................................................................................ 16
Ownership Rates by Sector ..................................................................................................... 17
The Lure of Self-Employment ................................................................................................ 18
VIII. Conclusion ................................................................................................................................... 20

Page 3
Latino Community Report
tino Community Report
I. Introduction
Across the country, the number of Hispanic-owned businesses has grown exponentially over the past few decades, spurring economic growth and creating jobs. Likewise, Hispanic-owned businesses represent a key investment opportunity to solidify our state’s economic recovery. Small business growth helps sustain our economy by presenting local communities the opportunity to foster innovation while providing new employment opportunities. Although overall entrepreneurship rates are on the decline in the U.S., Hispanic-owned businesses are increasing at more than double the national rate.1 Latina women in particular, are starting businesses at a rate six times the national average, according to the National Women’s Business Council. In Ohio, the most recent data reveals that while the total number of firms increased by 9.8 percent between 2002 and 2007, Hispanic-owned businesses increased by 37 percent. Hispanic-owned businesses have also increased employment at a rate of 1.9 percent, while the employment rates of white-owned firms have decreased by 5.7 percent.2 The unprecedented, sustained growth in Latino entrepreneurship further solidifies our community’s status as an emerging economic force. The overall growth of the Latino population in America largely accounts for the increasing number of Hispanic-owned businesses. According to the 2013 American Community Survey by the U.S. Census Bureau, the Ohio Hispanic population has grown by 76 percent since 2000, and on a national scale the Hispanic population grew by 43 percent between 2000 and 2010, making up more than half the total population growth in the U.S. Latino population growth represents both an enormous possibility for the founding of new businesses, and an ever-expanding new market for those that are already established. This Latino Community Report explores the implications of the entrepreneurial surge among the Hispanic population nationally and in Ohio. We begin by examining national and state data on business ownership from 1990 to present day, among various racial and ethnic groups. We look into Ohio’s Minority
Business Assistance Centers (MBAC), Small Business Development Centers (SBDC), Minority Business Enterprise (MBE) and Encouraging Diversity, Growth and Equity (EDGE) programs in an attempt to determine the level of support minority businesses are receiving in Ohio. This report seeks to explain the effect of Latino small business growth on the national and state economies. An entire section of this report is devoted to the state of Latina business owners in Ohio and in the United States. The increase in Hispanic women-owned businesses is important as it greatly exceeds the rate at which the number of all women-owned firms is increasing. We present several theories that attempt to
1 U.S. Census Bureau, Census Bureau Reports Hispanic-Owned Businesses Increase at More Than Double the National Rate. https://www.census.gov/newsroom/releases/archives/business_ownership/cb10-145.html 2 U.S. Census Bureau. Survey of Business Owners 2002 http://factfinder.census.gov/faces/tableservices/jsf/pages/productview.xhtml?pid=SBO_2002_00A1&prodType=table, and Survey of Business Owners 2007, http://factfinder.census.gov/faces/tableservices/jsf/pages/productview.xhtml?pid=SBO_2007_00CSA01&prodType=table.

Page 4
2015
explain this growth, ranging from increased availability of resources, to Latinas’ frustration with the
conditions they experience as employees. Finally, we highlight legislation that could impact the growth of Hispanic-owned businesses. The Ohio Latino Affairs Commission endeavors to be a valuable resource to members of the General Assembly in understanding and serving their Hispanic constituents. Our office welcomes calls and emails for further information, research, clarifications and to help with outreach.

Page 5
Latino Community Report
tino Community Report
II. Hispanic Entrepreneurship in the U.S.
Over the course of the past four decades, the Hispanic population within the United States has experienced tremendous growth. From a total population of 9.1 million people in 1970, America’s Hispanic population has increased six-fold to more than 53 million people in 2012.3 As a result of the staggering growth, the number of Hispanic-owned businesses within the U.S. has grown at a similarly astonishing rate. By 2013 there were an estimated 3.16 million Hispanic–owned businesses,4 nearly 40 percent more than the 2007 total of 2.26 million.5 The large growth in Hispanic business during this seven year time period is made more impressive when considering the growth occurred during the worst economic recession since the Great Depression.
Growth percentages, however, tell only part of this story. Total sales figures allow for a more complete appreciation of how great a contribution Hispanic-owned businesses make to the national economy. According to the 2007 Survey of Business Owners, Hispanic-owned businesses generated more than $345 billion in receipts, a 55.5 percent increase from 2002. Furthermore, the overall size and importance of these firms to the economy has grown dramatically, as the number of Hispanic-owned businesses with receipts of more than $1 million grew by nearly 52 percent from 2002 to 2007.6
Likewise, the number of Hispanic-owned businesses with 100 or more employees grew from 1,508 in 2002 to 1,906 in 2007, a 26.4 percent increase from 2002. These businesses generated more than $74 billion in total revenue during the 2007 fiscal year, marking a 76.6 percent increase from 2002.7 Although Census data from the 2012 Survey of Business Owners will not be available until later in 2015, we can comfortably assume based on the growth of Hispanic-owned businesses that total sales will be significantly higher than the 2007 figure.
Ownership Rates by Sector
Of the 2.3 million Hispanic-owned businesses totaled in the 2007 Survey of Business Owners, a majority 15 percent operated in the construction sector, 14 percent in administrative support/waste management and remediation services, and 10 percent in health care and social services (see chart on page 6).8
3 Krogstad, Jens Manuel and Mark Hugo Lopez. "Hispanic Nativity Shift." Pew Research Centers Hispanic Trends Project. April 29, 2014. http://www.pewhispanic.org/2014/04/29/hispanic-nativity-shift/. 4 "Hispanic Businesses & Entrepreneurs Drive Growth in the New Economy." Geoscape, 2013. http://ushcc.com/wp-content/uploads/2013/09/Geoscape_HispanicBusinessOwners_FINAL.pdf. 5 Ibid.; U.S. Census Bureau, 2007 Survey of Business Owners. 6 Ibid.; U.S. Census Bureau, Hispanic-Owned Firms: 2002. http://www2.census.gov/econ/sbo/02/sb0200cshisp.pdf 7 U.S. Census Bureau, Census Bureau Reports Hispanic-Owned Businesses Increase at More Than Double the National Rate. https://www.census.gov/newsroom/releases/archives/business_ownership/cb10-145.html 8 “Hispanic-owned Businesses Increased Nearly 44 Percent.” Minority Business Development Agency. U.S. Department of Commerce. 2007. http://www.mbda.gov/pressroom/news-and-announcements/hispanic-owned-businesses-increased-nearly-44-percent

Page 6
2015
15%
14%
10%
9% 8% 8%
6%
30%
Hispanic Business Distribution
All Other IndustrySectors Combined
Source: Minority Business Development Agency
Within these three largest categories, the vast majority of jobs available can be classified as low-skill positions, or positions requiring little to no previous experience, education or training. As a result of myriad institutional factors, including visa restrictions, barriers to education, and limited connections with established corporate networks,9 a significant number of Hispanic immigrants face obstacles to better paying, higher skilled jobs.
Because of these institutional factors, Hispanic employment within traditional employment sectors has become concentrated primarily in the low-skill job markets. Hispanic-owned companies attract innumerable new Americans by establishing visible and easily-accessible employment networks, creating the opportunity for would-be entrepreneurs to gain experience and advance their careers. As a result, thousands of Hispanic-owned businesses have emerged.
Economic Implications
With the U.S. Hispanic population expected to double by 2050,10 it is very likely that the number of Hispanic-owned businesses in the U.S. will continue to grow, both in number and in importance to the national economy, for the foreseeable future. However, predicting in absolute terms what the economic impact of Hispanic-owned businesses will be in the coming decades is tremendously difficult to do, as economic growth and business vitality are contingent upon numerous, unpredictable factors. Nevertheless, we can make several broad assumptions based on present indicators:
U.S. trade balance will be positively affected According to the Minority Business Development Agency, among firms generating 20 percent or more of their sales in exports, Hispanic-owned firms are twice as likely to export goods compared to non-minority-owned firms.11 Additionally, 5.1 percent of Hispanic firms in 2007 exported goods compared with 4.7 percent of non-minority firms.12
9 "Study: Hispanic Business Growth Drives U.S. Economy, Outpaces National Average." Business Wire. Sept. 22, 2014. http://www.businesswire.com/news/home/20140922005190/en/Study-Hispanic-Business-Growth-Drives-U.S.-Economy#.VYgeqflVhBc. 10 Krogstad, Jens Manuel. "With Fewer New Arrivals, Census Lowers Hispanic Population Projections." Pew Research Center RSS. Dec. 16, 2014. http://www.pewresearch.org/fact-tank/2014/12/16/with-fewer-new-arrivals-census-lowers-hispanic-population-projections-2/. 11 Castillo, Alejandra. "Renewing the American Dream: Hispanic-Owned Businesses, An Engine of Job Creation and Exports." Minority Business Development Agency. http://www.mbda.gov/pressroom/news-and-announcements/renewing-american-dream-hispanic-owned-businesses-engine-job-creation-and-exports. 12"Hispanic-Owned Business Growth and Global Reach." Minority Business Development Agency. U.S. Department of Commerce. August 2011. http://www.mbda.gov/sites/default/files/Hispanic-OwnedBusinessGrowthandGlobalReach_Final.pdf.
Construction Administrative, Support, Waste Management and Remediation Services
Health Care and Social Assistance Transportation and Warehousing Retail Trade Professional, Scientific, and Technical Services Real Estate, Rental, and Leasing All Other Industry Sectors Combined

Page 7
Latino Community Report
tino Community Report
The financial sector and stock market will benefit
Geoscape’s 2013 report on trends in Hispanic business indicates that Hispanic business owners are 83 percent more likely to invest in the stock market than the general Hispanic population. Hispanic business owners are also more likely to invest in mutual funds, refinance home mortgages, and take advantage of a variety of other financial instruments than their non-business-owning counterparts.13
Hispanic businesses will drive the U.S. economy through the 21st century As the white, non-Hispanic population continues to age and retire, Hispanic entrepreneurs will play a large role in maintaining our country’s economic viability. Hispanic entrepreneurs tend to be younger, more digitally connected and socially engaged than non-Hispanic entrepreneurs, and the success of their businesses in an increasingly modern world will in many ways determine the future of the U.S. economy.14
13 "Hispanic Businesses & Entrepreneurs." Geoscape. 14 Ibid.

Page 8
2015
III. Hispanic Entrepreneurship in Ohio
Similar to national trends, the number of Hispanic-owned businesses in Ohio has significantly increased in recent years and will likely continue to grow for the foreseeable future. In 2007, Ohio was home to nearly 10,000 Hispanic-owned businesses, representing a 37 percent increase since 2002. The overall growth rate for all firms in Ohio was just 9.8 percent in the same time period.15
Ownership Rates by Sector On a national and state scale, Hispanic-owned firms are most concentrated in the construction industry. In Ohio, 17 percent of Hispanic-owned firms are in the construction sector. Most are small firms with few, if any, paid employees. The healthcare and social assistance sector contains 14 percent of Hispanic-owned firms. Sectors in which Hispanic-owned firms are underrepresented, or have a proportionately smaller industry presence than in other sectors, include real estate/rental/leasing and retail. Nevertheless, 25 percent of total receipts, the largest portion of receipts for Hispanic-owned businesses, come from the retail sector.16
The MBE and EDGE Programs
When Hispanic businesses achieve market success, they create more jobs and contribute to Ohio’s
economic growth. The Ohio Development Services Agency (ODSA) promotes Hispanic business growth by providing technical and professional assistance, access to capital and bonding, connection to business opportunities through the Minority Business Assistance Centers, and through initiatives like the Minority Business Enterprise (MBE) and Encouraging Diversity, Growth and Equity in public contracting (EDGE) programs.17
15 All data from U.S. Census Bureau, Survey of Business Owners 2002 and Survey of Business Owners 2007. 16 “Ohio Hispanic Americans.” Ohio Development Services Agency. http://development.ohio.gov/files/research/P7002.pdf. 17 All information regarding the MBE/EDGE programs, unless otherwise cited, from Ohio Department of Administrative Services, “MBE/EDGE Certification.” http://das.ohio.gov/Divisions/EqualOpportunity/MBEEDGECertification.aspx.
Source: Ohio Development Services Agency, “Ohio Hispanic Americans.”

Page 9
Latino Community Report
tino Community Report
9.6%
90.4%
MBE Certified Businesses, FY 2015
Hispanic-ownedbusinesses
Other minority-owned businesses
The MBE Program The MBE program specifically targets businesses owned by members of racial or ethnic minority groups that are providing goods and services, with the goal of assigning 15 percent of state government contracts to these businesses. Businesses must meet the following requirements to qualify for MBE certification:
Business owner must be African American, American Indian, Hispanic and/or Asian, and must have been the owner for at least a year
Business must be for-profit Company has to have been in business for at least a year Business owner must be an Ohio resident & U.S. citizen Owner must be knowledgeable about his/her industry Business owner must have “day-to-day control” over the business, as well as have the final say over
business decisions Owner must have a demonstrated capability and/or expertise within classifications identified for a
period of one year prior to certification Owner must have all licenses and permits necessary to operate business
In addition to these criteria, business owners must be able to submit 24 pieces of required documentation, which include tax records, proof of race for all minorities, articles of incorporation, corporate by-laws, stock certificates, partnership agreements, resumes and more. According to the Department of Administrative Services (DAS), the average wait time for approval or denial of certification is 17 days, although it could take a few months. Hispanics owned 124 of the 1,286 MBE certified businesses in Fiscal Year 2015.18 According to the latest census data on business owners, Hispanic-owned firms account for 11.7 percent of those owned by a minority group, but account for 9.6 percent of MBE firms in FY2015. Only 1.3 percent of all Hispanic-owned firms and 1.5 percent of all minority-owned firms in Ohio were MBE certified in FY2015.19 The EDGE Program The EDGE program targets businesses and business owners that are economically or socially disadvantaged. It casts a wider net than the MBE program, as any of several factors, including but not limited to race/ethnicity, can account for this disadvantage. This certification is available not only to businesses providing goods and services, but also to those providing professional services, information
18 Department of Administrative Services, FY2015. 19 The percentage is likely even lower because we used 2015 certification data and 2007 data (the most recent available) for the total number of firms, and the total number of firms has increased since then.
Source: Department of Administrative Services.
Page 10
2015
6.5%
93.5%
EDGE Certified Businesses, FY 2015
Hispanic-ownedbusinesses
Other minority-owned businesses
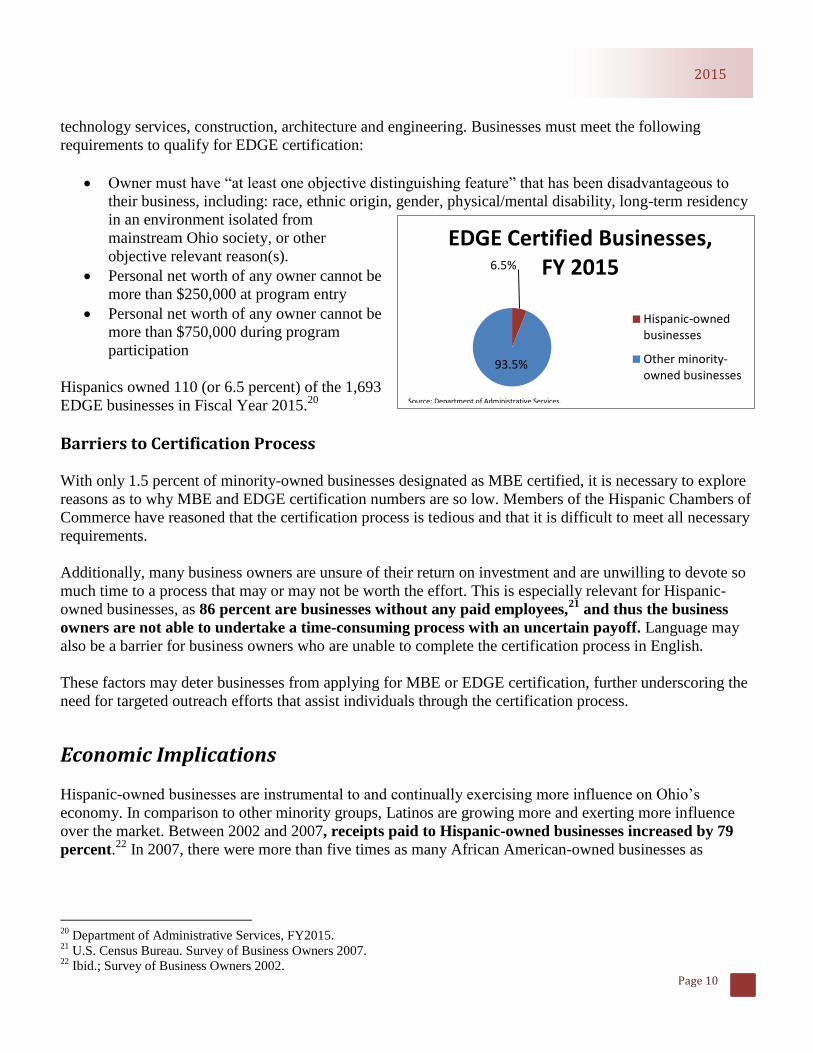
technology services, construction, architecture and engineering. Businesses must meet the following requirements to qualify for EDGE certification:
Owner must have “at least one objective distinguishing feature” that has been disadvantageous to
their business, including: race, ethnic origin, gender, physical/mental disability, long-term residency in an environment isolated from mainstream Ohio society, or other objective relevant reason(s).
Personal net worth of any owner cannot be more than $250,000 at program entry
Personal net worth of any owner cannot be more than $750,000 during program participation
Hispanics owned 110 (or 6.5 percent) of the 1,693 EDGE businesses in Fiscal Year 2015.20 Barriers to Certification Process With only 1.5 percent of minority-owned businesses designated as MBE certified, it is necessary to explore reasons as to why MBE and EDGE certification numbers are so low. Members of the Hispanic Chambers of Commerce have reasoned that the certification process is tedious and that it is difficult to meet all necessary requirements. Additionally, many business owners are unsure of their return on investment and are unwilling to devote so much time to a process that may or may not be worth the effort. This is especially relevant for Hispanic-owned businesses, as 86 percent are businesses without any paid employees,21 and thus the business owners are not able to undertake a time-consuming process with an uncertain payoff. Language may also be a barrier for business owners who are unable to complete the certification process in English. These factors may deter businesses from applying for MBE or EDGE certification, further underscoring the need for targeted outreach efforts that assist individuals through the certification process.
Economic Implications Hispanic-owned businesses are instrumental to and continually exercising more influence on Ohio’s
economy. In comparison to other minority groups, Latinos are growing more and exerting more influence over the market. Between 2002 and 2007, receipts paid to Hispanic-owned businesses increased by 79 percent.22 In 2007, there were more than five times as many African American-owned businesses as
20 Department of Administrative Services, FY2015. 21 U.S. Census Bureau. Survey of Business Owners 2007. 22 Ibid.; Survey of Business Owners 2002.
Source: Department of Administrative Services.

Page 11
Latino Community Report
tino Community Report
Hispanic-owned businesses, but these businesses had only twice as many receipts as Hispanic-owned firms.23 Hispanic-owned firms are also providing an increasing number of Ohio jobs. Between 2002 and 2007, the number of people employed by Hispanic-owned firms grew by 1.9 percent whereas the number of people employed by white-owned firms decreased by 5.7 percent.24 As the Latino population increases, so do opportunities for business growth. Ohio’s Latino population grew
from 1.9 percent of the state population in 2000 to 3.3 percent in 2013.25 The growing population continues to open doors to a new and increasingly powerful market. Between 1990 and 2013, Hispanic buying power grew 443 percent in Ohio, reaching $8.4 billion in 2013, and is projected to reach $11.7 billion by 2018, which would amount to a growth rate of 655 percent since 1990.26 African American buying power grew 169 percent between 1990 and 2013, and white buying power grew 127 percent. While both groups possess a higher buying power than Hispanics (black purchasing power reached $33.2 billion in 2013 and white buying power reached $427.5 billion in 2013), it is impossible to ignore the rate at which Hispanic buying power is growing. A 2012 Nielsen study found that “the Hispanic consumer is looking to build loyalty with brands that properly represents their voices and authentic identity; and that empowers their heritage by effectively embedding their cultural characteristics in how a brand speaks to them.”
27 No one is better equipped to satisfy Latinos’ search for cultural connectivity than Latino business owners.
23 Survey of Business Owners 2007. 24 Ibid. 25 Immigration Policy Center. “New Americans in Ohio.” American Immigration Council, updated 2015. http://www.immigrationpolicy.org/just-facts/new-americans-ohio. 26 Humphreys, Jeffrey M. “The Multicultural Economy.” The University of Georgia Selig Center for Economic Growth, 2013. http://www.latinocollaborative.com/wp-content/uploads/2013/10/Multicultural-Economy-2013-SELIG-Center.pdf. 27 Llopis, Glenn. “Don’t Sell to Me! Hispanics Buy Brands that Empower Their Cultural Relevancy.” Forbes, May 14, 2012. http://www.forbes.com/sites/glennllopis/2012/05/14/dont-sell-to-me-hispanics-buy-brands-that-empower-their-cultural-relevancy/.

Page 12
2015
IV. Local Entrepreneurship Rates Information regarding the number of Hispanic-owned businesses was included for 20 out of the 88 counties in Ohio in the Census Bureau’s 2007 Survey of Business Owners.
County Hispanic-owned businesses
Athens 66
Butler 365
Clermont 162
Columbiana 60
Cuyahoga 1,678
Fairfield 156
Franklin 1,714
Geauga 48
Greene 171
Hamilton 568
Lorain 391
Miami 69
Montgomery 341
Sandusky 118
Shelby 34
Stark 140
Summit 275
Warren 302
Williams 33
Wood 183
For more information, please visit the 2007 Survey at: http://factfinder.census.gov/faces/tableservices/jsf/pages/productview.xhtml?pid=SBO_2007_00CSA01&prodType=table
Page 13
Latino Community Report
tino Community Report
V. Contributing Factors to Latino Business Growth The most obvious explanation for the rapid increase of Hispanic-owned businesses is the growing Latino population in the United States. Population growth alone, however, does not ensure the same trend among businesses. In the case of Latinos in the U.S., several other factors have contributed to the massive growth in Hispanic-owned businesses, specifically micro-businesses. The vast majority, 89 percent, of Hispanic-owned businesses in the U.S. are businesses without any paid employees, as compared to 79 percent of all businesses in the U.S.28 Latino immigrants to the U.S. often start businesses intended solely to help their families survive, without the goal of expansion. The Council on Foreign Relations suggests that because “subsistence entrepreneurship” is common in Latin
America, Latinos in the U.S. are more likely to be willing to take the risk of starting their own small businesses.29 Self-employment is often more conducive to immigrants’ lifestyles because it provides the
flexibility necessary to earn an income while also running a household with children and elderly relatives.30 Finally, self-employment is often more appealing than working for low wages in the grueling conditions that many immigrant workers face. The resources available to Latino business owners, both immigrants and those born in the U.S., have also increased in recent years. Several state organizations in Ohio lend a hand to Hispanic business owners or potential business owners. The Ohio Small Business Development Centers (SBDC) include a Centro Empresarial Latino (Latino Business Center) that caters services to Latinos. The center offers consultations, educational courses, and business information, all in Spanish.31 The SBDC offers many different courses for business owners including: social media strategizing, a women’s mentoring group and
classes on how to use QuickBooks software. The Centro Latino also offers a monthly course titled Como empezar su propio negocio (How to start your own business).32 This course is in Spanish and teaches the fundamentals of starting a business. Across Ohio, the Minority Business Assistance Centers (MBAC) work to assist minority business owners by offering services such as loan and accounting assistance, consultations and help finding contract opportunities – all free of charge.33 These resources are critical to ensuring the success of Latino businesses in Ohio. The Ohio Hispanic Chambers of Commerce (OHCC) promote the development and continued growth of the Hispanic business community in Ohio. As the Hispanic business community’s greatest advocate, OHCC
works closely with corporations and government agencies to identify ways to improve economic
28 U.S. Census Bureau, Survey of Business Owners 2007. 29 Starr, Alexandra. Latino Immigrant Entrepreneurs: How to Capitalize on Their Economic Potential. Council on Foreign Relations, July 2012. 7. 30 National Association for Latino Community Asset Builders. “Latino Entrepreneurship: A 21
st Century American Economic Engine.” 2011. 6. 31 “Latino SBDC.” Ohio Small Business Development Centers. Last updated 2015. https://clients.ohiosbdc.ohio.gov/DocumentMaster.aspx?doc=1002 32 “Upcoming Events.” Ohio Small Business Development Centers. Last updated 2015. http://www.sbdccolumbus.com/events?page=1 33 “Minority Business Assistance Centers (MBAC).” Ohio Development Services Agency. http://development.ohio.gov/bs/bs_mbac.htm

Page 14
2015
development. In addition to keeping its members abreast of pending development projects, OHCC affords members the opportunity to network and promote their businesses. There are five Hispanic Chambers of Commerce in Ohio: Northeast Ohio, Northwest Ohio, Dayton, Cincinnati and Columbus. The Latino Business League of Canton also works closely with the Chambers.

Page 15
Latino Community Report
tino Community Report
VI. Economic Barriers to Business Growth & Capital Despite the integral role Hispanic businesses have played in 21st century American economic growth, many Hispanic businesses have difficulty acquiring the capital necessary to compete in their respective industries, injuring their long-term growth potential, and ultimately their chance of survival. The most significant barrier to growth among Hispanic businesses is access to credit. After controlling for variables like business credit scores, personal wealth and revenue, the U.S. Small Business Administration has found that relative to their non-minority counterparts, Hispanic business owners are disproportionately denied credit when they apply for it.34 As a result, Latinos are three times more likely than whites not to apply for a loan due to fear of rejection.35 Additionally, insufficient personal wealth frequently precludes many Hispanic business owners from accessing credit. Home ownership is in many cases essential for business owners to secure the low-cost loans needed to finance their businesses. However, while 78 percent of all business owners have a home, just 47 percent of Hispanics can say the same. On the other hand, 74 percent of non-Hispanic whites own homes.36 The inability to use home ownership and equity to finance their business development is a major detriment to the success of Hispanic businesses, as a lack of capital can permanently stunt, or shut down, a business.
34 Kymn, Christine. "Access to Capital for Women and Minority-owned Businesses: Revisiting Key Variables." Office of Advocacy Issue Brief 3. Jan 29, 2014. https://www.sba.gov/sites/default/files/Issue%20Brief%203%20Access%20to%20Capital.pdf. 35 Bjerg, Alexandra. "Hispanic-owned Businesses Fueling the Economic Recovery in California." Hispanic-owned Businesses Fueling the Economic Recovery in California. California Economic Summit, Oct. 17, 2013. http://www.caeconomy.org/reporting/entry/hispanic-owned-businesses-fueling-the-economic-recovery-in-california. 36 See table above.

Page 16
2015
VII. Latina Business Owners
Nationwide, and to a lesser degree in Ohio, the past several years have seen rapid growth in Latina-owned firms – that is, firms of which Latinas own at least 51 percent.
National Trends According to the 2014 State of Women-Owned Businesses Report, 11.4 percent of the 9.1 million women-owned firms in the U.S. are owned by Hispanic women. Latina-owned businesses have experienced a 206 percent growth rate since 1997, which is particularly impressive when compared with the 68 percent growth rate for all women-owned firms between 1997 and 2014.37 Of the 2.2 million workers employed by Hispanic-owned firms, Latina-owned firms employ 433,600 individuals, representing an 85 percent increase since 1997.38 Of the $440.2 billion in revenue generated by Hispanic-owned businesses, Latina-owned businesses account for only $71.1 billion, representing a 160 percent growth in revenue since 1997.39 Meanwhile, among all women-owned firms, employment grew by 11 percent and revenue grew by 72 percent in the same time period.40 Even though Latina-owned firms have continued to increase their revenue, receipts were 54 percent lower than the national average for all women-owned firms, whereas the receipts of businesses owned by white women were 9.5 percent higher than the national average.41 The exceedingly high rate of growth in the number of Latina-owned firms in the face of this disadvantage is especially significant when compared to the rates of growth of firms owned by other groups.
State Trends According to 2007 Census Bureau data from its Survey of Business Owners, 33.5 percent of Hispanic-owned firms in Ohio are owned by Latinas.42 Proportionally speaking, among racial groupings there are 6 percent more Latina business owners than white female business owners, and 15 percent less Latina business owners than black female business owners. Within the Hispanic community, women are more likely to start businesses than within the white community or within the community of women as a whole. Despite the frequency with which Hispanic women are starting businesses, the number of Hispanic male-owned businesses is increasing at an even faster rate. Between 2002 and 2007, Hispanic businesses as a
37 Womenable. “The 2014 State of Women-Owned Businesses Report.” Commissioned by American Express OPEN. March
2014. 25. http://www.womenable.com/content/userfiles/2014_State_of_Women-owned_Businesses_public.pdf. 38 Márquez Peterson, Lea. “Access to Capital and the Latina Business Owner.” National Women’s Business Council. https://www.nwbc.gov/content/access-capital-and-latina-business-owner. 39 Ibid. 40 Ibid. 41 Ahmad, Farah Z. “How Women of Color Are Driving Entrepreneurship.” Center for American Progress, June 10, 2014. https://www.americanprogress.org/issues/race/report/2014/06/10/91241/how-women-of-color-are-driving-entrepreneurship/ 42 All data in the State Trends section from U.S. Census Bureau 2007 Survey of Business Owners.

Page 17
Latino Community Report
tino Community Report
whole increased by 37 percent. Latina-owned businesses increased by 20 percent, while Hispanic male-owned businesses increased by 40 percent.43
Ownership Rates by Sector Latina-owned businesses are concentrated in several industries, where businesses tend to be relatively small and are more traditionally associated with women’s employment.
44 Twenty percent of Latina-owned firms are concentrated in health care, 18 percent in administrative services, 10 percent in retail, 9 percent in professional industries, and 6 percent in real estate.45 Less than .01 percent of Latina-owned firms are concentrated in company management, .06 percent in mining, quarrying, and oil and gas extraction, 0.07 percent in utilities, and 0.15 percent in agriculture, forestry, fishing, and hunting.46
43 Percentages based on analysis of U.S. Census Bureau Survey of Business Owners 2007 and Survey of Business Owners 2002. 44 Hess, Milli, Hayes and Hegewisch. “The Status of Women in the States 2015.” Institute for Women’s Policy Research, 2015. 136. http://www.iwpr.org/publications/pubs/the-status-of-women-in-the-states-2015-2014-employment-and-earnings. 45 Jackson, Mareshah. “Fact Sheet: The State of Latinas in the United States.” Center for American Progress, November 7, 2013. https://www.americanprogress.org/issues/race/report/2013/11/07/79167/fact-sheet-the-state-of-latinas-in-the-united-states/. 46 “Hispanic Women-Owned Businesses.” National Women’s Business Council, 2012. https://www.nwbc.gov/sites/default/files/hispanic%20women-owned%20businesses%20general.pdf.
33.5 27.4
48.3
27.8
66.5 72.6
51.7
72.2
0%
10%
20%
30%
40%
50%
60%
70%
80%
90%
100%
Hispanic-owned firms White-owned firms Black-owned firms All firms
Female-owned Male-owned
Source: U.S. Census Bureau Survey of Business Owners 2007
Ownership of Ohio Businesses by Gender

Page 18
2015
The Lure of Self-Employment The increase in Latina entrepreneurship is so unprecedented that it is necessary to investigate the possible causes. Although some causes were addressed in “Contributing Factors to Latino Business Growth” (page
13), some additional factors are specific to the experience of Hispanic women in the U.S. In part, the self-employment trend has to do with the conditions Latinas encounter when they enter the U.S. labor force as employees. When compared to other women and men, Hispanic women appear to have fewer career advancement opportunities. In 2013, just 25.6 percent of Hispanic women held professional and managerial positions, while 42.7 percent of white women and 48 percent of Asian-American women held these jobs.47 When holding the same position as a man, 2012 data found that Hispanic women make 53 percent of a man’s salary, black women make 64 percent, white women make 78 percent and Asian-American women make 87 percent.48 Non-quantifiable conditions, such as race and gender stereotyping and assumptions about their lesser capabilities, provide additional challenges for Latinas in the workplace.49 Furthermore, some argue that Hispanic immigrants to the United States, as a self-selecting population, tend to be more entrepreneurial from their countries of origin. They are those willing to take the risk of uprooting themselves and moving to a foreign country, and businesswomen have to be willing to take similar risks. Yesi Morillo-Gual, an entrepreneur and founder of the Proud To Be Latina development network, commented in an article, “Immigrants, in general, have innate entrepreneurial skills. When they arrive in
America, they have to figure out everything for themselves—from language to where to live, to how to support themselves.”
50 When these two factors—unfair conditions in the workplace and innate entrepreneurship—are met with increasing resources to help Latinas start their own businesses, they are likely to see an alternative to working on someone else’s terms. The growth of resources includes:
Increase in post-secondary education for women and women of color, Resources targeted specifically at minority women to help them start their own businesses, and Increase in role models and therefore motivation.51
Finally, because the Hispanic population in the United States is rapidly growing, Latina entrepreneurs have a market of consumers who are eager to support them. The buying power of Latinos in the U.S. is projected to increase by 42 percent to $1.7 trillion by 2017, growing at twice the national average.52 The story of Mexican native Maria de Lourdes Sobrino and her business, Lulu’s Desserts, illustrates the power
of this market:
“After opening a seven-hundred-square-foot storefront in an Anglo part of Los Angeles in 1982 and failing to attract customers for her gelatin desserts, she began selling them on consignment to
47 Ahmad, “Women of Color.” 48 Ibid. 49 Ibid. 50 Isele, Elizabeth. “Aging Latinas Are Boosting U.S. Entrepreneurial Numbers.” Forbes, April 30, 2015. http://www.forbes.com/sites/nextavenue/2015/04/30/aging-latinas-are-boosting-u-s-entrepreneurial-numbers/. 51 “Latina entrepreneurship rising and rising.” Latina Lista, May 9, 2014. . http://latinalista.com/life/women-life/latina-entrepreneurship-rising-rising. 52 Starr, Latino Immigrant Entrepreneurs, 3.

Page 19
Latino Community Report
tino Community Report
Mexican supermarkets. Lulu’s Desserts has since grown into a business with $8 million in annual
revenue, and there are plans to build a second manufacturing plant in Texas.”53
The growing Latino market thus follows the initial incentives to start a business.
53 Ibid., 7.

Page 20
2015
IX. Conclusion As Hispanic business owners continue to help move our economy forward, it is critical for lawmakers to craft policy that supports Hispanic business growth – specifically microbusiness growth. Starting a new business can be extremely challenging, and when a new business is minority-owned or in a low income area, the challenges seem to notably increase to the entrepreneurs aiming to create a successful livelihood. Legislation has the power to drastically affect business growth, thereby affecting the surrounding communities. The Ohio Latino Affairs Commission tracks bills that may impact Hispanic-owned businesses. Senate Bills 25, 40 and 73, and House Bills 64 and 102 are just a few examples of legislation that may impact small business growth – especially business ventures owned by minorities or located in economically distressed areas. In an effort to promote Latino business growth, the Commission is working with Ohio’s MBE/EDGE
program administrators to increase participation of Latinos in the state’s set aside programs. Targeted
outreach is necessary to better suit the unique needs of Hispanic entrepreneurs. Additionally, on a quarterly basis the Commission convenes the Ohio Hispanic Chambers of Commerce to discuss strategies to expand business opportunities for Latinos in Ohio, and to share best practices for promoting entrepreneurship within the Latino community. The Ohio Latino Affairs Commission is committed to equipping state leaders with key information on Ohio’s Hispanic communities. Latino Community Reports are part of the Commission’s work to fulfill its
statutory mandate to advise Ohio’s government on issues affecting their Hispanic constituents.

Page 21
Latino Community Report
tino Community Report
Ohio Latino Affairs Commission Riffe Center – 18th Floor
77 South High Street Columbus, Ohio 43215
Office: (614) 466-8333
Fax: (614) 995-0896
Homepage: http://ochla.ohio.gov Facebook: http://facebook.com/ochla
Twitter: https://twitter.com/OCHLA_OH