The Eight Unmet Promises of Fast-Start Clmate Finance
8
Policy pointers n Finance is not adequate. Funding needs to be scaled up, provided as grants that are new and additional to Official Development Assistance, and targeted at the countries particularly vulnerable to climate change. n Only Japan and Norway committed their ‘fair share’ of climate finance. Commitments should reflect both responsibility and capability. n More funds must go to adaptation. Only one- fifth of climate finance supports adaptation in developing countries despite Copenhagen commitments to balance funding between adaptation and mitigation. n Contributor countries are not being transparent. Only Switzerland received a ‘pass grade’ in this year’s transparency scorecard; improved practices and an independent climate finance registry are needed. n UN Climate Funds remain empty shells. Only two per cent of climate finance is being delivered through the UN Climate Funds. Scaling up of these multilateral funds is needed to strengthen trust between contributor and recipient nations. At the 2009 Copenhagen climate change negotiations the world’s wealthier nations pledged major funding to help developing countries shift to a lower-carbon economy, and to deal with current and future climate change impacts. They pledged US$30 billion of ‘new and additional’ fast-start climate finance, with funding ‘balanced’ between mitigation and adaptation. We are now at the end of the fast-start period (2010–2012). So which contributor countries met their obligations and which are lagging? Based on countries’ May 2012 reports to the UNFCCC, we have expanded our 2010 and 2011 approach to assessing fast-start finance 1,2 and our 2011 transparency scorecard 3 into an overall assessment of whether the ten contributors met their commitments: to transparently provide a fair-share of the US$30 billion promised, while balancing adaptation and mitigation funding, sourcing funds through UN channels, and without reverting to debt-inducing loans in the place of grants (see Table 1). We take up eight ways that the fast-start programme failed to meet its promises. Unmet promise 1: Not transparent In Cancun in 2010, Parties reaffirmed finance pledges made the previous year in Copenhagen and called Wealthy nations are still not meeting their Copenhagen climate finance pledges. While we await the final numbers from a few contributors, reports submitted to the UNFCCC in May 2012 show that only two of the ten contributors committed their ‘fair share’ of fast-start climate finance, assessed on their capability and their responsibility for the problem. The United States, European Union and Iceland committed half or less than half of their fair share. The result is that only $23.6 billion has been committed, short of the $30 billion pledged. Only one-fifth of climate finance supports adaptation in developing countries, in spite of promises to ‘balance’ it with mitigation funding. Only Switzerland received a ‘pass’ grade in this year’s transparency scorecard. Less than half of committed funds are grants and only two per cent are flowing through the UN, where they could strengthen trust between contributor and recipient nations. It is past time to meet the long-agreed principles: new and additional, predictable, and adequate climate finance. for a Standing Committee to improve “coherence and coordination in the delivery of climate change financing”. They also charged the Committee with the “measurement, reporting and verification of support provided to developing country Parties”. Despite these initiatives, transparency among contributors remains weak. Without transparency about how and when wealthy countries will fulfil their climate finance pledges, developing countries are unable to plan adequate responses to climate change. We scored ten contributor fast-start finance reports to the UNFCCC on 24 transparency metrics, awarding 0, 0.5 or 1 for each measure to produce an overall score. The 24 metrics fall under three broad categories: ‘summary information’, ‘measuring and allocating funds’, and ‘project data’. Summary information covers basic data in the report, such as its timeliness, clarity, and whether it includes the most essential information (such as the overall amount committed and the percentage of funds directed to adaptation, among other measures). ‘Measuring and allocating’ metrics explore how countries define new and additional funding, and how they determined their ‘fair share’ contribution. ‘Project data metrics’ look for specific details on funded activities that are accessible, complete, and easy to use. 4 Download the pdf at http://pubs.iied.org/17141IIED The eight unmet promises of fast-start climate finance NOVEMBER 2012
-
Upload
designannexe -
Category
Documents
-
view
212 -
download
0
description
Wealthy nations are still not meeting their Copenhagen climate finance pledges. Only two of the ten contributors committed their ‘fair share’ of fast-start climate finance. The United States, European Union and Iceland committed half or less than half of their fair share. Less than half of committed funds are grants and only two per cent are flowing through the UN, where they could strengthen trust between contributor and recipient nations. It is past time to meet the long-agreed principles: new and additional, predictable, and adequate climate finance.
Transcript of The Eight Unmet Promises of Fast-Start Clmate Finance
Policy pointers
n Finance is not adequate. Funding needs to be scaled
up, provided as grants that
are new and additional
to Official Development
Assistance, and targeted at
the countries particularly
vulnerable to climate change.
n Only Japan and Norway committed their ‘fair
share’ of climate finance.
Commitments should reflect
both responsibility and
capability.
n More funds must go to adaptation. Only one-
fifth of climate finance
supports adaptation in
developing countries despite
Copenhagen commitments
to balance funding between
adaptation and mitigation.
n Contributor countries are not being transparent. Only
Switzerland received a
‘pass grade’ in this year’s
transparency scorecard;
improved practices and an
independent climate finance
registry are needed.
n UN Climate Funds remain empty shells. Only two per
cent of climate finance is
being delivered through the
UN Climate Funds. Scaling
up of these multilateral funds
is needed to strengthen trust
between contributor and
recipient nations.
At the 2009 Copenhagen climate change negotiations
the world’s wealthier nations pledged major funding
to help developing countries shift to a lower-carbon
economy, and to deal with current and future climate
change impacts. They pledged US$30 billion of ‘new
and additional’ fast-start climate finance, with funding
‘balanced’ between mitigation and adaptation. We are
now at the end of the fast-start period (2010–2012).
So which contributor countries met their obligations and
which are lagging?
Based on countries’ May 2012 reports to the UNFCCC,
we have expanded our 2010 and 2011 approach
to assessing fast-start finance1,2 and our 2011
transparency scorecard3 into an overall assessment of
whether the ten contributors met their commitments: to
transparently provide a fair-share of the US$30 billion
promised, while balancing adaptation and mitigation
funding, sourcing funds through UN channels, and
without reverting to debt-inducing loans in the place of
grants (see Table 1). We take up eight ways that the
fast-start programme failed to meet its promises.
Unmet promise 1: Not transparent In Cancun in 2010, Parties reaffirmed finance pledges
made the previous year in Copenhagen and called
Wealthy nations are still not meeting their Copenhagen climate finance pledges.
While we await the final numbers from a few contributors, reports submitted to
the UNFCCC in May 2012 show that only two of the ten contributors committed
their ‘fair share’ of fast-start climate finance, assessed on their capability and their
responsibility for the problem. The United States, European Union and Iceland
committed half or less than half of their fair share. The result is that only $23.6
billion has been committed, short of the $30 billion pledged. Only one-fifth of
climate finance supports adaptation in developing countries, in spite of promises to
‘balance’ it with mitigation funding. Only Switzerland received a ‘pass’ grade in this
year’s transparency scorecard. Less than half of committed funds are grants and
only two per cent are flowing through the UN, where they could strengthen trust
between contributor and recipient nations. It is past time to meet the long-agreed
principles: new and additional, predictable, and adequate climate finance.
for a Standing Committee to improve “coherence
and coordination in the delivery of climate change
financing”. They also charged the Committee with the
“measurement, reporting and verification of support
provided to developing country Parties”. Despite these
initiatives, transparency among contributors remains
weak. Without transparency about how and when
wealthy countries will fulfil their climate finance pledges,
developing countries are unable to plan adequate
responses to climate change.
We scored ten contributor fast-start finance reports to
the UNFCCC on 24 transparency metrics, awarding 0,
0.5 or 1 for each measure to produce an overall score.
The 24 metrics fall under three broad categories:
‘summary information’, ‘measuring and allocating funds’,
and ‘project data’. Summary information covers basic
data in the report, such as its timeliness, clarity, and
whether it includes the most essential information (such
as the overall amount committed and the percentage of
funds directed to adaptation, among other measures).
‘Measuring and allocating’ metrics explore how countries
define new and additional funding, and how they
determined their ‘fair share’ contribution. ‘Project data
metrics’ look for specific details on funded activities that
are accessible, complete, and easy to use.4
Download the pdf at http://pubs.iied.org/17141IIED
The eight unmet promises of fast-start climate finance
NOvEMbEr 2012

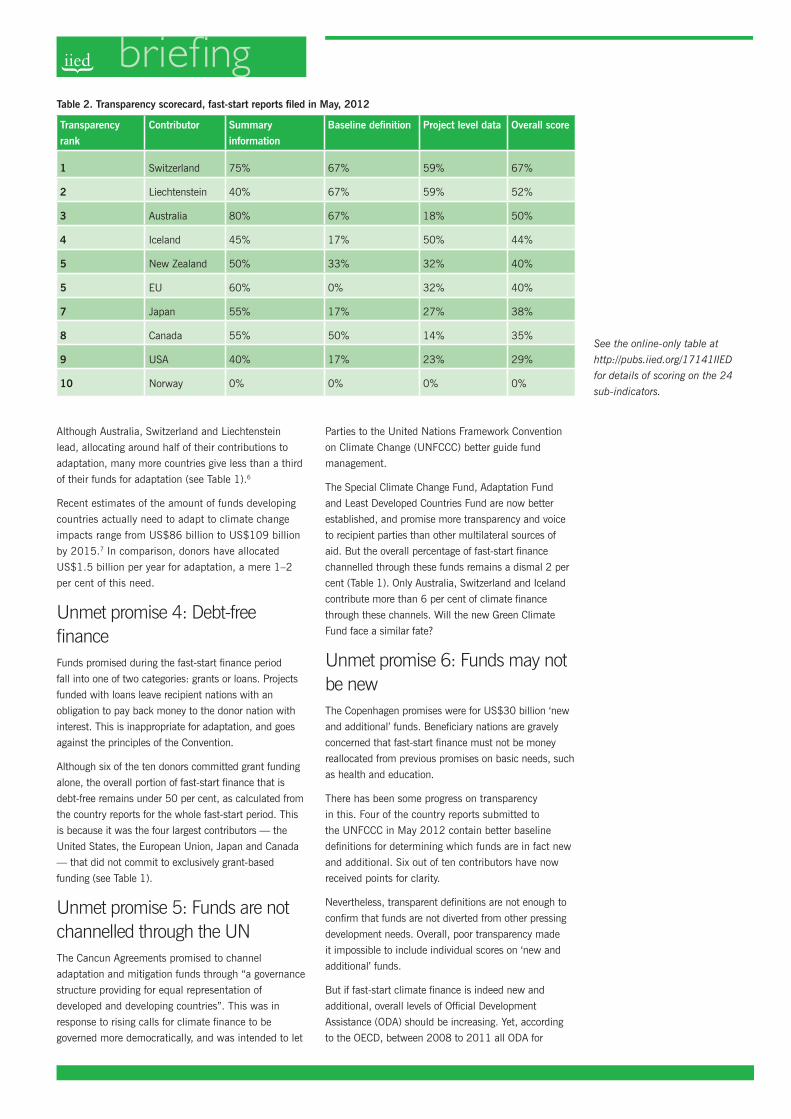
Last year, Norway, Japan and the EU were the only
contributors scoring near or over 50 per cent for
transparency. This year,
Switzerland, Liechtenstein
and Australia have
supplanted them at the top.
By not submitting a report
Norway fell from first
to worst. Nevertheless,
Switzerland’s 67 per cent — the top score — is
still a poor grade for most university students. Of
the contributors that submitted reports, the United
States has fallen into last place. Table 2 presents the
scorecard for 2012.
Unmet promise 2: Contributing a fair shareThus far, donors have only committed a total of
US$23.6 billion of the US$30 billion promised in
Copenhagen. Actors including the European Union,
United States, Canada and New Zealand have indicated
have indicated that they will make additional fast start
contributions by the end of the period.5
What portion of climate finance should each contributor
deliver? And are those most responsible and able to
contribute fulfilling their obligations? Whether or not
countries had offered their own rationale, we assessed a
‘fair share’ of the overall US$30 billion pledge based on
an average of two scores. These include ‘responsibility’
for the problem of climate change and ‘capability’
(national income), compared across contributors (see
Table 1).
We measured responsibility obligations based on a
contributor’s cumulative historical carbon dioxide
emissions between 1960 and 2008. To calculate what
portion each donor should have provided, we divided
each donor’s percentage contribution of the total US$30
billion pledge by their percentage of the total emissions
caused by all the donor countries.
We also scored the capability of a donor to meet
its obligations based on the size of its economy. To
calculate this capability-based fair share, we divided
each donor’s percentage contribution of the total US$30
billion pledge by their percentage of the total US$30
billion commitment by their percentage of the combined
Gross Domestic Product of all contributors (using the
most recent World Bank data — from 2011).
Although Norway did not submit a report this year, we
were still able to calculate its fair share score using
last year’s numbers. Over the fast-start period, Norway
and Japan have performed the best of any donors,
contributing several times above their fair share. New
Zealand and Canada contributed near their fair share,
while all other actors have contributed below what
they should.
Unmet promise 3: balanced funding for adaptationOne of the key stipulations of the fast-start finance was
to strike a balance between adaptation and mitigation
funding. So far, this has not been achieved. In the 2010
country reports, the percentage of funds allocated for
adaptation projects was in the low teens. By 2011,
countries had slightly improved — 19–25 per cent had
been allocated for adaptation projects.
In this briefing we consider the share of funds that
have been committed to adaptation during the entire
fast-start finance period, 2010–2012. Unfortunately,
we find that our high estimate now barely exceeds
20 per cent for the period — a far cry from the
50 per cent required to achieve true ‘balance’,
as most recipient countries understand the term.
Only one-fifth of climate finance supports adaptation in developing countries
Fast-start finance commitment (US$ millions)‡
Fair share % adaptation % grants % through UN funds
Norway* 710 492% 9-11% 100% 1%
Japan 9,600 291% 12-18% 21% 1%
New Zealand 69.8 88% 32-35% 100% 0%
Canada# 1,015.6 84% 9-12% 25% 2%
Switzerland† 135.5 75% 39% 100% 11%
Australia 603 74% 52% 100% 7%
Liechtenstein 2.1 70% 67% 100% 0%
EU# 6,390 54% 32% 55% 3%
USA# 5,100 43% 17% 67% 2%
Iceland 1 15% 23-47% 100% 13%
Total 23,627 79% 20-22% 45% 2%
Table1. Meeting promises.
A more detailed table for fair share
figures is available at http://pubs.iied.
org/17143IIED.
*Norway had not submitted the report
due in May, so the numbers included for
Norway in this table are from the last
report submitted, in May 2011. #Said that they will provide additional
funds by the end of 2012.5 †Total Swiss finance for climate change for
during the fast start period was US$387
million; however, this includes funding
that is not new and additional. ‡ Currency exchange rates to US$ are
either as given by the country report or,
where this was not provided, we used an
exchange rate as of June 2012.
Although Australia, Switzerland and Liechtenstein
lead, allocating around half of their contributions to
adaptation, many more countries give less than a third
of their funds for adaptation (see Table 1).6
Recent estimates of the amount of funds developing
countries actually need to adapt to climate change
impacts range from US$86 billion to US$109 billion
by 2015.7 In comparison, donors have allocated
US$1.5 billion per year for adaptation, a mere 1–2
per cent of this need.
Unmet promise 4: Debt-free financeFunds promised during the fast-start finance period
fall into one of two categories: grants or loans. Projects
funded with loans leave recipient nations with an
obligation to pay back money to the donor nation with
interest. This is inappropriate for adaptation, and goes
against the principles of the Convention.
Although six of the ten donors committed grant funding
alone, the overall portion of fast-start finance that is
debt-free remains under 50 per cent, as calculated from
the country reports for the whole fast-start period. This
is because it was the four largest contributors — the
United States, the European Union, Japan and Canada
— that did not commit to exclusively grant-based
funding (see Table 1).
Unmet promise 5: Funds are not channelled through the UNThe Cancun Agreements promised to channel
adaptation and mitigation funds through “a governance
structure providing for equal representation of
developed and developing countries”. This was in
response to rising calls for climate finance to be
governed more democratically, and was intended to let
Parties to the United Nations Framework Convention
on Climate Change (UNFCCC) better guide fund
management.
The Special Climate Change Fund, Adaptation Fund
and Least Developed Countries Fund are now better
established, and promise more transparency and voice
to recipient parties than other multilateral sources of
aid. But the overall percentage of fast-start finance
channelled through these funds remains a dismal 2 per
cent (Table 1). Only Australia, Switzerland and Iceland
contribute more than 6 per cent of climate finance
through these channels. Will the new Green Climate
Fund face a similar fate?
Unmet promise 6: Funds may not be new The Copenhagen promises were for US$30 billion ‘new
and additional’ funds. Beneficiary nations are gravely
concerned that fast-start finance must not be money
reallocated from previous promises on basic needs, such
as health and education.
There has been some progress on transparency
in this. Four of the country reports submitted to
the UNFCCC in May 2012 contain better baseline
definitions for determining which funds are in fact new
and additional. Six out of ten contributors have now
received points for clarity.
Nevertheless, transparent definitions are not enough to
confirm that funds are not diverted from other pressing
development needs. Overall, poor transparency made
it impossible to include individual scores on ‘new and
additional’ funds.
But if fast-start climate finance is indeed new and
additional, overall levels of Official Development
Assistance (ODA) should be increasing. Yet, according
to the OECD, between 2008 to 2011 all ODA for
Table 2. Transparency scorecard, fast-start reports filed in May, 2012
Transparency rank
Contributor Summary information
Baseline definition Project level data Overall score
1 Switzerland 75% 67% 59% 67%
2 Liechtenstein 40% 67% 59% 52%
3 Australia 80% 67% 18% 50%
4 Iceland 45% 17% 50% 44%
5 New Zealand 50% 33% 32% 40%
5 EU 60% 0% 32% 40%
7 Japan 55% 17% 27% 38%
8 Canada 55% 50% 14% 35%
9 USA 40% 17% 23% 29%
10 Norway 0% 0% 0% 0%
See the online-only table at
http://pubs.iied.org/17141IIED
for details of scoring on the 24
sub-indicators.
This briefing is published by
IIED in association with ecbi.
The International Institute for
Environment and Development
(IIED) is an independent,
nonprofit research institute
working in the field of
sustainable development.
IIED provides expertise and
leadership in researching
and achieving sustainable
development at local, national,
regional and global levels.
The European Capacity
Building Initiative (ecbi) is
an initiative for sustained
capacity building in support of
international climate change
negotiations.
This briefing has been
produced with the generous
support of Danida (Denmark),
Irish Aid, Norad (Norway) and
Sida (Sweden).
Contact: Achala Chandani
80–86 Gray’s Inn Road,
London WC1X 8NH, UK
Tel: +44 (0)20 3463 7399
Fax: +44 (0)20 3514 9055
Website: www.iied.org
Download the pdf at http://pubs.iied.org/17141IIED
all purposes from all countries (not just the fast-start
contributors) rose only by about US$11.7 billion.8
Unmet promise 7: vulnerability not addressed In recent negotiations, the Least Developed Countries
(LDCs), the Africa Group, and the Alliance of Small
Island States (AOSIS) negotiating groups became
more vocal about their vulnerability to adverse climate
change. The convention texts do indeed prioritise them
as “most vulnerable.” These nations’ citizens are already
experiencing dramatic environmental changes, from
sea level rise in Bangladesh, Tuvalu and the Gambia to
reduced crop yields and drought in the Sahel. It is crucial
that climate finance addresses these most vulnerable
countries’ needs, but only two of the ten contributors
provided data to show whether they had done this.
Poor information makes it very difficult to assess how
contributor countries address vulnerability. But there
is one indicator: the most urgent and immediate
adaptation needs identified in the Least Developed
Countries’ National Adaptation Programmes of Action
require an estimated US$3 billion. To date, only
US$536.7 million has been pledged to the Least
Developed Countries Fund (the LDCF).9 Given that the
fund remains short by nearly US$2.5 billion, and that
only 2 per cent of fast-start finance has been channelled
through UN funds like the LDCF, where vulnerable
countries feel their voices can be heard, it is safe to say
there is an urgent need for improvement.
Unmet promise 8: Pledges not deliveredAlthough large fast-start pledges are appreciated,
what really matters to developing countries is actual
delivery of funds (what are called ‘disbursements’).
Unfortunately, most of the donors have failed to disclose
how much they have delivered thus far.
In 2012, only Canada, Iceland, and Australia
provided useful figures for disbursements in their
reports. Switzerland also mentioned disbursements,
but conflated projections of future with current
disbursements. Norway has previously described
disbursements, but submitted no report this year.
A report by Bloomberg New Energy Finance estimates
that only US$11.3 billion total of fast-start finance had
been delivered to different funding agencies by September
2011.10 Another source considering total climate finance
(not just fast start) suggests that, on average, climate
finance disbursements are less than 25 per cent of the
amount approved for delivery, and less than 10 per cent of
the totals originally pledged.11 Because there is no agreed
classification for the status of project funds, nor consistent
reporting of ‘deposited’, ‘approved’ and ‘disbursed’ finance,
we could not score countries on disbursement. But clearly,
there is far to go before all of the funds that were pledged
actually get delivered and put to use.
n DAVID CIPLET, SPENCER FIELDS, KEITH MADDEN, MIZAN KHAN AND TIMMONS ROBERTS
David Ciplet is a Researcher and PhD candidate at Brown
University, United States, where Spencer Fields is Alumnus
and Researcher with the Climate and Development Lab, and
Keith Madden is an undergraduate. Mizan Khan is Visiting
Scholar at Brown and Professor of Environmental Management
at North South University, Bangladesh. Timmons Roberts is
Non-Resident Senior Fellow at the Brookings Institution and
Ittleson Professor of Environmental Studies and Sociology
at Brown University, United States. The Brown Climate and
Development Lab work with IIED’s Climate Change Group to
provide support for the Least Developed Countries group.
Notesn 1 Ciplet, D. et al. 2010. Fast start adaptation funding: keeping promises from Copenhagen. IIED Briefing. IIED, London. http://pubs.
iied.org/17088IIED n 2 Ciplet, D. et al. 2011. Adaptation finance: How can Durban deliver on past promises? IIED Briefing. IIED,
London. http://pubs.iied.org/17115IIED n 3 Ciplet, D. et al. 2011. Scoring fast-start climate finance: leaders and laggards in transparency.
IIED Briefing. IIED, London. http://pubs.iied.org/17100IIED n 4 The methodology for this year’s transparency scorecard is almost identical
to our 2011 scorecard (ref. 3). The only difference is that this year, if a country did not report all project level data, that country could not
score higher than 0.5 in the rest of the project level criteria. n 5 This is due to the fact that this data was taken from reports submitted
to the UNFCCC through May 2012. Three countries have proposed specific additional contributions to be made by the end of the period:
the EU US$3.6 billion; Canada US$235 million; and New Zealand US$48.8 million. The US has also said that it will make additional
contributions, but has not specified an amount. n 6 Adaptation percentages by country and overall are presented as a range. Low estimates
are based on adaptation funding listed in each country’s 2011 and 2012 reports. High estimates also include a third category of projects
besides adaptation and mitigation (i.e. ‘multi-sector’, ‘capacity-building’, or ‘both’). For contributors that listed such a category, we applied
50% per cent as an estimate for the extra portion counting as adaptation. n 7 UNDP Human Development Report as cited in Agrawala,
S., Fankhauser, S. (eds). 2008. Economic Aspects of Adaptation to Climate Change. Costs, Benefits and Policy Instruments. OECD, Paris.
n 8 Query by the authors of OECD ODA Flows Data at http://stats.oecd.org/qwids n 9 Ciplet et al. unpublished. Least Developed Country
demands for replenishment of the LDC Fund. n 10 Cuming, V. 2011. Have developed nations broken their promise on $30bn ‘fast-start’
finance? Bloomberg New Energy Finance White Paper, September 2011. www.newenergyfinance.com/WhitePapers/download/47
n 11 www.climatefundsupdate.org/global-trends/size-spending

Download the pdf at http://pubs.iied.org/17141IIED
Fair share figures
This online-only addition to the briefing gives full details of the fair share figures summarised in Table 1.
Capability Switzerland Liechtenstein Australia Iceland New Zealand EU Japan Canada USA Norway Total
Fast-start finance commitment (hundred millions) 1.355 0.02092 6.03 0.01 0.698 63.9 96 10.16 51 7.1 236.27
GDP (hundreds of millions of US$) 635.65 4.826 1371.764 14.059 142.477 17552.216 5867.154 1736.051 15094 485.803 42904
% of total GDP of donors 1.48% 0.01% 3.20% 0.03% 0.33% 40.91% 13.68% 4.05% 35.18% 1.13% 100.00%
% of total $30 billion fast-start finance commitment 0% 0% 2% 0% 0% 21% 32% 3% 17% 2% 79%
Fair share commitment (capability) 4.44 0.03 9.6 0.09 0.99 122.73 41.04 12.15 105.54 3.39 300
Fair share score (capability) 31% 70% 63% 11% 71% 52% 234% 84% 48% 209%
Responsibility Switzerland Liechtenstein Australia Iceland New Zealand EU Japan Canada USA Norway Total
Fast-start finance commitment (hundred millions) 1.355 0.02092 6.03 0.01 0.698 63.9 96 10.16 51 7.1 236.27
Cumulative emissions (MT CO2 1960–2008) 1883.5 11628.95 88.22 1088.78 189005.11 45772.04 20009.12 227278.14 1521.56 498275.42
Responsibility II (cumulative 1960–2008) 0.38% 0.01% 2.33% 0.02% 0.22% 37.93% 9.19% 4.02% 45.61% 0.31% 100.01%
% of total $30 billion fast-start finance commitment 0% 0% 2% 0% 0% 21% 32% 3% 17% 2% 79%
Fair share commitment (responsibility) 1.13 0.03 7.00 0.05 0.66 113.80 27.56 12.05 136.84 0.92 300.03
Fair share score (responsibility) 119% 70% 86% 19% 106% 56% 348% 84% 37% 775%
Aggregate score Switzerland Liechtenstein Australia Iceland New Zealand EU Japan Canada USA Norway
Fair share 75% 70% 74% 15% 88% 54% 291% 84% 43% 492% 79%

Download the pdf at http://pubs.iied.org/17141IIED
Switzerland Liechtenstein Australia Iceland New Zealand EU Japan Canada USA Norway
Overall rank in 2012 1 2 3 4 5 5 7 8 9 10
Total score in 2012 (% of all 24 categories) 67 52 50 44 40 40 38 35 29 0
Overall rank in 2011 5 7 4 7 10 3 2 7 5 1
Total score in 2011 32 30 34 30 26 48 50 30 32 52
Reporting of summary information 75% 40% 80% 45% 50% 60% 55% 55% 40% 0%
Filed report by May 31 1 1 1 0 1 1 1 1 1 0
Total committed 2010–2012 1 1 1 1 1 1 1 1 1 0
Total disbursed to date 1 0 1 1 0 0 0.5 1 0 0
Summary information about channels (particular bilateral, multilateral)
1 1 1 0.5 0 1 0.5 0 1 0
Proportion as loans and grants 1 1 1 1 1 1 0.5 1 0 0
Proportion or amount to LDCs, SIDS and Africa 0 0 0.5 0 0 0 1 0 0 0
Proportion to global regions 1 0 0.5 0 1 0 0 1 0 0
Proportion to adaptation and mitigation 1 0 1 0.5 1 1 0.5 0 0.5 0
Annual historical climate funding 0 0 0 0 0 0 0 0 0 0
Accessible organisation of data 0.5 0 1 0.5 0 1 0.5 0.5 0.5 0
Baselines, ‘fair share’, and allocation criteria defined 67% 67% 67% 17% 33% 0% 17% 50% 17% 0%
Clarity of baseline definition 1 1 1 0.5 0 0 0 1 0 0
Indication of how ‘fair share’ is calculated 0.5 0.5 0 0 0 0 0 0 0 0
Clear allocation rationale 0.5 0.5 1 0 1 0 0.5 0.5 0.5 0
Project level data 59% 59% 18% 50% 32% 32% 27% 14% 23% 0%
All project are reported 1 1 0 1 0.5 0 0 0 0 0
Amount committed to projects listed 1 1 0.5 1 0.5 0.5 0.5 0.5 0.5 0
Amount actually disbursed (status) 1 0 0 1 0.5 0 0 0 0 0
Start date/commitment of project 0 0.5 0 0 0 0.5 0.5 0 0 0
Description of the project listed 0 0.5 0 0 0.5 0.5 0 0 0.5 0
Grant/loan 1 1 0.5 1 0.5 0.5 0.5 0 0.5 0
Implementing agencies 0 1 0.5 1 0 0.5 0.5 0.5 0.5 0
Accessible database (PDF, searchable) 0.5 0.5 0 0 0.5 0.5 0.5 0.5 0 0
Adaptation or mitigation 1 1 0 0.5 0.5 0.5 0.5 0 0 0
Georeferenced location 0.5 0 0.5 0 0 0 0 0 0 0
Links to full project documents 0.5 0 0 0 0 0 0 0 0.5 0
Total count (of 24) 16 12.5 12 10.5 9.5 9.5 9 8.5 7 0
Fast-start finance transparency scorecard
This online-only addition to the briefing gives full details of the transparency scorecard summarised in Table 2.

Download the pdf at http://pubs.iied.org/17141IIED
This addendum to the briefing, Eight unmet promises of fast-
start climate finance, assesses newly announced fast-start
finance commitments for 2010–2012 provided by the United
States Department of State and the United Kingdom Department
for International Development. These figures were provided after
the briefing had already gone to press. These two new figures
raise the sum of committed fast-start finance to $US25.9 billion
of the $30 billion pledged in Copenhagen in 2009.1
Fast-start climate finance was a collective commitment, but
the core principle of the UN Framework Convention on Climate
Change is that Parties should address the problem according
to their “common but differentiated responsibilities and
respective capabilities” (CBDR and RC). We set out to estimate
what each contributor owed, based on their responsibility for
climate change (the past half century of cumulative emissions,
representing common but differentiated responsibilities) and their
Gross Domestic Product (representing respective capabilities).
Both sets of data are derived from the World Bank website. We
here provide both indicators separately, and a combined fair-
share percentage (the average of the two), for readers to evaluate
performance based upon the “burden sharing principle” they
endorse. Our position is that both are parts of the convention,
and so both should be considered.
The United States. The United States has now committed
US$7.5 billion in fast start finance for 2010–2012. This
includes US$4.7 billion in Congressionally appropriated funds
that qualify as Official Development Assistance (ODA), as well
as US$2.7 billion from United States development finance
and export credit agencies with missions to help American
businesses expand into international markets. Even with the new
commitments, the United States has committed less than two-
thirds (62 per cent) of the money that it should provide, based
on its role as a climate polluter and the size of its economy. This
is what we call its ‘fair share’ commitment, which we calculate
should be US$12.1 billion of the total US$30 billion. If one
counts only what qualifies as ODA, the United States is providing
well under half of its fair share, at 39 per cent. The United
States has committed 19 per cent of its funds for adaptation; 2
per cent of its funds to the United Nations climate funds; and 63
per cent of its funds as grants.
The United Kingdom. The United Kingdom has now committed
US$2.4 billion (GBP1.5 billion) in fast-start finance for
2010–2012. This funding appears to all qualify as ODA, but the
proportion delivered as loans is not clear from the new report.
With this new funding, the United Kingdom has provided 143
per cent of its fair share, when considering responsibility for the
problem of climate change, and financial capability. One-third
(33 per cent) is allocated for projects and programmes assisting
developing countries to adapt to climate change. Only 2.7 per
cent has been channelled through United Nations climate funds
such as the Adaptation Fund, the Least Developed Countries
Fund and the Special Climate Change Fund. The UK gave two-
thirds of its overall fast-start finance funding through multilateral
channels, especially the World Bank administered Climate
Investment Funds (CIFs).
See the Table overleaf for full details.
Addendum, 28 November 2012Eight unmet promises of fast-start climate finance
David Ciplet, Spencer Fields, Keith Madden, Mizan Khan and Timmons Roberts
Assessing new commitments of the United States and United Kingdom
1 As specified in the briefing, “Actors including the European Union, United States, Canada and New Zealand have indicated that they will make additional fast start contributions by the end of the period.” In particular, our report specified that, “Three countries have proposed specific additional contributions to be made by the end of the period: the EU US$3.6 billion; Canada US$235 million; and New Zealand US$48.8 million.” But these actors had yet to commit these funds and thus are not included in the total fast-start figure at this time.

Download the pdf at http://pubs.iied.org/17141IIED
Fast-start finance, November 2012 updates United States final fast start figures (US$ million)
United Kingdom final fast-start figures (GBP million)
United Kingdom final-fast start figures (US$ million)
Total committed 7,457.8 1,500.3 2,400
Fair share based on responsibility (CBDR, mTons
CO2)*
13,684 1,049.9 1,679.8
Percentage of total responsibility among all fast-
start finance contributors
45.6% 5.6% 5.6%
Percentage of responsibility fair share (CBDR)
committed
54.5% 142.9% 142.9%
Fair share based on capability (RC, GDP/capita
2011)
10,554 1,062.4 1,700.3
Percentage of total capability among fast-start
finance contributors
35.2% 5.7% 5.7%
Percentage of capability fair share (RC) committed
70.7% 141.2% 141.2%
Average fair share (based on CBDR+RC) 12,119 1,056.3 1,690
Percentage of total capability and responsibility of
fast-start finance group
40.4% 5.7% 5.6%
CBDR+RC fair share of total fast-start finance committed
61.5% 142.1% 142.1%
Total for adaptation 1,395.8 490 784
Percentage for adaption 18.7% 32.7% 32.7%
Total in grants 4,717.5 Not reported Not reported
Total percentage of funds in grants 63.2% Not reported Not reported
Committed to UN funds 120† 40 64
Percentage to UN funds 1.6% 2.7% 2.7%
Addendum Table: Final United States and United Kingdom fast-start finance figures, updated November 28, 2012
*Responsibility score is based on cumulative emissions of CO2 from 1960–2008, the latest year official data is available. Source: World Bank website.† This figure has been provided by the United States as an upper end estimate, but it has yet to be decided