The Efficient Market Hypothesis Department of Banking and Finance SPRING 200 7 -0 8 by Asst. Prof....
48
The Efficient Market Hypothesis Department of Banking and Finance SPRING 2007-08 by Asst. Prof. Sami Fethi
-
Upload
drusilla-jenkins -
Category
Documents
-
view
216 -
download
0
Transcript of The Efficient Market Hypothesis Department of Banking and Finance SPRING 200 7 -0 8 by Asst. Prof....

The Efficient Market Hypothesis
Department of Banking and Finance
SPRING 2007-08
by
Asst. Prof. Sami Fethi
2 Investment Management © 2005, Sami Fethi, EMU, All Right Reserved.
Ch 8: EMH
Efficient Market Hypothesis (EMH)Efficient Market Hypothesis (EMH)
What is meant by efficiency?– Efficiency means if security prices rationally reflect
available information.
What is meant by efficiency market Hypothesis? – This means that if new information is revealed about a
firm, it will be incorporated into the share price rapidly and rationally wrt the direction of the share price movement and the size of that movement.
Do security prices reflect information ?– This means that there exists a random walk effect.

3 Investment Management © 2005, Sami Fethi, EMU, All Right Reserved.
Ch 8: EMH
Efficient Market Hypothesis (EMH)-DefinitionEfficient Market Hypothesis (EMH)-Definition
Efficient market hypothesis: the notion that stocks fully reflect all available information or prices of securities fully reflect available information about securities.
The efficient market hypothesis (EMH) holds that a stock market is efficient if the market price of a company’s shares (or the financial securities, such as bonds), rapidly and correctly reflects all relevant information as it becomes available (Lumby 1992:352).

4 Investment Management © 2005, Sami Fethi, EMU, All Right Reserved.
Ch 8: EMH
Efficient Market Hypothesis (EMH)-DefinitionEfficient Market Hypothesis (EMH)-Definition
Fama (1970) defines efficiency as “prices always fully reflect available information” and he explains some sufficient conditions for efficiency:
There are no transaction costs in trading securities All market participants can obtain costless
information All agree on the implications of current information
for the current price and distributions of future price of each security.
The efficient market means that the prices of stocks and commodities follow a random walk.
5 Investment Management © 2005, Sami Fethi, EMU, All Right Reserved.
Ch 8: EMH
Random Walk and the EMHRandom Walk and the EMH
• Random walk theory asumes the current price of a security reflects all available information. Only the arrival of new information will cause the price to change. And it asumes that succesive one – period price changes are both independent and identically distributed (Fama 1970 p 383 – 390). Random Walk - stock prices are random
Expected price is positive over timePositive trend and random about the trend

6 Investment Management © 2005, Sami Fethi, EMU, All Right Reserved.
Ch 8: EMH
Security Security PricesPrices
TimeTime
Random Walk with Positive TrendRandom Walk with Positive Trend
7 Investment Management © 2005, Sami Fethi, EMU, All Right Reserved.
Ch 8: EMH
Why are price changes random?– Prices react to information– Flow of information is random– Therefore, price changes are random– It will only change if new information arises– Successive price changes will be independent and prices
follow a random walk cause the next piece of news will be independent of the last piece of news
– Shareholders are never sure whether the next item of relevant information is going to be good or bad.
Random Price ChangesRandom Price Changes
8 Investment Management © 2005, Sami Fethi, EMU, All Right Reserved.
Ch 8: EMH
Competition as a source of EfficiencyCompetition as a source of Efficiency
Stock prices fully and accurately reflect publicly available information
Once information becomes available, market participants analyze it
Competition assures prices reflect information

9 Investment Management © 2005, Sami Fethi, EMU, All Right Reserved.
Ch 8: EMH
Forms of the EMHForms of the EMH Weak Semi-strong Strong
Strong Form
Efficiency
Semi-Strong Form Efficiency
Weak Form Efficiency

10 Investment Management © 2005, Sami Fethi, EMU, All Right Reserved.
Ch 8: EMH
Weak-form EfficiencyWeak-form Efficiency
It is based on forecast future by past returns. How well do past returns predict future returns? It is restricted only to historical prices. If market is weak-form efficient, it might not possible to obtain mispriced securities by analysing their past prices. Stock prices do follow a random walk.
11 Investment Management © 2005, Sami Fethi, EMU, All Right Reserved.
Ch 8: EMH
Semi-strong form EfficiencySemi-strong form Efficiency:: • It is based on all publicly available information
incorporated into stock prices to obtain profits in a stock market. How quickly do security prices reflect public information announcements? So it covers past price movements, earning and dividend announcements, right issues, technological breakthroughs, and so on. It indicates that it is not possible to outperform the market average return except by chance.

12 Investment Management © 2005, Sami Fethi, EMU, All Right Reserved.
Ch 8: EMH
Strong-Form EfficiencyStrong-Form Efficiency
It is based on all publicly available information, reflected in stock prices. Do any investors have private information that is not fully reflected in market prices? It considers both public and private information and it focuses on insider dealing. According to strong-form even insiders are unable to obtain abnormal profits.

13 Investment Management © 2005, Sami Fethi, EMU, All Right Reserved.
Ch 8: EMH
Forms of the EMH-BrieflyForms of the EMH-Briefly
(a) Past prices – Weak form. (b) All public information – Semi-Strong
Form. - past prices, news, etc. (c) All information including inside
information – Strong Form.

14 Investment Management © 2005, Sami Fethi, EMU, All Right Reserved.
Ch 8: EMH
The form of EMH-EvidenceThe form of EMH-Evidence
up to now, all of the study have shown that in a stock market there is a big probability to obtain efficient in the weak-form sense. Most of the evidence prove that it is possible to obtain semi-strong efficient in stock market even it is not easy as weak-form efficient. But many studies have shown that it is difficult to obtain strong form efficient in stock market.

15 Investment Management © 2005, Sami Fethi, EMU, All Right Reserved.
Ch 8: EMH
Supportive Evidence of EMHSupportive Evidence of EMH Weak form of EMH is supported by the data.-
Source: R. Brealey and S. Myers, Principles of Corporate Finance.
Semi-strong form of EMH is generally supported by the data.-Source: A. Keown and J. Pinkerton, Journal of Finance (1981).
Strong-form of EMH has mixed evidence-Source: M. Jensen, “Risks, the Pricing of Capital Assets, and the Evaluation of Investment Performance.” Journal of Business (April 1969).

16 Investment Management © 2005, Sami Fethi, EMU, All Right Reserved.
Ch 8: EMH
Types of Stock AnalysisTypes of Stock Analysis
Technical Analysis - using prices and volume information to predict future prices– Weak form efficiency & technical analysis
Fundamental Analysis - using economic and accounting information to predict stock prices– Semi strong form efficiency & fundamental analysis
17 Investment Management © 2005, Sami Fethi, EMU, All Right Reserved.
Ch 8: EMH
Active Management– Security analysis– Timing
Passive Management– Buy and Hold– Index Funds
Implications of Efficiency for Active or Implications of Efficiency for Active or Passive ManagementPassive Management

18 Investment Management © 2005, Sami Fethi, EMU, All Right Reserved.
Ch 8: EMH
Active and passive ManagementActive and passive Management Proponents of the EMH believe active management
is largely wasted effort and unlikely to justify the expenses incurred. A passive strategy aims only at establishing a well-diversified portfolio of securities without attempting to find under or overvalued stock. Given all available information, the EMH indicates stock prices are at fair levels so that it makes no sense to buy and sell securities frequently as transactions generate large trading costs without increasing expected performance.

19 Investment Management © 2005, Sami Fethi, EMU, All Right Reserved.
Ch 8: EMH
Active and passive ManagementActive and passive Management
One common strategy for passive management is to create an index fund which is a fund designed to replicate the performance of a broad-based index of stocks
i.e., a mutual fund called the index 500 portfolio that holds stocks in direct proportion to their weight in the Standard & Poor’s 500 stock price index so the performance of the index 500 fund replicates the performance of the S&P 500.

20 Investment Management © 2005, Sami Fethi, EMU, All Right Reserved.
Ch 8: EMH
Even if the market is efficient, a role exists for portfolio management
Appropriate risk level Tax considerations Other considerations
Market Efficiency and Portfolio Market Efficiency and Portfolio ManagementManagement

21 Investment Management © 2005, Sami Fethi, EMU, All Right Reserved.
Ch 8: EMH
Event studiesAssessing performance of professional
managersTesting some trading rule
Empirical Tests of Market EfficiencyEmpirical Tests of Market Efficiency

22 Investment Management © 2005, Sami Fethi, EMU, All Right Reserved.
Ch 8: EMH
1. Examine prices and returns over time
How Tests Are StructuredHow Tests Are Structured

23 Investment Management © 2005, Sami Fethi, EMU, All Right Reserved.
Ch 8: EMH
00 +t+t-t-t
Announcement DateAnnouncement Date
Returns Surrounding the Event

24 Investment Management © 2005, Sami Fethi, EMU, All Right Reserved.
Ch 8: EMH
2. Returns are adjusted to determine if they are abnormalMarket Model approach
a. Rt = at + btRmt + et
(Expected Return)
b. Excess Return = (Actual - Expected)
et = Actual - (at + btRmt)
How Tests Are Structured (cont.)How Tests Are Structured (cont.)
25 Investment Management © 2005, Sami Fethi, EMU, All Right Reserved.
Ch 8: EMH
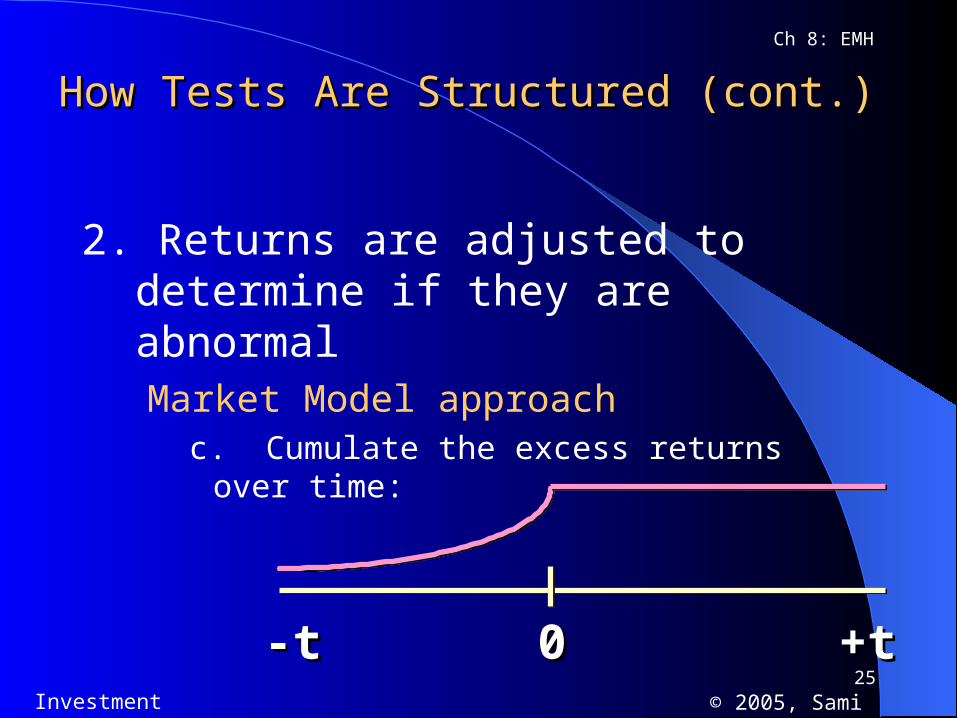
2. Returns are adjusted to determine if they are abnormalMarket Model approach
c. Cumulate the excess returns over time:
00 +t+t-t-t
How Tests Are Structured (cont.)How Tests Are Structured (cont.)

26 Investment Management © 2005, Sami Fethi, EMU, All Right Reserved.
Ch 8: EMH
To discuss empirical tests of hypothesis, the following factors should be taken into account:
Magnitude IssueSelection Bias IssueLucky Event Issue
Issues in Examining the ResultsIssues in Examining the Results
27 Investment Management © 2005, Sami Fethi, EMU, All Right Reserved.
Ch 8: EMH
Tests of Weak FormTests of Weak Form
Returns over short horizons– Very short time horizons small magnitude of
positive trends– 3-12 month some evidence of positive
momentum Returns over long horizons – pronounced negative
correlation Evidence on Reversals

28 Investment Management © 2005, Sami Fethi, EMU, All Right Reserved.
Ch 8: EMH
Small Firm Effect (January Effect)Neglected FirmMarket to Book RatiosPost-Earnings Announcement DriftHigher Level Correlation in Security Prices
Tests of Semi-strong Form: AnomaliesTests of Semi-strong Form: Anomalies

29 Investment Management © 2005, Sami Fethi, EMU, All Right Reserved.
Ch 8: EMH
Implications of Test ResultsImplications of Test Results
Risk Premiums or market inefficienciesAnomalies or data miningBehavioral Interpretation
– Inefficiencies exist– Caused by human behavior

30 Investment Management © 2005, Sami Fethi, EMU, All Right Reserved.
Ch 8: EMH
Behavioral PossibilitiesBehavioral Possibilities
Forecasting ErrorsOverconfidenceRegret avoidanceFraming and mental accounting errors
31 Investment Management © 2005, Sami Fethi, EMU, All Right Reserved.
Ch 8: EMH
Mutual Fund and Professional Manager Mutual Fund and Professional Manager PerformancePerformance
Some evidence of persistent positive and negative performance
Potential measurement error for benchmark returns– Style changes– May be risk premiums
Superstar phenomenon

32 Investment Management © 2005, Sami Fethi, EMU, All Right Reserved.
Ch 8: EMH

33 Investment Management © 2005, Sami Fethi, EMU, All Right Reserved.
Ch 8: EMH
Market ReactionMarket Reaction In the figure, the red line shows an efficient market response
to a car company’s announcement of an electrical car. The share price on the vertical line instantaneously adjust to the new level. However, there are four other possibilities if we relax the the efficiency assumption. First, the market could take a long time to absorb this information i.e., under reaction and it could be only after the 30th day that the share price approaches the new efficiency level. This shown the area between 0 and 30 days. Secondly, the market could anticipated the news announcement- Perhaps there have been leaks to press for the past to weeks. In this case, the share price starts to rise before the announcement. A third possibility is that the market overreacts to the new information; the bubble deflates over the next few days. Finally, the market may fail to get the pricing right at all and shares may continue to be under-priced for a considerable period between 0 and 30 days.

34 Investment Management © 2005, Sami Fethi, EMU, All Right Reserved.
Ch 8: EMH
Weak-form Efficiency
Exploiting predictable patterns in price movements
35 Investment Management © 2005, Sami Fethi, EMU, All Right Reserved.
Ch 8: EMH
Weak-form Efficiency
Prices reflect anything past prices say about likely future prices.
Predictable price movements unrelated to risk would be eliminated by investors buying at troughs and selling at peaks.

36 Investment Management © 2005, Sami Fethi, EMU, All Right Reserved.
Ch 8: EMH
Weak-form Efficiency
Pt =Pt-1 – Rt εt , where
Expected Return Rt over (t-1,t) (excluding dividends), which Could depend on past prices, but is known at t-1; while
εt Reflects New information after t-1, and is uncorrelated with all functions of P–i, i> 0.

37 Investment Management © 2005, Sami Fethi, EMU, All Right Reserved.
Ch 8: EMH
Tests of weak-form efficiency
Recent work in financial economics has focused on modeling predictable patterns in variances and covariances (for example using the ARCH model). These could be consistent with EMH if the patterns are risky to exploit and the apparent excess returns merely compensate for increased risk.

38 Investment Management © 2005, Sami Fethi, EMU, All Right Reserved.
Ch 8: EMH
Tests of semistrong-form efficiency
Pt – Pt-1 equals the capital gain over the period (t–1,t), and if dividends in (t–1,t) are zero, then equation (1) becomes:
. Rt =Rt +εt

39 Investment Management © 2005, Sami Fethi, EMU, All Right Reserved.
Ch 8: EMH
General formulaGeneral formula

40 Investment Management © 2005, Sami Fethi, EMU, All Right Reserved.
Ch 8: EMH
Theory of Rational ExpectationsTheory of Rational Expectations
Definition:
Rational expectation (RE) = Expectation that is optimal forecast (best prediction of future) using all available information:
i.e., RE
Xe = Xof = Et [ X | t ]
41 Investment Management © 2005, Sami Fethi, EMU, All Right Reserved.
Ch 8: EMH
Rational Expectations (cont…)Rational Expectations (cont…)
2 reasons Expectations may not be rational– Not best prediction
– Not using available information
Rational expectation, although optimal prediction, may not be accurate
Rational expectations makes sense because is costly not to have optimal forecast
42 Investment Management © 2005, Sami Fethi, EMU, All Right Reserved.
Ch 8: EMH
Rational Expectations (cont…)Rational Expectations (cont…)
Implications:
1. If there is a change in the way a variable moves, then the way expectations are formed also changes
2. Forecast errors on average = 0 and are not predictable

43 Investment Management © 2005, Sami Fethi, EMU, All Right Reserved.
Ch 8: EMH
Efficient Markets HypothesisEfficient Markets Hypothesis
Pt+1
– Pt + C
RET =P
t
Pet+1
– Pt + C
RETe =P
t
Rational Expectations implies:
Pet+1
= Poft+1
RETe = RETof (1)
Market equilibrium
RETe = RET* (2)

44 Investment Management © 2005, Sami Fethi, EMU, All Right Reserved.
Ch 8: EMH
Efficient Markets HypothesisEfficient Markets Hypothesis
Put (1) and (2) together:
Efficient Markets Hypothesis
RETof = RET*

45 Investment Management © 2005, Sami Fethi, EMU, All Right Reserved.
Ch 8: EMH
Why the Efficient Markets Hypothesis Why the Efficient Markets Hypothesis makes sensemakes sense
If RETof > RET* Pt , RETof
If RETof < RET* Pt , RETof
until RETof = RET*Note:1. All unexploited profit opportunities eliminated
2. Efficient Market holds even if are uninformed, irrational participants in market

46 Investment Management © 2005, Sami Fethi, EMU, All Right Reserved.
Ch 8: EMH
Evidence on Efficient Markets HypothesisEvidence on Efficient Markets Hypothesis
Favorable Evidence
1. Investment analysts and mutual funds don’t beat the market
2. Stock prices reflect publicly available information: anticipated announcements don’t affect stock price
3. Stock prices and exchange rates close to random walk
If predictions of P big, Rof > R* predictions of P small
4. Technical analysis does not outperform market

47 Investment Management © 2005, Sami Fethi, EMU, All Right Reserved.
Ch 8: EMH
Evidence on Efficient Markets Evidence on Efficient Markets HypothesisHypothesis
Unfavorable Evidence
1. Small-firm effect: small firms have abnormally high returns
2. January effect: high returns in January
3. Market overreaction
4. Excessive volatility
5. Mean reversion
6. New information is not always immediately incorporated into stock prices
48 Investment Management © 2005, Sami Fethi, EMU, All Right Reserved.
Ch 8: EMH
The EndThe End
Thanks