THE EFFICACY OF PARK BRANDING IN INFLUENCING CHOICE ...
253
i THE EFFICACY OF PARK BRANDING IN INFLUENCING CHOICE BEHAVIOR OF TOURISTS TO KENYAN PARKS MR. SHEM WAMBUGU MAINGI H87/11076/2008 A THESIS SUBMITTED IN FULFILMENT OF THE REQUIREMENTS FOR THE AWARD OF THE DEGREE OF DOCTOR OF PHILOSOPHY IN TOURISM MANAGEMENT THE SCHOOL OF HOSPITALITY AND TOURISM OF KENYATTA UNIVERSITY AUGUST 2014
Transcript of THE EFFICACY OF PARK BRANDING IN INFLUENCING CHOICE ...
i
THE EFFICACY OF PARK BRANDING IN INFLUENCING
CHOICE BEHAVIOR OF TOURISTS TO KENYAN PARKS
MR. SHEM WAMBUGU MAINGI
H87/11076/2008
A THESIS SUBMITTED IN FULFILMENT OF THE
REQUIREMENTS FOR THE AWARD OF THE DEGREE OF
DOCTOR OF PHILOSOPHY IN TOURISM MANAGEMENT THE
SCHOOL OF HOSPITALITY AND TOURISM OF KENYATTA
UNIVERSITY
AUGUST 2014

ii
DECLARATION
This thesis is my original work and has not been presented for a Degree in any other
University.
Signature: _________________________ Date: _________________________
Shem Wambugu Maingi
H87/11076/2008
I/We confirm that the work in this thesis was done by the candidate under my/our
supervision
Signature: _________________________ Date: _________________________
Dr. Alice Ondigi
Senior Lecturer, School of Hospitality and Tourism,
Kenyatta University.
Signature: _________________________ Date: _________________________
Dr. Joe Kibuye Wadawi
Senior Lecturer, Institute of Tourism and Hospitality Management
Strathmore University.
Signature: _________________________ Date: _________________________
Dr. Delno Tromp
Lecturer, Department of Tourism Management,
Kenyatta University.
iii
DEDICATION
This thesis is dedicated to My treasured Son, Lewis Maingi Wambugu for the
inspiration and an illuminating source of happiness in this journey, My dear wife
Susan Wanjiku Wambugu for being by my side throughout the moments in this
journey, My beloved parents Joseph Kuira Maingi and Elizabeth Wahito Maingi for
educating me in my early years and instilling a source of discipline and courage that
has carried me throughout the years, as well as My twin-brother, Donald Kuira
Maingi for being a mentor and close-friend, that was valuable addition to me as I
pursued this PhD.
In all, you have been with me through this journey.
God Bless You.
iv
ACKNOWLEDGEMENT
In the course of the preparation and completion of this study, many people assisted,
encouraged and cooperated with me for which I am entirely appreciative. I wish to
recognize with earnest efforts and works of my supervisors, Dr. Alice Ondigi, Dr.
Joseph Wadawi and Dr. Delno Tromp. The completion of this thesis would not have
been possible without their invaluable support, guidance and mentorship. I am deeply
indebted by their constructive criticisms and focus in the course of this study.
I thank the Kenya Wildlife Service, particularly the former Director, Dr. Julius
King‟etich and Dr. Samuel Kasiki (Deputy Director, Biodiversity Research and
Monitoring - KWS) for their support in the course of this study. I am specifically
grateful to the Senior Wardens of Hell‟s Gate National Park, Nairobi National Park,
Lake Nakuru National Park and the Aberdares National Park for their facilitation and
support in the study. I would like to acknowledge the efforts of my field assistants. I
wish to also acknowledge my colleagues and friends Mr. Joseph Kurauka, field
assistants Mr. William Githiomi and Ms Betty Mwangi.
v
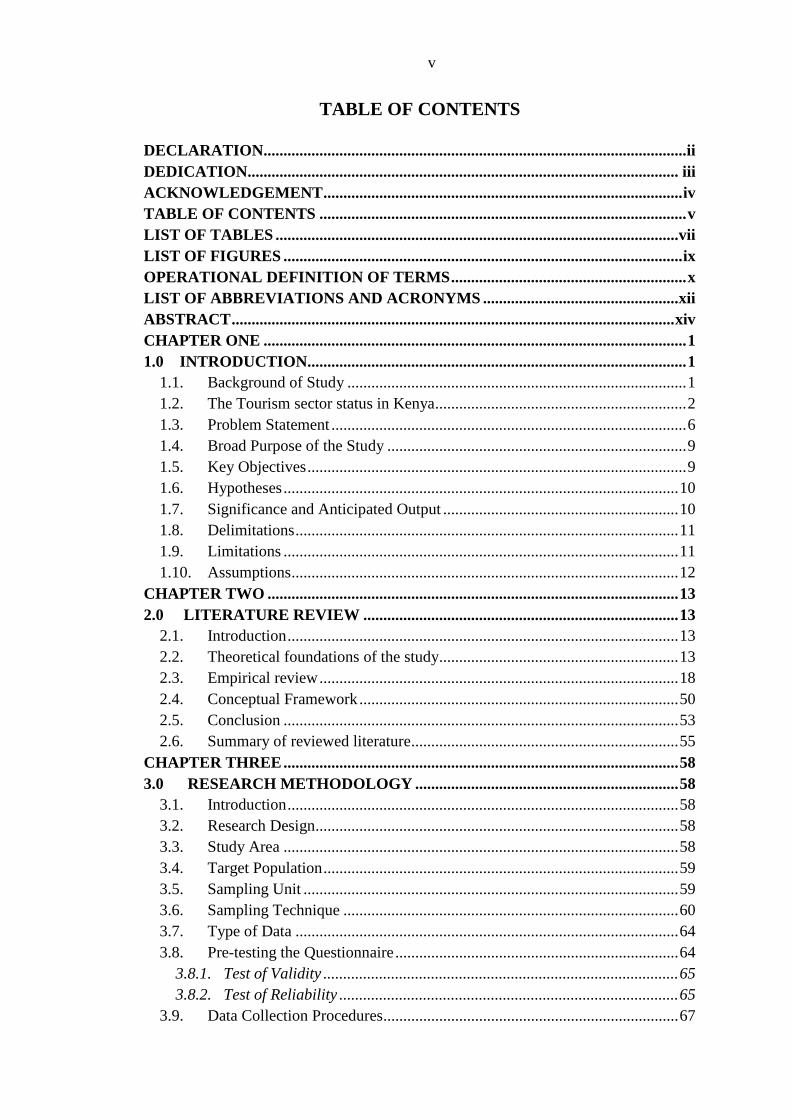
TABLE OF CONTENTS
DECLARATION.......................................................................................................... ii
DEDICATION............................................................................................................ iii
ACKNOWLEDGEMENT .......................................................................................... iv
TABLE OF CONTENTS ............................................................................................ v
LIST OF TABLES ..................................................................................................... vii
LIST OF FIGURES .................................................................................................... ix
OPERATIONAL DEFINITION OF TERMS ........................................................... x
LIST OF ABBREVIATIONS AND ACRONYMS ................................................. xii
ABSTRACT ............................................................................................................... xiv
CHAPTER ONE .......................................................................................................... 1
1.0 INTRODUCTION............................................................................................... 1
1.1. Background of Study ..................................................................................... 1
1.2. The Tourism sector status in Kenya............................................................... 2
1.3. Problem Statement ......................................................................................... 6
1.4. Broad Purpose of the Study ........................................................................... 9
1.5. Key Objectives ............................................................................................... 9
1.6. Hypotheses ................................................................................................... 10
1.7. Significance and Anticipated Output ........................................................... 10
1.8. Delimitations ................................................................................................ 11
1.9. Limitations ................................................................................................... 11
1.10. Assumptions ................................................................................................. 12
CHAPTER TWO ....................................................................................................... 13
2.0 LITERATURE REVIEW ............................................................................... 13
2.1. Introduction .................................................................................................. 13
2.2. Theoretical foundations of the study............................................................ 13
2.3. Empirical review .......................................................................................... 18
2.4. Conceptual Framework ................................................................................ 50
2.5. Conclusion ................................................................................................... 53
2.6. Summary of reviewed literature................................................................... 55
CHAPTER THREE ................................................................................................... 58
3.0 RESEARCH METHODOLOGY .................................................................. 58
3.1. Introduction .................................................................................................. 58
3.2. Research Design........................................................................................... 58
3.3. Study Area ................................................................................................... 58
3.4. Target Population ......................................................................................... 59
3.5. Sampling Unit .............................................................................................. 59
3.6. Sampling Technique .................................................................................... 60
3.7. Type of Data ................................................................................................ 64
3.8. Pre-testing the Questionnaire ....................................................................... 64
3.8.1. Test of Validity ......................................................................................... 65
3.8.2. Test of Reliability ..................................................................................... 65
3.9. Data Collection Procedures .......................................................................... 67

vi
3.9.1. Research Instrument ................................................................................ 68
3.9.2. Measurement of Constructs and Variables .............................................. 69
3.10. Ethical Considerations ................................................................................. 72
3.11. Data Analysis Framework............................................................................ 73
3.11.1. Structural Equations Modeling ................................................................ 73
3.11.2. Univariate and Bivariate Statistics .......................................................... 74
3.11.3. One-Way ANOVA..................................................................................... 75
3.11.4. Agglomerative Cluster Analysis ............................................................... 75
3.11.5. Multinomial Logistic Regression ............................................................. 77
3.12. Summary of Analytical Framework ............................................................. 79
CHAPTER FOUR ...................................................................................................... 80
4.2.1.1. Age Profile ....................................................................................... 81
4.2.1.2. Gender Profile .................................................................................. 88
4.2.1.3. Country of Origin ............................................................................. 92
4.2.1.4. Annual Personal Income .................................................................. 96
4.2.1.5. Marital Status ................................................................................. 100
4.2.1.6. Occupation ..................................................................................... 102
4.2.1.7. Preferred Mode of Travel Arrangement ........................................ 104
4.2.1.8. Tourists Travelling with Children .................................................. 105
4.2.1.9. Tourists‟ Highest Level of Education Attained ............................. 107
4.2.1.10. Duration of visit ............................................................................. 108
4.2.1.11. Brand Familiarity ........................................................................... 109
4.2.1.12. Source of Information about Park Brand ....................................... 111
4.2.1.13. Motivation to visit the National Park ............................................. 113
4.3.1. RESULTS FOR OBJECTIVE ONE:....................................................... 115
4.3.2. RESULTS FOR OBJECTIVE TWO: ...................................................... 131
4.3.3. RESULTS FOR OBJECTIVE TWO: ...................................................... 139
4.3.4. RESULTS FOR OBJECTIVE THREE: .................................................. 146
4.3.5. RESULTS FOR OBJECTIVE FOUR: .................................................... 153
4.3.6. STRUCTURAL EQUATIONS MODELLING RESULTS ....................... 156
CHAPTER FIVE ..................................................................................................... 177
5.0 SUMMARY OF FINDINGS, CONCLUSIONS AND
RECOMMENDATIONS ......................................................................................... 177
6.0 REFERENCES ................................................................................................. 189
APPENDIX 1: KWS PERMIT TO CONDUCT RESEARCH ............................ 211
APPENDIX 2: POST-VISIT TOURIST QUESTIONNAIRE ............................. 212
APPENDIX 3: CLUSTER - LEVEL SAMPLING FRAME................................ 219
APPENDIX 4: PARK PROFILES ......................................................................... 220
APPENDIX 5: STATUS OF PARK INITIATIVES ............................................. 235
APPENDIX 5: TOURISTS TO NATURAL ATTRACTIONS ........................... 238
APPENDIX 6: MAP OF STUDY LOCATION..................................................... 239
vii
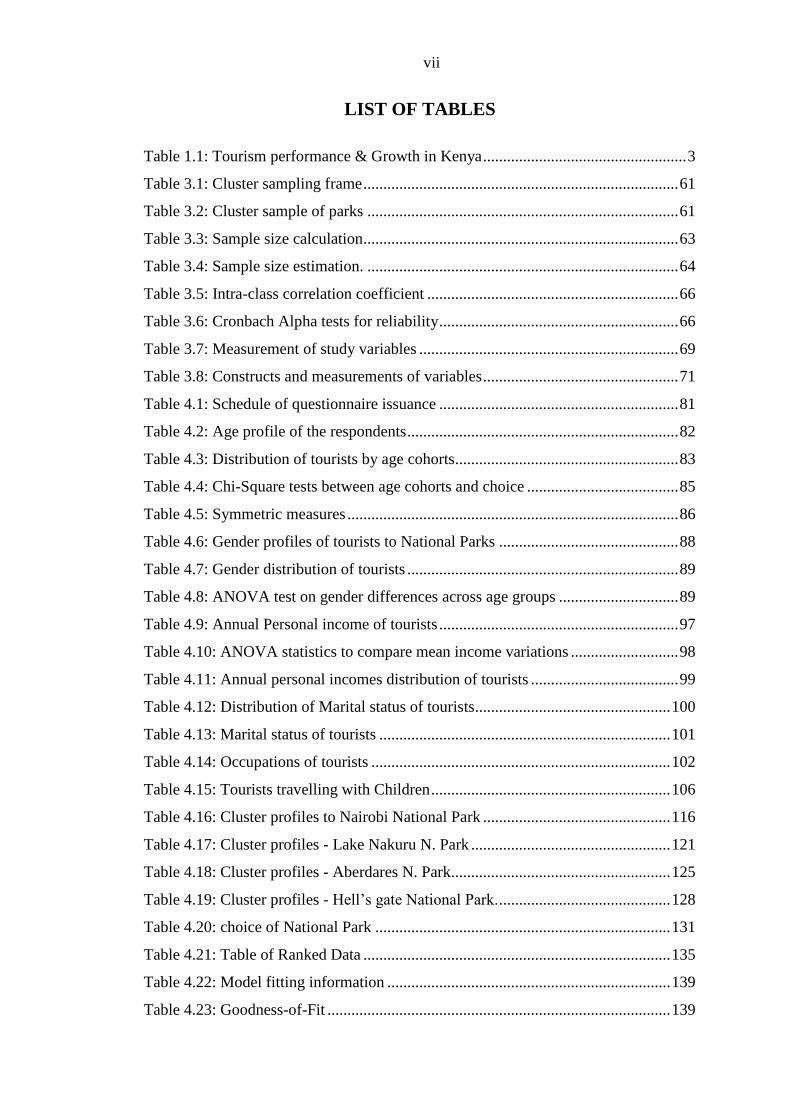
LIST OF TABLES
Table 1.1: Tourism performance & Growth in Kenya ................................................... 3
Table 3.1: Cluster sampling frame ............................................................................... 61
Table 3.2: Cluster sample of parks .............................................................................. 61
Table 3.3: Sample size calculation ............................................................................... 63
Table 3.4: Sample size estimation. .............................................................................. 64
Table 3.5: Intra-class correlation coefficient ............................................................... 66
Table 3.6: Cronbach Alpha tests for reliability ............................................................ 66
Table 3.7: Measurement of study variables ................................................................. 69
Table 3.8: Constructs and measurements of variables ................................................. 71
Table 4.1: Schedule of questionnaire issuance ............................................................ 81
Table 4.2: Age profile of the respondents .................................................................... 82
Table 4.3: Distribution of tourists by age cohorts........................................................ 83
Table 4.4: Chi-Square tests between age cohorts and choice ...................................... 85
Table 4.5: Symmetric measures ................................................................................... 86
Table 4.6: Gender profiles of tourists to National Parks ............................................. 88
Table 4.7: Gender distribution of tourists .................................................................... 89
Table 4.8: ANOVA test on gender differences across age groups .............................. 89
Table 4.9: Annual Personal income of tourists ............................................................ 97
Table 4.10: ANOVA statistics to compare mean income variations ........................... 98
Table 4.11: Annual personal incomes distribution of tourists ..................................... 99
Table 4.12: Distribution of Marital status of tourists ................................................. 100
Table 4.13: Marital status of tourists ......................................................................... 101
Table 4.14: Occupations of tourists ........................................................................... 102
Table 4.15: Tourists travelling with Children ............................................................ 106
Table 4.16: Cluster profiles to Nairobi National Park ............................................... 116
Table 4.17: Cluster profiles - Lake Nakuru N. Park .................................................. 121
Table 4.18: Cluster profiles - Aberdares N. Park....................................................... 125
Table 4.19: Cluster profiles - Hell‟s gate National Park. ........................................... 128
Table 4.20: choice of National Park .......................................................................... 131
Table 4.21: Table of Ranked Data ............................................................................. 135
Table 4.22: Model fitting information ....................................................................... 139
Table 4.23: Goodness-of-Fit ...................................................................................... 139

viii
Table 4.24: Pseudo R-Square ..................................................................................... 140
Table 4.25: Likelihood Ratio Tests ............................................................................ 140
Table 4.26: Choice of Nairobi National Park ............................................................ 142
Table 4.27: Choice of Hell‟s Gate National Park ...................................................... 144
Table 4.28: Choice of Lake Nakuru National Park.................................................... 145
Table 4.29: ANOVA tests of differences in tourist perceptions ................................ 147
Table 4.30: Test for Homogeneity of Variances ........................................................ 148
Table 4.31: Test of Homogeneity of Variances (sample = 358) ................................ 149
Table 4.32: ANOVA test ........................................................................................... 150
Table 4.33: Regression Results - Hell‟s gate N.P. ..................................................... 151
Table 4.34: Regression Results - Lake Nakuru N.P. ................................................. 152
Table 4.35: Regression Results - Nairobi N.P. .......................................................... 152
Table 4.36: Regression Results - Aberdares N.P. ...................................................... 153
Table 4.37: Regression Results - Lake Nakuru N.P. ................................................. 154
Table 4.37: Regression Results - Nairobi N.P. .......................................................... 154
Table 4.38: Regression Results - Hell‟s Gate N.P. .................................................... 155
Table 4.39: Regression Results - Aberdares N.P. ...................................................... 155
Table 4.40: Goodness-of-fit indices ........................................................................... 157
Table 4.41: Lake Nakuru N.P brand personality ....................................................... 159
Table 4.42: Measurement model Regression results ................................................. 160
Table 4.43: Measurement model Regression ............................................................. 161
Table 4.44: Structural Equation Model Regression results ....................................... 161
Table 4.44: Model Goodness-of-fit indices ............................................................... 162
Table 4.45: Brand Personality Measurement model .................................................. 164
Table 4.46: Brand perception measurement model ................................................... 165
Table 4.47: S.E.M structural model ........................................................................... 166
Table 4.48: Model Goodness-of-fit indices ............................................................... 167
Table 4.49: Measurement model of Brand Personality ............................................. 169
Table 4.50: Measurement model of Brand perception............................................... 170
Table 4.51: S.E.M Structural model .......................................................................... 171
Table 4.52: Goodness of fit indices ........................................................................... 172
Table 4.53: Regression Weights ................................................................................ 174
Table 4.54: Regression Weights: ............................................................................... 174
Table 4.55: Structural model...................................................................................... 175

ix
LIST OF FIGURES
Figure 1.1: Tourism statistics in Kenya (1983-2009) .................................................... 4
Figure 4.1: Cross-tabulation of Park choice and continent of origin ........................... 87
Figure 4.2: Cross-tabulation of Age and Sex distribution of tourists .......................... 90
Figure 4.3: Cross-tabulation of Choice, Gender and Origin of tourists ....................... 92
Figure 4.4: Tourists‟ Country of Origin of tourists...................................................... 93
Figure 4.5: Distribution based on country of origin of tourists ................................... 94
Figure 4.6: Distribution based on continent markets ................................................... 95
Figure 4.7: Occupations of tourists ............................................................................ 103
Figure 4.8: Other Occupations of tourists .................................................................. 103
Figure 4.9: Preferred mode of travel arrangement of tourists .................................... 105
Figure 4.10: Tourists‟ highest level of education attainment .................................... 107
Figure 4.11: Tourists‟ duration of visit ...................................................................... 109
Figure 4.12: Park brand familiarity ............................................................................ 110
Figure 4.13: Brand familiarity of competing brands ................................................. 111
Figure 4.14: Primary source of information on park brand ....................................... 113
Figure 4.15: Tourist Market cluster profiling (Nairobi N. Park) ............................... 118
Figure 4.16: Predictor importance to Nairobi N. Park ............................................... 119
Figure 4.17: Dendogram of significant predictors in Nairobi N. Park ...................... 120
Figure 14.18: Tourist cluster profiling (Lake Nakuru National Park) ....................... 122
Figure 4.19: Predictor importance - Lake Nakuru N. Park ........................................ 123
Rescaled Distance Cluster Combine .......................................................................... 124
Figure 4.20: Dendogram - Lake Nakuru N. Park....................................................... 124
Figure 4.21: Tourist Cluster Profiling (Aberdares N. Park) ...................................... 126
Figure 4.22: Predictor importance - Aberdares N. Park ............................................ 127
Figure 4.23: Dendogram - Aberdares N.Park ............................................................ 127
Figure 4.24: Tourist Market cluster profiling (Hell‟s gate N. Park) .......................... 129
Figure 4.25: Predictor importance - Hell‟s Gate N. Park .......................................... 130
Figure 4.26: Dendogram - Hell‟s gate N. Park .......................................................... 130
Figure 4.27: Radar chart of average antecedent factors ............................................. 133
Figure 4.28: AMOS Path diagram - Lake Nakuru N.P. ............................................. 158
Figure 4.29: AMOS Path diagram - Aberdare National Park .................................... 168
Figure 4.30: AMOS Path diagram - Nairobi National Park...................................... 173
Figure 4.33: The study locations within the main circuit connectivity ..................... 239

x
OPERATIONAL DEFINITION OF TERMS
Attraction - A designated protected area which is controlled and managed for the
enjoyment, amusement, entertainment and education of the visiting public.
Brand - It is a competitive identity that makes a product or a service distinctive and
differentiates it from others.
Brand identity - Logo or Totem. Visual mark which is used consistently on all
marketing correspondence as a symbol of the destination.
Brand personality - The destination‟s character which describes the way it is
perceived and reflects people‟s attitudes towards it.
Brand positioning - The position that the brand occupies, or wishes to occupy in the
minds of consumers with relations to the competitors.
Branding - The process of developing a competitive identity and (or) image of a
place (or destination). It involves techniques that are ensure that tourists
perceive the destination at an attractive way.
Choice Behaviour - The resulting post-visit behavioural intentions of tourists on
future choice.
Competitive Identity - Refers to a summation of a destination‟s (or place‟s)
characteristics that make it different and distinctive in the eyes of its potential
tourists.See also Brand.
Efficacy - The effectiveness of park branding in influencing choice behaviour of
tourists.
International Tourists - Any person who travels to a country other than that in which
he has his usual residence but outside his usual environment for a period not
exceeding 12 months and whose main purpose of visit is other than the
exercise of an activity remunerated from the place visited.
xi
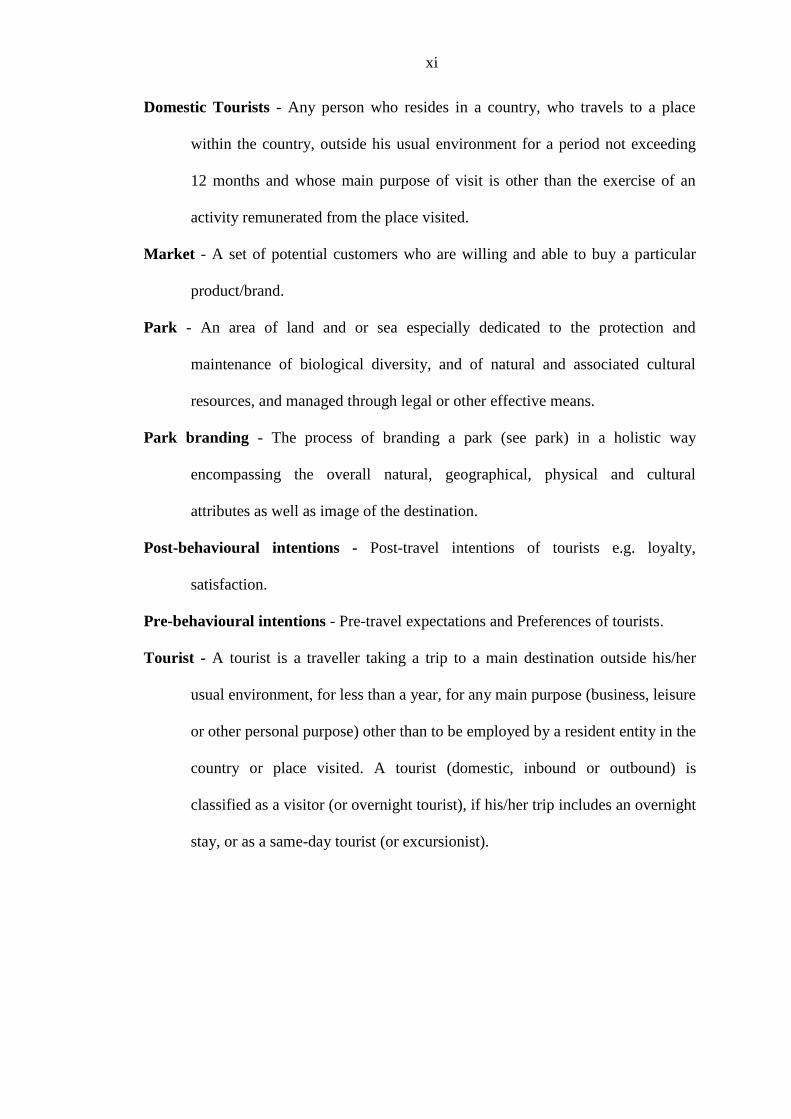
Domestic Tourists - Any person who resides in a country, who travels to a place
within the country, outside his usual environment for a period not exceeding
12 months and whose main purpose of visit is other than the exercise of an
activity remunerated from the place visited.
Market - A set of potential customers who are willing and able to buy a particular
product/brand.
Park - An area of land and or sea especially dedicated to the protection and
maintenance of biological diversity, and of natural and associated cultural
resources, and managed through legal or other effective means.
Park branding - The process of branding a park (see park) in a holistic way
encompassing the overall natural, geographical, physical and cultural
attributes as well as image of the destination.
Post-behavioural intentions - Post-travel intentions of tourists e.g. loyalty,
satisfaction.
Pre-behavioural intentions - Pre-travel expectations and Preferences of tourists.
Tourist - A tourist is a traveller taking a trip to a main destination outside his/her
usual environment, for less than a year, for any main purpose (business, leisure
or other personal purpose) other than to be employed by a resident entity in the
country or place visited. A tourist (domestic, inbound or outbound) is
classified as a visitor (or overnight tourist), if his/her trip includes an overnight
stay, or as a same-day tourist (or excursionist).

xii
LIST OF ABBREVIATIONS AND ACRONYMS
AIC Akaike Information Criteria
AIP All-inclusive Package tours
ANOVA Analysis of Variance
AGFI Adjusted Goodness-of-fit Indices
BPS Brand Personality Scale
BOO Build, Own, Operate
BOT Build, Operate, Transfer
CFA Confirmatory Factor Analysis
CFI Comparative Fit Index
DBFO Design, Build, Finance, Operate
DBPS Destination Brand Personality Scale
DF Degrees of Freedom
ERS Economy Recovery Strategy
ETC European Travel Commission
FIT Free-independent tourists
GDP Gross Domestic Product
GFI Goodness-of-fit Indices
GoK Government of Kenya
HLC Household Life Cycle
HN Hoetler‟s Critical N
HSD Honestly Significance Difference
IBA Important Bird Area
ICC Intra Class Correlation
IFI Incremental Fit Index
IGAD Inter-Governmental Authority on Development in Eastern Africa
ITB International Tourism Bourse
IUCN World Conservation Union
JICA Japan International Cooperation Agency
KATO Kenya Association of Tour Operators
KNBS Kenya National Bureau of Statistics

xiii
KWS Kenya Wildlife Service
LISREL Linear Structural Relationship Language
N. PARK National Park
NESC National Economic and Social Council
NFI Normed Fit Index
NP National Park
PPP Public Private Partnership
RMSEA Root Mean Square Error of Approximation
SD Standard deviation
SE Standard error
SEM Structural Equation Modelling
STMP Sustainable Tourism Master Plan
TANAPA Tanzanian National Parks Authority
TLI Tucker-Lewis Index
TTCI Travel and Tourism Competitive Index
UNDSPD United Nations Division for Social Policy and Development
UNECA United Nations Economic Commission on Africa
USA United States of America
UNWTO United Nations World Tourism Organization
UWA Ugandan Wildlife Authority
WARC World Advertising Research Centre
WEF World Economic Forum
WTO World Trade Organization
WTTC World Travel and Tourism Council
WWF World Wildlife Federation
xiv
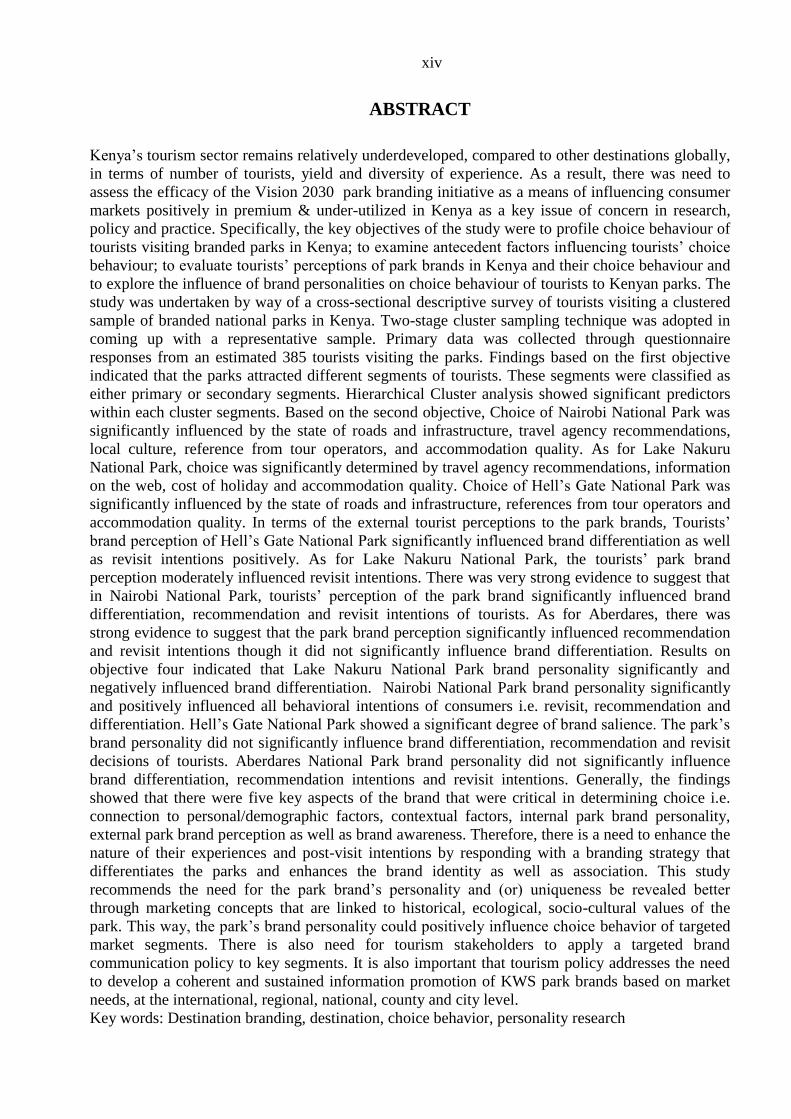
ABSTRACT
Kenya‟s tourism sector remains relatively underdeveloped, compared to other destinations globally,
in terms of number of tourists, yield and diversity of experience. As a result, there was need to
assess the efficacy of the Vision 2030 park branding initiative as a means of influencing consumer
markets positively in premium & under-utilized in Kenya as a key issue of concern in research,
policy and practice. Specifically, the key objectives of the study were to profile choice behaviour of
tourists visiting branded parks in Kenya; to examine antecedent factors influencing tourists‟ choice
behaviour; to evaluate tourists‟ perceptions of park brands in Kenya and their choice behaviour and
to explore the influence of brand personalities on choice behaviour of tourists to Kenyan parks. The
study was undertaken by way of a cross-sectional descriptive survey of tourists visiting a clustered
sample of branded national parks in Kenya. Two-stage cluster sampling technique was adopted in
coming up with a representative sample. Primary data was collected through questionnaire
responses from an estimated 385 tourists visiting the parks. Findings based on the first objective
indicated that the parks attracted different segments of tourists. These segments were classified as
either primary or secondary segments. Hierarchical Cluster analysis showed significant predictors
within each cluster segments. Based on the second objective, Choice of Nairobi National Park was
significantly influenced by the state of roads and infrastructure, travel agency recommendations,
local culture, reference from tour operators, and accommodation quality. As for Lake Nakuru
National Park, choice was significantly determined by travel agency recommendations, information
on the web, cost of holiday and accommodation quality. Choice of Hell‟s Gate National Park was
significantly influenced by the state of roads and infrastructure, references from tour operators and
accommodation quality. In terms of the external tourist perceptions to the park brands, Tourists‟
brand perception of Hell‟s Gate National Park significantly influenced brand differentiation as well
as revisit intentions positively. As for Lake Nakuru National Park, the tourists‟ park brand
perception moderately influenced revisit intentions. There was very strong evidence to suggest that
in Nairobi National Park, tourists‟ perception of the park brand significantly influenced brand
differentiation, recommendation and revisit intentions of tourists. As for Aberdares, there was
strong evidence to suggest that the park brand perception significantly influenced recommendation
and revisit intentions though it did not significantly influence brand differentiation. Results on
objective four indicated that Lake Nakuru National Park brand personality significantly and
negatively influenced brand differentiation. Nairobi National Park brand personality significantly
and positively influenced all behavioral intentions of consumers i.e. revisit, recommendation and
differentiation. Hell‟s Gate National Park showed a significant degree of brand salience. The park‟s
brand personality did not significantly influence brand differentiation, recommendation and revisit
decisions of tourists. Aberdares National Park brand personality did not significantly influence
brand differentiation, recommendation intentions and revisit intentions. Generally, the findings
showed that there were five key aspects of the brand that were critical in determining choice i.e.
connection to personal/demographic factors, contextual factors, internal park brand personality,
external park brand perception as well as brand awareness. Therefore, there is a need to enhance the
nature of their experiences and post-visit intentions by responding with a branding strategy that
differentiates the parks and enhances the brand identity as well as association. This study
recommends the need for the park brand‟s personality and (or) uniqueness be revealed better
through marketing concepts that are linked to historical, ecological, socio-cultural values of the
park. This way, the park‟s brand personality could positively influence choice behavior of targeted
market segments. There is also need for tourism stakeholders to apply a targeted brand
communication policy to key segments. It is also important that tourism policy addresses the need
to develop a coherent and sustained information promotion of KWS park brands based on market
needs, at the international, regional, national, county and city level.
Key words: Destination branding, destination, choice behavior, personality research

1
CHAPTER ONE
1.0 INTRODUCTION
1.1. Background of Study
Balakrishnan (2008) makes a case for the fact that destination brands are predominant
in the tourism sector and control an estimated US$ 1,480 billion in tourism spending
globally as well as US$ 2 billion international tourist spending per day, to the extent
that destinations are highly dependent on popular brands. Further, the strategic
supremacy of destination brands have triggered a superfluity of studies in the field,
with the aim of investigating different effects of branding and its influence on tourism
demand. Studies by Kotler (2002); Franzen and Bouwan (2001) and Wood (2000)
also claimed that, a differentiated brand was a means of conveying exclusivity,
lifestyle and fashionability to a destination. Most of the Destination brand image
studies lay claim to the fact that the destination image was a key area of academic
interest, given a large number of meta-analyses of image studies that exist (Chon,
1990; Echtner and Ritchie, 1991; Jenkins, 1999; Gallarza et al., 2002; Pike, 2002)
Additionally, the preponderance of studies recently laying the claim that destinations
can be branded in the same genre as tangible products, have yet to establish their
influence on choice behaviour of visitor (Beerli and Martin, 2004; Tasci and Gartner,
2007; Tasci et al., 2007). Kapferer (1997) notes that brands do not just serve as
identifiers to function as a recognizable symbol so as to facilitate choice and gain
time, but brands offers the ability to gain an exclusive, positive and prominent
meaning in the minds of the consumers. It is critical to assess the efficacy of branding
destinations in this context in influencing such emerging markets. Keller (2003) in a

2
study on the multidimensionality of brand knowledge identified three core elements
of brand knowledge that are key to influencing the consumer, which are brand
perception, brand choice and brand differentiation. The brand creates a significant
aspect of the tourist‟s perception that is fundamental in the purchasing process.
Academically, research on other aspects of branding such as brand personality, is
relatively scarce in the place branding literature (Kaplan,Yurt, Guneri and Kurtulus,
2008).
While these explanations maybe correct, there is need to understand the deeper
insights on the efficacy of park brands in influencing choice behaviour of visitors.
There is need for studies to consider product-related associations, personality,
perception and symbolic associations so as to ensure that brand identity has texture
and depth, (Aaker, 1996; Min Han, 2000). It was with these in mind, that the study
was designed to assess the efficacy of park branding in influencing choice behaviour
of visitors.
1.2. The Tourism sector status in Kenya
International Tourism has grown to be a significant contributor to Kenya‟s economy.
The sector has recorded a dramatic rise in earnings by 32.8% from KSh 73.7 billion in
2010 to KSh 97.9 billion in 2011, (KNBS, 2012). Within the same period,
International tourism arrivals had recorded a significant rise, resulting in a 13.3 per
cent rise from 1.6 million in 2010 to 1.8 million in 2011 (GoK, 2012). Tourism in
Kenya through its multiplier effect on the economy has promoted local development,
created new commercial and industrial enterprises as well as stimulating a demand for
locally-produced goods and services (UNECA, 2011). Tourism has been instrumental
in the realization of national economic goals set out in the Economic Recovery
3
Strategy for Wealth and Employment Creation (ERS 2003-2007), Vision 2030 as well
as the Medium Term Plan (2008-2012).
With the foregoing, the sector is expected to spearhead future national economic
development agenda for the country. It is expected to contribute significantly towards
the overall goal of increasing the GDP growth from 2.6 % in 2009 to 10% per annum
by the year 2030 (GoK, 2011). Wildlife and nature-based safari tourism lies at the
core of Kenya‟s tourism offerings. In fact, Kenya is ranked 14th
globally by the Travel
and Tourism Competitiveness Index (2013), owing to its natural resources with its
three World Heritage natural sites and its rich diversity of fauna (WEF, 2013). The
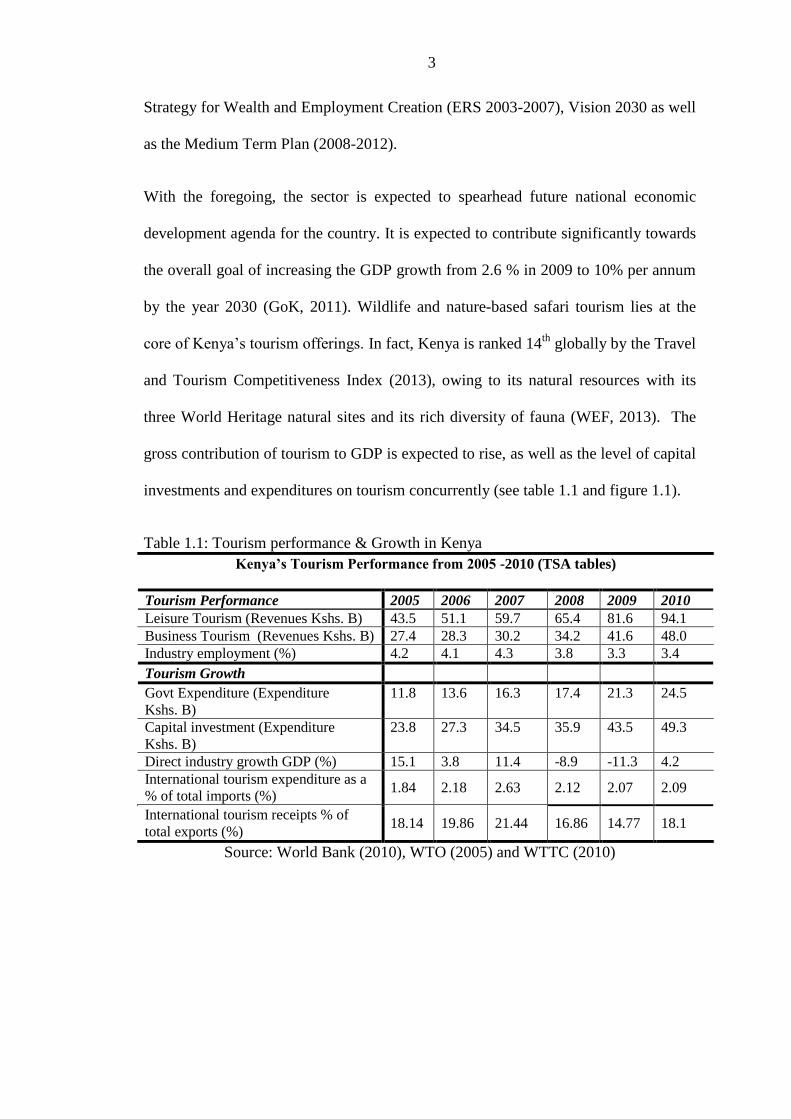
gross contribution of tourism to GDP is expected to rise, as well as the level of capital
investments and expenditures on tourism concurrently (see table 1.1 and figure 1.1).
Table 1.1: Tourism performance & Growth in Kenya
Kenya’s Tourism Performance from 2005 -2010 (TSA tables)
Tourism Performance 2005 2006 2007 2008 2009 2010
Leisure Tourism (Revenues Kshs. B) 43.5 51.1 59.7 65.4 81.6 94.1
Business Tourism (Revenues Kshs. B) 27.4 28.3 30.2 34.2 41.6 48.0
Industry employment (%) 4.2 4.1 4.3 3.8 3.3 3.4
Tourism Growth
Govt Expenditure (Expenditure
Kshs. B)
11.8 13.6 16.3 17.4 21.3 24.5
Capital investment (Expenditure
Kshs. B)
23.8 27.3 34.5 35.9 43.5 49.3
Direct industry growth GDP (%) 15.1 3.8 11.4 -8.9 -11.3 4.2
International tourism expenditure as a
% of total imports (%) 1.84 2.18 2.63 2.12 2.07 2.09
International tourism receipts % of
total exports (%) 18.14 19.86 21.44 16.86 14.77 18.1
Source: World Bank (2010), WTO (2005) and WTTC (2010)
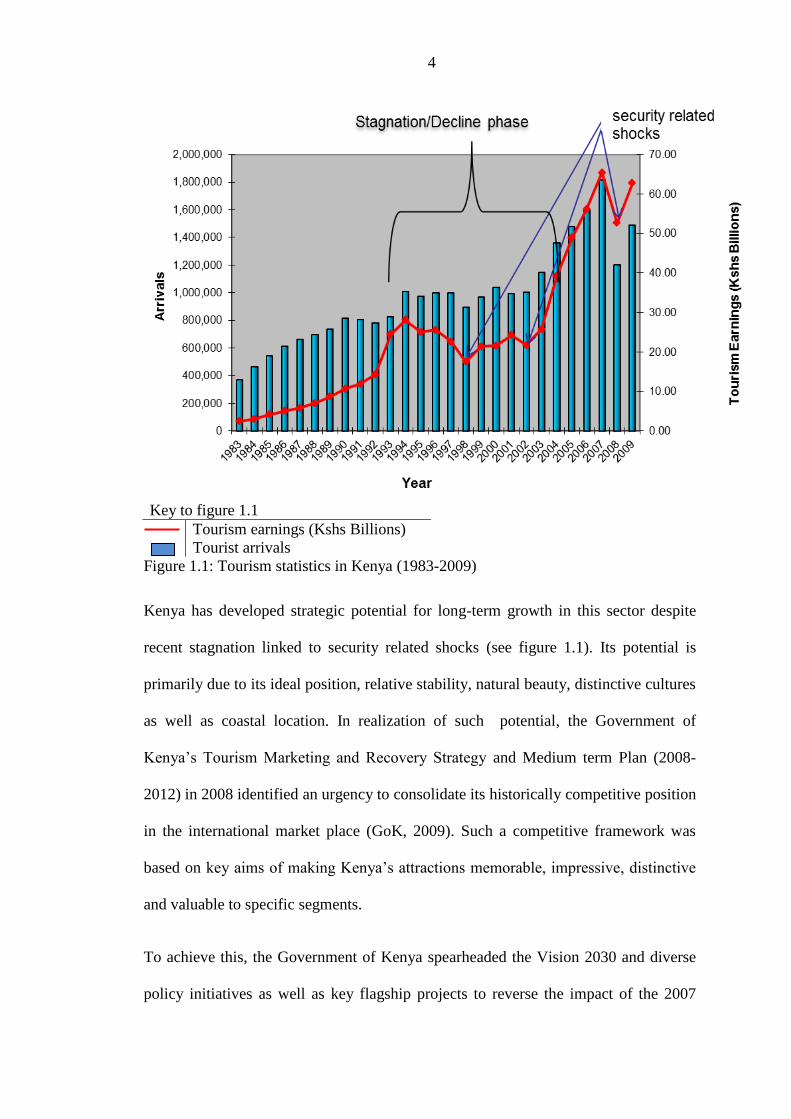
4
Key to figure 1.1
Tourism earnings (Kshs Billions)
Tourist arrivals
Figure 1.1: Tourism statistics in Kenya (1983-2009)
Kenya has developed strategic potential for long-term growth in this sector despite
recent stagnation linked to security related shocks (see figure 1.1). Its potential is
primarily due to its ideal position, relative stability, natural beauty, distinctive cultures
as well as coastal location. In realization of such potential, the Government of
Kenya‟s Tourism Marketing and Recovery Strategy and Medium term Plan (2008-
2012) in 2008 identified an urgency to consolidate its historically competitive position
in the international market place (GoK, 2009). Such a competitive framework was
based on key aims of making Kenya‟s attractions memorable, impressive, distinctive
and valuable to specific segments.
To achieve this, the Government of Kenya spearheaded the Vision 2030 and diverse
policy initiatives as well as key flagship projects to reverse the impact of the 2007

5
post-election violence, a global financial crisis experienced in 2008, and regional
insecurity associated with terrorism and political instability within the Horn of Africa
amongst other challenges (GoK 2009). Tourism flagship projects included the
development of three resort cities (in Isiolo, Kilifi and Diani/Ukunda), premier and
underutilized park branding initiatives as well as niche tourism product development.
In all of these initiatives, there was underlying need to enrich, consolidate and build
on existing efforts of making Kenya a competitive tourism destination globally.
Specifically, the park branding initiative was designed with the need to reposition the
parks as pivotal to realizing greater value from global tourism activity. The World
Tourism Organization in a report on destination marketing approaches highlighted
that destination brands have a distinctive and measurable impact on on-going
engagements with the major tourism markets (UNWTO, 2010). Further, the World
Economic Forum report on Tourism and Travel Competitiveness suggested that the
destination brand image is a formative standard of the extent to which the
Government prioritizes travel and tourism (WEF, 2013). In 2009, the World
Economic Forum‟s TTCI index ranked Kenya 9th
globally as far as the effectiveness
of national marketing and branding efforts in attracting tourists. This was clear
indication of a robust and upbeat image of the destination globally.
During this period (2008-2009), Euromonitor International reported that park
branding had led to a strong recovery of tourists wildlife tourism value sales at Ksh.
4.1 billion in 2009 after a Ksh. 3.1 billion low in 2008 (Euro monitor International,
2010). Kenya‟s Vision 2030 clearly emphasized that such a yield-focused branding
strategy in Kenyan premium parks, complemented by the expansion in underutilized
parks would improve Tourism GDP from Kshs 8 bn in 2006 to Kshs 11 bn –
accounting to over 56% of Tourism GDP (GoK, 2008a).
6
Branding these protected areas ideally involved developing park management
systems, signage, identity, image, tourist facilities and infrastructure within the parks
(GoK, 2007). In particular, the branding of Kenya‟s parks was not meant for only
attracting investments in conservation, high quality accommodation within hotels and
lodges, or developing park infrastructure and the wider superstructure, but ideally
focused on enhancing the ecological integrity and biodiversity within the park.
Up to March 2013, eighteen (18) parks and reserves have been branded in Kenya and
expectations are that such market-based initiatives would improve the identity of
Kenyan parks, differentiate and to augment the image of these conservation areas as
premier, world-class parks and tourist destinations (GoK, 2012; GoK, 2013).
Nonetheless, the 2013 Travel and Tourism Competitiveness Report indicates a decline
in ranking of Kenya‟s tourism sector as far as effectiveness of national marketing and
branding efforts in attracting tourists. Indeed, the marketer may consider a brand of
utmost importance, but the consumer continues to play a significant role in
determining when and whether the brand really matters.
Choice behaviour therefore becomes a critical aspect in this study, determining the
significance of the brand as a determinant factor. It is therefore with this basis
important to investigate the extent to which park branding influences holiday choices
of domestic and international tourists to Kenya. It is with this in mind that this study
sought to establish the efficacy of branding in influencing choice behaviour of tourists
to Kenya.
1.3. Problem Statement
Park branding in Kenya has been taking place since 2005 on majority of the parks and
reserves in Kenya with the aim of influencing market image, consumer preferences

7
and holiday choices, but the current trends have shown otherwise. Trends on Tourism
arrivals in Kenya are currently spatially concentrated in only six (6) parks (Nairobi
National Park, Lake Nakuru National Park, Maasai Mara National Reserve, Tsavo
East National Park, Amboseli National Park, and Tsavo West National Park), which
receive 81 per cent of the total number of tourists to the country‟s 26 wildlife
sanctuaries (GoK, 2007; GoK, 2008b; GoK 2010; GoK 2013). The popularity of these
park brands has created a spatial distribution of tourism development and arrivals in
Kenya.
Further, the sector remains relatively underdeveloped, compared to other tourist
destinations, in terms of the number of tourists, yield and diversity of experience.
According to the National Tourism Strategy, only 1.5 million tourists visit Kenya a
year, compared to some 8.3 million per year in South Africa (GoK, 2013). Kenya‟s
National Tourism Policy, echoes a need to expand product choice, quality and
diversity and to address unexploited and underdeveloped products (GoK, 2008a). To
increase our competitiveness, there is need to embark on a differential strategy that
reflects the true value of our compelling wildlife tourism products.
Nevertheless, in 2010, the World Bank report on tourism development in Kenya
raised ideal concerns over the uncompetitiveness of Kenya‟s traditional tourism
product offerings and the need to reposition the country‟s market image as a premier
safari destination (World Bank, 2010). Further, Costa (2011) alludes to the fact that
growth of the emerging BRICS markets (Brazil, Russia, India, China and South
African) economies presents unique market challenges and opportunities for global
brand managers.
8
The national Tourism Medium term Plan (2008-2012) noted that the image and
dismal performance of the sector had been attributed to the escalation in global
terrorism, infrastructural deficiencies, static and un-innovative products, meagre
resources allocated for promotion and marketing, declining standards of tourism
products, as well as increased regional competition (GoK, 2008a). The National
Tourism Strategy (2013-2018) further notes that the major challenge to tourism
planning in Kenya is dearth of sufficient and reliable disaggregated data and
information on the tourism industry (GoK, 2013).
As a result, the efficacy of park branding as a means of influencing consumer markets
positively is a key issue of concern. There is need to research more and understand
better the primary associations (drivers) a brand owns in the minds of consumers and
assess consumers‟ behavioural intentions when associating with brands (Trappey and
Woodside, 2005). Existing models on choice behaviour have not fully identified
choice behaviour from revealed choice data. Currently, the concept of park brand
choice, learning and differentiation remains under-researched.
Of the existing models on destination choice, the use of discrete choice scaling
techniques (Hankinson, 2004); economic consumer utility models (Odunga and
Maingi, 2008); destination choice sets (Botha and Ankomah, 1993), that have had
significant identification problems due to heterogeneity of individual consumer
preferences and brand perceptions. Middleton and Clarke (2001) concur and indicate
that the traditional models on consumer behaviour fail to consider the growing
customer sophistication and determinants to customer buying behaviour. This is
further reflective of the dynamic nature of tourist choice behaviour. It is therefore
imperative that different modes of destination choice are reviewed to determine their
efficacy and utilization in research on consumer behaviour.
9
Further, currently the Vision 2030 National reporting, monitoring and evaluation
framework of indicators in Kenya, does not adequately incorporate the views of the
tourists on policy initiatives and flagship projects. Therefore, this creates in a sense a
policy gap in monitoring the efficacy of park branding in influencing tourist choice
behaviour. This study therefore sought to fill the gaps and in a way address the
fundamental question that is, whether the park branding influences choice behaviour
of tourists to Kenya. It also seeks to provide a better understanding of choice
behaviour of tourists to branded parks in Kenya and assess the impacts of park brands
on tourists‟ holiday intentions.
1.4. Broad Purpose of the Study
The main purpose of this inquiry therefore, was to understand how choice behaviour
of local and international tourists interacted with current park branding initiatives in
Kenya. Choice behaviour hereby refers to the assessment of behavioural intentions of
tourists to parks in terms of pre-and post- behavioural intentions as well as analysing
the precursors to such behavioural intentions.
1.5. Key Objectives
Specifically, the study sought:
i. To profile tourists visiting branded parks in Kenya based on their choice
behaviour;
ii. To examine antecedent factors influencing tourists‟ choice behaviour ;
iii. To Evaluate tourists‟ perceptions of park brands in Kenya and their choice
behaviour ;
iv. To Explore the influence of brand personalities on choice behaviour of tourists
to Kenyan parks

10
1.6. Hypotheses
In essence, the hypothetical premises on which the study was based were that:-
H01: Kenyan Park brand perceptions do not significantly influence tourist choice
behaviour;
H02: There exist no significant differences in tourist choice behaviour;
H03: There exist no significant differences in tourist perceptions of branded parks
visited;
H04: There exists no direct positive relationship between the Brand personalities of
Kenyan Parks and tourists choice behaviour;
1.7. Significance and Anticipated Output
Historically, wildlife tourism‟s significance to the Kenyan tourism industry has been
clearly significant. Kenya‟s wildlife-based tourism accounts for 70% of tourism
earnings, 25% of Gross Domestic Product and more than 10% of total formal sector
employment (GoK, 2013). Nevertheless, there is need to upgrade and (or) diversify
existing product offerings as we are currently faced with a „tired product offering‟ that
is unsustainable and uncompetitive according to a recently launched World Bank
report on Kenya‟s tourism sector, (World Bank, 2010). Consequently, the challenge
Kenyan attractions faces today revolve around how to create and maintain a
competitive brand in an environment which largely depends on the visitation
perceptions/expectations and experiences of tourists. The heightened competitive
environment makes it important for Kenya to clearly differentiate itself from
competition, and to convey why it is a relevant and valued option to the source
markets.

11
Leisure tourists currently represent the largest segment of the inbound travelling
population to Kenya, accounting for just over 62% of the global tourist market
(UNWTO, 2012) and 83.7% of the Kenyan tourist market in 2005 (GoK, 2013).
Kenya, has not yet addressed the strategic potential of the domestic market vis-à-vis
the international market (GoK, 2009). A more comprehensive understanding of
leisure tourists‟ behaviour allows tourism organizations to better understand their
target markets, therefore formulating effective destination marketing strategies. On a
macro-scale, an assessment of „brand image‟ and the attractiveness of various tourist
destinations as well as evaluation of improvements made in tourism policy provides a
gestalt understanding of the impacts of park branding on the tourist numbers and
indeed the economic impacts of tourism to a destination (WEF, 2009).
These study findings are therefore useful to destination marketing policy-makers as
they implement the Vision 2030 sectoral strategies and vision. In particular, the study
findings are useful in aiding the various flagship programmes by the Ministry of
Tourism for Tourism Marketing and Recovery Strategy such as the premier park
initiative, and the under-utilized park initiative.
1.8. Delimitations
The study delimits itself to explaining choice behaviour of domestic and international
tourists to Kenya and in particular, assesses the efficacy of park branding in
influencing choice behaviours of local and International tourists in Kenya.
1.9. Limitations
The key limitations that affected the study were:-
i. Transient factors such as fatigue and anxiety in areas such as the Hell‟s Gate
National Park that limited the ability of the respondents to respond accurately
12
and fully. In this case the researcher targeted respondents within recreational
and resting facilities within the attractions mentioned.
ii. Cost considerations had a major impact on the decisions relating to the size of
the sample and type of sample. However, the researcher received a grant from
the university and therefore addressed the cost considerations adequately.
iii. It was further feared that the scope of the study would limit the researcher in a
few regions. However, a representative sample was selected and that was vital
at this stage to ensure non-bias.
iv. Language barriers were overcome by use of qualified interpreters as research
assistants. Two research assistants who were qualified tour guides were
employed in the study. They also were proficient in English, Chinese, French
and (or) Spanish language.
1.10. Assumptions
The study assumed that:-
i. Tourist respondents were rational in their decision making and choices. They
made a systematic use of the information that was available to them.
ii. Tourist respondents considered the implications of their actions before they
decided to engage or not engage in certain behaviours.
iii. Tourists attempted to maximize their utility in any exchange
iv. Tourists were constrained by limited income, which forced them to behave in
a way that ensured that they get the most out of their income.

13
CHAPTER TWO
2.0 LITERATURE REVIEW
2.1. Introduction
This chapter reviews extant literature specifically designed to explore the theoretical
and empirical underpinning with regards to park branding and choice behaviour of
tourists. The chapter is organized under the following sub-topics: theoretical
foundations, empirical review, a summary of emerging gaps in literature as well as the
conceptual framework of the study.
2.2. Theoretical foundations of the study
The study draws its foundations from the following theories in choice behaviour and
brand preference: Bayesian learning theory, theory of planned behaviour, recall
inhibition theory of brands and the prospect theory of brands.
2.2.1. The Bayesian Learning Process Theory
This study posits that tourists go through a brand learning process which is dependent
on individual preferences, past experiences and their brand perceptions that may be
measured in the same way as tangible products. Shin, Misra and Horsky, (2010) as
well as Erdem and Keane (1996) in this theory argued that consumers choose between
brands based on their individual preferences, past experiences as well as based on the
brand perception. However, failure of past research on brand choice to account for
either of the two factors in estimating their impacts on choice has led to bias in
estimation of their real value in choice estimation.
Within the Bayesian learning model, “learning” was conceptualized as having two
distinct effects on the consumer which are “quality perception bias reduction” and

14
“uncertainty reduction”. The first effect refers to the convergence of the consumer‟s
brand perception to the true mean quality of the brand, while the second effect reflects
the convergence of uncertainty to zero. The availability of preference information
offers unique insights on the degree of substitutability between two brands and would
directly inform the choice sensitivity of consumers. As applied to this research, choice
behavior is pre-determined by brand perception as well as past experiences. This
fundamental aspect was useful in conceptualizing the nature of choice behavior in the
study. The Brand learning Process Theory supports and addresses the research
problem of the study such that it highlights the key variables that would be ideal in
estimating the efficacy of brand perception as an aspect of the park brand in
influencing choice behavior of visitors.
2.2.2. Theory Of Planned Behaviour
The study posits that all choice behaviour is planned and can be measured through
behavioural intentions of tourists. Ajzen and Fishbein‟s (1980) theory of planned
behaviour as revised by Fishbein (2005) sought to explain the tourists choice
behaviour. It sought to specifically explain the factors that most effectively explain
tourist choice behaviour. Many kinds of behaviour can be engaged in, for example, a
consumer may in addition to buying a product (brand), discuss with friends,
recommend it (or warn them against it), etc. These behavioural intentions are
conditioned by an individual‟s beliefs towards acting in the particular manner.

15
Figure 2.1: Fishbein‟s theory of planned behavior
However, according to Fishbein, there are three kinds of factors underlying an
intention to buy a certain product (brand). One of these refers to attitude, not towards
the product (brand), but concerned with the behaviour which an individual is
contemplating in relations to that product (brand). The second factor related to
“subjective norms” towards the behaviour in mention, i.e. what influence certain
social norms may exercise on specific behaviour which may include other people‟s
opinions as perceived by an individual. From these two components (attitudes to the
act and social normative beliefs), fishbein proposed that an attitudinal estimate could
be formed as a function of a person‟s intention to buy a particular product (brand) and
his/her normative beliefs about the brand.
2.2.3. The Recall Inhibition Effect Theory Of Brands
Vieceli & Sharp (2001) argue that brands may have either a prohibiting or a
facilitative role in enhancing brand recall. In this case, someone who is presented with
a brand name, the brand name itself may serve as a cue for recall. However, Alba &

16
Chattopadhya (1986) contends that recall inhibition effect would occur when the
brand name is presented as a cue; it inhibits the recall of other competing brands. The
mere act of recall itself heightens a brand‟s popularity as well as strengthening the
links through memory to the brand. Rundus (1973) provides a widely accepted
explanation of this theory through his “Competition-at-retrieval hypothesis”. The
study reflects on the insight that the presentation (cuing) of an item (product) and
brand strengthens associations in memory between the product and the brand,
therefore increasing the intensity and accessibility of the brand relatively to the other
brands in the category.
This theory posit the fundamental principle that brands do actually influence their
recurrent recall thereby leading to the dismissal of other competing brands in the same
category. The recall effect of brands is central to this investigation and the study
sought to explain how significantly destination brands influenced tourist perceptions/
recall within Kenyan context. The study does not just look at the impact of branding
parks in Kenya but also addresses the efficacy of park brands amongst other
determinants in influencing tourist choice behaviour in Kenyan contexts.
2.2.4. Prospect Theory of Brands
Kahnemann and Tversky (1979; 1984) developed a theory to explain the switching
behaviour of consumers. According to this theory, people edit/assess a prospective
brand before they evaluate it. Since consumers are assumed to have the natural
tendency to simplify tasks and make life easier, the editing process helps make the
evaluation task easier. Liu (1998) notes that the editing process ideally involves a
cancellation process, where all common outcomes for all prospects are cancelled out
and do not filter into the evaluation stage. Individual consumers evaluate gains and
losses possible from choice alternatives and substitutions. Their theory breached the
17
hypotheses of expected utility theories in their earlier works and noted that decision-
making normally was undertaken under risk. A person appraised the product of choice
relative to its apparent departure from a reference point, rather than to a level of net
assets.
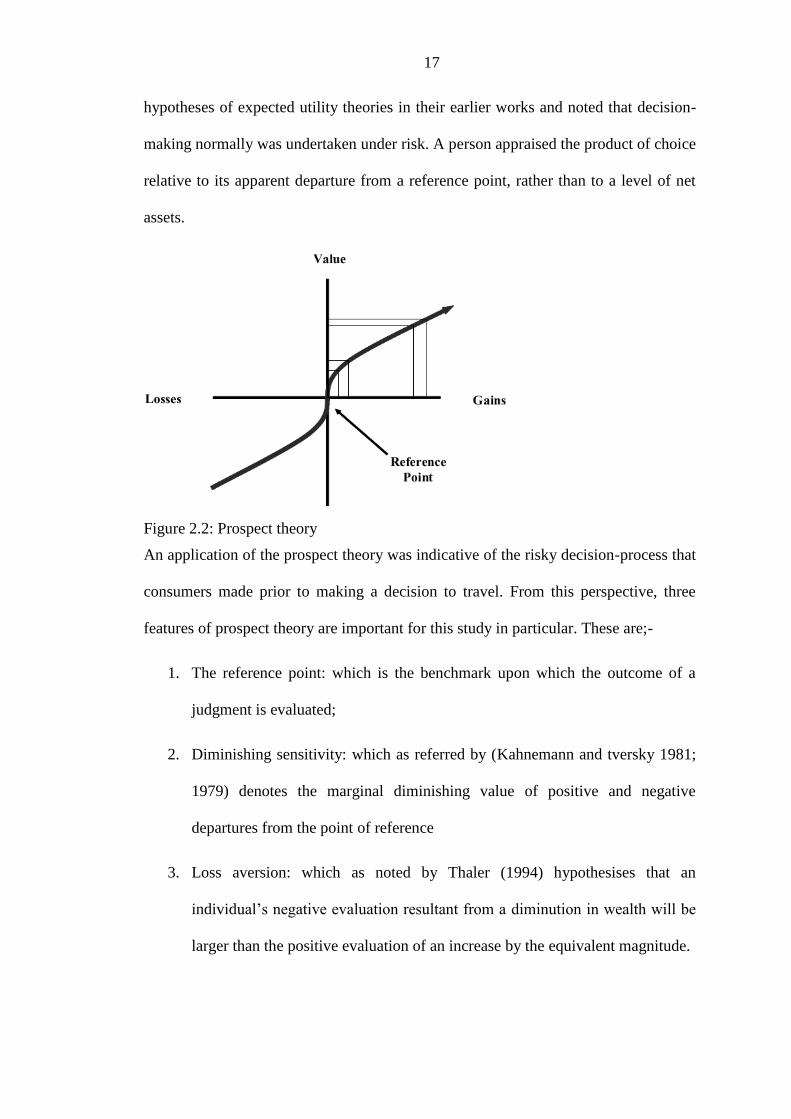
Figure 2.2: Prospect theory
An application of the prospect theory was indicative of the risky decision-process that
consumers made prior to making a decision to travel. From this perspective, three
features of prospect theory are important for this study in particular. These are;-
1. The reference point: which is the benchmark upon which the outcome of a
judgment is evaluated;
2. Diminishing sensitivity: which as referred by (Kahnemann and tversky 1981;
1979) denotes the marginal diminishing value of positive and negative
departures from the point of reference
3. Loss aversion: which as noted by Thaler (1994) hypothesises that an
individual‟s negative evaluation resultant from a diminution in wealth will be
larger than the positive evaluation of an increase by the equivalent magnitude.
18
2.3. Empirical review
2.3.1. The Concept of Choice Behaviour
An essential prerequisite of marketing according to Bresler (2001) to tourists is an
understanding of the degree of freedom they enjoy in their choices. Destination choice
may refer to a phase within the decision making process that tourists make prior to,
within and after their travel to the destination. Woodside and Lysonski (1989)
developed research of the destination choice process that suggested that the
destination chosen for a vacation is the outcome of a series of explicit and implicit
decisions which progress from an initial state of destination awareness conditions
from which particular destination preferences arise and a travel intention is formed.
The research further showed that the choice of destination differed from the one
intended due to the tourist interaction with certain situational variables for example
the security situation at the destination, news of a potential/active epidemic or
terrorism activity (Opperwall, Hybers & Crouch, 2010; Woodside and Lysonski,
1989).
Further, the affective associations that tourists have with the destination, to a
particular extent influence destination choice (Raju, 2009). These affective states
might be positive, negative or neutral choice sets. Woodside and Lysonski (1989)
conceived these choice sets by defining four categories of destinations within the
framework. These included the unavailable/unaware set of destinations which a
tourist knows about but the consumer rules out since they are unavailable for one
reason or another (e.g. cost reasons); the inept set of destinations which the tourist has
a negative perception of, therefore ruled out of the decision process early; inert
destinations that do not have any negative or positive perceptions and they remain
within the decision-making process till late for consideration and lastly the

19
consideration set that include destinations that the tourists have a positive
consideration before making any decision.
Studies on brand perception indicate that powerful brands create meaningful
perceptions in the minds of consumers (Keller, 1993), with brand perception and
reputation enhancing positive differentiation and thus potentially having a positive
influence on buying behaviour (Gordon, et.al., 1993; McEnally and de Chernatony,
1999). Cohen as cited in Raju (2009) suggests a cognitive typology to describe what
travel means to different people. Tourism can be: recreational i.e. to relieve tensions
and strains of work; diversionary, where the visit is a true escape from the boredom
and routines of life; experiential, the tourist here is a modern pilgrim looking for
authenticity in the life of other societies because he has seemingly lost it in his own;
experimental, where the tourist wants to experiment with lifestyles other than his
own; and finally existential, a tourist who actually acquires a new spiritual centre as a
result of the travel experience.
However, Maitland (2006) reinforced the importance of the destination brand
perception and the distinctiveness of the place and argued that the serial production of
standardized tourism zones would lead to inherently unappealing environments for
tourists. It is therefore essentially critical that the brand identity created by the seller
about natural and/or artificial attractions, histories and people, is portrayed as a
positive brand perception and may become motivations of choice to the consumers.
The nexus between the destination choice and the choice of vacation experience
presents an ideal challenge to tourism marketers. As Oppewal, Hybers & Crouch
(2010) notes, a tourist may decide initially that they would choose the destination first
before choosing the vacation experience and in other instances, the reverse order

20
would apply. These situations suggest that a series of situational variables influence
particular destination preferences and hence travel intentions are formed.
Majority of destination choice studies seek to appraise the attractiveness and
competitiveness of tourism destinations (Kozak and Remmington, 1998; Mihalic,
2000). Hunt (1975) was the first to demonstrate the importance of the destination
perception in influencing choice of vacation experience. Further, Gunn (1988) and
Pike (2002) noted that destination perception is a discriminating factor in the
destination selection process. Destinations with recognizable perceptions and more
positive association have more probability of being chosen (Marino, 2010).
More recent studies, however suggest that tourists, especially those intending to go on
vacation often behaved in a more emotional, liberated and less restrained manner
therefore leading to impulse purchasing behaviour (Laing, 1987). Such hedonistic
emotions and moods demonstrated a high degree of customer involvement and
personal significance of the tourism service to the consumer, (Sheth and Mittal, 2004;
Chishnall, 1995). Destination brands were pivotal to eliciting such motives in tourists,
which in-turn reflected on the specific travel behaviours (Jackson, 2001; Styles, 2002;
Keller, 1993). They represented a combination of tangible and emotional experiences
communicated to the consumer through brand elements that facilitated brand choice
(Hanzee, and Saeedi, 2011).
2.3.2. Destination Choice Research
Spatial choice research provides a more balanced view of tourist choice behaviour.
Baloglu and Kozak (2010), note that situational factors may have an influence on
destination choice. Research on tourism demand based on the tourist holiday choices
have extensively focussed on tourists‟ spatial choice behaviour (Haider and Ewing,

21
1990; Morley, 1994; Huybers and Bennet, 2000), and economic utility research
(Odunga and Maingi, 2008). In particular, the discrete choice method has been used to
analyse destination choices based on the attractiveness of the (list of) destinations in
the consideration set.
Crompton, Botha and Ankomah (1993) further advanced the choice set theory by
elaborating the choice sets in detail and envisaged a filtering process that is a funnel
approach to decision-making. However, the idea that consumers at one point in time
construct a list of destinations and then start pruning this list to a manageable size in
isolation from further market influences is a mere assumption that may not reflect
reality, especially not in an age where consumers can go online and are on social
media almost any time to conduct further information search (Kaplanidou and Vogt,
2006), and where they may encounter or search new alternatives any time during this
process.
It therefore seems proper that researchers adopt a differentiated approach to
destination choice behaviour research. The choice set research have further
demonstrated fundamental weaknesses in application owing to the heterogeneous
nature of choice sets and the fact that most respondent perceptions may be completely
different from the destination descriptions provided, therefore resulting to unrealistic
destination choice scenarios that are based on perceptions of the destination and not
the intrinsic aspects of the destination‟s perception to the consumer. Each tourist may
have different motivations and preferences for different destinations. It is therefore
imperative that different modes of choice estimation are reviewed to determine their
efficacy and utilization in research on choice behaviour. Mayo and Javis (1981)
further highlight that destination brand attitudes form a better predictor of choice than
the awareness of different choice sets. Therefore, this study would adopt a different
22
approach to handling destination / holiday choices. Essentially, this would involve
having the respondents to rate their preferred holiday options within the destination
(park), (i.e. revisit/ recommend and memory) without necessarily having discrete
guided destination options. This has proved reliable in the face of diverse attractions
options globally.
On overall, most of the traditional destination choice research emerged with the idea
that a destination is a perceptual concept, which is interpreted subjectively by the
consumers, (Buhalis, 1999; Woodside and Lyonski, 1989). As Buhalis (2000) puts it,
destinations are perceptual constructs that offer an integrated experience to
consumers. The destination experience can be further interpreted subjectively by
consumers depending on the travel itinerary, cultural background, purpose of visit,
educational level and past experience (Hall, 2000; Buhalis, 2000). In support of this,
Woodside and Lyonski, (1989) noted that choice was dependent on a number of
variables and a function of a process that lead to the formation of preferences for
particular destinations. These choice determinants were characterised by the
characteristics of the traveller (their values, motives and attitudes) as well as; their
impressions of the destination (positive, negative and neutral mental affective states),
known as choice sets.

23
2.3.3. The Branding Concept
Soeren Kierkegaard a prominent philosopher gave eminence to the term "existence"
on brands, which provoked the premise that consumers acquired certain symbolic
meanings on brands during their purchase process (Sartre, 1946). This view held to
the fact that brands existed only when the consumer had a symbolic perception to the
product. In contrast, Grassl (1999) challenged this claim that a brand is reinforced by
its unique identity by noting that brands were not “dependent upon human perception
for their existence”. The problem then boiled down to that of describing a brand,
rather than adopting essential distinction between human opinions on the brand. Dayal
(1998) concurs and argues that, the creation of an external brand identity has the
effect of forming a high level of awareness in the consideration set of consumers and
therefore creating a lived experience and brand encounter.
It then followed that a brand provided meaning, existence and essence to a product
and not the contrary. The brand is not a mere indicator of origin, but it is the actual
origin of the products to come (Searle 1995; Kapferer 1992; Grassl, 1999). The
implications of this on tourism product development are such that the brand
supervenes on the tourism product, or is founded on it. Therefore, an assessment of
brand meaning in the consumer‟s perspective is essential for tourism product
development in Kenya. In Kenya‟s case, branding tourism destinations in Kenyan
context had been founded on this underlying principle and KWS initiatives as guided
by the Vision 2030 precepts were indeed noble and timely. However, the local
deconstruction of brand meaning by tourists has been critical as most policy initiatives
have not been based on well-grounded research on the efficacy and significance of
park brands from a consumer‟s perspective. It is therefore critical that such a
24
deconstruction of brand meaning assesses the influence of brands on consumer
choice.
2.3.4. Components of Destination Brands
A review on brand components by Balakrishnan, Nekhili and Lewis (2011) ascertains
key brand attributes that are fundamental to the consumer‟s decision–making process,
include functional, symbolic, and experiential aspects. Functional brand components
relate to the tangible benefits manifest on a product or service (such as scenery,
attractions, accommodations and price levels) (Hankinson, 2004). These functional
components of the brand form the core aspect of the tourism product that consumers
seek for. The symbolic brand components however represent aesthetic features and
benefits that are over and the core product (Wood, 2000) which include the aesthetic
needs for self-expression, self-esteem and prestige. Finally, the experiential brand
components represent higher order needs for the consumer. These needs are well
illustrated by Cooper (1989) as the ability to convey exclusivity, lifestyle and
fashionability. However, Franzen and Bouwan (2001) note that brands create mental
representations that are direct, non-verbal representations (sensory), propositional
representations (abstract representations) and linguistic representations.
Kapferer (2004) notes that successful brands deliver value in addition to the core
benefits. These added values enable the brand to differentiate itself from the
competition. It is then as hypothesized that when done well, the customer recognises
the added value in the augmented product and chooses that brand in preference.
However, a consumer may be looking for reassurance or a guarantee of quality in a
situation where he or she is unsure about the choice of destination. Despite the
varying discourses on meanings of brands to consumers, Trappey and Woodside
(2005) notes that brand meaning can be determined through a framework he identifies

25
as a hexagonal identity prism (see Figure 2.3) that defines what a brand really is and
what it stands for. On one side of the communication channel represents what the
senders want the brand to be perceived as (i.e. its physique and personality) and on
the other hand, from a consumer perspective, the brand represents a reflection and
self-perception.
Figure 2.3: Scope of brand meaning
Alternatively, it can be noted that the consumer may be looking for the brand to add
meaning to his or her life in terms of lifestyle or personal perception and not merely a
self-reflection. Therefore a brand can be ultimately represented by core features that
are surrounded (or “augmented”) by less tangible features which include emotional
values, added services and ubiquitous experience. It is therefore important to assess
the core elements of the brand as well as the brands‟ impacts to the senders and the
intended recipients.
These unique aspects/ components of the brand are therefore critical in creating that
lived experience with the brand. A destination brand consequently uses the functional,
experiential and symbolic aspects of a place to present a unique identity. Grassl
(1999) and Berry (2000) concur but further characterize strong brands as having a
consistent perception which positively reinforced a differentiated brand message. To
26
be a brand, then, ultimately meant to be perceived, associated with and (or) known
positively by a particular niche of customers. In a sense a destination brand
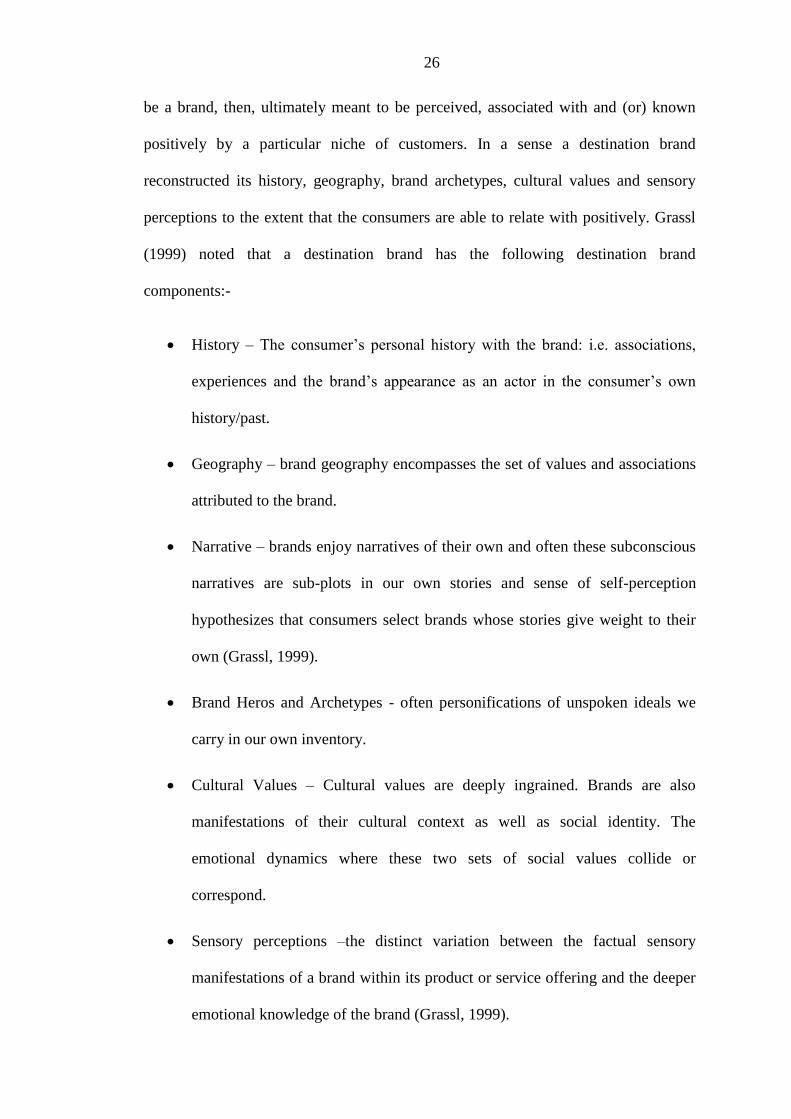
reconstructed its history, geography, brand archetypes, cultural values and sensory
perceptions to the extent that the consumers are able to relate with positively. Grassl
(1999) noted that a destination brand has the following destination brand
components:-
History – The consumer‟s personal history with the brand: i.e. associations,
experiences and the brand‟s appearance as an actor in the consumer‟s own
history/past.
Geography – brand geography encompasses the set of values and associations
attributed to the brand.
Narrative – brands enjoy narratives of their own and often these subconscious
narratives are sub-plots in our own stories and sense of self-perception
hypothesizes that consumers select brands whose stories give weight to their
own (Grassl, 1999).
Brand Heros and Archetypes - often personifications of unspoken ideals we
carry in our own inventory.
Cultural Values – Cultural values are deeply ingrained. Brands are also
manifestations of their cultural context as well as social identity. The
emotional dynamics where these two sets of social values collide or
correspond.
Sensory perceptions –the distinct variation between the factual sensory
manifestations of a brand within its product or service offering and the deeper
emotional knowledge of the brand (Grassl, 1999).
27
This might be a significant practical challenge to achieve from a tourism context but,
it is important to note that at the end of the day, policy makers concentrate more on
the brand equity and value to the consumers. Further, within the Kenyan context,
there is need to address the unique challenge of differentiating our destination product
from the competition and indeed realize brand value.
These key attributes therefore, present an idealist‟s destination brand perspective.
Hassan and Hamid (2011) interrogated this perspective through their realism
perspective on branding by claiming that although branding places had been a
difficult process of constructing the social realities of a place, the constructs of nature,
culture and history can be effectively used to create and market a unique perception of
the destination.
From 1985-2006, two underlying paradigms have been prevalent within the academic
world of brand management: one with a positivistic point of departure and one of a
constructivist or interpretive nature. The positivistic paradigm implies a notion of the
brand being „owned‟ by the marketer, who controls the communication to a passive
recipient/consumer (Hanby 1999, p. 12).
However, the constructivist or interpretive paradigm reflects on the nature of the
brand and the value of brand equity as something created through the interaction
between the marketer and an active consumer: „As holistic entities with many of the
characteristics of living beings‟ (Hanby 1999, p. 10) and „As a living entity (with a
personality with which we can form a relationship and that can change and evolve
over time)‟ (Hanby, 1999). This dynamic shift in thinking about brands poses unique
challenges for branding researchers in tourism context. This research seeks to
interrogate existing paradigms on the role of park brands and critically assesses the
efficacy of park branding and its roles within Kenyan context.

28
2.3.5. Destination Branding research
Varied empirical literature on branding research maintains that brand experiences are
diverse (Ivana, 2009; Graburn, 1989; Kates and Goh, 2003). Therefore, brand
meaning is not predetermined in an information booklet; rather, it is construed in the
customers‟ minds. Ivana (2009) supports this proposition by noting that people
experience brands in different settings, situations and psychological states and
therefore their understanding of brands is different. Variety of tourist expectations are
primarily based on seeking the essence of the tourist experience, as a quest for
authenticity (MacCannell, 1976), a personal transition from home to elsewhere
(Graburn, 1989), a form of neo-colonialism (Nash, 1977), or a particular type of
"gaze" (Urry, 1990).
With the rapid globalization of the tourism market, consumers from different cultural
scopes have different perceptions, needs, tastes, attitudes, beliefs and value systems.
Kapferer (1997) affirms this point by noting that destination brands do not just serve
as identifiers to function as a recognizable symbol so as to facilitate choice and gain
time, but brands offers the ability to gain an exclusive, positive and prominent
meaning in the minds of the consumers. While these explanations maybe correct,
there is need to understand the deeper insights on the meaning of brands to
consumers. Aaker (1996) claims the need to consider these product-related
associations, personality, and symbolic associations so as to ensure that brand identity
has texture and depth.
Brand meaning research as traditionally construed, had been based on a name,
associated with one or more items in the product line that was used to identify the
source of character of a product (Kotler, 2000, pp. 364). In fact, Keller (2003)
29
contends, “technically speaking, then, whenever a marketer created a new name, or
logo or symbol for a new product, he or she created a brand.” However, Aaker (1991)
goes on to validate these views by noting that branding had symbolic meaning and
was manifest in every product and (or) service. It served to identify goods and
services of either one seller and to differentiate those goods or services from
competitors‟.
Holt‟s (2004) comparison of branding research provides an illuminative view to the
differentiated scopes of brands. He specifically categorized them into four (4) main
branding types. The first one, “mind-share branding” that comes from the need to
occupy a significant share in the minds of customers. The second type of branding is
“emotional branding” which builds upon the mind share and emphasizes on how the
brand essence should be communicated through emotional appeals. The third type is
“viral branding” which focuses on enhancing public influence through viral
marketing. The fourth type of branding is “cultural branding” where communication
lies central to the brand and the customer seeks to listen to the story that the brand has
to offer. The product in this case is seen as a conduit through which customers
experience cultural myths of the brand.
It is therefore important to note from branding research that, a brand embodies a
whole set of meanings to a service provider/ customer who can manifest in different
functional, symbolic, and experiential or luxury forms. These meanings may arise
from constant interactions with the marketers, family, friends, retailers, the media etc.
However, Keller (2003) notes that, to a particular extent, there is some element of
brand self-meaning arising not through connection with the social paradigm but
through a direct connection to individualized consumer goals, needs and motives. The
individualized needs for self-expansion, social adjustment, value expression, self-
30
construction, and emotional regulation serve as self-meanings. It is therefore
imperative that these individualized as well as social and institutional meanings are
contextualized within the context of brand choice behaviour. The study sought to
assess the significance of such core brand meanings to consumer choices.
2.3.6. Consumer Profiling of branded parks based on their Choice Behaviour
2.3.6.1. Demographic Determinants and Choice Behavior
According to Sirikaya and Woodside, (2005), demographics represent the observable
measurements of a population‟s characteristics, such as birth rates, age distribution or
income levels. Recent tourism literature reflects an increasing interest in tourists‟
leisure-behaviour based on their demographic types (O‟Leary and Deegan, 2005;
Baker and Crompton, 2000). Gartner and Lime (2000) hold that demographics,
technology and changing lifestyles all play important roles in shaping the future of
wildlife tourism, outdoor recreation and park management. It is therefore critical to
analyse different approaches in analysing the demographic characteristics of tourists.
Peter and Olson (2010) adopts a sub-cultural analytical framework for analysing
demographics of consumers. Based on the sub-cultural analytical framework, first a
broad subculture is identified based on some general demographic characteristics
(black Americans, elderly Japanese, and middle-income Italians). Then, depending on
the marketing purpose, this broad group can be further segmented into sub-
subcultures based on other demographic characteristics (e.g. affluent, middle-income,
or poor Americans; elderly Japanese who are healthy versus those who are ill; middle-
income Italians living in large cities or those in small towns) (Peter and Olson, 2010).
If deemed necessary, the segmentation process could continue, creating ever smaller
and more narrowly defined subcultures. This method of analysing a subculture, one

31
would seek to identify the typical characteristics, meanings, and behavioural
tendencies shared by people in those groups. Despite sharing some qualities, however,
most subcultures are quite diverse. Curtin (2010) concurs and notes that in recent
years, the products offered by both mass and specialist wildlife tour operators have
evolved to meet a changing tourist profile. Therefore, there is need to assess the
impacts of changing demographic types on brand choice and preference of domestic
and international tourists.
2.3.6.1.1. Age and Choice Behavior
Choice behaviour studies have identified Age as a critical determinant of choice of
vacation experience and ultimately choice of destination. Solomon (2011) notes that
as one gets older, his/her needs and preferences change, often through age cohorts i.e.
often in unison with others who are close to his/her age. Important age cohorts include
teenagers, „Generation x‟ (18–29–year-olds), „baby boomers‟ and „the elderly
(Generation y)‟. Teenagers are making a transition from childhood to adulthood, and
their self-concepts tend to be unstable. They are receptive to products that help them
to be accepted and enable them to assert their independence. Because of changes in
family structure, many teenagers are taking more responsibility for their families‟
day-to-day shopping and routine purchase decisions.
Age also serves as an indicator of the choice and level of physical activity as well as a
measure of the level of involvement in the vacation experience (Odunga, 2010) as
well as a reflection of the personal values and symbolism used to appeal to them thus
evoking powerful forces of nostalgia (Solomon, 2011). To support this claim
Solomon (2011) notes that brands have often been linked/ associated with vivid
memories and experiences from childhood and adolescence therefore creating either
patronage or loyalty to the brand.
32
Hall (2005) argues that age will probably be the key demographic factor that will
affect the future of tourism. This is due to the dramatic improvement in healthcare and
a decline in birth rate within the developed world. The United Nations Division for
Social Policy and Development (1998) estimates that the proportion of very old
people (aged +80 years) between 1950 and 2050 is expected to grow by a factor of 8-
10 times on the global scale. Now, given that a vast majority of the world‟s tourists
come from the developed world, destinations will have to shift market focus to this
elusive segment. Williams and Hall (2002) provides a significant evidence to suggest
a trans-national retirement migration of tourists coming from the Mediterranean
Europe and the Iberian Peninsula and South west USA. However, in order to assess
whether age is a determinant to park brand choice is an issue of concern as well as
whether there are differences in perceptions of tourists to the park brands.
2.3.6.1.2. Gender and Choice Behavior
Ryan (1998) identifies sexual identity is a very important component of a consumer‟s
self-concept. It represents a personal and cultural predisposition and expectation of
the dichotomous roles of an individual in society. Some societies are highly
dichotomized i.e. Male/female and others show a significant toleration of deviance to
the accepted norms in behaviour. In fact, conceptions of masculinity and femininity
have been currently shaped by society and guide the acquisition of gender-type
products and brands. To support this claim, Andreu, Kozac, Avci, and Cifter (2005)
claimed that on overall, females had stronger inclinations to travel on holiday than
males, and age was not the only significant factor influencing their motives. They also
established significant gender differences in travel motivations where male tourists
preferred more recreation and activity in the destination, while the female tourists had
a stronger relaxation and escape-based motives.

33
Despite the modern tendency to downplay differences between men and women, there
is ample evidence that men and women may differ in important respects other than
physiologically. For instance, women may process information differently than men
and seem more “generous, more nurturing, and less dominating than men.” Ryan
(1998) gives a significant account of gender differences in leisure pursuits and activity
preferences. All these studies fail to identify a critical facet that is an important focus
in this study i.e. whether gender differences play a role in influencing choice of park
to visit. Further, gender roles may play a significant part in influencing destination
choice.
2.3.6.1.3. Annual Personal Income and Choice Behavior
Annual income has been cited as an important determinant of demand for tourism to a
destination (Odunga, 2004). Peter and Olson (2010) notes that people at different
income levels tend to have quite different values, behaviours, and lifestyles.
Marketers often divide American households into three income categories: down-
scale (under $33,000 income per year), up-scale (over $55,000 per year), and
middle income ($33,000 to 55,000 per year). Therefore, there is need to understand
income cohort variations and their influence on choice behaviour of tourists.
2.3.6.1.4. Marital Status and Choice Behavior
A person‟s family and marital status has an important bearing on the family‟s
spending priorities. Solomon, Bamossey, Askegaard & Hogg (2010) specifically give
an account of the longitudinal changes in spending priorities with changes in marital
status. These changes assist in predicting demand for specific product categories over
time. It is indeed true, that the young bachelors and newlyweds have different
priorities and choice options to the families with young children, single-parent
households as well as those with older children.
34
While a number of research have been proposed to describe family-life stages, their
usefulness has been limited to the fact that they have failed to account for dominant
social trends, such as the changing roles of women, the acceleration of alternative
lifestyles, childless and delayed-child marriages as well as single-parent households
(Solomon, Bamossey, Askegaard & Hogg 2010). Four variables are necessary to
describe these changes: age, marital status, the presence or absence of children in the
home, and their ages. In addition, our definition of marital status (at least for analysis
purposes) must be relaxed to include any couple living together who are in a long-
term relationship. Thus, while room-mates might not be considered „married‟, a man
and a woman who have established a household was, have a similar understanding.
2.3.6.1.5. Family Life-Cycle and Choice Behavior
The concept of the family-life cycle has been predominant in marketing literature,
recognizing the growing influence and change in family needs and expenditures over
time. The family life cycle concepts combine‟s trends in family and income
composition in determining demand dynamics and spending patterns. However,
according to (Hall, 2005) recent cultural changes in the American societies such as
delayed marriages, childless marriages, independent working women and increased
divorce rates have questioned the adequacy of the traditional life-cycle model.
The family life cycle as traditionally referred to in many reports, considers family
circumstances of white urban middle-class Americans in the 1950s and the 1960s,
which were much more child-oriented period in the developed world, than the
situation now. The figure (2.4) presents a modern family life cycle developed by
Murphy and Staples (1979) as developed by Peter and Olson (2010) that incorporates
the traditional family life cycle but adds several other family types to account for the
more diverse family structures of today.
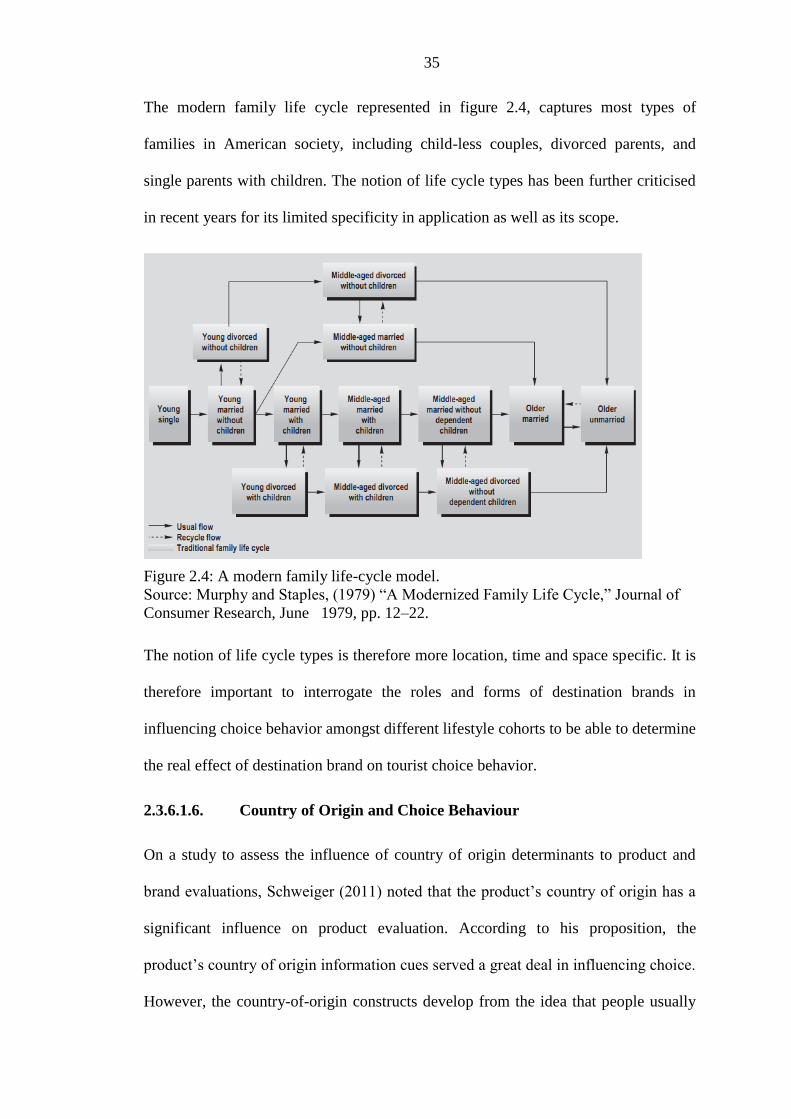
35
The modern family life cycle represented in figure 2.4, captures most types of
families in American society, including child-less couples, divorced parents, and
single parents with children. The notion of life cycle types has been further criticised
in recent years for its limited specificity in application as well as its scope.
Figure 2.4: A modern family life-cycle model.
Source: Murphy and Staples, (1979) “A Modernized Family Life Cycle,” Journal of
Consumer Research, June 1979, pp. 12–22.
The notion of life cycle types is therefore more location, time and space specific. It is
therefore important to interrogate the roles and forms of destination brands in
influencing choice behavior amongst different lifestyle cohorts to be able to determine
the real effect of destination brand on tourist choice behavior.
2.3.6.1.6. Country of Origin and Choice Behaviour
On a study to assess the influence of country of origin determinants to product and
brand evaluations, Schweiger (2011) noted that the product‟s country of origin has a
significant influence on product evaluation. According to his proposition, the
product‟s country of origin information cues served a great deal in influencing choice.
However, the country-of-origin constructs develop from the idea that people usually

36
make stereotyped judgements with regard to others and other countries (Giraldi and
Ikeda, 2010). The country-of-origin effects, consequently refers to the influence of the
product‟s country-of-origin on people‟s attitude and behaviour towards the product. It
therefore follows that for the country-of-origin effect to occur, the consumer must
consider information about the product‟s country of origin relevant to his or her
choice process.
Hofstede (2001) noted that country-of-origin influences play a significant role in
shaping the beliefs and values of individuals. In his studies, differences in orientations
and values of people in different countries would be categorized along five key
dimensions: power distance (PDI), Individualism (IDV), Masculinity (MAS),
Uncertainity avoidance (UAV) and long-term orientation (LTO). From a tourism
point of view, the destination choice process is deemed to have many determinants,
some of which may be significantly ethnocentric or country patriotic in nature for
domestic and regional tourists or may be out of curiosity or may be motivated by
other determinants. It is therefore important to assess whether the country brand
perception has a significant impact on tourist choice behaviour and brand preferences.
2.3.6.1.7. Level of Education and Choice Behavior
Education is seen as a means of widening one‟s horizons and perspectives in life.
Odunga (2003) posits that education is itself a primary motive to travel as well as a
primary indicator of tastes and socio-economic status in society. It is noted that
tourists within the digital and social media era have a higher scale of information than
the others within the word of mouth and mainstream media era. It has also been
proposed that individual within the same educational cohorts have the tendency to be
homophilous (Kotler 2006). Homophily, hereby referring to the degree that pair of
individuals are similar in terms of education, social status and beliefs. In such a case,
37
Solomon, Bamossey, Askegaard & Hogg (2010) notes that effective opinion leaders
tend to be slightly higher in terms of status and educational attainment than those they
influence.
2.3.6.1.8. Occupation and Choice Behaviour
In a study to assess the factors influencing the motor vehicle brand of choice by
Australians, Ahmed (2013), contend to the fact that different brands communicated
preference amongst different occupational and age cohorts. People of the same
occupation, are seen to prefer similar tastes, ideas and values. This may be due to the
fact that they have similar lifestyles due to their income levels and common tastes.
However, there has not been a study to determine the influence of occupation on
destination choice. The heterogeneity of tourists arriving in a destination assumes that
there are common cohorts that determine choice. This study seeks to do just that.
2.3.6.1.9. Tourist Length of stay and Choice Behaviour
The length of stay of a tourist is a key technical issue defining tourism activity in any
destination. Time dimension regarding tourism activity involves a minimum stay of
24 hours away of home to a maximum stay of less than a year (Buhalis, 2006). This
includes the cruise-ship passengers and tourists in transit at a particular point of
embarkation/departure and excursionists who stay for less than 24 hours at a
destination. According to Alegre and Pou (2006), length of stay can be explained by
two types of variables: first variables associated with personal and family
characteristics and secondly economic variables such as level of income or the price
of the holiday.
Length of stay is an important determinant of the socio-economic impact of tourism to
any economy. Several researchers have considered length of stay as a significant

38
segmentation variable in estimating the determinants of tourist spending (Mok and
Iverson 2000). However, according to Alegre and pou (2006), most of the literature
on length of stay are descriptive showing how length of stay varies with nationality,
age, occupation, etc. and not inferring on the causal relationship between the actual
trip experiences and the length of stay (Menezes, Moniz and Vieira, 2008) . It is
expected that the Destination brand would heighten the expectations of tourists and
therefore influence the average length of stay of tourists to the destination. The study
seeks to investigate the impacts of destination brand on tourist choice behavior.
2.3.6.1.10. Preferred Mode of Travel Arrangement and Choice Behaviour
Tourists have diverse expectations on holiday. These include the preferred mode of
travel arrangement. Their choice of travel arrangement is to some extent not unique to
the destination visited but is influenced by certain factors. There is dearth of
information on how and (or) whether the preferred mode of travel arrangement has an
influence on park brand choice. Packaged tours consist of accommodation and
transport advertised and sold together by a tour operator as a package. Group
inclusive tours are inclusive tours for members of an organized group-based air fare
offered by scheduled airlines (Medlik, 2003). The members of such a tour must travel
together on the same outward and return flights. The Global Development Solutions
LLC notes that with the all inclusive package, more than 80% of the tourist payment
is directed to an off-shore account to minimize EU income tax (as indicated by figure
2.5).

39
Figure 2.5: Structure of all-inclusive operation in Kenya.
Source: World bank (2010)
Less than 20% of the tourists‟ payment is sent to the hotel in Kenya. The remaining
operating costs for the hotel are cross-subsidized through other operations owned by
the European tour operator.
2.3.6.2. Brand information sources and Choice
Stylidis, Terzidou and Terzidis (2007) characterized perception change agents into
several categories of stimulus factors that had a key impact on tourist perception of a
destination. These information sources were deemed critical in the destination choice
and selection process. The information sources were then categorized as primary
information sources (previous experience and intensity of visit) and secondary
information sources (induced, organic and autonomous). These sources were deemed
basic towards informing choice and may have a significant impact on the destination
perception.

40
2.3.6.3. Social Determinants and Choice Behaviour
Social factors play a key role in determining destination choice (Evangelista and
Dioko 2010). Social determinants refer to the influence of a significant others on
individual decision-making process. In fact Dann (1966) notes that tourists are
implied semioticians, constructing their gaze around well-defined signs or markers.
Deutsh and Gerard, (1955) initially conceived social influences as of two types i.e.
informational and (or) normative. Informational social influence as the influence of
the significant others play as a primary source of information, while the normative
social influence results from the influence to conform to the expectations of a
significant others. These aspects of social influence play a significant role in
influencing tourist behaviour.
According to Jacob and Shreyer (1980), this dominant role of social influence is
referred to as goal interference theory. With the tenets of the theory, recreation exists
because of goal interference because of another‟s behaviour. In essence Jacob and
Shreyer (1980) identify various social players within the tourist‟s experience. Tourists
perceive different aspects of social interaction as critically important through
interaction with self, other travellers as well as the host.
Additional insights on the role of the social dimensions of tourist behaviour are
brought out by Rathmun (1995) who interrogated the role of group identity. In his
ideas, the tourist interaction creates a sense of group identity amongst members of a
social status orientation and this determines the tourist‟s choice behaviour. These
significant others may play a significant role in influencing tourists‟ behaviour. Rojek
(1997) however, added that the main elements in the social construction of tourism
places include:-

41
All tourist sights depend strongly on the differentiation processes that help
distinguish them from ordinary places (Urry 1990). These are supported by
signifiers in the landscape and the marketing industry;
The nature of the differentiation between ordinary and extraordinary (tourism
places) is cultural, as the relationship between the tourist and the sight is
always culturally detailed and mediated;
The distinction between the ordinary and the extraordinary seems to have been
undermined by „television culture‟.
However, the effect of brand recall may be facilitated through social factors and
therefore it is important to assess whether the social influencers play a significant role
in influencing park brand choice. A study conducted by Glasson, Godfey and Goodey
(1995) shows the relationship between user satisfaction and park use levels in a
number of contexts. The study findings significantly supported the significant role of
social dimensions of tourist behaviour. It is therefore important that the study
addresses the social role of tourists and its impacts on brand choice.
2.3.6.4. Institutional determinants and Choice Behaviour
The roles of tour operators and travel agents in influencing choice are an issue of
concern. Middleton, Ranchhod, Morgan & Fyall (2009) note that the distribution
channels play an important function of not just conveying products, but they also
transfer marketing communications, bookings, payments and management
information. The involvement of institutions within the consumer buying process is
critical. Kotler and Armstrong (1991) noted that the customer can either book each
element of the trip directly with the principal suppliers or through the services of a
tour operator, travel agent and a ground handling agent (See figure 2.6).
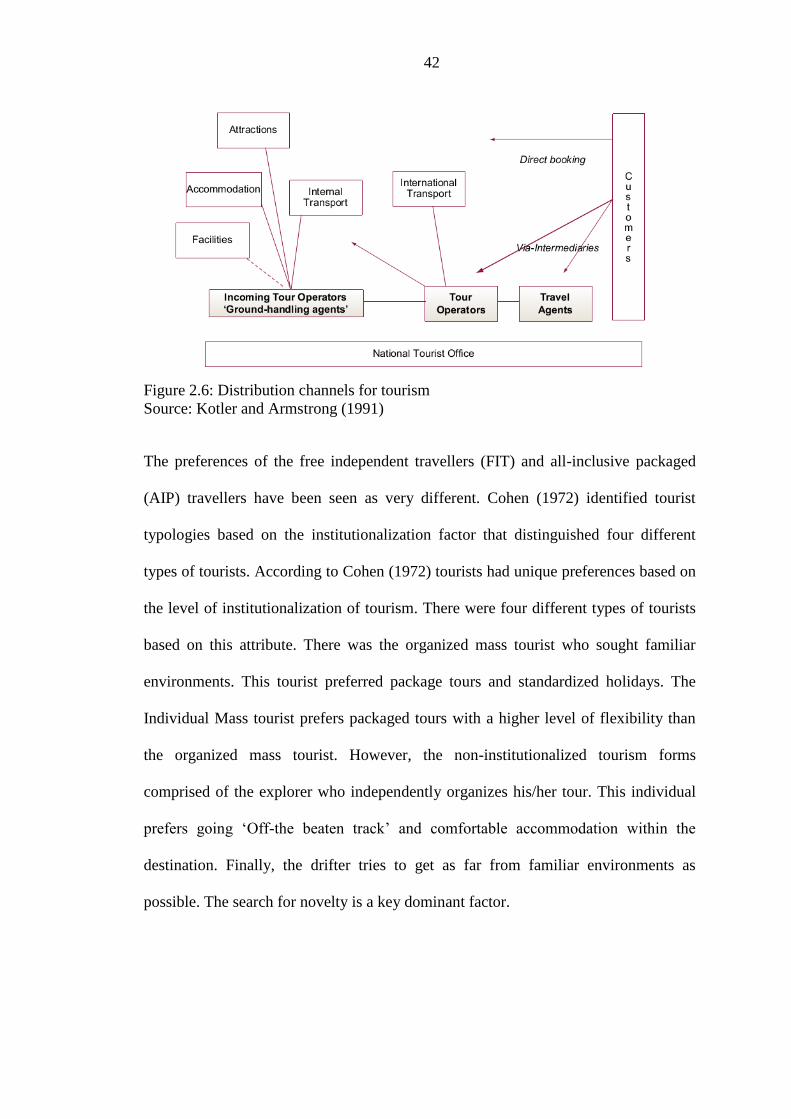
42
Figure 2.6: Distribution channels for tourism
Source: Kotler and Armstrong (1991)
The preferences of the free independent travellers (FIT) and all-inclusive packaged
(AIP) travellers have been seen as very different. Cohen (1972) identified tourist
typologies based on the institutionalization factor that distinguished four different
types of tourists. According to Cohen (1972) tourists had unique preferences based on
the level of institutionalization of tourism. There were four different types of tourists
based on this attribute. There was the organized mass tourist who sought familiar
environments. This tourist preferred package tours and standardized holidays. The
Individual Mass tourist prefers packaged tours with a higher level of flexibility than
the organized mass tourist. However, the non-institutionalized tourism forms
comprised of the explorer who independently organizes his/her tour. This individual
prefers going „Off-the beaten track‟ and comfortable accommodation within the
destination. Finally, the drifter tries to get as far from familiar environments as
possible. The search for novelty is a key dominant factor.
43
2.3.7. Antecedent factors influencing Tourists’ Choice Behaviour
Understanding destination choice behaviour of tourists is central to destination
marketers so they can decide upon which marketing strategies to use to influence
consumer choice. For the leisure traveller, destination choice is more prevalent than
the business traveller segment, whose choice of destination is dictated by employment
needs, business priorities and business trade (Ashworth and Goodall, 1988). Solomon,
Bamossey, Askegaard & Hogg (2006) further notes that leisure-based travellers
choose a destination brand because they like its „perception‟ or because they feel that
its „personality‟ somehow corresponds with their own. In concurrence to these
notions, Buckley and Papadopolous (1986) observe the importance of buyer
behaviour as a key element in destination choice.
However, growing consumer sophistication has seen branding and other non-rational
considerations and attitudes be seen to influence buyer behaviour significantly. These
include destinations that are constantly promoting competitive products to consumers
direct, and via the travel trade/intermediaries; Advertising, promotion, and the
interplay of personal recommendation, family and friends, consumer trends, taste and
the internet that combine to shape buyer choice behavior; as well as buyer
characteristics that are filtered by the learning behavior of consumers, which has been
influenced by marketing/ recommendation. Ashworth and Godall (1988) observed
that if a tourist is dissatisfied they will not recommend the destination to others.
Therefore the personal characteristics and attributes are critical to buyer behavior.
Consumer behavior may be also shaped by the perceptions of consumers on brands
and perceptions of the destination and their pasts experiences;
Apart from this, the consumers‟ choice of the destination may be influenced by
various demographic, geographic, psychographic and behavioural determinants.

44
Johnson and Devonish (2008) noted that past research analysing differences between
tourists from different countries visiting the same destination confirms that variables
such as tourist perceptions of a destination, satisfaction levels, socio-demographic
profiles and tourist activities that may vary according to country of origin and do
significantly influence destination choice.
Goossens (1998) attempted to explain the relationship between pull and push factors
of pleasure motivation. He argued that the concept of emotion was the psychological
factor that connected two sides of motivation. In this context, „tourists are pushed by
their (emotional) needs and pulled by the (emotional) benefits of activities and
destinations. Pull factors that affect the destination‟s appeal and experiences offered
may emanate from the attractions, public and private amenities, accessibility, human
resources, local communities culture, destination perception and character as well as
price. Therefore consumer dispositions and marketing stimuli are factors that have a
significant impact on choice. Push factors may also emanate from the cost
implications on travel, promotion and information content, reference from tour
operators, service quality, activity at the destination, previous travel experience and
market presence of the park.
2.3.8. Brand Perceptions and Choice Behaviour
Marino (2012) noted that destinations with recorgnizable perception and positive
tourist perceptions have a higher probability of being chosen. Further, Marino (2012)
continues and hypothesizes that post-visit destination perception has a distinct
implications on post-visit. There were three distinct levels of destination perception
that can influence a destination‟s perception. These include perception “a priori”, “in
situ” and “a posterior” perception. Perception “a priori” refers to the mental
construction an individual makes of a place without having a physical connection with
45
the place. This actually meant that the tourist has already visited a place before they
physically visit it. Perception “in situ” is central to the tourist‟s experience because it
contrasts what the tourists have imagined. Finally, the „a posterior‟ perception refers
to the fact that tourists‟ experience doesn‟t end with the trip but tourists consume
some elements in their daily life.
However, Gunn (1988) noted that perception is developed at two different levels, the
organic level and the induced level. The organic level developed internally due to the
actual experience or visitation, while the induced forms because of externally received
and processed information such as advertisements, publicity and word of mouth.
Upon further reflection, it is important to note that, brand perception serves as a
critical element of brand strategy. Marino (2012) and Gunn (1988) take a critical
reflection on the role of brand perception perception on the ultimate destination brand
strategy. However, it is important to note that most of the studies on brand perception
and brand perception have not focussed exclusively on how the “a priori”, “in situ”
and “futuristic” destination brand perception influences the behavioural intentions of
tourists.
2.3.9. Brand personalities and Choice Behaviour
Personality can be defined as a dynamic and organized set of characteristics possessed
by a person that uniquely influences his or her cognitions, motivations, and behaviors
in various situations (Keller 1993). The essence of branding lies on creating a unique
personality type which forms the stable unique qualities of an individual. Although
most studies in personality psychology have focused on the human personality,
minimum attention has focused on park brand personality. The limited existing
attention devoted to brand personality itself, however, is not unreasonable, since

46
empirical evidence reveals that consumers have a higher preference for brands that
they perceive to possess a personality that reflects their self-identity.
This preference is due to the fact that the personality traits associated with a brand
facilitates consumers‟ expression of their actual or ideal dimensions of the self (Belk,
1988; Sirgy, 1982) and society (Kaplan, Yurt, Guneri & Kurtulus, 2008). Application
of brand personality to tourism has been relatively new within the academic world. In
existing consumer behavior literature, Aaker (1997) defines brand personality as “the
set of human characteristics associated to a brand”. It was argued that the symbolic
use of brands was possible due to the fact that consumers often imbue brands with
human personality traits.
McGuiggan (2000) however, supported the hypothesis that destination personality
exerts significant role within the destination perception construction through
establishing leisure activity preferences. Consumers can then easily think about
brands as if they were celebrities. Aaker (1997) further, provided proof for the
validity of such brand personality constructs through a scaling process, i.e. the Brand
Personality Scale (BPS) which consisted of five generic dimensions: sincerity,
excitement, competence, sophistication and ruggedness. Such a framework suggested
that, the brand personality dimensions operate in different ways and that they
influence consumer preference in different ways.
However, Aaker (1997) and Fournier (1998) failed to influence existing suppositions
on the efficacy of these brand personalities. Azoulay and Kapferer (2003) have
challenged the conceptual validity of Aaker‟s (1997) brand personality scale. Recent
research raises some concerns over the generalizability and conceptual validity of
Aaker‟s scale (e.g. Austin, Siguaw & Mattilla 2003; Azoulay and Kapferer, 2003). In
a recent study, Hosany, Ekinci & Uysal (2006) investigated the relationship between
47
destination brand perception and destination brand personality for tourism
destinations, and identified three dimensions: (1) Excitement; (2) Sincerity; and (3)
Conviviality. Yet, according to Kaplan, Yurt, Guneri & Kurtulus (2008), further
support for applicability of the model to place brands is very limited in the literature,
which underlines the need for further studies to test the applicability of the brand
personality framework in other contexts.
Following trait theories as posited by Smith (2010) identified, a refined Destination
Brand Personality Scale (DBPS) with the fundamental view that human
characteristics that become associated to a destination have the ability to enhance the
likelihood of developing an emotional connection to a place by a tourist. These human
characteristics, following trait theories were termed as destination personalities. This
study sought to fill in to these gaps by studying the impacts of the destination
personalities on behavioural intentions of tourists.
2.3.10. Brand Loyalty and Choice behavior
Repeat purchase/ loyalty reflect a habit, behavioural disposition in which past
responses are triggered directly by contextual cues (Neal, Wood & Quinn, 2007).
When consumers attain a favourable attitude towards a brand, they tend to develop
some loyalty / attachment to the specific product/brand. However, according to Sheth
(2004), true loyalty incorporates both behaviour and an attitude change. Attitudes
qualify emotive reaction towards liking or disliking feelings towards a place or
destination. The attitudes are inherent beliefs (cognitions/thoughts), evaluative
feelings (affect) or actions (conations) that are manifest on an individual. In a similar
tone Keller (1993) notes that such inherent beliefs about the brand may lead to
specific behavioural responses such as recall, recognition, associations or beliefs that
are inherent with the brand (See figure 2.5).
48
Loyalty can therefore be biased (non-random) behavioural response (i.e. purchase),
expressed over time by some decision-making unit, with respect to one or more
alternative brands out of a set of brands, and is a function of psychological processes.
However, most attempts to explain the phenomenon (brand loyalty) seemingly
address the behavioural aspect of brand loyalty, overlooking the attitudinal facet of
brand loyalty. A consumer could buy the same brand simply out of habit or
convenience, without thinking much about it. Therefore, attitudes are crucial towards
brand evaluations. Brand loyalty can result from certain purchase and consumption
habits that activate context- response associations or may result from favourable
brand attitudes that inform behavioural intentions before and during the point of
purchase.
However, Keller (1993) notes that brand loyalty may arise as a result from brand
knowledge which in turn evokes brand awareness and a unique brand perception (see
figure 2.7). With time, consumers recognize the brand and form associations and
recall of the brand.
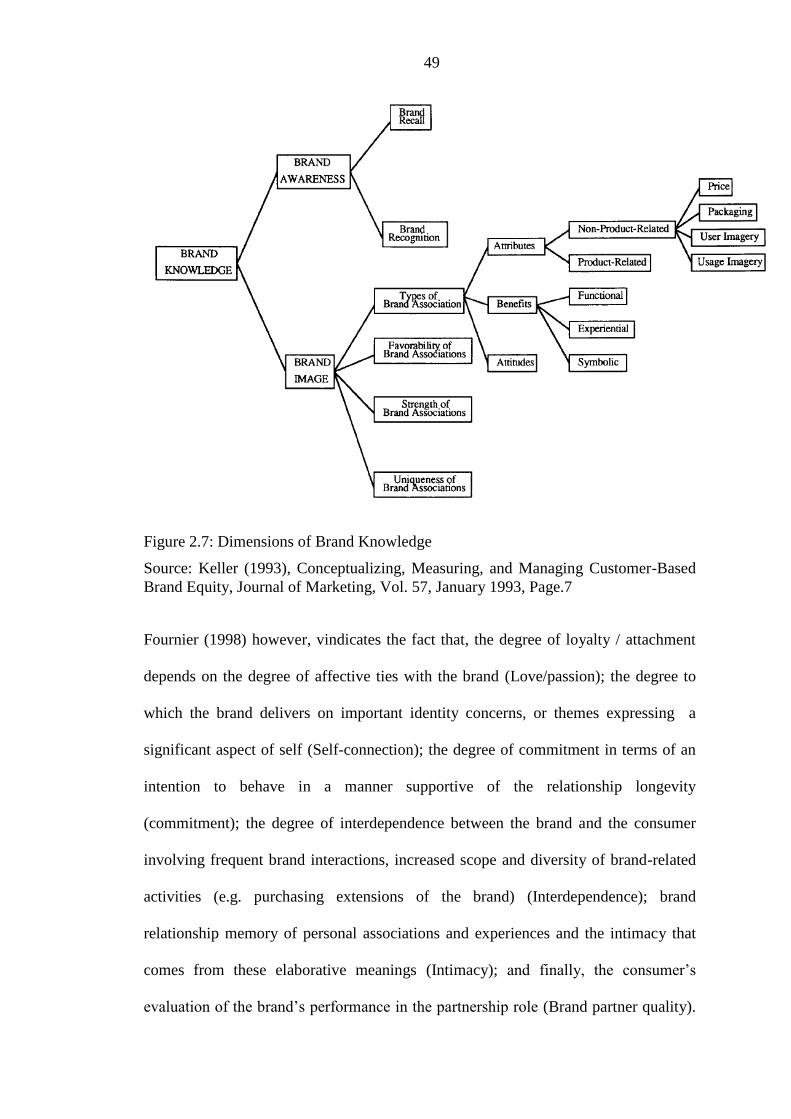
49
Figure 2.7: Dimensions of Brand Knowledge
Source: Keller (1993), Conceptualizing, Measuring, and Managing Customer-Based
Brand Equity, Journal of Marketing, Vol. 57, January 1993, Page.7
Fournier (1998) however, vindicates the fact that, the degree of loyalty / attachment
depends on the degree of affective ties with the brand (Love/passion); the degree to
which the brand delivers on important identity concerns, or themes expressing a
significant aspect of self (Self-connection); the degree of commitment in terms of an
intention to behave in a manner supportive of the relationship longevity
(commitment); the degree of interdependence between the brand and the consumer
involving frequent brand interactions, increased scope and diversity of brand-related
activities (e.g. purchasing extensions of the brand) (Interdependence); brand
relationship memory of personal associations and experiences and the intimacy that
comes from these elaborative meanings (Intimacy); and finally, the consumer‟s
evaluation of the brand‟s performance in the partnership role (Brand partner quality).

50
The study would measure both the behavioural and attitudinal constructs as measures
of brand attachment/loyalty.
2.4. Conceptual Framework
The conceptual model (Figure 2.5) depicts a conceptualized view on the proposed
effects of brands on tourists‟ choice behaviour. It specifically hypothesizes that brand
personalities may affect tourists choice behaviour. These consumers may however
differ in terms of personal characteristics, tastes and preferences. Personal influences
include factors such as inherent tourist characteristics e.g. Demographic, Socio-
economic background, lifestyle and Country of origin (Odunga 2006; Odunga and
Maingi 2011) as well as social and institutional determinants. Behavioural intentions
were hereby dichotomized as post – behavioural intentions (satisfaction, loyalty and
recommendations).
When consumers choose amongst brands, according to research by Blain, Levy and
Richie (2005), they rationally consider practical issues about the relative uniqueness
of the different brands on offer They also assess the symbolic value of the brand
based on their perceptions of these destinations (Howard and Sheth, 2010) as well as
the marketing information available from different sources (Odunga and Maingi,
2011). The consumers are bombarded with various marketing communication
(Advertising, online, Sales promotion, Personal selling, PR, word of mouth etc.),
which inform their behavioral intentions.

51
Figure 2.8: Conceptual framework
Source: Research data (2014)
At the same time, they evaluate different brand personalities, forming a gestalt view
about the brand that most closely represents the perception with which they wish to be
associated. The destination‟s uniqueness may make it stand-out from other areas by
virtue of its inherent appeal being stronger than its competitors‟ (UNWTO, 2010).
Further, the conceptual model postulates that social determinants such as group-based
travel behaviour on all-inclusive travel may significantly influence tourists‟ post-
behavioural intentions on brands. In many cases, tourism behaviour may be group-
oriented rather than being an individual consumption activity and therefore, travel
H3
H4
CHOICE BEHAVIOUR
Park Brand
Personality
Park Brand
Revisit
Park Brand
Recommendation
Park Brand
Differentiation
PARK BRANDING
Antecedent
factors Tourist
Profile
Park Brand
Perception
Independent variables Moderating variables Dependent variables
52
parties are a significant influence on group-oriented travel behaviour and continues to
set the fad on the definition of „fashionable‟ and „attractive‟.
The researcher sought to decipher how such normative beliefs about the branded park
are conditioned by the brand personalities. It is noted that, according to the Self-
perception congruence hypotheses, (Dolich, 1969; Grubb and Grathwohl, 1967; Levy,
1959; Sirgy, 1986; Sirgy and Su, 2000), consumption-related constructs (attitudes,
purchase intentions, etc.) among other factors, are influenced by the perceived match
of the consumers self-concept and by certain aspects of the brand‟s “perception” (user
perceptionry, brand/ product personality, etc.).
In addition, Chrishnall (1995) noted that institutional references/determinants to
buying behaviour are fundamental to interpreting buyer behaviour. Chrishnall (1995)
categorized institutional references to buying behavior as informational (from whom
information was sought about a prospective purchase); value-expressive (the likely
enhancement of self-perception or perceived attachment to the group) or utilitarian
(whether the prospective purchase was approved by group members and seen to be
complying with group norms). Chrishnall‟s inferences on group inclusive tourists‟
behavioural patterns indicated the significance of travel intermediaries‟ role in
distribution of the product to the consumer. The study would therefore assess the role
of institutional references in influencing choice behaviour/ behavioural intentions of
tourists as compared to the brand itself.
Moscardo (1996) highlighted the important role of brand knowledge as a crucial link
between travel and destination choice. They argued that motives provide travellers
with expectations for activities and destinations are seen as offering these activities.
As highlighted in the conceptual model, the study seeks to assess the efficacy of brand
53
knowledge in influencing tourists‟ choice behaviour. With the growth in demand for
„experiential‟ holidays, destinations increasingly need to satisfy travellers‟ emotional
needs (UNWTO, 2010). Therefore, the tourists‟ symbolic value and perceptions of
the destination would significantly influence their expectations in terms of
(Attraction, Accommodation, Amenities, Security, value, Hospitality of community,
Accessibility). Post-tourists choice behaviour may be influenced by their experience
in terms of Quality, Service, Interpretation and Distinctiveness of the tour experience.
2.5. Conclusion
In conclusion it is worth noting that existing branding research fails to capture the fact
that an actual evaluation of the brand is vital for product development. A summary of
literature reviewed as well as gaps identified in the literature is provided in table 2.2
. Varied literature on brand meaning research maintains that brand experiences are
diverse. With the rapid globalization of the tourism market, consumers from different
cultural scopes have different perceptions, needs, tastes, attitudes, beliefs and value
systems. Therefore a brand can be ultimately represented by core features that are
surrounded (or “augmented”) by less tangible features which include emotional
values, added services and ubiquitous experience.
Literature review has also suggested that consumers develop long-term and short-term
relationships with brands that may be discerning, independent or acquisitive. There is
need to focus more on determining the strength or intensity of the relationship rather
than focus solely on conceptualizing the scope of such meanings. There is need to test
the relationship between the consumer perception of the brand (need for social
adjustment, utilitarian, hedonic, value expressive mode and affiliation) with the brand
communication (in terms of quality, word of mouth, CSR, attitude and defend). Park
branding approaches were reviewed assessing their roles and efficacy. The need to

54
move to more interpretative paradigms need not be underscored. Existing research on
destination choice have failed to underscore the need for brand identity created by the
seller about natural and/or artificial attractions, histories and people, to be portrayed
as a positive brand perception and may become motivations of choice to the
consumers.

55
2.6. Summary of reviewed literature
Topic Sources and
theoretical models
Key contributions Key Gaps
The Branding concept and
scope of brand meanings
Dayal (1998)
Searle (1995)
Balakrishnan (2008)
Kotler (2000)
External identity
Provides meaning and identity to a product
Actual origin of products
Brands control an estimated US$ 1,480 billion
in tourism spending globally
Brands identify the source of character to a
product
Brands connect to individualized consumer
goals, needs and motives
An actual evaluation of brand meaning
is vital for product development
The deconstruction of brand meaning
has proved quite intricate owing to the
dynamic nature and context of brands
There is need to investigate how
significantly do brands connect with
individualized consumer perceptions
Characteristics and nature of
brands
Berry (2000)
Balakrishnan, Nekhili
and Lewis (2011)
Grassl (1999)
Iliachenko (2005)
Keller (2003)
Hankinson (2004)
Brands having consistent image
Brand attributes, which include functional,
symbolic, emotive and experiential elements
Different brand components
(History, Geography, Narrative, Brand
Archetypes, Cultural values and Sensory
perceptions)
Cultural, Historical and Nature dimensions
Six main elements (Brand culture, personality,
name, logo, slogan)
Brands as: communicators; perceptual entities;
enhancers; relationships
The need to consider the scope of
destination brands
It is important to assess the core
elements of the brand as well as the
scope of brands‟ meanings to the
senders and the intended recipients.
Roles of brands Guzman (2012)
Kapferer (1997)
Brands were just another step within the
marketing process to sell products
The brand was a sign which disclosed hidden
qualities of the product which were inaccessible
to contact
Sub-surface meaning of brands to
consumers seems to have evolved over
time, history and other factors.
There is need to establish the ideal
destination‟s brand meaning and appeal
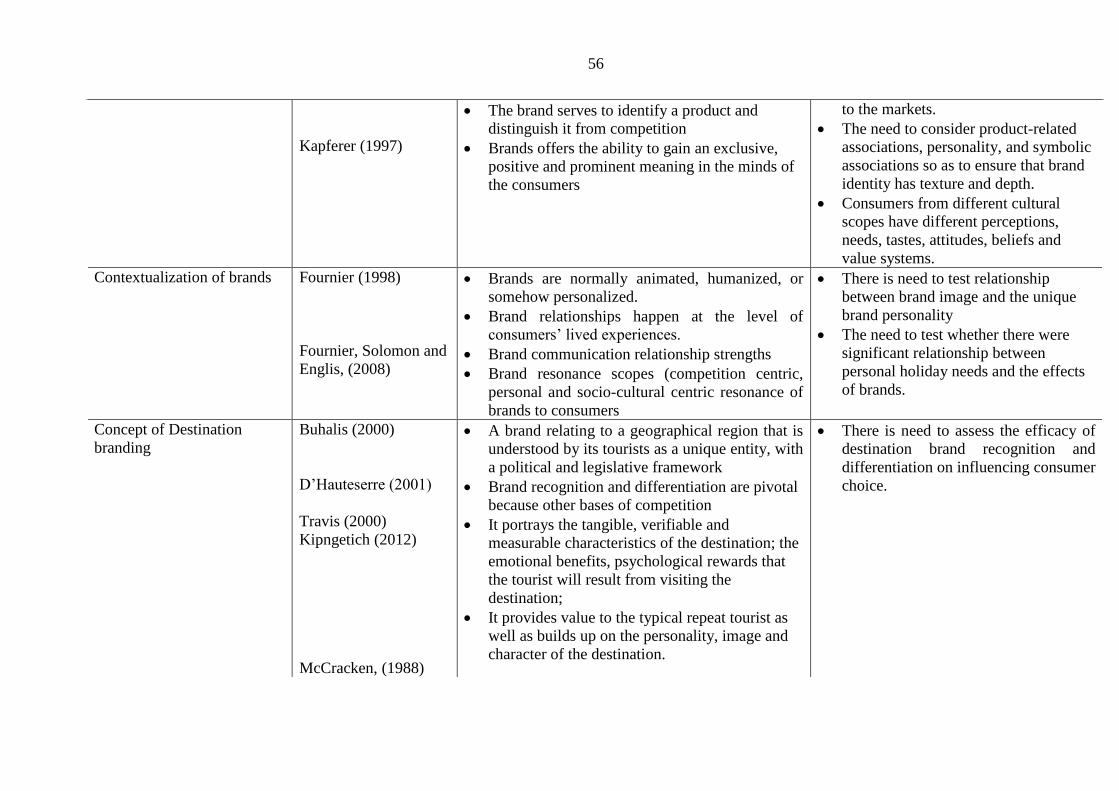
56
Kapferer (1997)
The brand serves to identify a product and
distinguish it from competition
Brands offers the ability to gain an exclusive,
positive and prominent meaning in the minds of
the consumers
to the markets.
The need to consider product-related
associations, personality, and symbolic
associations so as to ensure that brand
identity has texture and depth.
Consumers from different cultural
scopes have different perceptions,
needs, tastes, attitudes, beliefs and
value systems.
Contextualization of brands Fournier (1998)
Fournier, Solomon and
Englis, (2008)
Brands are normally animated, humanized, or
somehow personalized.
Brand relationships happen at the level of
consumers‟ lived experiences.
Brand communication relationship strengths
Brand resonance scopes (competition centric,
personal and socio-cultural centric resonance of
brands to consumers
There is need to test relationship
between brand image and the unique
brand personality
The need to test whether there were
significant relationship between
personal holiday needs and the effects
of brands.
Concept of Destination
branding
Buhalis (2000)
D‟Hauteserre (2001)
Travis (2000)
Kipngetich (2012)
McCracken, (1988)
A brand relating to a geographical region that is
understood by its tourists as a unique entity, with
a political and legislative framework
Brand recognition and differentiation are pivotal
because other bases of competition
It portrays the tangible, verifiable and
measurable characteristics of the destination; the
emotional benefits, psychological rewards that
the tourist will result from visiting the
destination;
It provides value to the typical repeat tourist as
well as builds up on the personality, image and
character of the destination.
There is need to assess the efficacy of
destination brand recognition and
differentiation on influencing consumer
choice.

57
The Destination Brand
building process
Heath (2007)
Olins, (2002)
Morgan, Prichard and
Pride (2004)
Five phases in destination brand building process
Four core elements of the destination brand
architecture
To assess whether these core elements
of the brand architecture significantly
influence choice
Choice Behaviour Woodside and
Lysonski (1989) Cognitive, affective and conative states
Pre-behavioral and post-behavioral choice
There is need to focus more on
determining the strength or intensity of
the relationship rather than focus solely
on conceptualizing the scope of such
meanings.
There is need to test the relationship
between the consumer perception of
the brand (need for social adjustment,
utilitarian, hedonic, value expressive
mode and affiliation) with the brand
communication (in terms of quality,
word of mouth, CSR, attitude and
defend).
Theoretical frameworks Shin, Misra and
Horsky, (2010)
Ajzen and Fishbein
(1980)
Vieceli and Sharp
(2001)
Kahnemann and
Tversky (1979; 1984)
Bayesian Brand Learning Process Theory
Theory of Planned Behaviour
Recall inhibition effect of brands
Prospect theory of brands
The effect of park brand perception on
tourist choice
Determinants of tourist behavioural
intentions and choice
Park Brand recall/inhibition effect
Loss aversion effect of brands
58
CHAPTER THREE
3.0 RESEARCH METHODOLOGY
3.1. Introduction
The methodology chapter of the study presents the research design, the study areas,
population and sample, sampling technique, data collection procedure and data
analysis procedures adopted in the research.
3.2. Research Design
On the level of research design for empirical studies, the researcher adopted a
descriptive survey research design for the study. Descriptive survey designs examine
a characteristic (exposure) and an outcome in the same respondents. Dayal (2004)
notes that survey research design seeks to explain a certain phenomenon in its natural
occurrence and the determinants of the phenomenon aimed at discovering inferences
or causal relationships. Quantitatively, a descriptive survey design allows one to
quantify, relate and justify attitudes of greater number of respondents (Kothari, 1999).
The survey method was used to generalize why and whether park branding influenced
tourists‟ choice behaviour. The structure of the survey research design allowed the
researcher to conduct a pre-test study to assess the reliability and validity of the
instruments as well as the constructs under measurement.
3.3. Study Area
The focus of the study was on four protected areas: i.e. two of the most visited
branded parks in Kenya and two underutilized parks. These are:- L. Nakuru National
park (Premium park); Nairobi National park (Urban Safari); Hell‟s gate National Park
(Scenic and special interest park) and Aberdares National park (Wilderness park).
59
These parks have been categorized in different ways. Though the four parks have
commonalities in the sense, they focus more exclusively on wildlife tourism and they
are all remains of the white highlands and are in close connectivity (See figure 3.1 )
and have close proximity to the private ranches and Nairobi (JICA, 1997). The
choices of the four parks were also important as they are the focus of the Vision 2030
policy initiatives and highlighting the efficacy of park branding in this context.
3.4. Target Population
The population under study was defined by the tourists to randomly selected branded
parks in Kenya. It was perceived to be infinite in nature as the numbers of tourists
were uncertain to determine but projections of the hypothetical population would have
been used in the study. The focuses of the study were on four protected areas: i.e. two
of the most visited branded parks in Kenya and two underutilized parks. These are:-
L. Nakuru National park (a premium park); Nairobi National park (an urban safari);
Hell‟s gate National Park (a scenic and special interest park) and the Aberdares
National park (a wilderness park).
3.5. Sampling Unit
The sampling unit for the collection and presentation of information in the study was
divided into two levels based on the sampling method. This constituted of branded
parks as the primary sampling units (clusters) and the second level constituted of the
tourist/tourist visiting branded parks. Hall (2008) presented a model for describing
different forms of temporal mobility. These forms significantly varied between
tourists based on the average length of stay in the destination visited.

60
3.6. Sampling Technique
A Two-stage Cluster sampling technique was adopted in coming up with a
representative sample. The technique is applied when the objective is to select a
representative sample by increasing the efficiency of survey administration and
reducing travel costs. There are two types of cluster samples. One-stage cluster
sampling involves splitting the population into clusters, then randomly selecting a
proportion of these cluster. All units within the clusters are then chosen to participate
in the survey (Rugg and Petre, 2007). Two-stage Cluster Sampling however, involves
splitting the population into clusters and selecting a proportion of these clusters to
form a sampling frame. The second stage would then involve a random selection of a
proportion of individuals within each chosen cluster to participate in the survey
(Fienberg, 2003).
Mugenda and Mugenda (1999) clarifies that cluster sampling is appropriate where it is
possible to classify members of a population that are homogeneous within themselves
and heterogeneous without themselves. This sampling procedure ensured that each
sector achieved representation in the sample. The scope of this survey was
considerably broad yet the time limit was a great constraint. The KWS branded
terrestrial parks of the Republic of Kenya as by April 18th
2011 comprised the
Universe from which cluster samples were constituted for analysis (See sampling
frame in appendix 3 and also table 3.1).
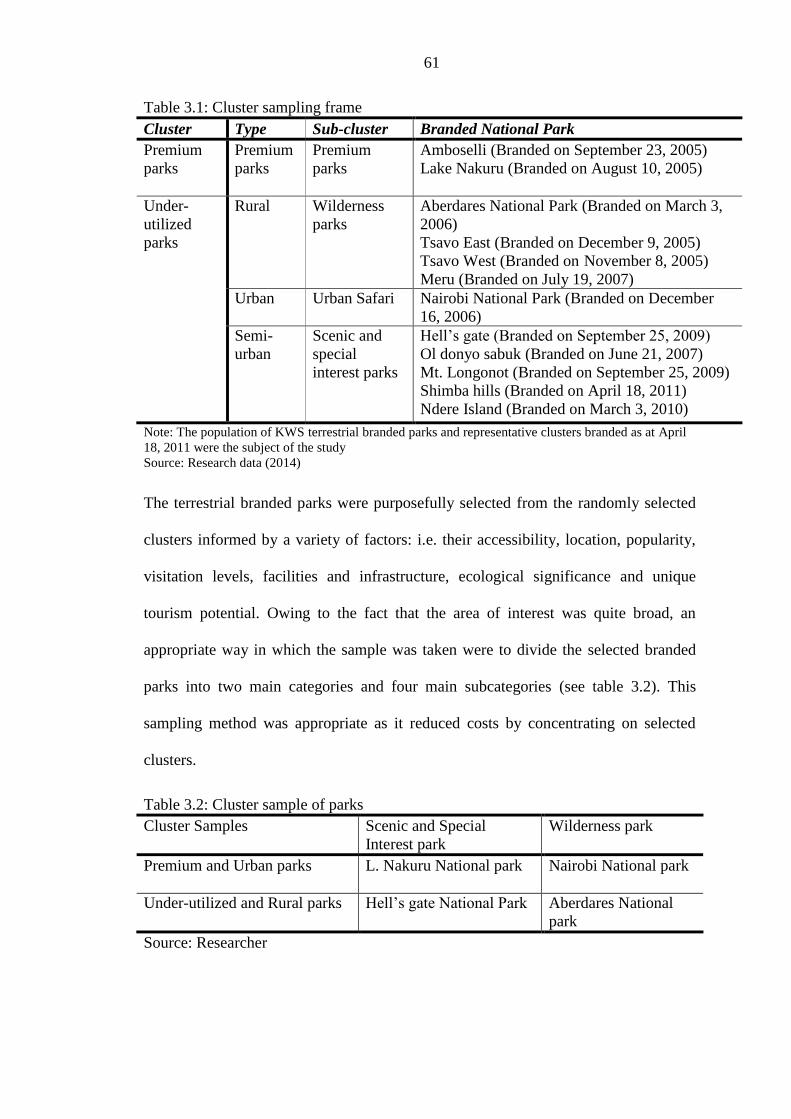
61
Table 3.1: Cluster sampling frame
Cluster Type Sub-cluster Branded National Park
Premium
parks
Premium
parks
Premium
parks
Amboselli (Branded on September 23, 2005)
Lake Nakuru (Branded on August 10, 2005)
Under-
utilized
parks
Rural Wilderness
parks
Aberdares National Park (Branded on March 3,
2006)
Tsavo East (Branded on December 9, 2005)
Tsavo West (Branded on November 8, 2005) Meru (Branded on July 19, 2007)
Urban Urban Safari Nairobi National Park (Branded on December
16, 2006)
Semi-
urban
Scenic and
special
interest parks
Hell‟s gate (Branded on September 25, 2009)
Ol donyo sabuk (Branded on June 21, 2007)
Mt. Longonot (Branded on September 25, 2009)
Shimba hills (Branded on April 18, 2011)
Ndere Island (Branded on March 3, 2010)
Note: The population of KWS terrestrial branded parks and representative clusters branded as at April
18, 2011 were the subject of the study
Source: Research data (2014)
The terrestrial branded parks were purposefully selected from the randomly selected
clusters informed by a variety of factors: i.e. their accessibility, location, popularity,
visitation levels, facilities and infrastructure, ecological significance and unique
tourism potential. Owing to the fact that the area of interest was quite broad, an
appropriate way in which the sample was taken were to divide the selected branded
parks into two main categories and four main subcategories (see table 3.2). This
sampling method was appropriate as it reduced costs by concentrating on selected
clusters.
Table 3.2: Cluster sample of parks
Cluster Samples Scenic and Special
Interest park
Wilderness park
Premium and Urban parks
L. Nakuru National park
Nairobi National park
Under-utilized and Rural parks Hell‟s gate National Park Aberdares National
park
Source: Researcher
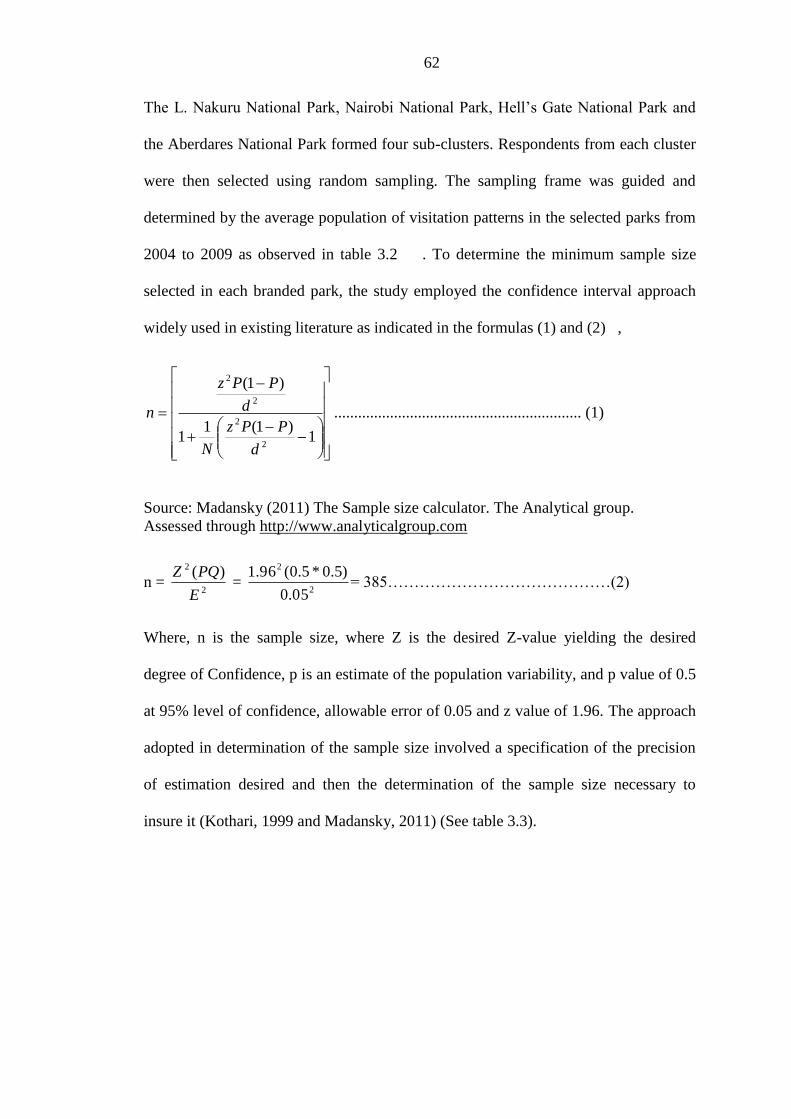
62
The L. Nakuru National Park, Nairobi National Park, Hell‟s Gate National Park and
the Aberdares National Park formed four sub-clusters. Respondents from each cluster
were then selected using random sampling. The sampling frame was guided and
determined by the average population of visitation patterns in the selected parks from
2004 to 2009 as observed in table 3.2 . To determine the minimum sample size
selected in each branded park, the study employed the confidence interval approach
widely used in existing literature as indicated in the formulas (1) and (2) ,
1)1(1
1
)1(
2
2
2
2
d
PPz
N
d
PPz
n .............................................................. (1)
Source: Madansky (2011) The Sample size calculator. The Analytical group.
Assessed through http://www.analyticalgroup.com
n = 2
2 )(
E
PQZ =
2
2
05.0
)5.0*5.0(96.1= 385……………………………………(2)
Where, n is the sample size, where Z is the desired Z-value yielding the desired
degree of Confidence, p is an estimate of the population variability, and p value of 0.5
at 95% level of confidence, allowable error of 0.05 and z value of 1.96. The approach
adopted in determination of the sample size involved a specification of the precision
of estimation desired and then the determination of the sample size necessary to
insure it (Kothari, 1999 and Madansky, 2011) (See table 3.3).

63
Table 3.3: Sample size calculation
Sample Size for Given Precision
Confidence Level (C.L) Estimation 80% 90% 95%
Z-score 1.2816 1.645 1.96
Precision +/- 5%
Infinite Population Size 9,999,999
Confidence Level (C.L) Estimation 80% 90% 95%
Assumed P 90% 60 98 139
Conservative P 50% 165 271 385
Formula adopted from Madansky, (2011).
Where:-
Precision +/-: is the allowable discrepancy between the proportion estimated from the
sample and the true population proportion P;
Assumed P: is the closest overestimate of that proportion i.e. 90%; and
Conservative P: is the magnitude of the population proportion/ choice leading to the
largest sample size needed to estimate the population proportion with
desired precision regardless of what the population proportion may be.
Madansky (2011) recommends 50% if one has no idea of the
magnitude of the population proportion.
The sampling precision levels of estimated sampling proportions were identified
based on the estimated proportion of the population visitation (as indicated in table
3.4).

64
Table 3.4: Sample size estimation.
National Park
Average monthly
population
(2009)
Estimated
proportion
of
population
(2009)*
Estimated
sample
size
L.Nakuru N.Park 23,916 0.35 135
Aberdare N.Park 1916 0.16 62
Nairobi N. Park 10,083 0.25 96
Hells Gate N. Park 2,000 0.24 92
TOTAL 385
Source: Researcher * Note that the trends are as indicated by Table 3.0
3.7. Type of Data
The research was based on the collection of primary and secondary data. Primary data
was collected through direct communication with the respondents i.e. through the use
of questionnaires. However, Secondary data was used to depict pertinent issues, as
they existed before the study. It would also be used as a basis to confirm / contrast
findings of the study. Various sources from the journals, conference reviews, books
and magazine articles were used for the purpose.
3.8. Pre-testing the Questionnaire
The research instruments were pre-tested to determine their validity and reliability. It
was administered to a small number of respondents drawn from the population of
interest. There were key aspects that were important for the researcher to identify,
which include whether the respondents had difficulty in understanding words/
questions, whether the sentence structure were complex?, whether the respondents
interpreted the questions the researcher intended and also the level of interest the
respondents had in filling through the questionnaires. Specifically, pre-testing served
65
to ascertain the appropriateness and relevance of the questions. Various techniques
were instituted for this purpose.
3.8.1. Test of Validity
Validity is the most important criterion, which indicates the degree to which an
instrument measures what it is supposed to measure (Kothari, 1999). Content validity
of a construct is established when its indicators represent the subject and semantic
meaning of the construct (Weiber and Mühlhaus 2010). It is demonstrated through
expert opinions and pretesting of the measurement scales (Cronbach and Meehl 1955;
Nunnally 1967). The research sought the views of the Head of Marketing Division,
Kenya Wildlife Service as well as the former Director, Kenya Wildlife Service on the
content validity of the instrument. It was noted that there was need for the researcher
to discuss the findings in relations to the confounding variables and contextual
elements that affected the outcomes of the study in terms of tourist perceptions of the
park brands.
3.8.2. Test of Reliability
To measure the reliability of the instrument (Questionnaire), the instrument was
subjected to a reliability test to ensure that the measurement instrument yielded
consistent results. Prior to initiating the study, the instrument was administered in a
consistent fashion to enhance reliability of the measurement instrument. Specifically,
the inter-rater reliability method was used to assess the correlation of scores between
the respondents pre-tested. Inter-rater reliability measures homogeneity in responses,
and essentially involves cross-administering the same questionnaire to the same
people by two or more raters/interviewers so as to establish the extent of consensus on
use of the instrument by those who administer it. The intraclass correlation coefficient
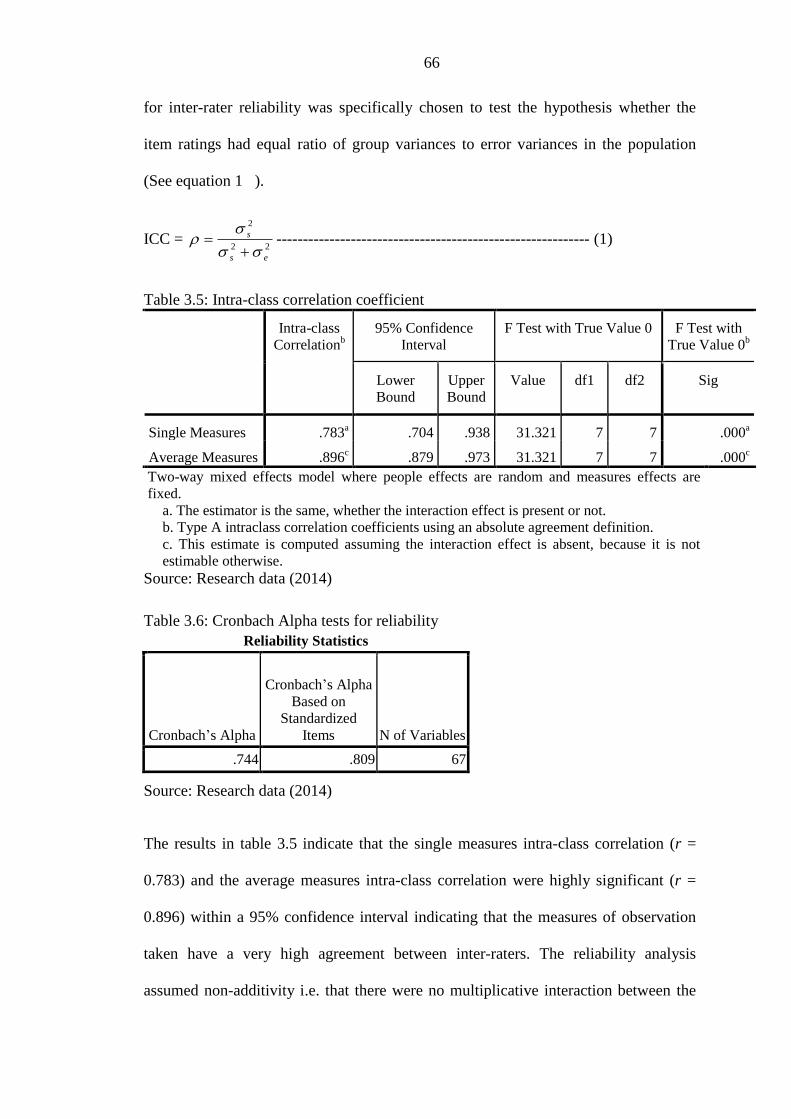
66
for inter-rater reliability was specifically chosen to test the hypothesis whether the
item ratings had equal ratio of group variances to error variances in the population
(See equation 1 ).
ICC = 22
2
es
s
----------------------------------------------------------- (1)
Table 3.5: Intra-class correlation coefficient
Intra-class
Correlationb
95% Confidence
Interval
F Test with True Value 0 F Test with
True Value 0b
Lower
Bound
Upper
Bound
Value df1 df2 Sig
Single Measures .783a .704 .938 31.321 7 7 .000
a
Average Measures .896c .879 .973 31.321 7 7 .000
c
Two-way mixed effects model where people effects are random and measures effects are
fixed.
a. The estimator is the same, whether the interaction effect is present or not.
b. Type A intraclass correlation coefficients using an absolute agreement definition.
c. This estimate is computed assuming the interaction effect is absent, because it is not
estimable otherwise.
Source: Research data (2014)
Table 3.6: Cronbach Alpha tests for reliability
Reliability Statistics
Cronbach‟s Alpha
Cronbach‟s Alpha
Based on
Standardized
Items N of Variables
.744 .809 67
Source: Research data (2014)
The results in table 3.5 indicate that the single measures intra-class correlation (r =
0.783) and the average measures intra-class correlation were highly significant (r =
0.896) within a 95% confidence interval indicating that the measures of observation
taken have a very high agreement between inter-raters. The reliability analysis
assumed non-additivity i.e. that there were no multiplicative interaction between the
67
cases and the items. Further, the researcher assumed that the errors were uncorrelated
and the questionnaires were coded consistently. Alpha test was also conducted to
assess the internal consistency and reliability measures which were based on the
correlation among the variables comprising the set. The standardized composite alpha
value of 0.809 was considered as highly significant in this case (See table 3.6 ).
3.9. Data Collection Procedures
Data collection involves the process of gathering and measuring information on
variables of interest, in an established and systematic fashion that enables one to
answer the research questions, test hypotheses and evaluate outcomes (Rugg and
Petre, 2007). Churchill (1996) and Wadawi (2008) give an account of factors to be
considered while choosing the particular data collection method:-
a) Versatility – the ability of a technique to collect information on a wide variety
of primary data of interest to the researcher;
b) Speed and cost – the extent to which data can be collected fast to facilitate
control over data gathering and the cost of data collection;
c) Objectivity and accuracy – the extent to which the data collection method is
focused on the research problem, objectives and its level of accuracy
These considerations were deemed critical in informing the decision of the range and
choice of data collection method. Initially, the researcher sought to attain a research
permit from the relevant authorities to undertake the research. Kenya Wildlife Service
offered a research permit on the same in accordance with the research charter and the
KWS policy on Academic Research (See attached Appendix 1). Following successful
permission to conduct the research within the National Parks, the researcher pre-tested
the instruments and subsequently ensued to conduct a data collection. The research
68
instruments involved in the study included a questionnaire. Participants in the study
were assured of respondent anonymity and confidentiality in the course of the
research.
3.9.1. Research Instrument
The Data were collected by use of a Questionnaire targeting the travellers, which is
attached within the Appendix A section. Before the questionnaires were developed, a
number of factors were considered in the design. These factors were in line with
Cohen, Manion and Morrison‟s (2004) recommendations:- Step 1: Formulation of
clear, specific and measurable research objectives; Step 2: A clear description of the
targeted population, therefore enabling the researcher to develop questions in such a
way that was understood by the respondents; Step 3: Formulation of questionnaire
questions in order to answer research objectives; Step 4: Deciding an appropriate level
of measurement for each question; Step 5: Determining appropriate statistical
techniques to be used; Step 6: Ordering and organization of these questions; Step 7:
Consulting experts in the specific area of study to ascertain their opinion on whether
the questions addressed relevant issues.
In this line, it is important to note that the questionnaire was forwarded to the Kenya
Wildlife Service – Biodiversity Research and Monitoring Department for review.
Consultations with the Head of Marketing were critical during this phase. Step 8:
Adherence to ethical standards were maintained to ensure that the rights of
respondents as human beings would be respected at all times as prescribed by the
researcher (Cohen, Manion and Morrison 2004).
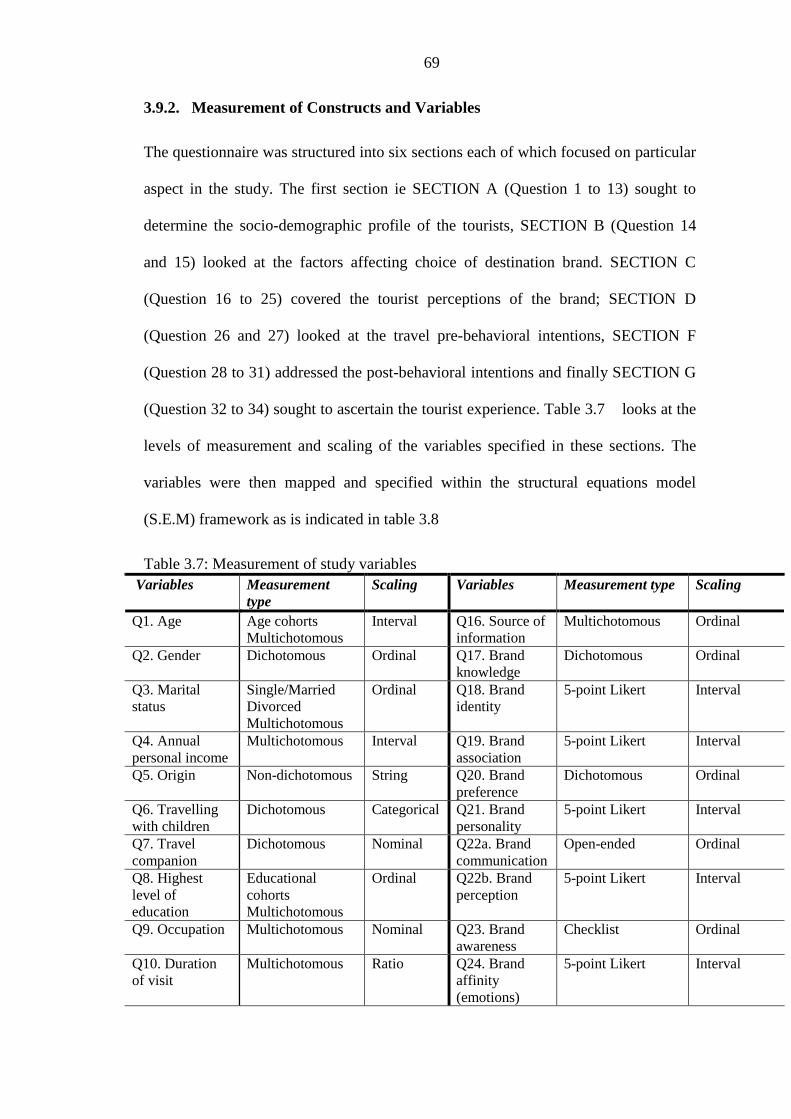
69
3.9.2. Measurement of Constructs and Variables
The questionnaire was structured into six sections each of which focused on particular
aspect in the study. The first section ie SECTION A (Question 1 to 13) sought to
determine the socio-demographic profile of the tourists, SECTION B (Question 14
and 15) looked at the factors affecting choice of destination brand. SECTION C
(Question 16 to 25) covered the tourist perceptions of the brand; SECTION D
(Question 26 and 27) looked at the travel pre-behavioral intentions, SECTION F
(Question 28 to 31) addressed the post-behavioral intentions and finally SECTION G
(Question 32 to 34) sought to ascertain the tourist experience. Table 3.7 looks at the
levels of measurement and scaling of the variables specified in these sections. The
variables were then mapped and specified within the structural equations model
(S.E.M) framework as is indicated in table 3.8
Table 3.7: Measurement of study variables
Variables Measurement
type
Scaling Variables Measurement type Scaling
Q1. Age Age cohorts
Multichotomous
Interval Q16. Source of
information
Multichotomous Ordinal
Q2. Gender Dichotomous
Ordinal Q17. Brand
knowledge
Dichotomous
Ordinal
Q3. Marital
status
Single/Married
Divorced
Multichotomous
Ordinal Q18. Brand
identity
5-point Likert Interval
Q4. Annual
personal income
Multichotomous Interval Q19. Brand
association
5-point Likert Interval
Q5. Origin Non-dichotomous String Q20. Brand
preference
Dichotomous
Ordinal
Q6. Travelling
with children
Dichotomous Categorical Q21. Brand
personality
5-point Likert Interval
Q7. Travel
companion
Dichotomous Nominal Q22a. Brand
communication
Open-ended Ordinal
Q8. Highest
level of
education
Educational
cohorts
Multichotomous
Ordinal Q22b. Brand
perception
5-point Likert Interval
Q9. Occupation Multichotomous Nominal Q23. Brand
awareness
Checklist Ordinal
Q10. Duration
of visit
Multichotomous Ratio Q24. Brand
affinity
(emotions)
5-point Likert Interval
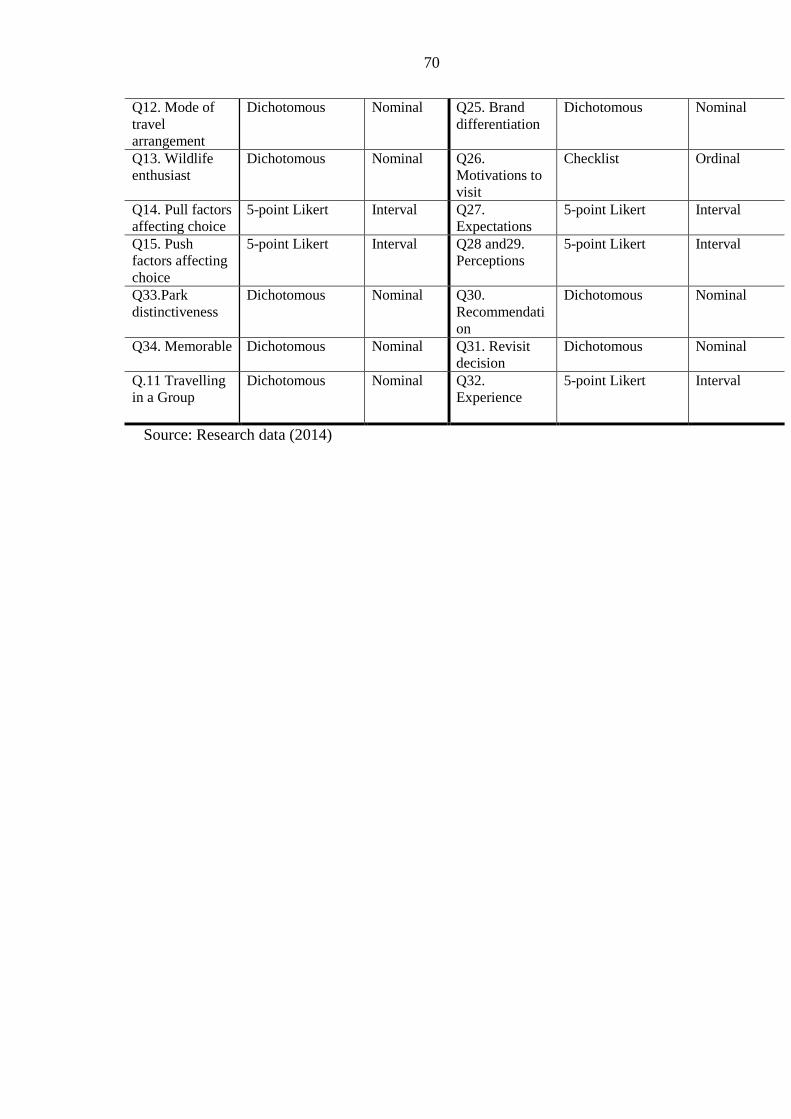
70
Q12. Mode of
travel
arrangement
Dichotomous Nominal Q25. Brand
differentiation
Dichotomous Nominal
Q13. Wildlife
enthusiast
Dichotomous Nominal Q26.
Motivations to
visit
Checklist Ordinal
Q14. Pull factors
affecting choice
5-point Likert Interval Q27.
Expectations
5-point Likert Interval
Q15. Push
factors affecting
choice
5-point Likert Interval Q28 and29.
Perceptions
5-point Likert Interval
Q33.Park
distinctiveness
Dichotomous Nominal Q30.
Recommendati
on
Dichotomous Nominal
Q34. Memorable Dichotomous Nominal Q31. Revisit
decision
Dichotomous Nominal
Q.11 Travelling
in a Group
Dichotomous Nominal Q32.
Experience
5-point Likert Interval
Source: Research data (2014)

71
Table 3.8: Constructs and measurements of variables
Source: Research data (2014)
Latent
Variable
Indicators Latent Variable Indicators Latent
Variable
Indicators
Behavioural
intention (1)
(Independent)
Recomm(y1) Park brand
personality
(3)
Lively (x15) Demographic
characteristic
s (5)
Age(x35)
Mamorable(y2) Romantic(x16) Agesq(x36)
Revisit(y3) Beautiful(x17) Gender(x37)
Peaceful(x18) Income(x38)
Pull factors (1) Destination image(x1) Attractive(x19) Education
position(x39)
State of Infrastructure
(x2)
Cheerful(x20) Grpsize(x40)
Safety and Security
(x3)
Intruiguing(x21) Lenstay(x41)
Travel agency
recommendation (x4)
Dangerous(x22) Grp Travel(x42)
Web info (x5) Depressing(x22) Travel arragement
mode (x43)
Destination attractions
(x6)
Fragile(x23) Expectations
(5)
Accqual (x44)
Local cultures(x7) Indepedent(x24) Distinctiveness of
attraction (x44)
Push factors (2) Cost of holiday (x8) Park brand
perception (4)
Like the brand(x25) Interpret qual(x45)
Promotion (x9) Brand entices to
visit(x26)
Activity (x46)
Reference from tour
operator(x10)
Brand grabs one‟s
attention(x27)
Security (x47)
Service quality (x11) Brand represents
Kenya(x28)
Roads(x48)
Destination activities
(x12)
Brand is
appealing(x29)
Hospitality (x49)
Previous travel
experience (x13)
Brand is
attractive(x30)
Weather (x50)
Accomodation quality
(x14)
Brand is
internationally
recorgnized (x31)
Access(x51)
Experience (6) Accqual (x54) Brand is visible
online (x32)
Scenic view(x52)
Distinctiveness of
attraction (x55)
Brand is persuasive
(x33)
Wildlife diversity
(x53)
Interpret qual(x56) Brand potray‟s
reliability (x34)
Activity (x57)
Security (x58)
Roads(x48)
Hospitality (x49)
Weather (x50)
Access(x51)
Scenic view(x52)
Wildlife diversity (x53)
72
The respondents were obtained from a random issuance of the questionnaires at the
main park exit points as well as the tourism facilities within the parks. On issuance of
the permit by the relevant KWS authorities (See appendix One) as well as national
government authorities, the study was conducted within the mentioned national parks
in Kenya. The data collected within this phase was subjected to a screening process
where outliers and inconsistencies were determined. The diagnostic phase enabled the
researcher to identify missing data and the effects of the missing data on the reliability
of the results.
3.10. Ethical Considerations
There were several ethical considerations that were considered during the study.
Creswell (2003) affirms that the researcher is obligated to respect the rights, needs,
values and desires of the informants. Further, Miles and Huberman (2004) provided
apt recommendations on the adoption of ethical considerations in research ie.
a) Informed consent (All the participants have full knowledge of what is
involved);
b) Honesty and trust (The researcher ensures that the study was truthful while
analysing and presenting the data);
c) Privacy, confidentiality and anonymity (The study ensures that it does not
intrude too much into group behaviour) as well as;
d) Intervention and advocacy (The researcher ensures that there are necessary
interventions if any respondent portrayed harmful behaviour in the course of
being issued or responding to the questionnaire).

73
3.11. Data Analysis Framework
This research sought to analyze and discuss the results in relations to the research
objectives (cf. 1.4), as well as the underlying research hypotheses (cf. 1.6). In this
context, several quantitative analytical methods were adopted to present the findings
accurately and adequately. These methods are specified in this section, therefore
providing a specification of the rationale, underlying assumptions and specific
measures.
3.11.1. Structural Equations Modeling
Specifically, Structural Equations Modelling (S.E.M) was adopted to examine how
park branding influences tourists‟ holiday choices and the antecedent factors
influencing their choice as well as explore the influence of brand personalities on
behavioural intentions of tourists to Kenyan parks. S.E.M is adopted when the goal of
the researcher is to investigate the influence of a factor (unobserved latent variable)
that is assumed to exert causal influence on observed variables. Such analysis is
termed as Confirmatory Factor Analysis (CFA).
Coefficient estimated was done using the maximum likelihood method which
minimizes discrepancies in estimation. Measures of fit for the model evaluation were
then instituted to assess the reliability and validity of the model estimates. Goodness
of fit measures were specified for both the „saturated‟ model and the „independence‟
model. Within the saturated model, no constraints were made on the population
moments (Bollen and Long, 1993) and the independence model there are constraints
set on the population moments (MacCallum 1990).
There were various assumptions of Structural Equation Modeling that were needed to
be met before conducting S.E.M. Firstly, S.E.M required that the sample size is

74
adequate as the covariance and correlations are more stable when using larger samples
as indicated by (Tabachnick.and Fidell, 2001). Recommended sample size is 200
(Boomsma, 1983). In Structural Equations Modeling, the hypothesized or causal
relationships were represented using a path diagram (See figure 29.0). The S.E.M
diagram consists of the constructs (unobserved variables), measured variables
(manifest indicator variables), measurement errors and the arrows determining the
relationships between the constructs. In Structural Equations Modeling, there are also
diagnostic tests/ goodness of fit indices that determine whether the model fits the data
or not.
Specifically, the Chi-square to df ration 2/df, the Normed Fit Index (NFI), the
Comparative Fit Index (CFI), the Root Mean Square Error of Approximation
(RMSEA), the Akaike Information Criterion (AIC), the Hoetler Index (HI), as well as
Goodness of fit tests/measures comparing the given model with alternative model
such as the Comparative Fit Index (CFI), Incremental Fit Index (IFI) and the Non-
Normed Fit Index (NNFI).
3.11.2. Univariate and Bivariate Statistics
Descriptive statistics described the basic features of the data in the study. In
particular, a univariate and bivariate analytical approach enabled the researcher to
understand three major characteristics of tourists. These include their demographic
profiles, brand preference as well as behavioural intentions of tourists. These
characteristics include measures of central tendency, distribution and dispersion. All
the three measures of univariate analysis were deemed suitable as they enabled the
researcher to identify the central tendency of distribution of the values. The mean

75
and standard deviation was significant at this stage as it enabled the researcher to
make sense of the nature and context of the distribution.
3.11.3. One-Way ANOVA
Further, the mean ( x ) was used to test the hypothesis (h o ) that the differences in
categorical means of the different study areas are statistically different (See null
hypothesis equation one ). One way ANOVA was specifically used for this analysis.
It tests the statistical model that a single treatment with say k levels has different
population parameters. Contingency tables, cross-tabulations and chi-square were also
used to test whether the probabilities of occurrences within the contingency tables
were significantly independent. OH : 010 pp . Specifically, the Phi coefficient
will be used to test the degree of association between two variables.
3.11.4. Agglomerative Cluster Analysis
Cluster analysis was adopted for preference mapping to identify homogenous groups
of objects (clusters). Objects (cases or observations) in a specific cluster share many
characteristics, but are very dissimilar to objects not belonging to the cluster on the
basis of a defined set of variables. SPSS cluster analysis was conducted to identify the
main dominant market clusters and segments. This is a relatively recent analytical
technique for market research developed by SPSS for market profiling and was used
within the context of this study to conduct a market profiling and define the key
market segments visiting each park.
Andrews and Currim (2003) note that there are a number of techniques in cluster
analysis, which include hierarchical methods, partitioning methods (k-means
clustering) and two-step clustering which is a combination of the two methods.
Hierarchical methods calculate measures of dissimilarity amongst variables/measures

76
by measuring the distances between pairs of objects. These procedures are
characterized by tree-like structure established in the course of the analysis (See
figure 20.0). The clustering under hierarchical methods can be classified into two
based on the direction of clustering: agglomerative and divisive clustering (Arabie
and Hubert, 1994). Punji and Steward (1983) note that Agglomerative clustering
assigns additional objects to clusters as cluster size increases while the divisive
clustering approach involves initially merging all objects in a single cluster, which is
then gradually split up.
Figure 3.1: Hierarchical method of cluster analysis
Source: Punji and Steward (1983) Cluster analysis in marketing research: review and
suggestions for application. J Mark Res 20(2):134–148
The Euclidean distance and log-likelihood procedure were used to measure the
distance of dissimilarity between pairs of objects (See Equation one).
)()(),( cBCBEuclidean yyxxCBd ---------------------------------------- (1)
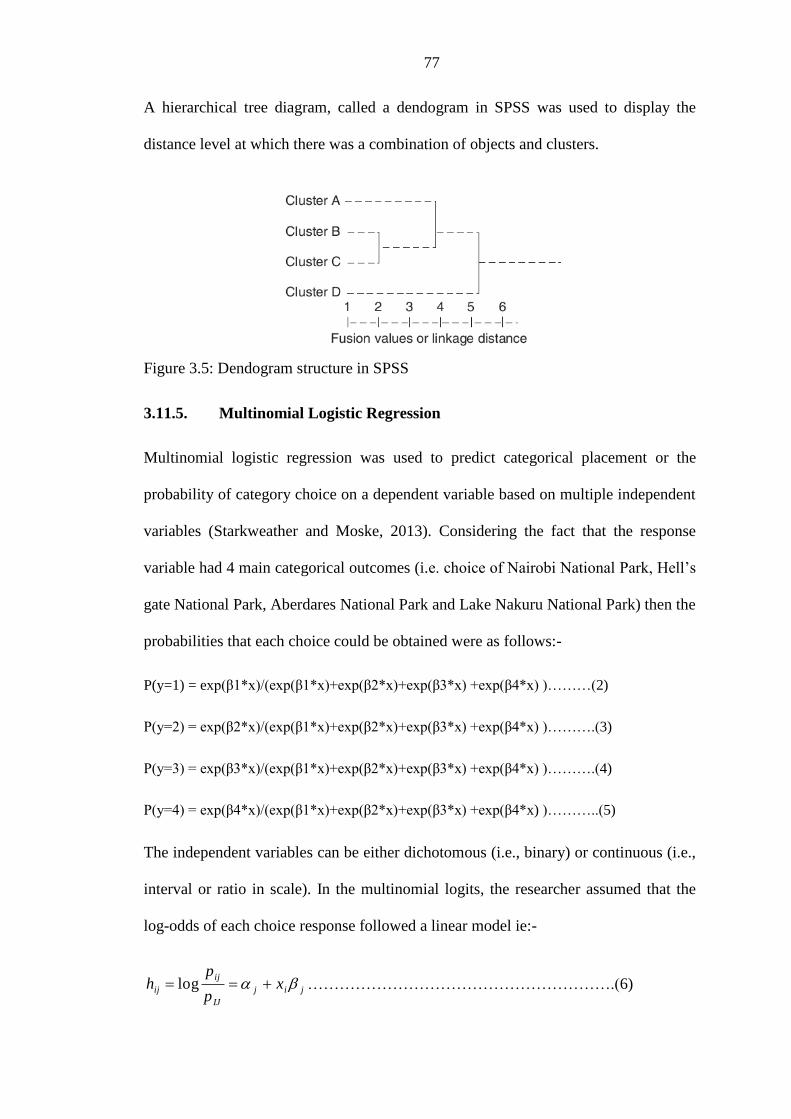
77
A hierarchical tree diagram, called a dendogram in SPSS was used to display the
distance level at which there was a combination of objects and clusters.
Figure 3.5: Dendogram structure in SPSS
3.11.5. Multinomial Logistic Regression
Multinomial logistic regression was used to predict categorical placement or the
probability of category choice on a dependent variable based on multiple independent
variables (Starkweather and Moske, 2013). Considering the fact that the response
variable had 4 main categorical outcomes (i.e. choice of Nairobi National Park, Hell‟s
gate National Park, Aberdares National Park and Lake Nakuru National Park) then the
probabilities that each choice could be obtained were as follows:-
P(y=1) = exp(β1*x)/(exp(β1*x)+exp(β2*x)+exp(β3*x) +exp(β4*x) )………(2)
P(y=2) = exp(β2*x)/(exp(β1*x)+exp(β2*x)+exp(β3*x) +exp(β4*x) )……….(3)
P(y=3) = exp(β3*x)/(exp(β1*x)+exp(β2*x)+exp(β3*x) +exp(β4*x) )……….(4)
P(y=4) = exp(β4*x)/(exp(β1*x)+exp(β2*x)+exp(β3*x) +exp(β4*x) )………..(5)
The independent variables can be either dichotomous (i.e., binary) or continuous (i.e.,
interval or ratio in scale). In the multinomial logits, the researcher assumed that the
log-odds of each choice response followed a linear model ie:-
jij
IJ
ij
ij xp
ph log ………………………………………………….(6)

78
Where αj is a constant and βj is a vector of regression coefficients, for j = 1, 2,…, J-1.
Multivariate diagnostics (i.e. standard multiple regression) were used to assess for
outliers and influential cases. The multinomial model uses the maximum likelihood
estimation to assess the probability for alternative j, given the multinomial model
shown in equation 6. Multinomial logistic regression models do not assume
normality, linearity and homoscedasticity; however the multinomial regression model
assumes independence amongst dependent variable choices. Tests of independence
include the Hausman-McFadden test (H). Further, the model assumed non-perfect
separation that meant that the outcome variables were not perfectly separated by the
predictors and therefore the coefficients were realistically estimated.
According to Ender, P.(2006), there are more than one solutions to the coefficients
that lead to the same probabilities. Therefore, to make the system identifiable, one of
the coefficients should be set to 0 (normalized as the Reference category). The
probability of choosing Aberdares National Park were set to zero (0), therefore
yielding
)exp(
11
xP
j
k
. As a result, the j logit has the form
jij
IJ
ij
ij xp
ph log ……………………………………………………….(7)
The multinomial assumption of specification was withheld that meant that the true
conditional probabilities were a logistic function of the independent variables. It was
also assumed that no important variables were omitted. Sample size specification
guidelines for multinomial logistic regression indicate a minimum of 10 cases per
independent variable (Schwab, 2002).

79
3.12. Summary of Analytical Framework
Research Objectives Sources of
data
Research
design
Data
collection
technique
Data analysis
1. To profile tourists
visiting branded
parks in Kenya,
based on their
choice behavior
Questionnaire
Quantitative
survey
Tourist
questionnaire
Frequencies and
Descriptives
crosstabulations
ANOVA
Cluster analysis
2. To examine
antecedent factors
influencing tourists‟
choice behavior
Questionnaire
Quantitative
survey
Tourist
questionnaire Multinomial logistic
regression
3. To Evaluate
tourists‟ perceptions
of park brands in
Kenya and their
impacts on choice
behavior
Questionnaire
Quantitative
survey
Tourist
questionnaire S.E.M
ANOVA
t-test
4. To Explore the
influence of brand
personalities on
choice behavior of
visitors to Kenyan
parks
Questionnaire
Quantitative
survey
Tourist
questionnaire Structural equation
modeling (S.E.M)
t-test
80
CHAPTER FOUR
4.0 RESULTS AND DISCUSSIONS
4.1 Response rate
The data had been gathered from self and enumerator-administered questionnaires.
The training of enumerators commenced before the pre-tests as well as the main
study. This involved familiarizing them with the study as well as the objectives of the
study. The pre-tests then commenced before the main study would be conducted.
During the main study, questionnaires were reviewed and inspected to ensure that
they were adequately filled. The data collection phase was conducted between a span
of 3.5 months (See schedule in table 4.1). Target numbers of respondents were 385
respondent questionnaires. Total questionnaires collected were completed by 358
respondents in the focal areas under study. This represented an overall response rate
of 93% that were deemed adequate for the analysis.

81
Table 4.1: Schedule of questionnaire issuance
Study area Attribute 2012
Sep
t
Wk
1
Wk
2
Wk
3
Wk
4
Oct
Wk
1
Wk
2
Wk
3
Wk
4
No
v
Wk
1
Wk
2
To
tals
Nairobi
National Park
Questionnaires
issued
45 35 34 33 147
Questionnaires
Targeted
24 24 24 24 96
Questionnaires
received
31 20 22 18 91
Response rate 129 83 92 75 95%
Hell‟s Gate
National Park
Questionnaires
issued
42 36 34 112
Questionnaires
Targeted
31 31 30 92
Questionnaires
received
37 25 26 88
Response rate 119 81 83 96%
Lake Nakuru
National Park
Questionnaires
issued
46 33 34 34 147
Questionnaires
Targeted
34 34 33 34 135
Questionnaires
received
32 23 22 26 103
Response rate 94 67 69 71 76%
Aberdares
National Park
Questionnaires
issued
50 25 25 100
Questionnaires
Targeted
25 25 25 75
Questionnaires
received
23 27 26 76
Response rate 92 108 100 101%
Source: Research data (2014)
4.2 General Findings
4.2.1. Demographic Information
4.2.1.1. Age Profile
An initial analysis of findings indicated that tourists to the four parks had varied
demographic characteristics. For example in terms of Age, Aberdares National park
recorded the highest mean age value ( x = 2.83; = 1.290; cv =0.456), while Hell‟s
Gate National park recorded the lowest mean age value ( x = 1.98; = 0.742; cv
=0.79) (See table 4.2 ). Further, the highest average age of tourists varied more widely
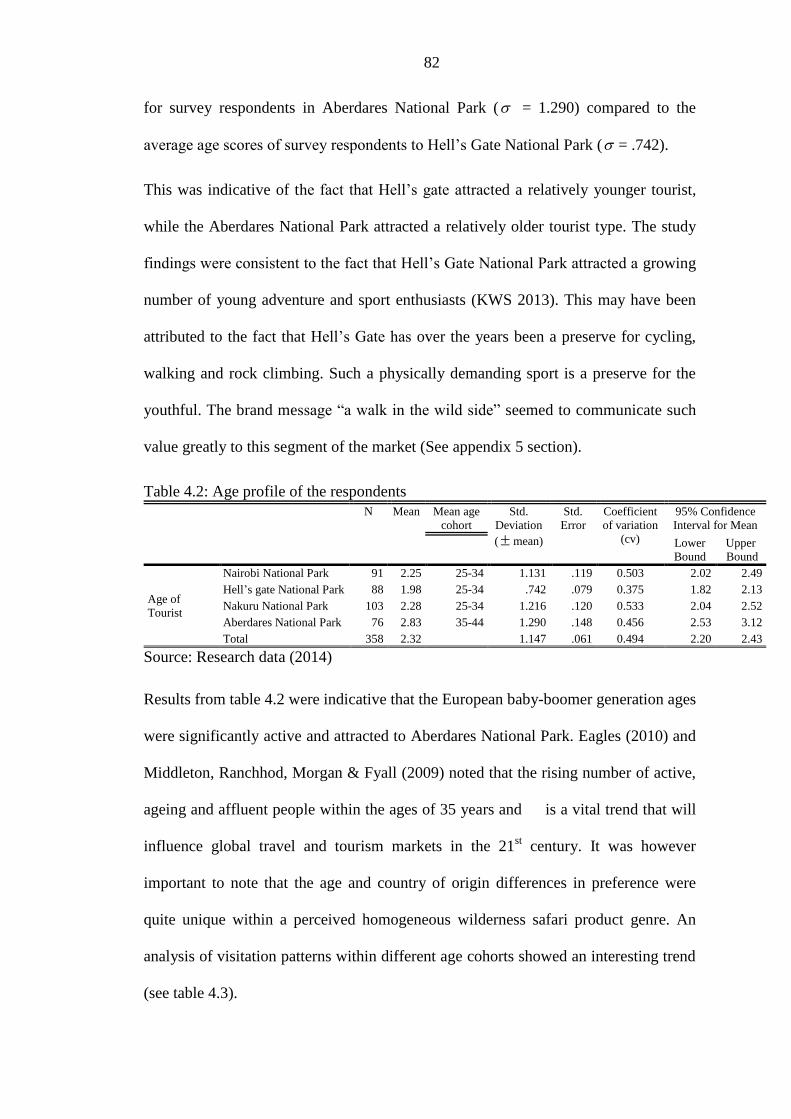
82
for survey respondents in Aberdares National Park ( = 1.290) compared to the
average age scores of survey respondents to Hell‟s Gate National Park ( = .742).
This was indicative of the fact that Hell‟s gate attracted a relatively younger tourist,
while the Aberdares National Park attracted a relatively older tourist type. The study
findings were consistent to the fact that Hell‟s Gate National Park attracted a growing
number of young adventure and sport enthusiasts (KWS 2013). This may have been
attributed to the fact that Hell‟s Gate has over the years been a preserve for cycling,
walking and rock climbing. Such a physically demanding sport is a preserve for the
youthful. The brand message “a walk in the wild side” seemed to communicate such
value greatly to this segment of the market (See appendix 5 section).
Table 4.2: Age profile of the respondents
N Mean Mean age
cohort
Std.
Deviation
( mean)
Std.
Error
Coefficient
of variation
(cv)
95% Confidence
Interval for Mean
Lower
Bound
Upper
Bound
Age of
Tourist
Nairobi National Park 91 2.25 25-34 1.131 .119 0.503 2.02 2.49
Hell‟s gate National Park 88 1.98 25-34 .742 .079 0.375 1.82 2.13
Nakuru National Park 103 2.28 25-34 1.216 .120 0.533 2.04 2.52
Aberdares National Park 76 2.83 35-44 1.290 .148 0.456 2.53 3.12
Total 358 2.32 1.147 .061 0.494 2.20 2.43
Source: Research data (2014)
Results from table 4.2 were indicative that the European baby-boomer generation ages
were significantly active and attracted to Aberdares National Park. Eagles (2010) and
Middleton, Ranchhod, Morgan & Fyall (2009) noted that the rising number of active,
ageing and affluent people within the ages of 35 years and is a vital trend that will
influence global travel and tourism markets in the 21st century. It was however
important to note that the age and country of origin differences in preference were
quite unique within a perceived homogeneous wilderness safari product genre. An
analysis of visitation patterns within different age cohorts showed an interesting trend
(see table 4.3).

83
Table 4.3: Distribution of tourists by age cohorts
Variables Values/
Cohorts
Measure Pooled
model
Nairobi
N.P
Nakuru
N.P
Aberdares
N.P
Hell’s
gate
N.P
Age 16 – 24 Count
% within Age
cohort
% within NP
% of Total
81
100%
100%
22.6%
17a
21%
(18.7%)
4.7%
31a
38.3%
(30.1%)
8.7%
11a
13.6%
(14.5%)
3.1%
22a
27.2%
(25.0%)
6.1%
25 – 34 Count
% within Age
cohort
% within NP
% of Total
164
100%
(45.8%)
45.8%
51a
31.1%
(56.0%)
14.2%
37c
22.6%
(35.9%)
10.3%
27b,c
16.5%
(35.5%)
7.5%
49a,b
29.9%
(55.7%)
13.7%
35 – 44 Count
% within Age
cohort
% within NP
% of Total
60
100%
(16.8%)
16.8%
16a
26.7%
(17.6%)
4.5%
18a
30.0%
(17.5%)
5.0%
12a
20.0%
(15.8%)
3.4%
14a
23.3%
(15.9%)
3.9%
45 – 54 Count
% within Age
cohort
% within NP
% of Total
31
100%
(8.7%)
8.7%
2a
6.5%
(2.2%)
0.6%
10a,b
32.3%
(9.7%)
2.8%
16b
51.6%
(21.1%)
4.5%
3a
9.7%
(3.4%)
0.8%
55 – 64 Count
% within Age
cohort
% within NP
% of Total
16
100%
(4.5%)
4.5%
0a
0.0%
(0.0%)
0.0%
6a,b
37.5%
(5.8%)
1.7%
10b
62.5%
(13.2%)
2.8%
0a
0.0%
(0.0%)
0.0%
> 65 Count
% within Age
cohort
% within NP
% of Total
6
100%
(1.7%)
1.7%
5a
83.3%
(5.5%)
1.7%
1a
16.7%
(1.0%)
0.3%
0a
0.0%
(0.0%)
0.0%
0a
0.0%
(0.0%)
0.0%
Each subscript letter denotes a subset of National Park categories whose column proportions do not
differ significantly from each other at the 0.05 confidence level
χ2 = 66.706, df = 15, p = 0.000; α = 0.05
Lake Nakuru National Park and Hell‟s Gate National Park received the highest
proportion of tourists within the 16-24 years category i.e. 38.3% and 27.2%
respectively. This indicated that there was a need for Lake Nakuru National Park and
Hell‟s gate National park to implore an active role as it attracts a relatively youthful
domestic tourist type who may be attracted to interesting wilderness activities that
appeal to diverse traits such as physical strength, stamina, youthful vigor and
imagination. This generation of consumers has often been referred to as the
„Generation y‟ consumers.
84
Peter and Olson (2010) note that consumers in this 16-24 years sub-culture are
dominated by a number of needs which include experimentation, belonging,
independence, responsibility and approval of others. On one hand, teenagers tend to
seek for autonomy and independence in their choices and on the other hand, they seek
to belong to a support structure such as their peers. They also pursue to rebel against
the social standards of appearance and behavior, therefore creating a perception of
being both brand-aware and brand dismissive.
Nairobi National Park and Hell‟s Gate National Park had the highest proportion of
tourists within the 25-34 age cohorts with 31.1% and 29.9% respectively. Most of
these tourists were domestic tourists. This age cohort has been termed as the
„generation x‟ or „the baby busters‟. These consumers are either within or out of
higher education and are mostly in one or two individual households. They are also
used to family shopping (Maclnnis, ET AL 2009). They are avid users of the internet
and social media in particular (Pease ET AL, 2007). Most of the consumers in this
category are emotionally and intellectually self-expressive (Conrady and Buck, 2010).
Lake Nakuru National Park and Nairobi National Park attracted the highest proportion
of tourists within the 35-44 age cohorts, with 30% and 26.7% respectively (as
indicated in table 20 and figure 23). This age group is characterized by a strong
family bonding with their friends and family. They are more mature consumers and
they seek to have an impact on the society around them. It is therefore important to
understand their altruistic, connectedness and autonomy attributes. Lynch and Veal
(1996) note that this segment of Australian society is also viewed as the leisure-poor
age-group as they have 60 per cent less leisure-time available than the leisure-rich age
group (those aged 65 and over).
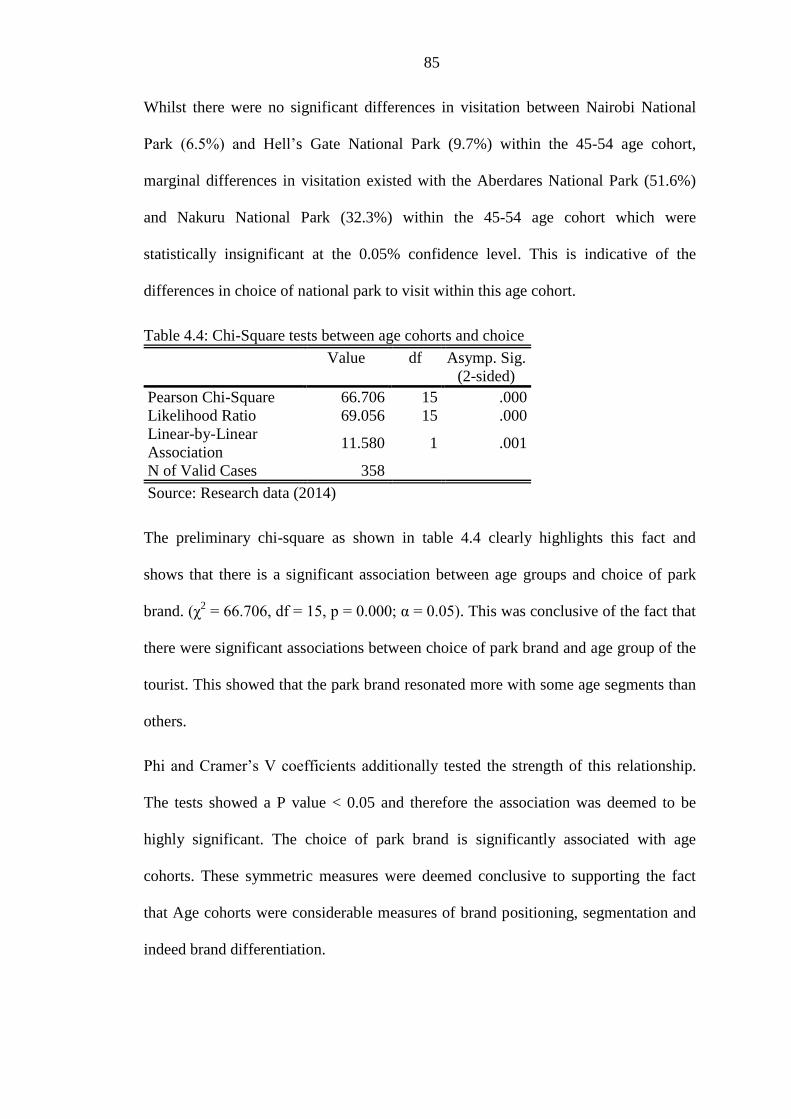
85
Whilst there were no significant differences in visitation between Nairobi National
Park (6.5%) and Hell‟s Gate National Park (9.7%) within the 45-54 age cohort,
marginal differences in visitation existed with the Aberdares National Park (51.6%)
and Nakuru National Park (32.3%) within the 45-54 age cohort which were
statistically insignificant at the 0.05% confidence level. This is indicative of the
differences in choice of national park to visit within this age cohort.
Table 4.4: Chi-Square tests between age cohorts and choice
Value df Asymp. Sig.
(2-sided)
Pearson Chi-Square 66.706 15 .000
Likelihood Ratio 69.056 15 .000
Linear-by-Linear
Association 11.580 1 .001
N of Valid Cases 358
Source: Research data (2014)
The preliminary chi-square as shown in table 4.4 clearly highlights this fact and
shows that there is a significant association between age groups and choice of park
brand. (χ2 = 66.706, df = 15, p = 0.000; α = 0.05). This was conclusive of the fact that
there were significant associations between choice of park brand and age group of the
tourist. This showed that the park brand resonated more with some age segments than
others.
Phi and Cramer‟s V coefficients additionally tested the strength of this relationship.
The tests showed a P value < 0.05 and therefore the association was deemed to be
highly significant. The choice of park brand is significantly associated with age
cohorts. These symmetric measures were deemed conclusive to supporting the fact
that Age cohorts were considerable measures of brand positioning, segmentation and
indeed brand differentiation.
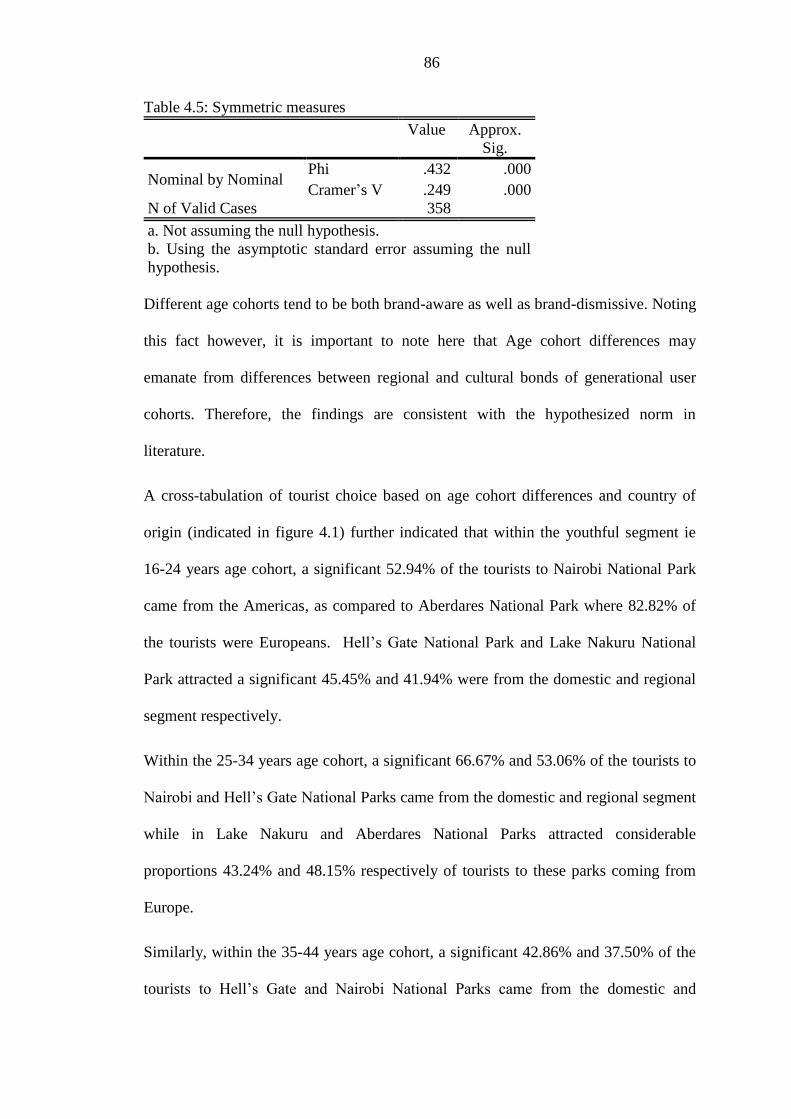
86
Table 4.5: Symmetric measures
Value Approx.
Sig.
Nominal by Nominal Phi .432 .000
Cramer‟s V .249 .000
N of Valid Cases 358
a. Not assuming the null hypothesis.
b. Using the asymptotic standard error assuming the null
hypothesis.
Different age cohorts tend to be both brand-aware as well as brand-dismissive. Noting
this fact however, it is important to note here that Age cohort differences may
emanate from differences between regional and cultural bonds of generational user
cohorts. Therefore, the findings are consistent with the hypothesized norm in
literature.
A cross-tabulation of tourist choice based on age cohort differences and country of
origin (indicated in figure 4.1) further indicated that within the youthful segment ie
16-24 years age cohort, a significant 52.94% of the tourists to Nairobi National Park
came from the Americas, as compared to Aberdares National Park where 82.82% of
the tourists were Europeans. Hell‟s Gate National Park and Lake Nakuru National
Park attracted a significant 45.45% and 41.94% were from the domestic and regional
segment respectively.
Within the 25-34 years age cohort, a significant 66.67% and 53.06% of the tourists to
Nairobi and Hell‟s Gate National Parks came from the domestic and regional segment
while in Lake Nakuru and Aberdares National Parks attracted considerable
proportions 43.24% and 48.15% respectively of tourists to these parks coming from
Europe.
Similarly, within the 35-44 years age cohort, a significant 42.86% and 37.50% of the
tourists to Hell‟s Gate and Nairobi National Parks came from the domestic and

87
regional segment while a significant 58.33% and 38.89% of tourists to Aberdares and
Lake Nakuru National Parks came from Europe. As for the 45-54 years age cohort, a
significant 50% of the tourists to Nairobi National Park came from the Americas as
compared to the other parks that attracted a significant proportion of European
travelers i.e. 66.67%, 50% and 50% to Hell‟s Gate, Lake Nakuru and Aberdares
National Park respectively.
Figure 4.1: Cross-tabulation of Park choice and continent of origin
The findings were further indicative of the fact that the park brand market segments
could have a regional segmentation bases. Significantly so, Giraldi and Ikeda (2013)
note that the country of origin effects has a significant influence on product
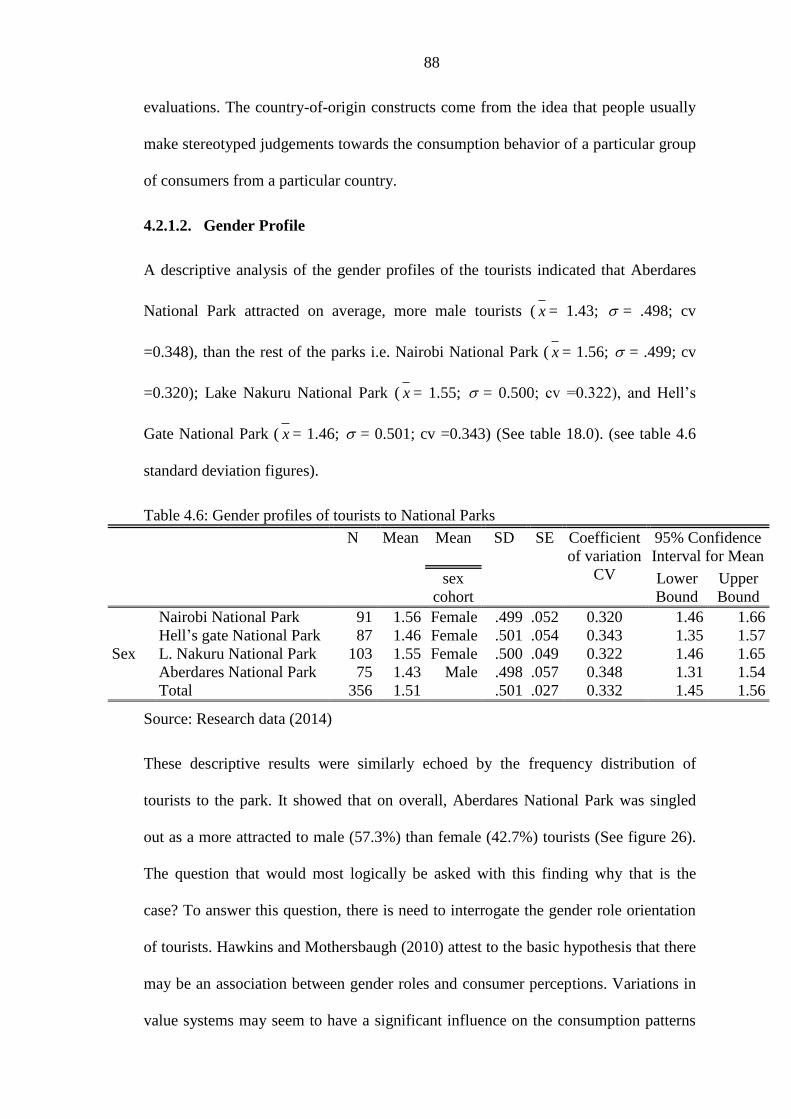
88
evaluations. The country-of-origin constructs come from the idea that people usually
make stereotyped judgements towards the consumption behavior of a particular group
of consumers from a particular country.
4.2.1.2. Gender Profile
A descriptive analysis of the gender profiles of the tourists indicated that Aberdares
National Park attracted on average, more male tourists ( x = 1.43; = .498; cv
=0.348), than the rest of the parks i.e. Nairobi National Park ( x = 1.56; = .499; cv
=0.320); Lake Nakuru National Park ( x = 1.55; = 0.500; cv =0.322), and Hell‟s
Gate National Park ( x = 1.46; = 0.501; cv =0.343) (See table 18.0). (see table 4.6
standard deviation figures).
Table 4.6: Gender profiles of tourists to National Parks
N Mean Mean SD SE Coefficient
of variation
CV
95% Confidence
Interval for Mean
sex
cohort
Lower
Bound
Upper
Bound
Sex
Nairobi National Park 91 1.56 Female .499 .052 0.320 1.46 1.66
Hell‟s gate National Park 87 1.46 Female .501 .054 0.343 1.35 1.57
L. Nakuru National Park 103 1.55 Female .500 .049 0.322 1.46 1.65
Aberdares National Park 75 1.43 Male .498 .057 0.348 1.31 1.54
Total 356 1.51 .501 .027 0.332 1.45 1.56
Source: Research data (2014)
These descriptive results were similarly echoed by the frequency distribution of
tourists to the park. It showed that on overall, Aberdares National Park was singled
out as a more attracted to male (57.3%) than female (42.7%) tourists (See figure 26).
The question that would most logically be asked with this finding why that is the
case? To answer this question, there is need to interrogate the gender role orientation
of tourists. Hawkins and Mothersbaugh (2010) attest to the basic hypothesis that there
may be an association between gender roles and consumer perceptions. Variations in
value systems may seem to have a significant influence on the consumption patterns
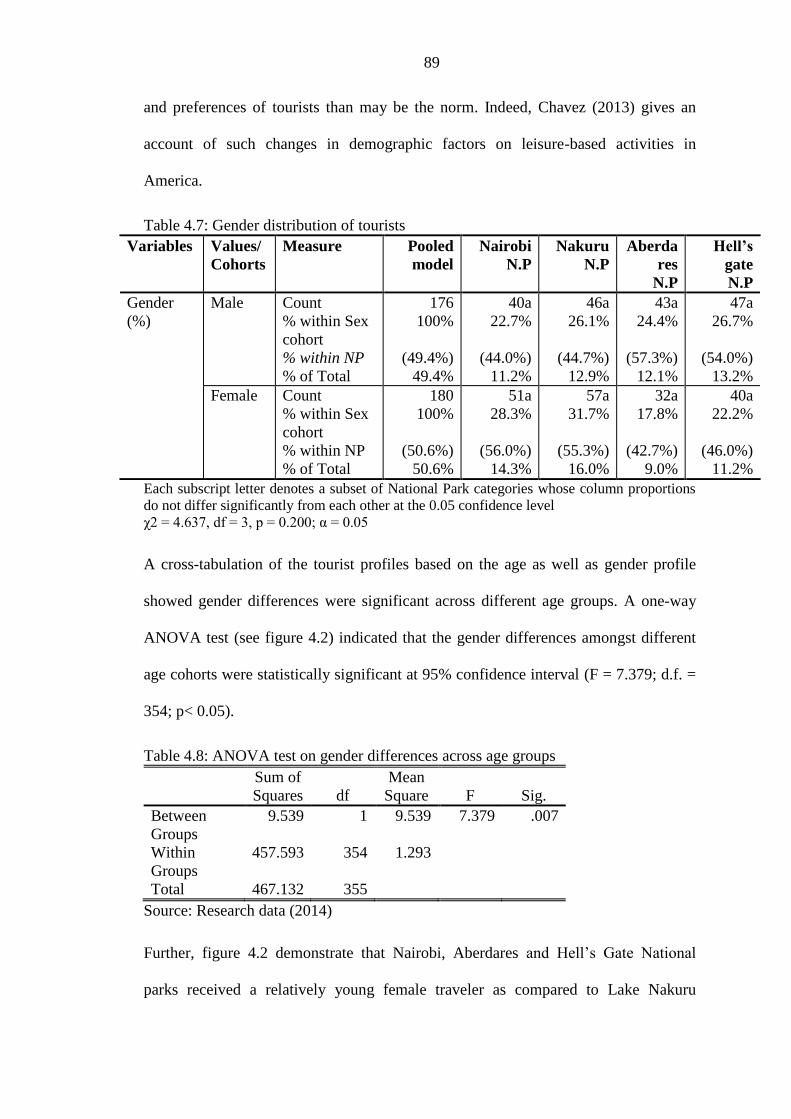
89
and preferences of tourists than may be the norm. Indeed, Chavez (2013) gives an
account of such changes in demographic factors on leisure-based activities in
America.
Table 4.7: Gender distribution of tourists
Variables Values/
Cohorts
Measure Pooled
model
Nairobi
N.P
Nakuru
N.P
Aberda
res
N.P
Hell’s
gate
N.P
Gender
(%)
Male Count
% within Sex
cohort
% within NP
% of Total
176
100%
(49.4%)
49.4%
40a
22.7%
(44.0%)
11.2%
46a
26.1%
(44.7%)
12.9%
43a
24.4%
(57.3%)
12.1%
47a
26.7%
(54.0%)
13.2%
Female Count
% within Sex
cohort
% within NP
% of Total
180
100%
(50.6%)
50.6%
51a
28.3%
(56.0%)
14.3%
57a
31.7%
(55.3%)
16.0%
32a
17.8%
(42.7%)
9.0%
40a
22.2%
(46.0%)
11.2%
Each subscript letter denotes a subset of National Park categories whose column proportions
do not differ significantly from each other at the 0.05 confidence level
χ2 = 4.637, df = 3, p = 0.200; α = 0.05
A cross-tabulation of the tourist profiles based on the age as well as gender profile
showed gender differences were significant across different age groups. A one-way
ANOVA test (see figure 4.2) indicated that the gender differences amongst different
age cohorts were statistically significant at 95% confidence interval (F = 7.379; d.f. =
354; p< 0.05).
Table 4.8: ANOVA test on gender differences across age groups
Sum of
Squares df
Mean
Square F Sig.
Between
Groups
9.539 1 9.539 7.379 .007
Within
Groups
457.593 354 1.293
Total 467.132 355
Source: Research data (2014)
Further, figure 4.2 demonstrate that Nairobi, Aberdares and Hell‟s Gate National
parks received a relatively young female traveler as compared to Lake Nakuru

90
National Park. The finding was indicative of the fact that more young female tourists
were attracted to tranquil vs. adventurous, wild destinations than the male tourists
within the same age group. These finding corroborated Andreu, Kozac, Avci, and
Cifter‟s (2005) findings that gender differences in preferences are quite evident where
for instance young female tourists have a stronger relaxation and escape-based travel
motives than the male counterparts. A chart (shown in figure 4.2) indicating the
distribution of respondents based on age and sex profiles examines this emerging
trend further.
Figure 4.2: Cross-tabulation of Age and Sex distribution of tourists
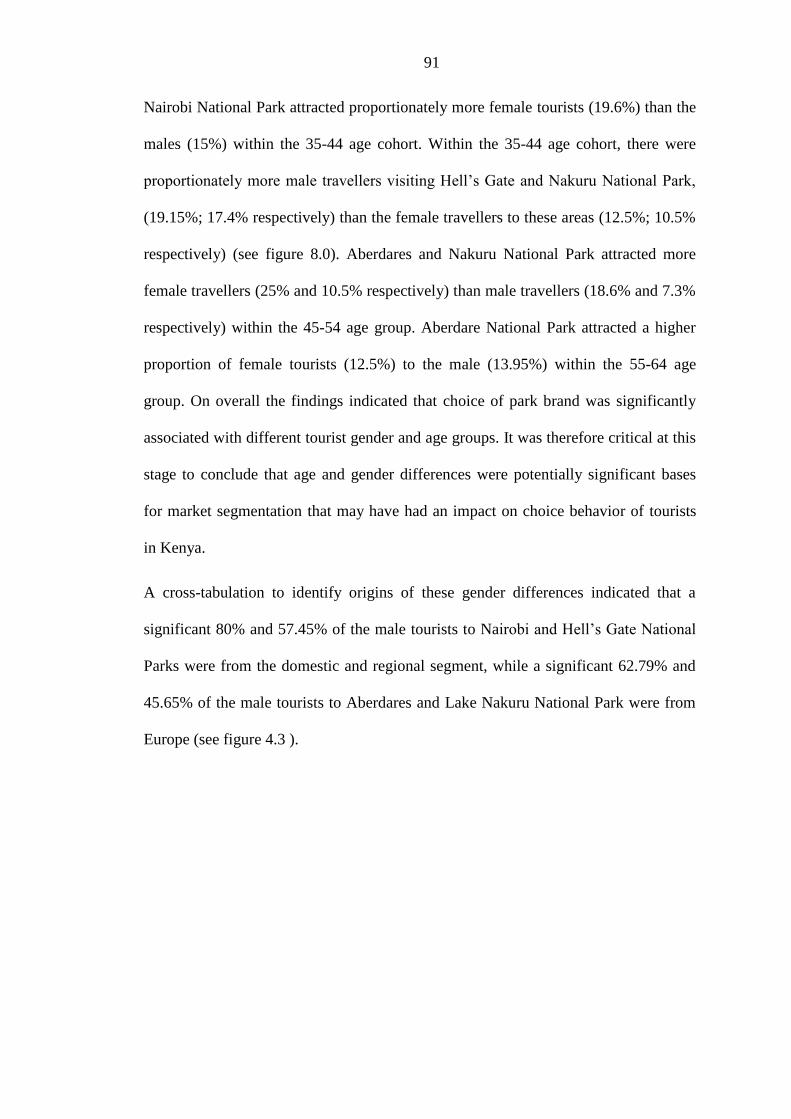
91
Nairobi National Park attracted proportionately more female tourists (19.6%) than the
males (15%) within the 35-44 age cohort. Within the 35-44 age cohort, there were
proportionately more male travellers visiting Hell‟s Gate and Nakuru National Park,
(19.15%; 17.4% respectively) than the female travellers to these areas (12.5%; 10.5%
respectively) (see figure 8.0). Aberdares and Nakuru National Park attracted more
female travellers (25% and 10.5% respectively) than male travellers (18.6% and 7.3%
respectively) within the 45-54 age group. Aberdare National Park attracted a higher
proportion of female tourists (12.5%) to the male (13.95%) within the 55-64 age
group. On overall the findings indicated that choice of park brand was significantly
associated with different tourist gender and age groups. It was therefore critical at this
stage to conclude that age and gender differences were potentially significant bases
for market segmentation that may have had an impact on choice behavior of tourists
in Kenya.
A cross-tabulation to identify origins of these gender differences indicated that a
significant 80% and 57.45% of the male tourists to Nairobi and Hell‟s Gate National
Parks were from the domestic and regional segment, while a significant 62.79% and
45.65% of the male tourists to Aberdares and Lake Nakuru National Park were from
Europe (see figure 4.3 ).
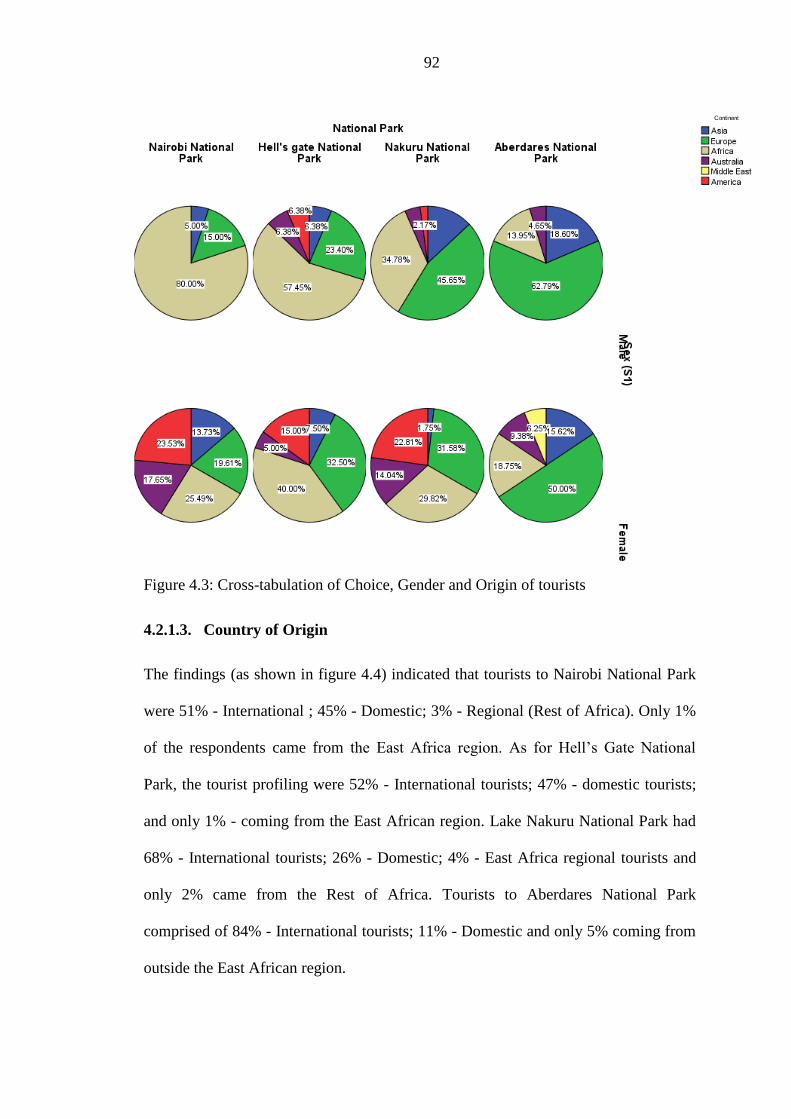
92
Figure 4.3: Cross-tabulation of Choice, Gender and Origin of tourists
4.2.1.3. Country of Origin
The findings (as shown in figure 4.4) indicated that tourists to Nairobi National Park
were 51% - International ; 45% - Domestic; 3% - Regional (Rest of Africa). Only 1%
of the respondents came from the East Africa region. As for Hell‟s Gate National
Park, the tourist profiling were 52% - International tourists; 47% - domestic tourists;
and only 1% - coming from the East African region. Lake Nakuru National Park had
68% - International tourists; 26% - Domestic; 4% - East Africa regional tourists and
only 2% came from the Rest of Africa. Tourists to Aberdares National Park
comprised of 84% - International tourists; 11% - Domestic and only 5% coming from
outside the East African region.

93
Figure 4.4: Tourists‟ Country of Origin of tourists
However, as for the individual country types, the five (5) major tourist segments to
each of the parks included the following (as shown in figure 4.5) :-
Aberdares National Park: UK/England (20%); Spain (16%); Kenya (11%);
(India 11%) and Denmark (8%);
Lake Nakuru National Park: Kenya (26%); Australia (8%); UK/England
(9%); Germany (8%); Canada (6%);
Hell‟s Gate National Park: Kenya (47%); Australia (5%); Canada (5%); USA
(5%); UK (5%);
Nairobi National Park: Kenya (45%); Australia (11%); USA (9%); Ireland
(7%); England (6%).
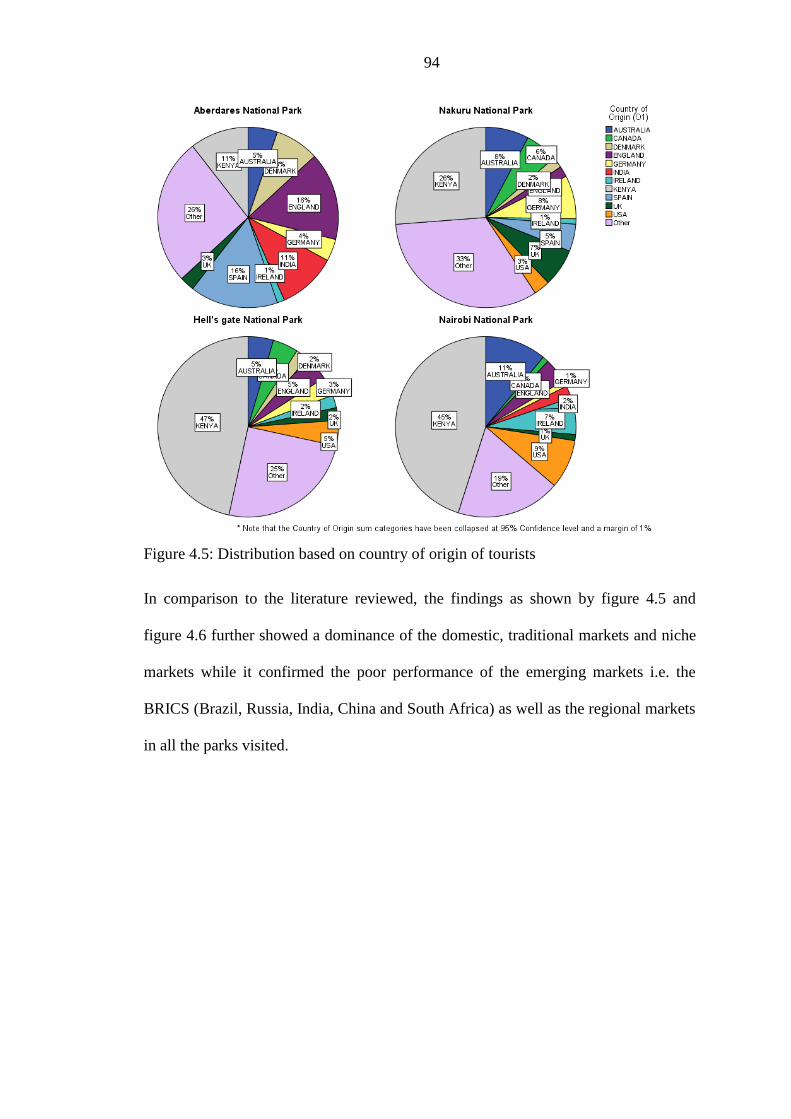
94
Figure 4.5: Distribution based on country of origin of tourists
In comparison to the literature reviewed, the findings as shown by figure 4.5 and
figure 4.6 further showed a dominance of the domestic, traditional markets and niche
markets while it confirmed the poor performance of the emerging markets i.e. the
BRICS (Brazil, Russia, India, China and South Africa) as well as the regional markets
in all the parks visited.
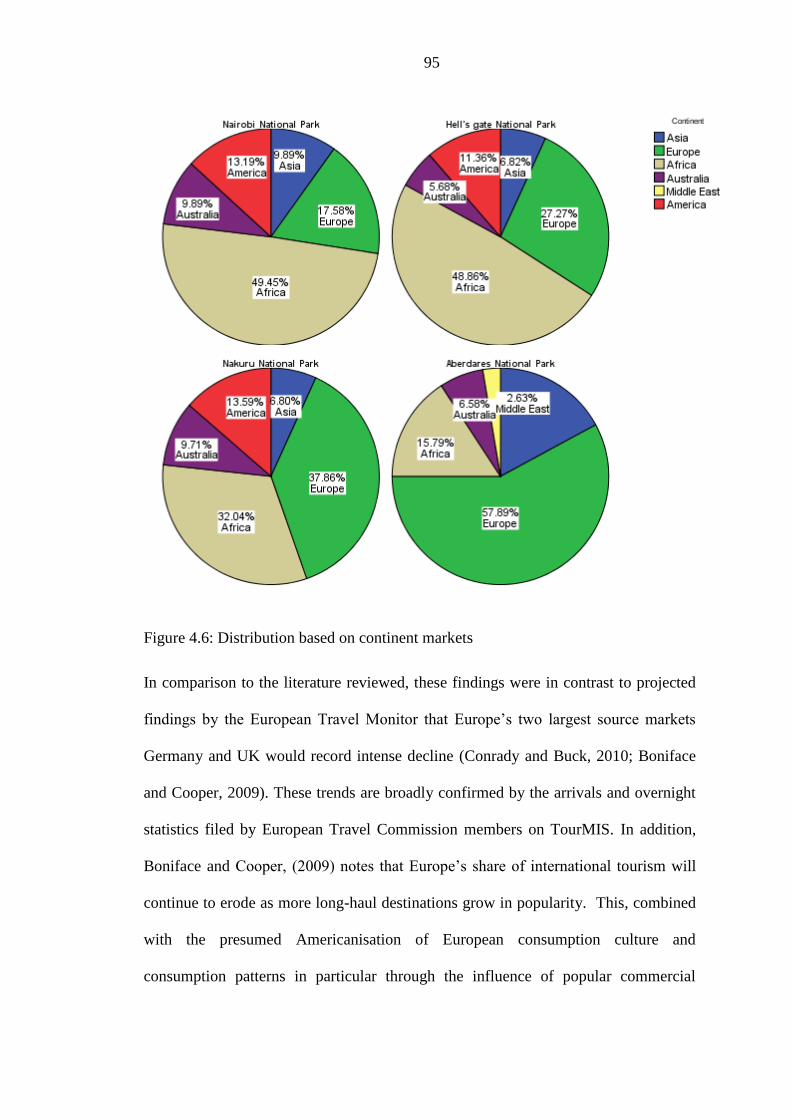
95
Figure 4.6: Distribution based on continent markets
In comparison to the literature reviewed, these findings were in contrast to projected
findings by the European Travel Monitor that Europe‟s two largest source markets
Germany and UK would record intense decline (Conrady and Buck, 2010; Boniface
and Cooper, 2009). These trends are broadly confirmed by the arrivals and overnight
statistics filed by European Travel Commission members on TourMIS. In addition,
Boniface and Cooper, (2009) notes that Europe‟s share of international tourism will
continue to erode as more long-haul destinations grow in popularity. This, combined
with the presumed Americanisation of European consumption culture and
consumption patterns in particular through the influence of popular commercial

96
culture and consumption patterns is a key issue that needs proper consideration
(Gronow and Southerton, 2010).
In comparison to the literature reviewed, despite the fact that the ITB World Travel
Trends Report, 2012 indicated that the USA remains the world‟s top destination for
international travel, the same report notes that South America and Asia would drive
global travel and tourism. South America had an all-time increase of 12% in outbound
trips; Africa also showed a significant rise in outbound trips by 9%, while the Asia
Pacific region had an all-time high of 7% (ITB, 2012). The findings confirmed that
the proportions of domestic tourism to accessible parks such as Nairobi National Park
(45%) and Hell‟s Gate National Park (47%) were proportionately high and would
continue to rise as compared to international tourism. WTTC (2013) confirms that
domestic travel and tourism is expected to grow by 3.5% annually. The UNWTO
attributes this growth to economic development as a major factor in encouraging this
transition, such that a growing „leisure society‟ can be expected to develop in coming
years in emerging economies of Asia, Eastern Europe and Latin America (UNWTO,
2012). Indeed, as in agreement with Kenya‟s Vision 2030, to be ranked among the top
ten, Kenya must expand her global and African market share by offering new
products, expanding tourist expenditure per capita and by improving her international
marketing strategies (NESC, 2013).
4.2.1.4. Annual Personal Income
Annual personal income profiles of tourists showed distinct variations between parks,
with tourists to Aberdares National Park having the highest mean earners ( x = 3.46;
= 1.935; cv =0.559), and Lake Nakuru National Park attracting the lowest average
of earners ( x = 1.55; = 0.500; cv =0.322) (see table 4.9). Further, the highest mean

97
earners varied more widely for survey respondents in Aberdares National Park ( =
1.935) compared to the average income scores to Lake Nakuru National Park
( =.500).
Table 4.9: Annual Personal income of tourists
N Mean Std.
Deviation
Std.
Error
Coefficient of
variation
CV
95% Confidence Interval
for Mean
Lower
Bound
Upper
Bound
Annual
Personal
Income
Nairobi National Park 91 2.44 1.327 .139 0.544 2.16 2.72
Hell‟s gate National Park 87 2.47 1.860 .199 0.753 2.07 2.87
lNakuru National Park 103 1.83 1.216 .120 0.664 1.59 2.06
Aberdares National Park 76 3.46 1.935 .222 0.559 3.02 3.90
Total 357 2.49 1.680 .089 0.674 2.31 2.66
Source: Research data (2014)
This was a high indication that at the time, there were factors that contributed to such
variances in tourist types. The fact that there were a significant proportion of
international tourists to Aberdares National Park (84%) and also the fact that most
tourists were on average married Dual Income No Kids (DINK) households and were
on average highly educated. Further, it was also suggestive of the fact that Aberdares
National Park is located in transit to high-end ranches and luxury lodges catering for
the high-end premium markets.
ANOVA findings as indicated by table 4.10 clearly show a distinctive income cohort
variations amongst tourists to the four national parks i.e. F (3,353) = 15.554, p<0.05.
These were significant findings as they further indicated that the tourism market was
further segmented in the basis of income cohort differences.
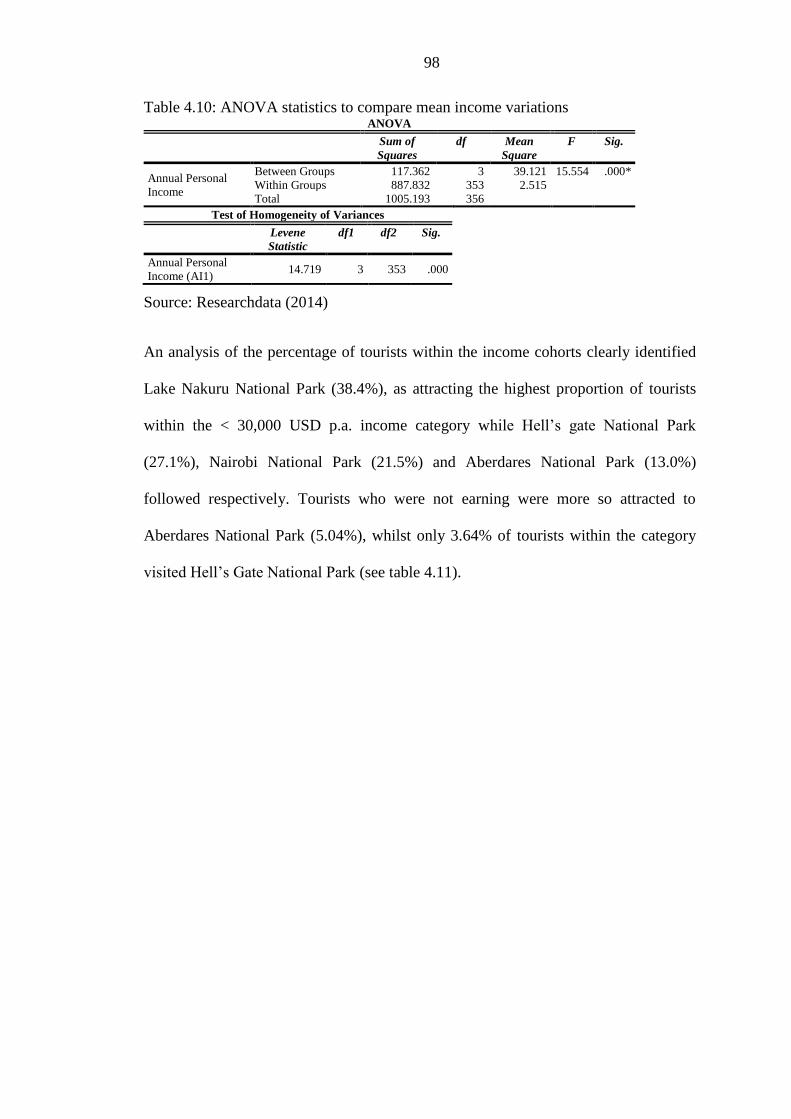
98
Table 4.10: ANOVA statistics to compare mean income variations ANOVA
Sum of
Squares
df Mean
Square
F Sig.
Annual Personal
Income
Between Groups 117.362 3 39.121 15.554 .000*
Within Groups 887.832 353 2.515
Total 1005.193 356
Test of Homogeneity of Variances
Levene
Statistic
df1 df2 Sig.
Annual Personal
Income (AI1) 14.719 3 353 .000
Source: Researchdata (2014)
An analysis of the percentage of tourists within the income cohorts clearly identified
Lake Nakuru National Park (38.4%), as attracting the highest proportion of tourists
within the < 30,000 USD p.a. income category while Hell‟s gate National Park
(27.1%), Nairobi National Park (21.5%) and Aberdares National Park (13.0%)
followed respectively. Tourists who were not earning were more so attracted to
Aberdares National Park (5.04%), whilst only 3.64% of tourists within the category
visited Hell‟s Gate National Park (see table 4.11).
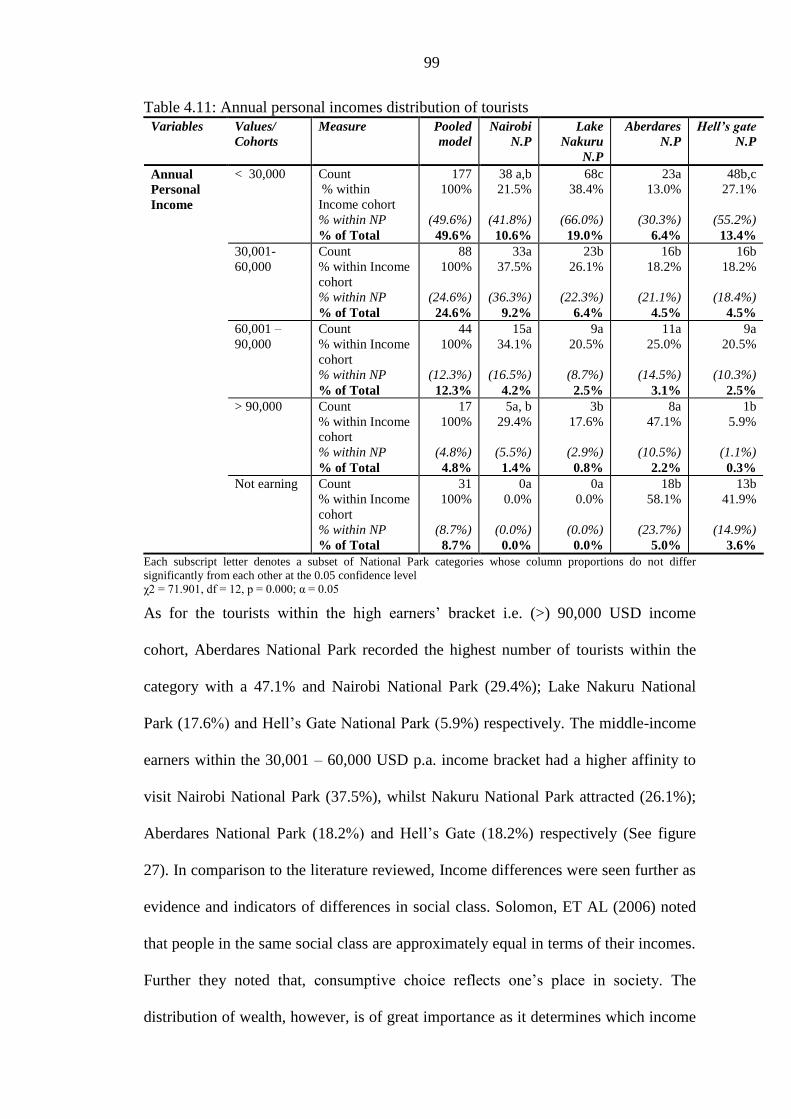
99
Table 4.11: Annual personal incomes distribution of tourists
Variables Values/
Cohorts
Measure Pooled
model
Nairobi
N.P
Lake
Nakuru
N.P
Aberdares
N.P
Hell’s gate
N.P
Annual
Personal
Income
< 30,000 Count
% within
Income cohort
% within NP
% of Total
177
100%
(49.6%)
49.6%
38 a,b
21.5%
(41.8%)
10.6%
68c
38.4%
(66.0%)
19.0%
23a
13.0%
(30.3%)
6.4%
48b,c
27.1%
(55.2%)
13.4%
30,001-
60,000
Count
% within Income
cohort
% within NP
% of Total
88
100%
(24.6%)
24.6%
33a
37.5%
(36.3%)
9.2%
23b
26.1%
(22.3%)
6.4%
16b
18.2%
(21.1%)
4.5%
16b
18.2%
(18.4%)
4.5%
60,001 –
90,000
Count
% within Income
cohort
% within NP
% of Total
44
100%
(12.3%)
12.3%
15a
34.1%
(16.5%)
4.2%
9a
20.5%
(8.7%)
2.5%
11a
25.0%
(14.5%)
3.1%
9a
20.5%
(10.3%)
2.5%
> 90,000 Count
% within Income
cohort
% within NP
% of Total
17
100%
(4.8%)
4.8%
5a, b
29.4%
(5.5%)
1.4%
3b
17.6%
(2.9%)
0.8%
8a
47.1%
(10.5%)
2.2%
1b
5.9%
(1.1%)
0.3%
Not earning Count
% within Income
cohort
% within NP
% of Total
31
100%
(8.7%)
8.7%
0a
0.0%
(0.0%)
0.0%
0a
0.0%
(0.0%)
0.0%
18b
58.1%
(23.7%)
5.0%
13b
41.9%
(14.9%)
3.6%
Each subscript letter denotes a subset of National Park categories whose column proportions do not differ
significantly from each other at the 0.05 confidence level
χ2 = 71.901, df = 12, p = 0.000; α = 0.05
As for the tourists within the high earners‟ bracket i.e. (>) 90,000 USD income
cohort, Aberdares National Park recorded the highest number of tourists within the
category with a 47.1% and Nairobi National Park (29.4%); Lake Nakuru National
Park (17.6%) and Hell‟s Gate National Park (5.9%) respectively. The middle-income
earners within the 30,001 – 60,000 USD p.a. income bracket had a higher affinity to
visit Nairobi National Park (37.5%), whilst Nakuru National Park attracted (26.1%);
Aberdares National Park (18.2%) and Hell‟s Gate (18.2%) respectively (See figure
27). In comparison to the literature reviewed, Income differences were seen further as
evidence and indicators of differences in social class. Solomon, ET AL (2006) noted
that people in the same social class are approximately equal in terms of their incomes.
Further they noted that, consumptive choice reflects one‟s place in society. The
distribution of wealth, however, is of great importance as it determines which income

100
cohorts have higher purchasing power and market potential. In this line, an
exploratory analysis of distribution of tourists‟ incomes was vital. A measure of the
distribution of tourists to the parks based on origin and incomes indicated that Europe,
Asia and Australia accounted for the wealthy segments of tourists, while the domestic
and regional segment accounted for the low and middle income earning segments of
tourists (as shown in table 4.11).
4.2.1.5. Marital Status
An analysis of the marital status of tourists indicated that Nairobi National Park,
Hell‟s gate and Lake Nakuru National Park attracted on average more single tourists
as compared to married (ie 54.9%; 64.8% and 63.7% respectively as indicated in table
4.12). Aberdares National Park attracted more married tourists (52.6%) than the
singles (42.1%). Within the household life cycle (HLC), these tourists can be grouped
as the Singles I. Single I is basically constituted of unmarried members of the
Generation Y cohort.
Table 4.12: Distribution of Marital status of tourists
Variables Values/
Cohorts
Measure Pooled
model
Nairobi
N.P
L.
Nakuru
N.P
Aberdares
N.P
Hell’s
gate
N.P
Marital
status
Single Count
% within marital
cohort
% within NP
% of Total
204
100%
(57.1%)
57.1%
50 a,b
24.5%
(54.9%)
14.0%
65b
31.9%
(63.7%)
18.2%
32a
15.7%
(42.1%)
9.0%
57b
27.9%
(64.8%)
16.0%
Married Count
% within marital
cohort
% within NP
% of Total
146
100%
(40.9%)
40.9%
41a
28.1%
(45.1%)
11.5%
34a
23.3%
(33.3%)
9.5%
40a
27.4%
(52.6%)
11.2%
31a
21.2%
(35.2%)
8.7%
Divorced Count
% within marital
cohort
% within NP
% of Total
7
100%
(2.0%)
2.0%
0
0.0%
(0.0%)
0.0%
3a
42.9%
(2.9%)
0.8%
4a
57.1%
(5.3%)
1.1%
0
0.0%
(0.0%)
0.0%
Each subscript letter denotes a subset of National Park categories whose column proportions do not
differ significantly from each other at the 0.05 confidence level
χ2 = 18.053, df = 6, p = 0.006; α = 0.05
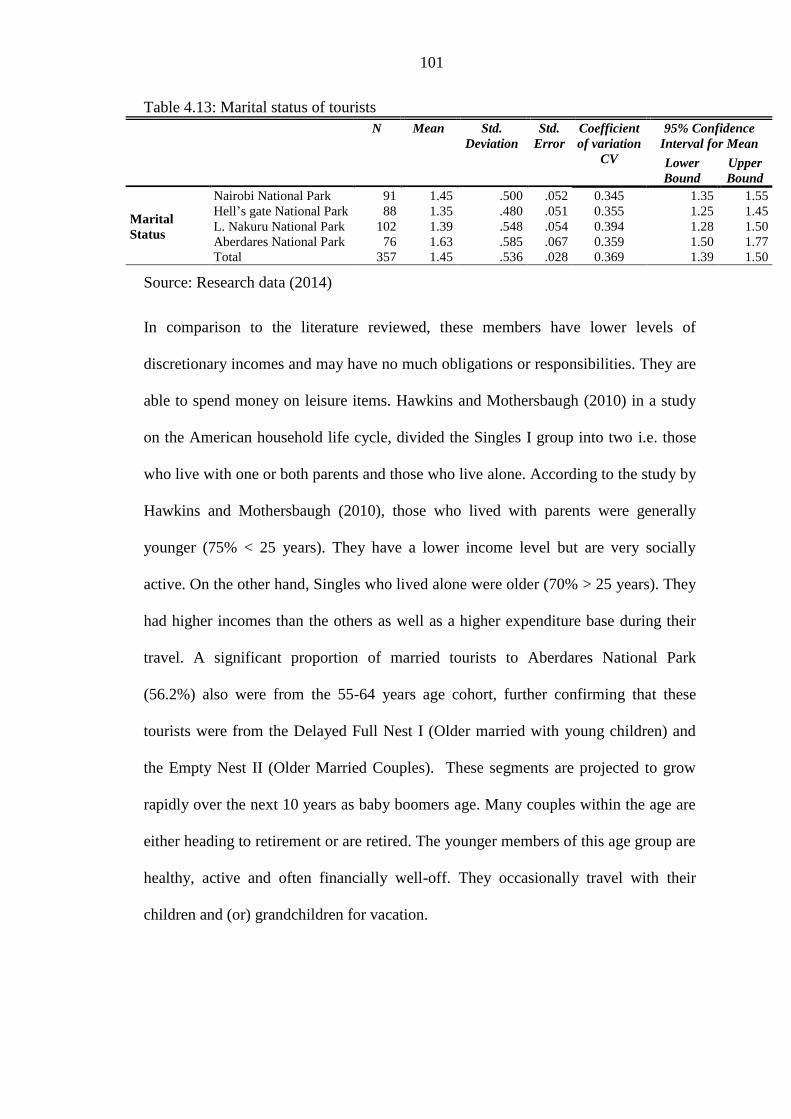
101
Table 4.13: Marital status of tourists
N Mean Std.
Deviation
Std.
Error
Coefficient
of variation
CV
95% Confidence
Interval for Mean
Lower
Bound
Upper
Bound
Marital
Status
Nairobi National Park 91 1.45 .500 .052 0.345 1.35 1.55
Hell‟s gate National Park 88 1.35 .480 .051 0.355 1.25 1.45
L. Nakuru National Park 102 1.39 .548 .054 0.394 1.28 1.50
Aberdares National Park 76 1.63 .585 .067 0.359 1.50 1.77
Total 357 1.45 .536 .028 0.369 1.39 1.50
Source: Research data (2014)
In comparison to the literature reviewed, these members have lower levels of
discretionary incomes and may have no much obligations or responsibilities. They are
able to spend money on leisure items. Hawkins and Mothersbaugh (2010) in a study
on the American household life cycle, divided the Singles I group into two i.e. those
who live with one or both parents and those who live alone. According to the study by
Hawkins and Mothersbaugh (2010), those who lived with parents were generally
younger (75% < 25 years). They have a lower income level but are very socially
active. On the other hand, Singles who lived alone were older (70% > 25 years). They
had higher incomes than the others as well as a higher expenditure base during their
travel. A significant proportion of married tourists to Aberdares National Park
(56.2%) also were from the 55-64 years age cohort, further confirming that these
tourists were from the Delayed Full Nest I (Older married with young children) and
the Empty Nest II (Older Married Couples). These segments are projected to grow
rapidly over the next 10 years as baby boomers age. Many couples within the age are
either heading to retirement or are retired. The younger members of this age group are
healthy, active and often financially well-off. They occasionally travel with their
children and (or) grandchildren for vacation.
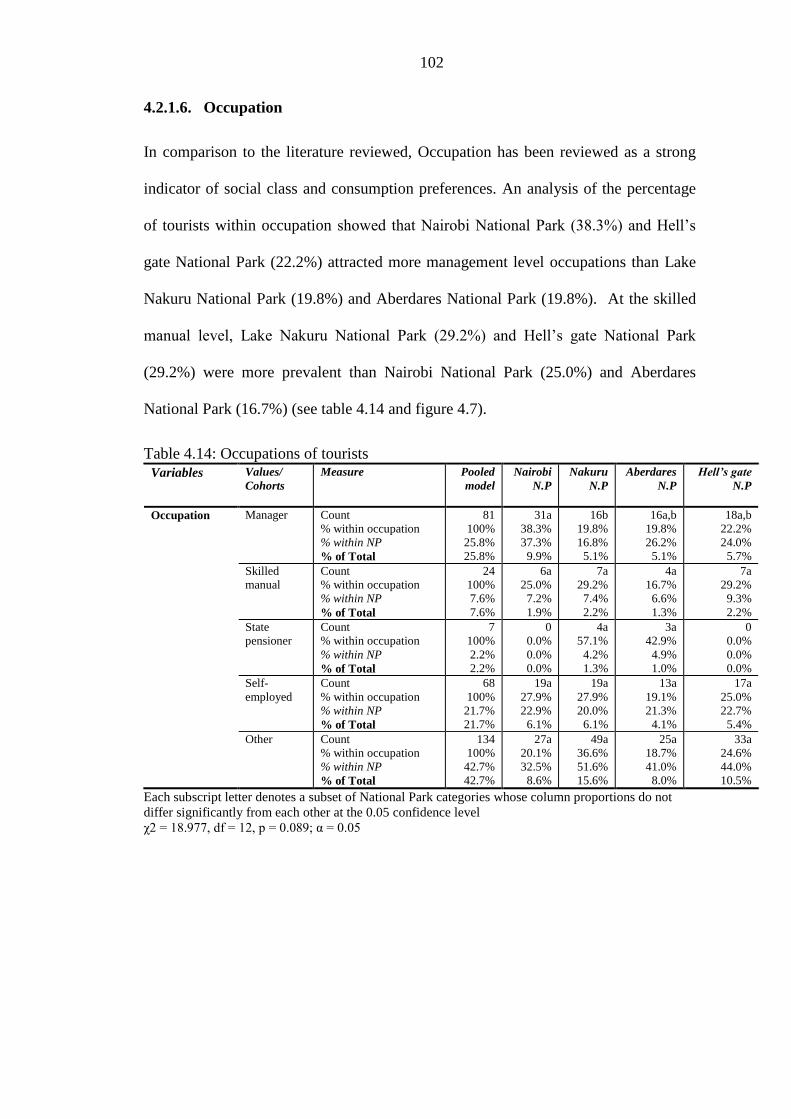
102
4.2.1.6. Occupation
In comparison to the literature reviewed, Occupation has been reviewed as a strong
indicator of social class and consumption preferences. An analysis of the percentage
of tourists within occupation showed that Nairobi National Park (38.3%) and Hell‟s
gate National Park (22.2%) attracted more management level occupations than Lake
Nakuru National Park (19.8%) and Aberdares National Park (19.8%). At the skilled
manual level, Lake Nakuru National Park (29.2%) and Hell‟s gate National Park
(29.2%) were more prevalent than Nairobi National Park (25.0%) and Aberdares
National Park (16.7%) (see table 4.14 and figure 4.7).
Table 4.14: Occupations of tourists
Variables Values/
Cohorts
Measure Pooled
model
Nairobi
N.P
Nakuru
N.P
Aberdares
N.P
Hell’s gate
N.P
Occupation Manager Count
% within occupation
% within NP
% of Total
81
100%
25.8%
25.8%
31a
38.3%
37.3%
9.9%
16b
19.8%
16.8%
5.1%
16a,b
19.8%
26.2%
5.1%
18a,b
22.2%
24.0%
5.7%
Skilled
manual
Count
% within occupation
% within NP
% of Total
24
100%
7.6%
7.6%
6a
25.0%
7.2%
1.9%
7a
29.2%
7.4%
2.2%
4a
16.7%
6.6%
1.3%
7a
29.2%
9.3%
2.2%
State
pensioner
Count
% within occupation
% within NP
% of Total
7
100%
2.2%
2.2%
0
0.0%
0.0%
0.0%
4a
57.1%
4.2%
1.3%
3a
42.9%
4.9%
1.0%
0
0.0%
0.0%
0.0%
Self-
employed
Count
% within occupation
% within NP
% of Total
68
100%
21.7%
21.7%
19a
27.9%
22.9%
6.1%
19a
27.9%
20.0%
6.1%
13a
19.1%
21.3%
4.1%
17a
25.0%
22.7%
5.4%
Other Count
% within occupation
% within NP
% of Total
134
100%
42.7%
42.7%
27a
20.1%
32.5%
8.6%
49a
36.6%
51.6%
15.6%
25a
18.7%
41.0%
8.0%
33a
24.6%
44.0%
10.5%
Each subscript letter denotes a subset of National Park categories whose column proportions do not
differ significantly from each other at the 0.05 confidence level
χ2 = 18.977, df = 12, p = 0.089; α = 0.05
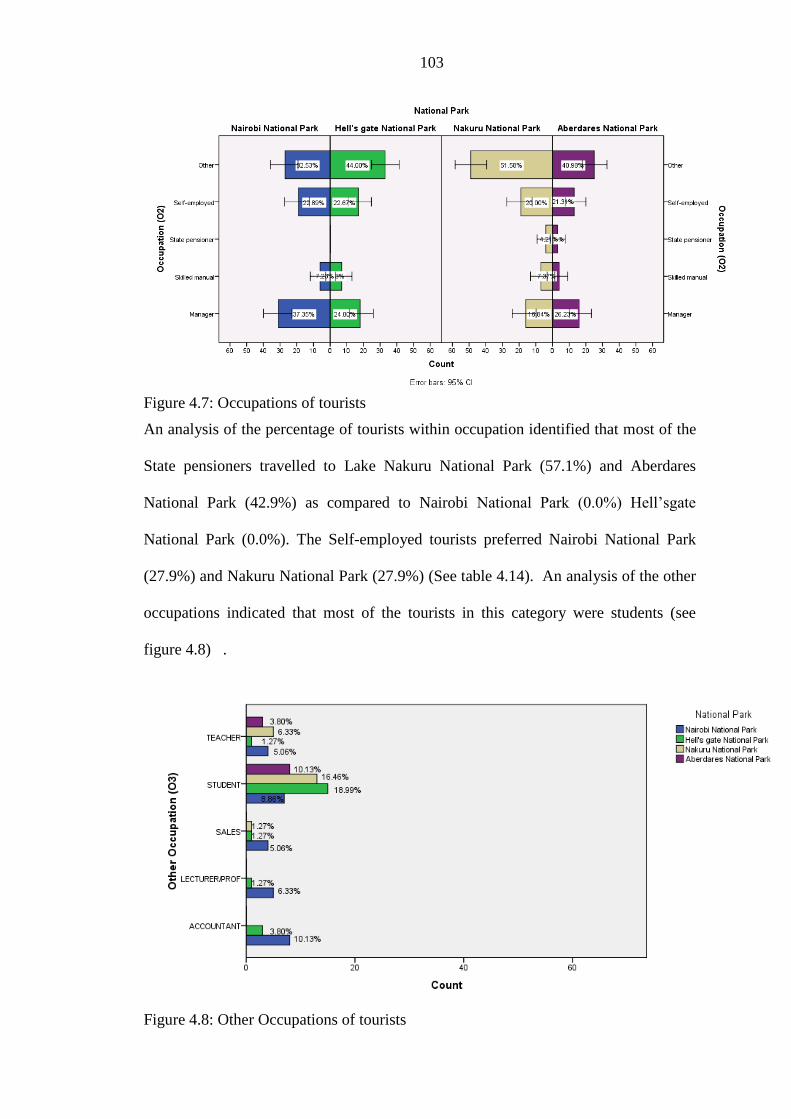
103
Figure 4.7: Occupations of tourists
An analysis of the percentage of tourists within occupation identified that most of the
State pensioners travelled to Lake Nakuru National Park (57.1%) and Aberdares
National Park (42.9%) as compared to Nairobi National Park (0.0%) Hell‟sgate
National Park (0.0%). The Self-employed tourists preferred Nairobi National Park
(27.9%) and Nakuru National Park (27.9%) (See table 4.14). An analysis of the other
occupations indicated that most of the tourists in this category were students (see
figure 4.8) .
Figure 4.8: Other Occupations of tourists

104
The student market constituted a significant 47.6% of the tourist market. Eagles
(2010) notes that environmental education targeting schools and institutions of higher
learning is a major activity in protected areas globally. Park visitation by students is
critical for the creation of societal culture that is conducive to parks. People visit
parks, and appreciate the experiences gained and must have a memory of appreciation
that leads to long-term attitude reinforcement. They develop a sufficiently strong
attitude that causes political action towards conservation. Tourism is the fundamental
element that determines whether a society has sufficient levels of conservation
appreciation to lead to action. This appreciation must be consistent and ongoing.
4.2.1.7. Preferred Mode of Travel Arrangement
The findings indicated that on overall, 89% of the tourists to Nairobi National Park
preferred independent tours whilst only 11% preferred packaged tours. Similarly,
majority (76.7%) of the tourists to Hell‟s gate National Park preferred Independent
tours, whilst only 23.3% preferred packaged tours. 62.1% of the tourists to Lake
Nakuru National Park preferred Independent tours while 37.9% preferred package
tours (as indicated in figure 4.9). The findings as indicated in figure 4.9 confirmed in
comparison to the literature reviewed that, most tourists to the branded parks
preferred independent tours to packaged tours. These tourists preferred flexible and
personalized holidays that were purchased competitively. This was indeed an
indication of the level of personalization of choice. Odunga (2003) attributes this level
of preference to the high levels of experience, education and independence in
decision-making.

105
Figure 4.9: Preferred mode of travel arrangement of tourists
A significant proportion of tourists to Nairobi, Hell‟s Gate and Lake Nakuru National
Park preffered independent tours (ie 89%, 77% and 62% respectively). 50% of
tourists to Aberdares National Park preffered package tours. Echtermeyer (2006)
attributes such a phenomenon to the fact that globally all the big tour operators from
Europe are offering single destination trips and strive to expand the FIT (Free
Independent Traveller) segment.
4.2.1.8. Tourists Travelling with Children
The research findings indicated that Nairobi National Park had the highest proportion
of tourists travelling with children (44.4%), followed by Lake Nakuru National Park
(21.0%); Hell‟s Gate National Park (18.5%) and finally Aberdares National Park
(16.0%) (see table 4.15). Chi-square tests as indicated in table 37 confirmed that there
were significant positive level of association between park visitation and tourists

106
travelling with children in Nairobi National Park χ2 = 19.496, df = 3, p = 0.000; α =
0.05 (see table 4.15). Therefore, there is significant need to develop tourist education
and recreational programmes that would cater for this elusive segment. However,
Grimm and Lohmann (2009) concurs and notes that with the changes in age structure
as well as the household structure the impact of this holiday segment of tourists
travelling with children (under the age of 14 years) is significant.
Table 4.15: Tourists travelling with Children
Variables Values/
Cohorts
Measure Pooled
model
Nairobi
N.P
Nakuru
N.P
Aberdares
N.P
Hell’s gate
N.P
Travelling with
children
Yes Count
% within Travelling
with children
% within NP
% of Total
81
100%
22.8%
22.8%
36a
44.4%
39.6%
10.1%
17b
21.0%
16.7%
4.8%
13b
16.0%
17.1%
3.7%
15b
18.5%
17.4%
4.2%
No Count
% within Travelling
with children
% within NP
% of Total
274
100%
77.2%
77.2%
55a
20.1%
60.4%
15.5%
85b
31.0%
83.3%
23.9%
63b
23.0%
82.9%
17.7%
71b
25.9%
82.6%
20.0%
Each subscript letter denotes a subset of National Park categories whose column proportions do not differ
significantly from each other at the 0.05 confidence level
χ2 = 19.496, df = 3, p = 0.000; α = 0.05
The degree to which the children influence purchase and choice decisions according
to (Mathieson and Wall, 1982) is influenced by interpersonal needs between the
children and the adults, the level of product involvement and utility as well as role
power ie the degree to which one family member exerts influence over others in
decision making. However, parents play a most significant role in consumer
socialization ie instilling their own values about consumption and choice to their
children. However, Chavez (2013) notes that American leisure patterns continue to
influence this trend, which include the graying of America, MOBYs (Mothers Older
when Baby is Young) the sandwich generation (those who care for their parents when
also caring for their own children), and the middle-age economy (characterized by
cautious consumer spending and more saving). Therefore, it is important to note that
park choice decisions may be conditioned by an influence of any of these factors.

107
4.2.1.9. Tourists’ Highest Level of Education Attained
A distribution of tourists by the highest level of education attained indicated that
42.08% of tourists to Nairobi National Park had an Undergraduate degree, whilst
28.41% had attained a Masters degree. Only 13.91% of the tourists to Nairobi
National Park had High School training and 11.36% PhD level training. A profile of
tourists to Hell‟s gate National Park showed similar variations where the majority
39.08% had Undergraduate degrees; 29.89% following with Masters degrees, whilst
only 15.9% and 13.8% had high school and diploma qualifications respectively (see
figure 4.10).
Figure 4.10: Tourists‟ highest level of education attainment
Tourists to Lake Nakuru National Park showed marked variations as a considerable
proportion of tourists were educated to the level of masters and undergraduate levels
i.e. 27.2% and 30.1% respectively (as shown in figure 4.10). Aberdares National Park
showed similar findings as a majority 32.43% had undergraduate training whilst
28.38% had masters training whilst only 19% had high school training as the highest
level of training.

108
The findings also collaborated with the fact that the more educated traveler prefers
those activities that are value expressive (Mathieson and Wall, 1982). High levels of
education attainment amongst travelers, according to Goeldner and Ritchie (2012)
would be highly attributable to the high visibility of a traveler culture within the social
and educational system in Europe and Asia. Although the role of tourism at its
meaning as discriminated by level of education is largely minimal in academic
research (Small, 2008), it is a significant factor to tourist choice.
4.2.1.10. Duration of visit
The study findings further identified that most of the tourists to the four parks
travelled on day trips and also a significant number on extended stays as indicated in
the figure . A significant number of tourists to Nairobi National Park and Hell‟s gate
National Park were on excursions and day trips. However, a significant number of
tourists to Lake Nakuru National Park and Aberdares National Park were on extended
stays > 8 days (see figure 4.11).

109
Figure 4.11: Tourists‟ duration of visit
In support of these findings, the UNWTO (2013) states on tourist demographic
changes that rising mobility and changes in behavior relating to day trips compensate
for the effects of demographic change (population development, age structure) by
2020, i.e. those aged 65+ may become the most important target group for day trip
travel. At the same time, significant market share will be lost with respect to those
aged 15 to 44. The growing importance of older target groups is expected to result in
an overall sales increase in terms of day trips.
4.2.1.11. Brand Familiarity
The tourists were asked whether they were familiar with the KWS park brands. The
results indicated that 76.92% of the tourists to Nairobi National Park were familiar to

110
the park brand, 79.31% of the tourists to Hell‟s Gate National Park were familiar to
the park brand, a significant 76.26% of the tourists to Lake Nakuru were familiar to
the park brand and 66.67% of the tourists to Aberdares National Park were familiar to
the park brand (see figure 4.12).
Figure 4.12: Park brand familiarity
In terms of brand familiarity within the context of other competing brands, a
significant 80.28% of tourists to Hell‟s Gate National Park were familiar to the KWS
park brands (see figure 4.13). Further to this, a significant 16.9% of the tourists to
Hell‟s gate National park used the lonely planet online brand and only 2.82% used the
Kenya Tourism Board‟s online MagicalKenya brand. As for Nairobi National Park,
66.28% of the tourists were familiar to the KWS park brand, while 27.91% of the
tourists felt that the lonely planet brand was a significant brand of choice and only
5.81% of the tourists felt that Kenya Tourism Board‟s Magical Kenya brand was quite
familiar.
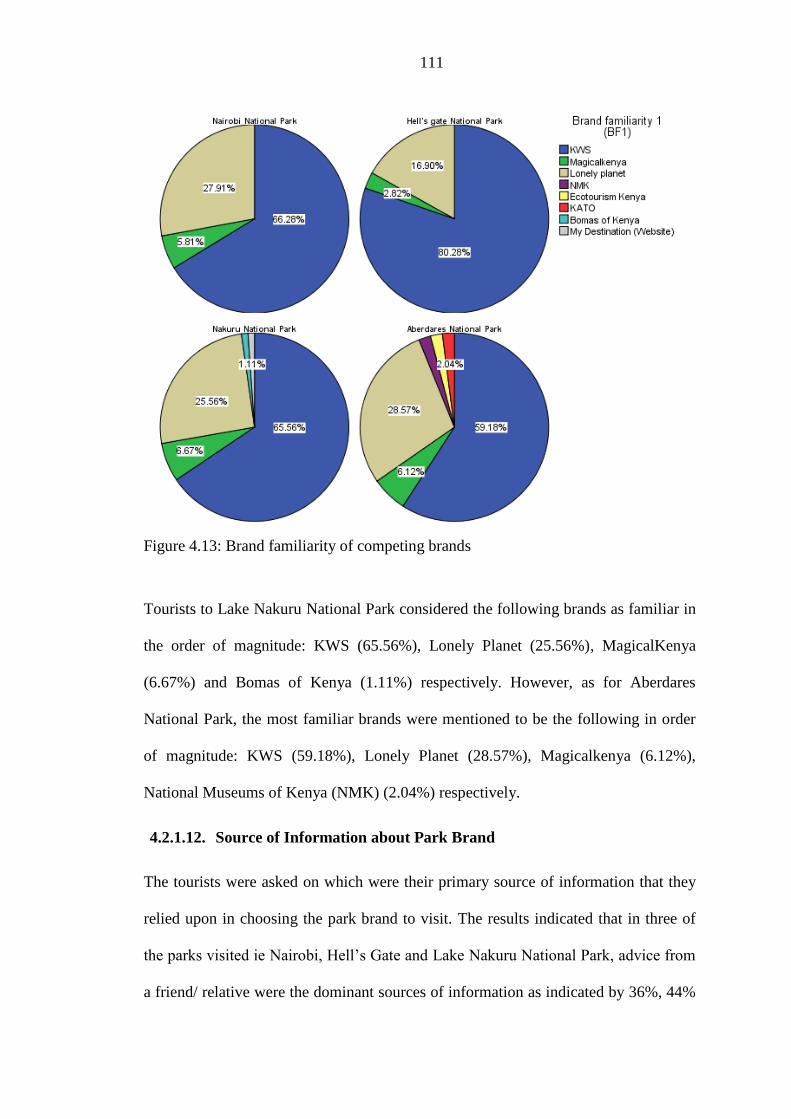
111
Figure 4.13: Brand familiarity of competing brands
Tourists to Lake Nakuru National Park considered the following brands as familiar in
the order of magnitude: KWS (65.56%), Lonely Planet (25.56%), MagicalKenya
(6.67%) and Bomas of Kenya (1.11%) respectively. However, as for Aberdares
National Park, the most familiar brands were mentioned to be the following in order
of magnitude: KWS (59.18%), Lonely Planet (28.57%), Magicalkenya (6.12%),
National Museums of Kenya (NMK) (2.04%) respectively.
4.2.1.12. Source of Information about Park Brand
The tourists were asked on which were their primary source of information that they
relied upon in choosing the park brand to visit. The results indicated that in three of
the parks visited ie Nairobi, Hell‟s Gate and Lake Nakuru National Park, advice from
a friend/ relative were the dominant sources of information as indicated by 36%, 44%
112
and 43% of the respondents indicating that respectively. As for Aberdares National
Park, the most dominant source of information for tourists were the travel agents
(28%). Additional sources of information which included online search (20%); tour
operators (18%) and advise from friends/ relatives (18%). For Nairobi National Park,
online search (15%), commercial ads (12%) and tour operators (11%) were significant
sources. For Hell‟s Gate National Park, additional sources of information included
social media (12%), tour operators (10%), travel guide (9%) and commercial ads
(9%).
In explaining these findings, it is important to note that Rojek (1997) however, added
that the main elements in the social construction of tourism places include:- All tourist
sights depend strongly on the information sources and differentiation processes that
help distinguish them from ordinary places (Urry 1990). These are supported by
information signifiers in the landscape and the marketing industry; Secondly, that the
nature of the information differentiation between ordinary and extraordinary (tourism
places) is cultural, as the relationship between the tourist and the sight is always
culturally detailed and mediated; finally, the distinction between the ordinary and the
extraordinary seems to have been traditionally undermined by the „television culture‟.

113
Figure 4.14: Primary source of information on park brand
4.2.1.13. Motivation to visit the National Park
The tourists were also asked on what really motivated them to visit the park. Tourists
to Nairobi National Park responded that their major motivation to visit the park was
to: View wildlife and reconnect with nature (75.95%); social interaction (11.39%); a
pursuit of relaxation (6.33%) and a desire to escape from the routine/ getaway
(6.33%). However, tourists to Hell‟s Gate National Park responded that the main
motivators were: to view wildlife and reconnect with nature (72.60%); a desire to
escape from routine/ getaway (12.33%); social interaction (4.11%); and a pursuit of
relaxation (2.74%) and education purposes (1.74%) respectively.
Tourists to Lake Nakuru National Park indicated that the key motivators for them to
visit the park were: to view wildlife and reconnect with nature (69.05%); a desire to
escape from routine/ getaway (9.52%); recuperation (3.57%); Strengthening family
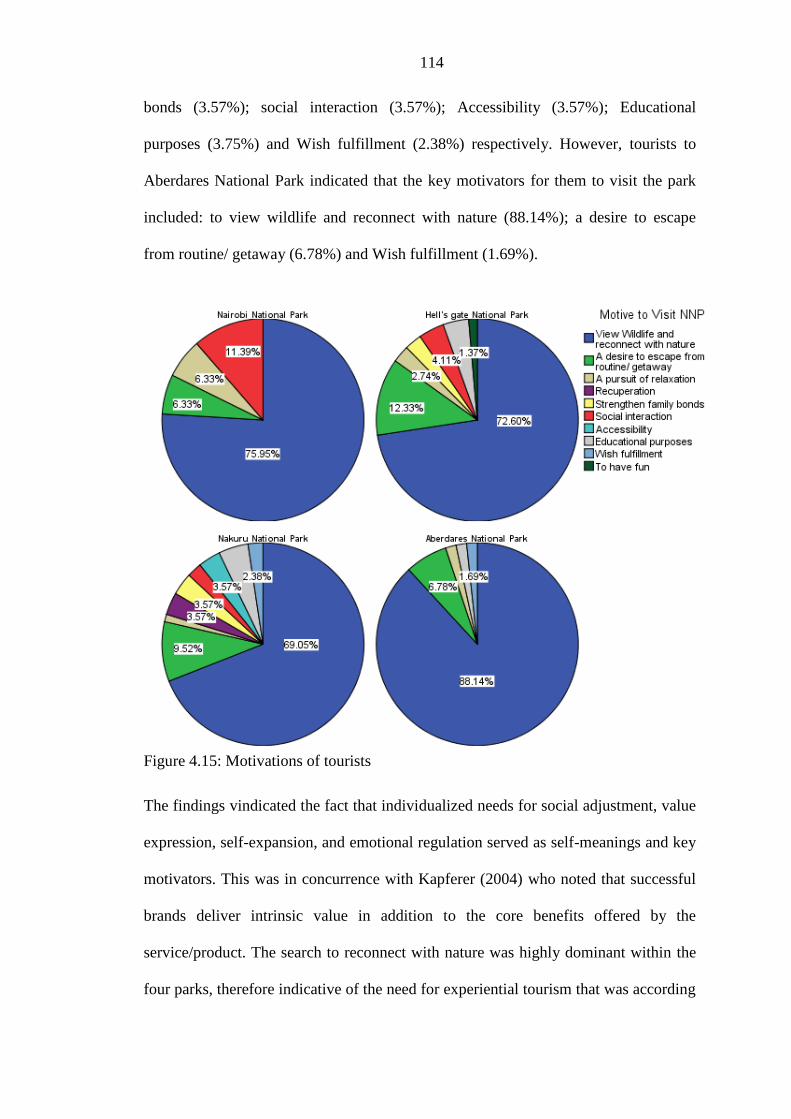
114
bonds (3.57%); social interaction (3.57%); Accessibility (3.57%); Educational
purposes (3.75%) and Wish fulfillment (2.38%) respectively. However, tourists to
Aberdares National Park indicated that the key motivators for them to visit the park
included: to view wildlife and reconnect with nature (88.14%); a desire to escape
from routine/ getaway (6.78%) and Wish fulfillment (1.69%).
Figure 4.15: Motivations of tourists
The findings vindicated the fact that individualized needs for social adjustment, value
expression, self-expansion, and emotional regulation served as self-meanings and key
motivators. This was in concurrence with Kapferer (2004) who noted that successful
brands deliver intrinsic value in addition to the core benefits offered by the
service/product. The search to reconnect with nature was highly dominant within the
four parks, therefore indicative of the need for experiential tourism that was according
115
to Cohen (1979) adaptable to the modern, alienated individual who seeks authentic
experiences in their tourism pursuits. It is important to further note that Escapism
motives were also considered as a significant motive to tourists in Hell‟s Gate, Lake
Nakuru and Aberdares National Parks. According to Gnoth (1997), the escape and
search dichotomy featured as ideal extremes in which actual tourism behaviour
occurred.
4.3.1. RESULTS FOR OBJECTIVE ONE: TO PROFILE TOURISTS
VISITING BRANDED PARKS IN KENYA BASED ON THEIR CHOICE
BEHAVIOUR
One of the key objectives of this study was to profile tourists visiting branded parks in
Kenya based on their choice behaviour (cf. 1.4). The key goal here was to identify
whether the parks attracted a differentiated tourist profile and whether such factors
influenced their choice behaviour as well as brand positioning.
4.3.1.1. Cluster profiling of market segments to Nairobi National Park
An analysis of the market clusters within Nairobi National Park indicated that the
park attracted two main market clusters of tourists. The first cluster (Cluster One –
shown in red in figure 4.16 and table 4.16) categorized as the secondary market
accounted for 48.2% of the tourist respondents which was characterized mainly by
International tourists (100%). Within this cluster, 67.5% of the tourists came to the
country for duration of > 8 days and 80% were female. They did not travel in groups
and preferred independent modes of travel arrangements. They were avid wildlife
enthusiasts. Further, 95% of the tourists from this cluster do not travel with children,
80% of these are female and on average 40% of the tourists within this cluster come
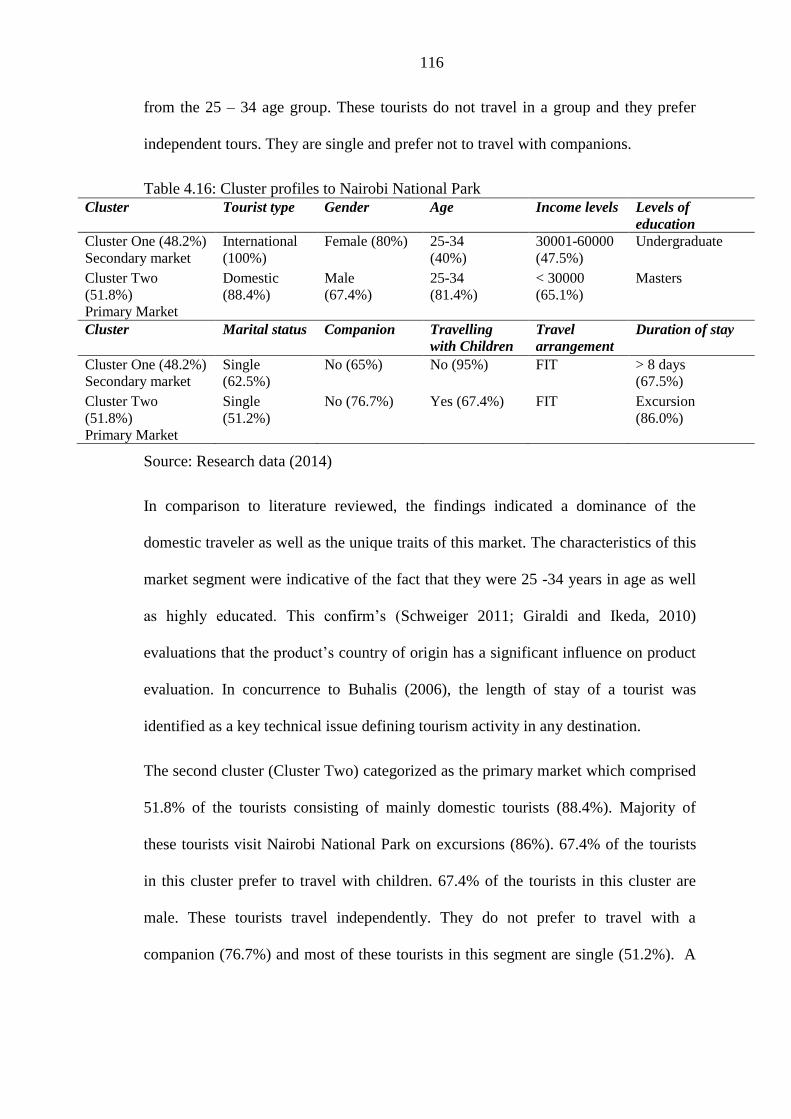
116
from the 25 – 34 age group. These tourists do not travel in a group and they prefer
independent tours. They are single and prefer not to travel with companions.
Table 4.16: Cluster profiles to Nairobi National Park
Cluster Tourist type Gender Age Income levels Levels of
education
Cluster One (48.2%)
Secondary market
International
(100%)
Female (80%) 25-34
(40%)
30001-60000
(47.5%)
Undergraduate
Cluster Two
(51.8%)
Primary Market
Domestic
(88.4%)
Male
(67.4%)
25-34
(81.4%)
< 30000
(65.1%)
Masters
Cluster Marital status Companion Travelling
with Children
Travel
arrangement
Duration of stay
Cluster One (48.2%)
Secondary market
Single
(62.5%)
No (65%) No (95%) FIT > 8 days
(67.5%)
Cluster Two
(51.8%)
Primary Market
Single
(51.2%)
No (76.7%) Yes (67.4%) FIT Excursion
(86.0%)
Source: Research data (2014)
In comparison to literature reviewed, the findings indicated a dominance of the
domestic traveler as well as the unique traits of this market. The characteristics of this
market segment were indicative of the fact that they were 25 -34 years in age as well
as highly educated. This confirm‟s (Schweiger 2011; Giraldi and Ikeda, 2010)
evaluations that the product‟s country of origin has a significant influence on product
evaluation. In concurrence to Buhalis (2006), the length of stay of a tourist was
identified as a key technical issue defining tourism activity in any destination.
The second cluster (Cluster Two) categorized as the primary market which comprised
51.8% of the tourists consisting of mainly domestic tourists (88.4%). Majority of
these tourists visit Nairobi National Park on excursions (86%). 67.4% of the tourists
in this cluster prefer to travel with children. 67.4% of the tourists in this cluster are
male. These tourists travel independently. They do not prefer to travel with a
companion (76.7%) and most of these tourists in this segment are single (51.2%). A

117
statistical analogy of the characteristics of the domestic tourist segment, highlights the
unique characteristics of the cluster therefore providing a basis for marketing strategy.
An analysis of the differences between the two clusters showed that the two clusters
were significantly different in terms of gender, income levels, level of education
attainment, duration of stay as well as country of origin. The two market segments
were also characteristically similar in terms of age profiles, marital status, travelling
with companion as well as the preferred mode of travel arrangement.

118
Figure 4.15: Tourist Market cluster profiling (Nairobi N. Park)
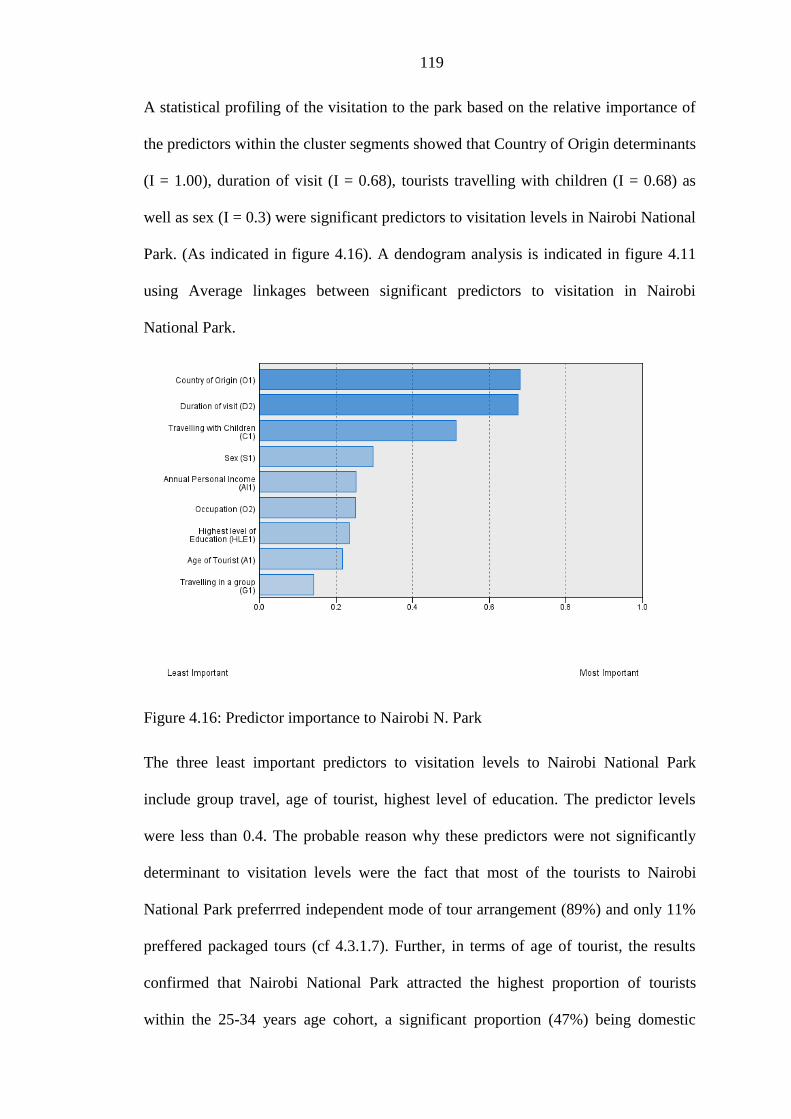
119
A statistical profiling of the visitation to the park based on the relative importance of
the predictors within the cluster segments showed that Country of Origin determinants
(I = 1.00), duration of visit (I = 0.68), tourists travelling with children (I = 0.68) as
well as sex (I = 0.3) were significant predictors to visitation levels in Nairobi National
Park. (As indicated in figure 4.16). A dendogram analysis is indicated in figure 4.11
using Average linkages between significant predictors to visitation in Nairobi
National Park.
Figure 4.16: Predictor importance to Nairobi N. Park
The three least important predictors to visitation levels to Nairobi National Park
include group travel, age of tourist, highest level of education. The predictor levels
were less than 0.4. The probable reason why these predictors were not significantly
determinant to visitation levels were the fact that most of the tourists to Nairobi
National Park preferrred independent mode of tour arrangement (89%) and only 11%
preffered packaged tours (cf 4.3.1.7). Further, in terms of age of tourist, the results
confirmed that Nairobi National Park attracted the highest proportion of tourists
within the 25-34 years age cohort, a significant proportion (47%) being domestic
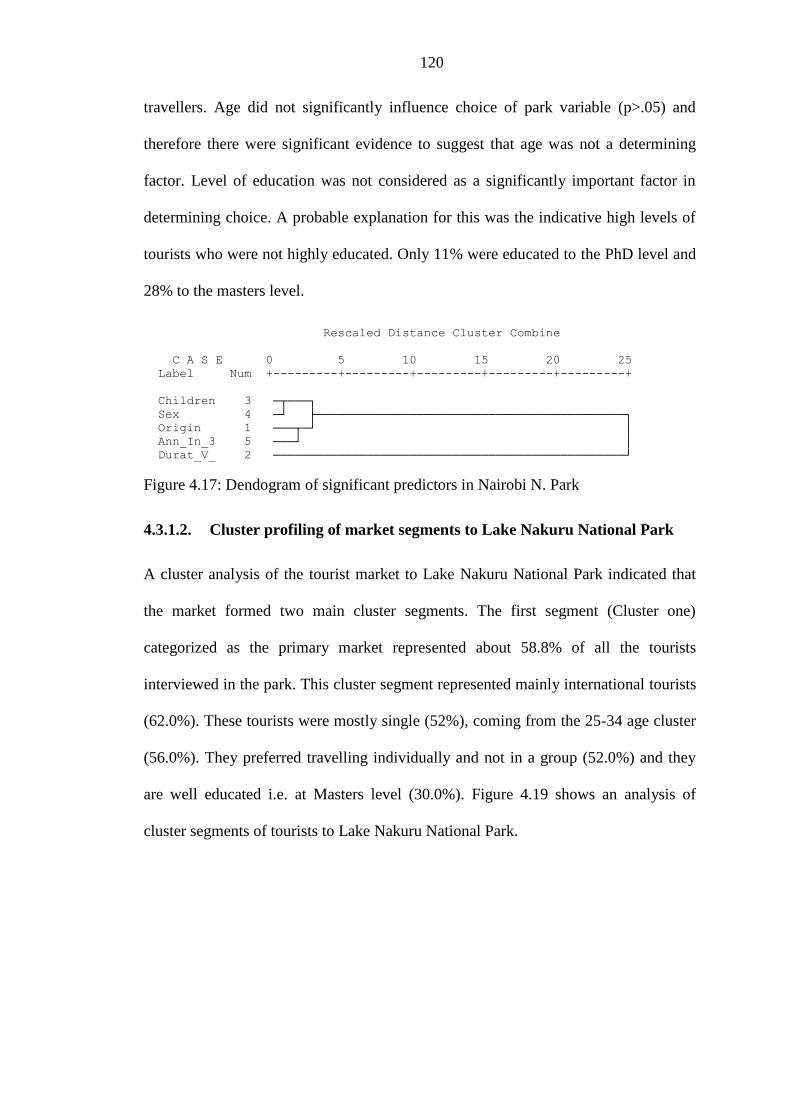
120
travellers. Age did not significantly influence choice of park variable (p>.05) and
therefore there were significant evidence to suggest that age was not a determining
factor. Level of education was not considered as a significantly important factor in
determining choice. A probable explanation for this was the indicative high levels of
tourists who were not highly educated. Only 11% were educated to the PhD level and
28% to the masters level.
Rescaled Distance Cluster Combine
C A S E 0 5 10 15 20 25
Label Num +---------+---------+---------+---------+---------+
Children 3 ─┬───┐
Sex 4 ─┘ ├───────────────────────────────────────────┐
Origin 1 ───┬─┘ │
Ann_In_3 5 ───┘ │
Durat_V_ 2 ─────────────────────────────────────────────────┘
Figure 4.17: Dendogram of significant predictors in Nairobi N. Park
4.3.1.2. Cluster profiling of market segments to Lake Nakuru National Park
A cluster analysis of the tourist market to Lake Nakuru National Park indicated that
the market formed two main cluster segments. The first segment (Cluster one)
categorized as the primary market represented about 58.8% of all the tourists
interviewed in the park. This cluster segment represented mainly international tourists
(62.0%). These tourists were mostly single (52%), coming from the 25-34 age cluster
(56.0%). They preferred travelling individually and not in a group (52.0%) and they
are well educated i.e. at Masters level (30.0%). Figure 4.19 shows an analysis of
cluster segments of tourists to Lake Nakuru National Park.
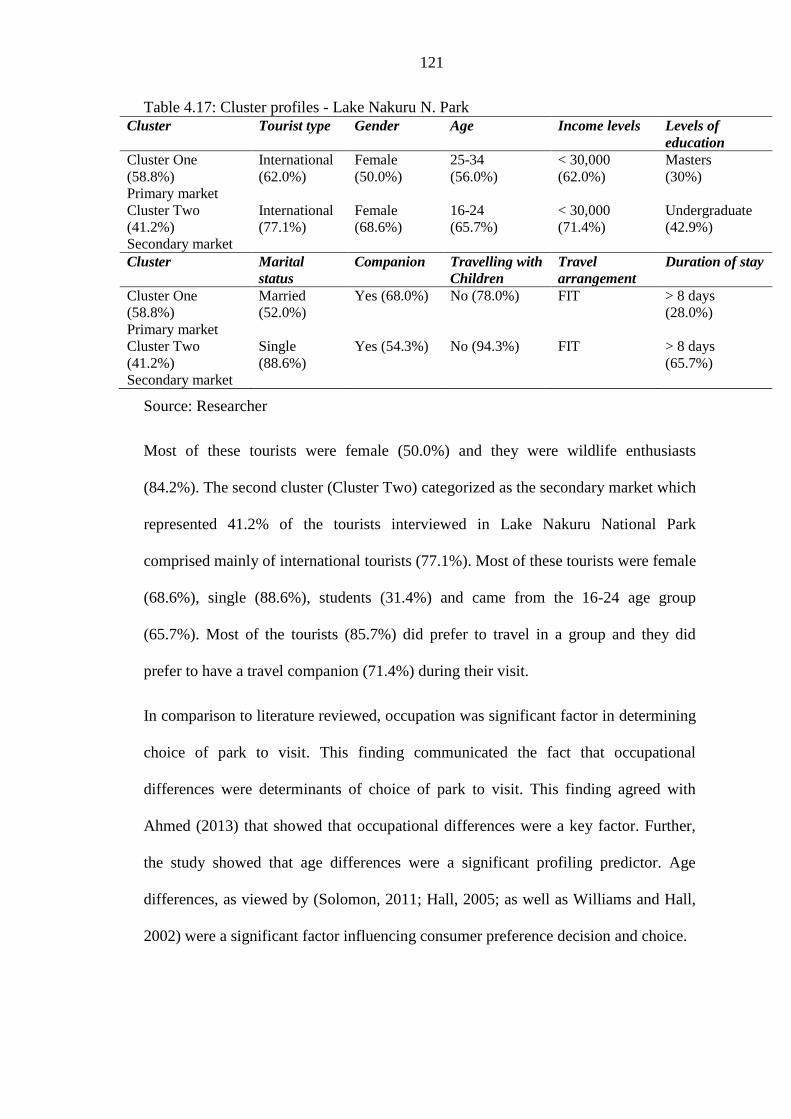
121
Table 4.17: Cluster profiles - Lake Nakuru N. Park
Cluster Tourist type Gender Age Income levels Levels of
education
Cluster One
(58.8%)
Primary market
International
(62.0%)
Female
(50.0%)
25-34
(56.0%)
< 30,000
(62.0%)
Masters
(30%)
Cluster Two
(41.2%)
Secondary market
International
(77.1%)
Female
(68.6%)
16-24
(65.7%)
< 30,000
(71.4%)
Undergraduate
(42.9%)
Cluster Marital
status
Companion Travelling with
Children
Travel
arrangement
Duration of stay
Cluster One
(58.8%)
Primary market
Married
(52.0%)
Yes (68.0%) No (78.0%) FIT > 8 days
(28.0%)
Cluster Two
(41.2%)
Secondary market
Single
(88.6%)
Yes (54.3%) No (94.3%) FIT > 8 days
(65.7%)
Source: Researcher
Most of these tourists were female (50.0%) and they were wildlife enthusiasts
(84.2%). The second cluster (Cluster Two) categorized as the secondary market which
represented 41.2% of the tourists interviewed in Lake Nakuru National Park
comprised mainly of international tourists (77.1%). Most of these tourists were female
(68.6%), single (88.6%), students (31.4%) and came from the 16-24 age group
(65.7%). Most of the tourists (85.7%) did prefer to travel in a group and they did
prefer to have a travel companion (71.4%) during their visit.
In comparison to literature reviewed, occupation was significant factor in determining
choice of park to visit. This finding communicated the fact that occupational
differences were determinants of choice of park to visit. This finding agreed with
Ahmed (2013) that showed that occupational differences were a key factor. Further,
the study showed that age differences were a significant profiling predictor. Age
differences, as viewed by (Solomon, 2011; Hall, 2005; as well as Williams and Hall,
2002) were a significant factor influencing consumer preference decision and choice.
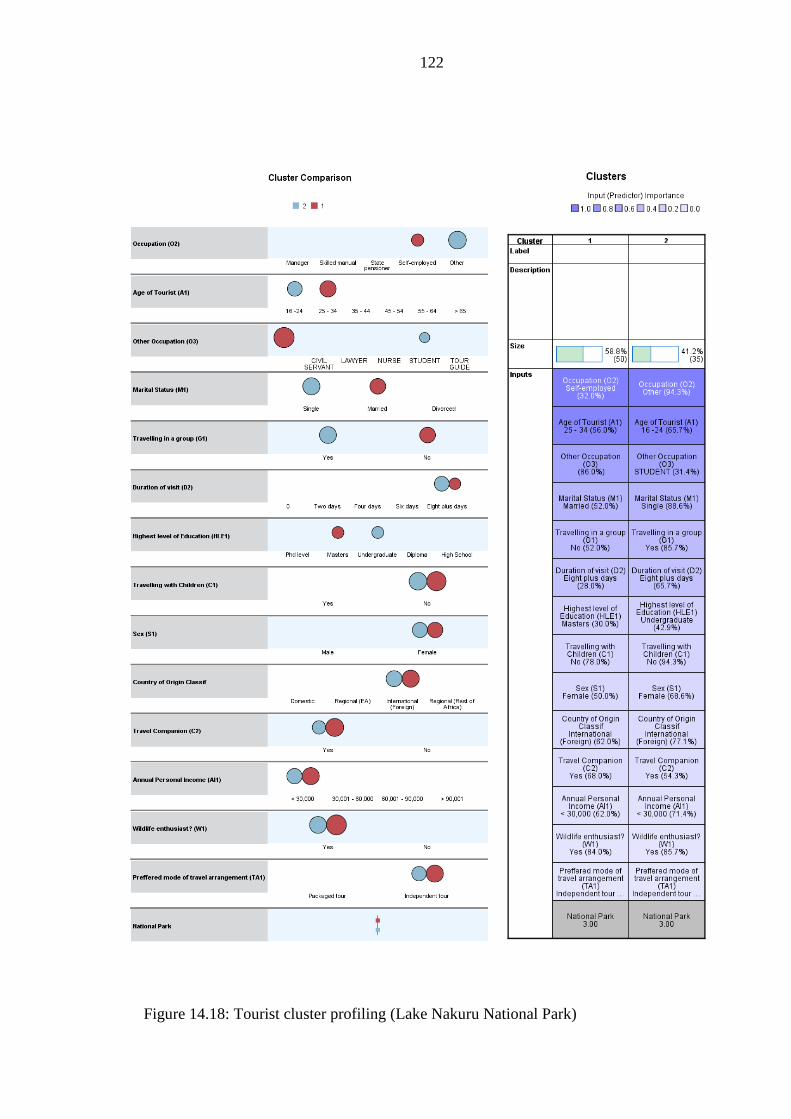
122
Figure 14.18: Tourist cluster profiling (Lake Nakuru National Park)

123
An analysis of predictor importance showed that the tourist‟s occupation (i = 1.00),
age group (i = 0.94), marital status (i =0.46), group travel (i = 0.41) as well as
duration of visit (i = 0.35) were key predictors to visitation in Lake Nakuru National
Park. A dendogram analysis is indicated in figure 4.19 using Average linkages
between significant predictors to visitation in Lake Nakuru National Park.
Figure 4.19: Predictor importance - Lake Nakuru N. Park
However, the three least important predictors to visitation levels in Lake Nakuru
National Park were country of origin, sex and tourists travelling with children. The
findings were indicative of the fact that these factors least influenced visitation to the
park.
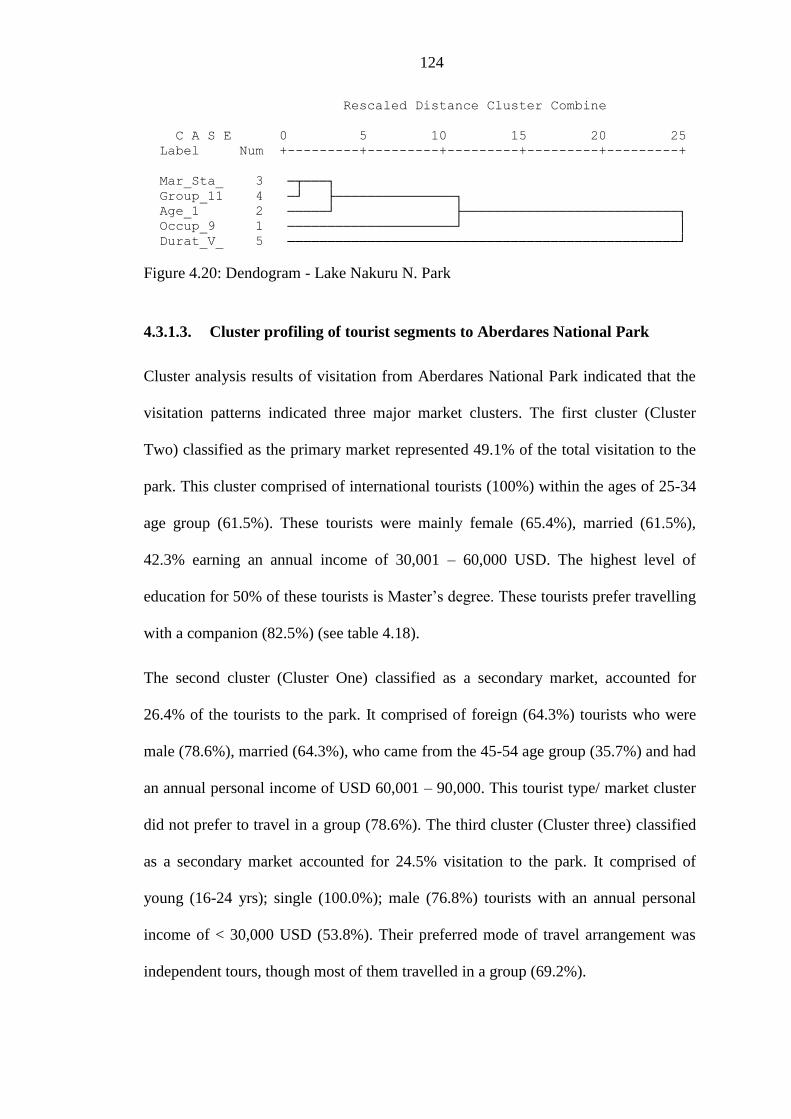
124
Rescaled Distance Cluster Combine
C A S E 0 5 10 15 20 25
Label Num +---------+---------+---------+---------+---------+
Mar_Sta_ 3 ─┬───┐
Group_11 4 ─┘ ├───────────────┐
Age_1 2 ─────┘ ├───────────────────────────┐
Occup_9 1 ─────────────────────┘ │
Durat_V_ 5 ─────────────────────────────────────────────────┘
Figure 4.20: Dendogram - Lake Nakuru N. Park
4.3.1.3. Cluster profiling of tourist segments to Aberdares National Park
Cluster analysis results of visitation from Aberdares National Park indicated that the
visitation patterns indicated three major market clusters. The first cluster (Cluster
Two) classified as the primary market represented 49.1% of the total visitation to the
park. This cluster comprised of international tourists (100%) within the ages of 25-34
age group (61.5%). These tourists were mainly female (65.4%), married (61.5%),
42.3% earning an annual income of 30,001 – 60,000 USD. The highest level of
education for 50% of these tourists is Master‟s degree. These tourists prefer travelling
with a companion (82.5%) (see table 4.18).
The second cluster (Cluster One) classified as a secondary market, accounted for
26.4% of the tourists to the park. It comprised of foreign (64.3%) tourists who were
male (78.6%), married (64.3%), who came from the 45-54 age group (35.7%) and had
an annual personal income of USD 60,001 – 90,000. This tourist type/ market cluster
did not prefer to travel in a group (78.6%). The third cluster (Cluster three) classified
as a secondary market accounted for 24.5% visitation to the park. It comprised of
young (16-24 yrs); single (100.0%); male (76.8%) tourists with an annual personal
income of < 30,000 USD (53.8%). Their preferred mode of travel arrangement was
independent tours, though most of them travelled in a group (69.2%).

125
Table 4.18: Cluster profiles - Aberdares N. Park
Cluster Tourist type Gender Age Income levels Levels of
education
Cluster One
(26.4%)
Secondary market
International
(64.3%)
Male
(78.6%)
45-56
(35.7%)
60,001-90,000
(42.9%)
Undergraduate
(42.9%)
Cluster Two
(49.1%)
Primary market
International
(100.0%)
Female
(65.4%)
25-34
(61.5%)
30,001-60,000
(42.3%)
Masters
(50.0%)
Cluster Three
(24.5%)
Secondary market
International
(76.9%)
Male
(76.9%)
16-34
(61.5%)
< 30,000
(53.8%)
High school
(46.2%)
Cluster Marital Status Companion Travelling with
Children
Travel
arrangement
Duration of stay
Cluster One
(26.4%)
Secondary market
Married
(64.3%)
Yes (71.4%) No (71.4%) FIT > 8 days
(64.3%)
Cluster Two
(49.1%)
Primary market
Married
(61.5%)
Yes (88.5%) No (84.6%) Packaged tour > 8 days
(50.0%)
Cluster Three
(24.5%)
Secondary market
Single
100%)
Yes (84.6%) No (100.0%) FIT > 8 days
(61.5%)
Source: Researcher
An analysis of the three cluster segments indicated that the clusters have distinct
similarities as well as differences in terms of demographic characteristics. In terms of
similarities in demographic characteristics, most of the tourists in the three segments
were international tourists, they travelled with a companion, and they preferred not to
travel with children. However, in terms of differences, the distinct market segments
could be differentiated in terms of gender, age profile, income levels, level of
education, marital status as well as preferred mode of travel arrangement (as indicated
in table 4.18 and figure 4.21).

126
Figure 4.21: Tourist Cluster Profiling (Aberdares N. Park)
An analysis of predictor importance showed that, Age, Marital status, income and
preferred mode of travel arrangement were highly rated predictors to visitation in
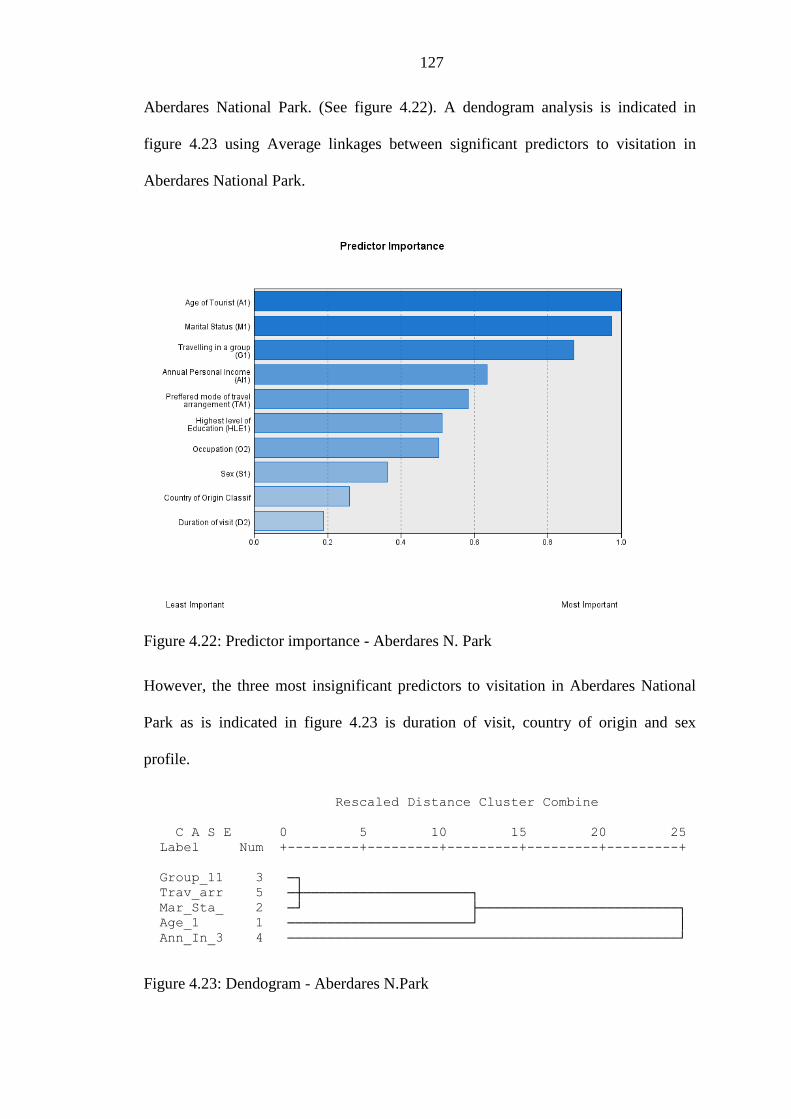
127
Aberdares National Park. (See figure 4.22). A dendogram analysis is indicated in
figure 4.23 using Average linkages between significant predictors to visitation in
Aberdares National Park.
Figure 4.22: Predictor importance - Aberdares N. Park
However, the three most insignificant predictors to visitation in Aberdares National
Park as is indicated in figure 4.23 is duration of visit, country of origin and sex
profile.
Rescaled Distance Cluster Combine
C A S E 0 5 10 15 20 25
Label Num +---------+---------+---------+---------+---------+
Group_11 3 ─┐
Trav_arr 5 ─┼─────────────────────┐
Mar_Sta_ 2 ─┘ ├─────────────────────────┐
Age_1 1 ───────────────────────┘ │
Ann_In_3 4 ─────────────────────────────────────────────────┘
Figure 4.23: Dendogram - Aberdares N.Park

128
4.3.1.4. Cluster profiling of tourist segments to Hell’s Gate National Park
Hell‟s Gate National Park attracted two main clusters of tourists (sa indicated in table
4.19 and figure 4.25. The first cluster (Cluster One) classified as the primary market
accounted for 58.3% of the visitation to Hell‟s Gate National Park. This cluster
comprised mainly male (85.7%); single (57.1%); International tourists (57.1%). These
tourists had an annual personal income of < 30,000 USD. They came from the 25-34
age group (42.9%). These tourists were well educated (Masters) and also preferred
travelling with children (100%). However, the second cluster, classified as the
secondary market comprised of 41.7% of the tourists consisted of female (100%);
married (80.0%); excursionists (100%), who were self-employed (80%). These
tourists preferred travelling in groups (60%) and were mostly domestic tourists (80%).
They had an annual personal income of < 30,000 (80.0%).
Table 4.19: Cluster profiles - Hell‟s gate National Park.
Cluster Tourist type Gender Age Income levels Levels of
education
Cluster One
(58.3%)
Primary market
International
(57.1%)
Male
(85.7%)
25-34
(42.9%)
< 30,000
(42.9%)
Masters
(71.4%)
Cluster Two
(41.7%)
Secondary market
Domestic
(80.0%)
Female
(100.0%)
25-34
(80.0%)
< 30,000
(80.0%)
High School
(60.0%)
Cluster Marital
status
Companion Travelling with
Children
Travel in a
group
Duration of stay
Cluster One
(58.3%)
Primary market
Single
(57.1%)
No
(57.1%)
2
(42.9%)
No
(85.7%)
> 8 days
(57.1%)
Cluster Two
(41.7%)
Secondary market
Married
(80.0%)
Yes
(100.0%)
1
(40.0%)
Yes
(60.0%)
Excursion
(100.0%)
Source: Research data (2014)
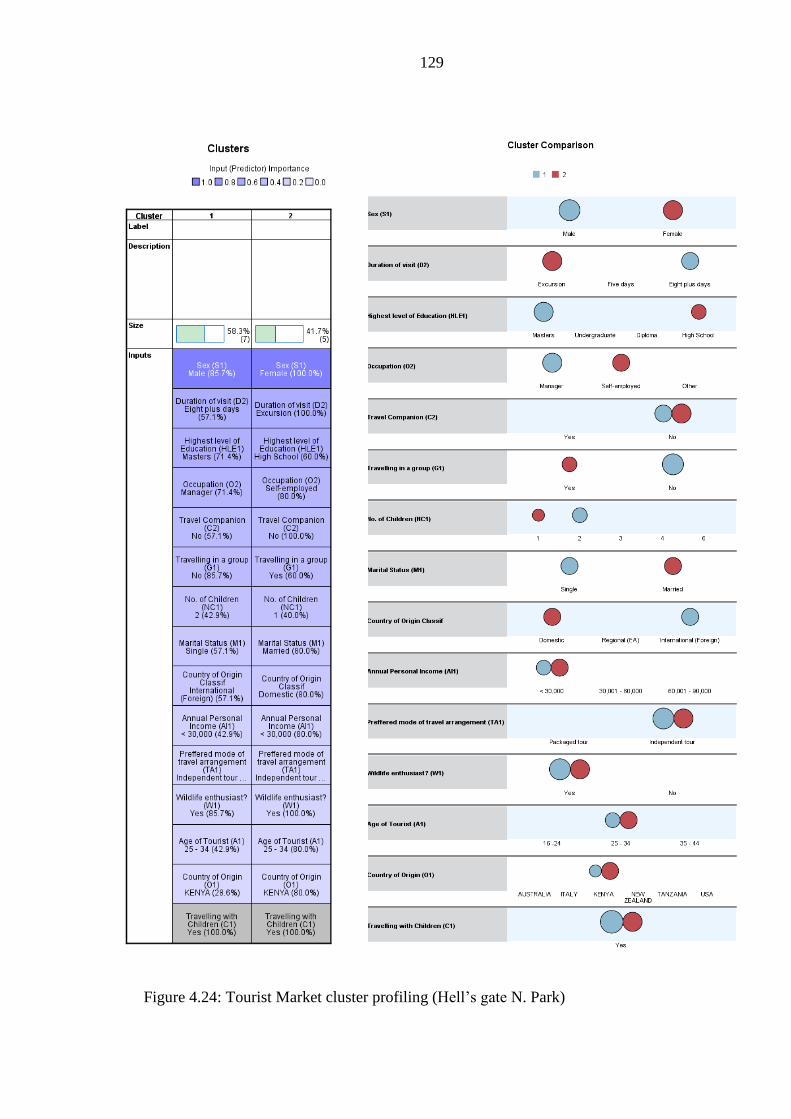
129
Figure 4.24: Tourist Market cluster profiling (Hell‟s gate N. Park)

130
An analysis of the predictor importance to visitation indicated that Gender, Duration
Of Visit, Level of Education, Occupation and Travel Companion were key predictors
to visitation in Hell‟s Gate National Park. A dendogram analysis is indicated in figure
4.25 using Average linkages between significant predictors to visitation in Hell‟sgate
National Park
Figure 4.25: Predictor importance - Hell‟s Gate N. Park
The three most least important predictors to visitation in Hell‟sgate National park
were annual personal income, country of origin and marital status.
Rescaled Distance Cluster Combine
C A S E 0 5 10 15 20 25
Label Num +---------+---------+---------+---------+---------+
Sex_2 1 ─┬───────────┐
Tr_Comp_ 5 ─┘ ├───────────────────────────────────┐
Educ_8 3 ─────────┬───┘ │
Occup_9 4 ─────────┘ │
Durat_V_ 2 ─────────────────────────────────────────────────┘
Figure 4.26: Dendogram - Hell‟s gate N. Park
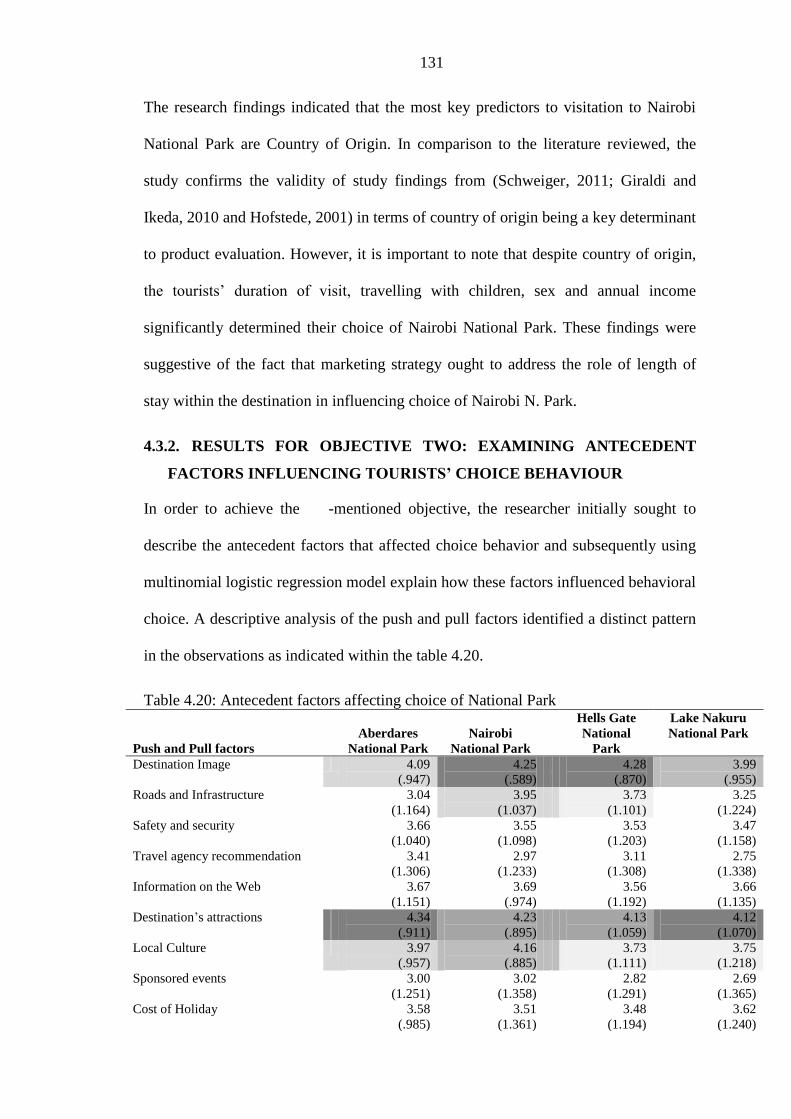
131
The research findings indicated that the most key predictors to visitation to Nairobi
National Park are Country of Origin. In comparison to the literature reviewed, the
study confirms the validity of study findings from (Schweiger, 2011; Giraldi and
Ikeda, 2010 and Hofstede, 2001) in terms of country of origin being a key determinant
to product evaluation. However, it is important to note that despite country of origin,
the tourists‟ duration of visit, travelling with children, sex and annual income
significantly determined their choice of Nairobi National Park. These findings were
suggestive of the fact that marketing strategy ought to address the role of length of
stay within the destination in influencing choice of Nairobi N. Park.
4.3.2. RESULTS FOR OBJECTIVE TWO: EXAMINING ANTECEDENT
FACTORS INFLUENCING TOURISTS’ CHOICE BEHAVIOUR
In order to achieve the -mentioned objective, the researcher initially sought to
describe the antecedent factors that affected choice behavior and subsequently using
multinomial logistic regression model explain how these factors influenced behavioral
choice. A descriptive analysis of the push and pull factors identified a distinct pattern
in the observations as indicated within the table 4.20.
Table 4.20: Antecedent factors affecting choice of National Park
Push and Pull factors
Aberdares
National Park
Nairobi
National Park
Hells Gate
National
Park
Lake Nakuru
National Park
Destination Image 4.09
(.947)
4.25
(.589)
4.28
(.870)
3.99
(.955)
Roads and Infrastructure
3.04
(1.164)
3.95
(1.037)
3.73
(1.101)
3.25
(1.224)
Safety and security 3.66
(1.040)
3.55
(1.098)
3.53
(1.203)
3.47
(1.158)
Travel agency recommendation
3.41
(1.306)
2.97
(1.233)
3.11
(1.308)
2.75
(1.338)
Information on the Web
3.67
(1.151)
3.69
(.974)
3.56
(1.192)
3.66
(1.135)
Destination‟s attractions
4.34
(.911)
4.23
(.895)
4.13
(1.059)
4.12
(1.070)
Local Culture 3.97
(.957)
4.16
(.885)
3.73
(1.111)
3.75
(1.218)
Sponsored events 3.00
(1.251)
3.02
(1.358)
2.82
(1.291)
2.69
(1.365)
Cost of Holiday 3.58
(.985)
3.51
(1.361)
3.48
(1.194)
3.62
(1.240)

132
Push and Pull factors
Aberdares
National Park
Nairobi
National Park
Hells Gate
National
Park
Lake Nakuru
National Park
Promotion 3.27
(1.170)
3.01
(1.321)
3.15
(1.273)
2.79
(1.249)
Reference from Tour Operator
3.52
(1.144)
2.79
(1.295)
2.87
(1.388)
2.93
(1.288)
Service Quality 3.86
(1.079)
3.82
(1.141)
3.35
(1.152)
3.22
(1.166)
Touristic activity at the
destination
4.11
(.848)
3.76
(.993)
3.94
(1.044)
4.09
(1.001)
Previous travel experience
3.69
(1.427)
3.78
(1.031)
3.82
(1.217)
3.82
(1.056)
Accommodation quality
3.92
(.967)
3.48
(1.139)
3.40
(1.187)
3.07
(1.229)
Market presence of the park 3.41
(1.050)
3.28
(1.044)
3.31
(1.080)
3.10
(1.284)
Valid N (list wise) 75 91 88 103
Note: Ranked using a Likert-type scale.
The standard deviations are indicated in brackets.
Key:
Highly Likely
Likely
Moderately Likely
Fairly Likely
Reasonably Likely
The radar chart in the figure 4.27 graphically describes the major patterns in the
observations. General observations imply that the destination‟s attractions were highly
likely to be chosen within Aberdares and Lake Nakuru National Park. In Nairobi and
Hell‟s Gate National Park the destination‟s image were mentioned as highly likely
factor on average to be chosen. In Lake Nakuru and Aberdares National Park touristic
activities within the destination were moderately likely to be chosen as factors.
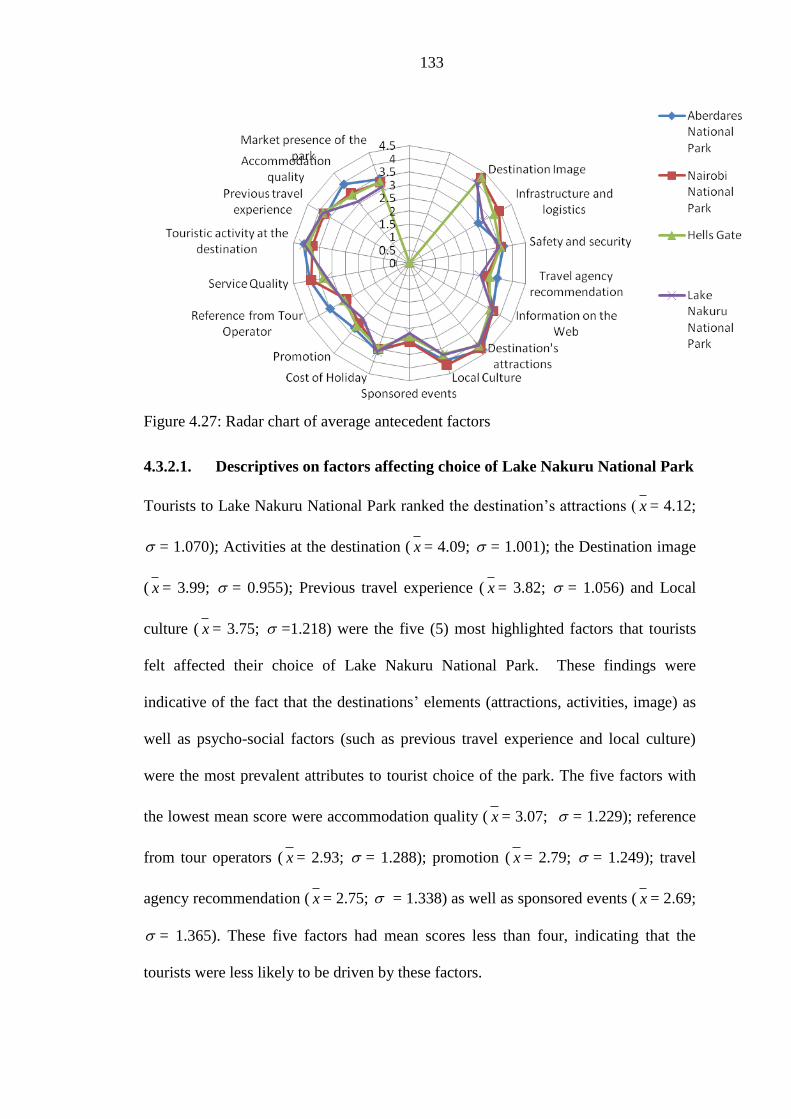
133
Figure 4.27: Radar chart of average antecedent factors
4.3.2.1. Descriptives on factors affecting choice of Lake Nakuru National Park
Tourists to Lake Nakuru National Park ranked the destination‟s attractions ( x = 4.12;
= 1.070); Activities at the destination ( x = 4.09; = 1.001); the Destination image
( x = 3.99; = 0.955); Previous travel experience ( x = 3.82; = 1.056) and Local
culture ( x = 3.75; =1.218) were the five (5) most highlighted factors that tourists
felt affected their choice of Lake Nakuru National Park. These findings were
indicative of the fact that the destinations‟ elements (attractions, activities, image) as
well as psycho-social factors (such as previous travel experience and local culture)
were the most prevalent attributes to tourist choice of the park. The five factors with
the lowest mean score were accommodation quality ( x = 3.07; = 1.229); reference
from tour operators ( x = 2.93; = 1.288); promotion ( x = 2.79; = 1.249); travel
agency recommendation ( x = 2.75; = 1.338) as well as sponsored events ( x = 2.69;
= 1.365). These five factors had mean scores less than four, indicating that the
tourists were less likely to be driven by these factors.

134
4.3.2.2. Descriptives on factors affecting choice of Hell’s Gate National Park
Similarly, a rank analysis of the determinants to choice of Hell‟s Gate National Park
indicated that the most prevalent factors included the destination‟s image ( x =4.28;
=0.870); the destination‟s attractions ( x = 4.13; =1.059); activities at the
destination ( x =3.94; =1.044); previous travel experience ( x =3.82; =1.217) and
local culture ( x = 3.73; =1.111) as indicated in table 4.25. These findings were
similarly indicative of the fact that the destinations‟ elements (activities, image,
attractions) as well as psycho-social factors (such as previous travel experience and
local culture) were the most prevalent attributes to tourist choice of the park. The five
items with the lowest mean scores were accommodation quality ( x =3.40; =1.187);
market presence of the park ( x = 3.31; =1.080); travel agency recommendation ( x =
3.11; = 1.308); reference from tour operator ( x =2.87; =1.388) and sponsored
events ( x = 2.82; =1.291). These five factors had mean scores less than four,
indicating that the tourists were less likely to be driven by these factors.
4.3.2.3. Descriptives on factors affecting choice of Aberdares National Park
A rank analysis of the five factors with the highest mean scores affecting choice of
Aberdares National Park indicated that the destination‟s attractions ( x = 4.34;
=0.911), touristic activities at the destination ( x = 4.11; =0.848); destination
image ( x = 4.09; =0.947); local culture ( x =3.97; =0.957) and accommodation
quality ( x = 3.92; =0.967). An analysis of the five least mean scores of factors
affecting choice of Aberdares National Park included sponsored events ( x = 3.00; =
1.251), roads and infrastructure ( x =3.04; = 1.164), promotion ( x = 3.27; =
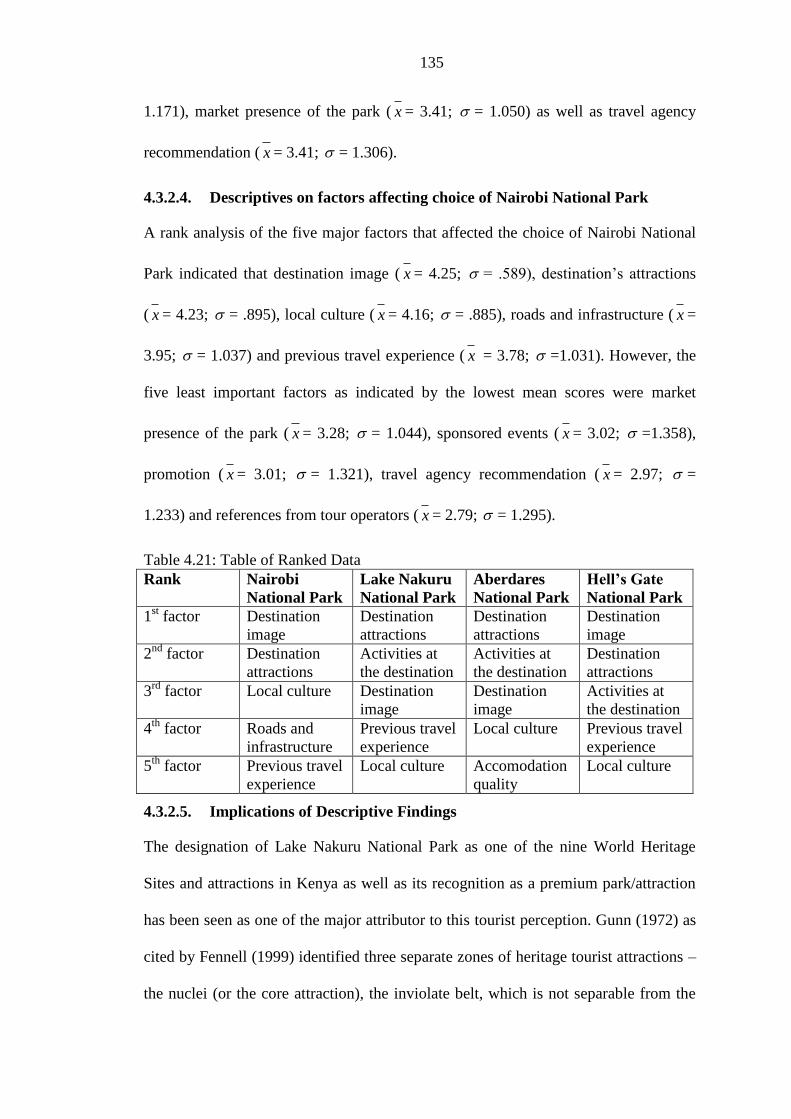
135
1.171), market presence of the park ( x = 3.41; = 1.050) as well as travel agency
recommendation ( x = 3.41; = 1.306).
4.3.2.4. Descriptives on factors affecting choice of Nairobi National Park
A rank analysis of the five major factors that affected the choice of Nairobi National
Park indicated that destination image ( x = 4.25; = .589), destination‟s attractions
( x = 4.23; = .895), local culture ( x = 4.16; = .885), roads and infrastructure ( x =
3.95; = 1.037) and previous travel experience ( x = 3.78; =1.031). However, the
five least important factors as indicated by the lowest mean scores were market
presence of the park ( x = 3.28; = 1.044), sponsored events ( x = 3.02; =1.358),
promotion ( x = 3.01; = 1.321), travel agency recommendation ( x = 2.97; =
1.233) and references from tour operators ( x = 2.79; = 1.295).
Table 4.21: Table of Ranked Data
Rank
Nairobi
National Park
Lake Nakuru
National Park
Aberdares
National Park
Hell’s Gate
National Park
1st factor Destination
image
Destination
attractions
Destination
attractions
Destination
image
2nd
factor Destination
attractions
Activities at
the destination
Activities at
the destination
Destination
attractions
3rd
factor Local culture Destination
image
Destination
image
Activities at
the destination
4th
factor Roads and
infrastructure
Previous travel
experience
Local culture Previous travel
experience
5th
factor Previous travel
experience
Local culture Accomodation
quality
Local culture
4.3.2.5. Implications of Descriptive Findings
The designation of Lake Nakuru National Park as one of the nine World Heritage
Sites and attractions in Kenya as well as its recognition as a premium park/attraction
has been seen as one of the major attributor to this tourist perception. Gunn (1972) as
cited by Fennell (1999) identified three separate zones of heritage tourist attractions –
the nuclei (or the core attraction), the inviolate belt, which is not separable from the

136
nuclei, and the zone of closure that comprises of desirable tourist infrastructure
including information. However Cameron and Gatewood (2000) in a study on the
differences in motives of tourists to heritage sites clearly showed that the tourists
main motive to visit heritage sites were to have a personal experience with the
attraction. They sought emotional involvement with the heritage of the area.
Heritage sites are dominated by public interests which may according to Ashworth &
Lakham (1994) have political, cultural and economic dimensions. Heritage is used to
Legitimate the dominance of the group in power (Ashworth, 1994) Construct place-
identities, whether on the local, regional, national and international level and to
establish a sense of distinctiveness (Ashworth & Lakham 1994). Therefore, the
destination‟s image and attractions played a significant role in influencing choice of
heritage sites. The distribution figures of the responses indicated that 42.7% of the
tourists agreed that Destination image was a factor. Prayag (2009) notes that a
compelling destination image is quintessential for the success of a destination brand.
It is therefore critical to align the marketing and promotion of parks to the brand
image and essence of the park.
Information on the web as indicated by 44.4% of the tourists were an important factor.
This finding clearly shows a prevalence of an online market that had a significant
influence on tourism globally. Infact, Buhalis and Diemezi (2004) affirm that
Information Communication Technologies (ICTs) have been changing the global
tourism industry rapidly. Mackay & Vogt (2012) in their research indicate three main
internet trends that have influenced consumer markets drastically. These include the
domestication of the internet as well as its prevalence in home environment and the
increase in availability along with access to the internet from almost everywhere. The
137
destination‟s attractiveness as indicated by 45.5% of the tourists strongly agreeing
were an important factor.
Previous travel experiences have been seen as key to the choice process. In
comparison to the literature reviewed, in a study by Sonmez & Graefe (1998), past
travel experience played a central role in determining future travel behaviour. These
serve within an interplay of risk and safety perceptions. In the presence of real and
(or) perceived previous travel experiences, they have the effect of becoming
overriding factors influencing choice (therefore altering conventional models on
destination choice).
The integration of Local culture and hospitality as well as the national policies of
hospitality and assimilation has been a central aspect for promoting awareness,
understanding, reconciliation and tolerance amongst societies in Europe and Asia
(Devine, Baum & Hearns 2009). In African context, local communities play a
significant role in tourism sustainability debates and local culture integration aspects
serve as significant attractions for tourists in Europe. It is therefore important that
local culture be factored in as a factor influencing park choice. In addition, the
activities at the destination were considered as a factor that may have significantly
influenced tourist choice.
In terms of destination attractions and image, Hell‟s gate National park‟s history as
well as geography has been seen as a critical factor that would have influenced tourist
choice. The study findings on country of origin of tourists to Hell‟s gate National Park
indicated that most of the tourists to the Park originated from Australia, America and
Europe. In a study on Landscapes, Seasonality and Tourism by Blender, Schumacher
and Stein (2007) indicated that the appeal of landscapes as well as seascapes in the
Western Europe had been driven and strengthened by a rich cultural heritage in
138
Europe that looked at the aesthetic beauty of nature within stringently-controlled
landscape-parks.
Similarly, activities within the destination continue to be significant attraction drivers
that have christened tourism movements from one park to another. The Hell‟s gate in
a wheelbarrow event has been an annual activity event that has been a key attraction
to tourists in the area. The promotion of Hell‟s gate as an adventurous getaway, „a
walk in the wild-side‟ as well as the „twende tujivinjari‟ campaigns (see figures 53
and 54) over the years have influenced tourism movements to the park and are going
to be the most determinant attributes to choice of park to visit.
The core attractions in the Aberdares National Park have been the spectacular
waterfalls, majestic peaks and the moorlands. The diverse range of accommodation
options within the park as well as the historical association of these facilities and
attractions with Kenya‟s independence and Europe in particular are important drivers
to visitation in the park. The Origin of the Outspan Hotel is linked to Lord Baden-
Powell, the founder of the worldwide Scout Association Movement who visited
Kenya in 1806 and settled in a cottage called Paxtu which to date is the Outspan
Hotel. The varied landscapes of the Aberdare ranges also provide an excellent scenic
area for camping, excellent game viewing and guided hiking. Aberdares is famous for
the most famous tree houses in the world e.g. Treetops. The Sagana State Lodge also
is connected to the British Empire as it was once a wedding present by the Kenyan
Colonial Government to Princess Elizabeth when she visited Kenya with Prince
Phillip in 1952.
Most of the increasing interest on touristic activities within the Aberdares National
Park according to KWS (2009) have been as a result of the popularity of the park
from movies such as the Oscar winning film, “Out of Africa” shot at both the Gura
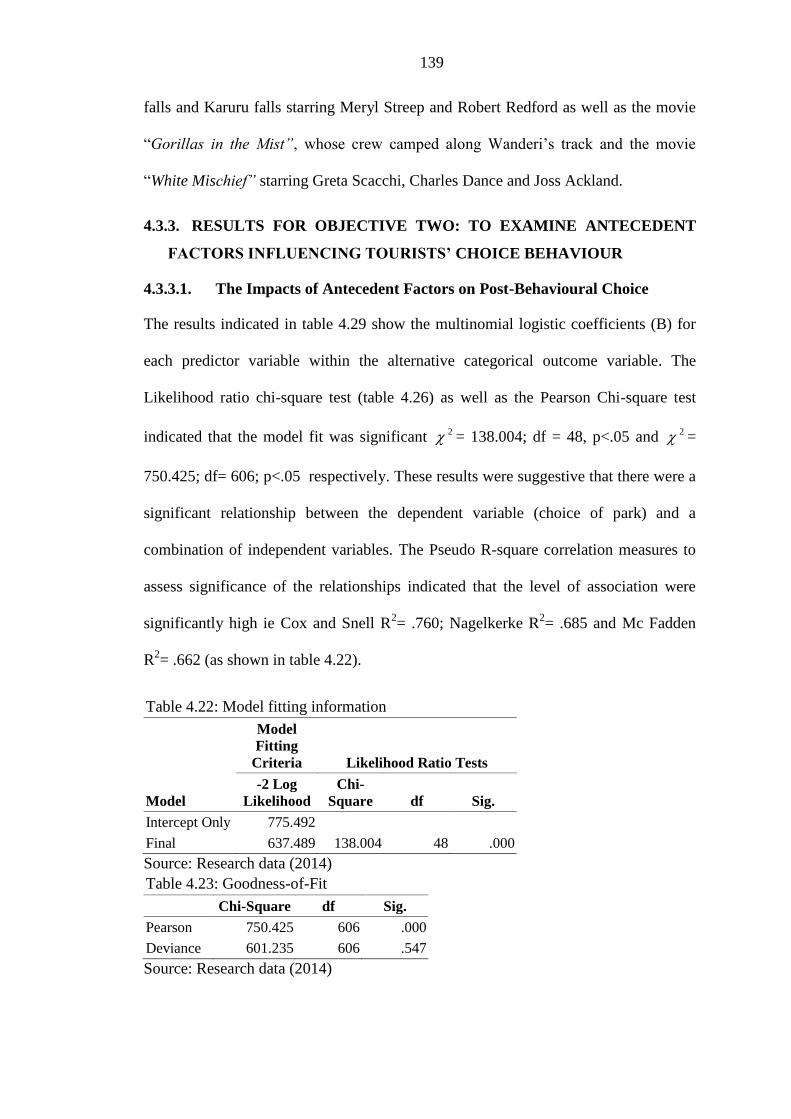
139
falls and Karuru falls starring Meryl Streep and Robert Redford as well as the movie
“Gorillas in the Mist”, whose crew camped along Wanderi‟s track and the movie
“White Mischief” starring Greta Scacchi, Charles Dance and Joss Ackland.
4.3.3. RESULTS FOR OBJECTIVE TWO: TO EXAMINE ANTECEDENT
FACTORS INFLUENCING TOURISTS’ CHOICE BEHAVIOUR
4.3.3.1. The Impacts of Antecedent Factors on Post-Behavioural Choice
The results indicated in table 4.29 show the multinomial logistic coefficients (B) for
each predictor variable within the alternative categorical outcome variable. The
Likelihood ratio chi-square test (table 4.26) as well as the Pearson Chi-square test
indicated that the model fit was significant 2 = 138.004; df = 48, p<.05 and 2 =
750.425; df= 606; p<.05 respectively. These results were suggestive that there were a
significant relationship between the dependent variable (choice of park) and a
combination of independent variables. The Pseudo R-square correlation measures to
assess significance of the relationships indicated that the level of association were
significantly high ie Cox and Snell R2= .760; Nagelkerke R
2= .685 and Mc Fadden
R2= .662 (as shown in table 4.22).
Table 4.22: Model fitting information
Model
Model
Fitting
Criteria Likelihood Ratio Tests
-2 Log
Likelihood
Chi-
Square df Sig.
Intercept Only 775.492
Final 637.489 138.004 48 .000
Source: Research data (2014)
Table 4.23: Goodness-of-Fit
Chi-Square df Sig.
Pearson 750.425 606 .000
Deviance 601.235 606 .547
Source: Research data (2014)

140
Table 4.24: Pseudo R-Square
Cox and Snell .760
Nagelkerke .685
McFadden .662
Source: Research data (2014)
There were two tests that were used to test for the individual independent variables.
These included the likelihood ratio test that was used to evaluate the overall
relationship between the destination-level factors and the choice of park visited. The
second test is the Wald test that evaluated whether or not the independent variable
was statistically significant in differentiating between the two groups. The likelihood
ratio test results as indicated in table 4.25 indicated that there were a significant
relationship between choice of park and the state of roads and infrastructure (p<.05);
travel agency recommendation (p<.05); local culture (p<.05) ; service quality (p<.05);
activity at the destination (p<.05) as well as accommodation quality (p<.05).
Table 4.25: Likelihood Ratio Tests
Effects
Model Fitting
Criteria Likelihood Ratio Tests
-2 Log
Likelihood of
Reduced
Model
Chi-
Square df Sig.
Intercept 643.176 5.687 3 .128
Destination Image 642.392 4.903 3 .179
Roads and Infrastructure 670.157 32.669 3 .000*
Safety and security 639.032 1.544 3 .672
Travel agency recommendation 647.375 9.886 3 .020*
Information on the Web 643.558 6.069 3 .108
Destination‟s attractions 640.547 3.058 3 .383
Local Culture 652.119 14.630 3 .002*
Sponsored events 640.297 2.808 3 .422
Cost of Holiday 642.232 4.744 3 .192
Promotion 640.213 2.724 3 .436
Reference from Tour Operator 642.832 5.343 3 .148
Service Quality 653.012 15.523 3 .001**
Activity at the destination 647.774 10.285 3 .016*
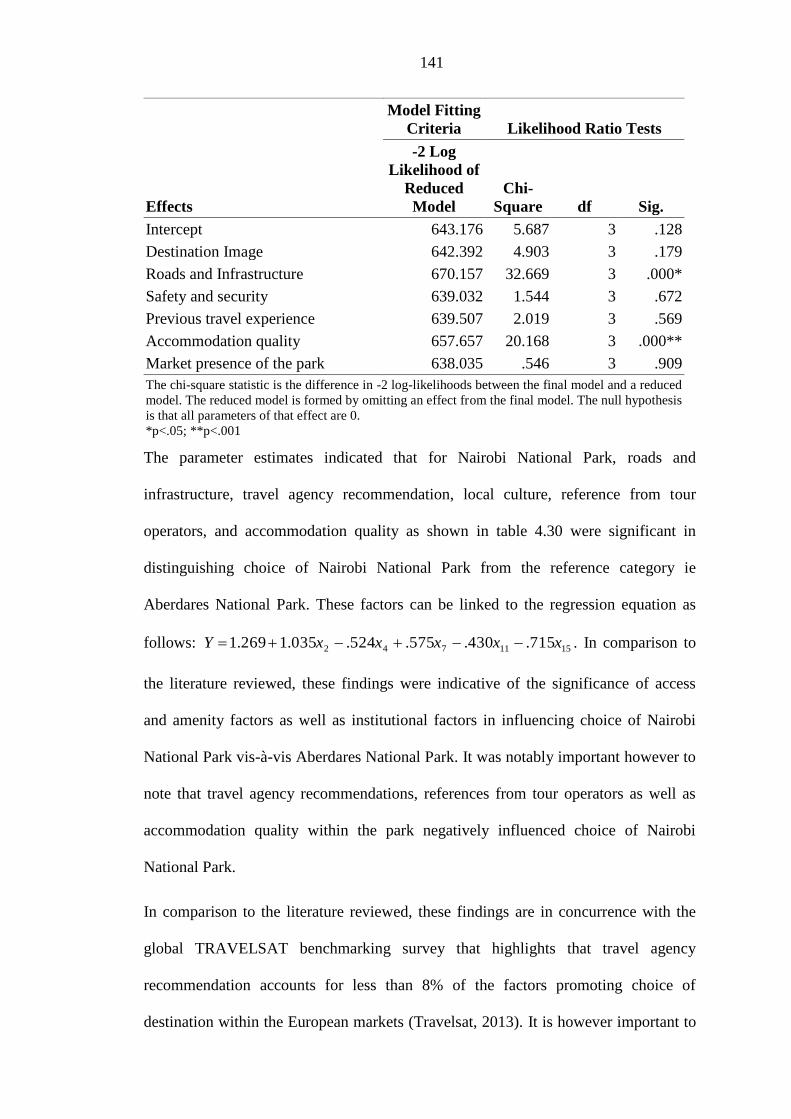
141
Effects
Model Fitting
Criteria Likelihood Ratio Tests
-2 Log
Likelihood of
Reduced
Model
Chi-
Square df Sig.
Intercept 643.176 5.687 3 .128
Destination Image 642.392 4.903 3 .179
Roads and Infrastructure 670.157 32.669 3 .000*
Safety and security 639.032 1.544 3 .672
Previous travel experience 639.507 2.019 3 .569
Accommodation quality 657.657 20.168 3 .000**
Market presence of the park 638.035 .546 3 .909
The chi-square statistic is the difference in -2 log-likelihoods between the final model and a reduced
model. The reduced model is formed by omitting an effect from the final model. The null hypothesis
is that all parameters of that effect are 0.
*p<.05; **p<.001
The parameter estimates indicated that for Nairobi National Park, roads and
infrastructure, travel agency recommendation, local culture, reference from tour
operators, and accommodation quality as shown in table 4.30 were significant in
distinguishing choice of Nairobi National Park from the reference category ie
Aberdares National Park. These factors can be linked to the regression equation as
follows: 1511742 715.430.575.524.035.1269.1 xxxxxY . In comparison to
the literature reviewed, these findings were indicative of the significance of access
and amenity factors as well as institutional factors in influencing choice of Nairobi
National Park vis-à-vis Aberdares National Park. It was notably important however to
note that travel agency recommendations, references from tour operators as well as
accommodation quality within the park negatively influenced choice of Nairobi
National Park.
In comparison to the literature reviewed, these findings are in concurrence with the
global TRAVELSAT benchmarking survey that highlights that travel agency
recommendation accounts for less than 8% of the factors promoting choice of
destination within the European markets (Travelsat, 2013). It is however important to

142
note that the new forms of tourism consumption (the so-called „post-fordist
consumption) where consumption is less and less functional and it is increasingly
aestheticized (Arva and Deli-Gray, 2013). These modern consumers are more and
more quality oriented and reject undifferentiated mass products. They are keen on
choosing brands that are unique, differentiated and valuable.
The reference category is: Aberdares National Park. Note. *p < .05
1511742 715.430.575.524.035.1269.1 xxxxxY
As for Hell‟s gate National Park, roads and infrastructure, references from tour
operators and accommodation quality as included in the likelihood ratio test results in
table 4.29 were significant in distinguishing choice of Hell‟s gate National Park from
the reference category i.e. Aberdares National Park. These factors can be linked to the
regression equation as follows: 15112 624.391.715.108.0 xxxY . In comparison
to the literature reviewed, the findings were similarly indicative of the importance of
access and amenity factors in influencing choice of Hell‟s gate National Park vis-à-vis
Table 4.26: Factors influencing choice of Nairobi National Park
National Parka B
Std.
Error Wald df Sig. Exp(B)
Nairobi
National
Park
Intercept 1.269 1.691 .563 1 .453
Destination Image (x1) .242 .274 .779 1 .378 1.274
Roads and Infrastructure (x2) 1.035 .214 23.410 1 .000* 2.816
Safety and security (x3) -.232 .200 1.347 1 .246 .793
Travel agency recommendation (x4) -.524 .203 6.676 1 .010* .592
Information on the Web (x5) .122 .215 .323 . 1 .570 1.130
Destination‟s attractions (x6) -.367 .244 2.267 1 .132 .692
Local Culture (x7) .575 .248 5.383 1 .020* 1.777
Sponsored events (x8) .013 .174 .005 1 .941 1.013
Cost of Holiday (x9) .338 .195 2.997 1 .083 1.402
Promotion (x10) -.064 .202 .100 1 .752 .938
Reference from Tour Operator (x11) -.430 .205 4.389 1 .036* .650
Service Quality (x12) .376 .238 2.491 1 .114 1.457
Activity at the destination (x13) -.356 .251 2.009 1 .156 .700
Previous travel experience (x14) .164 .207 .628 1 .428 1.179
Accommodation quality (x15) -.715 .237 9.077 1 .003* .489
Market presence of the park (x16) .146 .208 .493 1 .483 1.157

143
Aberdares National Park. The success of any tourism destination is dependent to a
large degree on the nature of the facilities and services infrastructure that are available
to the tourist. These can be categorized as: Primary tourist facilities and services
(accommodation/hotels, restaurants, and travel and tour services); Secondary tourist
facilities and services (shopping, recreation, entertainment and tourist information
services) and Tertiary tourist facilities and services (health services and care,
emergency and safety services, financial services and personal services).
It was notably important however to note that travel agency recommendations, as
well as references from tour operators negatively influenced choice of Hell‟s Gate
National Park. This finding was significantly indicative in comparison to the literature
reviewed, of the fact that the tourists felt that these factors were deterrents to choice of
Hell‟s Gate National Park. They negatively affected choice of Hell‟s Gate National
Park. A probable explanation to this was that the tour operators and travel agents
discouraged tourists from travelling to Hell‟s gate National Park as a result of the
flooding of the gorge as a result of heavy rains that hit the area during the same
period.

144
Table 4.27: Factors influencing choice of Hell‟s Gate National Park
National Parka B
Std.
Error Wald df Sig. Exp(B)
Hell‟s gate
National
Park
Intercept .108 1.566 .005 1 .945
Destination Image (x1) .495 .258 3.683 1 .055 1.640
Roads and Infrastructure (x2) .715 .197 13.143 1 .000* 2.044
Safety and security (x3) -.200 .197 1.030 1 .310 .818
Travel agency recommendation (x4) -.197 .197 .998 1 .318 .821
Information on the Web (x5) .031 .204 .023 1 .880 1.031
Destination‟s attractions (x6) -.153 .230 .442 1 .506 .858
Local Culture (x7) -.078 .212 .133 1 .715 .925
Sponsored events (x8) -.103 .170 .366 1 .545 .902
Cost of Holiday (x9) .351 .193 3.305 1 .069 1.421
Promotion (x10) .185 .193 .915 1 .339 1.203
Reference from Tour Operator (x11) -.391 .198 3.893 1 .048* .677
Service Quality (x12) -.350 .224 2.431 1 .119 .705
Activity at the destination (x13) -.036 .247 .021 1 .884 .965
Previous travel experience (x14) .281 .201 1.955 1 .162 1.325
Accommodation quality (x15) .624 .226 7.647 1 .006* .536
Market presence of the park (x16) .121 .202 .361 1 .548 1.129
The reference category is: Aberdares National Park. Note. *p < .05
15112 624.391.715.108.0 xxxY
As for Lake Nakuru National Park, travel agency recommendation, information on the
web, cost of holiday and accommodation quality as indicated in table 4.32 were
significant in distinguishing choice of Lake Nakuru National Park from the reference
category i.e. Aberdares National Park. These factors can be linked to the regression
equation as follows: 15954 926.392.412.475.202.2 xxxxY . In comparison to
the literature reviewed, the findings were quite evident on the importance of web
content as well as accommodation quality on influencing choice of Lake Nakuru
National Park from the reference category i.e. Aberdares National Park. A summary
of the predictor variables as well as the estimates are as indicated within table 4.28.

145
Table 4.28: Factors influencing choice of Lake Nakuru National Park
National Parka B
Std.
Error Wald df Sig. Exp(B)
Nakuru
National
Park
Intercept 2.202 1.479 2.217 1 .136
Destination Image (x1) .090 .245 .135 1 .714 1.094
Roads and Infrastructure (x2) .317 .195 2.639 1 .104 1.373
Safety and security (x3) -.122 .206 .352 1 .553 .885
Travel agency recommendation (x4) -.475 .199 5.669 1 .017* .622
Information on the Web (x5) .412 .210 3.846 1 .040* 1.509
Destination‟s attractions (x6) -.310 .235 1.750 1 .186 .733
Local Culture (x7) -.191 .213 .805 1 .369 .826
Sponsored events (x8) .158 .179 .777 1 .378 1.171
Cost of Holiday (x9) .392 .193 4.105 1 .043* 1.480
Promotion (x10) -.064 .203 .101 1 .751 .938
Reference from Tour Operator (x11) -.290 .205 1.989 1 .158 .748
Service Quality (x12) -.252 .229 1.216 1 .270 .777
Activity at the destination (x13) .390 .256 2.315 1 .128 1.477
Previous travel experience (x14) .163 .198 .676 1 .411 1.177
Accommodation quality (x15) -.926 .228 16.458 1 .000* .396
Market presence of the park (x16) .082 .207 .159 1 .690 1.086
The reference category is: Aberdares National Park. Note. *p < .05
15945 926.392.475.412.202.2 xxxxY
The research findings were indicative of the fact that travel agency recommendations,
accommodations quality, as well as references from tour operators were comparable
factors that played a significant role in determining/deterring the choice of Nairobi
National Park, Hell‟s gate National Park as well as Lake Nakuru National Park vis-à-
vis Aberdares National Park. These factors can be linked to the regression equation as
follows: 15945 926.392.475.412.202.2 xxxxY .
In comparison to the literature reviewed, these findings were also suggestive of the
significant role that institutional referrals played in determining and or deterring the
choice of park brand. It was only Lake Nakuru National Park where direct referrals
from the web significantly influenced choice of park brand. Similarly, the tourists to
Lake Nakuru National Park felt that the cost of holiday significantly influenced their
choice of park brand to visit. Since cost of holiday positively and significantly
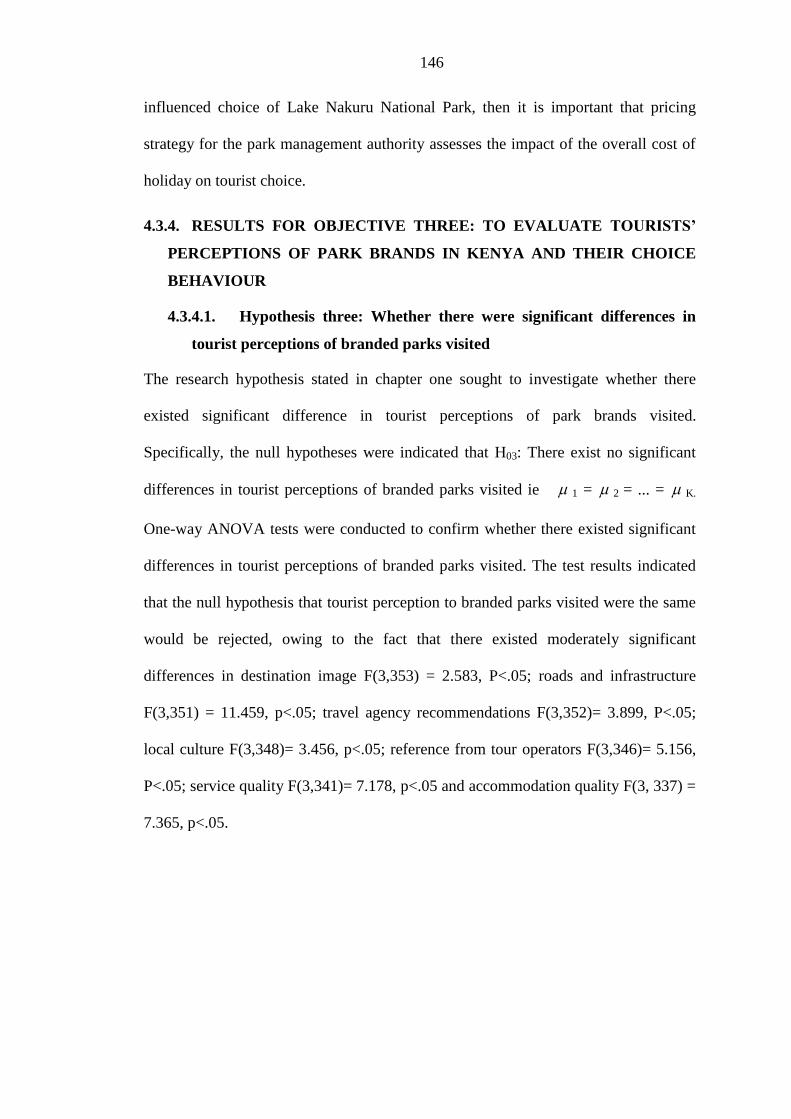
146
influenced choice of Lake Nakuru National Park, then it is important that pricing
strategy for the park management authority assesses the impact of the overall cost of
holiday on tourist choice.
4.3.4. RESULTS FOR OBJECTIVE THREE: TO EVALUATE TOURISTS’
PERCEPTIONS OF PARK BRANDS IN KENYA AND THEIR CHOICE
BEHAVIOUR
4.3.4.1. Hypothesis three: Whether there were significant differences in
tourist perceptions of branded parks visited
The research hypothesis stated in chapter one sought to investigate whether there
existed significant difference in tourist perceptions of park brands visited.
Specifically, the null hypotheses were indicated that H03: There exist no significant
differences in tourist perceptions of branded parks visited ie 1 = 2 = ... = K.
One-way ANOVA tests were conducted to confirm whether there existed significant
differences in tourist perceptions of branded parks visited. The test results indicated
that the null hypothesis that tourist perception to branded parks visited were the same
would be rejected, owing to the fact that there existed moderately significant
differences in destination image F(3,353) = 2.583, P<.05; roads and infrastructure
F(3,351) = 11.459, p<.05; travel agency recommendations F(3,352)= 3.899, P<.05;
local culture F(3,348)= 3.456, p<.05; reference from tour operators F(3,346)= 5.156,
P<.05; service quality F(3,341)= 7.178, p<.05 and accommodation quality F(3, 337) =
7.365, p<.05.

147
Table 4.29: ANOVA tests of differences in tourist perceptions
Factor
Sum of
Squares df
Mean
Square F Sig.
Destination Image Between Groups 5.410 3 1.803 2.483 .041
Within Groups 256.421 353 .726
Total 261.832 356
Roads and
Infrastructure
Between Groups 44.313 3 14.771 11.459 .000
Within Groups 452.431 351 1.289
Total 496.744 354
Safety and security Between Groups 1.545 3 .515 .403 .751
Within Groups 450.942 353 1.277
Total 452.487 356
Travel agency
recommendation
Between Groups 19.701 3 6.567 3.899 .009
Within Groups 592.824 352 1.684
Total 612.525 355
Information on the
Web
Between Groups .949 3 .316 .255 .858
Within Groups 426.867 344 1.241
Total 427.816 347
Destination‟s
attractions
Between Groups 2.644 3 .881 .894 .444
Within Groups 344.907 350 .985
Total 347.551 353
Local Culture Between Groups 11.641 3 3.880 3.456 .017
Within Groups 390.677 348 1.123
Total 402.318 351
Sponsored events Between Groups 6.557 3 2.186 1.250 .292
Within Groups 599.863 343 1.749
Total 606.421 346
Cost of Holiday Between Groups 1.201 3 .400 .272 .846
Within Groups 509.568 346 1.473
Total 510.769 349
Promotion Between Groups 10.973 3 3.658 2.309 .076
Within Groups 546.465 345 1.584
Total 557.438 348
Reference from
Tour Operator
Between Groups 25.631 3 8.544 5.156 .002
Within Groups 573.366 346 1.657
Total 598.997 349
Service Quality Between Groups 27.890 3 9.297 7.178 .000
Within Groups 441.663 341 1.295
Total 469.554 344
Activity at the Between Groups 7.044 3 2.348 2.443 .064
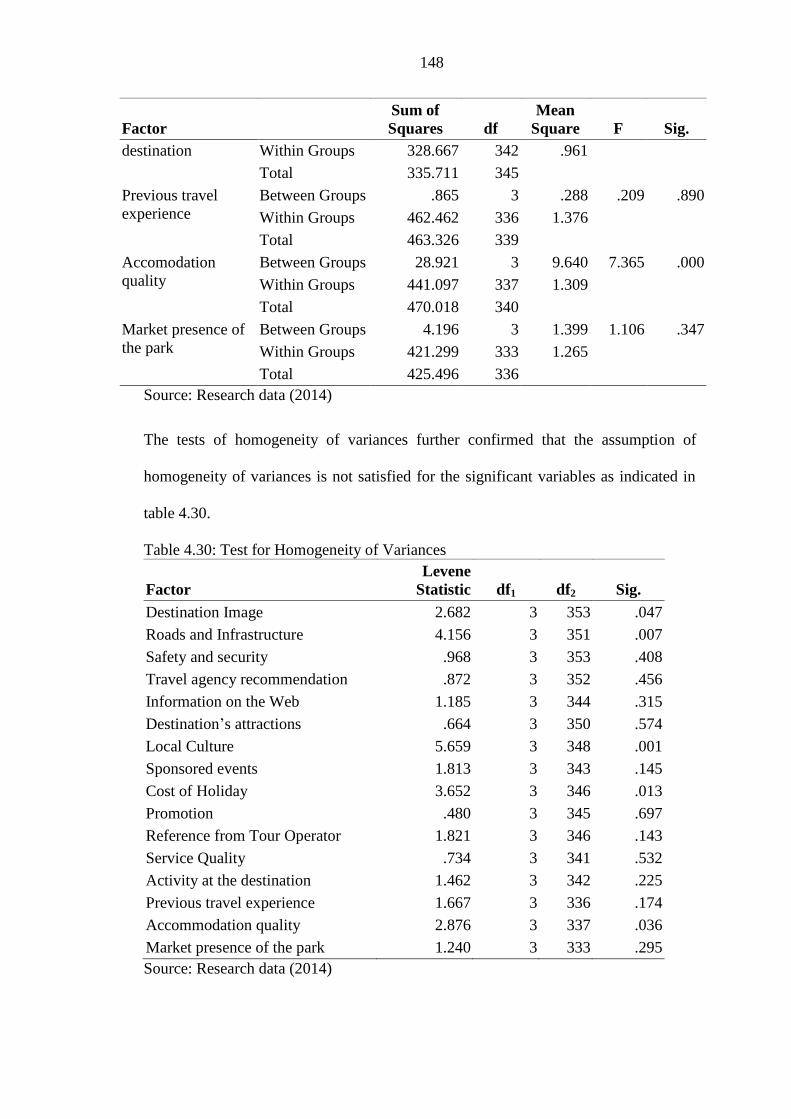
148
Factor
Sum of
Squares df
Mean
Square F Sig.
destination Within Groups 328.667 342 .961
Total 335.711 345
Previous travel
experience
Between Groups .865 3 .288 .209 .890
Within Groups 462.462 336 1.376
Total 463.326 339
Accomodation
quality
Between Groups 28.921 3 9.640 7.365 .000
Within Groups 441.097 337 1.309
Total 470.018 340
Market presence of
the park
Between Groups 4.196 3 1.399 1.106 .347
Within Groups 421.299 333 1.265
Total 425.496 336
Source: Research data (2014)
The tests of homogeneity of variances further confirmed that the assumption of
homogeneity of variances is not satisfied for the significant variables as indicated in
table 4.30.
Table 4.30: Test for Homogeneity of Variances
Factor
Levene
Statistic df1 df2 Sig.
Destination Image 2.682 3 353 .047
Roads and Infrastructure 4.156 3 351 .007
Safety and security .968 3 353 .408
Travel agency recommendation .872 3 352 .456
Information on the Web 1.185 3 344 .315
Destination‟s attractions .664 3 350 .574
Local Culture 5.659 3 348 .001
Sponsored events 1.813 3 343 .145
Cost of Holiday 3.652 3 346 .013
Promotion .480 3 345 .697
Reference from Tour Operator 1.821 3 346 .143
Service Quality .734 3 341 .532
Activity at the destination 1.462 3 342 .225
Previous travel experience 1.667 3 336 .174
Accommodation quality 2.876 3 337 .036
Market presence of the park 1.240 3 333 .295
Source: Research data (2014)
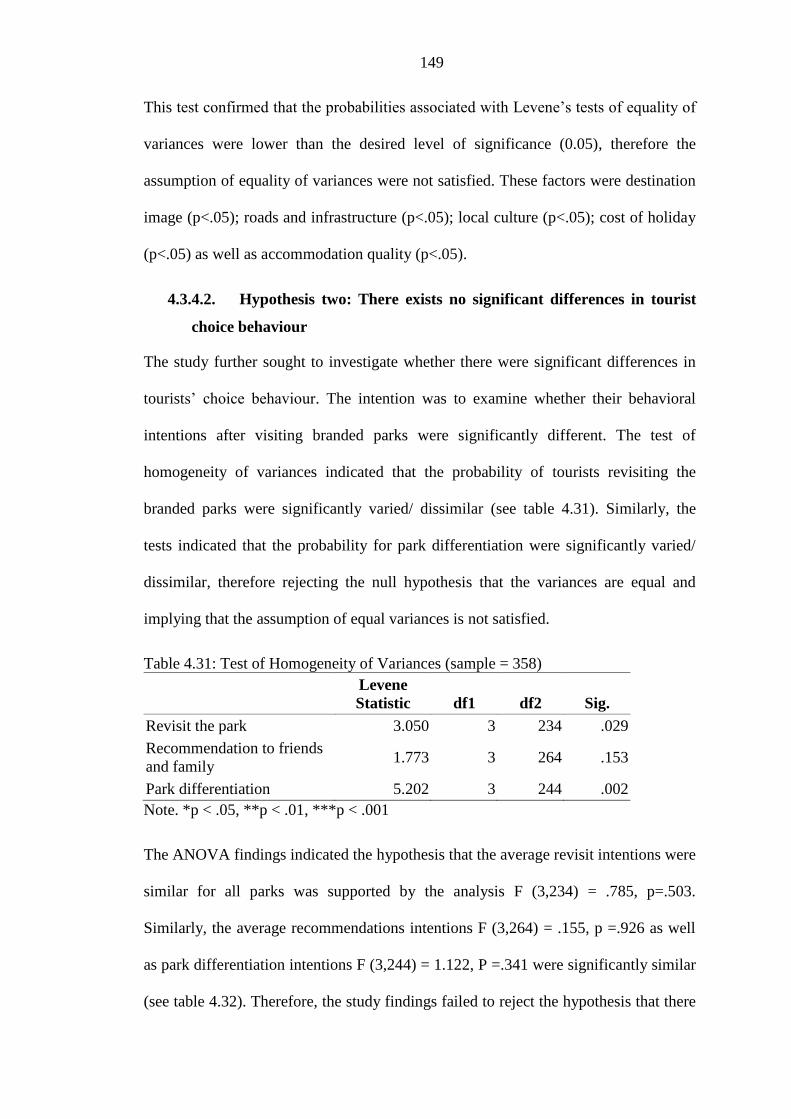
149
This test confirmed that the probabilities associated with Levene‟s tests of equality of
variances were lower than the desired level of significance (0.05), therefore the
assumption of equality of variances were not satisfied. These factors were destination
image (p<.05); roads and infrastructure (p<.05); local culture (p<.05); cost of holiday
(p<.05) as well as accommodation quality (p<.05).
4.3.4.2. Hypothesis two: There exists no significant differences in tourist
choice behaviour
The study further sought to investigate whether there were significant differences in
tourists‟ choice behaviour. The intention was to examine whether their behavioral
intentions after visiting branded parks were significantly different. The test of
homogeneity of variances indicated that the probability of tourists revisiting the
branded parks were significantly varied/ dissimilar (see table 4.31). Similarly, the
tests indicated that the probability for park differentiation were significantly varied/
dissimilar, therefore rejecting the null hypothesis that the variances are equal and
implying that the assumption of equal variances is not satisfied.
Table 4.31: Test of Homogeneity of Variances (sample = 358)
Levene
Statistic df1 df2 Sig.
Revisit the park 3.050 3 234 .029
Recommendation to friends
and family 1.773 3 264 .153
Park differentiation 5.202 3 244 .002
Note. *p < .05, **p < .01, ***p < .001
The ANOVA findings indicated the hypothesis that the average revisit intentions were
similar for all parks was supported by the analysis F (3,234) = .785, p=.503.
Similarly, the average recommendations intentions F (3,264) = .155, p =.926 as well
as park differentiation intentions F (3,244) = 1.122, P =.341 were significantly similar
(see table 4.32). Therefore, the study findings failed to reject the hypothesis that there

150
were no significant differences in tourist post-behavioral intentions of tourists to
branded park.
Table 4.32: ANOVA test of differences in tourist choice behaviour
Sum of
Squares df
Mean
Square F Sig.
Revisit the park Between Groups .114 3 .038 .785 .503
Within Groups 11.281 234 .048
Total 11.395 237
Recommendation
to friends and
family
Between Groups .016 3 .005 .155 .926
Within Groups 8.802 264 .033
Total 8.817 267
Park
differentiation
Between Groups .575 3 .192 1.122 .341
Within Groups 41.667 244 .171
Total 42.242 247
Note. *p < .05, **p < .01, ***p < .001
The research findings were suggestive of the underlying fact that the tourist product is
a consequence of the exact tourist need. Therefore, there is a need to enhance the
nature of their experiences and post-visit intentions by responding with a branding
strategy that differentiates the parks and enhances the brand identity as well as
association.
4.3.4.3. Hypothesis one: Kenyan park brand perceptions do not
significantly influence tourist choice behaviour
Hypothesis one sought to investigate the underlying premise that the tourists‟ park
brand perceptions did not significantly influence tourist‟s revisit choices (cf. 1.5). i.e.
This can be specified as follows:- H0: Β1 = 0; Ha: Β1 ≠ 0. Where BJ represents the
coefficients signifying the relationship between park brand perception and tourist
revisit intentions. Using the sample data, an analytical plan was instituted to test the
null hypothesis. This involved the specification of the significance level
(*p < .05, **p < .01, ***p < .001) as well as the test statistic that was the linear
regression t-test (to determine whether the slope of the regression line differs

151
significantly from zero) as well as the coefficient of determination measures. The tests
were conducted on the latent constructs and the results for the individual parks
indicated the following:.
4.3.4.3.1. Indirect effects: Structural model (Hell’s Gate National Park)
The tourists‟ brand perception of Hell‟s gate National Park significantly influenced
brand differentiation (p<.05) as well as revisit intentions (p<.05) positively (See table
4.33). The results significantly concur with Aaker (1996) findings that brand image
perception is a key factor in describing experience dimensions. According to
Echtermeyer (2006), brands are status symbols that appeal to the luxury segment and
safety symbols to the budget segment of tourists. It is therefore key that the brand
perception be unmistakeable and suit the target group.
Table 4.33: Structural model regression results - Hell‟s gate N.P.
Regression Weights
Structural relationships
Estimate S.E. t-
value P
R2
Brand differentiation - Brand perception 0.670 0.080 8.354 *** .777
Recommendation - Brand perception -0.048 0.049 -.979 .328 -.131
Revisit - Brand perception 0.077 0.012 6.597 *** .689
Note. *p < .05, **p < .01, ***p < .001
4.3.4.3.2. Indirect effects: Structural model (Lake Nakuru National Park)
As for Lake Nakuru National Park, the tourists‟ post-visit park brand perception
moderately influenced revisit intentions of tourists. Brand perception did not
significantly influence recommendation and differentiation decisions of tourists (as
indicted in table 4.34). This factor may be attributed according to Gunelius (2013)
that there may be a difference between the brand positioning within the marketing
communications and the consumers‟ brand perception.
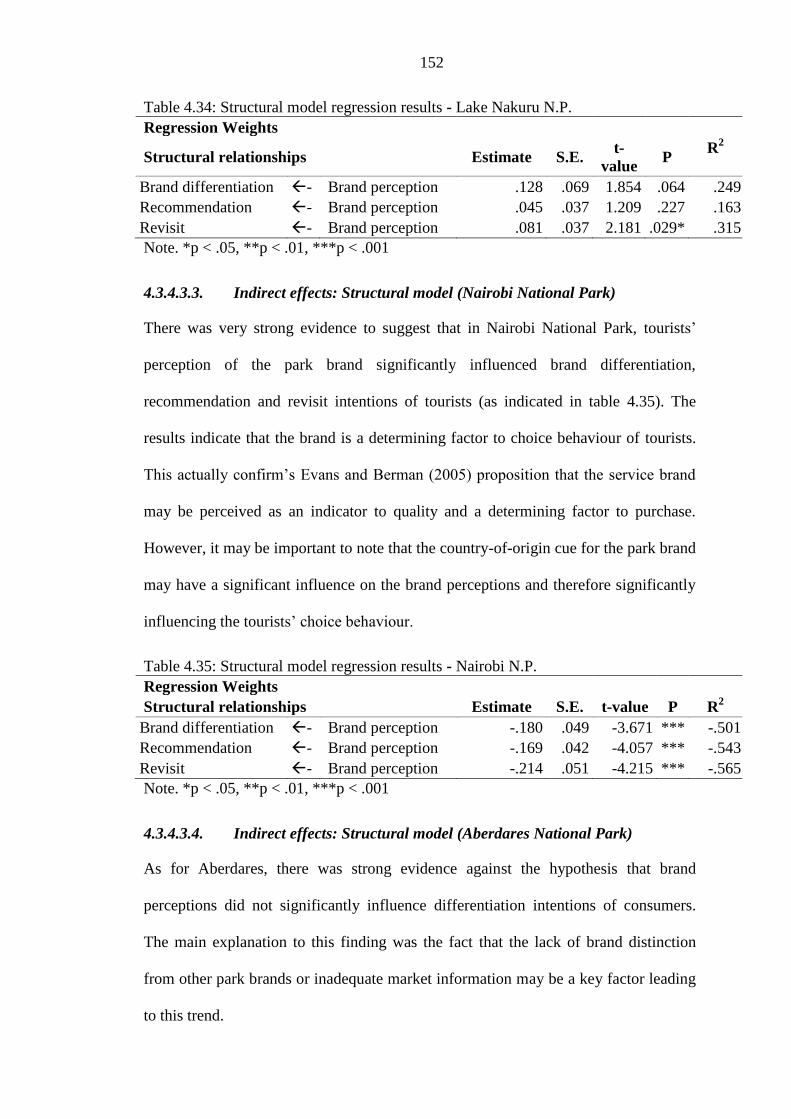
152
Table 4.34: Structural model regression results - Lake Nakuru N.P.
Regression Weights
Structural relationships
Estimate S.E. t-
value P
R2
Brand differentiation - Brand perception .128 .069 1.854 .064 .249
Recommendation - Brand perception .045 .037 1.209 .227 .163
Revisit - Brand perception .081 .037 2.181 .029* .315
Note. *p < .05, **p < .01, ***p < .001
4.3.4.3.3. Indirect effects: Structural model (Nairobi National Park)
There was very strong evidence to suggest that in Nairobi National Park, tourists‟
perception of the park brand significantly influenced brand differentiation,
recommendation and revisit intentions of tourists (as indicated in table 4.35). The
results indicate that the brand is a determining factor to choice behaviour of tourists.
This actually confirm‟s Evans and Berman (2005) proposition that the service brand
may be perceived as an indicator to quality and a determining factor to purchase.
However, it may be important to note that the country-of-origin cue for the park brand
may have a significant influence on the brand perceptions and therefore significantly
influencing the tourists‟ choice behaviour.
Table 4.35: Structural model regression results - Nairobi N.P.
Regression Weights
Structural relationships
Estimate S.E. t-value P R2
Brand differentiation - Brand perception -.180 .049 -3.671 *** -.501
Recommendation - Brand perception -.169 .042 -4.057 *** -.543
Revisit - Brand perception -.214 .051 -4.215 *** -.565
Note. *p < .05, **p < .01, ***p < .001
4.3.4.3.4. Indirect effects: Structural model (Aberdares National Park)
As for Aberdares, there was strong evidence against the hypothesis that brand
perceptions did not significantly influence differentiation intentions of consumers.
The main explanation to this finding was the fact that the lack of brand distinction
from other park brands or inadequate market information may be a key factor leading
to this trend.

153
Table 4.36: Structural model regression results - Aberdares N.P.
Regression Weights
Structural relationships
Estimate S.E. t-
value P
R2
Brand differentiation - Brand perception .068 .067 1.007 .314 .171
Recommendation - Brand perception .052 .018 2.905 .004** -.574
Revisit - Brand perception .110 .038 2.915 .004** -.590
Note. *p < .05, **p < .01, ***p < .001
The S.E.M findings however showed that the park brand perception significantly and
positively influenced recommendation and revisit intentions though it did not
significantly influence brand differentiation (as indicated in table 4.36). This finding
was indicative of a high degree of brand loyalty as well as tourist satisfaction with the
experiences.
4.3.5. RESULTS FOR OBJECTIVE FOUR: TO EXPLORE THE
INFLUENCE OF BRAND PERSONALITIES ON CHOICE BEHAVIOUR
OF TOURISTS TO KENYAN PARKS
4.3.5.1. Hypothesis four: There exists no direct positive relationship
between the brand personalities of Kenyan parks and Tourists Choice
Behaviour
The research hypotheses on which the study was based sought to reject or fail to reject
the following hypotheses (1) H04: There exists no direct positive relationship between
the Brand personalities of Kenyan Parks and tourists Choice Behaviour. This can be
specified as follows:- H0: Β1 = 0; Ha: Β1 ≠ 0
4.3.5.1.1.Indirect effects: Structural model (Lake Nakuru National Park)
The AMOS S.E.M structural model findings (see table 4.37) indicated that the Lake
Nakuru National Park brand personality significantly and negatively influenced brand
differentiation ( = -.131; SE= .071; t-value = -1.852; p<.05). Therefore, it was
critical to address the brand personality image from the tourists‟ viewpoints. Further,
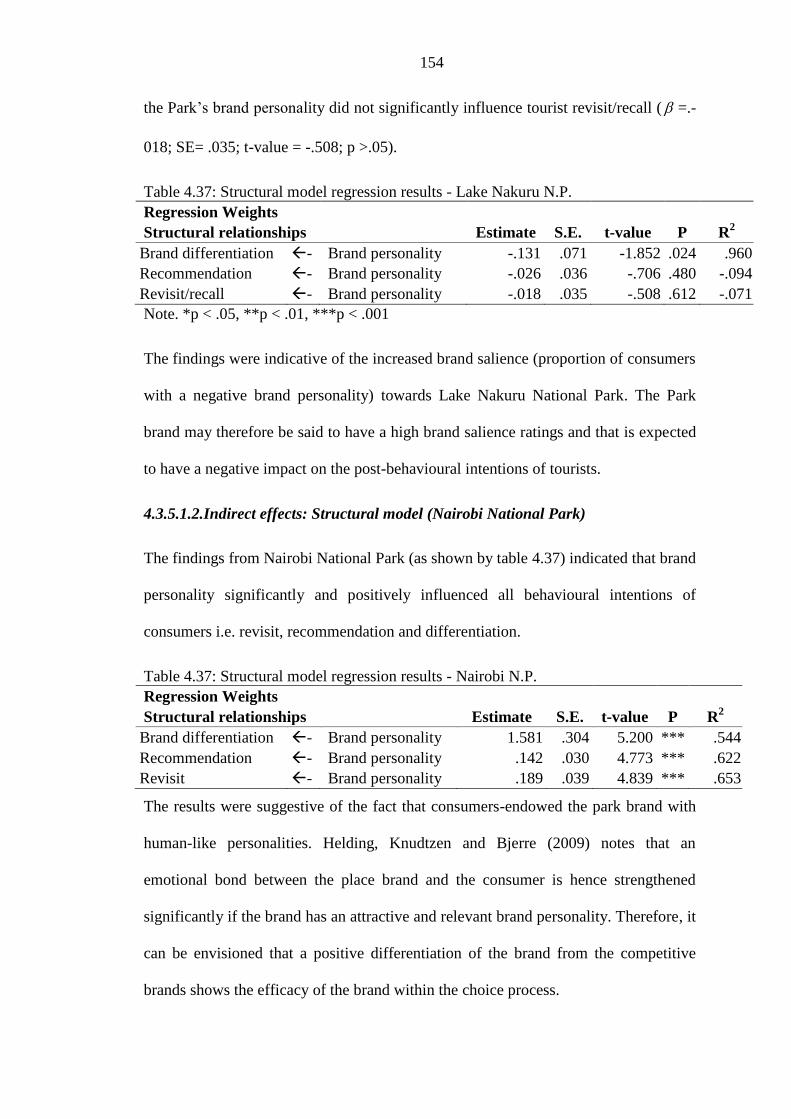
154
the Park‟s brand personality did not significantly influence tourist revisit/recall ( =.-
018; SE= .035; t-value = -.508; p >.05).
Table 4.37: Structural model regression results - Lake Nakuru N.P.
Regression Weights
Structural relationships
Estimate S.E. t-value P R2
Brand differentiation - Brand personality -.131 .071 -1.852 .024 .960
Recommendation - Brand personality -.026 .036 -.706 .480 -.094
Revisit/recall - Brand personality -.018 .035 -.508 .612 -.071
Note. *p < .05, **p < .01, ***p < .001
The findings were indicative of the increased brand salience (proportion of consumers
with a negative brand personality) towards Lake Nakuru National Park. The Park
brand may therefore be said to have a high brand salience ratings and that is expected
to have a negative impact on the post-behavioural intentions of tourists.
4.3.5.1.2.Indirect effects: Structural model (Nairobi National Park)
The findings from Nairobi National Park (as shown by table 4.37) indicated that brand
personality significantly and positively influenced all behavioural intentions of
consumers i.e. revisit, recommendation and differentiation.
Table 4.37: Structural model regression results - Nairobi N.P.
Regression Weights
Structural relationships
Estimate S.E. t-value P R2
Brand differentiation - Brand personality 1.581 .304 5.200 *** .544
Recommendation - Brand personality .142 .030 4.773 *** .622
Revisit - Brand personality .189 .039 4.839 *** .653
The results were suggestive of the fact that consumers-endowed the park brand with
human-like personalities. Helding, Knudtzen and Bjerre (2009) notes that an
emotional bond between the place brand and the consumer is hence strengthened
significantly if the brand has an attractive and relevant brand personality. Therefore, it
can be envisioned that a positive differentiation of the brand from the competitive
brands shows the efficacy of the brand within the choice process.

155
4.3.5.1.3.Indirect effects: Structural model (Hell’s Gate National Park)
Hell‟s Gate National Park showed a significant degree of brand salience. The park
brand‟s personality did not significantly influence brand differentiation,
recommendation and revisit decisions of tourists (see table 4.38).
Table 4.38: Structural model regression results - Hell‟s Gate N.P.
Regression Weights
Structural relationships
Estimate S.E. t-
value P
R2
Brand differentiation - Brand personality 0.035 0.082 .424 .671 .061
Recommendation - Brand personality -0.037 0.020 -1.862 .063 -.214
Revisit - Brand personality -0.003 0.033 -.098 .922 -.014
These findings were contrary to Sirgy (1982) who linked brand personality to positive
brand preference as well as Fournier (1994) who linked brand personality to trust and
loyalty. Further, Biel (1995) maintains that brand personality being more enduring
and more stable than other brand associations, it should favour the consumer‟s will to
maintain the relationship with the brand in future. Therefore an unstable brand
personality has an effect on brand preference.
4.3.5.1.4.Indirect effects: Structural model (Aberdares National Park)
The Structural model regression results indicated that the brand personality recorded
by tourists to Aberdares National Park did not significantly influence brand
differentiation (p>.05), recommendation intentions (p>.05) and revisit intentions
(p>.05).
Table 4.39: Structural model regression results - Aberdares N.P.
Regression Weights
Structural relationships
Estimate S.E. t-
value P
R2
Brand differentiation - Brand Personality .015 .112 .132 .895 .021
Recommendation - Brand Personality -.065 .034 -1.899 .058 -.270
Revisit - Brand Personality -.121 .071 -1.715 .086 -.247

156
This finding as noted here indicated that the park brand personality did not
significantly influence the behavioral intentions of tourists to the park. The probable
reasons to such an observation may be either because the park brand did not have
significant appeal, a striking profile, or a clear identity to the tourists.
4.3.6. STRUCTURAL EQUATIONS MODELLING RESULTS
4.3.6.1. S.E.M MODEL: LAKE NAKURU NATIONAL PARK
4.3.6.1.1.Measures of Model Fitness
Structural Equations Modelling test was conducted to assess the impacts of brand
perception on behavioural intentions of tourists to Lake Nakuru National Park. Table
49 represents the results of the initial model. The statistical results indicated an overall
good fit of the model to the data available. Specifically, the Chi square goodness-of-
fit test which tested the hypothesis that the 2 =0 indicated that there were significant
fit with the data provided. The level of significance was <.05. The GFI tests (GFI =
total
residual
v
v1 further indicated that the ratio of the total to residual variance within the
covariance matrix was significant ie GFI =1.000. It is the percent of observed
covariances explained by the covariances implied by the model. The Jöreskog-
Sörbom GFI is specified as GFI = FML/FO, where FO is the fit function when all model
parameters are zero.
The RMSEA which is based on the non-centrality parameter was used to test whether
the model fitted to the population data when the parameters were optimally chosen.
)1(
NdfRMSEA
M
M . The model was considered to have had a good fit to the
data. The Incremental fit indices further sought to compare a chi-square for the model
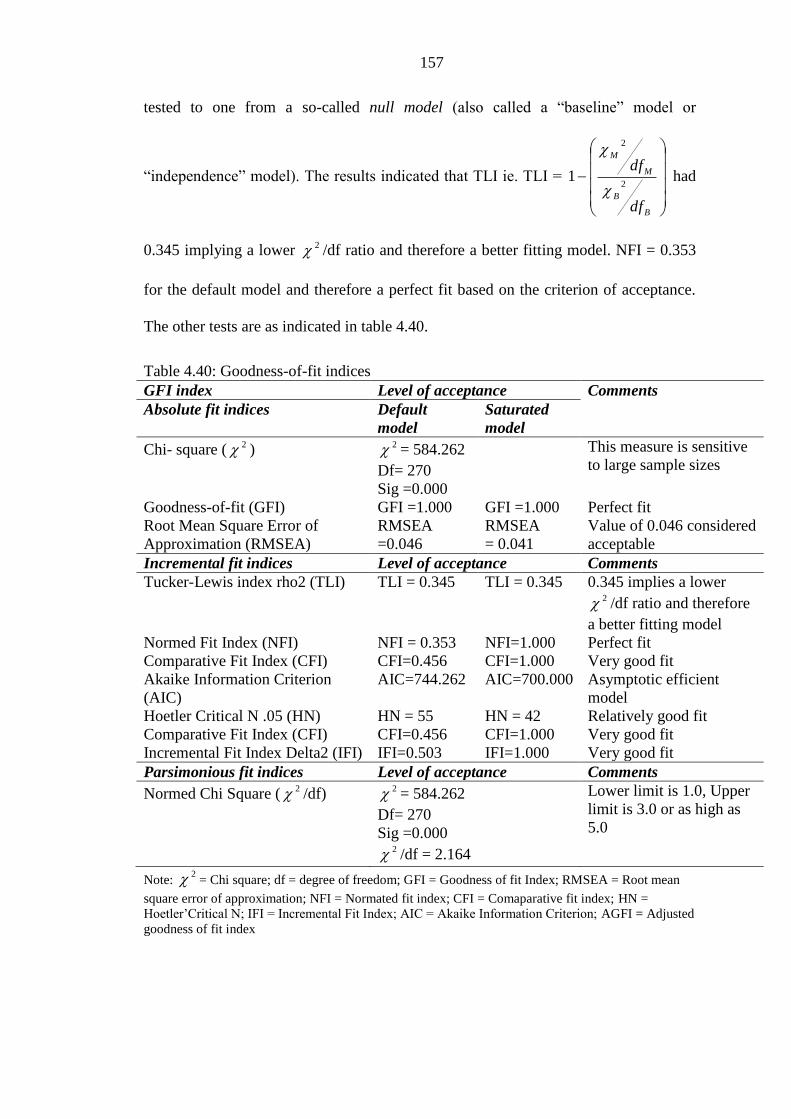
157
tested to one from a so-called null model (also called a “baseline” model or
“independence” model). The results indicated that TLI ie. TLI =
B
B
M
M
df
df2
2
1
had
0.345 implying a lower 2 /df ratio and therefore a better fitting model. NFI = 0.353
for the default model and therefore a perfect fit based on the criterion of acceptance.
The other tests are as indicated in table 4.40.
Table 4.40: Goodness-of-fit indices
GFI index Level of acceptance Comments
Absolute fit indices Default
model
Saturated
model
Chi- square ( 2 ) 2 = 584.262
Df= 270
Sig =0.000
This measure is sensitive
to large sample sizes
Goodness-of-fit (GFI) GFI =1.000 GFI =1.000 Perfect fit
Root Mean Square Error of
Approximation (RMSEA)
RMSEA
=0.046
RMSEA
= 0.041
Value of 0.046 considered
acceptable
Incremental fit indices Level of acceptance Comments
Tucker-Lewis index rho2 (TLI) TLI = 0.345 TLI = 0.345 0.345 implies a lower 2 /df ratio and therefore
a better fitting model
Normed Fit Index (NFI) NFI = 0.353 NFI=1.000 Perfect fit
Comparative Fit Index (CFI) CFI=0.456 CFI=1.000 Very good fit
Akaike Information Criterion
(AIC)
AIC=744.262 AIC=700.000 Asymptotic efficient
model
Hoetler Critical N .05 (HN) HN = 55 HN = 42 Relatively good fit
Comparative Fit Index (CFI) CFI=0.456 CFI=1.000 Very good fit
Incremental Fit Index Delta2 (IFI) IFI=0.503 IFI=1.000 Very good fit
Parsimonious fit indices Level of acceptance Comments
Normed Chi Square ( 2 /df) 2 = 584.262
Df= 270
Sig =0.000 2 /df = 2.164
Lower limit is 1.0, Upper
limit is 3.0 or as high as
5.0
Note: 2 = Chi square; df = degree of freedom; GFI = Goodness of fit Index; RMSEA = Root mean
square error of approximation; NFI = Normated fit index; CFI = Comaparative fit index; HN =
Hoetler‟Critical N; IFI = Incremental Fit Index; AIC = Akaike Information Criterion; AGFI = Adjusted
goodness of fit index
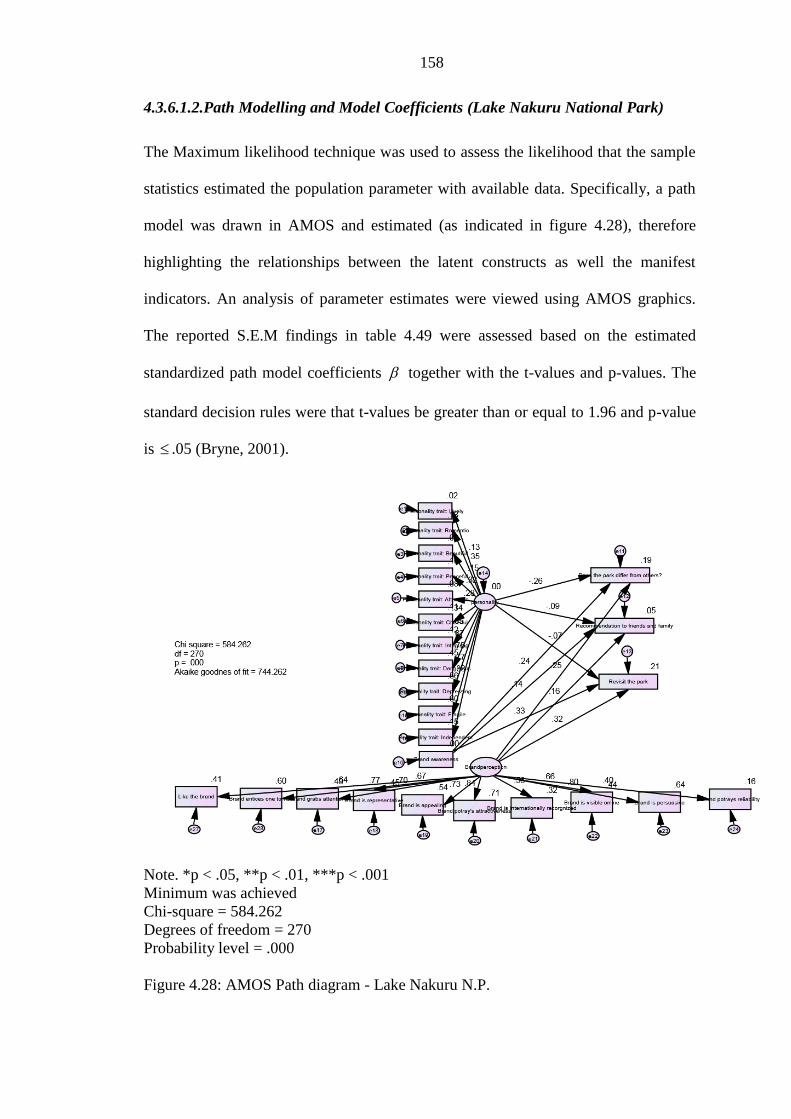
158
4.3.6.1.2.Path Modelling and Model Coefficients (Lake Nakuru National Park)
The Maximum likelihood technique was used to assess the likelihood that the sample
statistics estimated the population parameter with available data. Specifically, a path
model was drawn in AMOS and estimated (as indicated in figure 4.28), therefore
highlighting the relationships between the latent constructs as well the manifest
indicators. An analysis of parameter estimates were viewed using AMOS graphics.
The reported S.E.M findings in table 4.49 were assessed based on the estimated
standardized path model coefficients together with the t-values and p-values. The
standard decision rules were that t-values be greater than or equal to 1.96 and p-value
is .05 (Bryne, 2001).
Note. *p < .05, **p < .01, ***p < .001
Minimum was achieved
Chi-square = 584.262
Degrees of freedom = 270
Probability level = .000
Figure 4.28: AMOS Path diagram - Lake Nakuru N.P.
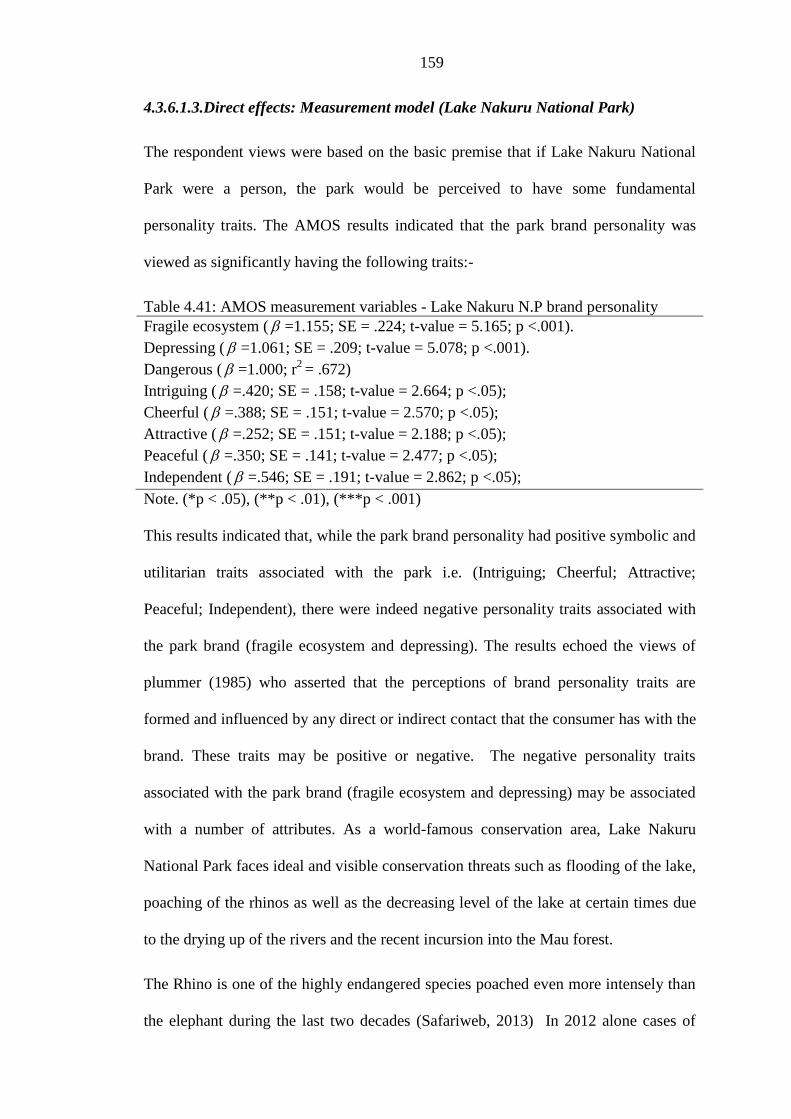
159
4.3.6.1.3.Direct effects: Measurement model (Lake Nakuru National Park)
The respondent views were based on the basic premise that if Lake Nakuru National
Park were a person, the park would be perceived to have some fundamental
personality traits. The AMOS results indicated that the park brand personality was
viewed as significantly having the following traits:-
Table 4.41: AMOS measurement variables - Lake Nakuru N.P brand personality
Fragile ecosystem ( =1.155; SE = .224; t-value = 5.165; p <.001).
Depressing ( =1.061; SE = .209; t-value = 5.078; p <.001).
Dangerous ( =1.000; r2
= .672)
Intriguing ( =.420; SE = .158; t-value = 2.664; p <.05);
Cheerful ( =.388; SE = .151; t-value = 2.570; p <.05);
Attractive ( =.252; SE = .151; t-value = 2.188; p <.05);
Peaceful ( =.350; SE = .141; t-value = 2.477; p <.05);
Independent ( =.546; SE = .191; t-value = 2.862; p <.05);
Note. (*p < .05), (**p < .01), (***p < .001)
This results indicated that, while the park brand personality had positive symbolic and
utilitarian traits associated with the park i.e. (Intriguing; Cheerful; Attractive;
Peaceful; Independent), there were indeed negative personality traits associated with
the park brand (fragile ecosystem and depressing). The results echoed the views of
plummer (1985) who asserted that the perceptions of brand personality traits are
formed and influenced by any direct or indirect contact that the consumer has with the
brand. These traits may be positive or negative. The negative personality traits
associated with the park brand (fragile ecosystem and depressing) may be associated
with a number of attributes. As a world-famous conservation area, Lake Nakuru
National Park faces ideal and visible conservation threats such as flooding of the lake,
poaching of the rhinos as well as the decreasing level of the lake at certain times due
to the drying up of the rivers and the recent incursion into the Mau forest.
The Rhino is one of the highly endangered species poached even more intensely than
the elephant during the last two decades (Safariweb, 2013) In 2012 alone cases of
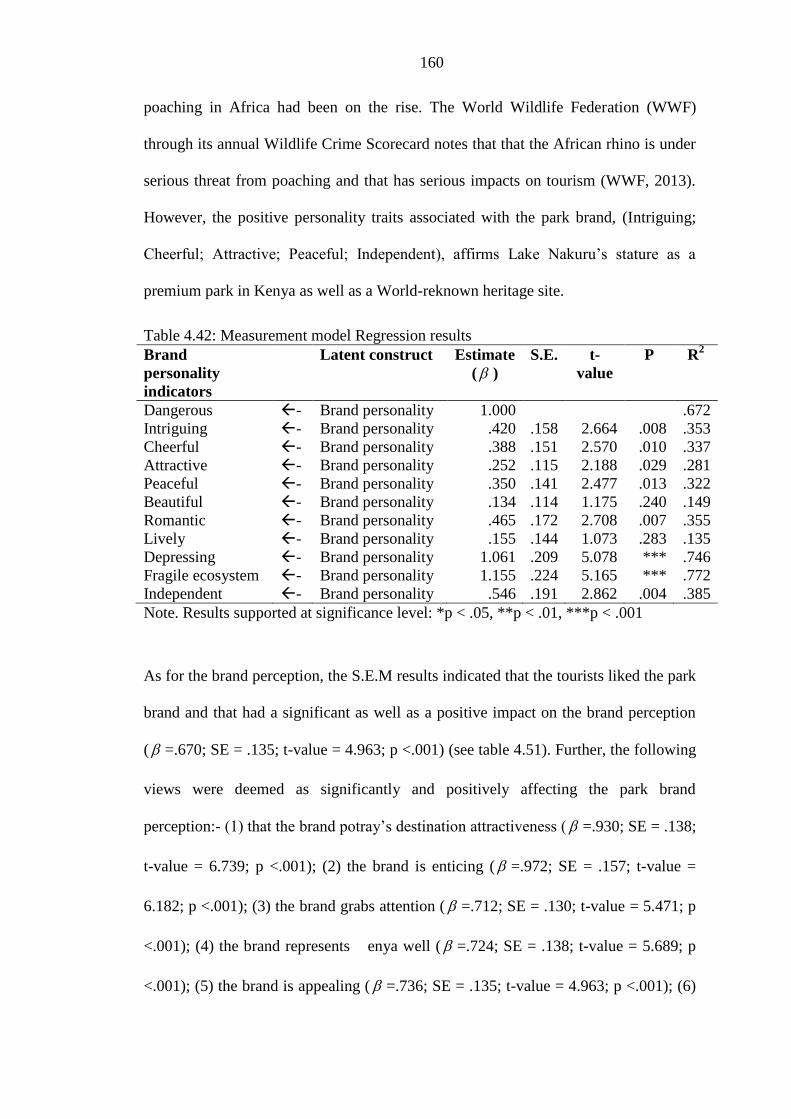
160
poaching in Africa had been on the rise. The World Wildlife Federation (WWF)
through its annual Wildlife Crime Scorecard notes that that the African rhino is under
serious threat from poaching and that has serious impacts on tourism (WWF, 2013).
However, the positive personality traits associated with the park brand, (Intriguing;
Cheerful; Attractive; Peaceful; Independent), affirms Lake Nakuru‟s stature as a
premium park in Kenya as well as a World-reknown heritage site.
Table 4.42: Measurement model Regression results
Brand
personality
indicators
Latent construct Estimate
( )
S.E. t-
value
P R2
Dangerous - Brand personality 1.000 .672
Intriguing - Brand personality .420 .158 2.664 .008 .353
Cheerful - Brand personality .388 .151 2.570 .010 .337
Attractive - Brand personality .252 .115 2.188 .029 .281
Peaceful - Brand personality .350 .141 2.477 .013 .322
Beautiful - Brand personality .134 .114 1.175 .240 .149
Romantic - Brand personality .465 .172 2.708 .007 .355
Lively - Brand personality .155 .144 1.073 .283 .135
Depressing - Brand personality 1.061 .209 5.078 *** .746
Fragile ecosystem - Brand personality 1.155 .224 5.165 *** .772
Independent - Brand personality .546 .191 2.862 .004 .385
Note. Results supported at significance level: *p < .05, **p < .01, ***p < .001
As for the brand perception, the S.E.M results indicated that the tourists liked the park
brand and that had a significant as well as a positive impact on the brand perception
( =.670; SE = .135; t-value = 4.963; p <.001) (see table 4.51). Further, the following
views were deemed as significantly and positively affecting the park brand
perception:- (1) that the brand potray‟s destination attractiveness ( =.930; SE = .138;
t-value = 6.739; p <.001); (2) the brand is enticing ( =.972; SE = .157; t-value =
6.182; p <.001); (3) the brand grabs attention ( =.712; SE = .130; t-value = 5.471; p
<.001); (4) the brand represents enya well ( =.724; SE = .138; t-value = 5.689; p
<.001); (5) the brand is appealing ( =.736; SE = .135; t-value = 4.963; p <.001); (6)
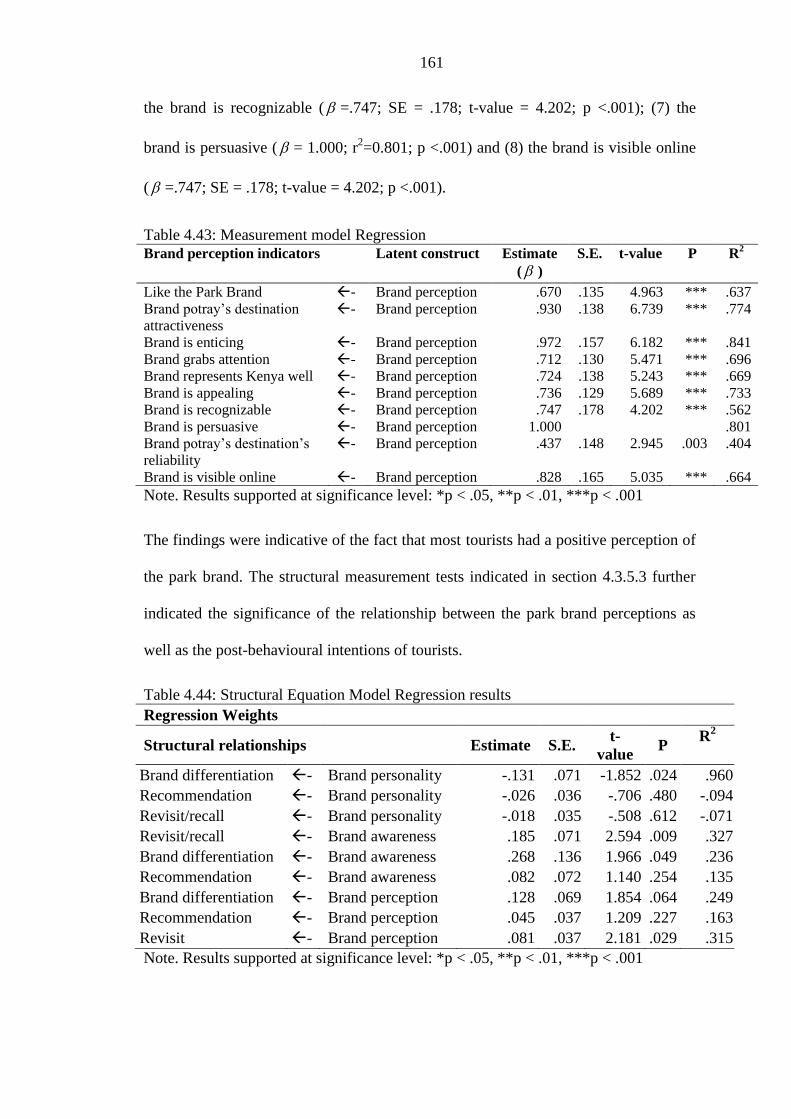
161
the brand is recognizable ( =.747; SE = .178; t-value = 4.202; p <.001); (7) the
brand is persuasive ( = 1.000; r2=0.801; p <.001) and (8) the brand is visible online
( =.747; SE = .178; t-value = 4.202; p <.001).
Table 4.43: Measurement model Regression
Brand perception indicators Latent construct Estimate
( )
S.E. t-value P R2
Like the Park Brand - Brand perception .670 .135 4.963 *** .637
Brand potray‟s destination
attractiveness
- Brand perception .930 .138 6.739 *** .774
Brand is enticing - Brand perception .972 .157 6.182 *** .841
Brand grabs attention - Brand perception .712 .130 5.471 *** .696
Brand represents Kenya well - Brand perception .724 .138 5.243 *** .669
Brand is appealing - Brand perception .736 .129 5.689 *** .733
Brand is recognizable - Brand perception .747 .178 4.202 *** .562
Brand is persuasive - Brand perception 1.000 .801
Brand potray‟s destination‟s
reliability
- Brand perception .437 .148 2.945 .003 .404
Brand is visible online - Brand perception .828 .165 5.035 *** .664
Note. Results supported at significance level: *p < .05, **p < .01, ***p < .001
The findings were indicative of the fact that most tourists had a positive perception of
the park brand. The structural measurement tests indicated in section 4.3.5.3 further
indicated the significance of the relationship between the park brand perceptions as
well as the post-behavioural intentions of tourists.
Table 4.44: Structural Equation Model Regression results
Regression Weights
Structural relationships
Estimate S.E. t-
value P
R2
Brand differentiation - Brand personality -.131 .071 -1.852 .024 .960
Recommendation - Brand personality -.026 .036 -.706 .480 -.094
Revisit/recall - Brand personality -.018 .035 -.508 .612 -.071
Revisit/recall - Brand awareness .185 .071 2.594 .009 .327
Brand differentiation - Brand awareness .268 .136 1.966 .049 .236
Recommendation - Brand awareness .082 .072 1.140 .254 .135
Brand differentiation - Brand perception .128 .069 1.854 .064 .249
Recommendation - Brand perception .045 .037 1.209 .227 .163
Revisit - Brand perception .081 .037 2.181 .029 .315
Note. Results supported at significance level: *p < .05, **p < .01, ***p < .001

162
4.3.6.2. S.E.M MODEL: HELL’S GATE NATIONAL PARK
4.3.6.2.1.Measures of Model Fitness
Structural Equations Modeling test was conducted to assess the impacts of brand
perceptions on post-behavioral intentions of tourists. The hypothesized S.E.M model
appeared to have a good fit to the data from the preliminary goodness-of-fit statistics.
The Chi square goodness-of-fit test which tested the hypothesis that the model did not
have a significant fit to the data ie Ho: 2 =0 indicated that there were significant fit
with the data provided. The GFI = 1.000 showed that the covariances implied by the
model were highly significant in explaining the observed model covariances. This was
significant for the research model as it indicated that the model estimates were
reliable. RMSEA also showed a significant fit to the data as RMSEA = 0.030. TLI of
0.752 indicated that the model significantly fit as compared to the baseline
model/data. Other fit indices as indicated by table 4.44 showed a relatively good fit.
Table 4.44: Model Goodness-of-fit indices
GFI index Level of acceptance Comments
Absolute fit indices Default
model
Saturated
model
1. Chi- square ( 2 ) 2 = 668.689
Df= 270
Sig =0.000
This measure is sensitive
to large sample sizes
2. Goodness-of-fit (GFI) GFI =1.000 GFI =1.000 Perfect fit
3. Root Mean Square Error of
Approximation (RMSEA)
RMSEA
=0.030
RMSEA
= 0.050
Value of 0.030 considered
acceptable
Incremental fit indices Level of acceptance Comments
4. Tucker-Lewis index rho2
(TLI)
TLI = 0.752 TLI = 0.000 0.752 implies a lower 2 /df ratio and therefore
a better fitting model
5. Normed Fit Index (NFI) NFI = 0.308 NFI=1.000 Perfect fit
6. Comparative Fit Index (CFI) CFI=0.379 CFI=1.000 Very good fit
7. Akaike Information Criterion
(AIC)
AIC=744.262 AIC=700.000 Asymptotic efficient
model
8. Hoetler Critical N .05 (HN) HN = 55 HN = 42 Relatively good fit
9. Comparative Fit Index (CFI) CFI=0.379 CFI=1.000 Very good fit
10. Incremental Fit Index Delta2
(IFI)
IFI=0.428 IFI=1.000 Very good fit
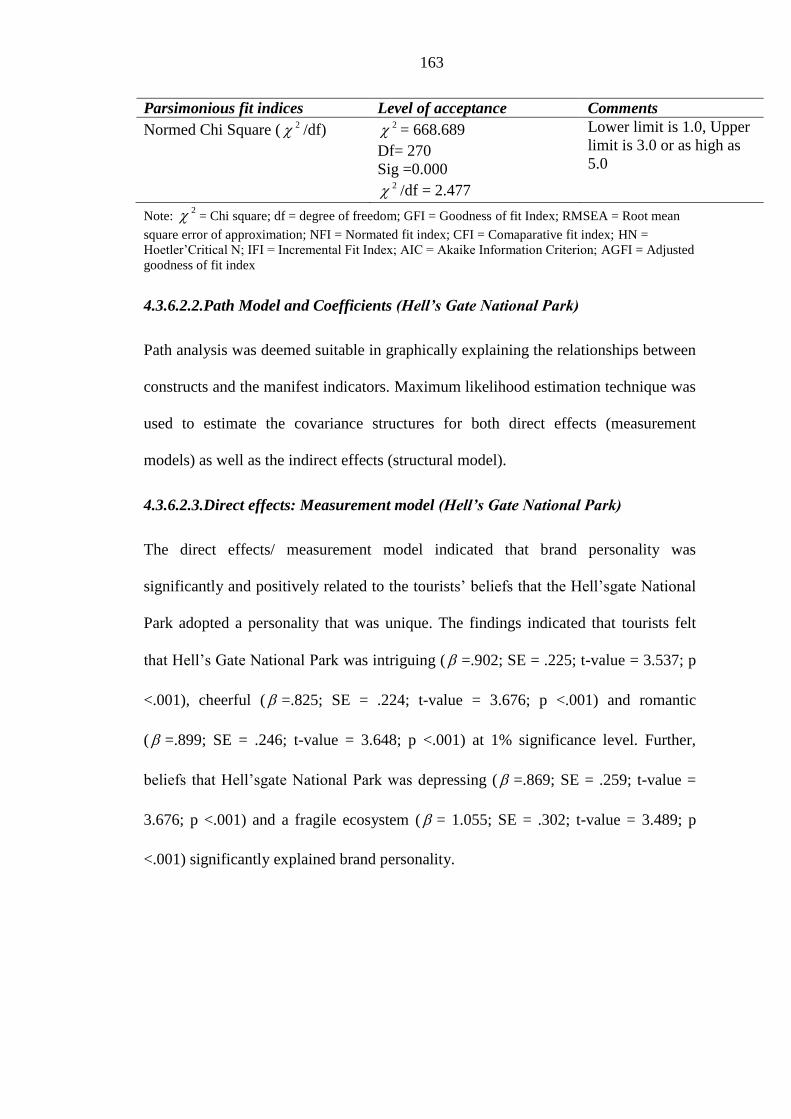
163
Parsimonious fit indices Level of acceptance Comments
Normed Chi Square ( 2 /df) 2 = 668.689
Df= 270
Sig =0.000 2 /df = 2.477
Lower limit is 1.0, Upper
limit is 3.0 or as high as
5.0
Note: 2 = Chi square; df = degree of freedom; GFI = Goodness of fit Index; RMSEA = Root mean
square error of approximation; NFI = Normated fit index; CFI = Comaparative fit index; HN =
Hoetler‟Critical N; IFI = Incremental Fit Index; AIC = Akaike Information Criterion; AGFI = Adjusted
goodness of fit index
4.3.6.2.2.Path Model and Coefficients (Hell’s Gate National Park)
Path analysis was deemed suitable in graphically explaining the relationships between
constructs and the manifest indicators. Maximum likelihood estimation technique was
used to estimate the covariance structures for both direct effects (measurement
models) as well as the indirect effects (structural model).
4.3.6.2.3.Direct effects: Measurement model (Hell’s Gate National Park)
The direct effects/ measurement model indicated that brand personality was
significantly and positively related to the tourists‟ beliefs that the Hell‟sgate National
Park adopted a personality that was unique. The findings indicated that tourists felt
that Hell‟s Gate National Park was intriguing ( =.902; SE = .225; t-value = 3.537; p
<.001), cheerful ( =.825; SE = .224; t-value = 3.676; p <.001) and romantic
( =.899; SE = .246; t-value = 3.648; p <.001) at 1% significance level. Further,
beliefs that Hell‟sgate National Park was depressing ( =.869; SE = .259; t-value =
3.676; p <.001) and a fragile ecosystem ( = 1.055; SE = .302; t-value = 3.489; p
<.001) significantly explained brand personality.

164
Table 4.45: Brand Personality Measurement model
Brand
personality
indicators
Latent construct Estimate
( )
S.E. t-
value
P R2
Dangerous - Brand Personality 1.000
.519
Intriguing - Brand Personality 0.902 0.225 3.537 *** .572
Cheerful - Brand Personality 0.825 0.224 3.676 *** .618
Attractive - Brand Personality 0.534 0.188 2.844 .004 .410
Peaceful - Brand Personality 0.546 0.195 2.803 .005 .400
Beautiful - Brand Personality 0.510 0.160 3.185 .001 .483
Romantic - Brand Personality 0.899 0.246 3.648 *** .601
Lively - Brand Personality 0.566 0.186 2.995 .003 .440
Depressing - Brand Personality 0.869 0.259 3.351 *** .525
Fragile ecosystem - Brand Personality 1.055 0.302 3.489 *** .558
Independent - Brand Personality 0.398 0.217 1.834 .067 .244
Note. Results supported at significance level: *p < .05, **p < .01, ***p < .001
The measurement model also indicated that the tourists‟ perception of the park brand
was significantly and positively related to their views that the park brand was enticing
( =.477; SE = .092; t-value = 5.184; p <.001); the park brand portrayed the
destination‟s attractiveness ( =.600; SE = .092; t-value = 6.524; p <.001); the park
brand took the tourists‟ attention ( =.418; SE = .082; t-value = 5.124; p <.001); the
park brand represents Kenya well ( =.266; SE = .113; t-value = 2.344; p <.005); the
park brand is appealing ( =.531; SE = .085; t-value = 6.211; p <.001); the park
brand is recognizable ( =.561; SE = .91; t-value = 6.182; p <.001); the park brand is
persuasive ( =.531; R2 = .907); the park brand potray‟s reliability ( =.402; SE =
.084; t-value = 4.806; p <.001) and that the park brand is visible online ( =.878; SE
= .102; t-value = 8.625; p <.001).
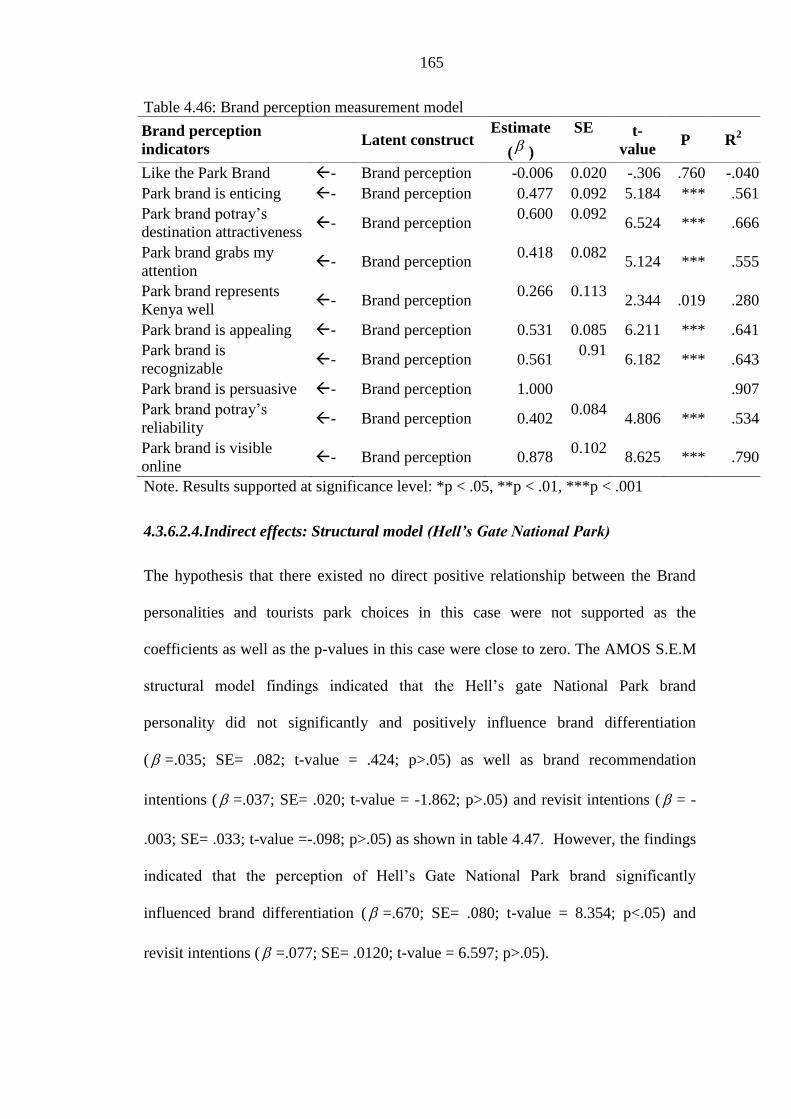
165
Table 4.46: Brand perception measurement model
Brand perception
indicators Latent construct
Estimate
( )
SE t-
value P R
2
Like the Park Brand - Brand perception -0.006 0.020 -.306 .760 -.040
Park brand is enticing - Brand perception 0.477 0.092 5.184 *** .561
Park brand potray‟s
destination attractiveness - Brand perception
0.600
0.092 6.524 *** .666
Park brand grabs my
attention - Brand perception
0.418
0.082 5.124 *** .555
Park brand represents
Kenya well - Brand perception
0.266
0.113 2.344 .019 .280
Park brand is appealing - Brand perception 0.531 0.085 6.211 *** .641
Park brand is
recognizable - Brand perception 0.561
0.91 6.182 *** .643
Park brand is persuasive - Brand perception 1.000
.907
Park brand potray‟s
reliability - Brand perception 0.402
0.084 4.806 *** .534
Park brand is visible
online - Brand perception 0.878
0.102 8.625 *** .790
Note. Results supported at significance level: *p < .05, **p < .01, ***p < .001
4.3.6.2.4.Indirect effects: Structural model (Hell’s Gate National Park)
The hypothesis that there existed no direct positive relationship between the Brand
personalities and tourists park choices in this case were not supported as the
coefficients as well as the p-values in this case were close to zero. The AMOS S.E.M
structural model findings indicated that the Hell‟s gate National Park brand
personality did not significantly and positively influence brand differentiation
( =.035; SE= .082; t-value = .424; p>.05) as well as brand recommendation
intentions ( =.037; SE= .020; t-value = -1.862; p>.05) and revisit intentions ( = -
.003; SE= .033; t-value =-.098; p>.05) as shown in table 4.47. However, the findings
indicated that the perception of Hell‟s Gate National Park brand significantly
influenced brand differentiation ( =.670; SE= .080; t-value = 8.354; p<.05) and
revisit intentions ( =.077; SE= .0120; t-value = 6.597; p>.05).

166
Table 4.47: S.E.M structural model
S.E.M Structural model
latent constructs
Estimate
( )
SE t-value P R2
Brand differentiation - Brand Personality 0.035 0.082 .424 .671 .061
Recommendation - Brand Personality -0.037 0.020 -1.862 .063 -.214
Revisit - Brand Personality -0.003 0.033 -.098 .922 -.014
Revisit - Brand Awareness 0.085 0.045 1.869 .062 .237
Brand differentiation - Brand Awareness -0.039 0.109 -.357 .021* -.045
Recommendation - Brand Awareness -0.022 0.025 -.893 .372 -.086
Brand differentiation - Brand perception 0.670 0.080 8.354 *** .777
Recommendation - Brand perception -0.048 0.049 -.979 .328 -.131
Revisit - Brand perception 0.077 0.012 6.597 *** .689
Note. Results supported at significance level: *p < .05, **p < .01, ***p < .001
These findings implied that the perception of the park brand significantly influence
tourists‟ revisit and recommendation intentions. The probable reason for this factor as
indicated by Keller‟s (1993) framework on Customer-Based Brand Equity, is that
brand perceptions create functional, experiential and symbolic associations with a
place, therefore facilitating recall.
4.3.6.3. S.E.M MODEL: ABERDARES NATIONAL PARK
4.3.6.3.1. Measures of Model Fitness
Structural equations modeling test was used to assess the impacts of brand perceptions
on the post-behavioral intentions of tourists to Aberdares. The Absolute fit indices
showed a clear fit between the implied model and the data provided as indicated by
the chi-square statistic 2 = 670.614; d.f.= 270; p =0.000. The GFI = 1.000 and NFI =
1.000 showed that the covariances implied by the model were highly significant in
explaining the observed model covariances. RMSEA also showed a significant fit to
the data as RMSEA = 0.14. TLI of 0.152 indicated that the model significantly fit as
compared to the baseline model/data. Other fit indices as indicated by table showed a
relatively good fit.
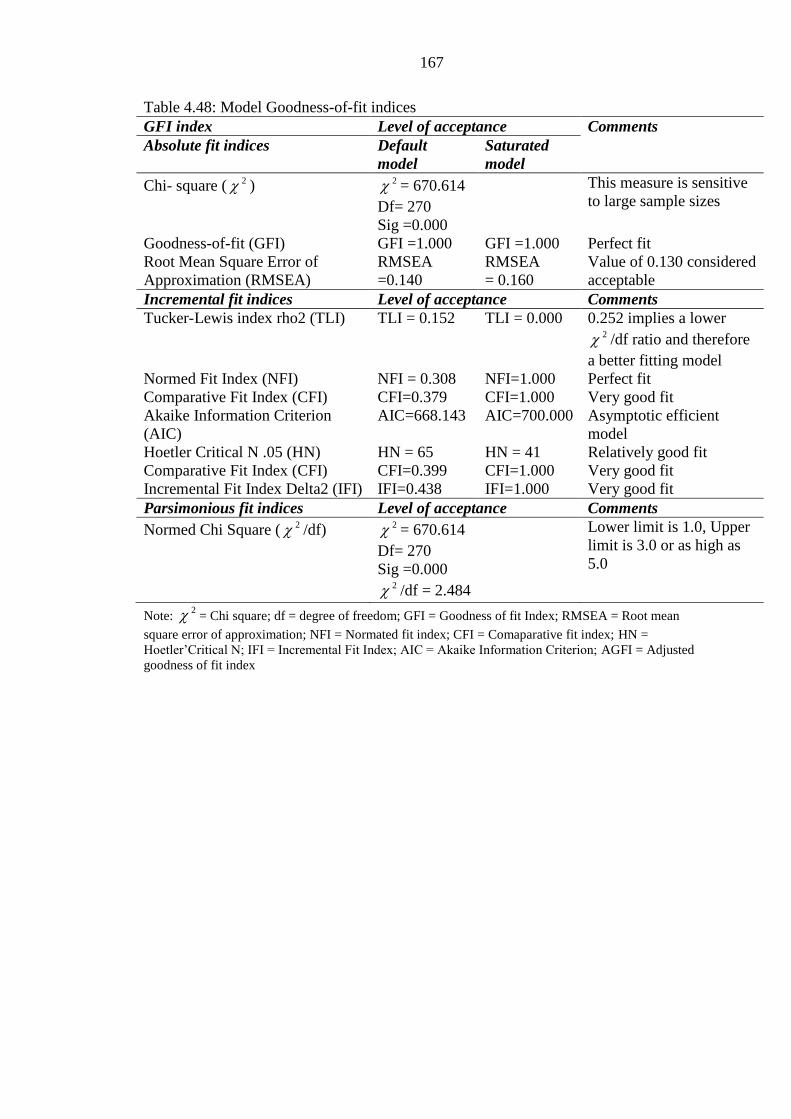
167
Table 4.48: Model Goodness-of-fit indices
GFI index Level of acceptance Comments
Absolute fit indices Default
model
Saturated
model
Chi- square ( 2 ) 2 = 670.614
Df= 270
Sig =0.000
This measure is sensitive
to large sample sizes
Goodness-of-fit (GFI) GFI =1.000 GFI =1.000 Perfect fit
Root Mean Square Error of
Approximation (RMSEA)
RMSEA
=0.140
RMSEA
= 0.160
Value of 0.130 considered
acceptable
Incremental fit indices Level of acceptance Comments
Tucker-Lewis index rho2 (TLI) TLI = 0.152 TLI = 0.000 0.252 implies a lower 2 /df ratio and therefore
a better fitting model
Normed Fit Index (NFI) NFI = 0.308 NFI=1.000 Perfect fit
Comparative Fit Index (CFI) CFI=0.379 CFI=1.000 Very good fit
Akaike Information Criterion
(AIC)
AIC=668.143 AIC=700.000 Asymptotic efficient
model
Hoetler Critical N .05 (HN) HN = 65 HN = 41 Relatively good fit
Comparative Fit Index (CFI) CFI=0.399 CFI=1.000 Very good fit
Incremental Fit Index Delta2 (IFI) IFI=0.438 IFI=1.000 Very good fit
Parsimonious fit indices Level of acceptance Comments
Normed Chi Square ( 2 /df) 2 = 670.614
Df= 270
Sig =0.000 2 /df = 2.484
Lower limit is 1.0, Upper
limit is 3.0 or as high as
5.0
Note: 2 = Chi square; df = degree of freedom; GFI = Goodness of fit Index; RMSEA = Root mean
square error of approximation; NFI = Normated fit index; CFI = Comaparative fit index; HN =
Hoetler‟Critical N; IFI = Incremental Fit Index; AIC = Akaike Information Criterion; AGFI = Adjusted
goodness of fit index
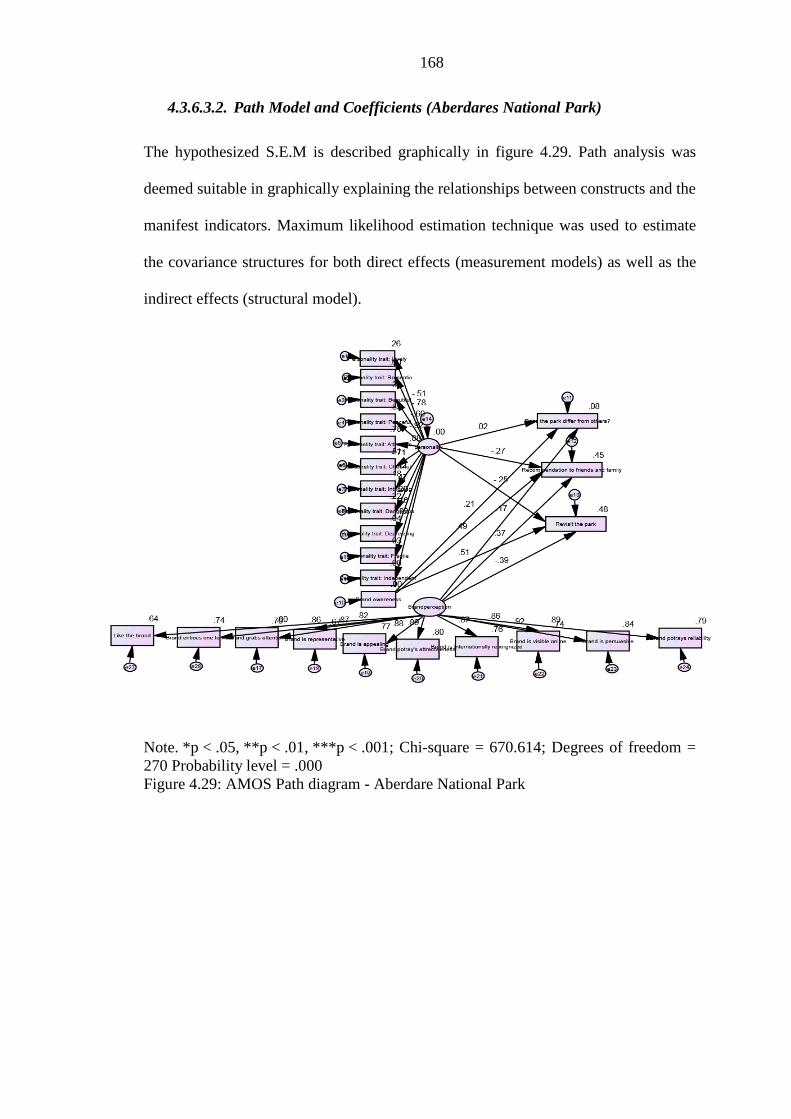
168
4.3.6.3.2. Path Model and Coefficients (Aberdares National Park)
The hypothesized S.E.M is described graphically in figure 4.29. Path analysis was
deemed suitable in graphically explaining the relationships between constructs and the
manifest indicators. Maximum likelihood estimation technique was used to estimate
the covariance structures for both direct effects (measurement models) as well as the
indirect effects (structural model).
Note. *p < .05, **p < .01, ***p < .001; Chi-square = 670.614; Degrees of freedom =
270 Probability level = .000
Figure 4.29: AMOS Path diagram - Aberdare National Park

169
4.3.6.3.3. Direct effects: Measurement model (Aberdares National Park)
The measurement model indicated that the tourists had a significant and positive view
of the park brand personality. The Park Brand personality was significantly and
positively explained by the tourists‟ beliefs that the Aberdares National Park was
intriguing ( =.902; SE = .225; t-value = 3.537; p <.001), cheerful ( =1.593; SE =
.471; t-value = 3.382; p <.05), attractive ( =1.540; SE = .422; t-value = 3.653; p
<.05), peaceful ( =1.947; SE = .525; t-value = 3.706; p <.05), romantic ( =.712;
SE = .228; t-value = 3.120; p <.01), lively ( =.745; SE = .261; t-value = 2.856; p
<.01) as indicated in table 4.49.
Table 4.49: Measurement model of Brand Personality
Brand personality
indicators Latent construct
Estimate
( ) S.E.
t
value P
R2
Dangerous - Brand Personality 1.000
.467
Intriguing - Brand Personality .817 .327 2.497 .013 .422
Cheerful - Brand Personality 1.593 .471 3.382 *** .714
Attractive - Brand Personality 1.540 .422 3.653 *** .881
Peaceful - Brand Personality 1.947 .525 3.706 *** .923
Beautiful - Brand Personality .712 .228 3.120 .002** .601
Romantic - Brand Personality 1.676 .480 3.489 *** .778
Lively - Brand Personality .745 .261 2.856 .004** .509
Depressing - Brand Personality .392 .284 1.381 .167 .201
Fragile ecosystem - Brand Personality .347 .317 1.094 .274 .159
Independent - Brand Personality .043 .247 .173 .862 .024
Note. Results supported at significance level: *p < .05, **p < .01, ***p < .001
4.3.6.3.4. Direct effects: Measurement model (Aberdares National Park)
The measurement model also provided the regression weights of the brand perception
measurement constructs. The parameter coefficients as well as the t-values and
coefficients of determination were all indicative of the fact that all the perception
indicators significantly and positively explained the brand perception latent construct.

170
Table 4.50: Measurement model of Brand perception
Brand perception
Indicators Latent construct
Estimate
(
) S.E.
t
value P R
2
Like the Park Brand - Brand perception .834 .111 7.509 *** .801
Park brand potray‟s destination
attractiveness - Brand perception .932 .097 9.633 *** .893
Park brand is enticing - Brand perception .975 .112 8.714 *** .860
Park brand grabs my attention - Brand perception .917 .102 8.950 *** .869
Park brand represents Kenya
well - Brand perception .852 .108 7.869 *** .820
Park brand is appealling - Brand perception .827 .090 9.206 *** .879
Park brand is recorgnizeable - Brand perception .963 .107 8.973 *** .870
Park brand is persuasive - Brand perception 1.000
.919
Park brand potray‟s reliability - Brand perception 1.029 .109 9.443 *** .887
Park brand is visible online - Brand perception .948 .109 8.683 *** .859
Note. Results supported at significance level: *p < .05, **p < .01, ***p < .001
4.3.6.3.5. Indirect effects: Structural model (Aberdares National Park)
The hypothesis that there existed no direct positive relationship between the Brand
personalities and tourists park choices in the case of Aberdares National Park were
supported. Brand personality did not significantly influence differentiation ( =.015,
SE=.112, t-value = .132, p>.05), recommendation ( =-.065; SE = .034; t-value = -
1.899; p>.05) as well as revisit intentions ( =-.121; SE = .071; t-value = -1.715;
p>.05). However, the hypothesis that Kenyan park brand perceptions do not
significantly influence tourist revisit intentions was not supported as there was a
significant relationship between brand perception and recommendation ( =.052; SE
= .018; t-value = 2.905; p>.01) and revisit intentions ( =.110; SE = .038; t-value
2.915; p<.05).
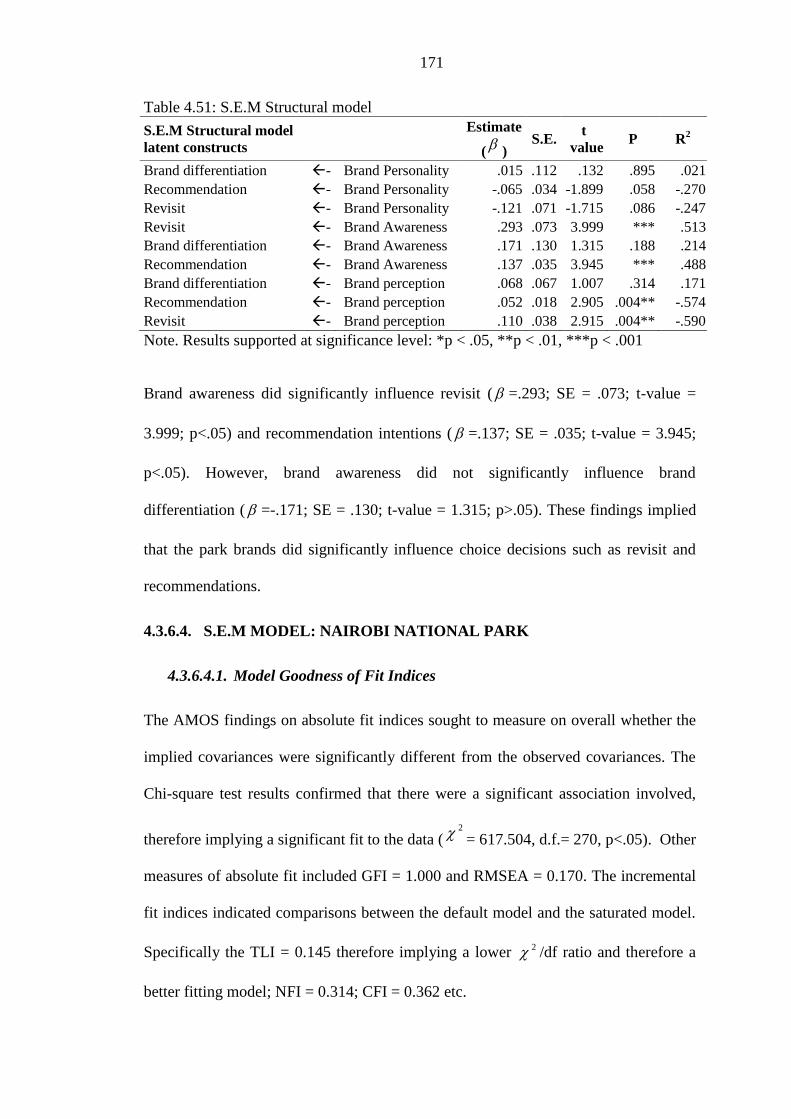
171
Table 4.51: S.E.M Structural model
S.E.M Structural model
latent constructs
Estimate
(
) S.E.
t
value P R
2
Brand differentiation - Brand Personality .015 .112 .132 .895 .021
Recommendation - Brand Personality -.065 .034 -1.899 .058 -.270
Revisit - Brand Personality -.121 .071 -1.715 .086 -.247
Revisit - Brand Awareness .293 .073 3.999 *** .513
Brand differentiation - Brand Awareness .171 .130 1.315 .188 .214
Recommendation - Brand Awareness .137 .035 3.945 *** .488
Brand differentiation - Brand perception .068 .067 1.007 .314 .171
Recommendation - Brand perception .052 .018 2.905 .004** -.574
Revisit - Brand perception .110 .038 2.915 .004** -.590
Note. Results supported at significance level: *p < .05, **p < .01, ***p < .001
Brand awareness did significantly influence revisit ( =.293; SE = .073; t-value =
3.999; p<.05) and recommendation intentions ( =.137; SE = .035; t-value = 3.945;
p<.05). However, brand awareness did not significantly influence brand
differentiation ( =-.171; SE = .130; t-value = 1.315; p>.05). These findings implied
that the park brands did significantly influence choice decisions such as revisit and
recommendations.
4.3.6.4. S.E.M MODEL: NAIROBI NATIONAL PARK
4.3.6.4.1. Model Goodness of Fit Indices
The AMOS findings on absolute fit indices sought to measure on overall whether the
implied covariances were significantly different from the observed covariances. The
Chi-square test results confirmed that there were a significant association involved,
therefore implying a significant fit to the data (2 = 617.504, d.f.= 270, p<.05). Other
measures of absolute fit included GFI = 1.000 and RMSEA = 0.170. The incremental
fit indices indicated comparisons between the default model and the saturated model.
Specifically the TLI = 0.145 therefore implying a lower 2 /df ratio and therefore a
better fitting model; NFI = 0.314; CFI = 0.362 etc.
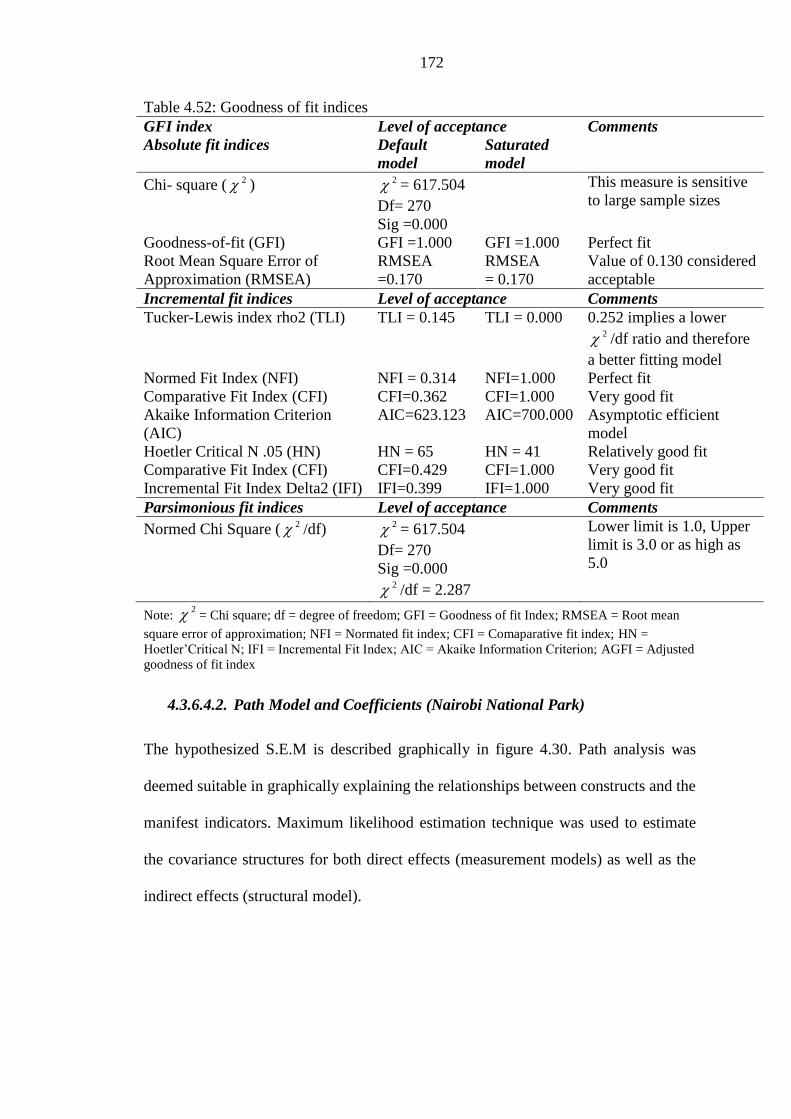
172
Table 4.52: Goodness of fit indices
GFI index Level of acceptance Comments
Absolute fit indices Default
model
Saturated
model
Chi- square ( 2 ) 2 = 617.504
Df= 270
Sig =0.000
This measure is sensitive
to large sample sizes
Goodness-of-fit (GFI) GFI =1.000 GFI =1.000 Perfect fit
Root Mean Square Error of
Approximation (RMSEA)
RMSEA
=0.170
RMSEA
= 0.170
Value of 0.130 considered
acceptable
Incremental fit indices Level of acceptance Comments
Tucker-Lewis index rho2 (TLI) TLI = 0.145 TLI = 0.000 0.252 implies a lower 2 /df ratio and therefore
a better fitting model
Normed Fit Index (NFI) NFI = 0.314 NFI=1.000 Perfect fit
Comparative Fit Index (CFI) CFI=0.362 CFI=1.000 Very good fit
Akaike Information Criterion
(AIC)
AIC=623.123 AIC=700.000 Asymptotic efficient
model
Hoetler Critical N .05 (HN) HN = 65 HN = 41 Relatively good fit
Comparative Fit Index (CFI) CFI=0.429 CFI=1.000 Very good fit
Incremental Fit Index Delta2 (IFI) IFI=0.399 IFI=1.000 Very good fit
Parsimonious fit indices Level of acceptance Comments
Normed Chi Square ( 2 /df) 2 = 617.504
Df= 270
Sig =0.000 2 /df = 2.287
Lower limit is 1.0, Upper
limit is 3.0 or as high as
5.0
Note: 2 = Chi square; df = degree of freedom; GFI = Goodness of fit Index; RMSEA = Root mean
square error of approximation; NFI = Normated fit index; CFI = Comaparative fit index; HN =
Hoetler‟Critical N; IFI = Incremental Fit Index; AIC = Akaike Information Criterion; AGFI = Adjusted
goodness of fit index
4.3.6.4.2. Path Model and Coefficients (Nairobi National Park)
The hypothesized S.E.M is described graphically in figure 4.30. Path analysis was
deemed suitable in graphically explaining the relationships between constructs and the
manifest indicators. Maximum likelihood estimation technique was used to estimate
the covariance structures for both direct effects (measurement models) as well as the
indirect effects (structural model).

173
Note. *p < .05, **p < .01, ***p < .001
Chi-square = 617.504
Degrees of freedom = 270
Probability level = .000
Figure 4.30: AMOS Path diagram - Nairobi National Park
4.3.6.4.3. Direct effects: Measurement model (Nairobi National Park)
Within the direct effects of the model, the brand personality construct were
significantly explained by all the measurement indicator variables (as indicated in
table 4.53). This was a significant attribute in determining the construct‟s validity in
the model. Important to note however were fact that there were negative coefficients
on some of the personality indicators. This was indicative of the fact that the tourists
strongly felt that these factors negatively explained brand personality of the park.
These include the views that the park was intriguing ( = -.163; SE = .054; t-value = -
3.027; p<.01), cheerful ( = -.294; SE = .065; t-value = -4.538; p<.001), attractive
( = -.745; SE = .156; t-value = -4.760; p<.001) and lively ( = -.488; SE = .102; t-
value = -4.762; p<.001). The implications of these findings was that KWS ought to
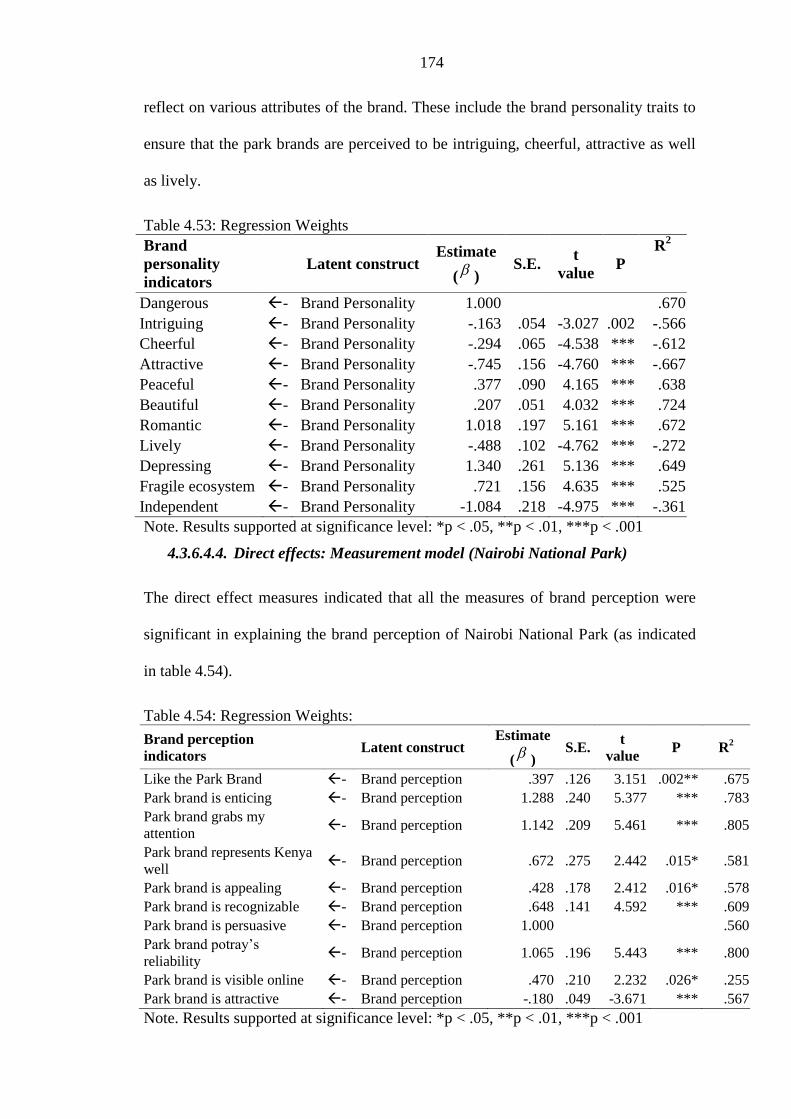
174
reflect on various attributes of the brand. These include the brand personality traits to
ensure that the park brands are perceived to be intriguing, cheerful, attractive as well
as lively.
Table 4.53: Regression Weights
Brand
personality
indicators
Latent construct Estimate
( ) S.E.
t
value P
R2
Dangerous - Brand Personality 1.000
.670
Intriguing - Brand Personality -.163 .054 -3.027 .002 -.566
Cheerful - Brand Personality -.294 .065 -4.538 *** -.612
Attractive - Brand Personality -.745 .156 -4.760 *** -.667
Peaceful - Brand Personality .377 .090 4.165 *** .638
Beautiful - Brand Personality .207 .051 4.032 *** .724
Romantic - Brand Personality 1.018 .197 5.161 *** .672
Lively - Brand Personality -.488 .102 -4.762 *** -.272
Depressing - Brand Personality 1.340 .261 5.136 *** .649
Fragile ecosystem - Brand Personality .721 .156 4.635 *** .525
Independent - Brand Personality -1.084 .218 -4.975 *** -.361
Note. Results supported at significance level: *p < .05, **p < .01, ***p < .001
4.3.6.4.4. Direct effects: Measurement model (Nairobi National Park)
The direct effect measures indicated that all the measures of brand perception were
significant in explaining the brand perception of Nairobi National Park (as indicated
in table 4.54).
Table 4.54: Regression Weights:
Brand perception
indicators Latent construct
Estimate
(
) S.E.
t
value P R
2
Like the Park Brand - Brand perception .397 .126 3.151 .002** .675
Park brand is enticing - Brand perception 1.288 .240 5.377 *** .783
Park brand grabs my
attention - Brand perception 1.142 .209 5.461 *** .805
Park brand represents Kenya
well - Brand perception .672 .275 2.442 .015* .581
Park brand is appealing - Brand perception .428 .178 2.412 .016* .578
Park brand is recognizable - Brand perception .648 .141 4.592 *** .609
Park brand is persuasive - Brand perception 1.000
.560
Park brand potray‟s
reliability - Brand perception 1.065 .196 5.443 *** .800
Park brand is visible online - Brand perception .470 .210 2.232 .026* .255
Park brand is attractive - Brand perception -.180 .049 -3.671 *** .567
Note. Results supported at significance level: *p < .05, **p < .01, ***p < .001

175
This finding was indicative of the fact that Nairobi National Park had a significant and
positive brand perception from the tourists. The tourists felt that the brand was highly
enticing, attractive, recorgnizeable, persuasive and reliable. These were highly
significant measures in explaining the park brand‟s popularity.
4.3.6.4.5. Indirect effects: Structural model (Nairobi National Park)
The findings of the structural measures showed that there was very strong evidence to
suggest that in Nairobi National Park, tourists‟ perception of the park brand
significantly and negatively influenced brand differentiation ( = -.180; SE = .049; t-
value = -3.671; p<.001), recommendation ( = -.169; SE = .042; t-value = -4.057;
p<.001) and revisit intentions of tourists ( = -.214; SE = .051; t-value = -4.215;
p<.001). The findings further indicated that brand personality significantly and
positively influenced all behavioural intentions of consumers i.e. revisit ( = .189; SE
= .039; t-value = 4.839; p<.001), recommendation ( = .142; SE = .030; t-value =
4.773; p<.001) and differentiation ( = 1.581; SE = .304; t-value = 5.200; p<.001).
Table 4.55: Structural model
Brand personality
indicators Latent construct
Estimate
( ) S.E.
t
value P R
2
Brand differentiation - Brand Personality 1.581 .304 5.200 *** .544
Recommendation - Brand Personality .142 .030 4.773 *** .622
Revisit - Brand Personality .189 .039 4.839 *** .653
Revisit - Brand Awareness -.042 .037 -1.135 .256 -.106
Brand differentiation - Brand Awareness .181 .040 4.567 *** .191
Recommendation - Brand Awareness -.025 .032 -.777 .437 -.575
Brand differentiation - Brand perception -.180 .049 -3.671 *** -.501
Recommendation - Brand perception -.169 .042 -4.057 *** -.543
Revisit - Brand perception -.214 .051 -4.215 *** -.565
Note. Results supported at significance level: *p < .05, **p < .01, ***p < .001

176
These findings implied that the internal brand personality traits were significant paths
to consumer loyalty, differentiation and recommendation decisions. An important
implication therefore is that beyond conventional marketing mix, park brand
managers need to raise tourist awareness of the parks‟ core values and identity. In
addition, park brand managers should further promote the park‟s identity and
personality in tourist markets.

177
CHAPTER FIVE
5.0 SUMMARY OF FINDINGS, CONCLUSIONS AND
RECOMMENDATIONS
5.1. Introduction
The study (as indicated in cf. 1.3) sought to assess the efficacy of park branding as a
means of influencing consumer markets positively. There was need to understand
better the primary associations (drivers) a brand holds in the minds of consumers as
well as assess consumers‟ cognitive determinants to park brand choice. Currently,
Kenya‟s Vision 2030 and tourism policy did not effectively incorporate perspectives
of tourists on park brand choice and flagship projects. Therefore, this created in a
sense a gap such that the researcher sought to assess the efficacy of park branding in
influencing tourist choice behaviour and in a sense advice on the policy directions for
the country.
5.2. Summary of findings
The summary of findings of this study are based on the field data in relations to the
main objectives and hypotheses of the study. The summary is as follows:-
5.2.1. Summary of findings on Objective One: To profile tourists visiting
branded parks in Kenya based on their choice behaviour
In terms of the first objective, the study findings were suggestive that the parks
attracted differentiated segments of tourists.
Cluster analysis of the tourist segments indicated that the park brands attracted
differentiated cluster segments. These segments were classified as primary
segments and secondary segments.
Levels of predictor importance indicated that the demographic factors were
important in explaining visitation to the parks mentioned

178
Choice of Nairobi National Park was significantly influenced by country of
origin determinants (I = 1.00), duration of visit (I = 0.68), tourists travelling
with children (I = 0.68) as well as gender (I = 0.3).
Choice of Lake Nakuru National Park was significantly influenced by tourist‟s
occupation (i = 1.00), age (i = 0.94), marital status (i =0.46), group travel (i =
0.41) as well as duration of visit (i = 0.35).
Age, Marital status, income and preferred mode of travel arrangement were
highly rated predictors to visitation to Aberdares National Park.
An analysis of the predictor importance to visitation indicated that Gender,
Duration of Visit, Level of Education, Occupation and Travel Companion
were key predictors to visitation to Hell‟s Gate National Park.
The results implied that tourism marketing and promotion ought to design, package
and promote the brand differently to meet the targeted needs of these segments.
5.2.2. Summary of findings on Objective Two: To examine antecedent factors
influencing tourists’ choice behaviour
The results further showed that, the choice of each park brand was influenced by five
main factors. These factors were choice specific as the factors differed.
General patterns in the observations imply that the destination‟s attractions
were highly likely to be chosen within Aberdares and Lake Nakuru National
Park. In Nairobi and Hell‟s Gate National Park the destination‟s image were
mentioned as highly likely factor on average to be chosen. In Lake Nakuru and
Aberdares National Park touristic activities within the destination were
moderately likely to be chosen as factors.
Choice of Nairobi National Park was significantly influenced by the state of
roads and infrastructure, travel agency recommendations, local culture,

179
reference from tour operators, and accommodation quality. Therefore, there
was need to enhance cross-sectoral interlinkages between the travel trade
intermediaries, local communities and the park management agency (KWS)
through in-market representation and adopting strategic partnerships (PPPs)
with the travel trade in advertising, trade-fairs and media etc. The state of
roads and infrastructure can be similarly enhanced as a matter of strategic
development priority within the park as it enhances the park‟s access to key
attractions. Accommodation quality needs to similarly enhanced within and
outside the park through stakeholder consultation and support. Such support
can be enhanced through partnership arrangements such as Design, Build,
Finance, Operate (DBFO); Build Own Operate (BOO); Build, Operate,
Transfer (BOT).
As for Lake Nakuru National Park, choice was significantly influenced by
travel agency recommendations, information on the web, cost of holiday and
accommodation quality. Therefore, similarly there was need to build strategic
sectoral partnerships with the industry in order to position the park brand as a
high-value park brand. In this line, there is need to enhance the park‟s online
brand proposition as well as differentiate the brand offering to enhance the
value of the brand in the market. There is need to understand that park brands
are operate essentially on the promise of an experience and tourists choose a
park brand over another with the expectations of an elevated experience.
Measures to address the cost of holiday need to be addressed. This is in line
with the global standards according to the UNWTO worldwide holiday costs
barometer (UNWTO 2012). Accommodation quality also needs to similarly
enhanced within and outside the park through stakeholder consultation and

180
support. The findings further showed that, there were three main aspects of the
brand that were indeed contextual factors that determined choice of tourists to
the Kenyan parks. There was need to urgently address these factors to ensure
that the brand popularity and brand equity were sustained.
Choice of Hell‟s Gate National Park was significantly influenced by the state
of roads and infrastructure, accommodation quality and references from tour
operators. The success of any tourism destination is dependent to a large
degree on the nature of the facilities and services infrastructure that are
available to the tourist. The implementation of the tourism infrastructure
development strategy depends on the partnership between public sector
investment (especially in infrastructure) and private sector investment
(especially in tourism infrastructure development. There is need to adopt a
collaborative strategy with tour operators to sell the park brand effectively to
the markets.
5.2.3.Summary of Findings on Objective Three: To Evaluate tourists’
perceptions of park brands in Kenya and their choice behaviour
One-way ANOVA test results indicated that there existed moderately significant
differences in destination image F(3,353) = 2.583, p=.061; roads and
infrastructure F(3,351) = 11.459, p=.000; travel agency recommendations
F(3,352)= 3.899, p=.009; local culture F(3,348)= 3.456, p=.017; reference from
tour operators F(3,346)= 5.156, p=.002; service quality F(3,341)= 7.178, p=.000
and accommodation quality F(3, 337) = 7.365, p=.000. These factors were
significant in differentiating choice of park to visit. These findings indicated that
there were distinct differences between different park brands.
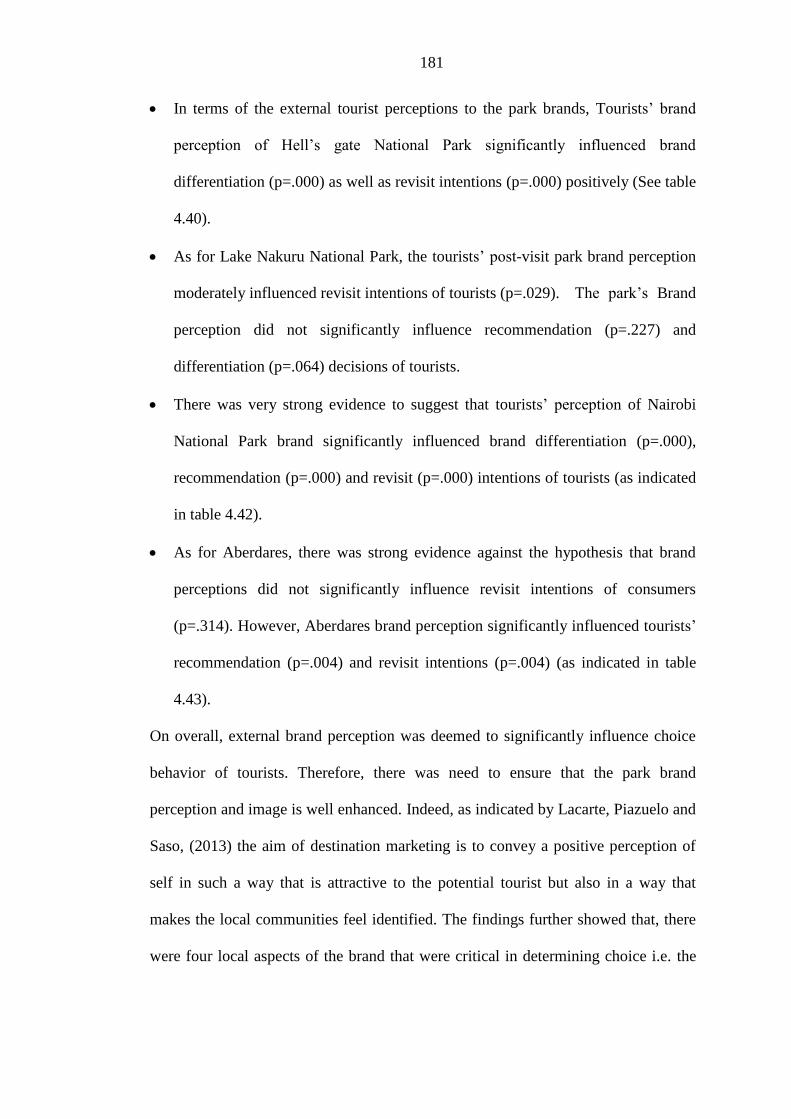
181
In terms of the external tourist perceptions to the park brands, Tourists‟ brand
perception of Hell‟s gate National Park significantly influenced brand
differentiation (p=.000) as well as revisit intentions (p=.000) positively (See table
4.40).
As for Lake Nakuru National Park, the tourists‟ post-visit park brand perception
moderately influenced revisit intentions of tourists (p=.029). The park‟s Brand
perception did not significantly influence recommendation (p=.227) and
differentiation (p=.064) decisions of tourists.
There was very strong evidence to suggest that tourists‟ perception of Nairobi
National Park brand significantly influenced brand differentiation (p=.000),
recommendation (p=.000) and revisit (p=.000) intentions of tourists (as indicated
in table 4.42).
As for Aberdares, there was strong evidence against the hypothesis that brand
perceptions did not significantly influence revisit intentions of consumers
(p=.314). However, Aberdares brand perception significantly influenced tourists‟
recommendation (p=.004) and revisit intentions (p=.004) (as indicated in table
4.43).
On overall, external brand perception was deemed to significantly influence choice
behavior of tourists. Therefore, there was need to ensure that the park brand
perception and image is well enhanced. Indeed, as indicated by Lacarte, Piazuelo and
Saso, (2013) the aim of destination marketing is to convey a positive perception of
self in such a way that is attractive to the potential tourist but also in a way that
makes the local communities feel identified. The findings further showed that, there
were four local aspects of the brand that were critical in determining choice i.e. the
182
contextual factors/ brand environment, internal park brand personality, external park
brand perception as well as the cognitive brand awareness.
5.2.4.Summary of Findings on Objective Four: To Explore the influence of
brand personalities on choice behaviour of tourists to Kenyan parks
Lake Nakuru National Park brand personality significantly and negatively
influenced brand differentiation ( = -.131; SE= .071; t-value = -1.852; p<.05).
The Park‟s brand personality similarly did not significantly influence tourist
revisit/recall ( =.-018; SE= .035; t-value = -.508; p >.05).
The findings from Nairobi National Park indicated that brand personality
significantly and positively influenced all behavioral intentions of consumers i.e.
revisit (p<.05), recommendation (p<.05) and differentiation (p<.05).
Hell‟s Gate National Park showed a significant degree of brand salience. The park
brand‟s personality did not significantly influence brand differentiation (p<.05),
recommendation (p<.05) and revisit (p<.05) decisions of tourists.
Additively, structural model regression results indicated that the Aberdares
National Park brand personality did not significantly influence brand
differentiation (p>.05), recommendation intentions (p>.05) and revisit intentions
(p>.05).
On overall, the results were indicative of a need that the park brand‟s personality and
(or) uniqueness be revealed better through marketing concepts that are linked to
historical, ecological, socio-cultural values of the park and the adjacent communities.
In this way, the park‟s brand personality could positively influence choice behavior of
targeted market segments.

183
5.3. Conclusions
Wildlife Tourism has been identified as one of the key sectors towards global
competitiveness within the economic pillar of Vision 2030. A specific strategy
towards realizing this aim has been achieving higher tourist revenue yield. General
patterns in the findings and observations imply that the park brand is a significant
attribute that affected destination choices of tourists. In conclusion, to address broad
tourism goals as well as address the research problem, the study affirms that there is
need:-
5.3.1. Conclusions based on Objective One: To profile tourists visiting
branded parks in Kenya based on their choice behaviour;
o Park branding offers value to targeted and unique market segments. In
this regards, there is need that the destination marketers design,
package and promote the brand effectively to meet the diverse needs of
these segments.
o The research findings were suggestive of the underlying fact that the
tourist product/experience is a consequence of the exact tourist need.
There is need thereof that tour operators are able to understand unique
personal needs of tourists
5.3.2. Conclusions based on Objective Two: To examine antecedent
factors influencing tourists’ choice behaviour;
o There is also need for tourism stakeholders to apply a targeted park
brand communication policy to the targeted segments and to adopt
different pricing, image, character, personality, communication and
distribution to the segment.
184
o There is need for the government to enhance future cross-sectoral
interlinkages and adopting strategic partnerships (PPPs) in product
development between the travel trade, suppliers, local communities
and the park brand management agency (KWS) through in-market
representation with the travel trade in advertising, trade-fairs and
media etc.
o The state of roads and tourism infrastructure should be similarly
enhanced as a matter of strategic development priority within the park
as it enhances the park‟s access to key attractions. Accessibility was
deemed as a significant factor in determining choice.
o Accommodation quality is key to the park brand and needs to similarly
enhanced within and outside the park through stakeholder consultation
and support. Such support can be enhanced through partnership
arrangements such as Design, Build, Finance, Operate (DBFO); Build
Own Operate (BOO); Build, Operate, Transfer (BOT).
o There is need to enhance the park‟s online brand proposition as well as
differentiate the brand offering to enhance the value of the brand in the
market. The online brand needs to focus more on peer-to-peer online
recommendations by tour operators and travel agents through you tube
video reviews, facebook friend reviews and news article reviews
o The implementation of the tourism infrastructure development strategy
depends on the partnership between public sector investment
(especially in physical infrastructure development) and private sector
investment (especially in tourism infrastructure development.
185
5.3.3. Conclusions based on Objective Three: To Evaluate tourists’
perceptions of park brands in Kenya and their choice behaviour;
o The study findings point out that tourists are becoming more
experiential and personal in their tourism choices, making them more
critical, independent and more determined to achieve their ideal
holiday needs. Individualism and perception may significantly account
for the growing need for unique experiences and park brand
personalities that generate them.
o On overall, external brand perception was deemed to significantly
influence choice behavior of tourists. Therefore, there was need to
ensure that the park brand perception and image is well enhanced.
o There is need for KWS to communicate high value to the client
through a local storyline. The essence of the park brand needs to be
identified, felt and perceived positively from the initial contact with the
tourist thoughout the holiday to the departure of the tourist. The park
brand should help create a sense of feel (affect and emotions); think
(creativity and cognition); act (individual actions and lifestyle) and
relations (connection with a reference group or culture).
5.3.4. Conclusions based on Objective Four: To Explore the influence of
brand personalities on choice behaviour of tourists to Kenyan parks
o The park brand‟s personality and (or) uniqueness be revealed better
through marketing concepts that are linked to historical, ecological,
socio-cultural values of the park and the adjacent communities. In this
way, the park‟s brand personality could positively influence choice
behavior of targeted market segments.
186
It is therefore important for the tourism stakeholders to enhance the efficacy of park
brands by assessing and developing seven main aspects of the park brand. These
include brand communication, packaging, experience, personality, design, perception
and partnerships at the destination level.
5.4. Recommendations to policy/ practice
The study findings showed distinct market segments in each of the parks based
on demographic and geographic attributes. The park brand communications
ought to be focused on specific market segments. Therefore there is need that
the park authorities (KWS) identify, anticipate and respond to the needs of
these varied segments;
There is need for KWS and KTB to focus more on promoting emotional
branding which emphasizes on how the brand personality should be
communicated through emotional appeals;
There is need for KWS and KTB to enhance park brand perception by
connecting more with the tourist segments through brand story-telling and
communication;
There is need for KWS and KTB to identify the light-house function of park
brands and focus on creating a striking profile of the park brands aimed at
differentiating identities of the parks in terms of color schemes, story-lines,
identities, symbols and value addition;
There is for KWS and KTB need to integrate regular brand audits from a
market perspective as a matter of policy so as to ensure proper brand
management;

187
There is need for KWS and KTB to engage more and endorse celebrities,
targeted media houses, counties, city and national co-brands positively within
marketing and investment promotion endeavors to improve on the image of
the park brands;
There is need for KWS and KTB to create more linkages with other
stakeholders such as the KTB, local communities, Export promotion council
and BrandKenya to create and develop coherent and lived impressions of these
parks in foreign markets, therefore influencing the brand perceptions and
choices of tourists;
There is need for KWS and KTB to improve each of the park‟s brand
communications. There is a need to focus on WOM (word of mouth) as well
as family and friend referrals from the distribution channels as well as online
referrals through social media;
The park branding process ought to focus more on the experiences since in
some parks, the park brand perception did not influence loyalty,
recommendation and (or) differentiation behavioral intentions of tourists;
There is need for KWS and KTB to enhance each of the park‟s brand
personalities by developing distinctive promotional campaigns aimed at
emphasizing on the distinctive park brand personalities in a sense
communicating excitement, sincerity and conviviality;
There is need for KWS and KTB to understand that park brands are operate
essentially on the promise of a unique experience and tourists choose a park
brand over another with the expectations of an elevated experience. There is
need that KWS to focus customer service initiatives towards providing
exceptional services
188
The success of any tourism park brand is dependent to a large degree on the
nature of the facilities and services infrastructure that are available to the
tourist. There is need to focus attention on innovative technologies that would
improve tourism infrastructure substantially over competition.
5.5. Recommendations for further research
There is need for the study to be replicated to all the branded parks in Kenya
so as to identify unique opportunities and challenges;
There is need to further assess the influence of country-of-origin and cultural
biases / perceptions of the destination brand on choice behavior of various
segments of tourists;
It is also important to assess the efficacy of the online and social media in
influencing the overall perception of the destination brand as well as choice
behavior of tourists;
There is need to assess emerging and new methodologies and epistemologies
in investigating park brand preference;
There is need to adopt a collaborative strategy with tour operators and travel
agents to sell the park brand effectively to the markets.

189
6.0 REFERENCES
Aaker, D.A. (1991). Managing brand equity: Capitalizing on the value of a brand
name. New York: The Free Press.
Aaker, D.A (1996) Building strong brands, New York: The Free Press.
Aaker, J.L. (1997) Dimensions of brand personality. Journal of Marketing Research,
34: 347-356.
African Horizons (2013) Tour and Travel Kenyan Map, African Horizons. Retrieved
from http://www.african-horizons.com
Ajzen, I and Fishbein, M (1980) Belief, attitude, intention, and behavior: An
introduction to theory and research. Reading, MA: Addison-Wesley
Ajzen, I. (1998) Attitudes, Personality and Behaviour Chicago. Illinois: The Dorsey
Press.
Akama, J., Maingi, S. and Camargo, B (2011) Wildlife Conservation, Safari tourism
and the role of tourism certification in Kenya: A Postcolonial Critique. TRR
36 (3) of 2011.
Alba and Chattopadhya (1986) Salience Effects in Brand Recall, Journal of
Marketing Research, 23, 363-9.
Albright and Park (2006) Confirmatory Factor Analysis using Amos, LISREL, Mplus,
SAS/STAT CALIS* Working Paper. The University Information Technology
Services (UITS) Centre for Statistical and Mathematical Computing,
Indiana University.
Alegre, J. and Pou, L. (2006) The length of stay in the demand for tourism, Tourism
Management, Vol 27, No.6, pp 1343-1355
Amante-Helwey (1996) Ecotourists beliefs and knowledge about dolphins and the
development of ostaceen ecotourism, Aquatic mammals, 22 (2), 131-140.
Anderson, J. and Gerbing, D (1988) Structural Equation Modelling in Practice: A
Review and Recommended Two-Step Approach. Psychological Bulletin
1988, Vol 103, No. 3, 411-423
Andreasson, L and Streling, B (2007) Brand Personality: Offline and Online. Lurea
University of technology.
Andreu, L., Kozac, M., Avci, N. and Cifter, N. (2005) Market segmentation by
motivations to travel: British tourists visiting Turkey. Journal of Travel and
Tourism Marketing, 19(1), 1-14.
190
Andrews, R.L., and Currim, I.S. (2003) Recovering and profiling the true
segmentation structure in markets: an empirical investigation. Int J Res
Mark 20(2):177–192.
Anholt, S. (2007) Competitive identity: The new Brand Management for Nations,
Cities and Regions. Palgrave Macmillan, Basingstoke.
Arabie, P and Hubert, L.J. (1994) Cluster analysis in marketing research. In: Bagozzi
RP (ed) Advanced methods in marketing research. Blackwell, Cambridge,
pp 160–189
Arva, L., and Deli-Gray, Z.S. (2013) New Types of Tourism and Tourism marketing in
the post-industrial world, Applied studies in Agribusiness and Commerce –
APSTRACT Agroinform Publishing House, Budapest.
Ashworth, G. and Godall, B. (1988) Marketing in the tourism industry: The
promotion of Destination Regions. Beckenham: Croom Helm.
Ashworth, G.J., Voogt, H (2004) Selling the City: Marketing Approaches in public
Sector Urban planning, London: Bellhaven Press.
Ashworth, J. and Lakham, M. (1994) A Heritage for Europe: the need, the task, the
contribution. London: Routeledge.
Austin, J.R., Siguaw, J.A. and Mattila, A.S (2003) A re-examination of the
generalizability of the Aaker Brand Personality Measurement Framework,
Journal of Strategic Marketing,Vol. 11 No. 2, pp. 77-92.
Azoulay, A and Kapferer, J.N. (2003) Do brand personality scales really measure
brand personality? J. Brand Management 11(2) 143-155.
Bagozzi, R.P. (1980) Causal Models in Marketing, John Wiley and Sons, New York,
NY.
Bagozzi, Richard, P., Youjane, Y. and Lynn, W (1991) Assessing Construct Validity
in Organizational Research. Administrative Science Quarterly (36:3),
September 1991, pp. 421-458
Baker, D.A. and Crompton,J.L (2000) Quality, Satisfaction and Behavioural
Intentions, Annals of Tourism Research, Vol. 27, pp.785-804.
Balakrishnan, M., Nekhili, R. and Lewis, C. (2011) Destination brand components.
International Journal of Culture, Tourism and Hospitality Research. Vol. 5,
No. 1, pp. 4-25.
Balakrishnan, M.S. (2008) Dubai – A star in the east: A case study in strategic
destination branding. Journal of Place Management and Development Vol.
1, No. 1, 2008.

191
Balmford,A., Beresford, J., Green, J., Naidoo, R., and Walpole, M (2009) A Global
perspective on trends in Nature-based tourism. PLoS Biol 7(6): e1000144.
Baloglu, S and Kozak, M. (2010) A Model of Destination Image Formation. Annals of
Tourism Research 26(4): 868-897.
Barnes, J., Burgess, J. and Pearce, D (1992) Wildlife tourism. In: Swanson, Barbier,
(Eds.), Economics for the Wilds. Earthscan, London, pp. 136 – 151
Belk, S (1988) Branding places: Applying brand personality concept to cities.
European Journal of Marketing. Vol, 44 No. 9/10, 2010 pp. 1284-1304.
Berry,L.L (2000) Relationship marketing. In Berry, G. L. Shostack, and G. Upah.
(Eds.), Emerging Perspectives on Services Marketing (pp. 25-28).
American Marketing Association.
Biel, J (1995) How brand mage drives brand equity. 4th
annual ARF Advertising and
Promotion Workshop, in: Exploring brand equity and advertising.
Hillsdale, NJ: Lawrence Erlbaum Associates 1993 pp. 113-124
Blain, C., Levy, S and Richie, J.R.B. (2005) Destination Branding: Insights and
Practices from Destination Management Organizations Journal of Travel
Research May 2005 vol. 43 no. 4
Blain, C.R. (2001) Destination Branding in Destination Marketing Organizations.
University of Calgary
Blender,O., Schumacher, K.P and Stein, D. (2007) Landscapes, Seasonality and
Tourism: A Survey with examples from Central Europe. H. Palang, H.
Sooväli and A. Printsmann (eds.), Seasonal Landscapes, 181–213. 2007-
Springer.
Bollen, K.A. and Long, J.S. (1993) Testing structural equations models. Newbury
Park , CA: Sage
Boniface, B. and Cooper, C (2009) Worldwide destinations: The geography of travel
and tourism. 5th
edition, Butterworth – Heinnemann, UK.
Botha, J and Ankomah, S. (1993) Developing a revised competitive position for
Sun/Lost City, South Africa Journal of Travel Research, 37,341-352.
Brand. (n.d.) The American Heritage® Dictionary of the English Language, Fourth
Edition. (2003). Retrieved June 9 2014 from
http://www.thefreedictionary.com/brand
Braun, T. (2004) The Philosophy of Branding: Great philosophers think brands.
Kogan Page, London and Sterling VA.
192
Bresler, N.C. (2001) The experiences of tourists on privately owned game lodges and
reserves in Mpumalanga and the Northern Province. Faculty of Economic
and Management Science, Rand Afrikaans University.
Brown, T.A (2006) Confirmatory Factor Analysis for Applied Research. New York:
Guilford Press.
Bryman, A. (2004) Social Research Methods (2nd
edition) Oxford: Oxford University
Press, UK.
Bryne, B.M. (2001) Structural equations modelling with AMOS: Basic concepts,
applications and Programming. Lawrence Erlbaum Associates: London.
Buckley, P.J. and Papadopolous, S.I. (1986) Marketing Greek tourism: the planning
process. Tourism Management. 7(2): 86-100.
Buhalis, D. (2000) Marketing the Competitive Destination of the future. Tourism
Management 21, (2000) pp. 97 – 116.
Buhalis, D. (2006) Tourism Management dynamics, trends, management and tools,
Elservier Butterworth-Heinemann
Buhalis, D. and Diemezi, R. (2004) eTourism developments in Greece: Information
Communication Technologies adoption for the strategic management of the
Greek tourism industry. Tourism and Hospitality Research. Vol. 5 No. 2
Bulmer, S. and Buchanan-Oliver, M. (2006) Experiences of brands and national
identity. Australasian Marketing Journal 18 (4), 199-205
Business week (2010) National Geographic to market Uganda Tourism East African
Business week.
Cai, A.L. (2002) Cooperative branding for rural destinations, Annals of Tourism
Research, Vol. 29, No.3, pp.720 – 742
Cameron, C.M. and Gatewood, J.B. (2000) Excursions into the Un-Remembered Past:
What People Want from Visits to Historic Sites. The Public Historian
22(3): 107-127
Chavez, D. (2013) Travel and Tourism Trends. USDA Forest Service.
Chrishnall, J. (1995) Consumer Behaviour 3rd Edition. McGraw-Hill Co.
Churchill, G.A (1996) Basic marketing research, 3rd
edition. New York: The Dryden
Press – Harcourt Brace College Publishers.
Clarke, J. (2000) „Tourism brands: An exploratory study of the brands box model‟,
Journal of Vacation Marketing, Vol. 6, No. 4, pp. 329–345.
193
Cohen, E. (1972) Towards a sociology of international tourism. Social Research, 39
(1), 164-182
Cohen, L., Manion, L., and Morrison, K. (2004) Research Methods in Education.
McGraw Hill. Fifth Edition.
Conen, L., Manion, L., and Morrison, K. (2000) Research Methods in Education (5 th
Ed.) London:Sage Publications.
Conrady, R. and Buck, M. (2010) Trends and Issues in Global Tourism 2010,
Springer Heidelberg Dordrecht London New York
Cooper, C., Fletcher, J., Gilbert, D., Shepherd, W. (1998) Tourism Principles and
Practice, London, Addison Wesley Longman.
Cooper, D.R. and Schindler, P.S. (2003) Business Research Methods (8th
edition).
USA: McGraw-Hill.
Cooper, P. (1989) Comparison between the US and UK: the qualitative dimensions.
Journal of Marketing Research Society, Vol. 31, No. 4, pp 509-520.
Creswell, J.W. (2003) Research design: qualitative, quantitative, and mixed methods
approaches. (2nd Edition.). London: Sage Publications.
Crompton, J.L., Botha, C. and Ankomah, P.K. (1993) „Choice Set Propositions in
Destination Decisions,‟ Annals of Tourism Research, 20(3), 461–476.
Cronbach, L.J. and Meehl, P.E. (1955) Construct validity in psychological tests.
Psychological Bulletin, 52, 281 – 302
Crotty, D. (1988) The foundations of social research: meaning and perspective in the
research process. St Leonards: Allen and Unwin Pty Ltd.
Crouch, D. (2004) Tourist Practices and Performances. In A. Lew, C. M. Hall and M.
Williams (Eds.), A Companion to Tourism (pp. 85-96). Oxford: Blackwell
Publishing Ltd.
Costa, M. (2011) "Heading east? (Difficulties experienced by UK marketers and
brand managers when translating the growth of the Chinese economy into
opportunities for their brands)", Strategic Direction, Vol. 27 Iss: 9.
Curtin, S. (2010) Managing the Wildlife Tourism Experience: The Importance of
Tour Leaders, International Journal of Tourism Research 12, 219-236.
Curtis, J. (2001) Branding a State: the evolution of Brand Oregon. Journal of
Vacation Marketing. 7(1):75-81.
D‟Hauteserre, A.M. (2001) Destination branding in a hostile environment. Journal of
Travel Research, 39 (Feb.): 300-307

194
Dash, N.K. (2013) Selection of the research paradigm and methodology. Manchester
metropolitan society. Assesed through
http://www.celt.mmu.ac.uk/researchmethods/Modules/Selection_of_metho
dology/
Davenport, L., Brockelman, W.Y., Wright, P.C., Ruf, K., and Fernando (2002)
Ecotourism Tools for Parks. In: Terborgh J, van Schaik C, Davenport L,
Rao M, eds. Making parks work. Washington (D.C.): Island Press. pp 279–
306.
Dayal, V. (1998) Any as inherently modal.Linguistics and Philosophy 21, 433–476
de Chernatony and McDonald (1992) Creating powerful brands, Butterworth
Heinemann, Oxford In Cooper, C., Fletcher, J., Gilbert, D. and Wanhill, S.
(1998) Tourism: Principles and practice. 2nd
Ed. Prentice Hall
Deutsh, M. and Gerard, H.B. (1955) A Study of the normative and informational
influence upon individual judgement. Journal of Abnormal and Social
Psychology, Vol. 51, November, pp. 629-636.
Devine, F., Baum, T. and Hearns, N. (2009) Cultural awareness for Hospitality and
Tourism, Hospitality, Leisure, Sport and Tourism, April 2009.
Dinnie, K. (2008) Nation Branding: Concepts, Issues, Practice. Butterworth-
Heinneman, Oxford.
Dobree, J. and Page, A.S. (1990) Unleashing the power of service brands in the
1990s, Management Decision, Vol. 28, pp 14-28.
Dolich, I.J. (1969) Congruence relationship between self image and product brands,
Journal of Marketing Research, Vol. 6, pp. 80-84.
Eagles, P.F.J (2002) Tourism in National parks and protected areas: Planning and
Management. CABI Publishing.
Eagles, P.F.J (2010) Trends in Park Tourism: Economics, Finance and Management,
Journal of Sustainable Tourism. Vol. 10, No.2, 2002
Eagles, P.F.J. and Higgins, B.R. (1998) . Ecotourism Market and Industry Structure.
Pages 11–43 in Kreg Lindberg, Megan Epler-Wood and David Engeldrum
(eds.), Ecotourism: A Guide for Planners and Managers, 2nd ed. North
Bennington, Vermont,United States of America: The Ecotourism Societ
Echtermeyer, M. (2006) Brands as Destinations – The New Tourism Objective for
Chinese Tourists. ITB 2006.
Echtner, C.M. and Ritchie, J.R. (1991) The meaning and measurement of Destination
image. Journal of Tourism Studies 2(2):2-12.
195
Echtner, C.M. and Ritchie, J.R. (1993) The Measurement of Destination Image: An
Empirical Assessment. Journal of Travel Research, spring: 3-13.
Erdem, T. and Keane, M. (1996) Decision-making under uncertainty: Capturing
dynamic brand choice processes in turbulent consumer goods markets.
Marketing Sci. 15 1-20.
Erdem, T. and Swait, J. (1998) Brand equity as a signaling phenomenon. Journal of
Consumer Psychology, 7(2): 131-157.
Euro monitor International (2010) Tourism attractions market research. Euromonitor
International Retrieved through http://www.euromonitor.com/tourist-
attractions
Evangelista, F. and Dioko, L.A.N. (2010) Interpersonal influence and destination
brand equity perceptions. International Journal of Culture, Tourism and
Hospitality Research. Vol. 5, No.3, 2010, pp. 316-328.
Evans, J., and Berman, B. (2005). Marketing, 9e: Marketing in the 21st century.
Cincinnati, OH: Atomic Dog Publishing.
Fennell, D.A. (1999). Ecotourism: An Introduction. New York: Routledge.
Fienberg, S.E. (2003) Notes on Cluster Sampling for Statistics 36-303: Sampling,
Surveys and Society. Spring 2003, Carnegie Mellon University.
Fishbein, M. (2005) The influence of attitudes on behaviour. In Hudges, M, Ham, S,
and Brown, T. (2009) Influencing Park tourist Behaviour: A Belief-based
Approach Journal of Park and Recreation Administration Volume 27, 4 pp.
38-53.
Foley, A. and Fahy, J. (2003) Incongruity between expression and experience: The
role of imagery in supporting the positioning of a tourism destination brand.
Brand Management, Vol 11, No. 3, 209-217.
Fournier, S. (1994) Consumer-brand relationship framework for Strategic Brand
Management, University of Florida
Fournier, S. (1998) Consumers and their brands: Developing relationship theory in
Consumer research, Journal of Consumer Research Vol 24, March 1998,pp.
343 – 374. In Sheth and Mittal (2004) Consumer Behaviour: A Managerial
Perspective. Thomson Learning – Southern Western.
Fournier, S., Solomon, M.R. and Englis, B. (2008) “When Brands Resonate,” in
Handbook on Brand and Experience Management, Schmitt, B.H. and D.L.
Rogers (eds.), Cheltenham, UK and Northampton, MA, USA: Edward
Elgar, 35-57.

196
Franzen, G and Bouwan, M. (2001) The Mental World of Brands. World Advertising
Research Centre (WARC). Assessed through http://www.warc.com
Gartner, W. and Lime, D. (2000) Trends in Outdoor Recreation, Leisure and Tourism.
London: CABI
Gartner, W.C. (1989) Tourism image: attribute measurement of state tourism products
using multidimensional scaling techniques. Journal of Travel Research,
Vol. 28, No. 2, pp.1620. In Echtner, C. and Ritchie, B. (2003) The meaning
and measurement of destination image. Journal of Tourism Studies, Vol.
14, No. 1, pp.3748.
Gilmore, F. (2002) A Country – Can it be repositioned? Spain – The success story of
country branding, Brand Management Vol. 9, No. 4 – 5, pp. 281 - 293
Giraldi, J.M.E and Ikeda, A.A. (2010) Personal values dimensions: A Study on
Brazilian executives. Lat. Am. Bus. Rev, 9: 169-187
Giraldi, J.M.E and Ikeda, A.A. (2013) How consumers‟ diverse personal values
influence the County-of-Origin effect. The New Cultures of Foods.
Glasson, J., Godfey, K. and Goodey, B. (1995) Towards tourist impact management:
Tourist impacts, Carrying capacity and management responses in Europe‟s
historic towns and cities. Aldershot: Avebury.
Gnoth, J. (1997) Tourism motivation and expectation formation. Annals of Tourism
Research, Vol. 24, No. 2, pp 283-304
Gnoth, J. (2002) Leveraging export brands through a tourism destination brand.
Journal of Brand Management, Vol. 9, No. 4-5, pp.262 – 280.
Goeldner, C.R. and Ritchie, J.R.B. (2012) Tourism Principles, Practices and
Philosophies. 12th
edition John Wiley and Sons Inc.
GoK (1957) Report of the 1956 Game Policy Committee. Sessional Paper, No 7.
Nairobi, Government Printer.
GoK (2006a) Ministry of Tourism and Wildlife National Tourism Policy, Nairobi,
Government Printer.
GoK (2006) Statistical analysis of Tourism trends (Globally and locally). Central
planning Unit, Ministry of Tourism and Wildlife, Government of Kenya
printers.
GoK (2007) Vision 2030 report. Government of Kenya printers.
GoK (2008a) Kenya Economic survey. Central bureau of statistics. Government of
Kenya printers.
197
GoK (2008b) Ministry of Tourism. Medium Term Plan (2008-2012) Tourism Sector
Report. Government of Kenya Printers.
GoK (2008c) Mt. Kenya Tourism Circuit Guide (2013-2014). Georeferencing
consortium
GoK (2009a) Kenya Economic survey. Central bureau of statistics. Government of
Kenya printers.
GoK (2009b) National reporting framework of indicators: The Vision 2030 first
Medium-term Plan. Ministry of State for Planning, National Development
and Vision 2030 (Monitoring and Evaluation Directorate), Government of
Kenya printers.
GoK (2011) Trade, Tourism and Industry Sector: Sector report for the Medium Term
Expenditure Framework 2011/12 – 2013/14),Government of Kenya
printers.
GoK (2012) Third Annual Progress Report 2010 – 2011 on the implementation of the
first Medium Term Plan (2008-2012). Ministry of State for Planning,
National Development and Vision 2030 (Monitoring and Evaluation
Directorate), Government of Kenya printers.
GoK (2013) National Tourism Strategy (2013 - 2018), Department of Tourism,
Ministry of East Africa, Commerce and Tourism Retrieved from
http://www.tourism.go.ke/ministry.nsf/pages/download_centre
Goodwin, H. (1996) In pursuit of ecotourism, Biodiversity and Conservation, 5: 277-
292.
Goossens, C. (1998) „Tourism Information and Pleasure Motivation‟, Annals of
Tourism Research 25: 301–20.
Gordon, G.I., Calantone, R.J., and Di Benetto, C.A. (1993). Brand equity in the
business-to-business sector: An exploratory study. Journal of Product and
Brand Management, 2 (3), 4-16.
Graburn, N.H. (1989) Tourism: the sacred journey. In Hosts and Guests: The
Anthropology of Tourism, 2nd
edn, Smith V (ed.). University of
Pennyslavania Press: Philadelphia: 21-36
Grassl, J. (1999) The Reality of Brands: Toward an Ontology of Marketing. The
American Journal of Economics and Sociology, 58:1-12.
Green, M.J.B. and Paine, J. (1997) State of the World‟s protected areas at the end of
the twentieth century. Paper presented at the IUCN World Commission on
Protected Areas Symposium on “Protected Areas in the 21st century: From
Islands to Networks” Albany, Australia, 24th
– 29th
November 1997.

198
Gronow, J. and Southerton, D. (2010) Leisure and Consumption in Europe.
Handbook of European Societies. Springer Science and Business Media.
Grubb, E.L. and Grathwohl, H.L. (1967) Consumer self-concept and significant
others", Journal of Marketing Research, Vol. 8, pp. 382-385.
Gunelius, S. (2013) Brand research fundamentals: Brand perception and Equity.
Accessed through http://aytm.com/blog/research-junction/brand-research-
fundamentals-brand-perception-and-equity/
Gunn, C. (1972) Vacationscape: Designing tourist regions. 2nd
Edition. Van Nostrand
Reinhold, New York.
Gunn, C. (1988) Tourism Planning. New York: Taylor and Francis
Guzman, T.L. (2012) Gastronomy, Tourism and Destination differentiation: A case
study of Spain. Review of Economics and Finance
Haider, W. and Ewing, G.O. (1990) A model of tourist choices of Hypothetical
Caribbean Destinations. Leisure sciences 12 (1): 33-47.
Hall, C.M. (2000) Tourism Planning: Policies, processes, relationships. UK: Prentice
Hall.
Hall, C.M. (2004) Branding and national identity: the case of Central and Eastern
Europe, in Morgan, N., Pritchard, A., and Pride, R. (Eds.) (2002),
Destination Branding: Creating the unique destination proposition,
Butterworth Heinemann, Oxford UK
Hall, C.M. (2005) Branding Britain, Journal of Vacation Marketing ,Vol. 10 , No. 2 ,
pp. 171 – 185
Hall, C.M. (2008) Tourism and Climate Change: Knowledge Gaps and Issues.
Tourism Recreation Research 33(3): 339–350
Hanby, T. (1999), „Brands dead or alive‟, Journal of Market Research Society, 41 (1):
7 –19
Hankinson, G. (2004) Relational network brands: Towards a conceptual model of
place brands Journal of Travel Marketing 10(2) pp 109-121
Hanna, S. and Rowley, J. (2007) Place Branding and Public Diplomacy: An analysis
of terminology use in place branding. Palgrave Macmillan Ltd. Vol.4, 1,
61-75
Hanzee, K.H., and Saeedi, H. (2011) A Model of Destination Branding for Isfan City:
Integrating the Concepts of the Branding and Destination Image.
Interdisciplinary Journal of Research in Business Vol 1, Issue 4 April 2011
(pp. 12-28)
199
Hassan, S.S. and Hamid, M.S. (2011) Integrating Product and Corporate Brand Equity
into Total Brand Equity Measurement. International Journal of Marketing
Studies. Volume 3, No. 1, 2011.
Hawkins, D. and Mothersbaugh, D. (2010) Consumer Behaviour: Building marketing
strategy. 11th
Edition. McGraw Hill, Irwin.
Heath, S. (2007) Widening the Gap: Pre University Gap Years and the „Economy of
experience‟. British Journal of Sociology of Education 28(1): 89–103
Heding, T., Knudzen, C.F., and Bjerre, M. (2009) Brand management: Research,
theory and practice. 1st edition. Routledge / Taylor and Francis Group.
Hofstede, G. (2001) Culture‟s Consequences: Comparing Values, Behaviors,
Institutions, and Organizations across Nations. Second edition, Sage:
Thousand Oaks (CA).
Holt, D.B. (2004) How brands become icons. Boston: Harvard Business School Press.
Hosany, S., Ekinci, Y. and Uysal, M. (2006) “Destination image and destination
personality: An application of brand theories to tourism places”, Journal of
Business Research, Vol. 59 No. 5, pp. 638-42
Howard, J.A. and Sheth, J.N. (2010) Decision-making process of consumers. Taylor
and Francis.
Hudges, M., Ham, S.H. and Brown, T (2009) Influencing Park tourist Behaviour: A
Belief-based Approach Journal of Park and Recreation Administration
Volume 27, 4 pp. 38-53.
Hunt, J.D. (1975) Image as a Factor in Tourism Development. Journal of Travel
Research 13(winter): 1-7.
Huybers, T., and Bennet, J. (2000) Impact of the Environment on Holiday Destination
Choices of Prospective UK Tourists: Implications for Tropical North
Queensland, Journal of Tourism Economics 6(1):21-46. In Huybers, T.
(2004), Destination Choice modelling –To label or not to label, Market
Survey Centre, Sydney.
Iliachenko, E.Y. (2005) Exploring culture, history and nature as tourist destination
branding constructs: The case of a peripheral region in Sweden. Paper
presented at the 14th Nordic Tourism and Hospitality Research Conference,
Akureyri, Iceland.
ITB (2012) ITB World Travel Trends Report 2012/2013. IPK International, Berlin,
Germany.
IUCN (1994) Guidelines for Protected Area Management Categories. IUCN, Gland,
Switzerland and Cambridge, UK. As cited in Eagles, P, McCool, S and

200
Haynes, C. (2011) Sustainable Tourism in Protected Areas: Guidelines for
Planning and Management. Best practice Protected areas guidelines Series
No. 8. World Commission on Protected Areas (WCPA)
Ivana, F. (2009) Brand Meaning and its Creation in a Cross-Cultural Context.
University of St. Gallen.
Jackson, S.E. (2001) Top management and innovation in banking. Does the
composition of the top team Rutgers, University New Brunswick
Jacob, G.R. and Shreyer, R (1980) Conflict in outdoor recreation: A theoretical
perspective. Journal of Leisure Research 12, 368-380.
James, L.R., Mulaik, S.A., & Brett, N., Sherri, L., and Dean, S.C. (1982) Evaluation
of Goodness-of-fit indices for structural equation models. Psychological
Bulletin, Vol 105(3), May 1989, 430-445.
JICA, (1997) Kenya‟s Tourism Master Plan (1997-2002). JICA
Johnson, C. and Devonish, D. (2008) “Does Nationality, Gender and Age Affect
Travel Motivation? A Case of Tourists to the Caribbean Island of
Barbados”, Journal of Travel and Tourism Marketing, 25 (3), pp. 398-408.
Jolugu, U.D. and Pansiri, J. (2011) Mixed methods: A research design for
management doctoral dissertations. Management Research Review. Vol 34,
No. 6. Pp 687-701
Kahnemann, D. and Tversky, A. (1979) Prospect theory: An analysis of decision
under risk, Econometrica, 47 (2), 263-291.
Kahnemann, D. and Tversky, A. (1984) Choices, Values and Frames, American
Psychologist, 39, 341-350.
Kapferer, J.N. (1992) Strategic Brand Management. New York and London: Kogan
Page.
Kapferer, J.N. (1997) Strategic brand management, Kogan Page, Great Britain
Kapferer, J.N. (2004) Strategic Brand Management: New Approaches to Creating
and Evaluating Brand Equity. New York: The Free Press
Kaplan, M.D., Yurt, O., Guneri, B., Kurtulus, K. (2008) Branding places: Applying
brand personality concept to cities. European Journal of Marketing. Vol 44
No. 9/10, 2010
Kaplanidou, K. and Vogt, C. (2006) Destination branding: Concept and
measurement. Working paper, Michigan State University.
201
Kates, S.M. and Goh, C. (2003) “Brand Morphing: Implications for Advertising
Theory and Practice,” Journal of Advertising, 32 (1), 59-68.
Kavaratzis, M. (2004) From City marketing to city branding: Towards a theoretical
framework for developing city brands, Place Branding, Vol. 1, No. 1, pp.
58 - 73
Kavaratzis, M. and Ashworth, G. (2005) City Branding: An affective assertion of
identity or a transitory marketing trick, Tijdschrift voor Economische en
Sociale Geograie Vol. 96, No. 5, pp. 506 - 614
Keller, K.L. (1993) Conceptualizing, measuring and managing customer based Brand-
equity, Journal of Marketing, 57 (1), 1-22.
Keller, K.L. (2003) “Brand Synthesis: The Multidimensionality of Brand
Knowledge”, Journal of Consumer Research, vol.29, March, pp.595-600.
Kipngetich, J (2012) Laying the foundation for Conservation of Kenya‟s Natural
Resources in the 21st Century. The George Wright Forum, vol. 29, no. 1,
pp. 30–38 (2012).
KNBS (2012) Kenya Facts and figures – 2012. Kenya National Bureau of Statistics
Kothari, C.R. (1999) Research Methodology: Methods and Techniques. Second
revised Edition. New Age International Publishers.
Kotler, P. (2000) Marketing Management. Millennium edition. Prentice Hall, NJ
Kotler, P. (2002) Marketing Management. 3rd
edition. Prentice-Hall.
Kotler, P. and Armstrong, G. (1991) Principles of Marketing, 18th
Edition. Prentice
Hall.
Kotler, P. and Barich, H. (1991) Marketing management: Analysis, Planning,
Implementation and Control, Englewood Cliffs, NJ: Prentice Hall 1991,
p.247
Kotler, P. and Gertner, D. (2002) “Country as brand, product, and beyond: A place
marketing and brand management perspective”, Journal of Brand
Management, Vol 9, No. 4-5, pp 249-261
Kozak, M. and Remmington, M. (1998) Tourist satisfaction with Mallorca, Spain, as
an off-season holiday destination, Journal of Travel Research, 38(3), pp.
260- 269
Kvale, S. (1996) Interviews: An Introduction to Qualitative Research Interviewing.
Thousand Oaks, CA: Sage.
KWS (2003) Aberdares National Park Profile, Kenya Wildlife Service
202
KWS (2010) Lake Nakuru National Park Profile. Kenya Wildlife Service.
KWS (2010b) The Nairobi National Park Profile. Kenya Wildlife Service.
Lacarte, M.P., Piazuelo, V.T. and Saso, C.E. (2013) The use of territorial brands to
stand out as a tourist destination. Universidad de Zaragoza. Esc. Univ. De
Estudios Empresariales de Huesca.
Laing, L. (1987) Building brand integrity. Laing Corp. Assessed through
http://laingbranding.com/
Leiper, N. (1995) Tourism Management. Collingwood, VIC: TAFE Publications.
Levy, S. (1959) Symbols for Sale Harvard Business Review, 37(4), 117–124.
Litteljohn, D. (2006) Destination branding: Differentiation and Synchronization.
Cultural Business Group, Caledonian Business School, Glasgow
Caledonian University.
Liu, Y. (1998) Prospect theory: Developments and Applications in Marketing.
Rutgers University. Fall 1998.
Lorenzi, R. (2013) Archeology: Pluto‟s Gate uncovered in Turkey. Discovery News as
at Mar 29, 2013 02:00 PM ET
Lusigi, W. (1978) Planning Human Activities in Protected Natural Ecosystems.
Ruggel. A.R.G. Gantner Verlag K.G.
Lynch, R. and Veal, A.J. (1996) Australian leisure. South Melbourne: Longman
Australia.
MacCallum, R.C. (1990) The need for alternative measures of fit in covariance
structure modelling. Multivariate behavioural research, 25, 157-162
MacCannell, D. (1976) The Tourist: A New Theory of the Leisure Class, Schocken
Books Inc., New York.
Mackay, K. and Vogt, C. (2012) Information technologies in everyday and vacation
contexts. Annals of Tourism Research, Vol 39, No.3 pp. 1380-1401, 2012
Maclnnis, D., Priester, J. and Park, C.W. (2009) Handbook of Brand relationships
Society of Consumer Psychology, USA.
Madansky, J. (2011) The Sample size calculator. The Analytical group. Assessed
through http://www.analyticalgroup.com
Maitland, R.A. (2006) City Tourism: National capital perspectives. CABI,
Oxfordshire, UK. Retrieved June 17th
, 2010.
203
Manyara, J (2011) Towards a sustainable tourism industry in East Africa: A study of
the challenges and opportunities for tourism development. United Nations
Economic Commission for Africa Sub-regional Office for East Africa
(SRO-EA).
Marino, S. (2010) The Strategic Dimension of Destination image. An analysis of the
French Riviera Image from the Italian Tourists‟ Perceptions. University of
Naples “Federicail”
Mathieson, A. and Wall, G. (1982) Tourism economic, physical and social impacts.
London: Longman: Singapore Publishers (Pte) Ltd
Mayo, E.J. and Javis, L. (1981) The Psychology of Leisure Travel: Effective
Marketing and Selling of Travel Services Boston: CBI Publishing Co., Inc.
Mayring, P. (2011) Designs for Qualitatively oriented research. Journal of
Psychologie. Vol 15, Issue2,4. Assessed through http://www.journal-fuer-
psychologie.de/jfp-2-2007-4.html
McCracken, G. (1988) The long interview. Newbury Park, CA: Sage.
McEnally, M. and de Chernatony, L. (1999) The Evolving Nature of Branding:
Consumer and Managerial Considerations. Academy of Marketing Science
Review. 1999, 1.
McGuiggan, R.L. (2000) The Myers–Briggs type indicator and leisure attribute
preference. In: A. G. Woodside, G. I. Crouch, J. A. Mazanec, M.
Oppermann and M. Y. Sakai (Eds), Consumer psychology of tourism,
hospitality and leisure(pp. 245–267). Cambridge, UK: CABI Publishing.
Medlik, S. (2003) Dictionary of Travel, Tourism and Hospitality. 3rd
Edition.
Butterworth Heinemann.
Menezes, A., Moniz, A. and Vieira, J. (2008) The determinants of length of stay of
tourists in the Azores. Tourism Economics, 2008, 14 (1), 205-222.
Middleton, V.T.C. (1988) Marketing in travel and Tourism, Butterworth Heinmann,
Oxford, pp. 91
Middleton, V.T.C., and Clarke, J. (2001) The Dynamic Business environment:
Factors influencing demand for tourism, Oxford, Butterworth Hanumann.
Middleton, V.T.C., Ranchhod, A., Morgan, M. and Fyall, A. (2009) Marketing in
Travel and Tourism. Butterworth and Heinemann.
Mihalic, T. (2000) Environmental management of a tourist destination: a factor of
tourism competitiveness. Tourism Management, 21(1), 65-78.
204
Miles, M.B. and Huberman, A.M (2004) Qualitative data analysis: An expanded
sourcebook (2nd
ed). Thousand Oaks, CA: Sage
Min Han, C. (2000) "Testing the Role of Country Image in Consumer Choice
Behaviour", European Journal of Marketing, Vol. 24 Iss: 6, pp.24 – 40
Mok, C. and Iverson, T.J. (2000) „Expenditure-based segmentation: Taiwanese
tourists to Guam‟, Tourism Management, Vol 21, pp 299–305.
Mooi, E. and Sarstedt, M. (2011) A Concise Guide to Market Research. Springer-
Verlag Berlin Heidelberg.
Morgan, N.J. and Pritchard, A. (1998) Tourism Promotion and Power: Creating
Images, Creating Identities, Wiley, Chichester.
Morgan, N.J., Prichard, A. and Pride, R. (2004) Advertising in Tourism and Leisure,
Butterworth-Heinemann, Oxford, UK
Morley, C.L. (1994) Experimental destination choice analysis, Annals of Tourism
research 21 (4), 780-791. In Huybers, T. (2004), Destination Choice
modelling – To label or not to label, Market Survey Centre, Sydney.
Moscardo, G. (1996) Mindful tourists: heritage and tourism. Annals of Tourism
Research, Vol. 23 (2): 376- 397.
Mouton, J. (1996) Understanding social research. Pretoria JL van Schaik - Academic
Mugenda, O.M. and Mugenda, A.G. (1999) Research Methods: Quantitative and
Qualitative Approaches. African Centre for Technology Studies
Murphy, J.M. (1990) Brand Strategy. New York: Prentice Hall
Murphy, P.E. and Staples, W.A. (1979) A modernized family life cycle. Journal of
Consumer Research. 6: 12-22.
Nash, D. (1977) Tourism as a form of imperialism. Hosts and guests: The
anthropology of tourism. In V. Smith, ed. Pp 33-47. Oxford: Blackwell.
Neal, D., Wood, W. and Quinn, J.M. (2007) Habits: A Repeat Performance, Current
Directions in Psychological Science, 15 (4), 198–202
NESC (2013) Vision 2030 – An abridged version. National Economic and Social
Council.
O‟Leary, S. and Deegan, J. (2005) Ireland Image as a Tourism Destination in France:
Attribute Importance and Performance, Journal of Travel Research 43, No.
3, pp.247-260
205
Odunga, P and Maingi, S. (2011) The Wildlife Tourism Market to Kenya (2002-2003)
Journal of Travel and Tourism Marketing, 28:62–80, 2011. ISSN: 1054-
8408 print / 1540-7306 online
Odunga, P. (2003) Choice of attractions, Expenditure and Satisfaction of
International Tourists to Kenya. Wageningen Universiteit, Nederland.
ISBN: 90-8504-291-0
Odunga, P. (2010) Choice, expenditure and Satisfaction of International Tourists to
Kenya: A Structural Equation Modelling Approach. A Paper presented at
the Operations Research Society of East Africa Conference
Odunga, P. and Folmer, H. (2004) Profiling Tourists for Balanced Utilization of
Tourism based Resources in Kenya. FEEM Working Paper No. 23.2004.
Available at SSRN: http://ssrn.com/abstract=504443 or
http://dx.doi.org/10.2139/ssrn.504443
Odunga, P. and Maingi, S. (2008) Challenges to E-tourism Adoption in Kenya (A
LISREL Approach Advances in Tourism Economics pp. 60-79.
Okello, M.M., Seno, S.K. and Nthiga, R.W. (2009) Reconciling People‟s Livelihoods
and Environmental Conservation in the Rural Landscapes in Kenya:
Opportunities and Challenges in the Amboseli Landscapes. Natural
Resources Forum 33(2): 123–133
Olins, W. (2002) The Nation as a Brand, http://www.dba.org.uk/pdf/nation.pdf ,
(accessed 23/04/12)
Olins, W. (2003) Hull: Pioneering City Case Study, Available at www.wolff-
olins.com/files/Hull_0202New815000.pdf Assessed on 3rd
January 2012
Olsen, M.E., Lodwick, D.G. and Dunlop, R.E. (1992) Viewing the world ecologically.
San Francisco: Westview Press.
Ooi, C.S. (2001) Tourist historical products: Packaged pasts of Denmark and
Singapore. Scandinavian Journal of Hospitality and Tourism 1 (2), 113–32.
Oppewal, H., Huybers, T., and Crouch, G.I. (2010) How do tourists choose Holiday
destinations and experiences? Modelling Consumer choice. Sustainable
Tourism Cooperative Research Centre.
Parkerson, B. and Saunders, J. (2005) City Branding: Can Goods and Services
branding models be used to brand cities?, Place Branding, Vol. 1, No.3, pp.
242 - 264
Pease, W.R., Rowe, M., and Cooper, M. (2007) Information and Communications
Technologies in support of the Tourism Industry, IDEA Group Publishing.
206
Peter, J.P. and Olson, M.I. (2010) Consumer behaviour and marketing strategy. 9th
Edition. McGraw Hill Irwin.
Pike, S.D. (2002) Destination image analysis: A review of 142 papers from 1973 to
2000. Tourism Management 23 (5): 541 – 9.
Pike, S.D. (2005) Tourism destination branding complexity. Journal of Product and
Brand Management. 14(4): 258-9.
Pine, B.J. and Gilmore, J.H. (2000) The Experience Economy: Work is theatre and
every business a stage. Academic service, Boston.
Prayag, G. (2009) Brand image assessment: International tourists perceptions of Cape
Town. Marketing Intelligence and Planning. Vol. 28 No. 4, 2010
Punji, G and Steward, D.W. (1983) Cluster analysis in marketing research: review and
suggestions for application. J Mark Res 20(2):134–148
Raju, G.P. (2009) Tourism Marketing and Management. Manglam Publications, 2009.
Rathmun, R. (1995) Factors in User Group Conflict betweeb Hikers and Mountain
Bikers. Leisure Sciences 17: 159-169
Ritland, B. (2003) The role of design in Research: The Integrative Learning Design
Framework. Educational Researcher, Vol. 32, No. 1, pp. 21–24
Roes, D., Leader-Williams, N, and Dalal-Clayton, B. (1997) Take only photographs,
leave only footprints: The environmental impacts of Wildlife Tourism. IIED
Wildlife and Development Series No. 10, October 1997
Rojek, C. (1997) Leisure theory: Retrospect and Prospect. Society and Leisure, 20 (2).
Pp 383-399
Romano ET AL (2006) Appropriate statistics for ordinal level data: Should we be
really be using t-test and cohen‟s d for evaluating group differences on the
NSSE and other surveys? Florida Association of Institutional Research,
February 1 -3, 2006, Cocoa Beach, Florida
Rugg, G and Petre, M. (2007) A Gentle guide to Research Methods. McGraw Hill,
Open University Press.
Rundus, D. (1973) Negative effects of using list items as recall cues. Journal of
Verbal Learning and Verbal Behavior. 12, 43-50.
Saarinen, J. (1997) Tourist destinations and the production of touristic space: Lapland
as an ethnic landscape. Nordia 26:38–45.
Safariweb (2013) The Rhino Programme – Kenya Wildlife Service. Assessed through
http://www.kws.org/info/news/2013/12rhino2013.html
207
Saris, W.E. and Stronkhorst, L.E. (1984) Causal modeling in nonexperimental
research. Amsterdam: Sociometric Research Foundation
Sartre, J.P. (1946) The Humanism of existentialism. University of Rhode Island.
Assessed through http://www.uri.edu/personal/szunjic/philos/human.htm
Schwab, J. (2002). Multinomial logistic regression: Basic relationships and complete
problems. University of Texas. Retrieved from: -
http://www.utexas.edu/courses/schwab/sw388r7/SolvingProblems/
Schweiger, G. (2011) The Country of Origin effect in modern-day Marketing
Communication, NHH.
Searle, J.R. (1995) The Construction of Social Reality. New York: Free Press.
Sheth, J.N. and Mittal, B. (2004) Consumer Behaviour: A Managerial Perspective.
Thomson Learning – Southern Western.
Sheth, N. (2004) Models of buyer behaviour: Conceptual, Quantitative and
Empirical. In A theory of family buying decisions New York: Harper and
Row. Pp 17-33.
Shin, S., Misra, S. and Horsky, D. (2010) Disentangling Preferences and Learning in
Brand Choice Models, Simon School of Business, University of Rochester.
Simoes, C. and Dibb, S. (2001) Rethinking the brand concept: New brand orientation.
Corporate Communications: An International Journal 6 (4), 217-224
Simon, M. (2006) Dissertation and Scholarly Research: Recipes for Success. ubuque,
IA: Kendall Hunt Pub Co.
Sirgy, M.J. (1982) Self-concept in consumer behavior: a critical review, Journal of
Consumer Research, Vol. 9, pp. 287-300.
Sirgy, M.J. (1986) A social cognition model of consumer satisfaction/dissatisfaction.
Psychology and Marketing, 1(Summer): 27-44.
Sirgy, M.J. and Su, C. (2000) Using self-congruity and ideal congruity to predict
purchase motivation", Journal of Business Research, Vol. 13, pp. 195-206.
Sirikaya, E. and Woodside, A.J. (2005) Building and Testing Theories of Decision
Making by Travellers. Tourism Management, 26, pp. 815-832.
Small, J. (2008) The absence of childhood in tourism studies. Annals of Tourism
Research, 35, 772-789.
Solomon, L., Bamossey, G., Askegaard, S. & Hogg, M.K (2010) Consumer
Behaviour: A European Perspective. 3rd
edition. Prentice Hall, Financial
Times.
208
Sonmez, S. and Graefe, A. (1998) Determining future Travel Behaviour from Past
travel experience and perceptions of risk and safety. Journal of Travel
Research, 37(2):172 - 177
Spierkermann, M. (2007) Building reputation – Communicating identity and the place
branding process, Eitel – Berlin
Starkweather, D.J. and Moske, D.A. (2013) Multinomial Logistic Regression in
STATA. Prentice Hall.
Stevens, S.S. (1946) The theory of scales of measurement. Science, 103, 677-680.
Stylidis, D. Terzidou, M. and Terzidis, K. (2007) Islands and Destination Image: The
Case of Ios. Turismos, An International Multidisciplinary Journal of
Tourism. Volume 3, No. 1, Spring 2008, pp. 180-199
Tabachnick, B.G. and Fidell, L.S. (2001) Using Multivariate Statistics (4th ed.).
Boston: Allyn and Bacon.
TANAPA (2011) Park branding in Tanzanian parks. TANAPA.
Tapachai, N. and Waryszak, R. (2000) An Examination of the Role of Beneficial
Image in Tourist Destination Selection. Journal of Travel Research
39(August):37-44.
Tashakkori, A. and Teddlie, C. (2003) Mixed methodology: Combining qualitative
and Quantitative approaches, Sage, Thousand Oaks, CA.
Terreblanche, M. and Durrheim, K. (1999) Research in practice. Cape Town: UCT
Press.
Trappey, R.J. and Woodside, A.G. (2005) Brand Choice: Revealing Customers‟
Unconscious Automatic and Strategic Thinking Process. PALGRAVE
MACMILLAN Houndmills, Basingstoke, Hampshire
Travelsat (2013) Global TRAVELSAT benchmarking survey. Travelsat.
Travis, D. (2000) Emotional branding: how successful brands gain the irrational
edge. Roseville, CA: Prima Venture.
Trueman, M., Klemm, M. and Giroud, A. (2004) Can a city communicate? Bradford
as a corporate brand, Corporate Communications: An International Journal,
Vol. 9, No. 4, pp.317 – 330.
Tsitsou, R. and Ratten, V. (2010) Future research directions in tourism marketing.
Journal of Market Intelligence and Planning Vol.28 No. 4, 2010 pp 533-
544. Emerald Group Publishing Ltd. www.emeraldinsight.com/0263-
4503.htm
209
Tucker, H. and Akama, J. (2009) Tourism as Postcolonialism. In Jamal, T. and
Robinson, M. (Eds) The SAGE Handbook of Tourism Studies. Thousand
Oaks. SAGE: 504–520.
Udoto, P (2011) Tourists taken down memory lane. Habari Wildlife Magazine, 78th
Edition Nov-Dec 2011.
UNECA (2011) Draft IGAD - Sustainable Tourism Master Plan. Unpublished report,
United Nations Economic Commission on Africa
United Nations Division for Social Policy and Development (1998) Population
dynamics. UNDSPD
WTO (2005) Kenyan Statistical Database. World Trade Organization. Assessed
through:
http://stat.wto.org/CountryProfile/WSDBCountryPFView.aspx?Country=K
E&Language=E
UNWTO (2010) Handbook on Tourism Destination Branding. World Tourism
Organization and the European Tourism Commission.
UNWTO (2012) Worldwide Holiday costs barometer. United Nations World Tourism
Organization
Upshaw, S. (1995) Building brand identity, John Wiley and Sons, New York, NY,
pp.13, 134-139
Urry, J. (1990) The Tourist Gaze: Leisure and Travel in Contemporary Societies,
London: Sage.
Vieceli, J. and Sharp, B. (2001) The inhibiting effect of brand salience on recall.
Australasian Marketing Academy Conference Proceedings, Massey
University, Albny, Newzealand. (Downloaded from www.byronsharp.com)
Wadawi, J.K. (2008) An assessment of hotel product quality in Kenya as a basis for
building destination competitiveness. Published thesis. University of
Johannesburg.
WEF (2009) The Travel and Tourism Competitive Index Report (2008): Beyond the
downturn. World Economic Forum.
WEF (2013) The Travel and Tourism Competitive Index Report (2013): Beyond the
downturn. World Economic Forum.
Weiber, R. and Mühlhaus, D. (2010) AMOS, SmartPLS und SPSS. Springer,
Berlin/Heidelberg/New York)
White, J.E. (2013) Attracting younger tourists: “Parks change to attract and keep
younger tourists,” Judy Keen, USA Today, April 5, 2013. Accessed

210
through http://www.crosswalk.com/blogs/dr-james-emery-white/attracting-
younger-tourists.html
Williams, A.M. and Hall, C.M. (2002) Tourism, migration, circulation and mobility:
the contingencies of time and place. In: Hall C.M. and Williams A.M. ,
eds. Tourism and Migration: new relationships between production and
consumption. Dordrecht, Netherlands: Kluwer, 2002, pp.1-52.
Wood, L. (2000) Brands and brand equity: definition and management, Management
Decision, Vol. 38 Iss: 9, pp.662 - 669.
Woodside, A.G. and Lyonski, S. (1989) A general model of traveller destination.
Journal of Travel Research 27 (4): 8–14.
World Bank (2010) Kenya‟s Tourism: Polishing the Jewel. The World Bank.
World Economic Forum (2009) The Travel and Tourism Competitiveness Report,
2009: Managing in a time of turbulence. World Economic Forum. Assessed
through www.weforum.org
WTO (2005) Tourism trends and patterns. World Tourism Organization.
WTO (2010) A Handbook on Tourism Destination Branding. United Nations World
Tourism Organization and Economic Tourism Council
WTO (2012) Tourism trends and patterns. World Tourism Organization.
WTTC (2007) The global travel and tourism summit. London: World Travel and
Tourism Council.
WTTC (2010) Travel and Tourism Economic Impact (2010) – Kenya. WTTC
WWF (2013) African Rhino Poaching Crisis. WWF Global. Assessed through
http://wwf.panda.org/what_we_do/endangered_species/rhinoceros/african_r
hinos/poaching_crisis_african_rhinos/

211
APPENDIX 1: KWS PERMIT TO CONDUCT RESEARCH

212
APPENDIX 2: POST-VISIT TOURIST QUESTIONNAIRE
For the Researcher‟s use only
Respondent No: ___________
Date:____________________
Enumerator name _________
SECTION A: BACKGROUND INFORMATION
1. Age 16 – 24 Years 25 – 34 Years 35 – 44 Years
45 – 54 Years 55 – 64 Years > 64 Years
2. Sex Male Female
3. Annual personal income (US$) > 10000 US$ 10,001 - 30,000 US$
30,001 -60,000US$ 60,001 - 90,000 US$
< 90,001 US$
4. Marital Status Single Married Divorced
5. Country of Origin __________________________________
6. Are you travelling with Children? Yes No
If yes, indicate Number _______
7. Do you have a travel companion accompanying you in your vacation? Yes No
8. What is your highest level of education? PhD Level Masters
Undergraduate Degree Diploma
High School
9. Occupation Manager Other white collar occupation _____________________
Skilled manual State pensioner Self-employed
10. Duration of visit to Kenya One day Two days Three days
Four days Five days Six days
Seven days Eight plus days
11. Are you currently travelling in a group? Yes No If Yes, indicate no.______
12. Indicate your preferred mode of travel arrangement
On a packaged Tour To travel independently
13. Would you consider yourself as a wildlife enthusiast? Yes No
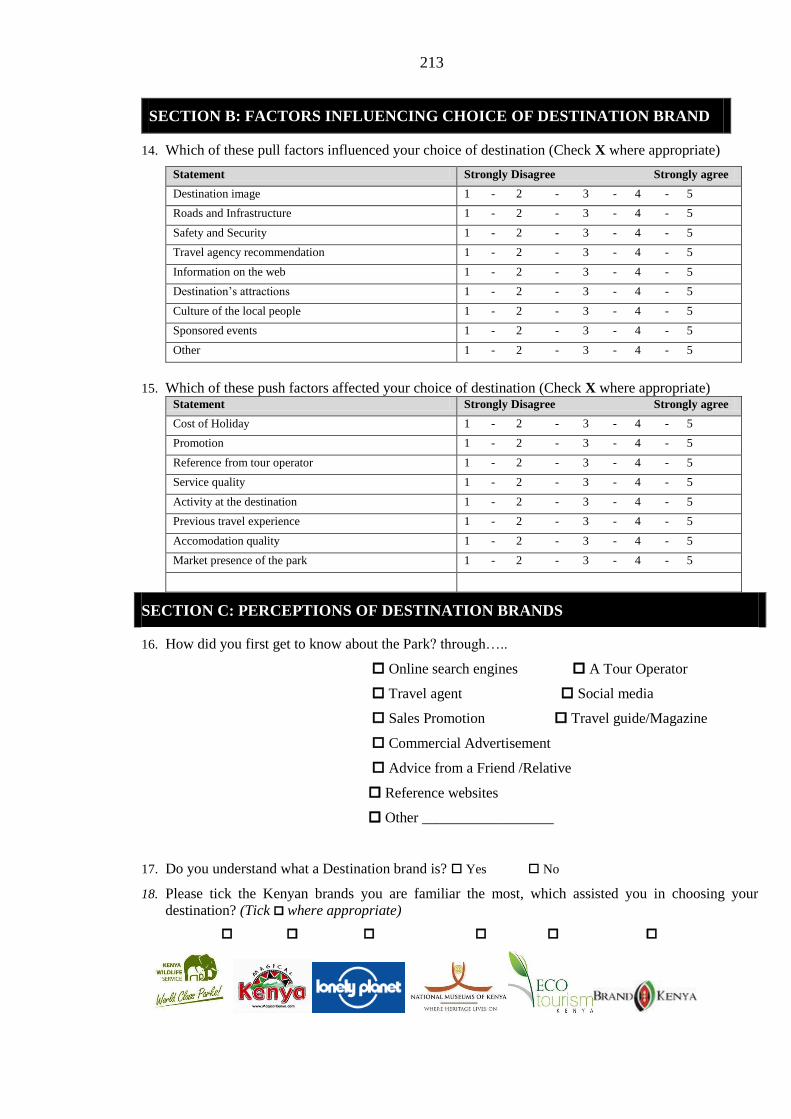
213
SECTION B: FACTORS INFLUENCING CHOICE OF DESTINATION BRAND
14. Which of these pull factors influenced your choice of destination (Check X where appropriate)
Statement Strongly Disagree Strongly agree
Destination image 1 - 2 - 3 - 4 - 5
Roads and Infrastructure 1 - 2 - 3 - 4 - 5
Safety and Security 1 - 2 - 3 - 4 - 5
Travel agency recommendation 1 - 2 - 3 - 4 - 5
Information on the web 1 - 2 - 3 - 4 - 5
Destination‟s attractions 1 - 2 - 3 - 4 - 5
Culture of the local people 1 - 2 - 3 - 4 - 5
Sponsored events 1 - 2 - 3 - 4 - 5
Other 1 - 2 - 3 - 4 - 5
15. Which of these push factors affected your choice of destination (Check X where appropriate) Statement Strongly Disagree Strongly agree
Cost of Holiday 1 - 2 - 3 - 4 - 5
Promotion 1 - 2 - 3 - 4 - 5
Reference from tour operator 1 - 2 - 3 - 4 - 5
Service quality 1 - 2 - 3 - 4 - 5
Activity at the destination 1 - 2 - 3 - 4 - 5
Previous travel experience 1 - 2 - 3 - 4 - 5
Accomodation quality 1 - 2 - 3 - 4 - 5
Market presence of the park 1 - 2 - 3 - 4 - 5
SECTION C: PERCEPTIONS OF DESTINATION BRANDS
16. How did you first get to know about the Park? through…..
Online search engines A Tour Operator
Travel agent Social media
Sales Promotion Travel guide/Magazine
Commercial Advertisement
Advice from a Friend /Relative
Reference websites
Other __________________
17. Do you understand what a Destination brand is? Yes No
18. Please tick the Kenyan brands you are familiar the most, which assisted you in choosing your
destination? (Tick where appropriate)
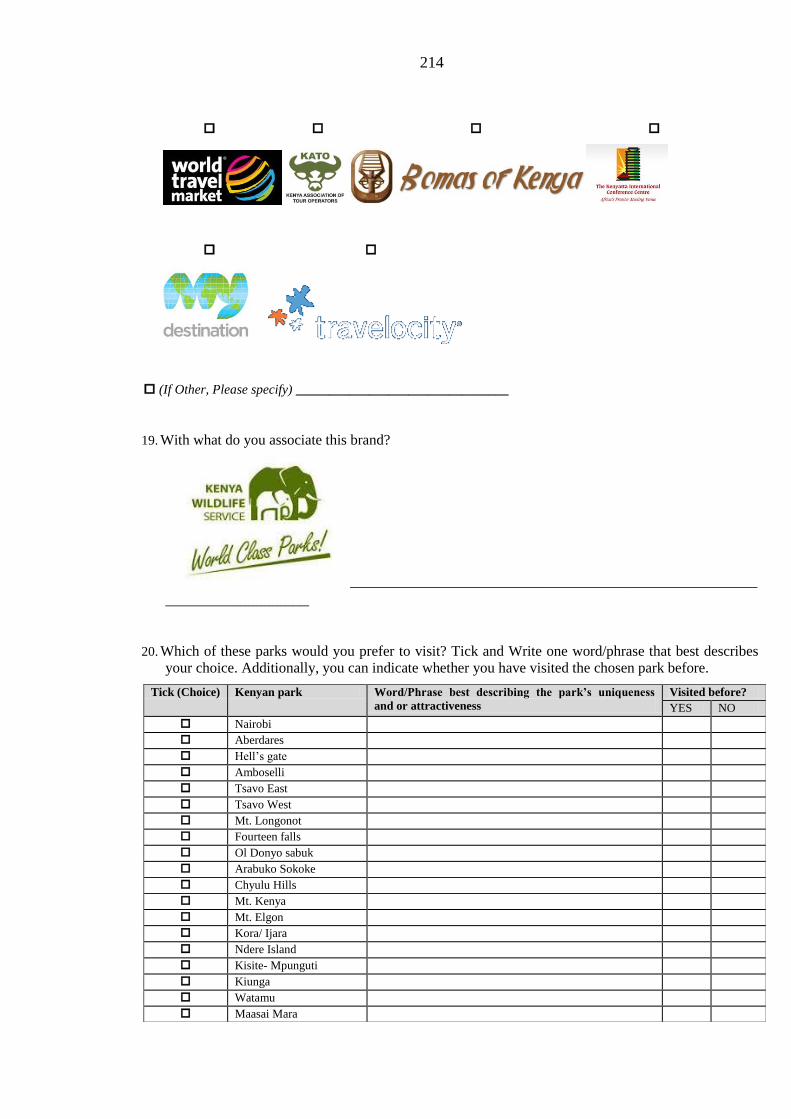
214
(If Other, Please specify) ________________________________
19. With what do you associate this brand?
___________________________________________________
__________________
20. Which of these parks would you prefer to visit? Tick and Write one word/phrase that best describes
your choice. Additionally, you can indicate whether you have visited the chosen park before.
Tick (Choice) Kenyan park Word/Phrase best describing the park’s uniqueness
and or attractiveness
Visited before?
YES NO
Nairobi
Aberdares
Hell‟s gate
Amboselli
Tsavo East
Tsavo West
Mt. Longonot
Fourteen falls
Ol Donyo sabuk
Arabuko Sokoke
Chyulu Hills
Mt. Kenya
Mt. Elgon
Kora/ Ijara
Ndere Island
Kisite- Mpunguti
Kiunga
Watamu
Maasai Mara
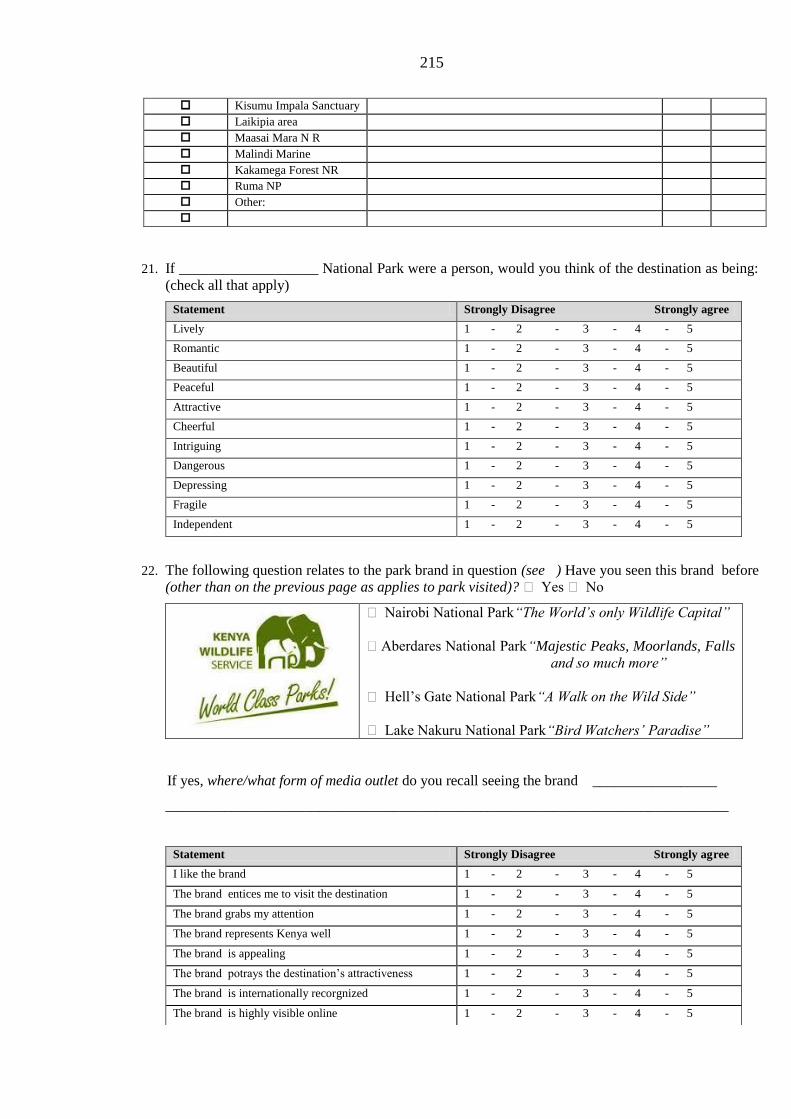
215
Kisumu Impala Sanctuary
Laikipia area
Maasai Mara N R
Malindi Marine
Kakamega Forest NR
Ruma NP
Other:
21. If ___________________ National Park were a person, would you think of the destination as being:
(check all that apply)
Statement Strongly Disagree Strongly agree
Lively 1 - 2 - 3 - 4 - 5
Romantic 1 - 2 - 3 - 4 - 5
Beautiful 1 - 2 - 3 - 4 - 5
Peaceful 1 - 2 - 3 - 4 - 5
Attractive 1 - 2 - 3 - 4 - 5
Cheerful 1 - 2 - 3 - 4 - 5
Intriguing 1 - 2 - 3 - 4 - 5
Dangerous 1 - 2 - 3 - 4 - 5
Depressing 1 - 2 - 3 - 4 - 5
Fragile 1 - 2 - 3 - 4 - 5
Independent 1 - 2 - 3 - 4 - 5
22. The following question relates to the park brand in question (see ) Have you seen this brand before
(other than on the previous page as applies to park visited)? Yes No
Nairobi National Park “The World‟s only Wildlife Capital”
Aberdares National Park “Majestic Peaks, Moorlands, Falls
and so much more”
Hell‟s Gate National Park “A Walk on the Wild Side”
Lake Nakuru National Park “Bird Watchers‟ Paradise”
If yes, where/what form of media outlet do you recall seeing the brand _________________
_____________________________________________________________________________
Statement Strongly Disagree Strongly agree
I like the brand 1 - 2 - 3 - 4 - 5
The brand entices me to visit the destination 1 - 2 - 3 - 4 - 5
The brand grabs my attention 1 - 2 - 3 - 4 - 5
The brand represents Kenya well 1 - 2 - 3 - 4 - 5
The brand is appealing 1 - 2 - 3 - 4 - 5
The brand potrays the destination‟s attractiveness 1 - 2 - 3 - 4 - 5
The brand is internationally recorgnized 1 - 2 - 3 - 4 - 5
The brand is highly visible online 1 - 2 - 3 - 4 - 5

216
The brand is persuasive 1 - 2 - 3 - 4 - 5
The brand potrays reliability 1 - 2 - 3 - 4 - 5
23. Were you aware that the brand represented a Kenyan park? Yes No
24. Which emotions are evoked when looking at the Nairobi National park brand Statement Strongly Disagree Strongly
agree
Pride 1 - 2 - 3 - 4 - 5
Excitem nt/ Joy 1 - 2 - 3 - 4 - 5
Peacefulness 1 - 2 - 3 - 4 - 5
Trust 1 - 2 - 3 - 4 - 5
Liberating 1 - 2 - 3 - 4 - 5
Anticipation 1 - 2 - 3 - 4 - 5
Other. Please specify
a. 1 - 2 - 3 - 4 - 5
b. 1 - 2 - 3 - 4 - 5
25. Do you believe that Nairobi National Park differs from other parks? Yes No
If yes, how do you think Nairobi National Park is differentiated?_____________________________
____________________________________________________________________________________
___________________________________________________________
SECTION D: TRAVEL PRE-BEHAVIOURAL INTENTIONS
26. What motivated you to visit the national park?
View wildlife and reconnect with nature
A desire to escape from routine / Getaway
A Pursuit of relaxation
Recuperation
Strengthen family bonds/ Family fun
Social interaction
Accessibility
Educational purposes/ Learning
Wish fulfilment
Other____________________
27. Indicate your level of expectations based on the following attributes:-
Choice Statement Strongly Disagree Strongly Agree
Accomodation quality 1 - 2 - 3 - 4 - 5
Distinctiveness of the attraction 1 - 2 - 3 - 4 - 5
Quality of interpretation 1 - 2 - 3 - 4 - 5
Activity 1 - 2 - 3 - 4 - 5
Security 1 - 2 - 3 - 4 - 5
Roads and Infrastructure 1 - 2 - 3 - 4 - 5

217
Hospitality of Local community 1 - 2 - 3 - 4 - 5
Weather/ Climate 1 - 2 - 3 - 4 - 5
Accessibility 1 - 2 - 3 - 4 - 5
Scenic attribute 1 - 2 - 3 - 4 - 5
Number and diversity of Wildlife 1 - 2 - 3 - 4 - 5
Value for money 1 - 2 - 3 - 4 - 5
Other: 1 - 2 - 3 - 4 - 5
SECTION F: POST- BEHAVIOURAL INTENTIONS
28. When thinking of your expectations prior to your travels to Nairobi National Park, your
current experience is exactly what you had imagined and expected: (Please circle your
answer along this 5 point scale)
Strongly
Disagree
Disagree Neutral Agree Strongly agree
1 2 3 4 5
29. Do you feel that your travel to the park met your expectations?
Choice Statement Strongly Disagree Strongly Agree
Accomodation quality 1 - 2 - 3 - 4 - 5
Distinctiveness of the attraction 1 - 2 - 3 - 4 - 5
Quality of interpretation 1 - 2 - 3 - 4 - 5
Activity 1 - 2 - 3 - 4 - 5
Security 1 - 2 - 3 - 4 - 5
Roads and Infrastructure 1 - 2 - 3 - 4 - 5
Hospitality of Local community 1 - 2 - 3 - 4 - 5
Weather/ Climate 1 - 2 - 3 - 4 - 5
Accessibility 1 - 2 - 3 - 4 - 5
Scenic attribute 1 - 2 - 3 - 4 - 5
Number and diversity of Wildlife 1 - 2 - 3 - 4 - 5
Value for money 1 - 2 - 3 - 4 - 5
Other: 1 - 2 - 3 - 4 - 5
30. Would you recommend the park to friends and family? Yes No. Give a reason for
your answer as Yes/No _________________________________
31. Would you visit the park some other time? Yes No Give a reason for your answer
as Yes/No__________________________
32. How did visiting the park/destination make you feel?
Choice Factor Agree Indifferent Disagree
Adventurous
Relaxing
Stimulating
Challenging
Romantic
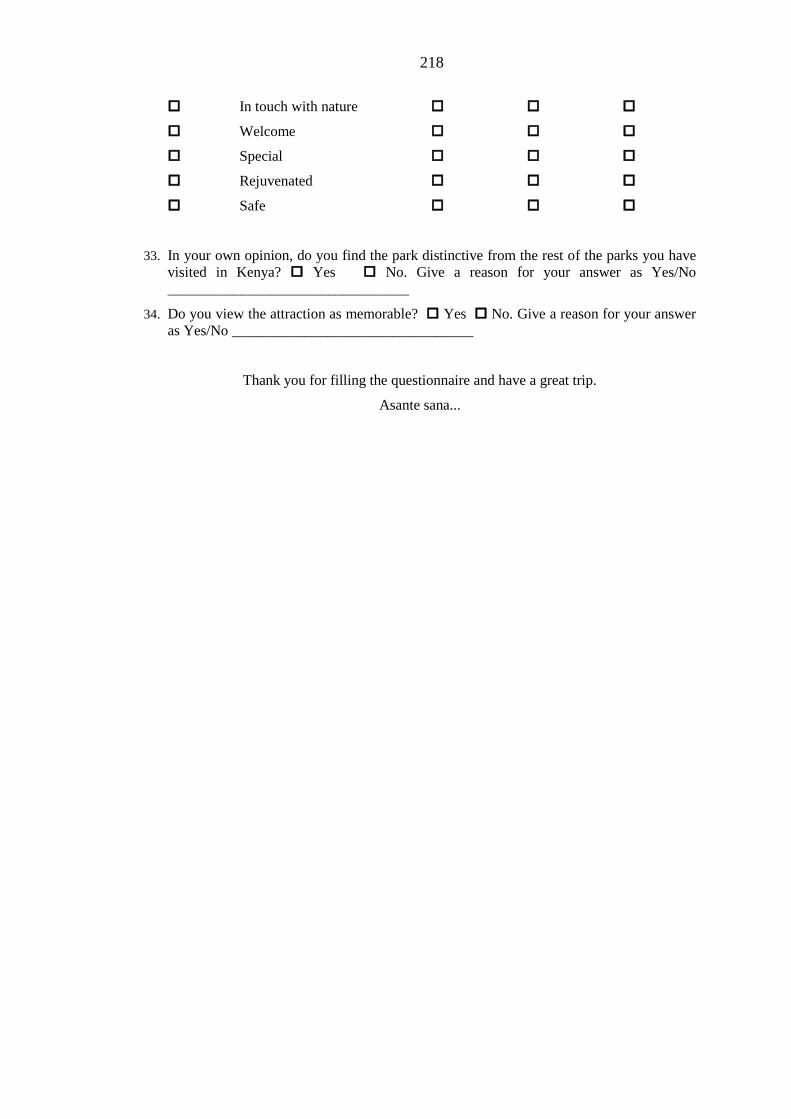
218
In touch with nature
Welcome
Special
Rejuvenated
Safe
33. In your own opinion, do you find the park distinctive from the rest of the parks you have
visited in Kenya? Yes No. Give a reason for your answer as Yes/No
_________________________________
34. Do you view the attraction as memorable? Yes No. Give a reason for your answer
as Yes/No _________________________________
Thank you for filling the questionnaire and have a great trip.
Asante sana...
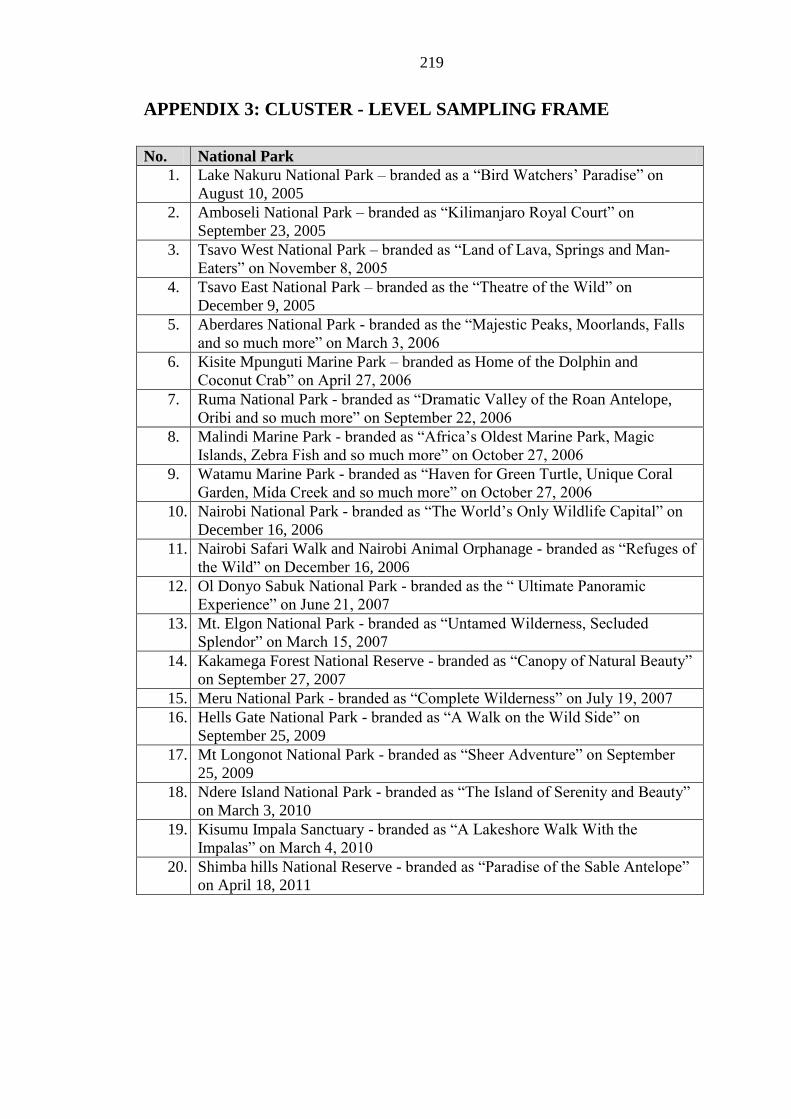
219
APPENDIX 3: CLUSTER - LEVEL SAMPLING FRAME
No. National Park
1. Lake Nakuru National Park – branded as a “Bird Watchers‟ Paradise” on
August 10, 2005
2. Amboseli National Park – branded as “Kilimanjaro Royal Court” on
September 23, 2005
3. Tsavo West National Park – branded as “Land of Lava, Springs and Man-
Eaters” on November 8, 2005 4. Tsavo East National Park – branded as the “Theatre of the Wild” on
December 9, 2005 5. Aberdares National Park - branded as the “Majestic Peaks, Moorlands, Falls
and so much more” on March 3, 2006
6. Kisite Mpunguti Marine Park – branded as Home of the Dolphin and
Coconut Crab” on April 27, 2006
7. Ruma National Park - branded as “Dramatic Valley of the Roan Antelope,
Oribi and so much more” on September 22, 2006
8. Malindi Marine Park - branded as “Africa‟s Oldest Marine Park, Magic
Islands, Zebra Fish and so much more” on October 27, 2006
9. Watamu Marine Park - branded as “Haven for Green Turtle, Unique Coral
Garden, Mida Creek and so much more” on October 27, 2006
10. Nairobi National Park - branded as “The World‟s Only Wildlife Capital” on
December 16, 2006
11. Nairobi Safari Walk and Nairobi Animal Orphanage - branded as “Refuges of
the Wild” on December 16, 2006
12. Ol Donyo Sabuk National Park - branded as the “ Ultimate Panoramic
Experience” on June 21, 2007
13. Mt. Elgon National Park - branded as “Untamed Wilderness, Secluded
Splendor” on March 15, 2007
14. Kakamega Forest National Reserve - branded as “Canopy of Natural Beauty”
on September 27, 2007
15. Meru National Park - branded as “Complete Wilderness” on July 19, 2007
16. Hells Gate National Park - branded as “A Walk on the Wild Side” on
September 25, 2009
17. Mt Longonot National Park - branded as “Sheer Adventure” on September
25, 2009
18. Ndere Island National Park - branded as “The Island of Serenity and Beauty”
on March 3, 2010
19. Kisumu Impala Sanctuary - branded as “A Lakeshore Walk With the
Impalas” on March 4, 2010
20. Shimba hills National Reserve - branded as “Paradise of the Sable Antelope”
on April 18, 2011
220
APPENDIX 4: PARK PROFILES
LAKE NAKURU NATIONAL PARK “THE BIRD WATCHER’S PARADISE’’
HISTORY OF THE PARK
Lake Nakuru National Park origins come from the freshwater springs to the north east
of the lake. The freshwater springs (Baharini springs) were a regular stop-off point for
the ivory and slave-trading caravans that travelled to and from the coast (KWS, 2003).
The word „Nakuru‟ may have had conflicting meanings. Whilst some of the Maasai
claim it came from the word na-kurro, which means „the rough and stony place‟ or
„the place that is scraped bare‟, others claim that the word is derived from the Maasai
word, enakuro, meaning „the place of swirling dust‟ referring to the dust devils
created when the wind whips up the salt dust from the lake.
Lake Nakuru National Park was officially designated in 1961 and officially gazetted
as a bird sanctuary, covering only the southern part of the lake in 1960 by the Kenya
Royal Parks. It was extended to include the entire lake in 1962 and upgraded to
National Park status in 1968 (legal notice no. 137) (Enhols, 2012). In 1972-73, the
World Wildlife Fund in conjunction with the Netherlands developed a conservation
agreement with the Kenyan Government that led to the acquisition of more land for
expansion to its present size. A northern extension was added to the park in 1974. In
1984, the park was established as the first government-managed rhino sanctuary in
East Africa. In 1987, Lake Nakuru officially achieved full status as a rhino sanctuary.
The lake was designated as a Ramsar site in 1990 (Alorm Kenya, 2012). In 2002, the
Lake Nakuru National Park was declared a World Heritage Site by UNESCO. The
park was officially branded as a “Bird Watchers‟ Paradise” on August 10, 2005.
LOCATION
Lake Nakuru National Park is located 156 km Northwest of Nairobi, (KWS, 2010a). It
is bordered by Menengai crater to the south, the Bahati hills to the North east; the lion
hill ranges to the east; Eburu crater to the south and the Mau escarpment to the west.
Three major rivers, the Njoro River, Makalia River and the Enderit drain into the lake.
The park has three (3) main gates and access ways such Main Gate, Lanet Gate and
Nderit Gate.
CLIMATE
The Lake Nakuru National Park is a typical African savannah which is dry and warm
with rainfall peaks around aril, august and November, delivering an annual average
rainfall of around 1000 mm (KWS 2003).
221
KEY ATTRACTIONS
The foundation of the park‟s food chain is the cyanophyte spirulina platensis which
supports huge numbers of the lesser flamingo. The lake was the first IBA (Important
Bird Area) and Ramsar site to be branded on the 10th of August 2010. It is an
orthinologist‟s paradise with over 500 species of birds recorded. Sir Peter Scott,
world-famous ornithologist referred to the lake as having the greatest ornithological
spectacle show on earth. Lake Nakuru National Park has the largest Euphorbia
candebrum forest in East Africa. Key attractions include the lesser flamingo, Kenya‟s
first black rhino sanctuary, malai waterfall, viewpoints such as the lion hill, baboon
cliffs and Out of Africa viewpoint, game viewing.
KEY ROUTES AND CIRCUITS
The park has been crisscrossed by key circuits and tourist routes that offer varied
experiences to tourists.
Key route and (or)
circuit
Scenic attractions
Cormorant Point Baboon cliff lookout/ viewpoint
Makalia falls campsite
Honeymoon hill
Euphorbia candelabrum forest
Out of Africa circuit Scenic Out of Africa viewpoint
Picnic site
Southern circuit (2WD) Extensive Game
Makalia falls
Lion Hill circuit (4WD) Extensive Game
Makalia falls
Lion cave
Baharini springs
Euphorbia candelabrum forest
Western circuit Olea forest (ideal habitat for black rhino and buffalo)
Acacia forest
Hippo point
Naishi and Makalia
circuit
Naishi rhino base
Naishi guest house
Grass airstrip
Enasoit hills
Makalia falls
Around Lake Nakuru
National Park
(Connectivity)
Lake Naivasha
Hell‟s Gate National Park
Hyrax hill
Flamingoes in L. Elementaita and L. Bogoria
Hippo infested L. Baringo
Scenic Western circuit eg Tugen hills and Kerio valley
Mt. Elgon National Park

222
Maasai Mara National Park
Source: Researcher
ACCOMODATION FACILITIES
There are a variety of accommodation options for tourists to Lake Nakuru National
Park, which include two (2) serviced hotels, one (1) self-catering accommodation,
five (5) campsites and other facilities. These are as indicated in table .
Figure 2: Range of accommodation facilities in Lake Nakuru National Park
Accommodation facility Scenic attractions
Tourist lodges Lake Nakuru Lodge
Sarova lion hill lodge
Self-catering
accommodation
Naishi house
Campsites The backpackers campsite
Makalia campsite (South and North)
Lake Nakuru special campsite
Kampi ya Nyati (Buffalo camp)
Kampi ya Nyuki (Bee Camp)
Other accommodation Naishi
Reedbuck
Chui and Rhino campsite
Nakuru field study Centre
Wildlife Clubs of Kenya Hostel and Guest House
MAIN FAUNA AND FLORA
The main fauna and flora include varied species of mammals, cats, fishes and birds
some of which are highlighted in table .
Figure 3: Main fauna and flora in Lake Nakuru National Park
Species Variety
Mammals Cape buffalo, Giraffe, Waterbuck, zebra, bush buck,
duiker, Kirk‟s dikdik, Thomson gazelle, Grant‟s
gazelle, White rhino, black rhino
Cats Lion, leophard, Chettah, Spotted hyena, Caracal,
Serval cats, Silver-backed jackal,
Fishes Tilapia (Oreochromis graham)
Birds Water-front birds eg Greater flamingo
Lesser flamingo
Ibis species
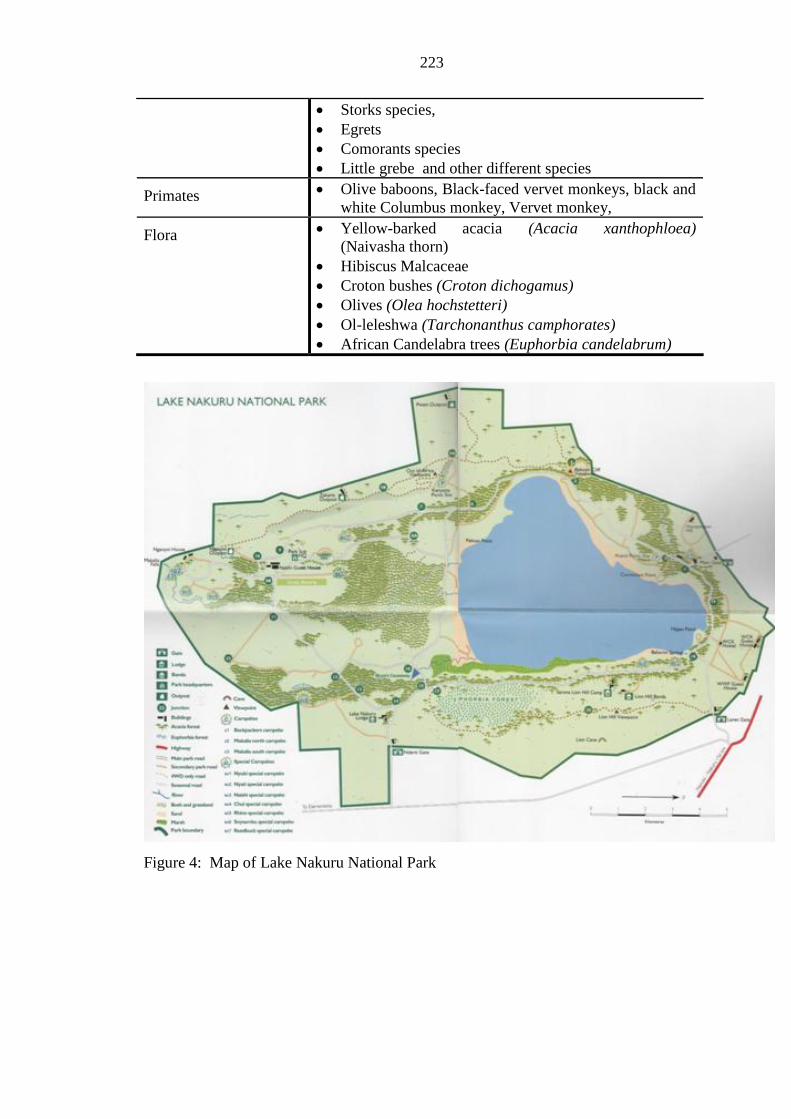
223
Storks species,
Egrets
Comorants species
Little grebe and other different species
Primates Olive baboons, Black-faced vervet monkeys, black and
white Columbus monkey, Vervet monkey,
Flora Yellow-barked acacia (Acacia xanthophloea)
(Naivasha thorn)
Hibiscus Malcaceae
Croton bushes (Croton dichogamus)
Olives (Olea hochstetteri)
Ol-leleshwa (Tarchonanthus camphorates)
African Candelabra trees (Euphorbia candelabrum)
Figure 4: Map of Lake Nakuru National Park

224
NAIROBI NATIONAL PARK “THE WORLD’S ONLY WILDLIFE
CAPITAL…”
HISTORY OF THE PARK
Originally, Nairobi National Park was part of the Great Southern Game Reserve
which was created in 1900. The land which now makes up the park acted as grazing
grounds for the Maasai and Somali herdsmen. British cconservationists concerns
about excessive destruction of wildlife species and habitats in the East Africa
Protectorate (e.g., by skin and trophy hunters) led the colonial government to
promulgate conservation policies to protect unique wildlife attractions and species,
which were then promoted through organized safari tourism activities (GoK 1957;
Lusigi 1978; Akama, Maingi and Camargo, 2011). In 1939, driven by pressure from
pioneer conservationists, the British government appointed a game committee to
study and inform the setting up of game parks in Kenya and other African colonies.
The committee was tasked to plan the location, extension, constitution, control and
management of game parks, as well as the forms of recreational activities that should
be permitted within them (Okello et al. 2009, Tucker and Akama 2009). Its
recommendations were approved by the colonial legislature in 1945 and led to the
creation of the pioneer national parks in Kenya that included Nairobi in 1946. After,
this Nairobi National Park was the first park to be gazetted in Kenya. It was officially
opened in Christmas 1946, and it was the first national park of East Africa. Nairobi
National Park was branded as “The World‟s Only Wildlife Capital” on December 16,
2006.
LOCATION
It is a popular park in Nairobi as it is located in close proximity to Nairobi town. Its
size is 117 km sq. It is a very popular attraction for side excursions by locals, transit
tourists as well as business travellers. The park has 4 major public access ways. The
gates are: - Main gate: KWS headquarters: Cheetah Gate; Langata Gate; and the
Maasai Gate. It is an IBA (Important bird area) as well as a conservation area. It is the
only Wildlife Park in the world that is so close to the city and has a major rhino
sanctuary for breeding and restocking to other areas. It is also one of the few parks in
Kenya without in-park accommodation due to its proximity to Nairobi town centre,
(KWS, 2010b).
CLIMATE
Nairobi National Park faces a hot and dry season from January to March. April to
June is hot and wet, July to October is very warm and dry. November and December
are warm and wet.
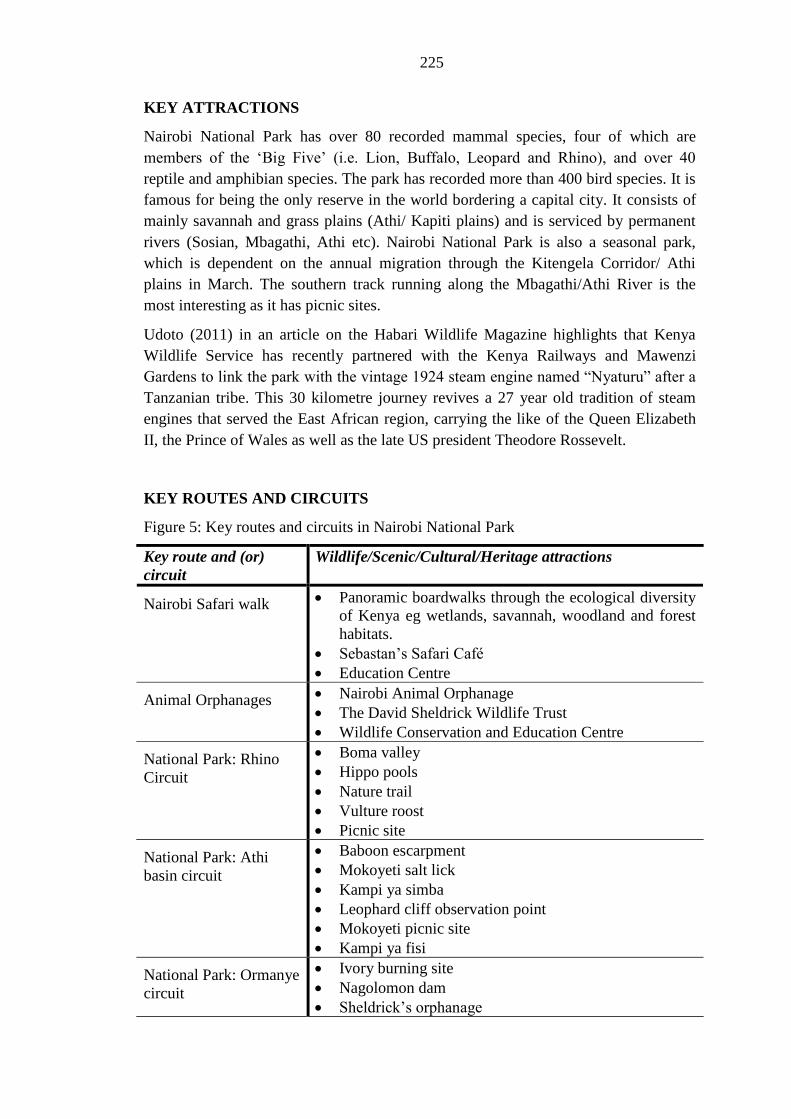
225
KEY ATTRACTIONS
Nairobi National Park has over 80 recorded mammal species, four of which are
members of the „Big Five‟ (i.e. Lion, Buffalo, Leopard and Rhino), and over 40
reptile and amphibian species. The park has recorded more than 400 bird species. It is
famous for being the only reserve in the world bordering a capital city. It consists of
mainly savannah and grass plains (Athi/ Kapiti plains) and is serviced by permanent
rivers (Sosian, Mbagathi, Athi etc). Nairobi National Park is also a seasonal park,
which is dependent on the annual migration through the Kitengela Corridor/ Athi
plains in March. The southern track running along the Mbagathi/Athi River is the
most interesting as it has picnic sites.
Udoto (2011) in an article on the Habari Wildlife Magazine highlights that Kenya
Wildlife Service has recently partnered with the Kenya Railways and Mawenzi
Gardens to link the park with the vintage 1924 steam engine named “Nyaturu” after a
Tanzanian tribe. This 30 kilometre journey revives a 27 year old tradition of steam
engines that served the East African region, carrying the like of the Queen Elizabeth
II, the Prince of Wales as well as the late US president Theodore Rossevelt.
KEY ROUTES AND CIRCUITS
Figure 5: Key routes and circuits in Nairobi National Park
Key route and (or)
circuit
Wildlife/Scenic/Cultural/Heritage attractions
Nairobi Safari walk Panoramic boardwalks through the ecological diversity
of Kenya eg wetlands, savannah, woodland and forest
habitats.
Sebastan‟s Safari Café
Education Centre
Animal Orphanages Nairobi Animal Orphanage
The David Sheldrick Wildlife Trust
Wildlife Conservation and Education Centre
National Park: Rhino
Circuit
Boma valley
Hippo pools
Nature trail
Vulture roost
Picnic site
National Park: Athi
basin circuit
Baboon escarpment
Mokoyeti salt lick
Kampi ya simba
Leophard cliff observation point
Mokoyeti picnic site
Kampi ya fisi
National Park: Ormanye
circuit
Ivory burning site
Nagolomon dam
Sheldrick‟s orphanage
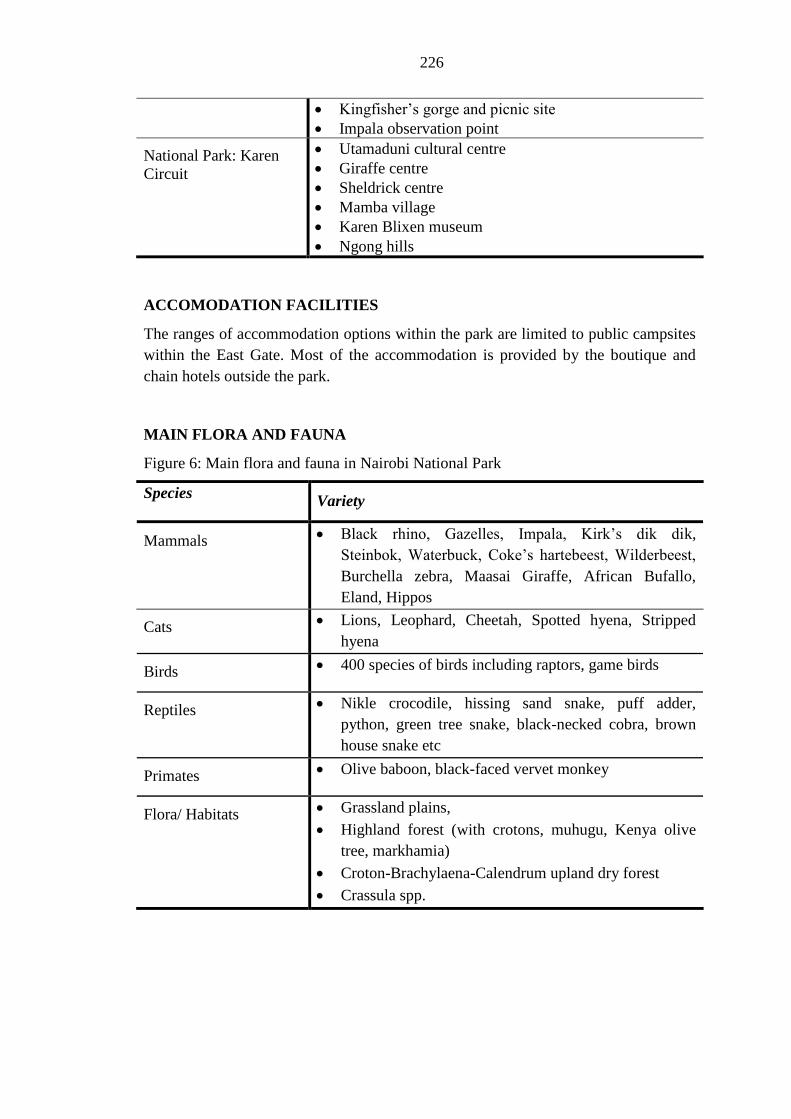
226
Kingfisher‟s gorge and picnic site
Impala observation point
National Park: Karen
Circuit
Utamaduni cultural centre
Giraffe centre
Sheldrick centre
Mamba village
Karen Blixen museum
Ngong hills
ACCOMODATION FACILITIES
The ranges of accommodation options within the park are limited to public campsites
within the East Gate. Most of the accommodation is provided by the boutique and
chain hotels outside the park.
MAIN FLORA AND FAUNA
Figure 6: Main flora and fauna in Nairobi National Park
Species Variety
Mammals Black rhino, Gazelles, Impala, Kirk‟s dik dik,
Steinbok, Waterbuck, Coke‟s hartebeest, Wilderbeest,
Burchella zebra, Maasai Giraffe, African Bufallo,
Eland, Hippos
Cats Lions, Leophard, Cheetah, Spotted hyena, Stripped
hyena
Birds 400 species of birds including raptors, game birds
Reptiles Nikle crocodile, hissing sand snake, puff adder,
python, green tree snake, black-necked cobra, brown
house snake etc
Primates Olive baboon, black-faced vervet monkey
Flora/ Habitats Grassland plains,
Highland forest (with crotons, muhugu, Kenya olive
tree, markhamia)
Croton-Brachylaena-Calendrum upland dry forest
Crassula spp.
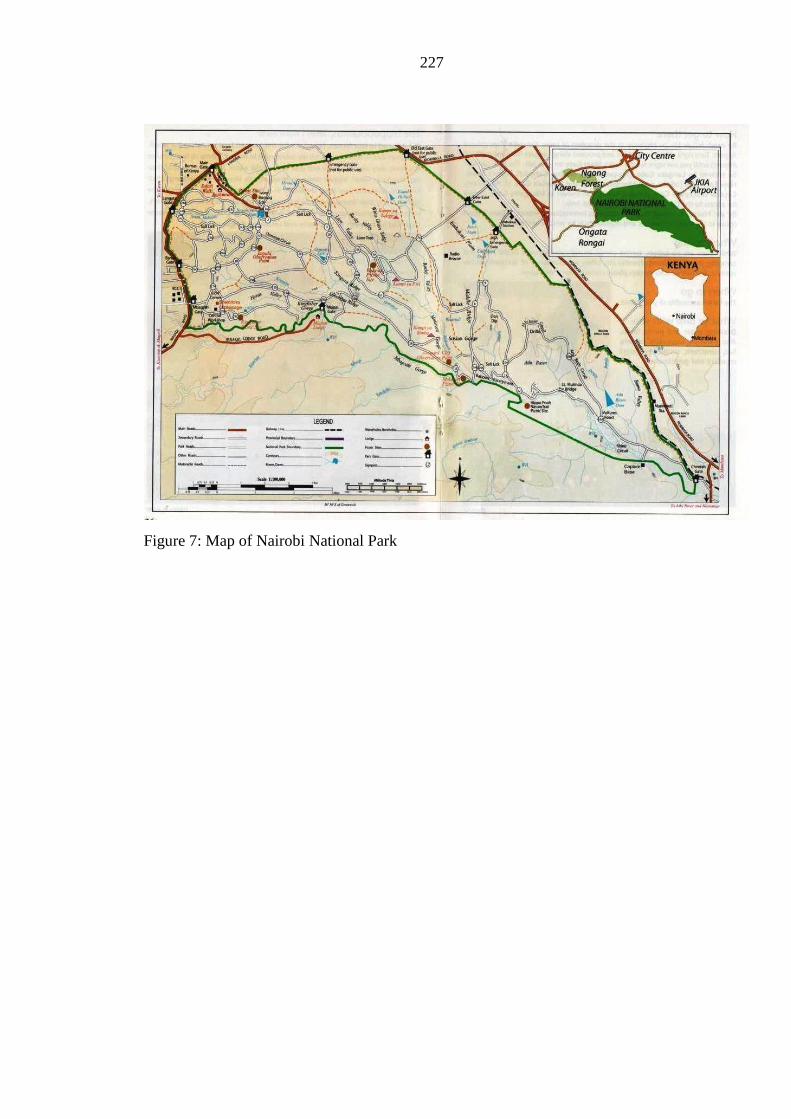
227
Figure 7: Map of Nairobi National Park

228
HELL’S GATE NATIONAL PARK “A WALK IN THE WILD SIDE…”
HISTORY OF THE PARK
Hell‟s Gate National Park is the second smallest park in Kenya covering 68 km sq and
it is situated on the East African Rift Valley. The geology of Hell‟s is quite diverse.
The region within and around the park is covered with ashes from Mt. Longonot
eruption which occurred 100 years ago. Hell‟s is unique and famous for hot natural
geysers, spectacular sceneries from the towering cliffs, huge rock towers, volcanic
gorge and the belching plumes of geothermal steam. Its names are synonymous to the
Gate of Hell within the ruins in south western turkey in the ancient Phrygian city of
Hierapolis, now called Pamukkale (Lorenzi, 2013).
The park was gazetted in 1984 and branded on the 25th September 2009. Before
gazettement of the park, it was an area inhabited by ranchers. The term Hell‟s Gate
came with a local maasai interpretation of the word “Hell‟s ground”. British explorers
Fisher and Thompson in 1883 after their defeat against the hostile Maasai warriors
named it Hell‟s Gate. This name was also associated with various local myths: During
the formation of the rift valley many years ago, Mt. Suswa, Menengai and Mt.
Longonot were active. Volcanic activity rendered the place inhabitable. The
inhabitants of the area i.e. the Maasai community, then eventually called it Hell‟s
ground.
A second myth associated to Hell‟s Gate history is associated with the Maasai‟s
wonder on how a place would have unique features such as the Olkaria and Holby‟s
volcanoes, Cliff faces, Hot springs and the Hell‟s kitchen. These areas had steam
coming from underground. According to the Maasai community, these were
associated with the works of the devil. The local Maasai community believed that the
rocks are petrified figures of a chief‟s daughters who went against the dictates of
society by turning back to have a last look of their home before leaving to get
married. These myths were significant in the brand personality index of the park. The
park was branded as “A Walk on the Wild Side” on September 25, 2009.
THE FORMATION OF THE HELL’S GATE GORGE
Local history has it that Lake Naivasha used to be a massive giant lake lying on the
floor of the rift valley in the ancient days. The lake used to collect its water from
different catchment areas like the Mau escarpment and the Aberdare ranges. Lake
Enaiposha as the Maasai used to call it meaning a lake of many waves, had an outlet
flowing through Hell‟s gate gorge and in the process, cutting and eroding as well as
depositing for hundreds of years. The Maasai used to call this outlet as River Ol-
Njorowa. Lake Enaiposha (present lake Naivasha) used to extend as far as Lake
Baringo.
After the eruption of Mt. Ol-ongonot - present Mt. Longonot, (Mountain of many
valleys), Mt Suswa and Menengai, the volume of the lake was reduced gradually as a
result of the very hot volcanic ashes into and around the lake, thus sub-dividing the
229
lake into two different types of lakes ie the fresh water lakes (Lake Naivasha and
Lake Baringo) and the salty lakes ie (Lake Nakuru, Bogoria and Elementaita). The
small Lake Naivasha had no more main outlet apart from the underground ones, one
such outlet is said to drain in Ondiri swamp in Kikuyu. The Ol-Njorowa river dried
when water from the Lake Naivasha stopped flowing through the gorge.
Ol-Njorowa river is now fed by the cold and the hot springs either on the floor of the
gorge or the sides, it therefore reduced into a small stream running from the strating
point of the gorge downwards to the paramount tower after then, it dries up as it goes
underground and by the end, the gorge opens up into a plain known as the Suswa
plains. As people now walk through the gorge, they mainly start seeing a beautiful
landscape with the vegetations led by the leleshwa, whistling thorn and the yellow
fever tree.
GEOGRAPHY
Hell‟s Gate National Park covers an area of 68.25 km2
(26 squared miles). It lies
within Nakuru County within the coordinates 0°54′57″S and 36°18′48″E. It is a
remnant of obsidian forms that were formed from the cool molten lava. The park has
two major extinct volcanoes ie Olkaria and Hobley‟s which can be viewed from the
park. The geology of Hell‟s is quite diverse. Hell‟s is unique and famous for hot
natural geysers, spectacular sceneries from the towering cliffs, huge rock towers,
volcanic gorge and the belching plumes of geothermal steam.
LOCATION
This park is currently accessible via tarmac road from Nairobi (90kms) via Naivasha
Town on the Lake Road South at a junction 5km south of Lake Naivasha. It has an
area location of 68 kmsq. It is located within central rift circuit in Naivasha.
MAIN ATTRACTIONS
Hell‟s Gate was branded on 25th
September 2009 as a place where a tourist would
walk on the wild side. It was specifically intended to promote the park as a wilderness
attraction for hiking, trekking, biking and camping. It provides also an exclusive
access for tourists to interact with nature and appreciate the geographical beauty. The
park is highly accessible and has close proximity to the Maasai mara National
Researve, Nakuru and Aberdares National Park. By virtue of close proximity to these
parks, Hell‟s Gate National Park has been a key attraction. Major attractions in the
park include game viewing, raptor nesting in the cliffs, gorge walks, the hot springs.
FACILITIES/ ACCOMMODATION

230
The park does not have onsite accommodation, but has three camping facilities
Oldubai campsite (on the cliff top south of Fischer‟s Tower), Nairburta campsite and
Endchata campsite (across the gorge on the northern cliffs). The park engendours the
Naivasha landscape that boosts of major tourist attractions such as Aberdare and
Eburru reserves, Lake Naivasha ramsar site, Longonot National Park, a diverse
culture and a pre-colonial history and scenic beauty.
Figure 17: Map of Hell‟s gate National Park
231
THE ABERDARE NATIONAL PARK “MAJESTIC PEAKS, MOOR LANDS
AND FALLS…”
HISTORY OF THE PARK
The Aberdare range was named after the then President of the Royal Geographical
Society by the intrepid Scot, Joseph Thomson, who explored the region in 1883. The
Kikuyu people farmed the slopes of the Aberdare range for centuries and named it
„Nyandarua‟, meaning „the drying hide‟. The Kikuyu also know the range as
„Thambara‟, meaning „the place of mist and gloom‟. The Maasai of the Rift Valley
named the summit of the Aberdare Range Ol Donyo Lesatima or the Mountain of the
Bull Calf. The Aberdares owes its existence due to the techtonic forces that led to the
development of the Great Rift Valley. Following the orientation of the range from
North to South, major peaks are Chebuswa (3,364m), Ol Donyo Lesatima (4,001m),
Table Mountain (3,791m), Maratini Hill (3,698m), Kinangop (Nyandarua) peak
(3,906m), and The Elephant Hill (3,591m). West of the Aberdare ranges is Kipipiri
(3,349m).
The northern moorlands are broken into a series of jagged rocky outcrops known as
the „Dragon‟s teeth‟. The streams that run across the Aberdares as several points form
stunning waterfalls. The waterfalls include Karuru falls (273m) which occurs in three
steps of 117, 126 and 130 metres, Gura falls and Chania falls. The Aberdare are the
main water catchments for Sasumua and Ndaka-ini Dams, which provide most of the
water for Nairobi UNEP (2002). It is one of the IBAs and one of the five water towers
(An important catchment area for the Tana River, Ewaso Nyiro River and for Lake
Naivasha. Queen Elizabeth learned of her accession to the throne at Tree-tops Lodge,
(KWS, 2010). Aberdares National Park was branded as the “Land of the Majestic
Peaks, Moorlands, Falls and so much more” on March 3, 2006.
LOCATION
Aberdares National Park is located 154 km from Nairobi town (approaching through
Nyeri County), 188 km from Nairobi town (approaching through Nyahururu town)
and 87 km from Nairobi (approaching through Naivasha town). The towns are
serviced by the following gates:-

232
Figure 8: Park entry gates to Aberdares National Park
Town Gates
From Nyeri Tree tops gate (17 km)
Ruhuruini gate (20 km)
Ark gate (28 km)
Kiandogoro gate (30 km)
Wanderi gate (47 km)
From Nyahururu Shamata gate (45 km)
Rhino gate (48 km)
From Naivasha Mutubio gate (50 km)
Source: Researcher
CLIMATE
Aberdares National Park experiences heavy rains all year round, averaging 1,000 mm
per annum on the drier northern slopes and as much as 3,000mm per annum in the
southeast areas.
KEY ATTRACTIONS
Key attractions include the spectacular waterfalls (Karuru and Chania falls), Lesatima
peak, and Kinangop peak, nature walks in the moorlands, Twin hills, Elephant hills,
Table Mountains and the Kimathi Hideout/Mau Mau caves.
ACCOMODATION FACILITIES
Luxury lodges as well as self-catering facilities and several public and private
campsites are available within the park.
Figure 9: Accommodation facilities within Aberdares National Park
Accommodation facility Scenic attractions
Boutique Tourist lodges Treetops Lodge
Outspan hotel
The Ark
Aberdare Country Club
Self-catering
accommodation
Tusk Camp (2km from Ruhuruini gate)
Sapper hut (10 km west of the fishing lodge)
Kiandogoro lodge (2km inside Kiandogoro gate)
Rhino retreat
Public Campsites Hagenia campsite
Honi Campsite
Rhino campsite
Reedbuck campsite

233
Ruhuruini campsite
Wanderi‟s campsite
Shamata campsite
Special or Private
campsites
Bongo campsite
Kifaru campsite
Muringato campsite
Nyati Campsite
The Queen Beatrix and Prince Charles campsites
Woodley campsite
Source: Researcher
MAIN FLORA AND FAUNA
Figure 10: Main flora and fauna in Aberdares National Park
Species Variety
Mammals Black rhino, Gazelles, Impala, Kirk‟s dik dik, Steinbok,
Waterbuck, Coke‟s hartebeest, Wilderbeest, Burchella
zebra, Maasai Giraffe, African Bufallo, Eland, Hippos
Cats Lions, Leophard, Cheetah, Spotted hyena, Stripped hyena
Birds 400 species of birds including raptors, game birds
Reptiles hissing sand snake, puff adder, python, green tree snake,
black-necked cobra, brown house snake etc
Primates Olive baboon, black-faced vervet monkey
Flora/ Habitats Grassland plains,
Highland forest (with crotons, muhugu, Kenya olive tree,
markhamia)
Croton-Brachylaena-Calendrum upland dry forest
Crassula spp.
Source: Researcher
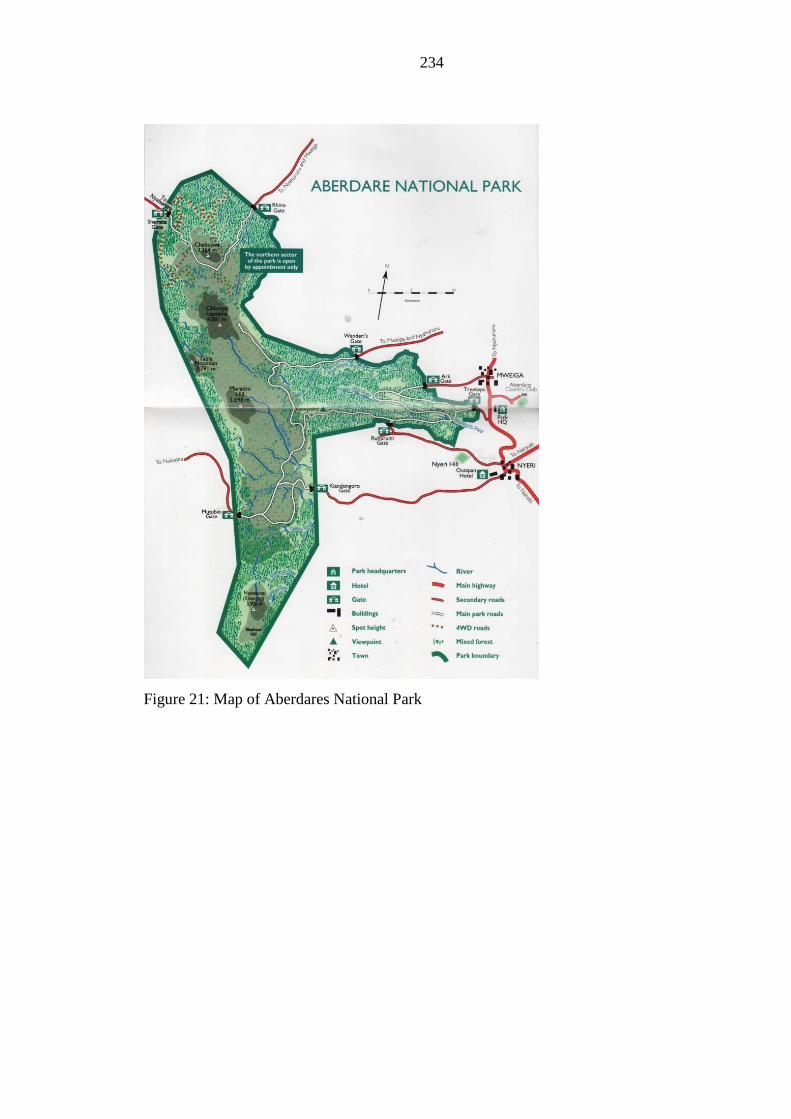
234
Figure 21: Map of Aberdares National Park
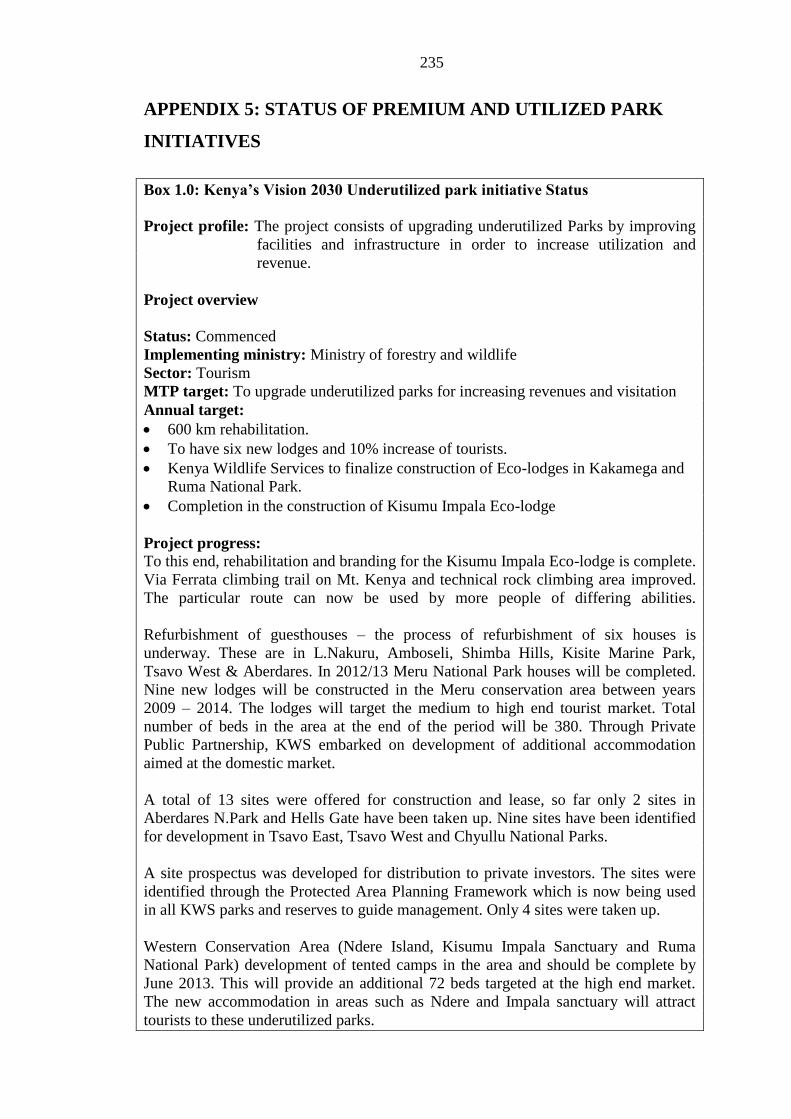
235
APPENDIX 5: STATUS OF PREMIUM AND UTILIZED PARK
INITIATIVES
Box 1.0: Kenya’s Vision 2030 Underutilized park initiative Status
Project profile: The project consists of upgrading underutilized Parks by improving
facilities and infrastructure in order to increase utilization and
revenue.
Project overview
Status: Commenced
Implementing ministry: Ministry of forestry and wildlife
Sector: Tourism
MTP target: To upgrade underutilized parks for increasing revenues and visitation
Annual target:
600 km rehabilitation.
To have six new lodges and 10% increase of tourists.
Kenya Wildlife Services to finalize construction of Eco-lodges in Kakamega and
Ruma National Park.
Completion in the construction of Kisumu Impala Eco-lodge
Project progress:
To this end, rehabilitation and branding for the Kisumu Impala Eco-lodge is complete.
Via Ferrata climbing trail on Mt. Kenya and technical rock climbing area improved.
The particular route can now be used by more people of differing abilities.
Refurbishment of guesthouses – the process of refurbishment of six houses is
underway. These are in L.Nakuru, Amboseli, Shimba Hills, Kisite Marine Park,
Tsavo West & Aberdares. In 2012/13 Meru National Park houses will be completed.
Nine new lodges will be constructed in the Meru conservation area between years
2009 – 2014. The lodges will target the medium to high end tourist market. Total
number of beds in the area at the end of the period will be 380. Through Private
Public Partnership, KWS embarked on development of additional accommodation
aimed at the domestic market.
A total of 13 sites were offered for construction and lease, so far only 2 sites in
Aberdares N.Park and Hells Gate have been taken up. Nine sites have been identified
for development in Tsavo East, Tsavo West and Chyullu National Parks.
A site prospectus was developed for distribution to private investors. The sites were
identified through the Protected Area Planning Framework which is now being used
in all KWS parks and reserves to guide management. Only 4 sites were taken up.
Western Conservation Area (Ndere Island, Kisumu Impala Sanctuary and Ruma
National Park) development of tented camps in the area and should be complete by
June 2013. This will provide an additional 72 beds targeted at the high end market.
The new accommodation in areas such as Ndere and Impala sanctuary will attract
tourists to these underutilized parks.
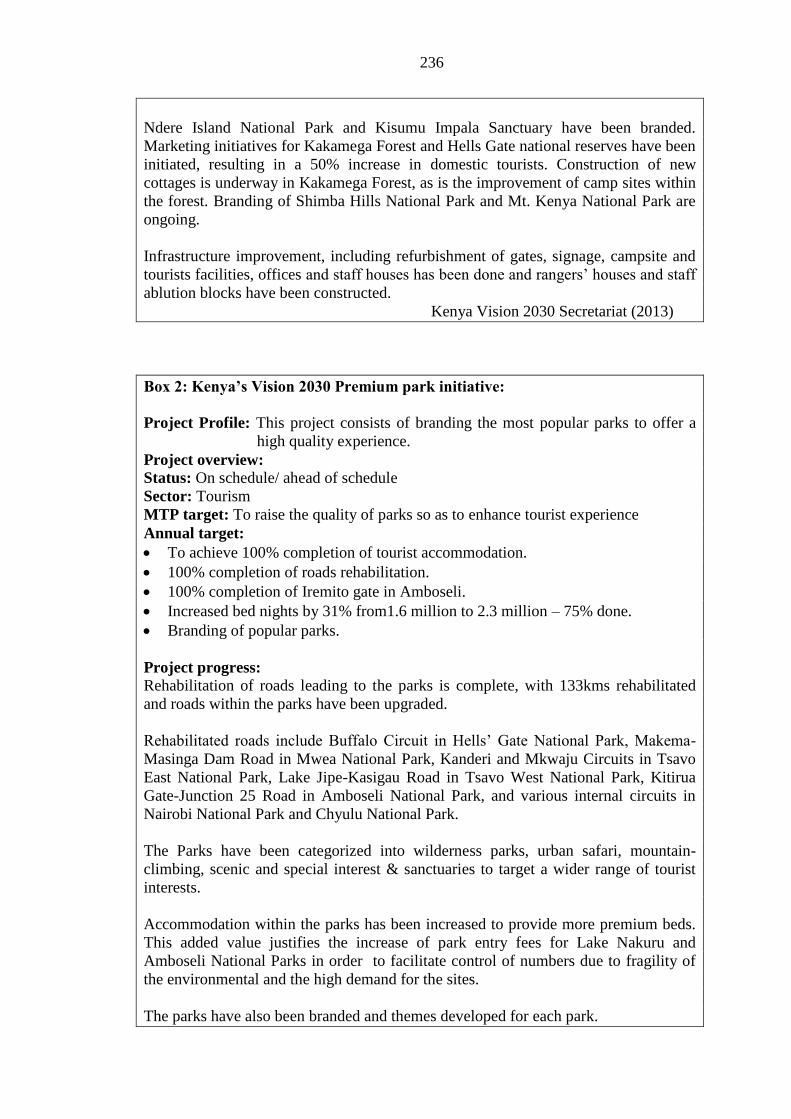
236
Ndere Island National Park and Kisumu Impala Sanctuary have been branded.
Marketing initiatives for Kakamega Forest and Hells Gate national reserves have been
initiated, resulting in a 50% increase in domestic tourists. Construction of new
cottages is underway in Kakamega Forest, as is the improvement of camp sites within
the forest. Branding of Shimba Hills National Park and Mt. Kenya National Park are
ongoing.
Infrastructure improvement, including refurbishment of gates, signage, campsite and
tourists facilities, offices and staff houses has been done and rangers‟ houses and staff
ablution blocks have been constructed.
Kenya Vision 2030 Secretariat (2013)
Box 2: Kenya’s Vision 2030 Premium park initiative:
Project Profile: This project consists of branding the most popular parks to offer a
high quality experience.
Project overview:
Status: On schedule/ ahead of schedule
Sector: Tourism
MTP target: To raise the quality of parks so as to enhance tourist experience
Annual target:
To achieve 100% completion of tourist accommodation.
100% completion of roads rehabilitation.
100% completion of Iremito gate in Amboseli.
Increased bed nights by 31% from1.6 million to 2.3 million – 75% done.
Branding of popular parks.
Project progress:
Rehabilitation of roads leading to the parks is complete, with 133kms rehabilitated
and roads within the parks have been upgraded.
Rehabilitated roads include Buffalo Circuit in Hells‟ Gate National Park, Makema-
Masinga Dam Road in Mwea National Park, Kanderi and Mkwaju Circuits in Tsavo
East National Park, Lake Jipe-Kasigau Road in Tsavo West National Park, Kitirua
Gate-Junction 25 Road in Amboseli National Park, and various internal circuits in
Nairobi National Park and Chyulu National Park.
The Parks have been categorized into wilderness parks, urban safari, mountain-
climbing, scenic and special interest & sanctuaries to target a wider range of tourist
interests.
Accommodation within the parks has been increased to provide more premium beds.
This added value justifies the increase of park entry fees for Lake Nakuru and
Amboseli National Parks in order to facilitate control of numbers due to fragility of
the environmental and the high demand for the sites.
The parks have also been branded and themes developed for each park.

237
Objective:
To increase re-vamp/equip select high-potential parks in order to increase their
surrender value and contribution to the economy and specifically increase revenue
from existing Premium Safari Parks by enhancing tourist access and experience, thus
increasing bed nights by 31% from 1.6 million to 2.3 million by 2012.
Kenya Vision 2030 Secretariat (2013)

238
APPENDIX 5: TOURISTS TO NATURAL ATTRACTIONS
Tourists to National attractions (2004-2009) '000 people
National attractions 2004 2005 2006 2007 2008 2009
Museums, Snake Parks 699.0 751.6 800.0 855.0 655.0 788.0
and Historical Sites
Nairobi National Park 92.5 99.9 100.0 150.0 102.0 121.0
Nairobi Safari Walk and 327.4 385.3 390.0 426.0 312.0 332.0
Animal Opharnage
Amboseli Game Reserve 101.6 126.2 130.0 164.0 122.0 123.0
Tsavo East National Park 158.5 180.1 190.0 231.0 189.0 194.0
Tsavo west National Park 92.7 105.7 110.0 131.0 77.0 81.0
Lake Nakuru National Park 257.0 344.6 355.0 386.0 272.0 287.0
Masai Mara National 240.0 285.2 300.0 344.0 265.0 266.0
Game Reserve
Malindi Marine Park 27.5 32.8 40.0 58.0 28.0 27.0
Abardare Game Reserve 44.2 48.3 55.0 71.0 33.0 23.0
Lake Bogoria National 64.5 65.7 70.0 85.0 55.0 43.0
Park
Meru National Park 6.4 8.9 10.0 18.0 10.2 12.0
Mount Kenya National Park 27.7 39.5 45.0 53.0 22.0 24.0
Samburu National Park 6.2 7.3 10.0 27.0 12.0 15.0
Kisite/Mpunguti Marine 51.7 59.2 65.0 76.0 51.0 77.0
Park
Mombasa Marine Park 32.3 36.2 40.0 56.0 41.0 45.0
Watamu Marine Park 28.4 32.4 35.0 55.0 21.0 25.0
Hell's Gate National Park 38.9 35.6 40.0 75.0 23.0 24.0
Haller's Park 101.2 100.8 110.0 184.6 121.0 123.0
Kisumu Impala Sanctuary 63.3 87.9 100.0 153.0 110.0 118.0
Other Tourist Attractions 863.5 861.6 863.6 1,003. 2 620.6 1,249.0
Source:Euromonitor International (2011)
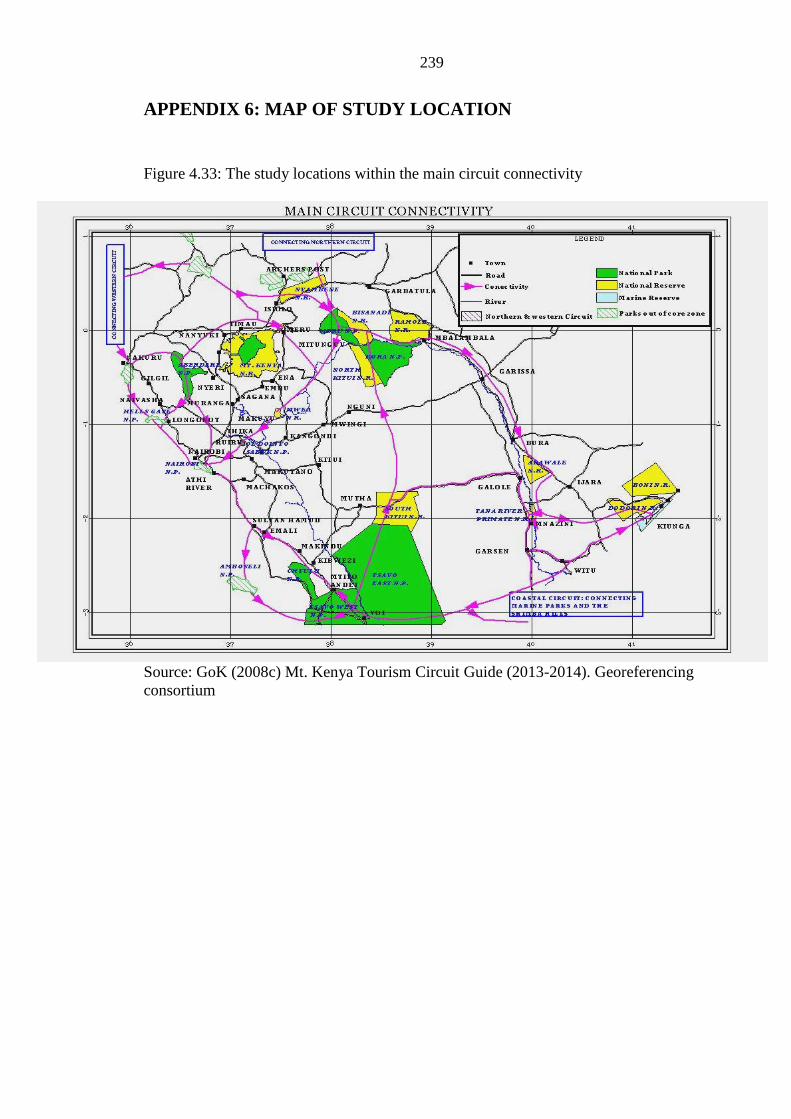
239
APPENDIX 6: MAP OF STUDY LOCATION
Figure 4.33: The study locations within the main circuit connectivity
Source: GoK (2008c) Mt. Kenya Tourism Circuit Guide (2013-2014). Georeferencing
consortium