THE EFFECTS OF WELDING HEAT INPUT ON THE - Doria
178
Markku Pirinen THE EFFECTS OF WELDING HEAT INPUT ON THE USABILITY OF HIGH STRENGTH STEELS IN WELDED STRUCTURES Acta Universitatis Lappeenrantaensis 514 Thesis for the degree of Doctor of Science (Technology) to be presented with due permission for public examination and criticism in Auditorium 1381 at Lappeenranta University of Technology, Lappeenranta, Finland, on the 25th of May, 2013, at noon.
Transcript of THE EFFECTS OF WELDING HEAT INPUT ON THE - Doria

Markku Pirinen
THE EFFECTS OF WELDING HEAT INPUT ON THE USABILITY OF HIGH STRENGTH STEELS IN WELDED STRUCTURES
Acta Universitatis Lappeenrantaensis 514
Thesis for the degree of Doctor of Science (Technology) to be presented with due permission for public examination and criticism in Auditorium 1381 at
Lappeenranta University of Technology, Lappeenranta, Finland, on the 25th of May, 2013, at noon.

2
Supervisor Professor Jukka Martikainen Faculty of Technology Department of Mechanical Engineering Lappeenranta University of Technology Finland
Reviewers Professor Victor Karkhin Department of Welding and Laser Technologies St.Petersburg State Polytechnical University 29 Polytechnicheskaya, St. Petersburg 195251 Russia
Professor emeritus Algirdas Bargelis (Honorary Doctor of Lappeenranta University of Technology) Faculty of Mechanical Engineering and Mechatronics Department of Manufacturing Technologies Kaunas University of Technology Kęstučio St. 27, LT-44025 Kaunas Lithuania
Opponents Professor Victor Karkhin Department of Welding and Laser Technologies St.Petersburg State Polytechnical University 29 Polytechnicheskaya, St. Petersburg 195251 Russia
Professor emeritus Algirdas Bargelis (Honorary Doctor of Lappeenranta University of Technology) Faculty of Mechanical Engineering and Mechatronics Department of Manufacturing Technologies Kaunas University of Technology Kęstučio St. 27, LT-44025 Kaunas Lithuania
ISBN 978-952-265-399-4 ISBN 978-952-265-400-7 (PDF)
ISSN-L 1456-4491 ISSN 1456-4491
Lappeenrannan teknillinen yliopisto Yliopistopaino 2013

i
ABSTRACT
Markku Pirinen
The effects of welding heat input on the usability of high strength steels in welded structures.
Lappeenranta 2013
174 pages plus 4 appendices at 4 pages
Acta Universitatis Lappeenrantaensis 514
Diss. Lappeenranta University of Technology
ISBN 978-952-265-399-4
ISBN 978-952-265-400-7 (PDF)
ISSN-L 1456-4491, ISSN 1456-4491
High strength steel (HSS) has been in use in workshops since the 1980s. At
that time, the significance of the term HSS differed from the modern conception
as the maximum yield strength of HSSs has increased nearly every year. There
are three different ways to make HSS. The first and oldest method is QT
(quenched and tempered) followed by the TMCP (thermomechanical controlled
process) and DQ (direct quenching) methods.
This thesis consists of two parts, the first of which part introduces the research
topic and discusses welded HSS structures by characterizing the most
important variables. In the second part of the thesis, the usability of welded HSS
structures is examined through a set of laboratory tests.
The results of this study explain the differences in the usability of the welded
HSSs made by the three different methods. The results additionally indicate that
usage of different HSSs in the welded structures presumes that manufacturers
know what kind of HSS they are welding. As manufacturers use greater
strength HSSs in welded structures, the demands for welding rise as well.

ii
Therefore, during the manufacturing process, factors such as heat input, cooling
time, weld quality, and more must be under careful observation.
Keywords: high strength steel, usability, heat input, cooling time, high strength
steel filler metal
UDC 678.029.43:621.791:624.078.45:624.014.2

iii
ACKNOWLEDGEMENTS
This thesis has been carried out in the Department of Mechanical Engineering
at Lappeenranta University of Technology.
I would like first to thank Professor Jukka Martikainen for his guidance
throughout this process. Your support in the major point of my work gave me
bottom line that I can clarify in this journey.
I want to express my utmost gratitude to Dr. Paul Kah, Dr. Mika Lohtander and
Professor Timo Björk. You have given me a positive example to follow and
great advice to help me to finish this thesis. Timo, you always supported me in
my endeavors despite that fact that you were often very busy.
I offer my sincere thanks to my colleagues for their friendly support and for our
pleasant working atmosphere. Special thanks go to Harri Rötkö, Antti
Heikkinen, Antti Kähkönen and Esa Hiltunen. You have done great work in the
laboratory during test processes. I also wish to thank the department
secretaries, Ms. Kaija Tammelin and Anna-Kaisa Partanen, for all their support
in administrative issues. I also cannot forget the work of all the steel structures
laboratory staff. You are all professional and I am proud that I have had
opportunity to research with you.
There are also many other people from Lappeenranta University of Technology
that have not been mentioned, but I believe they know their contribution to this
dissertation. Thank You.
I thank my proofreader Miss Jennifer Riley. You have worked hard to correct my
thesis into flowing English.
Despite the distance between our homes, my children, their spouses, and my
grandchildren are always on my mind. Your comments and lovely support
during this process have been the power which has seen me through this work.

iv
My dearest Pirjo- thank you for your affection and patience during this journey.
Without you, this never would have been possible.

v
CONTENTS
ABSTRACT ACKNOWLEDGEMENTS TABLE OF CONTENTS LIST OF ABBREVIATIONS AND SYMBOLS Standards ......................................................................................................... xii 1. INTRODUCTION .......................................................................................... 14
1.1. Background ............................................................................................ 14 2. STATE OF ART ............................................................................................ 16
2.1. What is HSS? ........................................................................................ 17 2.2. Effects of alloying elements in HSS and in its weld ............................... 19
2.2.1. Aluminium and Silicon ...................................................................... 22 2.2.2. Niobium ............................................................................................ 23 2.2.3. Vanadium ......................................................................................... 24 2.2.4. Titanium ........................................................................................... 25 2.2.5. Zirconium ......................................................................................... 27 2.2.6. Boron and Copper............................................................................ 27 2.2.7. Manganese and Nickel .................................................................... 28 2.2.8. Rare-earth elements ........................................................................ 28
2.3. Microstructure of welded HSS structure ................................................ 29 2.3.1. Microstructure and physical features of the HAZ ............................. 31 2.3.2. Microstructure of weld ...................................................................... 34
2.4. Undermatched, matched and overmatched filler metal .......................... 37 2.5. Heat input and cooling time ................................................................... 42
3. SCOPE OF THE RESEARCH ...................................................................... 47 4. AIM OF THE RESEARCH............................................................................. 50 5. RESEARCH METHODS ............................................................................... 52 6. EXPERIMENTAL INVESTIGATIONS ........................................................... 53
6.1. Experimental arrangement..................................................................... 53 6.1. Joint geometries and preparation .......................................................... 55 6.3. Test set up ............................................................................................. 58 6.4. Material properties ................................................................................. 61 6.5. Standard tests ........................................................................................ 69 6.6. Additional material test .......................................................................... 71
6.6.1. CTOD test ........................................................................................ 72 6.6.2. Compared microstructure examination ............................................ 81
7. RESULTS AND DISCUSSION ...................................................................... 83 7.1. Visual test .............................................................................................. 83 7.2. Macro photography ................................................................................ 83 7.3. Micro photography ................................................................................. 92 7.4. Radiographic tests ............................................................................... 103 7.5. Surface crack detection ....................................................................... 103 7.6. Transverse tensile test ......................................................................... 104 7.7. Transverse bend test ........................................................................... 112 7.8. Impact test ........................................................................................... 115 7.9. Hardness test ....................................................................................... 123 7.9. CTOD tests .......................................................................................... 129

vi
7.11. Additional microstructure tests ........................................................... 135 7.11.1. Microstructure of the base material .............................................. 136 7.11.2. Microstructure of weld metal ........................................................ 137 7.11.3. Microstructure of HAZ of QT and TMCP HSS .............................. 138 7.11.4. Comparison of HAZ microstructure of steels QT and TMCP ....... 147 7.11.5. Microstructure study of CTOD samples after simulated welding thermal cycle ............................................................................................ 150
8. DIVERGENCE IN MANUFACTURERS’ HSS’s WITH DIFFERENT HEAT INPUTS ........................................................................................................... 152 9. CONCLUSIONS .......................................................................................... 154 10. FUTURE WORK ....................................................................................... 157 11. SUMMARY ................................................................................................ 158 References...................................................................................................... 160

vii
LIST OF ABBREVIATIONS AND SYMBOLS Abbreviations Explanation 9R Cu A copper particle type
A Ampere
A Austenitising
A5 Elongation at break %
AC1 The temperature at which austenite starts to form
when heated.
Ac3 In hypoeutectoid steel, the temperature at which the
transformation of ferrite into austenite is completed.
AcC Accelerated-Cooled
AF Acicular Ferrite
AHSS Advanced High Strength Steel
Al Aluminium
APFIM Atom Probe Field Ion Microscopy
ASTM American Society for Testing and Materials
a/W Overall crack depth/ specimen width
B Boron
BH Bake Hardenable
Bs Temperature where bainite starts to form
C Carbon
CCT Continue-Cooling-Temperature (diagram)
CEV Carbon Equivalent Value (IIW)
CET Carbon Equivalent Value (SEW 088)
CGHAZ Coarse-Grain Heat Affected Zone
CJP Complete Joint Penetration
CMn Carbon Manganese
Cr Chromium
CTOD Crack-Tip Opening Displacement
Cu Copper
DP-CP Dual Phase or Complex Phase
DQ Direct Quenching

viii
DQ&T Direct Quenching and Tempering
E Welding Energy
EN European Standard
exp Exponent
Fe Iron
FCAW Flux-Cored Arc Welding
FGHAZ Fine Grane Heat Affected Zone
FSP Ferrite Site Plate
GBF Grain Boundary Ferrite
GMA Gas Metal Arc
GMAW Gas Metal Arc Welding
HAZ Heat Affected Zone
HB Brinell Hardness
HBW Brinell Hardness specifies the use of a tungsten car-
bide ball indenter
HIZ Heat Impact Zone
HSLA High Strength Low Alloy
HSS High Strength Steel
HV Vickers Hardness
HY High Yield Strength
ICCGHAZ Intercritically reheated Coarse-grain Heat Affected
Zone
ICHAZ Inter-Critical Heat Affected Zone
IF-HS High Strength Interstitial Free
IIW International Institute of Welding
IS Isotropic
ISO International Standard Organization
J Joule
lHAZ/e HAZ width to sample thickness
K Kelvin
kg Kilogram
kJ/mm Kilo Joule/ millimeter
M Thermomechanically rolled

ix
M-A, M/A Martensite-Austenite
MAG Metal Active Gas (welding)
Mg Magnesium
MIG Metal Inert Gas
min Minute
ML Lath Martensite
mm Millimeter
Mn Manganese
MnS Manganese Sulphate
Mo Molybdenum
MPa MegaPascal
MS Martensitic
Ms Temperature where martensites start to form
N Nitrogen
N Normalized
N Newton
Nb Niobium, Columbium
NDT Non-destructive Testing
Ni Nickel
Nital HNO3 + ethanol
O Oxygen
P Phosphorus
P180, P400 Degree of coarseness
PCM Carbon equivalent formula according to Ito-Bessyo
pf polygonal ferrite
PF Pearlite and Ferritic
PJP Partial Joint Penetration
ppm Parts per million
pWPS Preliminary Welding Procedure Specification
Q Quenched
Q Heat amount
QL Quenched and Tempered+ Low notch toughness
temperature

x
QT Quenched and Tempered
S Sulphur
s Second
s Plate Thickness
SA-Weld Submerged Arc Weld
SE(B) Three point bend specimen
SFS Finnish Standard Association
Si Silicon
SiC Silicon carbide
SMA Submerged Arc (Welding)
Sn Tin
StPSPU St. Petersburg State Polytechnic University
T Tempered
t8/5 Cooling time from 800 °C to 500 °C
∆t8/5 Cooling time from 800 °C to 500 °C
Ta Tantalum
TEM Transmission Electron Microscopy
Ti Titanium
TiN Titanium Nitride
TiO Titanium Oxide
TM Thermomechanical
TMCP Thermomechanical Controlled Process
Tp Peak Temperature
TRIP Transformation-Induced Plasticity
TTT Time-Temperature-Transformation (diagram)
U.S.Navy United State Navy
V Vanadium
V Voltage
W Watt
W Tungsten
Wf Windmanstatten ferrite
WM Weld Metal
WPS Welding Procedure Specification

xi
wt% Mass fraction
X-ray Röntgen radiation
Zr Zirconium
YAG Yttrium-Aluminium-Garnet–laser
ε-Cu epsilon copper
μm micrometer
α alpha
α ferrite
ɣ gamma
ɣ austenite
π pi
μ mu
δ delta
λ lambda
σ sigma
∞ Infinite
°C degrees Celsius, degrees centigrade
% percent
∆ delta
η eta
η arc heat efficiency

xii
Standards
ASTM E 1290-2 Standard test method for crack-tip opening displacement
(CTOD) fracture toughness measurement
ASTM E 112-10 Standard Test Methods for Determining Average Grain Size
SEW 088:1993 German standard, weldable fine grained steels; guidelines
for processing, particular for fusion welding
SFS-EN 10204 Metallic products. Types of inspection documents
SFS-EN 1321 Destructive tests on welds in metallic materials.
Macroscopic and microscopic examination of welds
SFS-EN 1435 Non-destructive examination of welds. Radiographic
examination of welded joints
SFS-EN 571-1 Non destructive testing. Penetrant testing. Part 1: General
principles
SFS-EN ISO 148-1 Metallic materials. Charpy pendulum impact test. Part 1:
Test method (ISO 148-1:2009)
SFS-EN ISO 15164-1Specification and qualification of welding procedures for
metallic materials. Welding procedure test. Part 1: Arc and
gas welding of steels and welding of nickel and nickel
alloys.
SFS-EN ISO17637 Non-destructive testing of welds. Visual testing of fusion-
welded joints (ISO 17637:2003)
SFS-EN ISO 23277 Non-destructive testing of welds. Penetrant testing of welds.
Acceptance levels (ISO 23277:2006)
SFS-EN ISO 5173 Destructive tests on welds in metallic materials. Bend tests
(ISO 5173:2009)
SFS-EN ISO 4063 Welding and allied processes. Nomenclature of processes
and reference numbers (ISO 4063:2009, Corrected version
2010-03-01)
SFS-EN ISO 4136 Destructive tests on welds in metallic materials. Transverse
tensile test (ISO 4136:2001)

xiii
SFS-EN ISO 6057-1Metallic materials. Vickers hardness test. Part 1: Test
method (ISO 6507-1:2005)
SFS-EN ISO 6892-1Metallic materials. Tensile testing. Part 1: Method of test at
room temperature (ISO 6892-1:2009)

14
1. INTRODUCTION
Welding is the most commonly used method to join different types of structures.
In many respects, joints are the most critical components of a load-bearing steel
structure. In order for the final product to be properly developed, a number of
factors must be considered when manufacturing individual components,
including design, processes, inspection and quality control of structure. At low
service temperatures, questions about the ductility of the welded joint can arise,
as the welded structure tends to low transition temperatures. This is especially
the case if the joint is produced from high strength steels (HSSs).
HSS has been in use in workshops since the 1980’s. At the time, the
significance of the term HSS differed from the modern conception because
maximum yield strength of HSSs has increased nearly every year. During the
1980’s, the maximum yield strength of weldable HSS was 500 MPa, whereas
today it is at least 1000 MPa or more. In the beginning, only a few
manufacturers had HSS, which was represented through a limited assortment
of products. Today, HSS is constructed worldwide with most of the modern
global production consisting of structural steel which is measured in tons with
an approximate yield strength 355 MPa.
1.1. Background
The need of utilization of HSS grows continuously. Currently, HSSs are used
more frequently and in a diverse number of industries. Primarily, HSS was just
used in the car industry, but today the material is used in a more diverse
assortment of industries and locations including the arms of cranes and the
frames of lumber carriers, although this list is by no means extensive.

15
To date, HSS has not been formally standardized. At the lower end, structure
steels have a yield strength in the range of 235-355 MPa. Recent literature has
stated that strong steels should have yield strength of at least 460 MPa, while
steels with a yield strength of more than 550 MPa should be categorized as
ultra HSSs. Today, the yield strength of some steel has increased to 1100 MPa,
while in the commercial sector, steel with a rating of up to 1300 MPa (1500
MPa) is sold.
There are three different ways to make HSS. First, the oldest method is the QT
method (quenched and tempered method), followed by the TMCP
(thermomechanical controlled process) and finally, the last method is direct
quenching (DQ). The common goal of all of these above mentioned production
methods is to create a steel of high yield strength and good ductility. All the
steels that are created using one of these three different methods (QT, TMCP
or DQ) have a bainite and/or martensite small microstructure in the main
structure. TMCP steel can also have a ferrite-bainite main structure. This small
microstructure is created through the alloying of various microelements such as
niobium, titanium, vanadium, and boron, which in turn make inclusions like
carbides and nitrides. Together with fast cooling and tempering, the resulting
microstructure is small and the hardness of structure is high despite the small
content of carbon. Some manufacturers have developed DQ steel to replace QT
steel using this new method (Porter 2006).
Additionally, chromium, nickel, molybdenum, aluminium, carbon, magnesium,
silicon, phosphorus and other alloying elements are added (or are not taken
away during the manufacturing process) to iron to make HSS. It is typical of
HSSs to have a low carbon content which gives the steel a lower CEV (Carbon
Equivalent Value) and good weldability.
Before starting to use HSS in old structures, the entire structure must be
redesigned. Simply thinning the structures is not enough as buckling, springing,
or bending can easily occur. In their publication from GMA-welded AHSS
structure, Kaputska et al. (2008) explained that it is important for designers and

16
manufacturing engineers to understand the factors that may be affected in
these performances. As there are a large variety of manufacturers that make
HSSs using different methods, it is important to clarify differences between
these steels. Sampath (2006) explained that manufacturers must exercise
extreme caution when transferring allowable limits of certified secondary
construction practices from one type of HSS plate steel to another, even for
same plate thickness.
2. STATE OF THE ART
A large number of scientific reports and design guidelines have been published
regarding the welding of HSSs (Zeman 2009, Shi & Han 2008, Liu et al. 2007,
Pacyna & Dabrowski 2007, Yayla et al. 2006, Juan et al. 2003, Keehan et al.
2003, Miki et al. 2002, Zaczek & Cwiek 1993). Special attention has been
devoted to welding HSSs with matching filler material, however, only a limited
number of publications consider welding HSSs with undermatching filler
material (Rodriques et al 2004a). In the 1980s HSS was pioneered in Japan
and organized so that individual manufacturers had their own research projects
on specific steels. As a result of this rigorous research, today’s steels are of
much better caliber and quality.
There are three different popular and widely available HSSs on the market
including those manufactured through the QT, TMCP and DQ processes. QT
has been available the longest and DQ HSS has only recently been developed
and acquirable on the market. Consequently, most of the research has focused
on QT steels, however DQ steel research has emerged in the 2000s and
recently, comparing all three HSSs has been an emerging field of investigation.

17
2.1. What is HSS?
The term HSS is variable concept. Today, HSSs are steels with a yield strength
greater than 550 MPa. Classifying steels according to their yield strength allows
for the correct comparison between different types of steels. Fig. 1 (World Auto
Steels 2009) depicts the classifications of different HSS types.
Conventional HSSs (HSS) have a yield strength lower than 550 MPa. Included
in this group of steels are IF-HS (High Strength Interstitial Free) steels, BH
(Bake Hardenable) steels, IS (Isotropic steels), CM (Carbon Magnanese) steels,
and HSLA (High Strength Low Alloy) steels (World Auto Steel 2009).
Advanced HSSs (AHSS) have yield strengths greater than 550 MPa. Some
steels that fit into this category are TRIP (Transformation-Induced Plasticity)
steels, DP-CP (Dual Phase or Complex Phase) steels, and MS (Martensitic)
steels. MS steels are used in many different industries and can be found in
cranes, earth-movers, harvesters, and more.
Traditional HSSs, such as high-strength low-alloy (HSLA), have more than three
decades of shop experience upon which to build a technology base. In contrast,
users of AHSS demanded a fast track accumulation of knowledge and
dissemination as they implemented these new steels. A considerable challenge
arises along the total elongation and yield strength axes, as the trend shows
that higher strengths steels have decreasing total elongation percentages.
Manufacturers are currently looking for ways to maintain the total elongation
percentages with steels of increased yield strength.
18
Figure 1. Relationship between yield strength and total elongation for various
types of steels (World Auto Steel 2009).
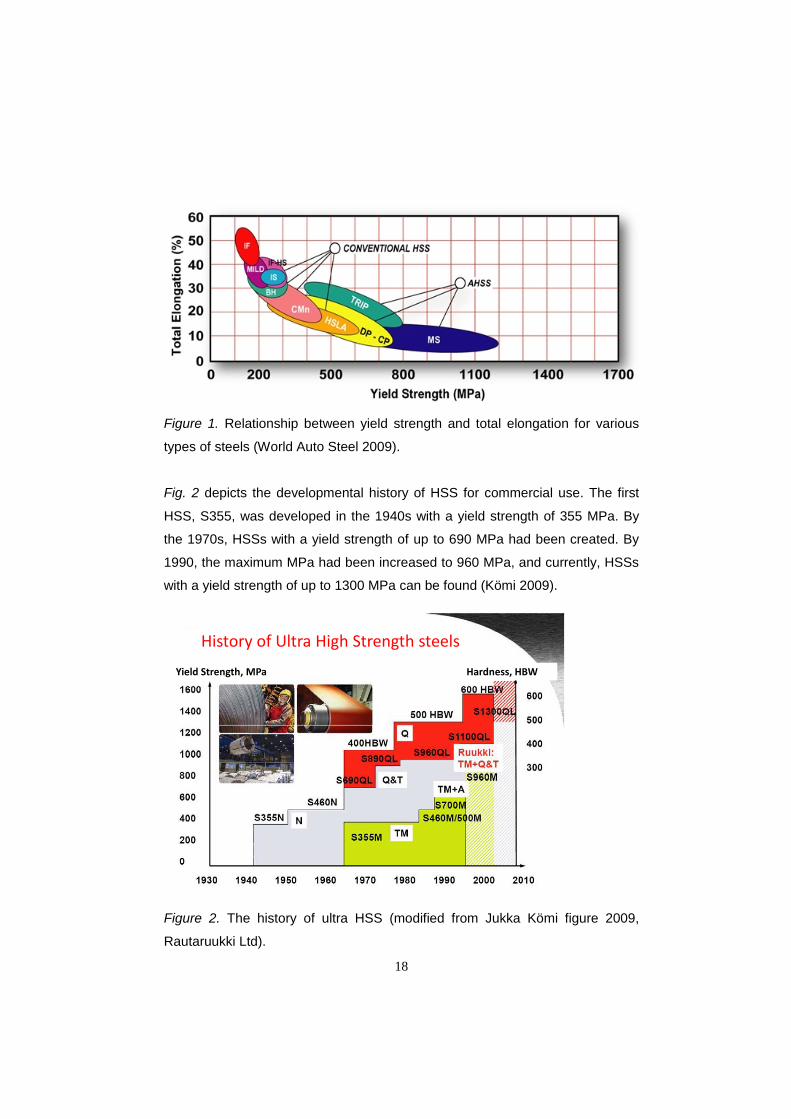
Fig. 2 depicts the developmental history of HSS for commercial use. The first
HSS, S355, was developed in the 1940s with a yield strength of 355 MPa. By
the 1970s, HSSs with a yield strength of up to 690 MPa had been created. By
1990, the maximum MPa had been increased to 960 MPa, and currently, HSSs
with a yield strength of up to 1300 MPa can be found (Kömi 2009).
History of Ultra High Strength steels
Yield Strength, MPa Hardness, HBW
Figure 2. The history of ultra HSS (modified from Jukka Kömi figure 2009,
Rautaruukki Ltd).

19
HSSs have been used in the war industry since 1946. The U.S. Navy has used
high yield (HY) strength steel, including HY-80, HY-100, and HY-130 steels
(Moon et al. 2000 according to Holsberg, P.W. et al. 1989). However, these
steels were originally quite expensive to make and additionally, the knowledge
of this new generation of steel was kept within the government and therefore
the private sector was, for a time, excluded from this new industry. The HY-
strength steel corresponds with the ISO system, where the tensile strength of
HY-70 (70 ksi) corresponds to 490 MPa, HY-80 (80 ksi) corresponds to 700
MPa, HY-100 (100 ksi) corresponds to 780 MPa, HY-120 (120 ksi) corresponds
to 840 MPa and HY-130 (130 ksi) corresponds to 910 MPa.
2.2. Effects of alloying elements in HSS and in its weld
Alloying elements are used in HSSs to reduce the phase microstructure. There
are many appropriate alloying elements that can be used when making HSSs,
including Cr, W, Mo, V, B, Ti, Nb, Ta, Zr, Ni, Mn and Al. Every alloy or blend of
alloys has a different effect on the steel. These elements compose inclusions
and precipitations such as nitrides, carbides, carbonitrides and composites in
the HSS and inhibit grain growth. In order to create a HSS with a small grain
size an alloy or combination of alloys should be used, and additionally planned
rolling can contribute to the creation of a steel with the above mentioned desired
characteristics.
To prevent the growth of austenite grains, a maximum temperature, which is
dependent on the alloying element, where carbides and nitrides will dissolve to
austenite, must not be exceeded. Fig. 3 shows how carbide and nitride
inclusions quickly dissolve into austenite once these temperatures have been
exceeded.

20
Figure 3. The effects of microalloying on Al, Zr and Ti to austenite grain growth
starting temperature (modified from Harri Nevalainen figure 1984).
Titanium, niobium, zirconium, and vanadium are also effective grain growth in-
hibitors during reheating. However, for steels that are heat treated (QT, TMCP
and DQ steels) these four elements may have adverse effects on hardenability
because their carbides are quite stable and difficult to dissolve in austenite prior
to quenching (Metal Handbook 1990).
In many research projects alloying elements of HSSs and its welds have been
under examination. For example, Kou (2003) reported that increasing the
alloying content of weld metal increases its hardenability by pushing the nose of
continuous cooling curves to longer times. Moon et al. (2000) noticed that the
microhardness variations in the weld and HAZ areas can be examined to
correspond with the microstructure of the weldment. At the same time they
concluded that the HAZ of the base metal was the hardest region in each
weldment examined, regardless of filler metal type, base metal, or heat input.
Maximum hardness was reached about midway through the HAZ of each

21
weldment studied. Fig. 4 describes hardness areas with different heat inputs
(4.33 kJ/mm, 2.17 kJ/mm and 1.18 kJ/mm) using HSSs HSLA100 and HY80.
Figure 4. Microhardness maps of welds made with three different filler metals
and different welding parameters. The corresponding microhardness scale is
included at the bottom of this figure (Moon et al. 2000).
Hamada (2003) reported that it is necessary to combine the values of the
constituents in the steel material and the welding conditions after taking into
account the necessary joint properties. In their research, they used five different
HSSs, HT50, HT60, HT80 and two HT100. They concluded that the properties
of the weld HAZ, especially those of the coarse grain HAZ and fine grain HAZ

22
heated to more than the AC3 transformation point, are determined by the
composition of the steel along welding conditions, as seen in fig 5.
Figure 5. Structural distribution within multi-layer welded joint HAZ (Hamada
2003 according to Shishida et al. 1987).
Toughness deterioration is one of worst things that can happen when welding
HSSs. Caballero et al. (2009) investigated HS bainite steel and concluded that
a high degree of microstructural banding, as a result of an intense segregation
of manganese during dendritic solification, leads to a dramatic deterioration in
toughness in these advanced bainitic steels. They concluded that the stress
concentration associated with heterogeneous hardness distribution in the
microstructure can be considered a possible factor contributing to premature
crack nucleation.
2.2.1. Aluminium and Silicon
Aluminium (Al) is widely used as a deoxidizer and it was the first element used
to control austenite grain growth during reheating. When Al or silicon (Si) reacts
with oxygen, soft oxides are formed. These soft oxides do not create crack
initiations of growth similar to what is seen in TiO precipitations (Vähäkainu
2003). However, in HSSs it has been noticed that niobium (Nb) and titanium (Ti)
are more effective grain refiners than Al (Metal Handbook 1990). High Al

23
content weakens the toughness of steel, as it promotes the formation of
preferred orientation of ferrite and upper bainite. Free Al promotes forming local
areas which contain high contents of carbon, which are known as M-A islands.
This mechanism prevents carbon diffusion and the formation of carbides
(Matsuda et al. 1995).
With regard to Al, Kaputska et al. (2008) have also observed that while Al has
many effects in steel making, the CEV does not consider Al in its calculation.
Si is one of the principal deoxidizers used in steel making. Killed steels may
contain moderate amounts of Si, from 0 to a 0.6 % maximum (Metal Handbook
1990). Low-alloy steels are reinforced by Si, but Si does not affect the features
of low carbon steels (Harrison & Wall 1996).
2.2.2. Niobium
As an alloying element, Nb has an important role in HSS. The effects of niobium
on steel and HAZ are not solely derived from niobium. Niobium affects steel and
HAZ when it is combined with other alloying elements, such as Ti and V, and
precipitations. In the welded joints of HS steels, the effects of niobium depend
upon the heat input. If welding and using a low heat input, this will increase
impact toughness, while if a high heat input is used it will decrease the impact
toughness in the HAZ. In these HSSs, as carbon content increases, there in an
inverse relationship as the impact toughness decreases (Tian 1998; Hatting &
Pienaar 1998).
In certain amounts, Nb (0.02-0.05 wt.%) increases austenite recrystallization
temperature, provides strengthening by forming thermally stable, Nb(C,N) and
Nb,Ti(C,N) precipitates. During fusion welding, the precipitates limit austenite
grain growth in the weld HAZ, and thereby limit hardenability or improve
weldability. Excessive amounts of Nb (>0.05 wt.%) can potentially impair HAZ
toughness in high heat input weldments (Sampath 2005). Small additions of Nb

24
increase the yield strength of carbon steel. The addition of 0.02 % Nb can
increase the yield strength of medium-carbon steel from 490 MPa to 700 MPa.
This increased strength may be accompanied by considerably impaired notch
toughness unless special measures are used to refine grain size during rolling.
Grain refinement during rolling involves special thermomechanical processing
techniques such as controlled rolling practices, low finishing temperatures for
final reduction passes, and accelerated cooling after rolling is completed (Metal
Handbook 1990).
In HSLA steel with niobium, granular bainite is dominant within a wider cooling
rate range. In addition, martensite is observed at high cooling rates with Nb
0.026 %, but is not produced in the same steel without Nb (Zhang et al. 2009).
Zhang also reports that at lower cooling rates, under 32 °C/s, Nb addition
suppresses grain boundary ferrite transformation and promotes the formation of
granular bainite. Li et al. (2001) have reported that the addition of 0.031 % Nb to
low carbon micro alloyed steel produced the largest size and greatest area of
M-A phase.
2.2.3. Vanadium
Vanadium (V) increases the austenite recrystallization temperature in HS steels.
It provides room temperature strengthening by forming VN, V(C,N) and (V,Ti)N
precipitates in ferrite (Sampath 2005). V also strengthens HSLA steels in two
ways. First, the precipitation hardens the ferrite and secondly, the precipitation
refines the ferrite grain size. The precipitation of V carbonitride in ferrite can
develop a significant increase in strength that depends not only on the rolling
process used, but also on the base composition. Carbon content above 0.13 to
0.15 % and Mn content of 1 % or more enhances the precipitation hardening,
particularly when nitrogen content is at least 0.01 %. Grain size refinement
depends on thermal processing (hot rolling) variables, as well as V content
(Metal Handbook 1990).

25
Chen et al. (2006) have reported that there is a correlation between V content
and the size of M-A particles. This is a direct correlation as the size of M-A
particles increase with increased V content from 0 % to 0.151 %. When
increasing V content, there is a decrease in the impact toughness in HSS. The
coarse austenite and ferrite grain and M-A constituent were thought to be the
main factors resulting in impact toughness deterioration.
Both Chen et al. (2006) and Zhang et al. (2009) reported after their experiments
on that the concentration of V should be limited to a low level, near 0.05 %. If
the V content is 0.1 % or more, this results in a greater area fraction of the M-A
phase, larger average and maximum sizes of M-A particles, and deterioration in
toughness.
2.2.4. Titanium
When considering the welding of steel, Ti is most important micro alloying
element. Stable Ti nitrides that form in high temperatures inhibit grain growth in
the HAZ. Consequently, because of this grain size CGHAZ cannot grow
destructively (Liu & Liao 1998).
Ti is unique among common alloying elements, because it provides both
precipitation strengthening and sulfide shape control. Small amounts of Ti
(<0.025 %) are also useful in limiting austenite grain growth in HSSs. However,
it is only useful in fully killed (aluminium deoxidized) steels because of its strong
deoxidizing effect. The versatility of Ti is limited because variations in O, N, and
S affect the contribution of Ti as a carbide strengthener (Metal Handbook 1990).
In controlled amounts (0.01-0.02 wt.%) Ti acts as a grain refiner, increases
rerystallization temperature, fixes solute nitrogen as TiN, and provides
strengthening by forming thermally stable, complex Ti(C,N) precipitates. During
fusion welding, TiN precipitates limit austenite grain growth in the weld HAZ,
thereby limiting hardenability and improving the HAZ strength and toughness.

26
Precipitation of TiN invariably reduces the HAZ toughness, especially at low
temperatures (Sampath 2005).
Ti can react with nitrogen in liquid condition. Large TiN precipitates will grow in
steel and their formation is easier when the Ti/N ratio is large. These kinds of
precipitates cannot prevent grain growth as the precipitates which form in lower
temperature. Precipitates which are big and angular can nucleate cracks and
decrease fatigue durability (Lee & Pan 1995). The size of some inclusions are
explained in fig. 6.
Figure 6. The nucleation ability of various inclusions (Lee & Pan 1995).
Ti improves HAZ microstructure and toughness of welded structure with three
inter-related mechanism. Those mechanism are refining of ferrite grains by the
pinning effect of thermally stable Ti-nitride and Ti-oxide particles which are
distributed in austenite, by formation of pure Ti-nitride and Ti-oxide particles
which disperse in austenite at high temperature and then this particles can be
as nucleation sites for acicular ferrite during the ɣ-α transformation. Third
mechanism is formation of fine nitrides which decrease the detrimental effect of
soluble nitrogen in ferrite (Rak et al. 1997).

27
2.2.5. Zirconium
Zirconium can also be added to killed high-strength low-alloy steels to improve
inclusion characteristics. This occurs with sulfide inclusions, where the changes
in inclusion shape improve ductility in transverse bending (Metal Handbook
1990).
2.2.6. Boron and Copper
Boron (B) is added to fully killed steel to improve hardenability. The average B
content in steels ranges from 0.0005 to 0.003 %. When B is substituted in part
for other alloys, it should be done only to alter the hardenability. The lowered
alloy content may be harmful for some applications; however B is most effective
in lower carbon steels (Metal Handbook 1990).
According to Moon et al. (2008), the addition of B to high strength low alloy
plate steel makes a fine martensite microstructure, which increases
hardenability by making the prior austenite grain boundary more stable.
Vickers hardness of base steels and CGHAZ increasing Cu and B content,
solid-solution hardening as uncovered by Moon et al. (2008) investigation. In
the same investigation, it was also noticed that Charpy V-notch toughness
showed an opposite tendency. This is mainly due to the formation of the hard
phase by increasing hardenability with Cu and B addition and where toughness
in the CGHAZ is decreased as compared to base steels.
The results published by Moon et al. (2008) indicate that Cu addition is not
useful to improve the toughness of the HAZ in high strength low alloy plate
steel. Hwang at al. (1998) studied that the structure of low-carbon (C 0.04 %)
copper-bearing (Cu 1.8 %) alloy steel plate manufactured by the DQ&T process
has been transformed into a fine structure with high dislocation density. During
tempering, fine NbC and ɛ-Cu particles are precipitated in large amounts, which

28
do not get coarsened even when the tempering temperatures rise, resulting in
excellent mechanical properties. The results of Hwang et al. (1998) indicate
that the addition of alloying elements and the application of the DQ&T process
to low-carbon alloy steel plates contribute to the production of plates with
excellent strength and toughness.
2.2.7. Manganese and Nickel
Manganese (Mn) improves the strength of steel without decreasing its impact
toughness and is commonly used in steel making. Mn reacts with oxygen and
sulphur quite easily and makes precipitations and is important because all non
hopeless effects are outclosed. The use of Mn needs to limited to under 1.5 %
as steel with over 1.5 % Mn content can be brittle (Vähäkainu 2003, Lindroos at
el. 1986). Excessive amounts Mn increase hardenability and reduce weldability
(Sampath 2005).
In his study, Keehan (2004) investigates the effects of Ni and Mn in weld metal.
TEM investigations in conjunction with APFIM (Atom Probe Field Ion
Microscopy) concluded a mixed microstructure of martensite, bainitic and
retained austenite at an alloying level where a fully martensite microstructure
would normally be expected. For increased levels of Mn, a harder and more
brittle mainly martensite microstructure formed. At lower levels of Mn a softer,
tougher and more easily tempered microstructure with greater amount of bainite
is formed. Ni reduction with Mn levels at 2 wt% lead to an increase in
toughness. Hardness results showed that lower Mn and Ni levels lead to a
softer weld metal (Keehan 2004).
2.2.8. Rare-earth elements
Rare-earth elements, principally cerium, lanthanum, and praseodymium, can be
used to provide shale control of sulphide inclusions. Sulphide inclusions, which
are plastic at rolling temperatures and thus elongate and flatten during rolling,

29
adversely affect ductility in the short transverse (through-thickness) direction.
The chief role of rare-earth additives is to produce rare-earth sulfide and
oxysulphide inclusions, which have negligible plasticity at even the highest
rolling temperatures. Excessive amount of cerium (>0.02 %) and other rare-
earth elements lead to oxide of oxysulphide stringers that may affect
directionally. Treatment with rare-earth elements is seldom used because they
produce relatively dirty steels. Treatment with calcium is preferred, because it
helps with sulphide inclusions shape control (Metal Handbook 1990).
2.3. Microstructure of welded HSS structure
The structure of the base metal of HSS is homogenous and the grain size is
small and regular, fig. 7. When the steel is heated during welding, the
homogenous microstructure changes immediately. The heat input in the HAZ is
different depending on how far the area is from the fusion zone. Many features,
such as hardness, ductility and impact toughness change radically, and in many
cases, to defective direction. The main structure in the base of HSS is tempered
martensite and/or bainite. In addition, there are other phases such as ferrite and
M-A constituent. Other important parts of structure are segregations of
inclusions and precipitations such as nitrides, carbides, carbonitrides and
composites.
Figure 7. Microstructure of TMCP HSS (own image 2010). Aspect ratio is 1:500.

30
Fig. 8 shows the schematic description from the HAZ area temperature during
steel welding. The width of the HAZ depends on heat input and cooling time. A
large proportion of inclusions and precipitations dissolve when the temperature
is high. When this happens, there are no nether inclusions or precipitations in or
near the fusion line.
HAZ area
Temperature
Weld
HAZ area
Liquid
Liquid + γ
Austenite
Bainite
A1-boundary 723 °C
Martensite
20
1. Weld metal, 2. Fusion line, 3. CGHAZ, 4. FGHAZ, 5. Partly austenite zone6. ICHAZ. T curve describe maximum temperature of base material during welding.
Figure 8. Maximum temperature of base material during welding and HAZ
microstructure after welding in steel (modified from Hitsaajan opas 2003).
Inclusions and precipitations are important in HSS making, as they are
processes which constrain the grain growth. The same texture, inclusions and
precipitations, occur in HSS weld metal. Inclusions of different shapes and
textures, including spherical and faceted, and agglomerations of particles were
observed in the weld metals when welding HSSs with matching filler metal. The
inclusions core mainly consists of a mixture of oxides of Ti, Mn, Si, and Al in
different proportions, reflecting a very complex deoxidation product.
Additionally, phases rich in either Mn and S, Si or Zr, C, and N, which indicates
the presence of Mn sulphides, Si, or Zr carbonitrides, were also observed
(Ramirez 2008).
31
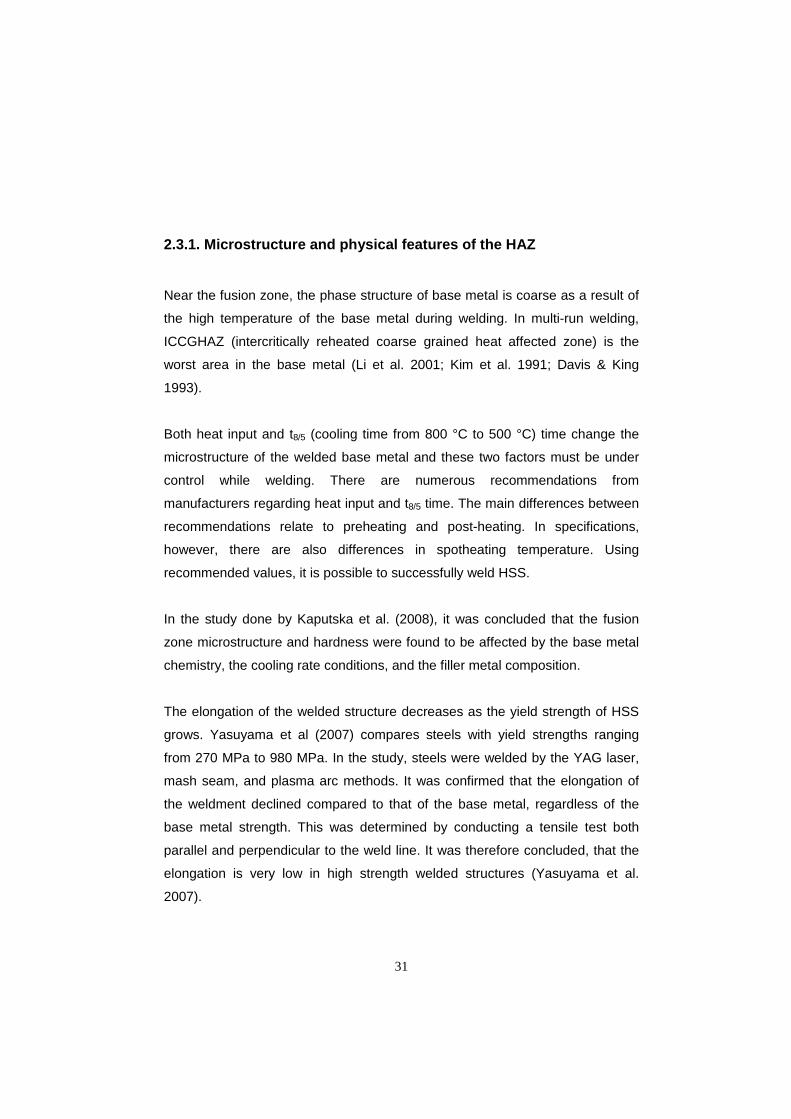
2.3.1. Microstructure and physical features of the HAZ
Near the fusion zone, the phase structure of base metal is coarse as a result of
the high temperature of the base metal during welding. In multi-run welding,
ICCGHAZ (intercritically reheated coarse grained heat affected zone) is the
worst area in the base metal (Li et al. 2001; Kim et al. 1991; Davis & King
1993).
Both heat input and t8/5 (cooling time from 800 °C to 500 °C) time change the
microstructure of the welded base metal and these two factors must be under
control while welding. There are numerous recommendations from
manufacturers regarding heat input and t8/5 time. The main differences between
recommendations relate to preheating and post-heating. In specifications,
however, there are also differences in spotheating temperature. Using
recommended values, it is possible to successfully weld HSS.
In the study done by Kaputska et al. (2008), it was concluded that the fusion
zone microstructure and hardness were found to be affected by the base metal
chemistry, the cooling rate conditions, and the filler metal composition.
The elongation of the welded structure decreases as the yield strength of HSS
grows. Yasuyama et al (2007) compares steels with yield strengths ranging
from 270 MPa to 980 MPa. In the study, steels were welded by the YAG laser,
mash seam, and plasma arc methods. It was confirmed that the elongation of
the weldment declined compared to that of the base metal, regardless of the
base metal strength. This was determined by conducting a tensile test both
parallel and perpendicular to the weld line. It was therefore concluded, that the
elongation is very low in high strength welded structures (Yasuyama et al.
2007).

32
Lambert et al. (2000) studied the microstructure of the martensite-austenite
constituent in HAZ of HSLA steel welds in relation to toughness properties. The
material used in the research was HSLA steel, with a yield strength of 433 MPa.
Charpy impact test results indicated that the correlation between the toughness
and microstructure of low carbon steel simulated HAZs is rather complex. The
amout of M-A constituents and coarseness of bainite are major metallurgical
factors affecting the impact properties (Lampert et al. 2000). In the same study,
Lampert et al. (2000) also noticed that retained austenite and low carbon
transformed martensite have significantly different influences on cleavage
fracture and impact properties of simulated HAZ microstructure, where freshly
transformed high carbon martensite is much more deleterious than retained
austenite.
Metallographic investigations demonstrated the existence of different M-A
constituents. In the most brittle zones (the ICCGHAZ), retained austenite was
mostly located between bainitic packets, whereas blocky martensite and mixed
M-A constituents were located at prior austenite grain boundaries. In mixed M-A
constituents, austenite was distributed at the periphery, while martensite was
located at the centre. This distribution of retained austenite could be a result of
chemicals and/or the mechanical stabilization mechanism (Lambert et al. 2000).
Furthermore, through TEM, Lambert et al. (2000) found a constituent retained
austenite at room temperature. The presence of constituent may influence the
thermal stability of retained austenite, as they propagate before transformation.
These observations constitute preliminary investigations of the transformation
mechanism of retained austenite islands.
Moon et al. (2000) compared two new ultra-low-carbon matching filler metals,
with HY steel (High yield, quenched and tempered, steel) of HSLA steel.
Despite the low heat input, 1.2 kJ/mm, the fusion zone hardness of two of the
new ultra-low-carbon matching filler metals are comparable to the base metal
hardness. The results were achieved through researching the microhardness
variations in the weld and HAZ areas and corresponding this with the

33
microstructure of the weldment. In addition, the heat affected zone of the base
metal was the hardest region in each weldment examined, regardless of filler
metal type, base metal, or heat input. The maximum hardness occurs about
midway through the HAZ of each weldment studied, rather than adjacent to the
fusion boundary (Moon et al. 2000).
Additionally, Moon et al. (2000) studied that the fusion zone consists
predominantly of lath ferrite with varying amounts (depending on location) of
untempered fine lath martensite, as well as small amounts of interlath retained
austenite and oxide inclusions. No polygonal ferrite or solid-state precipitates
such as carbides or carbonitrides were observed in the fusion zone. The local
variations in microhardness correlate well with the local variations in the
microstructure.
Research carried out to study the research done by Mohandas et al. (1999) has
displayed that the high Ms and Bs temperatures of steel are also responsible for
low softening tendency. Steel, which has longer critical cooling time for full
martensite transformation, exhibited greater resistance for softening with high
heat inputs.
In the investigation of heat input it was realized that the number and
morphology of the ML (lath martensite) in the HAZ had some variations under
different weld heat inputs (E= 0.92 ~ 1.86 kJ/mm). The carbon gathers near the
grain boundary and then becomes a carbide with Fe, Mn, Mo etc. so that the
impact toughness decreases. The carbide has strong direction bonds with the
lath microstructure which provides the low energy passage for the impact
fracture and increases brittle crack sensitivity. The fine precipitate distributed
inside the grain or at the boundary is favorable to improve toughness. By
controlling weld heat input (E ≤ 2.0 kJ/mm), the presence of carbides in the HAZ
can be removed, and therefore the impact toughness in this zone can be
assured. It was also indicated from the test results of Juan at al. (2003) that the
cooling time (t8/5) should be controlled (t8/5 10-20 s) to improve toughness in the
HAZ. This is so, because the cooling time increases with larger weld heat

34
inputs, which increases the potential for the deterioration of impact toughness in
the HAZ (Juan et al. 2003).
When welding ultra HSS, with a yield strength of more than 900 MPa, with MAG
welding, it is important to precisely and accurately control heat input to the
lowest possible temperatures. Zeman (2009b) examined ultra HSS, with a yield
strength of 1100 MPa. In the case of the joint made by the MAG method, the
weld is characterized by its bainitic structure. In the HIZ (Heat Impact Zone),
Zeman observed a purely martensite structure or mixture of bainite and
martensite structures (Zeman 2009b). In the same study, Zeman (2009b)
noticed that ultra HSS requires the linear energy of welding to be precisely
adjusted. If the linear energy of welding is too low, there could be excessive
hardening of the HIZ, which increases the risk of cold cracking, whereas if the
linear energy of welding is too high, the strength properties can decrease.
2.3.2. Microstructure of weld
The microstructure of the weld in welded HSSs should be small and
homogeneous. Alloying elements are used to make inclusions in the weld and
these inclusions are the beginnings of solidifications. The inclusion density
tends to be quite high but the volume fraction is comparatively small. Ramirez
(2008) found in his research that in the HSS filler metal the volume fraction of
nonmetallic inclusions in most deposit HSS weld metals ranged from 0.2 to 0.6
%. In a few welds, the volume fraction was from 0.8 to 1.1 %. The inclusion
density observed in the welds ranged from 1.2 x 10⁸ to 5.4 x 10⁸ particles per
mm3, while the average inclusion diameter ranged from 0.3 to 0.6 μm and the
maximum inclusion diameter from 0.9 to 1.7 μm.
O and S levels correlate with the inclusion size and higher levels of O and S
increase the inclusion size. The average inclusion size does not drastically
change with combined O and S levels up to about 400 ppm. However, above

35
400 ppm, the average inclusion size increases with an increase of both O and S
levels in the weld metal (Ramirez 2008).
Ramirez (2008) has stated that there are dozens of different inclusions in HSS
filler metal. Table 1 describes these inclusions, while fig. 9 a and b show the
acceptable shape of spherical and angular inclusions, respectively. Finally, Fig.
10 shows the phase structure of one inclusion. The chemical composition of the
inclusion in region a (fig.10) is 32.2O-0.5Al-1.3Si-0.9S-51.4Ti-13.7Mn (TiO2), in
region b (fig.10) MnS, and in region c (fig.10) Ti-oxide.
a) b)
Figure 9. Inclusion of the weld in HSS (a) Spherical, (b) Angular (Ramirez
2008).
Figure 10. Composites of inclusion (Ramirez 2008).
The weld microstructure can be formed from many starting values. Fig. 11
illustrates those elements which must be taken into consideration when
estimating the microstructure of a weld. Additionally, Mistra et al. (2005)
researched different types of inclusions as seen in Table 1.

36
Figure 11. The various factors that play a role in deciding weld microstructure
(Modified from Basu & Raman 2002).
CHEMISTRY
WELD METAL MICROSTRUCTURE
HARDENABILITY ELEMENTS
INCLUSION CONTENT
JOINT DESIGN PARAMETERS
HEAT INPUT
• Plate thickness • Heat input • Thermal diffusivi-
ty • Joint geometry
• Current • Speed • Voltage
• Grain Boundary Ferrite
• Pearlite Ferrite
• Ferrite Site Plate
• Acicular Ferrite

37
Table 1. Characteristic of nonmetallic inclusions (modified from Ramirez 2008).
INCLUSION CHARACTERISTIC
INCLUSION CHEMICAL COMPOSITION DESCRIPTION
1
Region a — 50.1O-0.7Mg-1.6Al-3.9Si-2.8S-19.6Ti-21.4Mn O, Al, Si, S, Ti,
Mn rich Region b — 48.2O-0.9Mg-1.6Al-3.4Si-2.3S-22.2Ti-21.4Mn
2 51.4O-1.4Al-4.5Si-1.7S-18.1Ti-22.8Mn O, Al, Si, S, Ti,
Mn rich
3 Region a — 32.2O-0.5Al-1.3Si-0.9S-51.4Ti-
13.7Mn (Ti-O2) Composite inclu-sion Region b MnS, Region c Ti-Oxide
4
Region a — 32.3O-1.5Al-0.7Si-50.4Ti-15.1Mn
Ti-Mn oxide Region b — 35.4O-3.2Al-6.1Si-0.8S-26.5Ti-
28.0Mn Region c — 35.3O-4.4Al-9.6Si-1.4S-3.6Ti-
45.8Mn
Table 2. Classification of precipitates of HSS with a yield strength 770 MPa into
type I – IV based on size and morphology (Misra et al. 2005).
2.4. Undermatched, matched and overmatched filler metal
Filler metal also has quite a considerable effect on the welded structure of HSS
depending of the yield strength of filler metal corresponding with the yield
strength of base metal on the filler wire used. The filler metal can be classified
as either undermatched, matched or overmatched. The filler metal is
undermatched when the yield strength of the filler metal is below the yield
strength of the base metal. Matched filler metals have the same yield strength

38
as base metals, and overmatched filler metals have yield strength greater than
the base metals. Generally, HSSs are welded by undermatched or matched
filler metal, and overmatched filler metal is infrequently used as confirmed by
Porter (2006). Welding HSS requires a high quality welding process, however, it
is not economical to use overmatched filler metal for HSS as it does not garnish
any additional benefits.
Structural steels, whose yield strength is between 235 MPa and 460 MPa, are
usually welded with overmatched or matched filler material. The yield strength
of structural steels is lower compared to HSSs, and there are more possibilities
when welding these steels. The flexibility has allowed for a greater variety of
filler material research to be carried out with regards to structural steels.
Only a few research projects have used undermatching filler metal when
welding HSSs. A maximum undermatching valve of 10 % can be accepted for
class 690 MPa yield strength HSS (Toyota 1986, Satoh & al. 1975). Pisarski
and Dolby (2003) found out that in assessing the toughness of softened HAZs,
the test specimen must match the practical situation in terms of yield strength,
mismatch between weld deposit, and parent metal. They explained that the
fracture toughness of softened HAZ regions depended on the mismatch in
strength between the weld deposit and parent plate. Their research confirmed
that the worst case fracture toughness of softened HAZs occurred when the
HAZ undermatched in strength both the weld deposit and parent metal. Higher
toughnesses were measured when either the weld metal or parent steel
undermatched the HAZ in strength.
Their conclusions also elaborated that the tolerance to flaws in softened HAZs
critically depends on the fracture toughness of the HAZ region where tolerance
reduces rapidly in a situation where the cleavage is the dominant failure
mechanism (Pisarski and Dolby 2003).
In a study carried out by Umekuni and Masubuchi (1997), the tensile strength
test showed that the tensile strength of the undermatched weld increases due to

39
restraint by surrounding matched welds and the base metal. Results of fatigue
testing showed that both undermatched and matched welds exhibited a similar
relationship between crack growth rates and the stress intensity factor.
Undermatched welds have proven to be effective with HSSs, reducing the need
for preheating. Undermatched welds lead to lower residual stresses than
matched welds, which has the potential to reduce crack initiation. The
properties of the weld metal are also a factor in the effectiveness of
undermatched welds on HSSs (Umekuni & Masubuchi 1997).
The results of restraint cracking tests indicated that the application of
undermatched welds to HSSs leads to the reduction of minimum preheating
temperatures and thus preventing cold cracking on the weld metal. It is
necessary to consider not only the strength of weld metal, but also its ductility,
fracture toughness, and hydrogen content when selecting weld metals for
undermatching (Umekuni & Masubuchi 1997).
Undermatched welds have similar fatigue characteristics to matched welds,
where both undermatched and matched welds have similar crack propagation
rates (Umekuni & Masubuchi 1997).
Additionally, with a WM undermatched yield strength level 12 %, the
concentration of plastic flow in the weakest zone increased, while the strength
and ductility of the weld loaded in tension decrease. This experiment was
conducted with two different heat inputs (2.0 kJ/mm and 5.0 kJ/mm) on a 25
mm thick piece of 700 MPa HSS, yield strength 700 MPa. Mismatching yield
strength grade between WM / BM was 0.815, when heat input was 2.0 kJ/mm
and 0.765 when heat input was 5.0 kJ/mm (Loureiro 2002).
Welding high strength and high hardness QT steel involves HAZ softening and
is a characteristic feature of fusion welding processes and consumables used
(Rodrigues et al. 2004b).

40
Initiating a simulation is one possible way to evaluate the features of a welded
structure in HSS. Rodrigues et al. (2004b) used this method and concluded that
the tensile strength of the soft zone determines the overall strength of the joint.
In fact, independent to the level of the undermatched yield stress, the joints
achieved the base plate strength in all overmatched tensile strength situations.
For matched and undermatched cases, the strength of joint was strongly
dependent on the HAZ dimensions. For the cases in which the ratio width of the
HAZ to sample thickness was less than 1/3, the loss of strength never
exceeded 10 %, even in cases of extreme strength undermatch. However, the
joint strength decreased linearly with increased HAZ widths. In almost all the
cases, mismatch lead to a decrease in joint ductility, which varied depending on
HAZ dimensions and hardening values (Rodrigues et al. 2004b).
Rodrigues et al (2004b) also wrote that the mechanical behaviour of the overall
joint depends on the plastic distribution inside the HAZ. They noticed that the
large undermatched tensile strength promotes strain localization in the HAZ
from the start of deformation. When the HAZ dimension is very small (width <
1/3 of the thickness), it was found that the soft material can achieve the base
plate strength. They further stated that if the undermatched level of yield stress
is large and the HAZ width is equal to the sample thickness, then the constraint
promotes premature failure in the soft zone and the overall strength of the joint
decrease even more. In the matched situation of tensile strength, the HAZ
constraint induces deformation to spread to the adjacent material, whereas the
soft HAZ material avoids deformation. There is an apparent increase in the
material strength in almost all the undermatched cases and for lHAZ/e (HAZ
width to sample thickness) ratios lower than unity, which is due to constraint
(Rodrigues et al. 2004b).
In Complete Joint Penetration (CJP), where matching filler metal is required,
one recommendation stipulates that there should be groove welds in the tension
application. Duane (1997) wrote that using undermatched filler metal is useful in
welds such as Partial Joint Penetration (PJP) groove welds and filler welds. In
these situations, using undermatched filler material is a cost-effective and

41
desirable alternative to matched welds. Duane (1997) also explained that when
welding higher strength steels with undermatched weld metal, it is important
that the level of diffusible hydrogen in the deposit weld metal is appropriate for
the higher strength steel that is being welded.
An analysis of the microstructure and the resulting fusion zone hardness
indicated that dilution of the filler metal by the base metal does play a role in
weld metal microstructure evolution. Hardness traverses indicated that the weld
has regions of significant hardening and softening depending on the base metal
grade, filler metal type, and cooling rate conditions. The location of greatest
hardening in the near HAZ (adjacent to the fusion boundary), is where the far
HAZ experienced softening. The potential implications of the hardness
increased in the near HAZ region are not well understood (Kapustka et al.
2008).
In dynamic tensile test results of the 780 MPa butt joint and of the DP780
steels, all of these specimens failed in the softened region of the HAZ
(Kapustka et al. 2008).
It is clear from a large amount of research that the lower the weld strength
mismatching, the higher the fracture toughness of the HAZ (Shi et al. 1998).
When undermatched filler metal is used in welding HSS, a number of items
must be taken into consideration. First of all, heat input and t8/5 time are two of
the most important aspects to consider. These two elements depend on a
number of factors, including thickness of steel, preheating, current, voltage, and
the speed of welding. Some of these factors can be altered while others cannot.
For example, metallurgic and chemical effects depend on base and filler
material and predescrible the effects in the weld.

42
2.5. Heat input and cooling time
Welding HSS is considerably more complex than welding lower yield strength
structural steels. When welding HSSs, a number of quantity modifications are
made during the heating process. The HAZ area has many different phase
zones, and the CGHAZ is quite often the worst zone in HSS after welding. The
phase structure depends on the thermal cycle, which in turn depends on heat
input, work piece geometry, material properties, etc.
In earlier research (Vilpas et al. 1985) low heat input was under 2.0 kJ/mm, but
today low heat input correspond to values 0.5 kJ/mm or lower. When welding
ultra HSSs heat input must be very low according to the recommendations of
manufacturers.
HSS has been studied in a number of research using different consumables
and welding processes. Nevasmaa et al. (1992b) researched Accelerated-
Cooled (AcC) high strength TMCP steel X80 and noticed that those steel do not
need to be preheated in the arc energy range from 1.5 to 5.0 kJ/mm. They also
concluded that in SA-weld metals, the toughness requirement of 40 J at -40 °C
was exceed throughout the arc energy range from 2.0 to 5.0 kJ/mm.
Magudeeswaran et al. (2008) researched QT steel of two different types; (1)
consumable made from austenitic stainless steel, and (2) low hydrogen ferritic
steel. Welding with different heat inputs and two different methods (GMAW and
FCAW), they concluded that the alloying content of manganese and nickel are
important in the solidification process of HSS weld metals. They also noticed
that the SMAW process is more useful for welding HSSs than the FCAW
process. The joints produced by using the SMAW process exhibited superior
tensile and impact properties and lesser degree of CGHAZ softening compared
to their FCAW counterparts.

43
Wang et al. (2003) and Juan et al. (2003) researched heat input of HSS and the
test results indicated that implementing a cooling time (t8/5 =10 - 20 s) improves
toughness in the HAZ (when corresponding weld heat input is 1.31 - 1.86
kJ/mm). This is true, because the larger the weld heat input, the longer the
cooling time and the easier it is for the deterioration of impact toughness in the
HAZ.
In another study carried out of Shi and Han (2008) on 800 MPa yield strength
HSLA steel it was reported that the presence of allotriomorphic ferrite, bainitic
ferrite and martensite exists for simulated HAZ of the test steel. This happens,
because at a temperature range of 800-1300 °C, the austenite decomposes to
various ferrite morphologies. In the subsequent cooling process from 800 °C to
300°C, the austenite decomposes to various ferrite morphologies. The austenite
to ferrite decomposition starts with the formation of allotriomorphic ferrite at prior
austenite boundaries and eventual coverage of these boundaries. With the
continued cooling, the side plate ferrite may nucleate at the ferrite/ austenite
boundaries and extend into the untransformed austenite grain interiors. Further
cooling to even lower temperatures increases the possibility of bainitic ferrite or
acicular ferrite formation. When carbide-free bainitic ferrite is formed, the
remaining austenite is enriched into carbon and becomes stable. The carbon
content of remaining austenite may reach 0.5 – 0.8 wt%. With further cooling as
the temperature settles to room temperature, the remaining austenite may
completely or partially transform to martensite (Shi & Han 2008).
As the M/A constituent forms in the HAZ during bainite transformation, the
carbon-enriched, untransformed regions will partially transform into martensite
at low temperatures. The carbon-enriched austenite regions are formed by the
rejection of carbon from ferrite to austenite following the transformation of
bainite ferrite. The transformation of M/A constituent leads to the deterioration of
toughness in the HAZ (Shi & Han 2008).
Shi & Han (2008) also noticed that when the cooling time in simulated 800 MPa
yield strength HSS is 18 s, the fracture toughness in the simulated HAZ is
44
highest. Additionally, when the value of t8/5 is 45 s or longer, the toughness of
the weld deteriorates. A remarkable decrease in toughness is observed with the
increased size of austenite grain and the volume fraction of the M/A constituent.
The fact that the fracture toughness deteriorated drastically for the partially
phase transformed HAZ may be related to the formation of a mixed
microstructure, in which the M/A constituent is a distributed shape of networks
(Shi & Han 2008).
Liu et al. (2007) noticed in double thermal experiments that the impact
toughness decreases dramatically and obvious brittlement happens in the
intercritical region of CGHAZ. They investigated copper-bearing steel with a
tensile strength of no less than 685 MPa. The decreased toughness and
brittlement occurred, because pearlite is formed on the interface of original
austenite and coarse granular bainite, which can reduce the impact toughness.
The higher heat input, the more serious brittlement becomes. Thus, during
multilayer welding, it is proposed to strictly control heat input. Single thermal
cycle experiments show that the copper-bearing steel has a narrow range of
heat-input and brittlement can easily occur in the region of CGHAZ with higher
heat-input. Granular bainite transformed from austenite leads to brittlement, and
the softening starts when t8/5 time is more than 7 s. The dissolution of ε-Cu and
coarse lath bainite and more ferrite can cause softening of the CGHAZ.
Many HSSs, particularly copper-bearing steels, have a narrow range of heat
input when welding. The effective measure to avoid or reduce the softening
phenomenon of CGHAZ is to limit or control the heat input during welding.
During the welding thermal cycle, with increasing heat input, lath bainite
becomes coarser and the amount of ferrite increases. Coarse lath bainite
decreases dislocation density and ferrite is in a soft phase. Therefore, coarse
lath bainite and more ferrite can cause the softening of CGHAZ (Liu, W-Y.
2007).
The features of steel can vary with the cooling rate. Pacyna and Dabrovski
(2007) investigated CEV 0.39 low-C, Mn-Mo, Al killed steel using different

45
cooling time in the manufacturing process. They noticed that depending on the
rate of cooling, and within the air to water cooling temperature range, the new
steel can attain a tensile strength between 504 MPa and 1122 MPa. The
corresponding proof stress range is from 286 MPa to 478 MPa and the structure
of the air cooled steel consists of ferrite, pearlite, and bainite. This research
concluded that a low carbon equivalent allows for good weldability under any
conditions.
Depending on the welding current and travel speed combination used,
significantly different dependencies on all the influencing parameters were
observed even though the heat input was same. This can be attributed to
differences in the weld bead morphologies. Different weld bead morphologies
are likely to lead to different weld cooling rates that will affect the microstructure
by itself and also different microstructural features, such as austenite grain size,
inclusion parameters, which in turn, will further contribute to the final AF content
(Basu & Roman 2002).
The increase to the heat input increases the yield and undermatched tensile
strength of the WM, and also produces an undermatched HAZ (Loureiro 2002).
When the heat input is greater (4.5 kJ/mm), the weld metal can undermatch,
despite the use of matching filler material (Nevasmaa & al. 1992a). If
undermatching is 10 % or less, then a maximum heat input 2.0 kJ/mm can be
accepted according to Nevasmaa et al. (1992a).
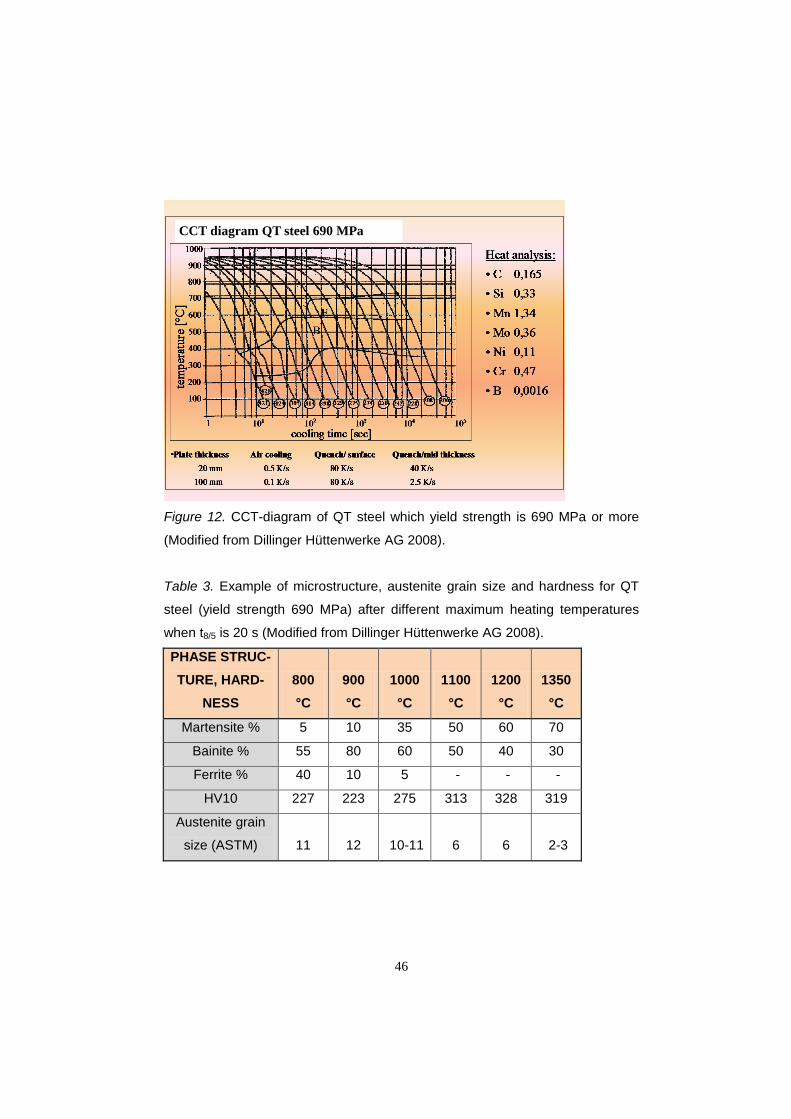
An example of the microstructure of HSS is in fig. 12, which illustrates QT steel
with a yield strength of 690 MPa or more and the CCT-diagram shows cooling
curves from 1000 °C to room temperature, and together with table 3, it shows
the main microstructure and hardness for this steel after different cooling times.
This type of CCT-diagram can be used to describe the microstructure of high
strength QT steels with a standard yield strength 690 MPa. That microstructure
will form in different zones of QT steels HAZ (yield strength 690 MPa) after
cooling.
46
CCT diagram QT steel 690 MPa
Figure 12. CCT-diagram of QT steel which yield strength is 690 MPa or more
(Modified from Dillinger Hüttenwerke AG 2008).
Table 3. Example of microstructure, austenite grain size and hardness for QT
steel (yield strength 690 MPa) after different maximum heating temperatures
when t8/5 is 20 s (Modified from Dillinger Hüttenwerke AG 2008).
PHASE STRUC-TURE, HARD-
NESS 800 °C
900 °C
1000 °C
1100 °C
1200 °C
1350 °C
Martensite % 5 10 35 50 60 70
Bainite % 55 80 60 50 40 30
Ferrite % 40 10 5 - - -
HV10 227 223 275 313 328 319
Austenite grain
size (ASTM) 11 12 10-11 6 6 2-3

47
3. SCOPE OF THE RESEARCH
The research work reported in this thesis concerns
1. The microstructure and
2. Other features, such as hardness, yield strength, impact toughness e.g.,
of welded HSSs
a. Using undermatching filler metal
b. With varying welding heat input in different (QT, TMCP (and DQ))
HSSs.
This study includes extensive experimental investigations of the HAZ of the
HSS butt joint and material characterization. The joint testing portion of the
research was performed at temperatures ranging from -40 to 20 °C. Some
results were analyzed and assessed using CCT diagrams which are provided
by material manufactures, while the CTOD test results were analyzed using
equations from design guidance documents.
Fracture mechanism (crack initiation and propagation) is not included in this
research, because the function in this research was to compare welded steel
structures made of different steels which were made with different
manufacturing methods.
This research solely looks at butt weld joints; fillet welds are excluded.
Specifically, the study is focused on the V-joint and single-bevel butt welds.
These specific joints were selected because they are widely used in many kinds
of plate structures and the CTOD investigation of single-bevel butt welds were
useful because there is a perpendicular fusion face research gap. In addition,
Gleeble simulated tests were made to investigate CTOD in the CGHAZ.
The materials used in this study were made with the
1. QT (Quenched and Tempered) method and

48
2. TMCP (Thermomechanical controlled process) method.
3. DQ (Direct Quenching) method has been limited to a theoretical
discussion.
Several parameters need to be considered when assessing the strength,
toughness, and impact ductility of a butt welded steel structure. In the current
study it was necessary to limit the number of heat input variations of the weld,
so only three were selected; Q=1.0 kJ/mm, Q=1.3 kJ/mm and Q=1.7 kJ/mm.
These heat input values resulted in different microstructure and mechanical
properties in the HAZ area.
All the welds were made using the MAG welding process, so the influence of
welding processes is outside the scope of this work. The heat input during
welding was controlled and good workmanship was applied in all construction
phases as the same technician performed all welding operations. Thus, the
potential influence in variations of weld quality was assumed to be excluded
from this research.
An extensive literature analysis was carried out during the preliminary period of
this research project. This literature review covered the study of the different
alloying elements that constitute the microstructure of different types of HSSs,
earlier studies of heat input and cooling time and different levels of matching
when welding various types of HSSs.
Fig. 13 highlights the main ideas of this research project. All three different
types of HSS must be carefully examined when planning and constructing
welded structures using these steels. The main body of fig. 13 shows the main
things that must be checked, such as cooling time, heat input, filler material,
and both operating and manufacturing conditions.

49
QT HIGH STRENGTH STEELS
TMCP HIGH STRENGTH STEELS
DQ HIGH STRENGTH STEELS
HEAT INPUT- Between 0.5 to
1.7 kJ/mm
OPERATING CONDITIONS-Temperature
- Loading-Working position-Filler metal, etc.
MANUFACTURE CONDITIONS
- Climate- Machines and
Equipment
t8/5 time- Between 5 to
20 s
FILLER MATERIAL
-Undermatched-Matched
-Overmatched
USABILITY OFQT, TMCP, DQ
HIGH STRENGTH STEELS
Figure 13. Fundamentals for usability of HSSs.

50
4. AIM OF THE RESEARCH
The usability of HSSs in welded structures depends on a number of elements,
including manufacturing methods, types of alloying elements, quantity of
alloying elements, filler metals, heat input and t8/5 time, welding method,
automation, and more. The number of variables are so high that not all of the
characteristics of the welding can be explained, however, some of these
elements should become clearer with this research.
1. The main aim of this research is to compare different HSS and their
usability in welded structures. These steels have minimum yield
strengths of 690 MPa (minimum yield strength of steel A was 650 MPa).
The experimental portion of this study included eight pieces of different
HSSs from six different factories, that were made through the QT, TMCP
and DQ processes. (DQ HSSs are studied in theoretical part using earlier
studies.) Some of the tests done on these HSS, such as impact energy
and CTOD test, were carried out in temperatures as low as -40 °C.
2. The second aim of this research is to clarify the effects of three different
heat input, 1.0 kJ/mm, 1.3 kJ/mm and 1.7 kJ/mm, with a tolerance level
of ± 0.1 kJ/mm, in the HAZ on HSS which are made using QT, TMCP
and DQ methods. One again, the DQ method is covered through a
theoretical exercise. The hardened (martensite or/ and bainite) structure
of QT HSS is more prone to heat input effects in welding. Also, TMCP
HSS have different effects in welding, especially in the CGHAZ. The heat
input is limited as a consequence of the base material is being welding.
Additionally, the cooling time from 800 °C to 500 °C is important when
discussing the microstructure of the HAZ in the base material.
3. Brittleness of the base material and the drop of transition temperature
are two factors which will appear when the heat input and cooling time
t8/5 are not correct. Problems in these areas lead to a decrease in
ductility and impact toughness in the steel. Accordingly, one goal of this
study was to investigate these base material modifications.

51
4. The target mismatch level between the weld metal and parent metal was
0.72, where mismatch is defined as the ratio of room temperature weld
metal yield strength to parent steel yield strength. Therefore, the fourth
aim was to clarify the influence of high level of mismatch between filler
metal and base material to the usability of the welded structure.
52
5. RESEARCH METHODS
Firstly, state of art was clarified using basic scientific knowledge and the newest
scientific sources, including conference presentations and articles, journal
articles, and books from HSS and welding. The experimental research was
carried out using two research methods. In the first method, the structures were
welded just as they are in normal manufacturing conditions, whereas in the
second method the CGHAZ structure was simulated using Gleeble 3800
system. Standard SFS-EN ISO 15164-1, (Specification and qualification of
welding procedures for metallic materials, welding procedure test, Part 1; Arc
and gas welding of steels and arc welding of nickel and nickel alloys), was used
as the research method in the welding tests. The Gleeble simulation was used
for pieces being subjected to the CTOD test, while the CTOD tests were made
using standard ASTM E1290-02, (Standard test method for crack-tip opening
displacement (CTOD) fracture toughness measurements).
1. The tests using standard SFS-EN ISO 15164-1 included reconnaissance
and radiographic inspections, a bending test, a tensile strength test, an
impact (Charpy-V) test, hardness test, microfilming, and macro
photography. A description of these tests is included and follows
scientific standards.
2. Additionally, optical tests were performed to clarify the HAZ
microstructure, while microhardness tests of the QT and TMCP steels
with different heat input and cooling times were done as well.
3. To test the fracture mechanics of the HAZ area, CTOD tests were used.
Welds were made for these tests and the CTOD test method has been
used for testing fracture mechanics.
4. Gleeble simulation has been used to clarify the CGHAZ area in welded
structures. Research pieces were made for simulation, and the
simulation was done using the Gleeble 3800 machine, while the CTOD
test method was used for testing fracture mechanics.

53
A study was also carried out on the different elements and metals related to
HSSs on the basis of chosen relevance materials from various research.
6. EXPERIMENTAL INVESTIGATIONS
Experimental investigations in this study were carried out to clarify main factors
affecting the usability of high strength QT and TMCP steels. The steels used in
this research have been picked out among worldwide common HSSs, also used
in Finland today. On the eight different HSSs that were used as research
material, all but one had a yield strength of 690 MPa. (This other steel was
rated with a yield strength of 650 MPa.) These steels were made using different
manufacturing methods including the QT and TMCP processes. These methods
and the various steels have been elaborated on during the first part of this
study.
6.1. Experimental arrangement
All studied welds were made using the mechanization machine, as shown in fig.
14. It was made in the Laboratory of Welding Technology at the Lappeenranta
University of Technology. This machine did not have any welding speed
adjustment limits. The power source used in this study was a Kemppi Pro 5200
Evolution as shown in fig. 15; which is a modern machine that is commonly
used in the industry. All of the welding data was collected and stored using
Kemppi ProWeld Data computer software for research use. Fig. 16 shows the
principle description of fastening of weldable pieces and the processes of
welding.

54
Welding torch
Speed adjust
Frame of mechanizing machine
Figure 14. Experimental mechanizing set up.
Picture 15. Power source, Kemppi Pro 5200 Evolution.

55
WELDING TORCH
MECHANIZING MACHINE
PNEUMATIC FASTENERS
WELDED TEST PIECE
Figure 16. Fasten of welded pieces in mechanizing arrangement.
6.1. Joint geometries and preparation
The plate thickness of all the studied HSSs was 8.0 mm (excluding one piece of
690 MPa yield strength QT HSS, steel G, which was only started being
delivered to Finland in 2008 at a minimum thickness of 12 mm). A one side V-
groove as seen in fig. 17 was used. The groove angle was 60 degrees with an
air gap of 1.5 mm and root edge of 1 mm. Test pieces with dimensions of 150
mm x 400 mm were welded together. Fig. 20 shows the preparation of the
groove, where run-on and run-off plates were used as tacking. Tacks of welds
were first welded to fasten test pieces together, with an advance angle of three
degrees estimate angular distortion. Fig. 20 illustrates a good example of a
complete penetration.
Fiberglass tape was used as a backing ring, as shown in figs. 18 and 19. The
groove was welded on one side with two welding beads, and the 12 mm HSS
was welded with three welding beads.

56
Figure 17. One side V-groove preparation.
Figure 18. Fiberglass tape was used as a backing ring.
Picture 19. Glued backing ring.

57
Figure 20. Run-off plates pictured root of groove.
Weldable pieces were fixed between holders in the mechanized machine. The
welding torch was installed downright upon the welded groove. Fig. 21 shows
the plate and completed torch installation.
Figure 21. Fixed weldment in mechanized machine.

58
6.3. Test set up
While the backing ring was primarily used to make sure that the root edges
were completely melted, it is also important to consider that the backing ring
shapes the surface of the backing weld. The surfaces of joint preparation were
polished between weld passes and the interpass area between welds was not
subjected to any heat input, and only experienced room temperature.
Additionally, the amount of free wire, which depends on current levels and the
pass that is being welded, was adjusted to appropriate lengths before welding.
The gas run was also adjusted, and all of the welding parameters used,
including pWPS’s appear appendices 1, 2 and 3. All the welding parameters
used were collected and stored using Kemppi ProWeld Data computer software
for research use.
The equation used for t8/5 time was (two dimension heat conduction) according
to standard SFS-EN 1011-2
t8/5=(4300-4.3·T0)·105·𝑘2·𝐸2
𝑑2·[( 1
500−𝑇0)2 −( 1
800−𝑇0)2]·F2 (1)
where
t8/5 = cooling time between 800-500 °C (s)
T0 = work temperature (°C)
k = thermal efficiency (0.8 in MAG welding)
E = welding energy (kJ/mm)
d = thickness of welded piece (mm)
F2 = Coefficient depending the type of joint in two dimensional heat conduction
(it is 1.0 when the cooling curve (t8/5) in two dimensional heat conduction is in
the oblique area)
Used equation for heat input (Q) was
𝑄 = ɳE (2)

59
ɳ is 0.8 through 8 mm plate in MAG welding according to the standard SFS-EN
ISO 4063.
𝐸 = 60·𝑈·𝐼1000·𝑣
(3)
where
E = welding energy (kJ/mm)
U = arc voltage (V)
I = welding current (A)
v = welding speed (mm/min)
For thicker plates, a three dimensional equation will be used, as follows:
t8/5=(6700-5·T0)·k·E·[( 1500−𝑇0
)−( 1800−𝑇0
)]·F3 (4)
where;
t8/5 = cooling time between 800-500 °C (s)
T0 = work temperature (°C)
k = thermal efficiency (0.8 in MAG welding)
E = welding energy (kJ/mm)
F3 = Coefficient depending on the type of joint in three dimensional heat con-
duction (it is 1.0 when the cooling curve (t8/5) in three dimensional heat conduc-
tion is in the oblique area)
The welding parameters used in this study are shown below in table 4.

60
Table 4. MAG welding values in three different test procedures.
HEAT INPUT
ARC CURRENT
[A]
ARC VOLTAGE
RANGE [V]
WELDING SPEED
[mm/min]
WIRE FEED
RANGE [m/min]
FLOW RATE
RANGE [l/min]
root pass 220-225 22.3 243 5.8 16 1.0 225-230 25.5 275 6.8 16 1.3 260-270 29.0 270 8.0 16 1.7 260-270 30.9 230 7.6 16
The calculated cooling times for plates are in table 5.
Table 5. Cooling times for heat inputs of 1.0 kJ/mm, 1.3 kJ/mm and 1.7 kJ/mm
when plate thickness is 8 mm, 12mm or 15 mm.
Heat input 1.0 kJ/mm
Heat input 1.3 kJ/mm
Heat input 1.7 kJ/mm
Cooling time t8/5
[s] Plate thickness 8 mm
21 36 56
Cooling time t8/5
[s] Plate thickness 12 mm
9 15 23
Cooling time t8/5
[s] Plate thickness 15 mm
6 10 15
The root pass has a lower cooling time. The heat input of the root pass was
0.97 kJ/mm and it is the leader in cooling times with 8 mm plate in 17 s and with
12 mm plate in as low as 7 s.
Using equation 4 the maximum heat input will be 5.0 kJ/mm and the cooling
time will again be 21s – the same as was used in the 8 mm thick plate with a
heat input of 1.0 kJ/mm. The three dimensional equation for heat input can be
used if the plate thickness is more than 46 mm. This plate thickness can be

61
calculated so that equations 1 and 4 will be set even and then the thickness of
plate will be calculated using a heat input of 1.0 kJ/mm. For example, if the
plate thickness is 20 mm then the heat input can be 2.7 kJ/mm using t8/5 21 s.
6.4. Material properties
HSSs, made by either the TMCP or QT manufacturing methods were the core
materials of this study. The chemical properties of these steels are presented in
table 6. The chemical properties are specified in the inspection certificate 3.1
(EN 10 204-3.1 2004) provided by the manufacturer. All manufacturers have
stated that their steels are made according to the conditions specified in these
certificates that were supplied for this study. The conditions under which the
steels were created were carefully controlled.
The mechanical properties of the steels in the research are not similar, as
shown in table 7. The tensile strength of these steels, which have the required
yield strength of 690 MPa, varies between 798 and 879 MPa. One of steels has
a tensile strength of 769 MPa, but the standard yield strength value of it is 650
MPa. The change of highest tensile strength is 10 % compared to the lowest
value, which is 798 MPa. Additionally, the elongation of HSS is lower than
structural steel, at yield strength 235 and 355 MPa, respectively. The change of
elongation in the steels used in the experiment is between 15 and 22 %. The
lowest elongation percentage was seen in steels B and D, at 15 %, while the
highest elongation percentage was found in steel F, at 22 %.
The impact ductility of the steels in this investigation changed between 40 and
194 J, at a temperature of -40 °C, however steels A and C were tested at a
temperature of -20 °C. An impact value of at least 27 J is needed for impact
ductility. That means that all the reported values in the material certificates are
quite exceptional compared material standards, however HSS’s have larger
strength tolerance than structure steels.

62
Furthermore, table 6 presents the chemical properties of the steels that are
tested with in this research and illustrates that there are varied amounts of
alloying elements used in these different steels. For example, steels E and F
have the most alloying elements, as Sn is found in steel F and Zr is found is
steel E. Comparatively, steel H has much fewer alloying elements. The base
elements in HSS are C, Si, Mn, P and S. In addition to these five core elements,
steel H only includes two more elements, Cr and Mo. Mo is in all steels in this
investigation, while Cr has been used in all QT steels, and Ni has been used in
all irrespective of H steel. Carbon is used in the formation of all steel. Steels A
and C had the lowest amount of carbon, each with 0.05 % C. The carbon
content in the other steels used for the experiments was closer to 0.15 %.
However, this can be explained by the fact that steels A and C are made by the
TMCP method and all the others are made by the QT method. Steel B was
produced through the quenched and tempered method but additionally has a
low notch toughness temperature. The grade of this steel B was S690QL.
These manufacturing specifications emphasize the tough features of Steel B in
cold environments up to -40 ⁰C, according to standards SFS-EN 10025-6 + A1.
Aluminium is also found in HSSs and is used in the deoxidation process. Of all
the steels used in the scope of this research, only steels G and H do not have
any Al. Furthermore, another element found in HSSs is nitrogen, which plays a
role in making nitrides such as TiN. Of the steels used for this research,
nitrogen is found in five of the eight steels; namely A, C, D, E and F.
Boron is an important alloying element that aids to the hardness of the steel.
Only small amounts of B are needed to do an adequate job, mostly under 0.005
%. B is found in steel B, D, E and F, and the hardness of steels in this
investigations was between 270 HV5 and 290 HV5. Other micro alloying
elements used in these steels were Nb, V, Cu and Ti.

63
Tabl
e 6.
Che
mic
al p
rope
rties
of v
ario
us s
teel
s us
ed in
the
rese
arch
(wt %
).
STEE
L De
liver
y te
mpe
r
Thic
k-ne
ss
mm
C
%
Si %
M
n %
P %
S
%
Al %
Cr
%
Ni %
M
o %
B
%
Nb
%
V %
Cu
%
Ti %
N
%
Sn
%
Zr %
CE
V CE
T P C
M
A M
8
0,05
2 0,
19
1,64
0,
010
0,00
3 0,
029
- -
0,00
9 -
0,04
6 0,
011
- 0,
091
0,00
6 -
- 0,
34
0,22
0,
14
B Q
L 8
0,15
9 0,
33
0,82
0,
008
0,00
1 0,
049
0,3
0,05
0,
223
0,00
17
0,00
4 0,
010
0,02
5 0,
019
- -
- 0,
41
0,28
0,
25
C M
8
0,04
9 0,
17
1,86
0,
008
0,00
4 0,
025
- -
0,00
8 -
0,08
1 0,
009
- 0,
092
0,00
5 -
- 0,
38
0,24
0,
15
D Q
T 8
0,13
0 0,
30
1,20
0,
009
0,00
2 0,
044
0,26
0,
04
0,14
8 0,
002
0,02
1 0,
007
0,01
0,
015
0,00
4 -
- 0,
42
0,28
0,
23
E Q
T 8
0,13
7 0,
276
1,39
0 0,
013
0,00
13
0,06
1 0,
052
0,06
6 0,
029
0,00
21
0,02
2 0,
001
0,02
0 0,
002
0,00
50
- 0,
0002
0,
39
0,28
0,
23
F Q
T 8
0,14
0 0,
40
1,41
0,
011
0,00
4 0,
037
0,02
0,
02
0,00
2 0,
002
0,03
2 0,
06
0,01
0,
026
0,00
46
0,00
2 -
0,39
3 0,
28
0,24
G Q
T 12
0,
140
0,37
1,
21
0,01
3 0,
004
- 0,
07
0,00
1 0,
11
- -
0,00
1 0,
002
- -
- -
0,38
0,
28
0,22
H Q
T 8
0,16
0 0,
24
0,87
0,
011
0,00
1 -
0,35
-
0,22
-
- -
- -
- -
- 0,
419
0,29
0,
24
M
= T
MCP
Q
L= Q
uenc
hed
and
Tem
pere
d +
Low
not
ch to
ughn
ess t
empe
ratu
re
Q
T= Q
uenc
hed
+ Te
mpe
red
𝐶𝐸𝑉
=𝐶
+𝑀𝑛 6
+𝐶𝑟+𝑀𝑜+
𝑉6
+𝑁𝑖+𝐶𝑢
15
(
1)
𝐶𝐸𝑇
=𝐶
+𝑀𝑛+𝑀𝑜
10+
𝐶𝑟+𝐶𝑢
20+
𝑁𝑖
40
(2
)
𝑃 𝐶𝑀
=𝐶
+𝑆𝑖 30
+𝑀𝑛+𝐶𝑢
+𝐶𝑟
20+
𝑁𝑖
60+
𝑀𝑜
15+
𝑉 10+
5𝐵
(3)
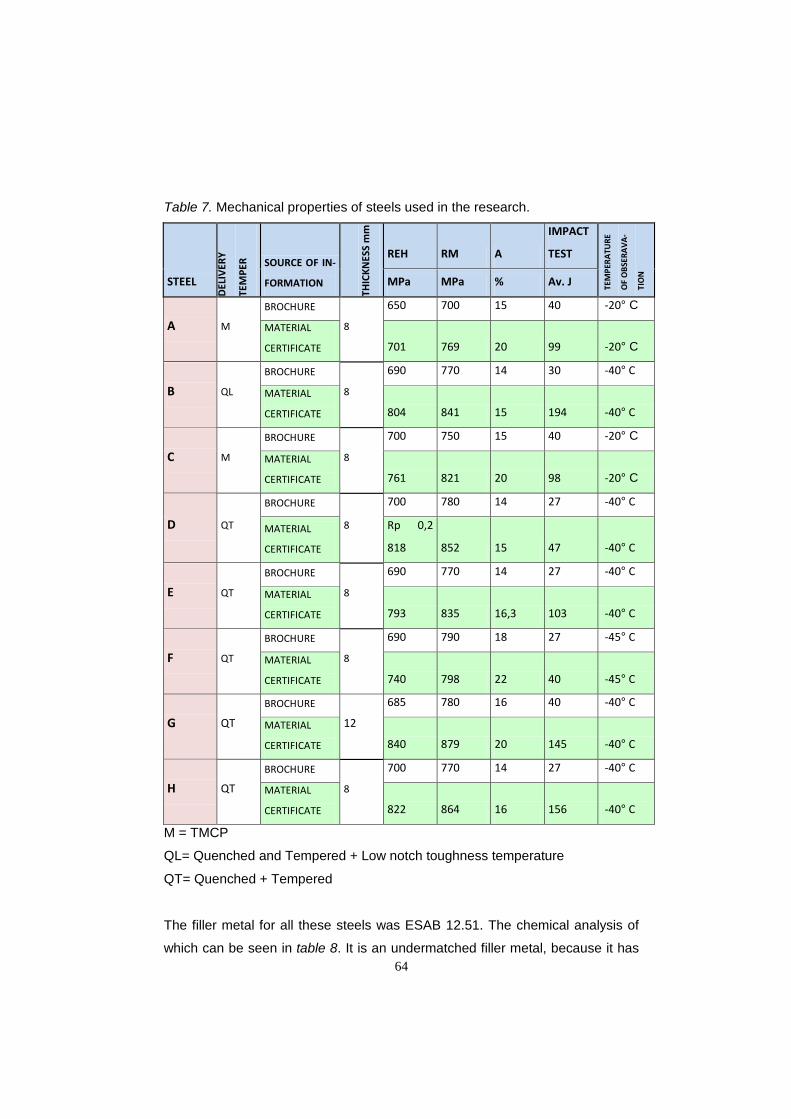
64
Table 7. Mechanical properties of steels used in the research.
STEEL
DELI
VERY
TEM
PER SOURCE OF IN-
FORMATION
THIC
KNES
S m
m
REH RM A
IMPACT
TEST
TEM
PERA
TURE
OF
OBS
ERAV
A-
TIO
N
MPa MPa % Av. J
A M
BROCHURE
8
650 700 15 40 -20° C
MATERIAL
CERTIFICATE 701 769 20 99 -20° C
B QL
BROCHURE
8
690 770 14 30 -40° C
MATERIAL
CERTIFICATE 804 841 15 194 -40° C
C M
BROCHURE
8
700 750 15 40 -20° C
MATERIAL
CERTIFICATE 761 821 20 98 -20° C
D QT
BROCHURE
8
700 780 14 27 -40° C
MATERIAL
CERTIFICATE
Rp 0,2
818 852 15 47 -40° C
E QT
BROCHURE
8
690 770 14 27 -40° C
MATERIAL
CERTIFICATE 793 835 16,3 103 -40° C
F QT
BROCHURE
8
690 790 18 27 -45° C
MATERIAL
CERTIFICATE 740 798 22 40 -45° C
G QT
BROCHURE
12
685 780 16 40 -40° C
MATERIAL
CERTIFICATE 840 879 20 145 -40° C
H QT
BROCHURE
8
700 770 14 27 -40° C
MATERIAL
CERTIFICATE 822 864 16 156 -40° C
M = TMCP
QL= Quenched and Tempered + Low notch toughness temperature
QT= Quenched + Tempered
The filler metal for all these steels was ESAB 12.51. The chemical analysis of
which can be seen in table 8. It is an undermatched filler metal, because it has

65
a yield strength 470 MPa. The mechanical properties for this filler metal are in
table 9 and a 1.2 mm fillet solid wire was used in the welding. Additionally, the
shielding gas was an AGA mixing gas composed at 15 % CO2 and 85 % Ar.
Table 8. Chemical Analysis of filler material OK AUTROD 12.51 (ESAB 2008).
CHEMICAL ANALYSIS C % Si %
Mn % P % S %
Cr %
Ni % Cu % N % Ti %
OK AUTROD 12.51 0.07
0.89 1.45
0.012
0.02
0.05
0.04 <0.30
0.005
0.01
Table 9. Mechanical properties of filler material OK AUTROD 12.51 (ESAB
2008).
MECHANICAL PROPERTIES
YIELD STRENGTH
MPa
TENSILE STRENGTH
MPa ELONGATION
A5 %
IMPACT DUCTILITY
J COMMENT OK AUTROD
12.51 470 560 26 26 -30°C
To know the real content of the weld metal, the area of the first and second
pass must be measure from figure first and then calculated (figs. 22 and 23).
Every different alloying element will be calculated one to one. Dilution will
happen between the base material and the filler material.
The first pass has a weld metal area of 52 mm x 54 mm= 2808 mm2 (the
measurements 52 mm and 54 mm are measured from fig. 22). Smelted base
material areas are 7 mm x 71 mm= 497 mm2 and 6 mm x 53 mm= 336 mm2.
The sum of the smelted base material areas are 497 mm2 + 336 mm2 = 833
mm2. This is 30 % from all the weld area. A concentration of the alloy elements
can be calculated:
The concentration of QT HSS C of the first pass:
Cweld = Cbase material * 0.3 + Cfiller material * 0.7 = 0.137 *0.3 + 0.07 * 0.7 = 0.0901%.
66
The same equation was applied for all the alloy elements in the first pass. The
concentrations of the first pass to the welded TMCP HSS E are:
Si = 0.7058%, Mn = 1.432%, P = 0.0123%, S = 0.0144%, Cr = 0.0506%, Ni =
0.0478%, Cu = 0.216%, N = 0.005% and Ti = 0.0076%. Other alloy elements
are only in the base material. Then the content of the alloy elements in the weld
is 30 % of the base material content. It is likely that the content of Mo was 0.3 x
0.029 % = 0.0087 % in weld and the content of Al was 0.0183%, Nb = 0.0066
%, V = 0.00006 % and B = 0.00063%.
The second pass will be calculated between the base material, the first pass
and the filler material.
The second pass has the weld metal which will be calculated in four parts. The
first area is 39 mm x 118 mm= 4608 mm2. Two triangles, (22 mm * 22 mm)/ 2 =
242 mm2 and (22 mm * 27 mm)/ 2 = 297 mm2 and second rectangle 13 mm * 22
mm = 286 mm2. The sum of weld metal is 5433 mm2. Smelted base material
areas are 19 mm x 26 mm= 494 mm2 and 18 mm x 31 mm= 558 mm2. The sum
of the smelted base material areas are 494 mm2 + 558 mm2 = 1052 mm2.
Smelted first pass was 12 mm x 30 mm= 360 mm2. Filler metal was 5433 mm2
– 1052 mm2 – 360 mm2 = 4021 mm2. This is 74 % from all the weld area.
Smelted base material was 19 % and smelted first pass was 7 % from all weld
metal.
A concentration of the alloy elements can then be calculated:
The concentration of C of the second pass to the QT HSS E,
Cweld = Cbase material * 0.19 + Cfiller material * 0.74 + Cfirst pass * 0.07= 0.137 *0.19 +
0.07 * 0.74 + 0.09 *0.901 = 0.086%.
The same equation will be used for all alloy elements. All concentrations to
second pass of welded TMCP HSS E are:

67
Si = 0.76%, Mn = 1.437%, P = 0.0122%, S = 0.016%, Al = 0.0129%, Cr =
0.0504%, Ni = 0.0455%, Mo = 0.00612%, B = 0.00044%, Nb = 0.0046%, V =
0.0002%, Cu < 0.241%, N = 0.005%, Ti = 0.0083% and Zr = 0.00004 %.
Smeltedbasematerial
Weld area
Figure 22. Principle the figure to calculate the weld metal dilution of the first
pass. Aspect ratio of 1:500.
Second pass
Fusion line
First pass
Surface of firstpass afterpolishing
Weld metal
Smelted basemetal
Smelted firstpass
a) b) c)
Figure 23. Principle figure to calculate weld metal dilution of the second pass. a)
fusion line and surface of the polished first pass before welding, b) weld metal
area, c) smelted base metal and first pass.
Content of alloy elements in weld after welding are in table 10.

68
Table 10. Content of alloy element of QT HSS E in the first and second pass.
Dilution between base material and filler material has happened in all QT HSSs
in about the same proportion. This means that the content of alloy elements
were at the same levels. In TMCP HSS content of C was less of than in QT
HSS. It leads to smaller content of C in the weld of TMCP HSS. As in TMCP
HSS C, the C content was in the first pass was 0.3 * 0.05% + 0.7 * 0.07% =
0.064 %, while in the second pass of TMCP HSS C, the C content was 0.05
*0.19 + 0.07 * 0.74 + 0.09 *0.064 = 0.067%.
For all the other alloy elements, the content differences between TMCP and QT
HSSs were not large. The content of other alloying elements in the weld was at
same level in TMCP HSS as in QT HSS.

69
6.5. Standard tests
A welding procedure test is an inclusive test for welded structures. Using this
test, the usability of the welded structure can be examined. In the standard
SFS-EN ISO 15164-1 welding procedure test, all of the applicable areas are
tested. Testing includes both non-destructive testing (NDT) and destructive
testing which shall be in accordance with the requirements of table 11. A
description of these tests is provided in the enclosed standards, and all of the
welding procedure tests done on all welded pieces were carried out by the chief
researcher.
The first test to be conducted was a visual examination of all of the pieces.
Radiographic tests were made using an industrial X-ray machine, RUP-300.
Additionally, penetrant testing was made to all pieces using red penetrating
liquid and white development of dye.
Table 11. Examination and testing of the test pieces (standard SFS-EN ISO
15164-1).

70
Metallographic specimens were polished and etched with 4 % Nital (HNO3 +
ethanol) before being placed under a conventional light microscope. The
polishing automat machine was a Struers TegraPol-31.
Macro- and microscopic examinations were made to all the welded test pieces.
The test machine for the macro photography was Wild M400 macroscope and
an Olympus 4040 camera. In addition, microscopic examinations were made on
all of the weldments including the HAZ area. Microfilming was made using a
light microscope, Zeiss MC63, and the computer software was Isolution Lite.
Additional microscopic test were done at St. Petersburg State Polytechnic
University laboratory (StPSPU) using light metallographic microscope LEICA
DMI5000M with magnification up to x1000 to clarify the exact microstructure of
the HAZ.
Additionally, the impact toughness test was measured using the standard
Charpy V-notch impact test (standard SFS-EN ISO 148-1). The test
temperature was -40 °C and test machine was model VEB
Werkstoffpromachine Leipzig VBN with a load of 150 N. The 5 x 10 mm Charpy
test pieces were shaped with a “V” notch of 2 mm depth with the notch tip in
conformity with the standards of the HAZ and the weld.
Vickers hardness tests were also performed on the welded specimens, to the
SFS-EN ISO 6057-1 standard, using a 5 kg load. Test machine was a Zwick
3202.
Four transverse bending tests were made using standard SFS-EN ISO 5173 to
all welded structures, two from the weld surface and two from the root, and the
machine used was a bend machine, WPN 20. The same WPN 20 machine was
used to make tensile tests with an extensometer. The standard used with the
tensile test was SFS-EN ISO 6892-1. The computer software used for this
information was PicoLog for windows PLW recorder, and two tests were made
to all welded structures.

71
When conducting a transverse bend test on HSSs, the diameter of pusher and
opening of drums must be considerably larger than when testing lower yield
strength steels. All of these values are found in standards SFS-EN ISO 5173
and SFS-EN ISO 15614-1. For example, an 8 mm thick plate must have a
pusher diameter 45 mm and a drum opening of 65 mm, while 12 mm thick plate
must have a pusher diameter 75 mm and a drum opening of 105 mm.
According to the standard SFS-EN ISO 5173, the bending angle at which to
conduct the bending test should be 180, however the bending machine that was
used was limited to a maximum 150 angle.
Equation is
d=(100 x ts)/A-ts and (5)
d+3 x ts ≥ l >(d+2 x ts) (6)
where
d= diameter of pusher
A= minimum ultimate elongation of base metal
ts= plate thickness
l= opening of drums
6.6. Additional material test
To confirm that standard SFS-EN ISO 15164-1 test has shown realistic results,
an additional material test had to be conducted. CTOD tests and microstructure
analysis, like analysing different faces and micro hardness, were done. HAZs
were also calculated and CTOD tests were done to all HSS steels. Additional
microstructure tests were performed on QT HSS steel (steel E) and TMCP HSS
steel (steel C).

72
6.6.1. CTOD test
In order to check if the impact toughness values were correct, a CTOD test was
made on all welded structures. Fig. 24 shows the construction of the welded
pieces with dimensions of 8 x 15 x 50 mm. The 8 mm in thick, 50 mm length
and 15 mm lateral pieces were cut from the whole plate. Using tack welds these
pieces were welded together and the fusion faces were machined. The gap was
about 1.5 mm and root edge was about 1.0 mm, while a single-bevel (½-V)
groove was used with a flank angle of 45 degrees.
Fig. 25 illustrates the welded pieces before they were separated by saw. The
beginning and end of the groove were made with assisting pieces. The test
pieces with dimension 5 mm width, 10 mm high and 50 mm long were made by
machining after cutting.
Figure 24. Used one side single be-
vel (½-V) groove in CTOD tests.
Figure 25. CTOD test pieces after
welding.

73
In fig. 26 there is an etched CTOD test piece where the red line indicates the
fusion line, the blue line indicates the start notch, the yellow line indicates the
fatigue notch, and the green line indicates the test area. The groove was
welded with three or four beads according to the heat input. The same three
heat inputs (1.0; 1.3 and 1.7 kJ/mm) were used as in previous tests.
Figure 26. Etched CTOD test piece.
The CTOD test equipment was made by the Welding Technology Laboratory at
Lappeenranta University of Technology. Fig. 27 illustrates the pusher and its
counterpart, while fig. 28 is a picture of the actual machine used for the testing.

74
Figure 27. CTOD test components and test piece.
COMPUTER AND SOFTWARE
PUSHER AND ITS COUNTERPART
COOLING UNIT
FATIGUE TEST MACHINE
Figure 28. CTOD test machine.
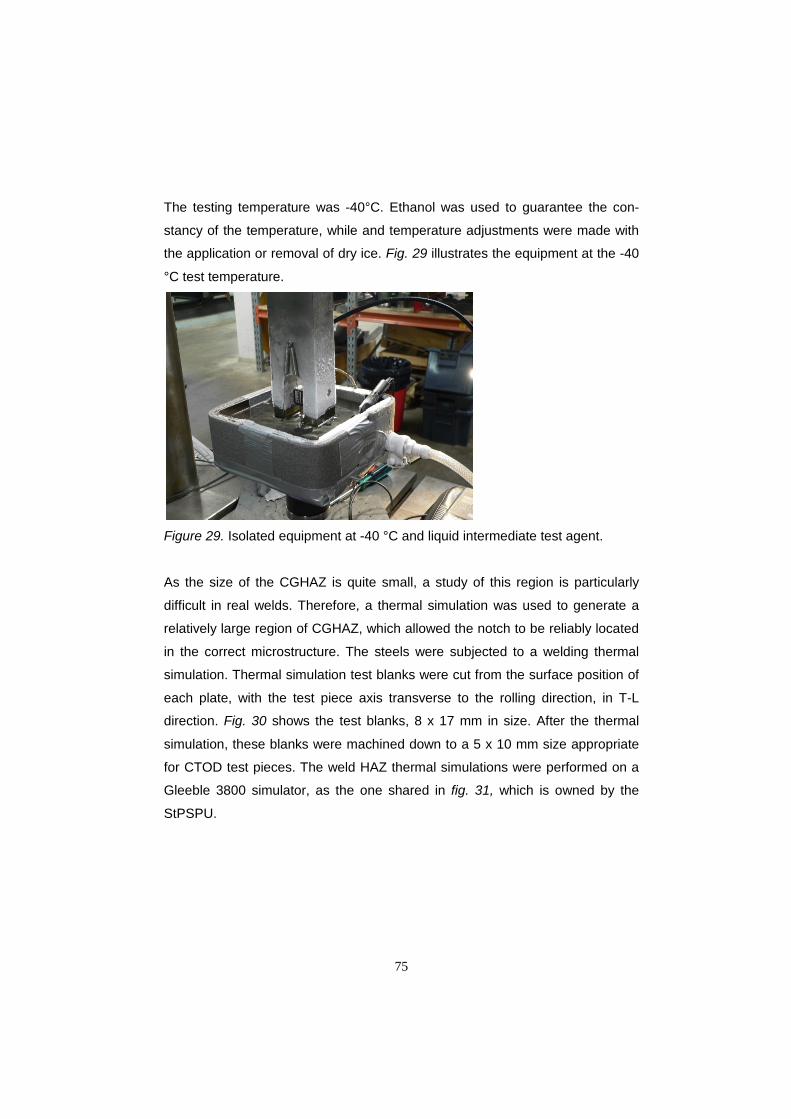
75
The testing temperature was -40°C. Ethanol was used to guarantee the con-
stancy of the temperature, while and temperature adjustments were made with
the application or removal of dry ice. Fig. 29 illustrates the equipment at the -40
°C test temperature.
Figure 29. Isolated equipment at -40 °C and liquid intermediate test agent.
As the size of the CGHAZ is quite small, a study of this region is particularly
difficult in real welds. Therefore, a thermal simulation was used to generate a
relatively large region of CGHAZ, which allowed the notch to be reliably located
in the correct microstructure. The steels were subjected to a welding thermal
simulation. Thermal simulation test blanks were cut from the surface position of
each plate, with the test piece axis transverse to the rolling direction, in T-L
direction. Fig. 30 shows the test blanks, 8 x 17 mm in size. After the thermal
simulation, these blanks were machined down to a 5 x 10 mm size appropriate
for CTOD test pieces. The weld HAZ thermal simulations were performed on a
Gleeble 3800 simulator, as the one shared in fig. 31, which is owned by the
StPSPU.

76
Figure 30. Test pieces proportion to rolling direction.
DIGITAL CONTROL SYSTEM
OPERATION CHAMBER MECHANICAL CABIN
MECHANICAL CAPIN
OPERATION CHAMBER FORM MOBILE CONVERT UNIT
Figure 31. The Gleeble 3800 machine used in StPSPU laboratory.
Table 12. Welding parameters and cooling time.
Ther
mal
cycl
e
Current,
A
Voltage,
V
Welding
speed,
mm s-1
Gross
power,
W
Net
power,
W
Net heat
input,
J mm-1
Cooling
time t8/5,
s
1 230 25.6 4.533 5888 4710 1039 21.0
2 268 29.0 4.517 7772 6218 1376 36.5
3 258 30.6 3.713 7895 6316 1701 55.6
The thermal cycles were calculated depending on the welding conditions (Table
12). When calculating of the temperature field, the following assumptions were
made: a point heat source on the plate surface moves along the x-axis with

77
constant speed v, the origin of coordinates is fixed to the source, the plate
surfaces are heat impermeable, and the plate is infinitely wide and long. Then
the steady state of the temperature field T(x,y,z) in the moving reference frame
is expressed by the following formula:
2/1222
0
])2([
)2
exp(1)2
exp(2
),,(
nszyxRa
vRRa
vxqTzyxT
n
n
n n
−++=
−−+= ∑∞
−∞=πλ
where T0 is the ambient temperature (T0 = 20°C), q is the net power, λ is the
heat conductivity (λ = 0.035 W mm-1 K-1), a is the thermal diffusivity (a = 7.0
mm2 s-1), s is the plate thickness (s = 8 mm). The vertical z - axis is directed
through the plate thickness and changes from coordinate x to time t is made
according to the equation: t = - x/v. Then the thermal cycle of any point y, z at
any time t can be calculated:
2/1222
2
0
])2()[(
)2
exp(1)2
exp(2
),,(
nszyvtRa
vRRa
tvqTtzyT
n
n
n n
−++=
−+= ∑∞
−∞=πλ
This formula was used to calculate the thermal cycle of the point having peak
temperature Tmax = 1350°C at the top surface (z = 0). Three cycles are shown in
Fig. 32 a - c.
a) Q= 1.0 kJ/mm.
Figure 32. Welding
b) Q= 1.3 kJ/mm.
thermal cycles.
c) Q= 1.7 kJ/mm.
(9) (10)
(7) (8)

78
The first heat input was 1.0 kJ/mm and was applied to an 8 mm thick plate. This
involved heating to a peak temperature (Tp1) of 1350 °C at a rate of
approximately 450 °C/s and holding the peak temperature for less than 2 s,
followed by a cooling time from 1350 °C to 800 °C for 10 seconds, between 800
°C to 500 °C (∆t8/5) in 20s, and from 500 °C to ambient temperature in 40
seconds.
The second heat input was 1.3 kJ/mm and was applied to an 8 mm thick plate.
This involved heating to a peak temperature (Tp1) of 1350 °C at a rate of
approximately 450 °C/s and holding at the peak temperature for less than 2 s,
followed by a cooling time from 1350 °C to 800 °C in 15 seconds, between 800
°C to 500 °C (∆t8/5) in 35 s and from 500 °C to ambient temperature in 65
seconds.
Finally, the third heat input was 1.7 kJ/mm and was applied to an 8 mm thick
plate. This involved heating to a peak temperature (Tp1) of 1350 °C at a rate of
approximately 450 °C/s and holding at the peak temperature for less than 2 s,
followed by cooling time from 1350 °C to 800 °C in 20 seconds, between 800 °C
to 500 °C (∆t8/5) in 55 s and from 500 °C to ambient temperature in 80 seconds.
In simulation, which occurred in a Gleeble 3800 machine between watercooled
copper made grip jaws, the non-standard Gleeble specimen has been heated
and cooled, as seen in figs. 33 a and b.
a) b) Figure 33. The 5x10 grips jaws (a) and non-standard Gleeble specimen (b).
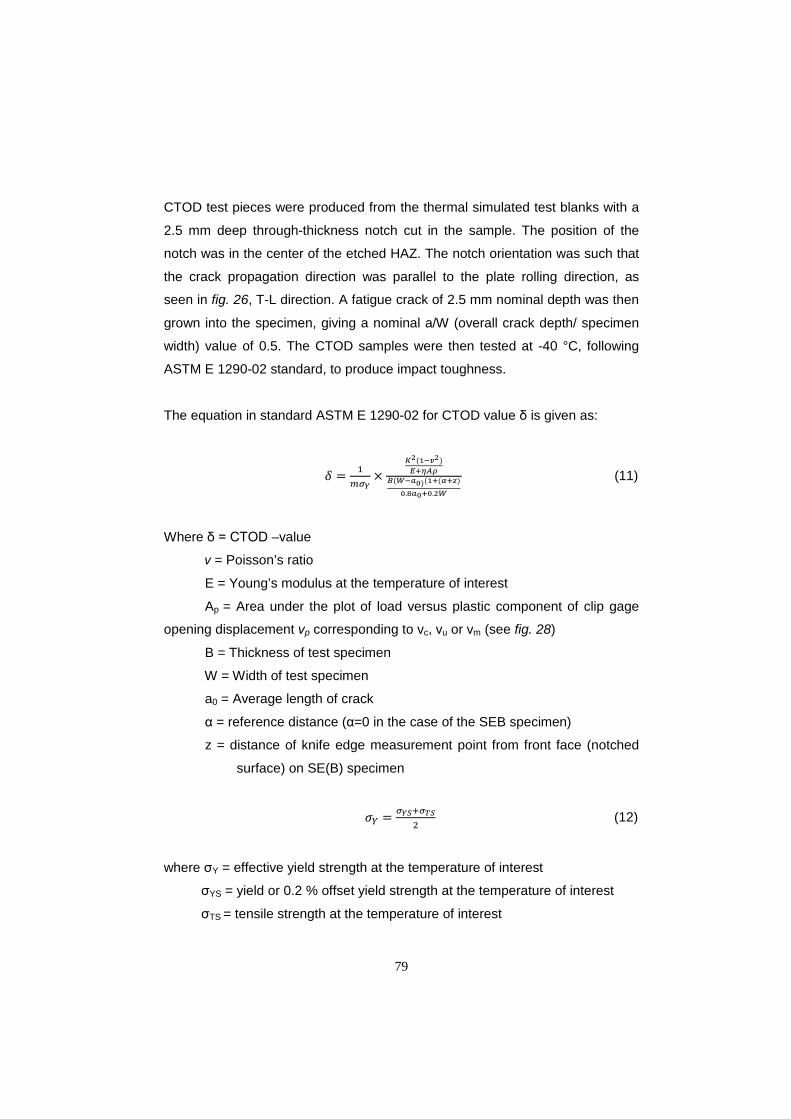
79
CTOD test pieces were produced from the thermal simulated test blanks with a
2.5 mm deep through-thickness notch cut in the sample. The position of the
notch was in the center of the etched HAZ. The notch orientation was such that
the crack propagation direction was parallel to the plate rolling direction, as
seen in fig. 26, T-L direction. A fatigue crack of 2.5 mm nominal depth was then
grown into the specimen, giving a nominal a/W (overall crack depth/ specimen
width) value of 0.5. The CTOD samples were then tested at -40 °C, following
ASTM E 1290-02 standard, to produce impact toughness.
The equation in standard ASTM E 1290-02 for CTOD value δ is given as:
𝛿 = 1𝑚𝜎𝑌
×𝐾2(1−𝑣2)𝐸+𝜂𝐴𝜌
𝐵(𝑊−𝑎0)(1+(𝛼+𝑧)0.8𝑎0+0.2𝑊
(11)
Where δ = CTOD –value
ν = Poisson’s ratio
E = Young’s modulus at the temperature of interest
Ap = Area under the plot of load versus plastic component of clip gage
opening displacement vp corresponding to vc, vu or vm (see fig. 28)
B = Thickness of test specimen
W = Width of test specimen
a0 = Average length of crack
α = reference distance (α=0 in the case of the SEB specimen)
z = distance of knife edge measurement point from front face (notched
surface) on SE(B) specimen
𝜎𝑌 = 𝜎𝑌𝑆+𝜎𝑇𝑆2
(12)
where σY = effective yield strength at the temperature of interest
σYS = yield or 0.2 % offset yield strength at the temperature of interest
σTS = tensile strength at the temperature of interest

80
𝐾 = 𝑌𝑃𝐵√𝑊
(13)
where K= stress intensity factor
P = force corresponding to Pc, Pu or Pm (See fig. 34)
Y= Stress Intensity coefficient
𝑌 =6�𝑎0𝑊×�1.99−𝑎0𝑊�1−𝑎0𝑊��×�2.15−3.93𝑎0𝑊+2.7�𝑎0𝑊�
2�
�1+2𝑎0𝑊�×��1−𝑎0𝑊�3 (14)
Constraint m in equation 11:
𝑚 = 1.221 + 0.793 𝑎0𝑊
+ 2.751(𝑛) − 1.418 �𝑎0𝑊� (𝑛) (15)
where
𝑛 = 1.724 − 6.098𝑅
+ 8.326𝑅2
− 3.965𝑅3
(16)
where
𝑅 = 𝜎𝑇𝑆𝜎𝑌𝑆
(17)
𝑎𝑊
function η in equation 11:
𝜂 = 3.785 − 3.101 𝑎0𝑊
+ 2.018 �𝑎0𝑊�2 (18)

81
Figure 34. Types of Force versus Clip Gage Displacements Records (ASTM E
1290-02).
6.6.2. Compared microstructure examination An additional test on the microstructure was conducted using a high-resolution
microscope. The test results illustrate the microstructure differences between
QT and TMCP steels. These tests also show the HAZ microstructure and the
zone difference. QT HSS steel, steel E, has been investigated as a typical QT
HSS steel and steel C has been investigated as a typical TMCP HSS steel. This
test was conducted at StPSPU.
Specimen preparation included following techniques: sectioning, mounting,
grinding, polishing, etching. Abrasive cut-off machine Buehler Powermet 3000
was used for sectioning. Mounting was performed on Buehler Simplimet 1000
mounting press in Epomet and Transoptic mounting resins.
Buehler Phoenix 4000 was used for grinding and polishing of the specimens.
Grinding was undertaken with a set of SiC abrasive papers starting out with the
roughest (P180) and gradually introducing the finest (P400). Polishing materials
were the diamond suspensions with particles ranging from 9 to 1 μm, alumina
suspension 0.01 μm.

82
Revealing of microstructure was conducted by etching of the specimens in nital
e.g. 4% solution of HNO3 in ethanol.
The examination of microstructure was made using the light metallographic
microscope LEICA DMI5000M with magnification up to x1000. Acquisition of
images was performed by digital camera LEICA DFC320 attached to the
microscope, which has 3 MPix image sensor. LEICA Application Suite software
was used for enhancement and analysis of captured images. Image analysis
provided accurate means for determining grain size according to ASTM E112.
Stereomicroscope LEICA Mz12.5 was used for examination of macrostructures
of welded joints.
Hardness measurement was conducted on Vickers hardness tester Wilson
Wolpert 452SVD according to ISO6507. Microhardness of single phases or tiny
constituents were measured by microhardness tester Wilson Wolpert 402MVD
with diamond pyramid indenter under load of 0.0025 N.

83
7. RESULTS AND DISCUSSION
All of the tests carried out on these steels were made according to standard
SFS-EN ISO 15614-1 welding procedures. Additionally, CTOD tests were
conducted using standard ASTM E 1290-2. An in depth explanation of the
results of these tests is covered in this section.
7.1. Visual test
The researcher conducted a 100 % visual test on all of the welds according to
standard SFS EN ISO 17637. This step excluded all premature negative effects
that are possible in destructive testing. A proper visual test was conducted,
which included feeling the entire weld. No defects, such as undercut, high
reinforcement, root concavity, root defect etc., were noticed in the welded
structures, which may be due to the MAG welding methods which produce high
quality welds.
7.2. Macro photography
After etching, a macro photograph was taken of each of the welded joints. The
test specimens were prepared and etched in accordance with standard EN
1321 on one side to clearly reveal the fusion line, the HAZ, and the build up of
the runs. Fig. 35 shows the location of the different zones in the macro image.
Tables 13 through 20 show and explain macro photographs from all of the
welded steels. The influence of heat input is noticeable from the pictures, as the
HAZ zone is wider whit higher heat inputs. All steels were welded with two
passes, except for steel G, which was welded with three passes. Additionally,
the thickness of steel H was 12 mm, while all other steels were 8 mm thick. The
fill up run and the final run heat-treats the root pass, all of which can be seen in
macro photographs.

84
Heat input has the ability to effect the weld, with bigger heat inputs displaying
greater degrees of mixing between the base and filler metals. Similar Basu and
Raman (2002), this study reports, that different weld cooling rates lead to
different weld microstructure features and inclusion parameters, which further
leads to different values in mechanical properties. This is clearly seen from
different tensile test results that were included in this study. The fusion (mixing)
zone is seen from macro photographs, however, micro photographs display this
zone in much finer detail.
8 m
m
HAZ zone
Fusion line
Second pass
First pass
Figure 35. A macro photograph shows the different zones of a welded joint.

85
Table 13. Macro photographs of steel A and comments.
Steel name Macro sections Heat Input (kJ/mm)
Comments
A
1.0
Narrow HAZ with clear zones. Backing ring has developed near lack of side weld fusion in the root pass.
A
1.3
Very good root. Both welds are good. Heat input in capping run has changed the microstructure in the CGHAZ.
A
1.7
Wide HAZ area. Great heat input has changed the microstructure and also the root pass area. Too wide capping run consequent on 1.2 mm filler metal and great heat input.

86
Table 14. Macro photographs of steel B and comments.
Steel name
Macro sections Heat Input (kJ/mm)
Comments
B
1.0
Very clear zones in narrow HAZ area. Excess weld metal in root pass. Smooth capping run which is good in dynamic action.
B
1.3
Very good joint between gapping run and base metal. Clear HAZ area.
B
1.7
Wide HAZ area. Good joint in both surface and root sides. Fusion line is not clear as a consequence of good mixing.

87
Table 15. Macro photographs of steel C and comments.
Steel name
Macro sections Heat Input (kJ/mm)
Comments
C
1.0
Some misalignment in the welded plates. Smooth joints between weld and base plates. Also, the CGHAZ is clear in root pass.
C
1.3 Very good weld. All HAZ areas are evident. This kind of weld has good properties. When welding HSSs, this kind of weld is intended.
C
Heat input 1.7 kJ/mm
Steel C
8 m
m
1.7 Good weld, only root opening is greater than 1 mm. Gapping run is wide because the groove was too full after the root pass.

88
Table 16. Macro photographs of steel D and comments.
Steel name
Macro sections Heat Input (kJ/mm)
Comments
D
1.0
In QT steel the CGHAZ area is not as clear as steels A and C which are TMCP steels. HAZ area is clear. Small heat input lead up to clear fusion line.
D
1.3
Smooth joint in both sites, top of preparation and root. Undermatched filler weld is distinguishable from base material.
D
1.7
Wide HAZ area as a result of high heat input. The fusion line is not as clear as in steel D with a 1.0 kJ/mm heat input. This happens because greater mixing occurs at higher heat inputs, the effects of which can be seen in micro photographs.

89
Table 17. Macro photographs of steel E and comments.
Steel name
Macro sections Heat Input (kJ/mm)
Comments
E
1.0
The formation of the backing ring is important to the shape of the root pass. In this weld, the filler metal has spread over the base metal. When the fusion line is not completely melted, a lack of side weld fusion can occur.
E
1.3
Zones in the HAZ are distinguished. This QT steel has a clear CGHAZ using 1.3 kJ/mm heat input.
E
1.7
Wide HAZ as a consequence of high heat input. When the fusion line is not completely melted, a lack of side weld fusion can occur.

90
Table 18. Macro photographs of steel F and comments.
Steel name Macro sections Heat Input (kJ/mm)
Comments
F
1.0
Smooth joint between weld and base metal. Clear HAZ area where individual zones can be seen.
F
1.3
Gapping run has tempered all root pass. Very good smooth joint between weld and base material. Using this kind of weld, welded HSS structure will be durable.
F
1.7
Wide HAZ area. Shape of root pass is a little high. Wide CGHAZ is distinguished from HAZ.

91
Table 19. Macro photographs of steel G and comments.
Steel name Macro sections Heat Input (kJ/mm)
Comments
G
1.0
12 mm width QT steel welded using three passes. With this heat input, the HAZ area is narrow. This is intended when welding HSSs.
G
1.3
Not a much wider HAZ area than in 1.0 kJ/mm heat input.
G
1.7
Wider HAZ area where CGHAZ is well seen. The HAZ of steel G is quite narrow compared to other steels tested but can be explained because steel G is 12 mm thick instead of 8 mm of the other tested steel.

92
Table 20. Macro photographs of steel H and comments.
Steel name Macro sections Heat Input (kJ/mm)
Comments
H
1.0
Good looking welded structure. Narrow HAZ is good in welded HSS structure. Base material is not excessively tempered.
H
1.3
Wider HAZ area than in 1.0 kJ/mm heat input but very good looking welded HSS structure.
H
1.7
Too wide HAZ area but otherwise good welded high strength QT steel structure.
7.3. Micro photography
Micro photographs with an aspect ratio of 1:500 were taken of all of the welds
and their HAZs. The micro photograph in fig. 36 shows different zones where
pictures were taken, including the weld, fusion line (partially melted zone),
CGHAZ, FGHAZ, ICHAZ, SCHAZ and base material. Additionally, tables 21 -28
show and explain micro photographs from all of the welded steels. The heat
input moves the place of the FGHAZ, ICHAZ and SCHAZ further from the fusion
line; however, the microstructure is the same throughout the entirety of the
welded structure.

93
The base microstructure in the steels was either bainite-martensite or ferrite-
bainite. Disparities occurred in the phase structure of the steels depending on
the manufacturer. The weld structure was a ferrite-perlite microstructure, which
is a typical microstructure when the filler material is ESAB OK 12.51. Initial
columnar grains formed by epitaxial growth were detected by the presence of
grains of polygonal ferrite and Widmanstatten ferrite along the former grain
boundaries. However, the main constituent is an acicular ferrite, forming a
"wicker basket" structure.
The first phase forming on prior austenite grain boundaries during cooling below
the AC3 temperature is referred to as polygonal ferrite. At relatively low
undercooling temperatures, Widmstatten ferrite formation occurs. The ferrite
plates grow rapidly with a high aspect ratio, resulting in parallel arrays.
Widmanstatten ferrite plates grow directly from a prior austenite grain boundary
or from polygonal ferrite at the grain boundaries.
Acicular ferrite is recognized as an intragranular nucleated morphology of ferrite
in which there are multiple impingements between grains. The acicular ferrite
nucleates on inclusions inside the prior austenite grains during the γ→α
transformation. Provided there is a high density of inclusions, a fine interlocking
structure is produced.
The microstructure of the fusion line was an alloy of filler material and base
metal, the two of which mixed together. This zone is in partially melted state.
The microstructure of FL is mixed and contains bainite and polygonal ferrite,
fig.37. Near fusion line hardness in QT base metal started to grow fast and in
the CGHAZ, hardness had reached its highest point. The microstructure in the
CGHAZ of QT steels is martensite-bainite.
The highest concentration of martensite was observed in the CGHAZ, however
bainite was formed as well. The FGHAZ is the zone after CGHAZ, in which the
microstructure is smaller than the latter. Bainite phase is predominant with small
part of martensite phase. The last variable phase is the ICHAZ which has a

94
phase structure similar to the base material. The microstructure of the ICHAZ
can have some changes in its carbide structure which can decrease its yield
strength compared to the base material.
Line of photography
WeldMetal
FusionLine CGHAZ FGHAZ ICHAZ
BaseMetal
2 m
m
1
5
432 6
8 m
m
Figure 36. Semantic photograph from welded structure showing the areas
where the micro photographs had been taken.
Figure 37. Optical microstructure of the fusion line of QT HSS E.

95
Tabl
e 21
. Mic
ro p
hoto
grap
hs o
f wel
ded
TMC
P st
eel A
and
com
men
ts. A
spec
t rat
io o
f 1:5
00.
1 2
3 4
5 6
WEL
D M
ETAL
FU
SIO
N L
INE
CG
HA
Z FG
HA
Z IC
HA
Z an
d S
CG
AZ
BA
SE
MET
AL
Sol
idifi
ed w
eld
mat
eria
l is
ferri
te s
truct
ure.
Alp
ha
ferri
te, W
indm
anns
tätt
ferri
te a
nd a
cicu
lar f
errit
e oc
curs
in th
e fe
rrite
mic
ro
stru
ctur
es. E
pita
xial
cr
ysta
l gro
wth
is w
ell
disp
laye
d (L
anca
ster
19
80).
Liqu
id b
ase
met
al a
nd
wel
d m
etal
has
mix
ed
toge
ther
. Bas
e m
etal
al
loyi
ng e
lem
ents
, lik
e N
b,
V, T
i, et
c. h
ave
mix
ed w
ith
liqui
d fil
ler m
etal
. The
st
reng
th o
f the
wel
d ha
s gr
own
beca
use
of th
at.
Mic
rost
ruct
ure
of th
e ba
se
met
al n
ear f
usio
n zo
ne is
ba
inite
alth
ough
ferri
te-
pear
lite
can
occu
r.
In th
e C
GH
AZ
zone
, au
sten
ite h
ad ti
me
to g
row
la
rge.
Coo
ling
time
has
been
fast
and
the
mic
rost
ruct
ure
afte
r so
lidifi
catio
n is
bai
nite
th
roug
h so
me
pear
lite-
ferri
te c
an o
ccur
. Siz
e of
gr
ains
has
gro
wn,
but
de
pend
s on
t 8/5 ti
me
(hea
t in
put).
Inhe
rent
aus
teni
te
grai
n si
ze is
see
n in
this
fig
ure.
W
idth
of t
he C
GH
AZ
depe
nds
on h
eat i
nput
. A
CG
HA
Z th
at is
too
wid
e ca
n ca
use
the
wel
ded
stru
ctur
e to
bre
ak u
nder
lo
adin
g. T
hree
diff
eren
t he
at in
put 1
.0, 1
.3 a
nd 1
.7
kJ/m
m h
ad d
iffer
ent
CG
HA
Z w
idth
s an
d 1.
7 kJ
/mm
had
the
wid
est
CG
HA
Z. It
is n
otic
ed th
at
in th
is T
MC
P s
teel
ha
rdne
ss d
oes
not g
row
in
spite
of f
ast c
oolin
g in
the
CG
HA
Z zo
ne, b
ecau
se o
f th
e lo
w c
arbo
n co
nten
t of
the
base
met
al.
FGH
AZ
zone
has
au
sten
itize
d du
ring
wel
ding
. Aus
teni
tizin
g ha
d ch
ange
d th
e m
icro
st
ruct
ure
and
som
e ph
ases
are
larg
er th
an in
th
e ba
se m
ater
ial.
The
mai
n st
ruct
ure
is p
earli
te-
ferri
te. F
GH
AZ a
rea
has
the
sam
e st
reng
th th
an
the
base
mat
eria
l or m
ore.
In IC
HA
Z so
me
carb
ides
an
d ni
tride
s ha
d di
ssol
ved.
S
ize
of m
icro
stru
ctur
e is
sa
me
as b
ase
mat
eria
l. M
ain
mic
rost
ruct
ure
is
bain
ite a
nd fe
rrite
. D
iffer
ence
of
mic
rost
ruct
ure
betw
een
ICH
AZ
and
SC
HAZ
is
diffi
cult
to s
ee.
Bas
e m
icro
stru
ctur
e of
TM
CP
A s
teel
was
a
bain
ite a
nd fe
rrite
m
icro
stru
ctur
e.
Mic
rost
ruct
ure
was
ver
y sm
all a
nd h
omog
eneo
us.
Rol
ling
dire
ctio
n ha
s no
t an
y ef
fect
on
stee
l A.
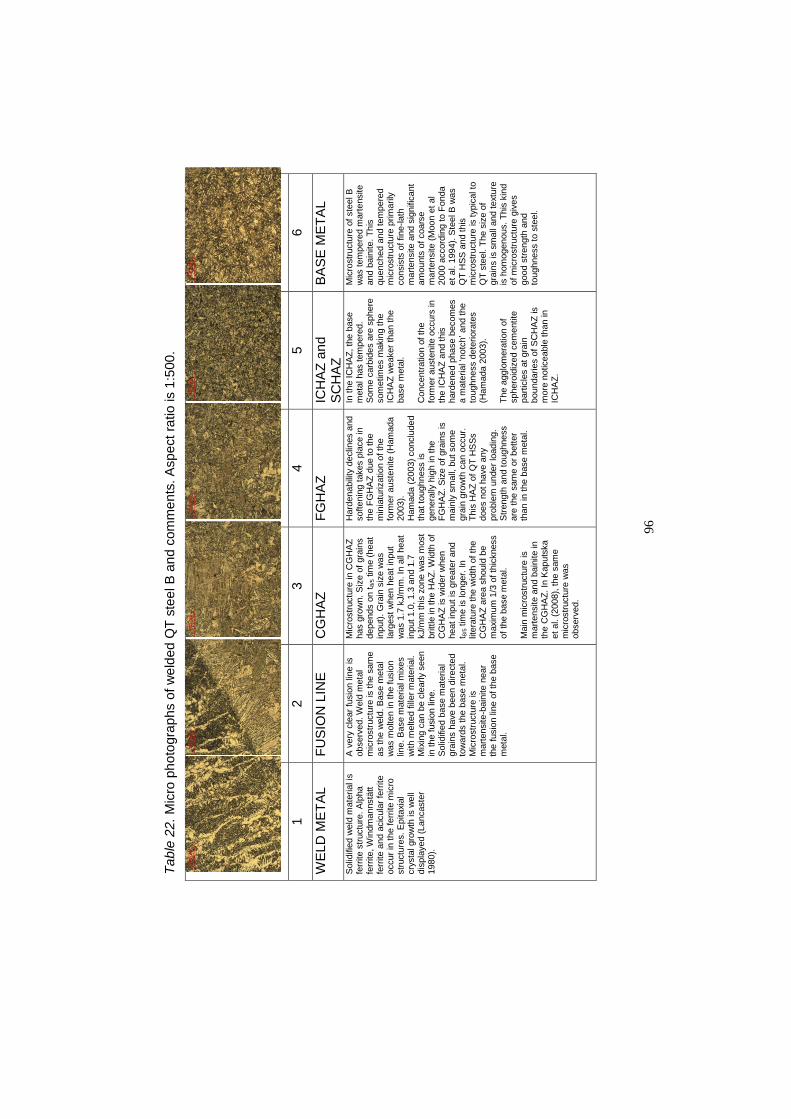
96
Tabl
e 22
. Mic
ro p
hoto
grap
hs o
f wel
ded
QT
stee
l B a
nd c
omm
ents
. Asp
ect r
atio
is 1
:500
.
1 2
3 4
5 6
WEL
D M
ETAL
FU
SIO
N L
INE
CG
HA
Z FG
HA
Z IC
HA
Z an
d S
CH
AZ
BA
SE
MET
AL
Sol
idifi
ed w
eld
mat
eria
l is
ferri
te s
truct
ure.
Alp
ha
ferri
te, W
indm
anns
tätt
ferri
te a
nd a
cicu
lar f
errit
e oc
cur i
n th
e fe
rrite
mic
ro
stru
ctur
es. E
pita
xial
cr
ysta
l gro
wth
is w
ell
disp
laye
d (L
anca
ster
19
80).
A v
ery
clea
r fus
ion
line
is
obse
rved
. Wel
d m
etal
m
icro
stru
ctur
e is
the
sam
e as
the
wel
d. B
ase
met
al
was
mol
ten
in th
e fu
sion
lin
e. B
ase
mat
eria
l mix
es
with
mel
ted
fille
r mat
eria
l. M
ixin
g ca
n be
cle
arly
see
n in
the
fusi
on li
ne.
Sol
idifi
ed b
ase
mat
eria
l gr
ains
hav
e be
en d
irect
ed
tow
ards
the
base
met
al.
Mic
rost
ruct
ure
is
mar
tens
ite-b
aini
te n
ear
the
fusi
on li
ne o
f the
bas
e m
etal
.
Mic
rost
ruct
ure
in C
GH
AZ
has
grow
n. S
ize
of g
rain
s de
pend
s on
t 8/5 ti
me
(hea
t in
put).
Gra
in s
ize
was
la
rges
t whe
n he
at in
put
was
1.7
kJ/
mm
. In
all h
eat
inpu
t 1.0
, 1.3
and
1.7
kJ
/mm
this
zon
e w
as m
ost
britt
le in
the
HA
Z. W
idth
of
CG
HA
Z is
wid
er w
hen
heat
inpu
t is
grea
ter a
nd
t 8/5 t
ime
is lo
nger
. In
liter
atur
e th
e w
idth
of t
he
CG
HA
Z ar
ea s
houl
d be
m
axim
um 1
/3 o
f thi
ckne
ss
of th
e ba
se m
etal
. M
ain
mic
rost
ruct
ure
is
mar
tens
ite a
nd b
aini
te in
th
e C
GH
AZ.
In K
aput
ska
et a
l. (2
008)
, the
sam
e m
icro
stru
ctur
e w
as
obse
rved
.
Har
dena
bilit
y de
clin
es a
nd
softe
ning
take
s pl
ace
in
the
FGH
AZ
due
to th
e m
inia
turiz
atio
n of
the
form
er a
uste
nite
(Ham
ada
2003
).
Ham
ada
(200
3) c
oncl
uded
th
at to
ughn
ess
is
gene
rally
hig
h in
the
FGH
AZ.
Siz
e of
gra
ins
is
mai
nly
smal
l, bu
t som
e gr
ain
grow
th c
an o
ccur
. Th
is H
AZ
of Q
T H
SSs
do
es n
ot h
ave
any
prob
lem
und
er lo
adin
g.
Stre
ngth
and
toug
hnes
s ar
e th
e sa
me
or b
ette
r th
an in
the
base
met
al.
In th
e IC
HAZ
, the
bas
e m
etal
has
tem
pere
d.
Som
e ca
rbid
es a
re s
pher
e so
met
imes
mak
ing
the
ICH
AZ
wea
ker t
han
the
base
met
al.
Con
cent
ratio
n of
the
form
er a
uste
nite
occ
urs
in
the
ICH
AZ
and
this
ha
rden
ed p
hase
bec
omes
a
mat
eria
l ‘no
tch’
and
the
toug
hnes
s de
terio
rate
s (H
amad
a 20
03).
The
aggl
omer
atio
n of
sp
hero
idiz
ed c
emen
tite
parti
cles
at g
rain
bo
unda
ries
of S
CH
AZ
is
mor
e no
ticea
ble
than
in
ICH
AZ.
Mic
rost
ruct
ure
of s
teel
B
was
tem
pere
d m
arte
nsite
an
d ba
inite
. Thi
s qu
ench
ed a
nd te
mpe
red
mic
rost
ruct
ure
prim
arily
co
nsis
ts o
f fin
e-la
th
mar
tens
ite a
nd s
igni
fican
t am
ount
s of
coa
rse
mar
tens
ite (M
oon
et a
l 20
00 a
ccor
ding
to F
onda
et
al.
1994
). S
teel
B w
as
QT
HSS
and
this
m
icro
stru
ctur
e is
typi
cal t
o Q
T st
eel.
The
size
of
grai
ns is
sm
all a
nd te
xtur
e is
hom
ogen
ous.
Thi
s ki
nd
of m
icro
stru
ctur
e gi
ves
good
stre
ngth
and
to
ughn
ess
to s
teel
.

97
Tabl
e 23
. Mic
ro p
hoto
grap
hs o
f wel
ded
TMC
P st
eel C
and
com
men
ts. A
spec
t rat
io is
1:5
00.
1 2
3 4
5 6
WEL
D M
ETAL
FU
SIO
N L
INE
CG
HA
Z FG
HA
Z IC
HA
Z an
d S
CH
AZ
BA
SE
MET
AL
Sol
idifi
ed w
eld
mat
eria
l is
ferri
te s
truct
ure.
Alp
ha
ferri
te, W
indm
anns
tätt
ferri
te a
nd a
cicu
lar f
errit
e oc
curs
in th
e fe
rrite
mic
ro
stru
ctur
es. E
pita
xial
cr
ysta
l gro
wth
is w
ell
disp
laye
d (L
anca
ster
19
80).
Mel
ted
base
met
al a
nd
liqui
d w
eld
met
al h
ave
mix
ed to
geth
er. B
ase
met
al a
lloyi
ng e
lem
ents
, su
ch a
s N
b, V
, Ti,
etc.
ha
ve m
ixed
with
liqu
id
fille
r met
al, c
ausi
ng th
e w
eld’
s st
reng
th to
gro
wth
. Th
e m
icro
stru
ctur
e of
the
base
met
al n
ear t
he fu
sion
zo
ne is
bai
nite
alth
ough
fe
rrite
- pea
rlite
can
occ
ur.
Gre
at h
eat i
nput
s ne
ar th
e fu
sion
line
hav
e m
ade
larg
e gr
ains
in th
e ba
se
met
al. T
he in
here
nt
aust
enite
gra
in s
ize
has
grow
n ne
ar th
e fu
sion
line
be
caus
e th
is z
one
has
been
the
long
est o
ver t
he
Ac 3
poi
nt.
In C
GH
AZ a
uste
nite
has
tim
e to
gro
w la
rge.
C
oolin
g tim
e ha
s be
en
fast
and
mic
rost
ruct
ure
afte
r the
sol
idifi
catio
n is
ba
inite
thou
gh s
ome
pear
lite-
ferri
te c
an o
ccur
. Th
e si
ze o
f the
gra
ins
has
grow
n an
d th
e in
here
nt
aust
enite
gra
in s
ize
can
be s
een
in th
is fi
gure
. W
idth
of t
he C
GH
AZ
depe
nds
on h
eat i
nput
. A
CG
HA
Z th
at is
too
wid
e ca
n ca
use
the
wel
ded
stru
ctur
e to
bre
ak u
nder
lo
adin
g. T
hree
diff
eren
t he
at in
put 1
.0, 1
.3 a
nd 1
.7
kJ/m
m h
ad d
iffer
ent
CG
HA
Z w
idth
s an
d 1.
7 kJ
/mm
had
the
wid
est
CG
HA
Z.
It is
not
iced
that
in th
is
TMC
P s
teel
C h
ardn
ess
does
not
gro
w in
spi
te o
f fa
st c
oolin
g in
the
CG
HA
Z be
caus
e of
the
low
car
bon
cont
ent o
f the
bas
e m
etal
.
FGH
AZ
zone
has
au
sten
itize
d du
ring
wel
ding
. Aus
teni
tizin
g ha
d ch
ange
d m
icro
stru
ctur
e an
d so
me
phas
es a
re
larg
er th
an in
bas
e m
ater
ial.
Mai
n st
ruct
ure
is
pear
lite-
ferri
te. F
GH
AZ
area
has
sam
e st
reng
th
than
bas
e m
ater
ial o
r m
ore.
In IC
HA
Z so
me
carb
ides
an
d ni
tride
s ha
d di
ssol
ved.
Siz
e of
m
icro
stru
ctur
e is
sam
e as
ba
se m
ater
ial.
Mai
n m
icro
stru
ctur
e is
bai
nite
an
d fe
rrite
. Diff
eren
ce o
f m
icro
stru
ctur
e be
twee
n IC
HA
Z an
d S
CH
AZ is
di
fficu
lt to
see
.
Bas
e m
icro
stru
ctur
e of
TM
CP
C s
teel
was
a
bain
ite a
nd fe
rrite
m
icro
stru
ctur
e.
Mic
rost
ruct
ure
was
ver
y sm
all a
nd h
omog
eneo
us.
Rol
ling
dire
ctio
n ha
s no
t ha
d an
y ef
fect
on
stee
l C.
PC
M o
f ste
el C
was
big
ger
than
ste
el A
. The
car
bon
cont
ent w
as s
ame
but M
n an
d N
b co
nten
ts w
ere
bigg
er. A
s re
sults
of t
hese
fa
ctor
s, s
teel
C h
as
grea
ter m
echa
nica
l fe
atur
es.
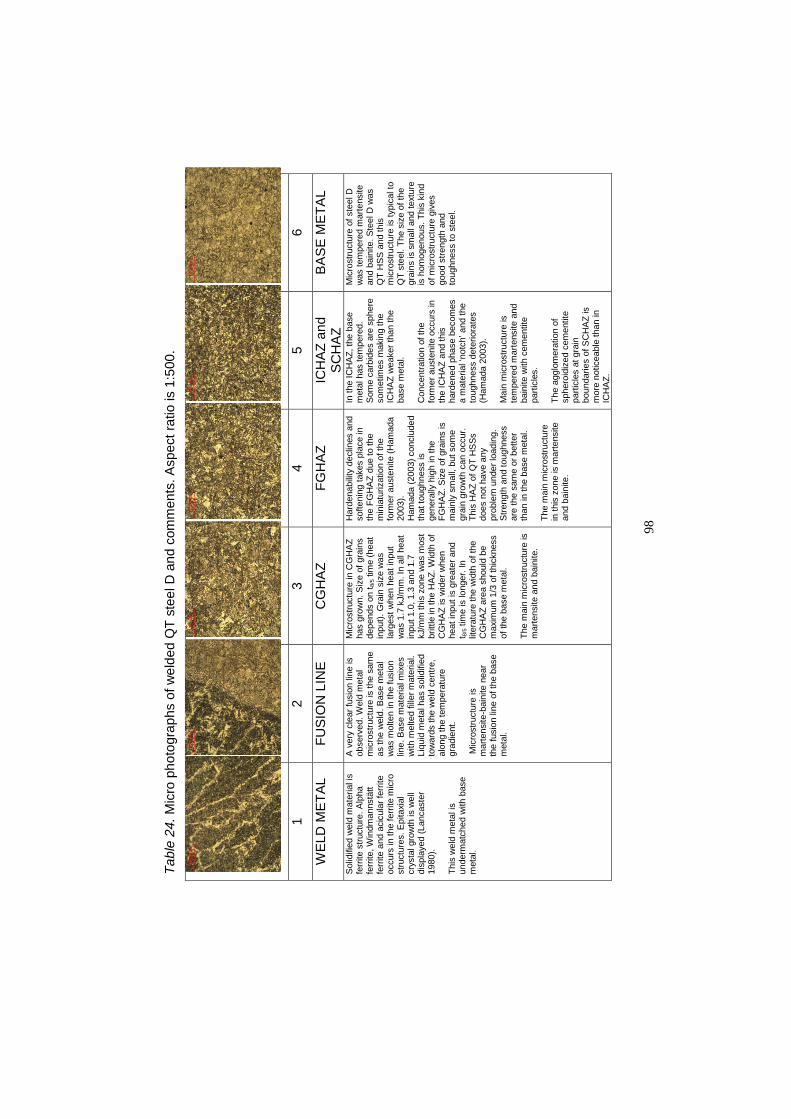
98
Tabl
e 24
. Mic
ro p
hoto
grap
hs o
f wel
ded
QT
stee
l D a
nd c
omm
ents
. Asp
ect r
atio
is 1
:500
.
1 2
3 4
5 6
WEL
D M
ETAL
FU
SIO
N L
INE
CG
HA
Z FG
HA
Z IC
HA
Z an
d S
CH
AZ
BA
SE
MET
AL
Sol
idifi
ed w
eld
mat
eria
l is
ferri
te s
truct
ure.
Alp
ha
ferri
te, W
indm
anns
tätt
ferri
te a
nd a
cicu
lar f
errit
e oc
curs
in th
e fe
rrite
mic
ro
stru
ctur
es. E
pita
xial
cr
ysta
l gro
wth
is w
ell
disp
laye
d (L
anca
ster
19
80).
Th
is w
eld
met
al is
un
derm
atch
ed w
ith b
ase
met
al.
A v
ery
clea
r fus
ion
line
is
obse
rved
. Wel
d m
etal
m
icro
stru
ctur
e is
the
sam
e as
the
wel
d. B
ase
met
al
was
mol
ten
in th
e fu
sion
lin
e. B
ase
mat
eria
l mix
es
with
mel
ted
fille
r mat
eria
l. Li
quid
met
al h
as s
olid
ified
to
war
ds th
e w
eld
cent
re,
alon
g th
e te
mpe
ratu
re
grad
ient
. M
icro
stru
ctur
e is
m
arte
nsite
-bai
nite
nea
r th
e fu
sion
line
of t
he b
ase
met
al.
Mic
rost
ruct
ure
in C
GH
AZ
has
grow
n. S
ize
of g
rain
s de
pend
s on
t 8/5 ti
me
(hea
t in
put).
Gra
in s
ize
was
la
rges
t whe
n he
at in
put
was
1.7
kJ/
mm
. In
all h
eat
inpu
t 1.0
, 1.3
and
1.7
kJ
/mm
this
zon
e w
as m
ost
britt
le in
the
HA
Z. W
idth
of
CG
HA
Z is
wid
er w
hen
heat
inpu
t is
grea
ter a
nd
t 8/5 t
ime
is lo
nger
. In
liter
atur
e th
e w
idth
of t
he
CG
HA
Z ar
ea s
houl
d be
m
axim
um 1
/3 o
f thi
ckne
ss
of th
e ba
se m
etal
. Th
e m
ain
mic
rost
ruct
ure
is
mar
tens
ite a
nd b
aini
te.
Har
dena
bilit
y de
clin
es a
nd
softe
ning
take
s pl
ace
in
the
FGH
AZ
due
to th
e m
inia
turiz
atio
n of
the
form
er a
uste
nite
(Ham
ada
2003
).
Ham
ada
(200
3) c
oncl
uded
th
at to
ughn
ess
is
gene
rally
hig
h in
the
FGH
AZ.
Siz
e of
gra
ins
is
mai
nly
smal
l, bu
t som
e gr
ain
grow
th c
an o
ccur
. Th
is H
AZ
of Q
T H
SSs
do
es n
ot h
ave
any
prob
lem
und
er lo
adin
g.
Stre
ngth
and
toug
hnes
s ar
e th
e sa
me
or b
ette
r th
an in
the
base
met
al.
The
mai
n m
icro
stru
ctur
e in
this
zon
e is
mar
tens
ite
and
bain
ite.
In th
e IC
HAZ
, the
bas
e m
etal
has
tem
pere
d.
Som
e ca
rbid
es a
re s
pher
e so
met
imes
mak
ing
the
ICH
AZ
wea
ker t
han
the
base
met
al.
Con
cent
ratio
n of
the
form
er a
uste
nite
occ
urs
in
the
ICH
AZ
and
this
ha
rden
ed p
hase
bec
omes
a
mat
eria
l ‘no
tch’
and
the
toug
hnes
s de
terio
rate
s (H
amad
a 20
03).
Mai
n m
icro
stru
ctur
e is
te
mpe
red
mar
tens
ite a
nd
bain
ite w
ith c
emen
tite
parti
cles
. Th
e ag
glom
erat
ion
of
sphe
roid
ized
cem
entit
e pa
rticl
es a
t gra
in
boun
darie
s of
SC
HA
Z is
m
ore
notic
eabl
e th
an in
IC
HA
Z.
Mic
rost
ruct
ure
of s
teel
D
was
tem
pere
d m
arte
nsite
an
d ba
inite
. Ste
el D
was
Q
T H
SS a
nd th
is
mic
rost
ruct
ure
is ty
pica
l to
QT
stee
l. Th
e si
ze o
f the
gr
ains
is s
mal
l and
text
ure
is h
omog
enou
s. T
his
kind
of
mic
rost
ruct
ure
give
s go
od s
treng
th a
nd
toug
hnes
s to
ste
el.

99
Tabl
e 25
. Mic
ro p
hoto
grap
hs o
f wel
ded
QT
stee
l E a
nd c
omm
ents
. Asp
ect r
atio
is 1
:500
.
1 2
3 4
5 6
WEL
D M
ETAL
FU
SIO
N L
INE
CG
HA
Z FG
HA
Z IC
HA
Z an
d S
CH
AZ
BA
SE
MET
AL
Sol
idifi
ed w
eld
mat
eria
l is
ferri
te s
truct
ure.
Alp
ha
ferri
te, W
indm
anns
tätt
ferri
te a
nd a
cicu
lar f
errit
e oc
curs
in th
e fe
rrite
mic
ro
stru
ctur
es. E
pita
xial
cr
ysta
l gro
wth
is w
ell
disp
laye
d (L
anca
ster
19
80).
Th
is w
eld
met
al is
un
derm
atch
ed w
ith b
ase
met
al.
A v
ery
clea
r fus
ion
line
is
obse
rved
. Wel
d m
etal
m
icro
stru
ctur
e is
the
sam
e as
the
wel
d. B
ase
met
al
was
mol
ten
in th
e fu
sion
lin
e. B
ase
mat
eria
l mix
es
with
mel
ted
fille
r mat
eria
l. Li
quid
met
al h
as s
olid
ified
to
war
ds th
e w
eld
cent
re,
alon
g th
e te
mpe
ratu
re
grad
ient
. M
icro
stru
ctur
e is
m
arte
nsite
-bai
nite
nea
r th
e fu
sion
line
of t
he b
ase
met
al.
Mic
rost
ruct
ure
in C
GH
AZ
has
grow
n. S
ize
of g
rain
s de
pend
s on
t 8/5 ti
me
(hea
t in
put).
Gra
in s
ize
was
la
rges
t whe
n he
at in
put
was
1.7
kJ/
mm
. In
all h
eat
inpu
t 1.0
, 1.3
and
1.7
kJ
/mm
this
zon
e w
as m
ost
britt
le in
the
HA
Z. W
idth
of
CG
HA
Z is
wid
er w
hen
heat
inpu
t is
grea
ter a
nd
t 8/5 t
ime
is lo
nger
. In
liter
atur
e th
e w
idth
of t
he
CG
HA
Z ar
ea s
houl
d be
m
axim
um 1
/3 o
f thi
ckne
ss
of th
e ba
se m
etal
. Th
e m
ain
mic
rost
ruct
ure
in th
is z
one
is m
arte
nsite
an
d ba
inite
.
Har
dena
bilit
y de
clin
es a
nd
softe
ning
take
s pl
ace
in
the
FGH
AZ
due
to th
e m
inia
turiz
atio
n of
the
form
er a
uste
nite
(Ham
ada
2003
).
Ham
ada
(200
3) c
oncl
uded
th
at to
ughn
ess
is
gene
rally
hig
h in
the
FGH
AZ.
Siz
e of
gra
ins
is
mai
nly
smal
l, bu
t som
e gr
ain
grow
th c
an o
ccur
. Th
is H
AZ
of Q
T H
SSs
do
es n
ot h
ave
any
prob
lem
und
er lo
adin
g.
Stre
ngth
and
toug
hnes
s ar
e th
e sa
me
or b
ette
r th
an in
the
base
met
al.
Mai
n m
icro
stru
ctur
e is
m
arte
nsite
and
bai
nite
in
that
zon
e.
In IC
HA
Z zo
ne b
ase
met
al
has
tem
pere
d. S
ome
carb
ides
are
sph
ered
and
it
mak
es IC
HA
Z zo
ne
som
etim
es w
eake
r tha
n ba
se m
etal
. C
once
ntra
tion
of a
uste
nite
fo
rmer
s oc
curs
in IC
HA
Z zo
ne a
nd th
is h
arde
ned
phas
e be
com
es a
mat
eria
l ‘n
otch
’ and
the
toug
hnes
s de
terio
rate
s (H
amad
a 20
03).
Mai
n m
icro
stru
ctur
e is
te
mpe
red
mar
tens
ite a
nd
bain
ite w
ith c
emen
tite
parti
cles
. Th
e ag
glom
erat
ion
of
sphe
roid
ized
cem
entit
e pa
rticl
es a
t gra
in
boun
darie
s of
SC
HA
Z is
m
ore
notic
eabl
e th
an in
IC
HA
Z.
Mic
rost
ruct
ure
of s
teel
E
was
tem
pere
d m
arte
nsite
an
d ba
inite
. Ste
el E
was
Q
T H
SS a
nd th
is
mic
rost
ruct
ure
is ty
pica
l to
QT
stee
l. Th
e si
ze o
f the
gr
ains
is s
mal
l and
the
text
ure
is h
omog
enou
s.
This
kin
d of
mic
rost
ruct
ure
give
s go
od s
treng
th a
nd
toug
hnes
s to
ste
el.

100
Tabl
e 26
. Mic
ro p
hoto
grap
hs o
f wel
ded
QT
stee
l F a
nd c
omm
ents
. Asp
ect r
atio
is 1
:500
.
1 2
3 4
5 6
WEL
D M
ETAL
FU
SIO
N L
INE
CG
HA
Z FG
HA
Z IC
HA
Z an
d S
CH
AZ
BA
SE
MET
AL
Sol
idifi
ed w
eld
mat
eria
l is
ferri
te s
truct
ure.
Alp
ha
ferri
te, W
indm
anns
tätt
ferri
te a
nd a
cicu
lar f
errit
e oc
curs
in th
e fe
rrite
mic
ro
stru
ctur
es. E
pita
xial
cr
ysta
l gro
wth
is w
ell
disp
laye
d (L
anca
ster
19
80).
Th
is w
eld
met
al is
un
derm
atch
ed w
ith b
ase
met
al.
A v
ery
clea
r fus
ion
line
is
obse
rved
. Wel
d m
etal
m
icro
stru
ctur
e is
the
sam
e as
the
wel
d. B
ase
met
al
was
mol
ten
in th
e fu
sion
lin
e. B
ase
mat
eria
l mix
es
with
mel
ted
fille
r mat
eria
l. Li
quid
met
al h
as s
olid
ified
to
war
ds th
e w
eld
cent
re,
alon
g th
e te
mpe
ratu
re
grad
ient
. M
icro
stru
ctur
e is
m
arte
nsite
-bai
nite
nea
r th
e fu
sion
line
of t
he b
ase
met
al.
Mic
rost
ruct
ure
in C
GH
AZ
has
grow
n. S
ize
of g
rain
s de
pend
s on
t 8/5 ti
me
(hea
t in
put).
Gra
in s
ize
was
la
rges
t whe
n he
at in
put
was
1.7
kJ/
mm
. In
all h
eat
inpu
t 1.0
, 1.3
and
1.7
kJ
/mm
this
zon
e w
as m
ost
britt
le in
the
HA
Z. W
idth
of
CG
HA
Z is
wid
er w
hen
heat
inpu
t is
grea
ter a
nd
t 8/5 t
ime
is lo
nger
. In
liter
atur
e th
e w
idth
of t
he
CG
HA
Z ar
ea s
houl
d be
m
axim
um 1
/3 o
f thi
ckne
ss
of th
e ba
se m
etal
. Th
e m
ain
mic
rost
ruct
ure
in th
is z
one
is m
arte
nsite
an
d ba
inite
.
Har
dena
bilit
y de
clin
es a
nd
softe
ning
take
s pl
ace
in
the
FGH
AZ
due
to th
e m
inia
turiz
atio
n of
the
form
er a
uste
nite
(Ham
ada
2003
).
Ham
ada
(200
3) c
oncl
uded
th
at to
ughn
ess
is
gene
rally
hig
h in
the
FGH
AZ.
Siz
e of
gra
ins
is
mai
nly
smal
l, bu
t som
e gr
ain
grow
th c
an o
ccur
. Th
is H
AZ
of Q
T H
SSs
do
es n
ot h
ave
any
prob
lem
und
er lo
adin
g.
Stre
ngth
and
toug
hnes
s ar
e th
e sa
me
or b
ette
r th
an in
the
base
met
al.
Mai
n m
icro
stru
ctur
e is
m
arte
nsite
and
bai
nite
in
that
zon
e.
In IC
HA
Z zo
ne b
ase
met
al
has
tem
pere
d. S
ome
carb
ides
are
sph
ered
and
it
mak
es IC
HA
Z zo
ne
som
etim
es w
eake
r tha
n ba
se m
etal
. C
once
ntra
tion
of a
uste
nite
fo
rmer
s oc
curs
in IC
HA
Z zo
ne a
nd th
is h
arde
ned
phas
e be
com
es a
mat
eria
l ‘n
otch
’ and
the
toug
hnes
s de
terio
rate
s (H
amad
a 20
03).
Mai
n m
icro
stru
ctur
e is
te
mpe
red
mar
tens
ite a
nd
bain
ite w
ith c
emen
tite
parti
cles
. Th
e ag
glom
erat
ion
of
sphe
roid
ized
cem
entit
e pa
rticl
es a
t gra
in
boun
darie
s of
SC
HA
Z is
m
ore
notic
eabl
e th
an in
IC
HA
Z.
Mic
rost
ruct
ure
of s
teel
F
was
tem
pere
d m
arte
nsite
an
d ba
inite
. Ste
el F
was
Q
T H
SS a
nd th
is
mic
rost
ruct
ure
is ty
pica
l to
QT
stee
l. Th
e si
ze o
f the
gr
ains
was
sm
all a
nd th
e te
xtur
e is
hom
ogen
ous.
Th
is k
ind
of m
icro
stru
ctur
e gi
ves
good
stre
ngth
and
to
ughn
ess
to s
teel
.
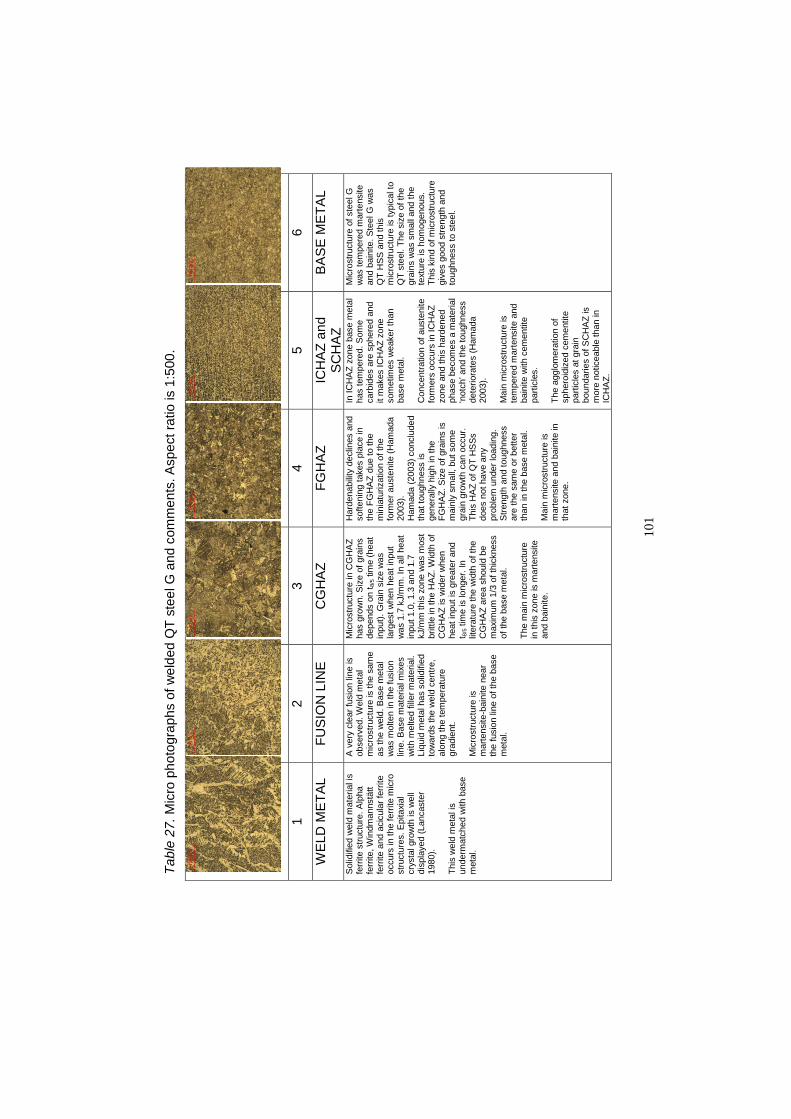
101
Tabl
e 27
. Mic
ro p
hoto
grap
hs o
f wel
ded
QT
stee
l G a
nd c
omm
ents
. Asp
ect r
atio
is 1
:500
.
1 2
3 4
5 6
WEL
D M
ETAL
FU
SIO
N L
INE
CG
HA
Z FG
HA
Z IC
HA
Z an
d S
CH
AZ
BA
SE
MET
AL
Sol
idifi
ed w
eld
mat
eria
l is
ferri
te s
truct
ure.
Alp
ha
ferri
te, W
indm
anns
tätt
ferri
te a
nd a
cicu
lar f
errit
e oc
curs
in th
e fe
rrite
mic
ro
stru
ctur
es. E
pita
xial
cr
ysta
l gro
wth
is w
ell
disp
laye
d (L
anca
ster
19
80).
Th
is w
eld
met
al is
un
derm
atch
ed w
ith b
ase
met
al.
A v
ery
clea
r fus
ion
line
is
obse
rved
. Wel
d m
etal
m
icro
stru
ctur
e is
the
sam
e as
the
wel
d. B
ase
met
al
was
mol
ten
in th
e fu
sion
lin
e. B
ase
mat
eria
l mix
es
with
mel
ted
fille
r mat
eria
l. Li
quid
met
al h
as s
olid
ified
to
war
ds th
e w
eld
cent
re,
alon
g th
e te
mpe
ratu
re
grad
ient
. M
icro
stru
ctur
e is
m
arte
nsite
-bai
nite
nea
r th
e fu
sion
line
of t
he b
ase
met
al.
Mic
rost
ruct
ure
in C
GH
AZ
has
grow
n. S
ize
of g
rain
s de
pend
s on
t 8/5 ti
me
(hea
t in
put).
Gra
in s
ize
was
la
rges
t whe
n he
at in
put
was
1.7
kJ/
mm
. In
all h
eat
inpu
t 1.0
, 1.3
and
1.7
kJ
/mm
this
zon
e w
as m
ost
britt
le in
the
HA
Z. W
idth
of
CG
HA
Z is
wid
er w
hen
heat
inpu
t is
grea
ter a
nd
t 8/5 t
ime
is lo
nger
. In
liter
atur
e th
e w
idth
of t
he
CG
HA
Z ar
ea s
houl
d be
m
axim
um 1
/3 o
f thi
ckne
ss
of th
e ba
se m
etal
. Th
e m
ain
mic
rost
ruct
ure
in th
is z
one
is m
arte
nsite
an
d ba
inite
.
Har
dena
bilit
y de
clin
es a
nd
softe
ning
take
s pl
ace
in
the
FGH
AZ
due
to th
e m
inia
turiz
atio
n of
the
form
er a
uste
nite
(Ham
ada
2003
).
Ham
ada
(200
3) c
oncl
uded
th
at to
ughn
ess
is
gene
rally
hig
h in
the
FGH
AZ.
Siz
e of
gra
ins
is
mai
nly
smal
l, bu
t som
e gr
ain
grow
th c
an o
ccur
. Th
is H
AZ
of Q
T H
SSs
do
es n
ot h
ave
any
prob
lem
und
er lo
adin
g.
Stre
ngth
and
toug
hnes
s ar
e th
e sa
me
or b
ette
r th
an in
the
base
met
al.
Mai
n m
icro
stru
ctur
e is
m
arte
nsite
and
bai
nite
in
that
zon
e.
In IC
HA
Z zo
ne b
ase
met
al
has
tem
pere
d. S
ome
carb
ides
are
sph
ered
and
it
mak
es IC
HA
Z zo
ne
som
etim
es w
eake
r tha
n ba
se m
etal
. C
once
ntra
tion
of a
uste
nite
fo
rmer
s oc
curs
in IC
HA
Z zo
ne a
nd th
is h
arde
ned
phas
e be
com
es a
mat
eria
l ‘n
otch
’ and
the
toug
hnes
s de
terio
rate
s (H
amad
a 20
03).
Mai
n m
icro
stru
ctur
e is
te
mpe
red
mar
tens
ite a
nd
bain
ite w
ith c
emen
tite
parti
cles
. Th
e ag
glom
erat
ion
of
sphe
roid
ized
cem
entit
e pa
rticl
es a
t gra
in
boun
darie
s of
SC
HA
Z is
m
ore
notic
eabl
e th
an in
IC
HA
Z.
Mic
rost
ruct
ure
of s
teel
G
was
tem
pere
d m
arte
nsite
an
d ba
inite
. Ste
el G
was
Q
T H
SS a
nd th
is
mic
rost
ruct
ure
is ty
pica
l to
QT
stee
l. Th
e si
ze o
f the
gr
ains
was
sm
all a
nd th
e te
xtur
e is
hom
ogen
ous.
Th
is k
ind
of m
icro
stru
ctur
e gi
ves
good
stre
ngth
and
to
ughn
ess
to s
teel
.

102
Tabl
e 28
. Mic
ro p
hoto
grap
hs o
f wel
ded
QT
stee
l H a
nd c
omm
ents
of i
t. A
spec
t rat
io is
1:5
00.
1 2
3 4
5 6
WEL
D M
ETAL
FU
SIO
N L
INE
CG
HA
Z FG
HA
Z IC
HA
Z an
d S
CH
AZ
BA
SE
MET
AL
Sol
idifi
ed w
eld
mat
eria
l is
ferri
te s
truct
ure.
Alp
ha
ferri
te, W
indm
anns
tätt
ferri
te a
nd a
cicu
lar f
errit
e oc
curs
in th
e fe
rrite
mic
ro
stru
ctur
es. E
pita
xial
cr
ysta
l gro
wth
is w
ell
disp
laye
d (L
anca
ster
19
80).
This
wel
d m
etal
is
unde
rmat
ched
with
bas
e m
etal
.
A v
ery
clea
r fus
ion
line
is
obse
rved
. Wel
d m
etal
m
icro
stru
ctur
e is
the
sam
e as
the
wel
d. B
ase
met
al
was
mol
ten
in th
e fu
sion
lin
e. B
ase
mat
eria
l mix
es
with
mel
ted
fille
r mat
eria
l. Li
quid
met
al h
as s
olid
ified
to
war
ds th
e w
eld
cent
re,
alon
g th
e te
mpe
ratu
re
grad
ient
.
Mic
rost
ruct
ure
is
mar
tens
ite-b
aini
te n
ear
the
fusi
on li
ne o
f the
bas
e m
etal
.
Mic
rost
ruct
ure
in C
GH
AZ
has
grow
n. S
ize
of g
rain
s de
pend
s on
t 8/5 ti
me
(hea
t in
put).
Gra
in s
ize
was
la
rges
t whe
n he
at in
put
was
1.7
kJ/
mm
. In
all h
eat
inpu
t 1.0
, 1.3
and
1.7
kJ
/mm
this
zon
e w
as m
ost
britt
le in
the
HA
Z. W
idth
of
CG
HA
Z is
wid
er w
hen
heat
inpu
t is
grea
ter a
nd
t 8/5 t
ime
is lo
nger
. In
liter
atur
e th
e w
idth
of t
he
CG
HA
Z ar
ea s
houl
d be
m
axim
um 1
/3 o
f thi
ckne
ss
of th
e ba
se m
etal
.
The
mai
n m
icro
stru
ctur
e in
this
zon
e is
mar
tens
ite
and
bain
ite.
Har
dena
bilit
y de
clin
es a
nd
softe
ning
take
s pl
ace
in
the
FGH
AZ
due
to th
e m
inia
turiz
atio
n of
the
form
er a
uste
nite
(Ham
ada
2003
).
Ham
ada
(200
3) c
oncl
uded
th
at to
ughn
ess
is
gene
rally
hig
h in
the
FGH
AZ.
Siz
e of
gra
ins
is
mai
nly
smal
l, bu
t som
e gr
ain
grow
th c
an o
ccur
. Th
is H
AZ
of Q
T H
SSs
do
es n
ot h
ave
any
prob
lem
und
er lo
adin
g.
Stre
ngth
and
toug
hnes
s ar
e th
e sa
me
or b
ette
r th
an in
the
base
met
al.
Mai
n m
icro
stru
ctur
e is
m
arte
nsite
and
bai
nite
in
that
zon
e.
In IC
HA
Z zo
ne b
ase
met
al
has
tem
pere
d. S
ome
carb
ides
are
sph
ered
and
it
mak
es IC
HA
Z zo
ne
som
etim
es w
eake
r tha
n ba
se m
etal
.
Con
cent
ratio
n of
aus
teni
te
form
ers
occu
rs in
ICH
AZ
zone
and
this
har
dene
d ph
ase
beco
mes
a m
ater
ial
‘not
ch’ a
nd th
e to
ughn
ess
dete
riora
tes
(Ham
ada
2003
).
Mai
n m
icro
stru
ctur
e is
te
mpe
red
mar
tens
ite a
nd
bain
ite w
ith c
emen
tite
parti
cles
.
The
aggl
omer
atio
n of
sp
hero
idiz
ed c
emen
tite
parti
cles
at g
rain
bo
unda
ries
of S
CH
AZ
is
mor
e no
ticea
ble
than
in
ICH
AZ.
Mic
rost
ruct
ure
of s
teel
G
was
tem
pere
d m
arte
nsite
an
d ba
inite
. Ste
el G
was
Q
T H
SS a
nd th
is
mic
rost
ruct
ure
is ty
pica
l to
QT
stee
l. Th
e si
ze o
f the
gr
ains
was
sm
all a
nd th
e te
xtur
e is
hom
ogen
ous.
Th
is k
ind
of m
icro
stru
ctur
e gi
ves
good
stre
ngth
and
to
ughn
ess
to s
teel
.
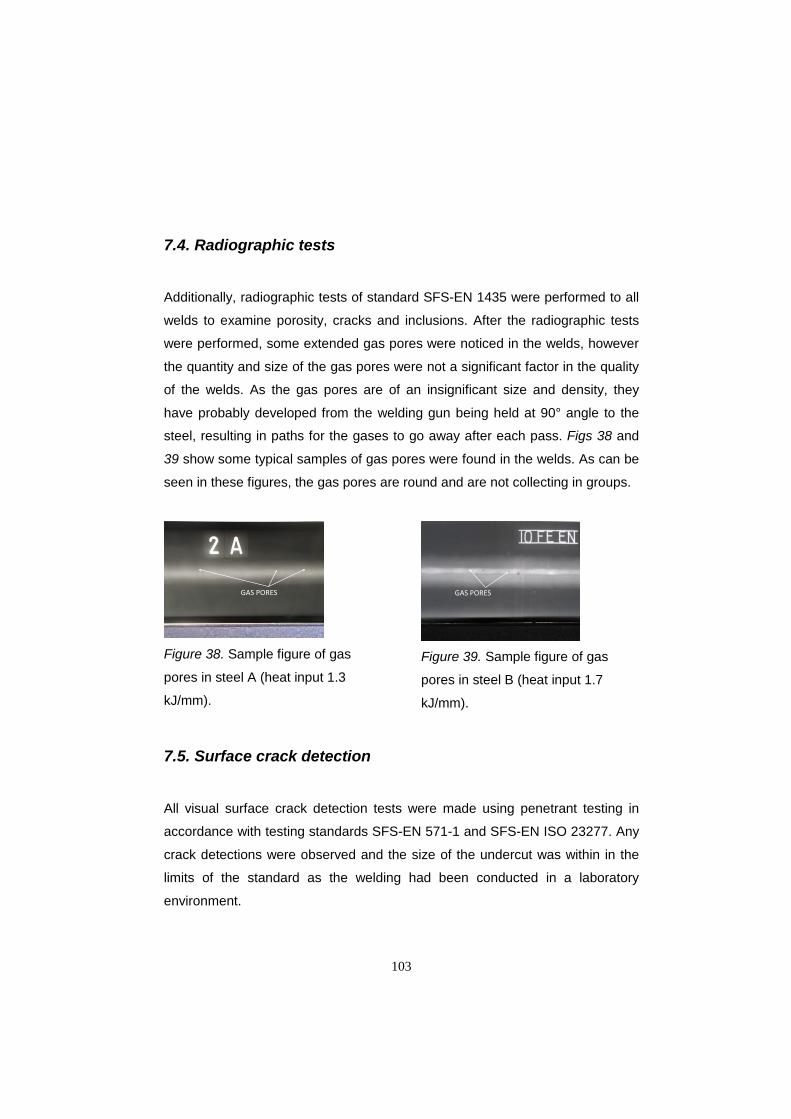
103
7.4. Radiographic tests
Additionally, radiographic tests of standard SFS-EN 1435 were performed to all
welds to examine porosity, cracks and inclusions. After the radiographic tests
were performed, some extended gas pores were noticed in the welds, however
the quantity and size of the gas pores were not a significant factor in the quality
of the welds. As the gas pores are of an insignificant size and density, they
have probably developed from the welding gun being held at 90° angle to the
steel, resulting in paths for the gases to go away after each pass. Figs 38 and
39 show some typical samples of gas pores were found in the welds. As can be
seen in these figures, the gas pores are round and are not collecting in groups.
GAS PORES
Figure 38. Sample figure of gas
pores in steel A (heat input 1.3
kJ/mm).
GAS PORES
Figure 39. Sample figure of gas
pores in steel B (heat input 1.7
kJ/mm).
7.5. Surface crack detection
All visual surface crack detection tests were made using penetrant testing in
accordance with testing standards SFS-EN 571-1 and SFS-EN ISO 23277. Any
crack detections were observed and the size of the undercut was within in the
limits of the standard as the welding had been conducted in a laboratory
environment.

104
7.6. Transverse tensile test
Two transverse tensile tests were performed on all welds in accordance with
standard SFS-EN ISO 4136. The results of these tests are in figs 40 though 43.
Fig. 40 represents all of the tensile test results that were collected and helps to
illustrate that the tensile strength of the welded structure is lower when the heat
input is bigger. The tensile strength of the filler material was 560 MPa, and the
tensile strength of the base material, corresponding to its material standard,
was between 700 and 770 MPa. All of the material certificates have actual
values of tensile strength. When undermatched filler metal was used during
welding, the real tensile strength of the undermatched welded structure was
more than the tensile strength of filler material as a consequence of penetration
and mixing between the base and filler materials. The tensile strength of the
welded structure is near the tensile strength of the base material required by
that steel’s standard. All of this can be seen in figs 40 through 42 and
additionally all of the tested welded structures broke at their welding points as a
result of the tensile test.
580
600
620
640
660
680
700
720
740
760
780
Heat input 1.0 kJ/mm Heat input 1.3 kJ/mm Heat input 1.7 kJ/mm
Tensile test values of structure
A B C D E F G H
MPa
STEELS
Figure 40. Tensile strengths of welded joint made of different steels using three
heat input.
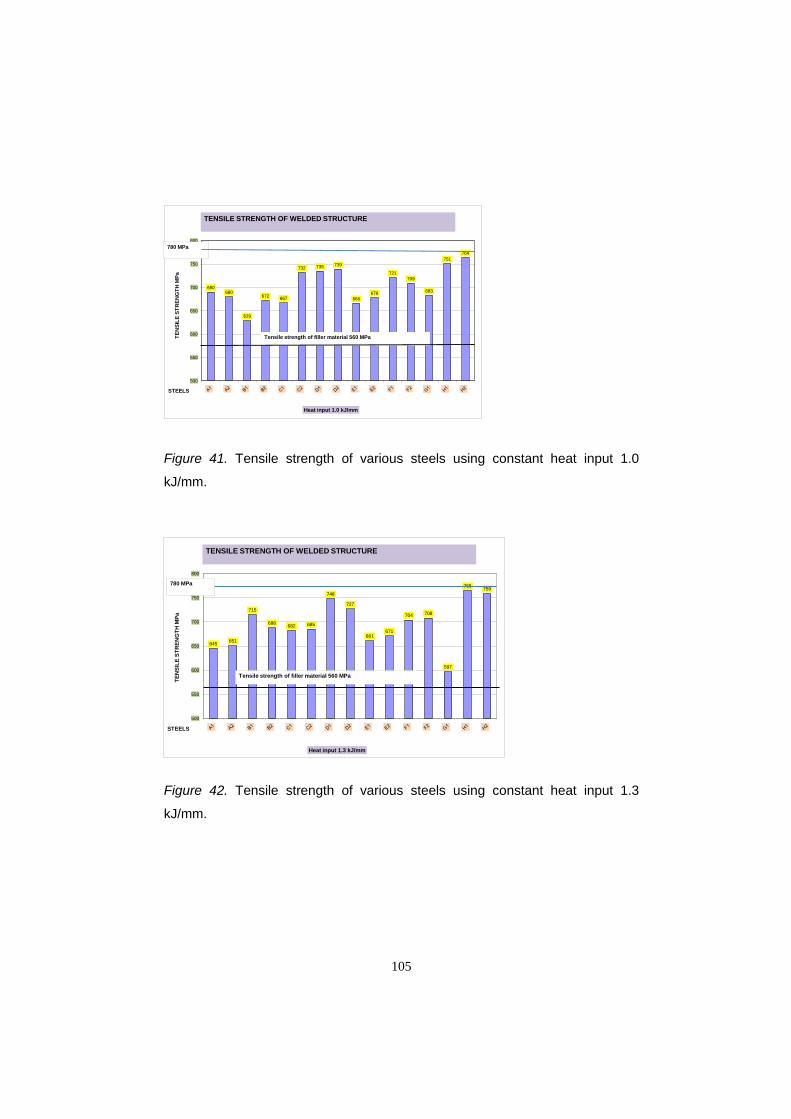
105
690680
629
672 667
732 735 739
666678
721709
683
751764
500
550
600
650
700
750
800
TEN
SILE
STR
ENG
TH M
Pa
Heat input 1.0 kJ/mm
Tensile strength of filler material 560 MPa
TENSILE STRENGTH OF WELDED STRUCTURE
STEELS
780 MPa
Figure 41. Tensile strength of various steels using constant heat input 1.0
kJ/mm.
645 651
715
688 682 685
748
727
661671
704 708
597
765 759
500
550
600
650
700
750
800
TEN
SILE
STR
ENG
TH M
Pa
Heat input 1.3 kJ/mm
Tensile strength of filler material 560 MPa
TENSILE STRENGTH OF WELDED STRUCTURE
STEELS
780 MPa
Figure 42. Tensile strength of various steels using constant heat input 1.3
kJ/mm.

106
660647
685691
671
706716
642 639
669679
632 631
739
718
500
550
600
650
700
750
800
TEN
SILE
STR
ENG
TH M
Pa
Heat input 1.7 kJ/mm
Tensile strength of filler material 560 MPa
STEELS
TENSILE STRENGTH OF WELDED STRUCTURE
780 MPa
Figure 43. Tensile strength of various steels using constant heat input 1.7
kJ/mm.
The mismatch level between filler metal and parent metal was 0.72, which is
lower than the recommendations of many researchers (Toyota 1986, Satoh & et
al. 1975). Within such as low mismatch value, it is clear that the weld is the
weakest place in structure, especially when compared to the strengths of filler
and base materials. Tensile strength values change when penetration and
mixing between filler and base material occurs and figures 41 through 43 show
that the strength values of the base material are higher than the filler material. A
typical example of a broken tensile test bar is shown in figs 44 a, b, c and d.
The fracture occurs in the weld at the point of reduction area, the failure of
which arises in the HAZ and continues into the weld.

107
a)side picture b) face side
c) root side d) broken tensile test bar
Figure 44. Tensile test bar.
Steel A has standard tensile test value 700 MPa and using the lowest heat input
(1.0 kJ/mm), the values obtained from steel A were near the tensile strength of
the base steel. The same happened in steel H when heat input was 1.0 and 1.3
kJ/mm, and nearly same situation occurred in steel D. In these situations, the
tensile strength of welded structure was 4 % lower than the tensile strength of
base material. The standard tensile strength of all steels with the exception of
steel A was 780 MPa.
In all welded structures, the failure started from the weld or the HAZ, however,
in some instants the failure started from the fusion line between weld and HAZ.
This happens because of the low yield strength of filler material but also
because of possible deformation in the weld. Nearly all of the tensile test pieces
failed starting at the fusion line and only few of them broke in the HAZ. When
the failure began in the fusion line or the HAZ, the direction of the break was
towards the weld at a traditional 45° angle.

108
There will always be differences between welded structures regardless of how
the steel was welded or what the heat input of welded structure was. All of heat
inputs, steel H had the best tensile strength values, closely followed by steel G.
In all cases, tensile strength values were the lowest when the heat input was
1.7 kJ/mm, however steel B’s lowest tensile test occurred when the heat input
was 1.0 kJ/mm. It is important to consider that tensile test values do not account
for all feature of the welded structure, and this is why other tests were
conducted within the scope of this research to determine other mechanical
properties.
Tables 29, 30 and 31 present tensile test values which are used in different heat
inputs in welding. Regardless of heat input, all tensile test values are higher
than the tensile test of the filler material, which was 560 MPa. The tensile test
values of the base material was around 780 MPa or more (steel A had minimum
tensile test value 700 MPa). In all steels, the real tensile test value was more
than in manufactorer’s procedure. Heat input has lowering effect to tensile
strength of structure. Manufactory method doesn’t effect to tensile strength.
Also, TMCP and QT steels behaved equally when using different heat input in
welding.
In all structures, the elongation at the break was considerably smaller than the
base material elongation. In 690 MPa class HSSs, the standards stipulate that
the minimum A5 should be 15%. However, in this research the values for the
elongation at the break were only half of the base material values. These
discrepancies can be accounted for by the differences in elongation at the break
between the base and filler material as seen in tables 29, 30 and 31. The
gauge length was 85 mm (standard SFS-EN ISO 6892-1) while the length of the
weld was around 25 mm. The yield strength of the filler material was 470 MPa
while the yield strength of the base material was 690 MPa. As there was such a
large difference between these yield strength values, most of the yielding
occurred in the weld. As these steels were constructed under varying
manufacturing methods, their resulting yield strength and elongation break

109
values differed from one another. These differences caused variations between
elongation break values of the welded structures when using the same heat
input. The amount of penetration and dilution that occurred between the base
and filler materials led to a better tensile strength in the welded structure than in
the filler material. There is a correlation between the tensile strength and
elongation break value of HSS, where larger real tensile strength leads to
smaller elongation break values.
When dilution happens between the base material and the weld, alloy elements
can mix together. Some alloys such as Nb mixes to the weld and increases the
properties of the welded structure. The Metal Handbook (1990) explains that the
yield strength of the carbon steel increases with small additions of Nb. The yield
strength of carbon steel can increase from 490 MPa to 700 MPa when the
addition of Nb is 0.02 %.
Using fillet welds, it is possible to increase the size of the weld (effective throat
thickness) which leads to a greater tensile strength in the welded structure.
Aside from increasing the tensile strength, this method also has some negative
side effects including a longer welding time, higher cost and decreasing
productivity. As opposed to fillet welds, butt welds are limited and increasing the
weld size is not possible. When using undermatched filler material, the welded
structure will not have a strength matching its base material.

110
Table 29. Comparing the tensile strength and elongation at break of base ma-
terial to the welded structure when heat input was 1.0 kJ/mm. Red font corres-
ponds to the highest value while green font corresponds to the lowest.
Table 30. Comparing the tensile strength and elongation at break of base
material to the welded structure when heat input was 1.3 kJ/mm. Red font
corresponds to the highest value while green font corresponds to the lowest.
TEST SPECIMEN
TESTED TENSILE
TRENGTH MPa
% BIGGER THAN FIL-LER MATE-
RIAL
TENSILE STRENGTH OF BASE MATERI-AL (from ma-terial certificate) MPa
% LOWER THAN BASE MATERIAL
ELON-GATION AT BREAK A₅ %
MEAN VALUE
A1 690 23.2 769 10.3 8.5 8.2 A2 680 21.4 11.6 7.9 B1 629 12.3 844 25.5 4.8 5.0 B2 672 20.0 20.4 5.2 C1 667 19.1 821 18.8 7.0 6.2 C2 732 30.7 10.8 5.4 D1 735 31.3 852 13.7 6.4 6.4 D2 739 32.0 13.3 6.4 E1 666 18.9 835 20.2 4.3 4.4 E2 678 21.1 18.8 4.6 F1 721 28.8 798 9.6 5.5 5.5 F2 709 26.6 11.2 5.4 G2 683 22.0 879 22.3 7.0 7.0 H1 751 34.1 865 13.2 6.3 6.3 H2 764 36.4 11.7 6.3
MEAN VALUE 25.2 15.4 6.1
TEST SPECIMEN
TESTED TENSILE
STRENGTH MPa
% BIGGER THAN FIL-LER MATE-
RIAL
TENSILE STRENGTH OF BASE MATERI-AL (from ma-terial certificate) MPa
% LOWER THAN BASE MATERIAL
ELON-GATION AT BREAK A₅ %
MEAN VALUE
A1 645 15.2 769 16.1 9.4 9.3 A2 651 16.3 15.3 9.3 B1 715 27.7 844 15.3 5.8 6.1 B2 688 22.9 18.5 6.4 C1 682 21.8 821 16.9 9.6 9.4 C2 685 22.3 16.6 9.3 D1 748 33.6 852 12.2 5.6 5.7 D2 727 29.8 14.7 5.7 E1 661 18.0 835 20.8 5.0 4.8 E2 671 19.8 19.6 4.6 F1 704 25.7 798 11.8 8.1 7.9 F2 708 26.4 11.3 7.8 G2 597 6.6 879 32.1 7.0 7.0 H1 765 36.6 865 11.6 5.9 6.0 H2 759 35.5 12.3 6.1
MEAN VALUE 23.9 16.3 7.1

111
Table 31. Comparing the tensile strength and elongation at break of base ma-
terial to the welded structure when heat input was 1.7 kJ/mm. Red font corres-
ponds to the highest value while green font corresponds to the lowest.
This tensile test has proven that when heat input is bigger and consequence of
that width of HAZ is consequently wider, the tensile properties of the welded
structure are weaker than the base material. In the tensile tests, the weakest
welded structure had the highest heat input. Rodriques et al. (2004a) came to
the same conclusion in their study when they looked at matched and under-
matched filler metal situations and determined that the strength of the joint is
strongly depend on the HAZ dimension. It is therefore of utmost importance to
use proper welding parameters when welding HSSs regardless of the filler ma-
terial.
TEST SPE-CIMEN
TESTED TENSILE
STRENGTH MPa
% BIGGER THAN FILLER
MATERIAL
TENSILE STRENGTH OF BASE MATERIAL (from material certificate) MPa
% LOWER THAN BASE MATERIAL
ELONGATION AT BREAK A₅ %
MEAN VALUE
A1 660 17.9 769 14.2 9.5 9.0 A2 647 15.5 15.9 8.5 B1 685 22.3
844 18.8 6.1 6.8
B2 691 23.4 18.1 7.5 C1 7.9 8.6 C2 671 19.8 821 18.3 9.4 D1 706 26.1
852 14.0 5.9 6.4 D2 716 27.9 16.0 6.9
E1 642 14.6 835
23.1 6.1 6.1 E2 639 14.1 23.5 6.1 F1 669 19.5
798 16.2 6.0
6.1 F2 679 21.3 14.9 6.3 G1 632 12.9
879 28.1 6.6
6.0 G2 631 12.7 28.2 5.3 H1 739 32.0
865 14.6 6.8 7.0 H2 718 28.2 17.0 7.1
MEAN VA-LUE 20.5 7.0

112
7.7. Transverse bend test
Overall, four bend tests were carried out to determine the occurrence of cracks
and unmelted fusion line among other issues. Two of these tests were carried
out on the root of the groove, while the other two were carried out on the top of
the groove. All bend tests were made according to standard SFS-EN ISO 5173.
The transverse bend tests will show faults in welded structure, such as
defective penetration or low mixture levels between base and filler material.
The transverse bend tests that were done on these HSSs with undermatched
filler material were much more demanding than normal transverse bend tests.
The discrepancy between the tests occurs because the filler material has a
lower yield strength than base material. In these tests, the first part to be bent
was the welded structure and the base material. In the end of these tests, the
weld yielded more than the base material and the bending angle was bigger in
the weld than in the structure, as seen in figs 45 and 46. If the welded structure
passes this bend test, the weld can then be considered of acceptable quality.
Figure 45. Example from transverse bending test face side.

113
Figure 46. Example from transverse bending test root side.
The results of the transverse bending tests are in table 32, where OK means
that the weld passed the bending test. Of all the transverse bending tests, steel
G got the worst results which can be explained through a number of factors.
First of all, a thickness of 12 mm, the heat flow from the fusion line was faster
than in other steels. During the solidification of the molten weld pool, the
porosity could increase, and these porous areas will be the first to crack during
bending tests. Additionally, dilution in fusion line could be too low for the same
reasons. In steel G, all the root passes failed in the transverse bending test.
This can potentially be explained by the fact that the cooling time of the root
pass without being preheated is shorter in 12 mm thick plates than in 8 mm
thick plates. If there are significant thickness discrepancies, it would be possible
to use a three dimensional equation, however, the differences between 8 and
12 mm thickness (d) in equation 16 is 2.25 times (d2 in the equation).
In addition to heat input, cooling time is another important component in the
welding process. Cooling time is dependent factor that depends on heat input,
but also plate thickness, workpiece geometry, material properties and more.
The cooling time can be calculated, using equation 9.
Equation 9 allows the cooling time to be calculated with allowance for thicker
plate thickness. During the course of this research, 8 mm and 12 mm thick
plates of steel displayed large differences in cooling time (fig. 46-1).
Additionally, the cooling time of the root pass of QT HSS G was short, 7 s. A

114
short cooling time can lead to brittle martensite microstructure, which also has
small ductile value. This is why the root pass of QT HSS G broke in the bending
test.
Figure 46-1. Cooling time t8/5 vs. plate thickness. Welding conditions are
presented in Table 12.

115
Table 32. Results of tranverse bending tests. OK means acceptable test.
MATERIAL WELD
HEAT IN-PUT 1.0 kJ/mm
HEAT IN-PUT 1.3 kJ/mm
HEAT IN-PUT 1.7 kJ/mm
A
root 1 OK OK OK root 2 OK OK surface 1 OK OK OK surface 2 OK OK
B
root 1 OK OK OK root 2 OK OK OK surface 1 OK OK OK surface 2 OK OK OK
C
root 1 OK OK OK root 2 OK OK OK surface 1 OK OK OK surface 2 OK OK OK
D
root 1 OK OK Broken 90° root 2 OK OK OK surface 1 OK OK OK surface 2 OK - OK
E
root 1 OK OK OK root 2 OK OK OK surface 1 OK OK OK surface 2 - OK OK
F
root 1 OK OK OK root 2 OK OK OK surface 1 OK OK OK surface 2 OK OK OK
G
root 1 Broken 51° Broken 39° Broken 18° root 2 Broken 57° Broken 28° Broken 18° surface 1 Broken 26° OK OK surface 2 OK OK OK
H
root 1 broken 75° OK OK root 2 OK OK OK surface 1 OK OK OK surface 2 OK OK OK
7.8. Impact test
Two sets of impact tests were conducted, each set including three test pieces.
Standard SFS-EN ISO 148-1 was used and each piece was 5 x 10 x 55 mm
and tested at a temperature -40 °C. A 2 mm V notch was cut into each test
piece and its correct placement was ensured by etching the notch before
machining. The place of Charpy-V impact test is in fig. 47, which figure clarifies
the structure being tested. Dependent on welding heat input, the shape of weld

116
will curve more horizontally and it leads to different HAZs under the V-groove.
As shown in fig. 47, the test area of Charpy-V test can include some weld metal,
CGHAZ, FGHAZ, ICHAZ, SCHAZ and some base metal. Between first and
second HAZ is the ICCGHAZ which earlier research (Liu at al. 2007, Hamada
2003, Li et al. 2001, Lambert et al. 2000, Matsuda et al. 1995, Lee et al. 1993)
has shown to be the most fracture area in the HAZ. The brittle area of
ICCGHAZ is small, but in some Charpy-V tests it can be under the test notch.
8 m
m
HAZ zone
Fusion line
Second pass
First pass
2
Milled Charpy-Vgroove
5m
m
Figure 47. Place of Charpy-V groove in test pieces.
In earlier studies (Wang et al. 2003, Juan et al. 2003) it was noticed that lower
toughness values occur because of a wide HAZ. The lowest toughness values
were in CGHAZ and if the HAZ is wide all zones will be wider and then the
Charpy-V test place is more in CGHAZ and fusion line. In this present research,
the same results have been observed. The overall numbers of tests were small
because of the testing standards, and some exceptional results are the
consequence of statistical dispersion.
Overall, the results of the impact tests were ambiguous. The test results from
weld area, as seen in fig. 48 and table 33 were acceptable and these results
show that undermatching weld metal has good impact ductility. This might be
because the impact value was limited to 18 J for test bar 5 x 10 x 55 mm piece.
As seen in table 33 steels A, E, F and G have a few results under 18 J, however

117
the vast majority of them are close to 18 J (16 J - 17 J) and they can be
considered acceptable.
Fig. 49 and table 34 display HAZ impact results. In earlier study by Shi et al.
(1998) it was concluded that the lower the weld strength mismatching, the
higher the fracture toughness of the HAZ. In this study, the mismatching value
was very low at 0.72. There was not a great deal of consistency in HAZ impact
test results, as some steels have good values for all three heat inputs while
other steels had very low values. In fig. 49 the impact test values show great
divergence between different HSSs. Additionally, the test values in fig. 49 are
very low. Cells highlighted in yellow in table 34 indicate that the values are
under standard recommendations. For example, steel H had a value 4 J twice
when heat input was 1.7 kJ/mm and had poor values ranging from 8 - 13 J at
1.0 and 1.3 kJ/mm as well. Steels A, B, D and F also exhibited low impact test
values, however there is no consistency in the results according to heat input.
TMCP steels A and C have low C content. C content levels determine
toughness properties in general and high C content is detrimental to toughness
as Hatting and Pienaar (1998) have concluded. In this study, TMCP steels A
and C have low C contents, whereas the C content in QT steels was
considerable bigger. Accordingly, TMCP steels have good toughness values in
the HAZ than most of the QT steels.
As Tian (1998) and Hatting and Pienaar (1998) have researched, heat input has
a direct effect on impact toughness in Nb added HSSs. When using a low heat
input in welding, this will increase impact toughness, while if a high heat input is
used in welding it will decrease the impact toughness in the HAZ. Six of eight
tested steels had Nb as an alloying element in this study and the greater heat
input led to the lower impact toughness.
Ti precipitations have an impact to grain growth and they inhibit it very well.
However, if the heat input is too high on welding, then the grains grow too much
which leads to the coarse structure in the HAZ and consequently destroys the
welded structure. Liu and Liao (1998) researched Ti nitrides and found that

118
those nitrides inhibit grain growth especially in high temperatures. However,
when the temperature is too high for an extended period of time, the Ti nitrides
also dissolve in the structure and their influence diminishes. This specific
influence is seen in this study when using heat inputs 1.3 and 1.7 kJ/mm, where
impact ductility values have decreased and grains have grown. Only steels G
and H do not have Ti as an alloy element.
As Rak et al. (1997) has concluded and is also clearly displayed in this
research, the size and distribution of the Ti precipitates are important when
studying the grain growth control and comparing it to the role of the chemical
composition of the precipitates. It is important to keep the heat input as low as
possible, because Ti precipitate dissolves in to base material at higher
temperatures. When the heat input is kept low, there is no time for precipitates
to dissolve and the properties of the welded structure remain satisfactory. In this
research, the lowest heat input 1.0 kJ/mm gives the best results of impact
ductility and strength test on the chemical composition and microstructure of
HSS.
In the undermatched weld structure, local mismatch can be the reason for
lowered toughness. Dilution and alloying are not evenly distributed in
undermatched welds and this leads to local mismatch. This study similarly
clarifies the differences between impact test values as was in the Rak et al.
(1995) study.
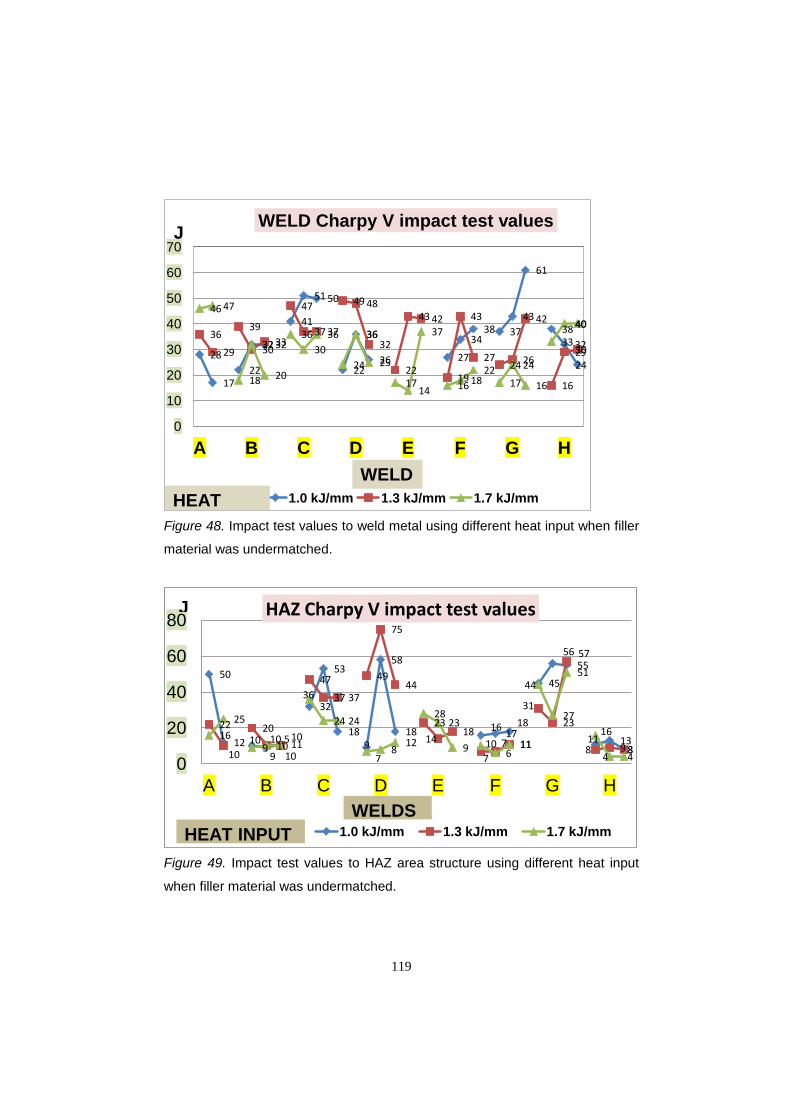
119
Figure 48. Impact test values to weld metal using different heat input when filler
material was undermatched.
Figure 49. Impact test values to HAZ area structure using different heat input
when filler material was undermatched.
28
17 22
32 32
41
51 50
22
36
26 27
34 38 37
43
61
38 32
24
36
29
39
30 33
47
37 37
49 48
32
22
43 42
19
43
27 24 26
42
16
29 30
46 47
18
32
20
36 30
36
24
36
25
17 14
37
16 18 22
17
24
16
33
40 40
0
10
20
30
40
50
60
70
A B C D E F G H
WELD Charpy V impact test values
1.0 kJ/mm 1.3 kJ/mm 1.7 kJ/mm
J
WELDHEAT
50
12 10 9
11
32
53
18 9
58
18 16 17 18
45
56 55
11 13 8
22
10
20 10,5 10
47
37 37
49
75
44
23 14
18
7 7 11
31 23
57
8 9 8 16
25
9 10 10
36
24 24
7 8
12
28 23
9 10 6
11
44
27
51
16
4 4 0
20
40
60
80
A B C D E F G H
HAZ Charpy V impact test values
1.0 kJ/mm 1.3 kJ/mm 1.7 kJ/mm HEAT INPUT
J
WELDS

120
In addition to previous research (Wang et al. 2003), this study confirms the
influence of heat input to impact toughness in HSS welding. As the heat input
grows, the deterioration of impact toughness in the HAZ of HSSs is quite clear.
In this study, steels F and H had very low HAZ area impact values.
To further bolster confidence in these impact test results, and uncover different
implications, it was additionally determined to conduct CTOD tests.
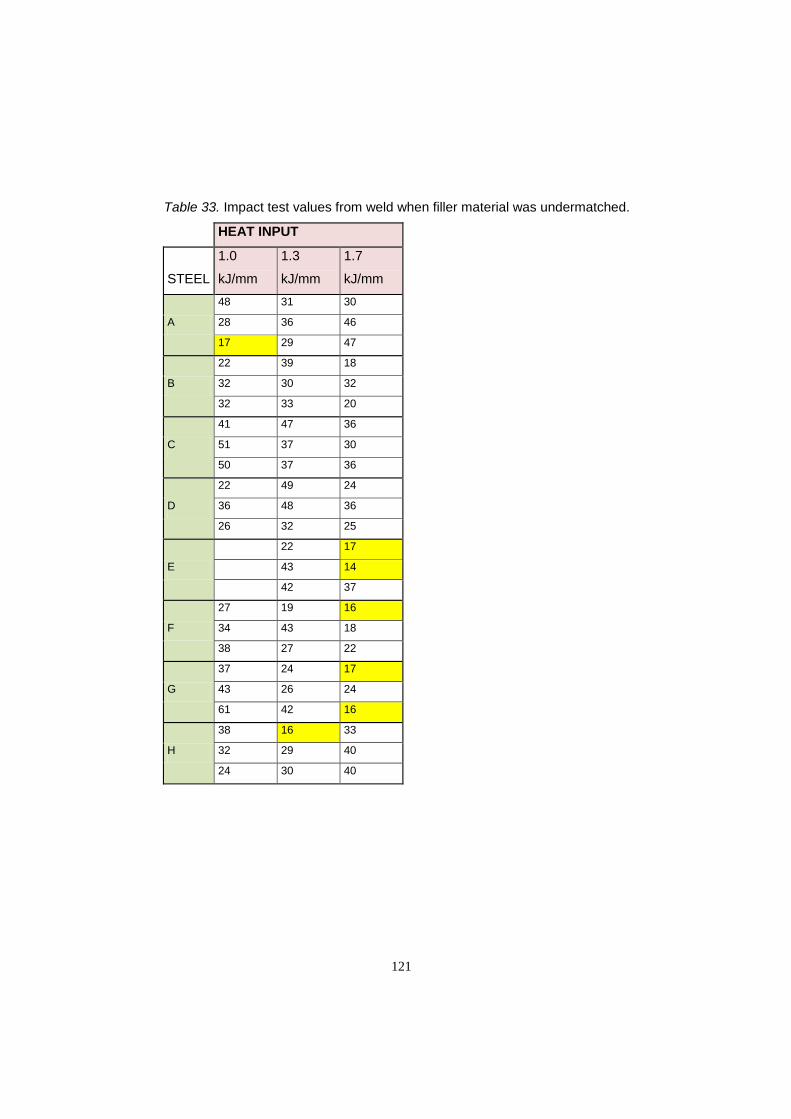
121
Table 33. Impact test values from weld when filler material was undermatched.
HEAT INPUT
STEEL
1.0
kJ/mm
1.3
kJ/mm
1.7
kJ/mm
A
48 31 30
28 36 46
17 29 47
B
22 39 18
32 30 32
32 33 20
C
41 47 36
51 37 30
50 37 36
D
22 49 24
36 48 36
26 32 25
E
22 17
43 14
42 37
F
27 19 16
34 43 18
38 27 22
G
37 24 17
43 26 24
61 42 16
H
38 16 33
32 29 40
24 30 40

122
Table 34. Impact test values from HAZ when filler material was undermatched.
HEAT INPUT
STEEL
1.0
kJ/mm
1.3
kJ/mm
1.7
kJ/mm
A
41 11 22
50 22 16
12 10 25
B
10 20 9
9 10.5 10
11 10 10
C
32 47 36
53 37 24
18 37 24
D
9 49 7
58 75 8
18 44 12
E
23 28
14 23
18 9
F
16 7 10
17 7 6
18 11 11
G
46 31 44
55 23 27
56 57 51
H
11 8 16
13 9 4
8 8 4

123
7.9. Hardness test
The welds were also subjected to Vickers hardness tests with SFS-EN ISO
6507-1 standards. The tests were conducted on the weld and HAZ areas at 0.5
mm intervals. Fig. 50 shows a hardness measurement sample, while figs 51, 52
and 53 show the hardness test results by varying heat inputs.
In all of the tested pieces, the hardness values in the weld metal were the
same, but when test moved though HAZ from fusion line to base material,
hardness values were higher than in the weld. Test values differed depending
on the base metal test material. In QT steels, the HAZ hardness curve is at its
highest point in the CGHAZ, (just beyond the fusion line and the base material)
and sinks down to its lowest point in the ICHAZ. As Loureiro (2002) has
explained, a loss of hardness occurs in the ICHAZ because of carbide
precipitation. Beyond the ICHAZ, the hardness levels rose until they reached
the hardness level of the base material. The highest hardness values observed
were the same or slightly higher than the hardness of the base material, a
phenomenon that possibly be explained as an effect of quenching in the HAZ.
Steels A and C which were made using TMCP method behaved quite different
than the QT HSSs. The TMCP steels had a very straight hardness curve in the
weld and the HAZ, the hardness curve gradually grew to the hardness of base
material. These steels had C content 0.05 % while QT steels had C content
close to 0.15 %. Additionally, the two types of steel have differences in their
base material microstructure with TMCP steel having a ferrite-bainite mix and
QT steel having martensite and bainite.
Prior to welding, all steels had near same base metal hardness levels, 280-290
HV5. B was added as an alloying element to steels B, D, E and F, because B
has been known to increase hardness in low carbon steels. Moon et al. (2008)
researched that the hardness of the CGHAZ increases when B is added as
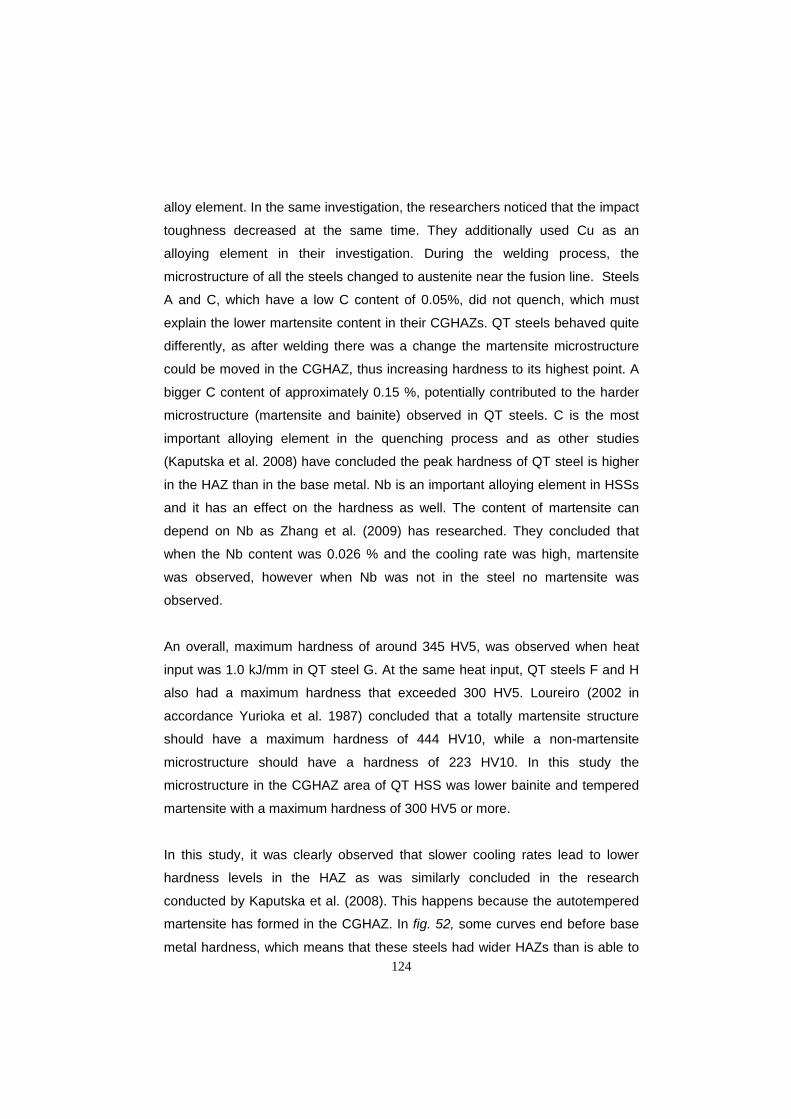
124
alloy element. In the same investigation, the researchers noticed that the impact
toughness decreased at the same time. They additionally used Cu as an
alloying element in their investigation. During the welding process, the
microstructure of all the steels changed to austenite near the fusion line. Steels
A and C, which have a low C content of 0.05%, did not quench, which must
explain the lower martensite content in their CGHAZs. QT steels behaved quite
differently, as after welding there was a change the martensite microstructure
could be moved in the CGHAZ, thus increasing hardness to its highest point. A
bigger C content of approximately 0.15 %, potentially contributed to the harder
microstructure (martensite and bainite) observed in QT steels. C is the most
important alloying element in the quenching process and as other studies
(Kaputska et al. 2008) have concluded the peak hardness of QT steel is higher
in the HAZ than in the base metal. Nb is an important alloying element in HSSs
and it has an effect on the hardness as well. The content of martensite can
depend on Nb as Zhang et al. (2009) has researched. They concluded that
when the Nb content was 0.026 % and the cooling rate was high, martensite
was observed, however when Nb was not in the steel no martensite was
observed.
An overall, maximum hardness of around 345 HV5, was observed when heat
input was 1.0 kJ/mm in QT steel G. At the same heat input, QT steels F and H
also had a maximum hardness that exceeded 300 HV5. Loureiro (2002 in
accordance Yurioka et al. 1987) concluded that a totally martensite structure
should have a maximum hardness of 444 HV10, while a non-martensite
microstructure should have a hardness of 223 HV10. In this study the
microstructure in the CGHAZ area of QT HSS was lower bainite and tempered
martensite with a maximum hardness of 300 HV5 or more.
In this study, it was clearly observed that slower cooling rates lead to lower
hardness levels in the HAZ as was similarly concluded in the research
conducted by Kaputska et al. (2008). This happens because the autotempered
martensite has formed in the CGHAZ. In fig. 52, some curves end before base
metal hardness, which means that these steels had wider HAZs than is able to

125
be read in the table. Our study proves that when welding HSSs, lower cooling
rates tend to produce a wider HAZ, a phenomenon that has also been studied
by Kaputska et al. (2008).
0.5 mm
FUSION LINEWELD
METALHAZ BASE
METAL2
mm
Figure 50. Sample from hardness measurement.
Figure 51. Hardness of the welded structure when the heat input was 1.0
kJ/mm.
150 170 190 210 230 250 270 290 310 330 350
WE
LD 1
W
ELD
2
WE
LD 3
W
ELD
4
FUS
ION
LIN
E
HA
Z 1
HA
Z 2
HA
Z 3
HA
Z 4
HA
Z 5
HA
Z 6
HA
Z 7
BA
SE
MAT
ER
IAL
1 B
AS
E M
ATE
RIA
L 2
BA
SE
MAT
ER
IAL
3 B
AS
E M
ATE
RIA
L 4
BA
SE
MAT
ER
IAL
5 B
AS
E M
ATE
RIA
L 6
HAR
DN
ESS
HV5
HEAT INPUT 1.0 kJ/mm
A B C D E F G H STEELS

126
Figure 52. Hardness of the welded structure when the heat input was 1.3
kJ/mm.
150 170 190 210 230 250 270 290 310 330 350
WE
LD 1
W
ELD
2
WE
LD 3
W
ELD
4
FUS
ION
LIN
E
HA
Z 1
HA
Z 2
HA
Z 3
HA
Z 4
HA
Z 5
HA
Z 6
HA
Z 7
BA
SE
MAT
ER
IAL
1 B
AS
E M
ATE
RIA
L 2
BA
SE
MAT
ER
IAL
3 B
AS
E M
ATE
RIA
L 4
BA
SE
MAT
ER
IAL
5 B
AS
E M
ATE
RIA
L 6
HAR
DN
ESS
HV5
HEAT INPUT 1.3 kJ/mm
A B C D E F G H STEELS

127
Figure 53. Hardness of the welded structure when the heat input was 1.7
kJ/mm.
Fig. 54 shows the hardness results for the TMCP steels. This table shows that
the hardness of the HAZ area does not grow until it reached the base material.
Heat input also affects the width of the HAZ area, with greater heat inputs
leading to wider HAZ areas. Of all the TMCP steels, the only one not displaying
hardness growth at the base material was steel A when the heat input was 1.7
kJ/mm. Under these conditions, steel A is likely to have a wider HAZ than the
other steels and hardness measurements from the base material of steel A
were not captured within the scope of this test.
Fig. 55 shows the hardness results of steel G which was 12 mm thick. It was
remarkable that the width of the HAZ was the same regardless of heat input
values. This could be attributed to the thickness of steel G which was greater
150 170 190 210 230 250 270 290 310 330 350
WE
LD 1
W
ELD
2
WE
LD 3
W
ELD
4
WE
LD 5
FU
SIO
N L
INE
H
AZ
1 H
AZ
2 H
AZ
3 H
AZ
4 H
AZ
5 H
AZ
6 H
AZ
7 B
AS
E M
ATE
RIA
L 1
BA
SE
MAT
ER
IAL
2 B
AS
E M
ATE
RIA
L 3
BA
SE
MAT
ER
IAL
4 B
AS
E M
ATE
RIA
L 5
BA
SE
MAT
ER
IAL
6 B
AS
E M
ATE
RIA
L 7
BA
SE
MAT
ER
IAL
8 B
AS
E M
ATE
RIA
L 9
BA
SE
MAT
ER
IAL
10
BA
SE
MAT
ER
IAL
11
HAR
DN
ESS
HV5
HEAT INPUT 1.7 kJ/mm
A B C D E F G H STEELS

128
than all of the other steels. Another reason for this behaviour could be within the
microstructure of steel G, which had neither Nb nor Ti. These microelements
have a big influence upon the microstructure, where Ti inhibits grain growth in
the HAZ, while Nb only has an effect upon the HAZ with the presence of other
alloying elements. Overall, it is not very clear why the HAZ width is the same
regardless of heat inputs in steel G. Another option to consider is whether the
equations for two or three dimensional conduction of heat are still valid with
HSSs.
Figure 54. Hardness of the welded structure of TMCP steels A and C.
150 200 250 300 350
Har
dnes
s H
V5 TMCP steels A and C
Steel A 1.0 kJ/mm Steel C 1.0 kJ/mm Steel A 1.3 kJ/mm Steel C 1.3 kJ/mm Steel A 1.7 kJ/mm Steel C 1.7 kJ/mm

129
Figure 55. Hardness of the welded structure of QT steel G.
In HSSs 780 and 980 DP, it was noticed that a greater reduction in base metal
hardness occurs in the HAZ of 780 DP steel. This may be due the higher
dislocation density present in the ferrite phase of this material producing a
larger driving force for recovery (Kaputska et al. 2008), which is important to
notice when planning steels structures using HSSs.
7.9. CTOD tests
Even after the impact tests the fracture strength of welded structure was still
unambiguous. As some results were not within the limit of the standards, CTOD
tests were deemed necessary. These CTOD test were done according to
standard ASTM E1290-2. The first CTOD test was conducted on the welded
structure while the other test first used Gleeble simulation (as reported in
experimental investigations 6.6.) before continuing with CTOD testing.
150 170 190 210 230 250 270 290 310 330 350
WE
LD 1
W
ELD
2
WE
LD 3
W
ELD
4
WE
LD 5
FU
SIO
N L
INE
H
AZ
1 H
AZ
2 H
AZ
3 H
AZ
4 H
AZ
5 H
AZ
6 H
AZ
7 H
AZ
8 B
AS
E M
ATE
RIA
L 1
BA
SE
MAT
ER
IAL
2 B
AS
E M
ATE
RIA
L 3
BA
SE
MAT
ER
IAL
4
Har
dnes
s H
V5 STEEL G
1.0 kJ/mm 1.3 kJ/mm 1.7 kJ/mm

130
CTOD tests are trustworthy and give accurate measurements of material
toughness. It is very important to clarify toughness in a welded structure,
especially in the HAZ which is a critical area in relation to material toughness.
The CGHAZ of the HAZ has been reported (Shi & Han 2007, Lee & al. 1993,
Güran & al. 2007) to be the most brittle area where toughness is at its lowest.
Depending on heat input, the CGHAZ can have different widths. Finding the
CGHAZ during testing has proven to be quite difficult. Simulation has been
developed to clarify the characteristics of different areas in the HAZ, and a
Gleeble simulation was used in this research to clarify ductility in the CGHAZ.
If the weld is welded with many passes, then the ICCGHAZ has been observed
(Liu at al. 2007, Hamada 2003, Li et al. 2001, Lambert et al. 2000, Matsuda et
al. 1995, Davis & King 1993, Lee et al. 1993) to be the worst impact ductility
zone between two CGHAZs. This LBZ has a very brittle structure where the M-
A phase will destroy the impact ductility. This ICCGHAZ is narrow and
discontinuous, and only 0.5 mm width (Davis & King 1993) depending on heat
input. CTOD tests are better suited to find this kind of brittle areas than Charpy-
V tests, but in this study test place was unfortunately too far from the fusion line
and ICCGHAZ LBZs were not under investigation. In Gleeble made test bars
only one heat input was used.
The very brittle microstructure proves that the CGHAZ is a weak area within the
HAZ. In this situation, it is assumed that the CGHAZ is the weakest zone in
welded structure. In real structures, there are many zones in the HAZ and the
width of the CGHAZ is usually narrow. The total width of all zones in the HAZ
depends on heat input. When the heat input is large, those zones are wider and
the tensile strength and toughness properties of the structure go down. The
microstructure of the CGHAZ can be composed of M-A constituents and this
making the structure very brittle. A good example of this brittle structure is seen
in fig. 57 which was taken of Gleeble simulated QT test bar. The main
microstructure is martensite and the proportion of bainite is less than half.
Additionally, the coarseness of bainite is a metallurgical factor affecting the
impact properties as Lampert et al. (2000) have also studied.

131
CTOD test results from the welded structure and base material are presented in
table 35 and in fig. 58. Overall, the base material has the lowest CTOD value.
Only steel H exhibited different behaviour, as the base material of steel H had
the highest CTOD value and only decrease by its higher heat inputs. This result
was one of the hypotheses of this study. As seen in fig. 58, the highest results
from this CTOD test were 0.2 or more. Five of the eight tested HSSs reached
this value when the heat input was 1.7 kJ/mm. Steel A also reached this value
with a heat input of 1.0 kJ/mm, but the value was too high as the result of a
measurement mistake which is not clear. There were big differences between
the base material CTOD test values. The lowest values, near 0.05, were seen
in steels A, C, D and G, whereas the highest value, 0.2, was seen in steels B, F
and H. With the heat input at 1.0 and 1.3, the measured values were not so
unambiguous because the measured HSS, like steel B, had a low value when
the heat input was 1.0 (0.15) and a high value (0.3) when the heat input was 1.3
and 1.7kJ/mm. Steel F had good values with all the welded structures.
It is very difficult to find the weakest zone of the HAZ. It was expected that the
CGHAZ would to be the weakest area, however, it is very difficult to find the
CGHAZ from within the HAZ. The place of CTOD test was 2 mm from fusion
line, the same measurement as was used in Charpy-V test. As shown in table
35, near all test results were higher than base materials results. This most likely
means that these measurements were taken from a HAZ area other than the
CGHAZ. In fig. 56 it can clearly be seen that the place of the test was not in the
CGHAZ. Depending on heat input, this zone of the HAZ was so far from the
fusion line that the test place was most likely in the ICHAZ or SCHAZ. When
conducting the CTOD test on a welded structure made from HSS, the initial
crack must not be more than 0.5 mm from fusion line. If this criterion is met,
then the initial crack will be in the CGHAZ.
Table 36 shows the results from Gleeble tested pieces. These test pieces were
made to clarify the features of the CGHAZ microstructure from the tested HSSs.
These CTOD test results are very low compared to CTOD test results from

132
welded structure, which means that all the CTOD test results from simulated
structures were very brittle, as seen in fig. 59. In fig. 59, it is clearly explained
that all of the results of this CTOD test were very low and within close value
proximity to one another. Only steel E had one value over 0.05, however, this
value was very low when compared to the base material. Fig. 58 additionally
explains that the base material CTOD test values in all the tested HSSs were
higher than in the Gleeble simulated test bars.
2 mm
End of sawedcrack starternotch
Fusion line
Crack extension
using cyclicforce
Breakageafterbending
Figure 56. Broken QT steel CTOD test piece where the place of initial crack is
well seen.
When welding using undermatched filler material as was used in this study, it is
clear that the weakest zone is in the weld. The rate of undermatching has a
significant role in fracture toughness. When the rate of undermatching is low,
the HAZ can have lower toughness than the weld or base material. This can
encourage the toughness of the welded structure to decrease. Pisarski and
Dolby (2003) concluded that the worst case fracture toughness of softened
HAZs occurred when the HAZ undermatched in strength both the weld deposit

133
and the parent plate. In this study, the highest level of undermatching was in the
weld, which makes the fracture toughness acceptable.
100 µm
Figure 57. The CGHAZ of Gleeble simulated and CTOD tested QT steel. Aspect
ratio is 1:500.
Table 35. CTOD test values from the welded structure.
STEEL
BASE MATERIAL
HEAT INPUT 1.0
kJ/mm
HEAT INPUT 1.3
kJ/mm
HEAT INPUT 1.7
kJ/mm VALUE
mm CATEGORY
VALUE
mm CATEGORY
VALUE
mm CATEGORY
VALUE
mm CATEGORY
A 0.05 c 0.42 m 0.12 m 0.12 u
B 0.21 m 0.14 m 0.30 m 0.31 m
C 0.06 u 0.07 u 0.12 m 0.27 m
D 0.07 u 0.14 u 0.04 c 0.27 m
E 0.10 m 0.11 u 0.14 m 0.21 m
F 0.18 m 0.23 m 0.28 m 0.28 m
G 0.08 u 0.10 u 0.12 m 0.11 m
H 0.21 m 0.17 u 0.15 u 0.13 u
c= critical u= unstable m=high tensile

134
Table 36. CTOD values (mm) of Gleeble simulated CGHAZ.
STEEL
Base
material
Heat
input
1.0
kJ/mm
Heat
input
1.3
kJ/mm
Heat
input
1.7
kJ/mm
A 0.05 0.022 0.015 0.027
B 0.21 0.024 0.025 0.018
C 0.06 0.012 0.011 0.008
D 0.07 0.013 0.016 0.008
E 0.10 0.031 0.036 0.065
F 0.18 0.021 0.010 0.016
G 0.08 0.011 0.014 0.022
H 0.21 0.021 0.017 0.010
Figure 58. Compared CTOD values (mm) of welded HAZ structure.
0
0,05
0,1
0,15
0,2
0,25
0,3
0,35
0,4
0,45
A B C D E F G H
BASE MATERIAL
HEAT INPUT 1.0 kJ/mm
HEAT INPUT 1.3 kJ/mm
HEAT INPUT 1.7 kJ/mm
CTOD values of welded HAZ structure
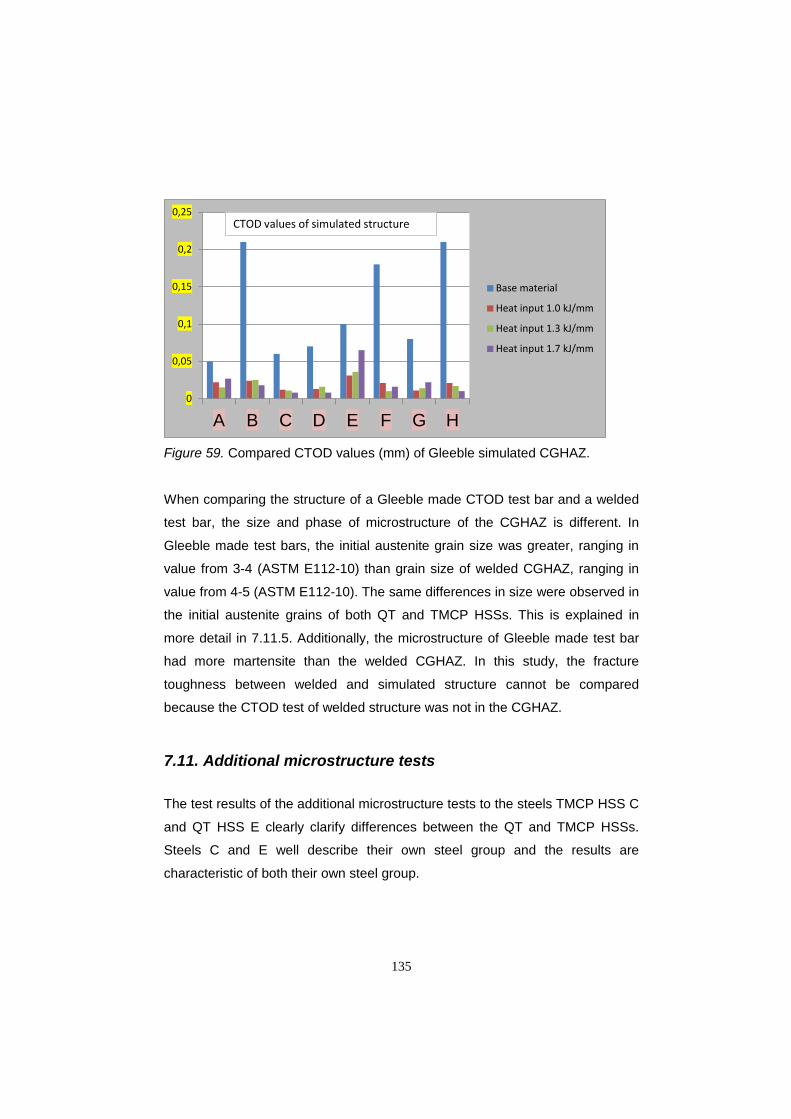
135
Figure 59. Compared CTOD values (mm) of Gleeble simulated CGHAZ.
When comparing the structure of a Gleeble made CTOD test bar and a welded
test bar, the size and phase of microstructure of the CGHAZ is different. In
Gleeble made test bars, the initial austenite grain size was greater, ranging in
value from 3-4 (ASTM E112-10) than grain size of welded CGHAZ, ranging in
value from 4-5 (ASTM E112-10). The same differences in size were observed in
the initial austenite grains of both QT and TMCP HSSs. This is explained in
more detail in 7.11.5. Additionally, the microstructure of Gleeble made test bar
had more martensite than the welded CGHAZ. In this study, the fracture
toughness between welded and simulated structure cannot be compared
because the CTOD test of welded structure was not in the CGHAZ.
7.11. Additional microstructure tests
The test results of the additional microstructure tests to the steels TMCP HSS C
and QT HSS E clearly clarify differences between the QT and TMCP HSSs.
Steels C and E well describe their own steel group and the results are
characteristic of both their own steel group.
0
0,05
0,1
0,15
0,2
0,25
A B C D E F G H
Base material
Heat input 1.0 kJ/mm
Heat input 1.3 kJ/mm
Heat input 1.7 kJ/mm
CTOD values of simulated structure

136
7.11.1. Microstructure of the base material
As was studied earlier in this research, the microstructure of the base material
of the QT and TMCP HSSs differ and also the HAZ microstructure changes are
different. The types of differenced have been tested in additional microstructure
tests. The microstructure of the QT HSS E base metal, fig. 60, consists of tem-
pered martensite and bainite. The size of the initial austenite grain corresponds
to 12 number according to ASTM E112-10, 5.6 µm. Microstructure of base
metal is homogeneous, and through thickness inequigranularity was not ob-
served. Limited carbon content up to 0.15 % in base metal allows obtaining lath
martensite and avoiding formation of twinned martensite in order to increase
toughness in combination with high strength.
The microstructure of the steel C, TMCP HSS, base metal, fig. 61, consists of
bainite (70%) and ferrite (30%). The effective grain size of the base metal cor-
responds to 14 number, ASTM E112-10, 3.0 µm. The optimum microstructure
with a desired balance of mechanical properties are achieved through a suitably
designed thermomechanical process. This includes heavy deformation of the
austenite, carried out in the non-recrystallisation temperature region, which
brings about significant refinement of the final transformation microstructure.
Figure 60. QT HSS E microstructure: tempered martensite and bainite.
137
Figure 61. TMCP HSS C microstructure: bainite and ferrite.
Both QT and TMCP HSS steels have exceptional working properties and al-
though they have different microstructures, both HSSs are good to cold form,
cut or machine. However, the welding these steels makes their properties quite
different. Both HSS have bainite in their microstructure, but the tempered mart-
ensite microstructure of QT HSS forms differently than ferrite in TMCP HSS.
Also TMCP HSS has more bainite (70%) than QT HSS, and additionally rolling
TMCP HSS has worked its faces more parallel than the faces of QT HSS.
7.11.2. Microstructure of weld metal
The weld metal does not differ between TMCP and QT HSS steel. Initial colum-
nar grains formed by epitaxial growth are detected by the presence of grains of
polygonal ferrite and Widmanstatten ferrite along the former grain boundaries.
However, the main constituent is an acicular ferrite, forming a "wicker basket".
Both base metal weld microstructures are illustrated in fig. 62.

138
a) b)
Figure 62. Microstructure of TMCP (a) and QT HSS (b) weld. Wf (Windmanstat-
ten ferrite), pf (polygonal ferrite) and af (acicular ferrite) are observed.
7.11.3. Microstructure of HAZ of QT and TMCP HSS
Microstructure of the metal surrounding weld interface is influenced by heat
while the weld joint is being formed. In the studied welded joint of QT HSS E
and TMCP HSS C CGHAZ, FGHAZ, ICHAZ and SCHAZ are clearly recognized.
The microstructure changes continuously depending upon the maximum tem-
perature attained in each region of the HAZ.
Close to the weld interface the metal is exposed to the temperatures between
liquidus and solidus lines described as the fusion line (FL). This zone is in par-
tially melted state. Microstructure of FL of QT HSS E has mixed microstructure
which contains bainite and polygonal ferrite, fig. 63.

139
Figure 63. Optical microstructure of the fusion line of QT HSS E.
QT HSS E CGHAZ borders the FL and refers to the HAZ subjected to peak
temperatures above the grain coarsening temperature, the latter is 1300 oC for
steels which have been Ti-treated to elevate their grain coarsening temperature
(Eastling 1992). As the peak temperature exceeds the critical point, AC3,
complete retransformation to austenite occurs, fig. 64. The extent of following
grain coarsening depends on the peak temperature, the time above the grain
coarsening temperature, the chemical composition of the steel and presence of
undissolved nitride and carbonitride particles. When heated above 1300 oC,
most of these particles, except the most stable such as TiN, dissolve (Mitchell et
al. 1995). This results in reduction of pinning effect of the particles and following
grain growth. At the same time long exposure of the HAZ to high temperature
promotes homogenizing of austenite by alloying elements. So grain coarsening
and homogenizing of austenite make it more stable. During cooling the grain
coarsened austenite transforms to non-equilibrium transformation products
depending on steel chemistry and cooling rate.

140
Figure 64. Scheme of CGHAZ formation.
In both TMCP and QT HSS steel coarse grain microstructure of initial austenite
grains is clearly revealed in CGHAZ. Austenite grains grew from 5.6 µm, num-
ber 12 (base metal) up to 75 µm, number 4-5 (according to ASTM E112-10)
during welding heating. In QT HSS E during subsequent cooling coarse grains
were divided into packets of a lath bainite and low-carbon martensite, which
slightly refines the constituents of the structure and has a positive effect on the
resistance to crack propagation (Lamberte-Perlade et al. 2004). In TMCP HSS
C during subsequent cooling coarse grains were divided into packets of a lath
and granular bainite. Both microstructures are seeing in fig. 65 a and b.
a) b)
Figure 65. Optical microstructure of CGHAZ of QT HSS E (a) and TMCP HSS C
(b).
Identification of structural constituents was derived from measuring their
microhardness. Microhardness indentation was conducted by Vickers scale and

141
0.025 kgf loading. The hardness of the lath martensite in CGHAZ exceeds 300
HV and reaches 340 HV, fig. 66. Packets of bainite have hardness less than
300 HV. Tempered martensite of the base metal is characterized by a hardness
of 270-280 HV.
In the present investigation, martensite and bainite are distinguished by quite
different etching susceptibilities as shown by optical micrographs, fig. 66. Since
the bainitic transformation occurs at a higher temperature compared to the
martensitic transformation, carbon can diffuse to a greater extent either to the
remaining austenite islands or to the boundary between laths (Thewlis 2004).
When this structure is etched, the boundaries of the retained austenite islands
or its decomposition products etch deeply, giving the overall appearance of a
plate shaped ferritic matrix with a superimposed dispersion of dark contrasting
particles. The martensitic transformation is characterized by clusters of very fine
ferritic laths which form at lower temperatures. Since the carbon distribution in
the martensitic structure is more uniform, it etches more evenly.
Figure 66. Microhardness measurement in CGHAZ of QT HSS Е.
The microstructure of the CGHAZ of TMCP HSS C formed during weld thermal
cycle consists of the products of bainite transformation of austenite, fig. 67.
These microstructures are classified as bainite which may take many
morphologies. Bainite-ferrite is one example of a microstructure which consists
of a carbide-free ferrite matrix with well-defined islands of retained austenite or
martinsite-austenite (M-A) constituent. The microstructure of granular ferrite

142
consists of dispersed retained austenite or M-A constituent in a featureless
matrix which may retain the prior austenite grain boundary structure (Krauss G
& Thompson 1995).
Most prior austenite grain boundaries are clearly visible in CGHAZ of TMCP
HSS C, allowing the mean austenite grain size to be measured. The mean
austenite grain size at this size is 89.0 µm, 4 number (according to ASTM E112-
10). Within prior austenite grain several crystallographic packets with high
misorientation angles between them, which slightly refines effective grain size,
can be identified.
Figure 67. Optical microstructure of CGHAZ of TMCP HSS C.
As determined in CTOD and Charpy-V tests, a coarse microstructure decreases
impact ductility. Charpy-V values of CGHAZ TMCP HSSs were good but some
QT HSS steels had low impact ductility values. CTOD test values of Gleeble
made CGHAZ test bars were very low. Impact ductility of bainite microstructure
is higher than martensite microstructure.
FGHAZ refers to HAZ regions which have been subjected to peak temperatures
between the austenite grain coarsening temperature and the upper critical point
AC3, typically between about 1300 and 910 °C (Eastling 1992). Both CGHAZ
and FGHAZ are the zones which have become fully austenitic due to weld
thermal cycle. The microstructures of these zones continuously change

143
according to the former austenite grain size. Consequently, it is difficult to
precisely indicate the boundary between CGHAZ and FGHAZ.
The reduction in peak temperatures in this zone implies that, following the α→γ
transformation during heating, the austenite does not have time to develop
properly, and the grain size remains small. In addition, nitrides and carbides
may not be fully dissolved, fig. 68.
During α→γ transformation γ grains nucleate heterogeneously at the bounda-
ries prior γ grain and grow along them. Also the nucleation of γ grains occurs
due to the dissolution of cementite, fig. 68. During γ→α transformation, the large
grain boundary area tends to promote nucleation of fine ferrite grains.
Figure 68. Scheme of FGHAZ formation.
Along the HAZ of HSS QT steel, FGHAZ has the most fine grain structure with
the mean grain size of 4.0 µm, 13 number (according to ASTM E112-10), fig.
69. There are more equilibrium transformation products, such as polygonal fer-
rite, and islands of granular bainite in this zone. Compared with tempered mar-
tensite of BM, microstructure constituents of FGHAZ have lower hardness.
Hardness of ferrite equals 210 HV, granular bainite 230 HV, fig. 70.

144
Figure 69. Optical microstructure of FGHAZ of QT HSS E.
Figure 70. Microhardness measurement in FGHAZ of QT HSS E.
As a result of rapid heating and short exposure to high temperatures, the
homogenization of austenite is not completed and some islands of retained
austenite are enriched by carbon, that could promote formation of martensite or
transformation to perlite in these islands.
The most fine grain and uniform structure within the HAZ of TMCP HSS C is
observed in FGHAZ, fig. 71. The microstructure contains mostly polygonal fer-
rite with a hardness of 220 HV and dispersed islands of granular bainite with a
hardness of 240 HV.

145
Figure 71. Optical microstructure of FGHAZ of TMCP HSS C.
ICHAZ refers to HAZ regions which have been subjected to peak temperatures
between the upper and lower critical points AC3 and AC1, typically between 910
and 720 °C (Eastling 1992). In this region partial retransformation to austenite
occurs during heating, the exact extent of which is governed by the peak
temperature within the intercritical temperature range. During cooling, the
austenite regions decompose to different extents and to various transformation
products, fig. 72 (Matsuda et al. 1996).
Figure 72. Scheme of ICHAZ formation.
The microstructure in this region consists of a mixture of bainite, tempered
martensite and perlite, fig. 73. Carbides, mainly cementite also experience a
process of spheroidization and coagulation.

146
Figure 73. Optical microstructure of ICHAZ of QT HSS E.
The SCHAZ is the region of HAZ that has been subjected to peak temperatures
below the lower critical point AC1, below 720 °C (Eastling 1992). The processes
of nucleation and spheroidization of carbides occurs in this zone, fig. 74. Black
cementite conglomerates are clearly identified in fig. 75. The agglomeration of
spheroidized cementite particles at grain boundaries and triple junctions em-
phasizes the role of grain boundaries as high diffusivity channels for carbon at
these low temperatures.
Figure 74. Scheme of SCHAZ formation.

147
Figure 75. Optical microstructure of SCHAZ of QT HSS E.
The ICHAZ and SCHAZ regions of TMCP HSS, fig. 76 a and b, can be hardly
distinguished unlike the HAZ of steel QT, fig. 73 and 75. This happens because
the TMCP steel has a low carbon content and heating up to temperatures
around critical point AC1 does not produce large scale nucleation of cementite
and its coagulation.
a) b)
Figure 76. Optical microstructure of TMCP HSS C: a) ICHAZ, b) SCHAZ.
7.11.4. Comparison of HAZ microstructure of steels QT and TMCP
Measurements of the microhardness in cross section of the studied welded QT
and TMCP HSS joints were made. Distributions that were obtained are shown
in Fig. 77.

148
Base metal microhardness of the QT and TMCP steels is similar, 265 and 273
HV respectively, fig. 77. The weld metal has a lower hardness (200-210 HV) in
comparison with BM, while undermatching between the weld and base metal
occurs.
a) b)
Figure 77 . Microhardness distribution in the weld joint: а) QT HSS E; b) TMCP
HSS C.
As it seen from fig. 77, the HAZ microhardness of the both steels varies over a
wide range. Characteristic of the TMCP steel HAZ is a general decrease in
hardness with respect to the base metal. In the HAZ of QT steel a decrease as
well as increase in hardness is observed depending on the resulting
microstructure.
In the HAZ of QT welded joint the highest hardness reaches 290-317 HV and is
observed in the CGHAZ close to the fusion line. This can be explained by the
formation of bainite- martensite microstructure. Increased hardenability of steel
at the CGHAZ, because of the increased carbon content in the base metal and
a strong grain growth due to welding thermal cycle, is the cause of such
microstructure. There is a gradual decrease in hardness with decreasing the
fraction of martensite in the microstructure with the distance from the weld and
the associated reduction of maximum heating temperature.

149
CGHAZ of the TMCP steel welded joint has microhardness 230-240 HV. The
decrease in the hardness in relation to the base metal is explained by the full
recrystallization of microstructure and its transformation to the austenite during
heating. Optimum microstructure with a desired balance of mechanical
properties and primary bainitic microstructure with a high density of dislocation
are achieved through suitably designed thermomechanical process. Low
hardenability of the TMCP steel is explained by a very low level of alloying
elements and carbon. When heating exceeds the AC3 temperature the full
recrystallization of the microstructure occurs and the more equilibrium products
of transformation with lower density of dislocation are achieved. This is the main
cause of a decreasing of the hardness at a considerable distance from the HAZ.
The lowest hardness in the HAZ of the both steels corresponds to the FGHAZ.
It is explained by the formation of the polygonal ferrite in this area. Austenite
fine grain and insufficiently high cooling rates assist in transformation of the
austenite into ferrite with low density of dislocations.
SCHAZ of the both steels is characterized by the decrease in hardness due to
tempering of the base metal.
During heating between AC1 and AC3 (ICHAZ) austenite composition in the
microstructure varies from 0 to 100% according to the local maximum
temperature or in other words to the distance from the fusion line. Ferrite as a
product of austenite decomposition determines the hardness of this region of
the HAZ after cooling.
So both TMCP and QT steels are characterized by the softening in the HAZ but
the lowest hardness relates to the weld metal. Formation of the quenched
structures in the HAZ of QT steel can lead to cold cracking during welding and
deterioration of the toughness of CGHAZ.

150
7.11.5. Microstructure study of CTOD samples after simulated welding thermal cycle
Fig. 78 shows the microstructure of QT HSS E Gleeble simulated and welded
joint when heat input was 1.3 kJ/mm. The grain boundaries are depicted by the
red lines. The Gleeble sample has a coarse microstructure in comparison with
CGHAZ of the real welded joint. Austenite grains have a number 4-5 (according
to ASTM E112-10) in the welded joint and 3.5-4 in the simulated sample, the
differences of which can be explained by the effect of high temperature gradient
in the welded joint. Additionally, the microstructural constituents of both samples
are similar.
a) b)
Figure 78. Microstructure of CGHAZ HSS E of the Gleeble sample a) and a real
GMAW welded joint b).
Fig. 79 shows the microstructure of TMCP HSS C Gleeble simulated and
welded joint when heat input was 1.3 kJ/mm. The Gleeble sample has a similar
microstructure in comparison with CGHAZ of the real welded joint. Austenite
grains have a number 4 (according to ASTM E112) in case of welded joint and
4-5 for simulated sample. Additionally, the microstructural constituents of both
samples are similar.

151
a) b)
Figure 79. Microstructure of TMCP HSS E CGHAZ of the Gleeble sample (a)
and a real GMAW welded joint (b).
When comparing the HAZ grain growth in the simulated weld and the real weld,
this current study also came to the same conclusions of previous research
(Easterling 1992) where it was observed that the maximum initial austenite
grain size in real welds is less than what is seen in simulated welds. This trend
has been mainly observed with medium heat input values. This phenomenon
can possibly be explained by the fact that small grains hinder the grain growth
of the large grains in real welds. This is shown in fig. 80, where it can be ob-
served that the change in grain size is associated with a very steep temperature
gradient. The grains can move other way, like grains which have a large tem-
perature gradient across them tend to grow non-uniformly. Then it results
change of shape from equiaxed to pear-shaped. A grain can also experience
surface tension restrictions when adjacent grains are trying to expand at faster
or slower rates (Easterling 1992).

152
Figure 80. Grain size in the HAZ as a function of the peak temperature and dis-
tance from the fusion line (Easterling 1992).
8. DIVERGENCE IN MANUFACTURERS’ HSS’s WITH DIFFERENT HEAT INPUTS
This study began with the idea that the main structure of the base material is
different when comparing TMCP, QT and DQ HSSs. It is especially important to
consider that the microstructure of these steels are quite different from one
another. The chemical properties of these steels are also different with some
steels having a large variety of alloying elements compared to other HSSs. QT
and DQ steels have same kind of tempered martensite and bainite
microstructure, while the main microstructure of TMCP steels is ferrite-bainite.
When comparing QT and DQ steels with TMCP steels, there is a distinct
difference in the HAZ hardness as seen from the results of the hardness tests.
When constructing steel structures using TMCP steels, the HAZ hardness must
be taken into consideration. When using undermatching filler material this is not
of the utmost importance, however when using matching filler material, the HAZ
hardness should be closely monitored.
The divergence between different manufacturers HSSs can be clearly observed
in the width of the HAZ. Many researchers (Magudeeswaran et al. 2008, Shi &
Han 2008, Liu et al. 2007, Liu W-Y 2007, Pavyna & Dabrovski 2007, Wang et
al. 2003, Basu & Roman 2002, Louriero 2002, Nevasmaa et al. 1992a,
Nevasmaa et al. 1992b, Vilpas et al. 1985) have examined the effects in the
153
HAZ under welding, especially the effects of the heat input and the cooling
time. It has been clearly observed within this research that higher yield
strengths HSSs require lower heat inputs and cooling time t8/5. In this study
there were so many different HSS from the different manufacturers (eight steels
from six manufacturers) that the observation was unambiguous regardless of
the steel or manufacturer.
Welding DQ HSSs required the lowest values in heat input. The microstructure
and the hardness are the most susceptible areas of DQ steels, yet these steels
have the highest yield strength of HSSs. The martensite and bainite
microstructure of QT steels leads to a brittle CGHAZ structure, as seen in DQ
steels, and therefore the heat input must be low, near 1.0 kJ/mm. In TMCP
steels hardness decreases in the CGHAZ when compared to the base material.
This must be taken into consideration, especially if the filler material is
undermatched, because a soft HAZ can weaken the entire welded structure. If
the filler material is matched and the heat input is as low as 1.0 kJ/mm, then
despite reduced hardness in the HAZ, the welded structure will have as good
strength values as the base material in TMCP HSS.
At the same time that hardness is decreasing, the impact toughness decreases
when the cooling time is longer. Similar to the work of other researchers (Shi &
Han 2008, Liu at al. 2007, Wang et al. 2003, Juan et al. 2003), this study has
also observed that greater heat input leads to decreasing impact toughness
values, which can lead to damage in the welded structure especially in low
temperatures such as -40 °C. The same phenomenon will happen despite the
manufacturing method used to make the HSSs. This study has shown that the
welding circumstances in the workshops, good professional skills, and needed
WPSs are important when pursuing a good impact toughness in HSS welded
structures.

154
9. CONCLUSIONS
1. It has been acknowledged in this study that when welding HSS with a
minimum yield strength of 690 MPa, the heat input cannot be over 1.0
kJ/mm. If the heat input is greater than this, then the impact ductility,
toughness, tensile strength and fatigue strength properties of the welded
structure start to decrease and in the worst case scenario, the welded
HSS will break unexpectedly because of the brittle structure in the HAZ.
M-A grains in the HAZ can be the source of initial crack as an increased
heat input results in more M-A grains in the HAZ. The heat input 1.0
kJ/mm in this study leads to t8/5 time 21 s if the plate thickness is 8 mm,
however when the thickness of the welded plate is thicker, the heat input
must be calculated again. Based on earlier studies, it was recommended
that the heat input for HSS with a minimum yield strength of 690 MPa
should be anywhere between 1.0 through 2.0 kJ/mm. This study has
clearly indicated that these ranges are too high regardless of the method
which was used to make the HSS; QT, TMCP or DQ.
2. The disappearance of nitrides and carbides in the CGHAZ during welding
leads to a growth of initial austenite grains. The base metal temperature
in the CGHAZ exceeds 1300 °C and this causes the microstructure to
change. When the temperature of the CGHAZ decreases, the stable
particles that gave the base material its small homogenous
microstructure have disappeared and the microstructure consequently
becomes coarse. It has been clearly shown in this research that the heat
input must be low, under 1.0 kJ/mm attaining a narrow CGHAZ. The
CGHAZ that is susceptible to cold cracking during welding due to the
coarse hardenable martensite or bainite microstructure. One way to
monitor excessive heat input is to use new welding methods that have
been developed by welding machine manufacturers. These methods,
which lower the energy during welding, offer a new way to lower heat
input and they have more features to adjust welding. Nevertheless,

155
these methods were not utilized in the course of this research, although
they can offer new solutions for welding HSSs.
3. Elongation at break in all the HSS welded structures was too low when
compared to the standards of these steels. Values of 6.1 % were
observed when heat input was 1.0 kJ/mm, 7.1 % when heat input was
1.3 kJ/mm and 7.0 % when heat input was 1.7 kJ/mm. These values are
only half of the required 15 % necessary for HSSs. Big differences
between the yield strengths of the weld and base materials meant that
most of the yielding occurred in the weld. The same situation occurs in
real welded structures when using undermatched filler material, main
yield will happen in the weld. Designers of steel structures must consider
that the majority of the yielding will happen in the weld.
4. The tensile strength of welded structures was good. Although the tensile
strength of filler material was only 72 % of base material tensile strength,
some welded structures had near the same tensile strength as the base
material. The average value of weakness was 15.4 %, when heat input
was 1.0 kJ/mm, 16.3 % when heat input was 1.3 kJ/mm and 18.7 %
when heat input was 1.7 kJ/mm. Additionally, the tensile strength of
welded structure was 25.2 % when heat input was 1.0 kJ/mm, 23.9 %
when heat input was 1.3 kJ/mm and 20.5 % when heat input was 1.7
kJ/mm, higher than the tensile strength of the filler material. The fusion
zone has experienced mixing during the welding process, most likely
involving the mixture of alloying elements that make inclusions, such as
carbides and nitrides.
5. Using undermatched filler material when welding HSSs with a yield
strength of 700 MPa is a workable method. There are many benefits to
using this method as have been previously discussed. Planning ahead
careful welding is the best guarantee to ensure a good final result when
welding HSSs with a yield strength of 700 MPa. Undermatched filler
material survives as filler metal, too.
6. However, if the steel structure is loaded in low temperatures, from -20 °C
to -40 °C, then the CGHAZ could be the place from which failure can
occur. The CGHAZ is near the fusion zone and there is always undercut

156
between the weld and base material. The undercut is the initial crack
near the weakest zone of the HAZ. It is important to repair it within the
structure through grinding and polishing. This is important if the welded
structure is dynamic loaded.

157
10. FUTURE WORK
Understanding the use of matching filler material in welded structure is
important. There are still many structures where the behaviour of the strength
and ductility of welded structures using matching filler material need to be
clarified. Of most importance will be research that looks into how the structure
will behave using different heat inputs and t5/8 cooling time. Research using
different steels made by TMCP, QT and DQ method with matching filler material
is also needed.
HSSs use has been growing in the steel industry. Many of those products will
be in use in the winter in Arctic areas. It would be important to clarify more
behaviours of welded HSS structures in -40 °C and -60 °C temperatures. All
tests should be conducted at these lower temperatures to ensure that HSS will
be able to endure in the demanding Arctic area.
In this study, the CTOD test was only implement in the CGHAZ. It would be
important to test all HAZ zones to test if the hypothesis that the CGHAZ is the
weakest zone in the HAZ. This is important when QT steels and TMCP steels
are in service in the same steel structure.
Only two impact ductility tests have made in this study. There were such a big
range of values that the mean values of some HAZs were not the real impact
ductility value. To make sure which is the real impact ductility mean value in the
HAZ more tests must be done. Together with CTOD tests it will give the best
estimation of the structure.
In this study micro photography has also been done. However, TEM testing of
the microstructure gives a better description of the microstructure. Using this
method would be an easy way to clarify content of inclusions, such as carbides,
nitrides and carbonitrides. Additionally, the size and shape of inclusions could
be clarified through TEM testing.

158
11. SUMMARY
In this doctoral thesis the usability of HSS in welded structures has been
researched. Welded QT, TMCP and DQ HSSs have been under examination.
The use of these HSSs grows in many industrial areas and the need for
knowledge of these steels structures manufacturing is in high demand.
Today, HSS is manufactured using three different methods, QT, TMCP and DQ.
The microstructure of these steels and HAZ area after welding, mechanical
properties, usability, and other main discrepancies in the welded structures
were researched. Only after carefully clarifying the research topic and discusses
welded high strengths structures was experimental research done using
different laboratory tests. These tests were all conducted with undermatched
filler material with three different heat inputs, 1.0, 1.3 and 1.7 kJ/mm.
The research carried out during this doctoral thesis had four key findings.
1) A clear implication of this study points out that when welding HSS, thickness
8 mm and butt joint, the heat input must be 1.0 kJ/mm or lower. HSS steels with
a heat input of 1.0 kJ/mm have better HAZ microstructures and additionally
superior tensile strength and impact test values than steels with a heat input of
1.3 or 1.7 kJ/mm.
2) When welding all three types of HSS (QT, DQ and TMCP), the CGHAZ was
very brittle. This brittleness occurred because of the high heat input used during
the welding process causes dissolve of carbides and nitrides and also growing
of initial austenite grains. The CGHAZ is narrow using low heat input and in
normal steels structures it does not significantly weaken the structure. However,
if the steel structure is loaded in low temperatures, from -20 °C to -40 °C, then
the CGHAZ could be the area from which failure can occur.

159
3) The tensile strength of the welded structures was acceptable. Although the
tensile strength of the filler material was only 72 % of base material’s tensile
strength, some welded structures had nearly the same tensile strength as the
base material.
Elongation at break values in all the welded structures were low. Values of 6.1
% where observed when the heat input was 1.0 kJ/mm, 7.1 % when the heat
input was 1.3 kJ/mm and 7.0 % when the heat input was 1.7 kJ/mm. These
values are only half of the required 15 % necessary for HSSs. The same
situation occurs in real welded structures when using undermatching filler
material, and the main yield will occur in the weld. Designers of steel structures
must consider that the majority of the yielding will happen in the weld.
4) When welding HSSs with a yield strength of 700 MPa, using undermatched
filler material is an acceptable method. This undermatched filler material will
survive as a filler metal. However, planning ahead and careful welding are the
best guarantees to ensure a positive result when welding HSSs.

160
References
Basu, B. Raman, R. Microstructural Variations in a High-Strength Structural
Steel Weld under Isoheat Input Conditions. Welding Journal, pp. 239- 248.
2002.
Cabello, F. G. Chao, J. Cornide, J. Gardía-Mateo, C. Santofimia, M. J. Cap-
devila, C. Toughness deterioration in advanced high strength bainitic steels.
Materials Science and Engineering A, vol. 525, pp. 87-95. 2009.
Chen, Y. T. Guo, A. M. Wu, L. X. Zeng, J. Li, P. H. Microstructure and mechani-
cal property development in the simulated heat affected zone of V treated HSLA
steels. Acta Metallurgica Sinica, vol. 19, no 1. pp. 57-76. 2006.
Davis, C.L. King, J.E. Effect of cooling rate on intercritically reheated
microstructure and toughness in high strength low alloy steel. Materials Science
& Techology, vol. 9, pp 8. 1993.
Dillinger Hüttenwerke AG, Dillimax ppt document via e-mail. 2008.
Duane, K. Miller, P. E. Use Undermatching Weld Metal Where Advantageous.
Welding Innovation, vol. XIV, no 1. 1997.
Easterling K. Introduction to the physical metallurgy of welding. 2nd edition// But-
terworth-Heinemann Ltd., 1992.
Esab Dalsbruk Oy. OK Autrod 12.51. Test Certificate 0010028133. 2008.
Güral, A. Bostan, B. Özdemir, A.T. Heat treatment in two phase region and its
effect on microstructure and mechanical strength after welding of a low carbon
steel. Material and Design. 2007.
161
Hamada, M. Control of strength and toughness at the heat affected zone. Weld-
ing International, vol. 17, no 4, pp. 265-270. 2003.
Harrison, P. Wall, P. Effect of alloying elements on HAZ microstructure and
toughness, EU raportti EN 15834. Europa Comission. Technical Steel Re-
search. p.79. 1996.
Hatting, R, J. Pienaar, G. Weld HAZ embrittlement of Nb containing C-Mn
steels. International Journal of Pressure Vessels and Piping, vol. 75, pp. 661-
667. 1998.
Holsberg, P. W. Gudas, J. P. Caplan, I. L. Metallurgical design and processes in
the U.S. Navy HSS welding. Recent Trends in Welding Science and Technol-
ogy TWR’89, edited by S. A. Daid and J. M. Vitek. 1989.
Hwang, G.C. Lee, S. Yoo, J. Y. Choo, W. Y. Effect of direct quenching on mi-
crostructure and mechanical properties of copper-bearing high-strength alloy
steels. Material Science and Engineering A252, p. 256-268. 1998.
Juan, W. Yajiang, L. Peng, L. Effect of weld heat input on toughness and struc-
ture of HAZ of a new super-HSS. Bulletin Material Science, vol 26, no 3, pp.
301-305. 2003.
Kapustka, N. Conrardy, C. Baby, S. Albrigth, C. Effect of GMAW Process and
Material Conditions on DP 780 and TRIP 780 Welds. Welding Journal, vol. 87,
pp. 135-148. 2008.
Keehan, E. Effect of Microstructure on Mechanical Properties of HSS Weld
Metals. Thesis for the degree of doctor of philosopfy. Chalmers University of
technology and Göteborg University, Göteborg, Sweden. 2004.
Keehan, E. Andrén, H. O. Karlsson, L. Murugananth, M. Bhadeshia, H. K. D. H.
Microstructural and mechanical effects of nickel and manganese on HSS weld

162
metals. Trends in Welding Research, Proc. 6th Int. Conf., Eds. SA David, T De-
bRoy, JC Lippold, HB Smartt and JM Vitek. ASM International, Materials Park,
pp. 695-700, 2003.
Kim, B. C. Lee, S. Kim, N. Lee, D. Y. Metallurgical and Materials Transaction A,
vol. 22A, pp 139. 1991.
Kou, S. Welding Metallurgy, Second Edition. Hoboken, N.J.: John Wiley &
Sons, Inc. 2003.
Krauss G., Thompson S.W. Ferritic microstructures in continuously cooled low-
and ultralow-carbon steels, ISIJ International, 35, No.8, 937-945, 1995.
Kömi, J. Ultralujat kuumavalssatut ratkaisut painokriittisiin sovelluksiin - teräsra-
kenteiden optimointi superteräksistä. Ultralujat ja kulutusta kestävät teräkset pe-
rinteisten terästen korvaavina materiaaliratkaisuina Teknologia Kuopio, semi-
naarisarja: Savonia-ammattikorkeakoulu Tekniikka. Rautaruukki Ltd, 2009. (in
Finnish)
Lambert, A. Drillet, J. Gourgues, A.F. Sturel, T. Pineau, A. Microstructure of
martensite-austenite constituents in heat affected zones of high strength low al-
loy steel welds in relation to toughness properties. Science and Technology of
Welding and Joining, vol. 5, no 3, 168-173. 2000.
Lamberte-Perlade A., Gourgues A.F., Besson J., Sturel T., Pineau A. Mehanism
and modeling of clivage fracture in simulated heat-affected zone microstruc-
tures of a high-strength low alloy steel, Metall. Trans. A, vol. 35A, 1039-1053,
2004.
Lancester, J. F. Metallurgy of welding. Third Edition. ISBN 0-04-669008-5.
George Allen & Unwill Ltd. 1980.

163
Lee, S. Kim, B. C. Kwon, D. Fracture Toughness Analysis of Heat-Affcted
Zones in High-Strength Low-Alloy Steel welds. Metallurgical Transactions A,
vol. 24A, 1134-1141. 1993.
Lee, J-L. Pan, Y-T. The formation of intragranular acicular ferrite in simulated
heat affected zone. ISIJ International, vol. 35, no. 8, pp. 1027-1033. 1995.
Li, Y. Crowther, D, N. Green, M, J, W. Mitchell, P, S. Baker, T, N. The effect of
Vanadium and Niobium on the Properties and Microstructure of the Intercritically Reheated Coarce Grained Heat Affected Zone in Low Carbon
Microalloyed Steels. ISIJ International, Vol. 41, No 1, p. 46-55. 2001.
Lindroos, V. Sulonen, M. Veistinen, M. Uudistettu Miekkojan metallioppi. Tek-
nisten tieteiden akatemia. Kustannusosakeyhtiö Otava. Helsinki. 1986. (In Fin-
nish)
Liu, S. Liao, F-C. Precipitate stability in the heat affected zone of nitrogen-
enchanced high strength low alloy steels. Materials Science & Engineering
A244, pp. 273-283. 1998.
Liu, W-Y. Wang, L, Liu, J-B. Zhang, Y-Y. Li, P-H. Yuan,G-L. Microstructures
and Properties in Simulated Heat-Afeected Zones of 685 MPa Grade Copper-
Bearing Steel. Proceedings of Sino-Swedish Structural Materials Symposium.
2007.
Loureiro, A.J.R. Effect of heat input on plastic deformation of undermatched
welds. Journal of Materials Technology, vol 128, pp. 240-249. 2002.
Magudeeswaran,G. Balasubramanian, V. Madhusudhan Reddy, G.
Balasubramanian, T.S. Effect of Welding Processes and Consumables on
Tensile and Impact Properties of High Strength Quenched and Tempered Steel
Joints. Journal of Iron and Steel Researce, International, 15, pp. 87-94. 2008.
164
Matsuda, F. Ikeuchi, K. Fukada, Y. Horii, Y. Okada, H. Shiwaku, T. Shiga, C.
Suzuki, S. Review of Machanical and Metallurgical Investigations of M-A Consti-
tuent in Welded Joint in Japan. Transaction of JWRI in published by welding re-
search, Institute, Osaka University, Ibaraki, Osaka 567, Japan. 1995.
Matsuda F., Fukada Y., Okada H., C.Shiga Review of mechanical and metallur-
gical investigations of martensite-austenite constituent in welded joints in Japan,
Welding in the World, No.3, Vol.37, 134-154, 1996.
Mee van der, V. J. H. M, Pletcher, P. M. Consumables and practices for welding
HSSs. Singapore 2009.
Metals Handbook Tenth Edition, Volyme 1, Properties and Selection: Iron,
Steels, and High Performance alloys. Prepared under the direction of the ASM
INTERNATIONAL Handbook Committee. 1990.
Miki, C. Homma, K. Tominaga, T. High strenth and high performance steels and
their use in bridge structures. Journal of Constructional Steel Research, vol 58,
pp. 3-20. 2002.
Misra, R. D. K. Nathani, H. J.E. Hartmann, J. E. Siciliano, F. Microstructural
evolution in a new 770 MPa hot rolled Nb–Ti microalloyed steel. Materials
Science and Engineering A 394, p 339–352. 2005.
Mitchell P.S., Hart P.H.M., Morrison W.B. The effect of microalloying on HAZ
toughness, MICROALLOING 95, Eds. M.Korchynsky et. al., I&SS, Pittsburgh,
USA, 1995.
Mohandas, T. Madhusudan Reddy, G. Satish Kumar, B. Heat-affected zone
softening in high-strength low-alloy steels. Journal of Materials Processing
Technology 88, pp. 284-294. 1999.
165
Moon, D. W. Fonda, R. W. Spanos, G. Microhardness Variations in HSLA-100
Welds Fabricated with New Ultra-Low-Carbon Weld Consumables. Welding
Research Supplement, October, pp. 278-285. 2000.
Moon, J. Kim, S. Lee, J. Hwang, B. Lee, C.G. Lee, C. Effect of Cu and B
addition on tempering behaviour in the weld CGHAZ of high strength low alloy
plate steel. Materials Science and Engineering A 497, pp 153-159. 2008.
Nevasmaa, P. Cederber, M. Vilpas, M. Weldability of direct-quenched and
tempered (DQT) HSS HT80. Technical Research Centre of Finland. 1992A.
Nevasmaa, P. Cederberg, M. Vilpas, M. Weldability of accelerated-cooled (AcC)
high strength TMCP steel X80. Technical Research Centre of Finland. 1992B.
Pacyna, J. Dabrowski, R. New alloy steel of high strength and resistance to
cracking. Welding International, vol. 21, no 5, pp.20-23. 2007.
Pisarski, H.G. Dolby, R.E. The significance of softened HAZs in high strength
structural steels. Welding in the World, vol. 47, no 5/6, pp. 32-40. 2003.
Porter, D. Development in hot-rolled high-strength steel. Nordic welding
conference 06, New trends in welding technology, Tampere, Finland. 2006.
Rak, I. Kocak, M. Gliha, V. Gubeljak, N. Prauseis, Z. Effect of Strength
Mismatch on Fracture Toughness of HSLA Steel Weld Joint. OMAE, Volyme III,
Materials Engineering, ASME, 1995.
Rak, I. Gliha, V. Kocak, M. Weldability and Toughness Assessment of Ti-
Microalloyed Offshore Steel. Metallurgical and Materials Transactions A, vol
28A, 1997.
166
Ramirez, J.E. Characterization of High-Strength Steel Weld Metals: Chemical
Composition, Microstructure, and Non metallic Inclusions. Welding Journal, vol.
87, pp. 65-75. 2008.
Rodrigues, D.M. Menezes, L.F. Loureiro, A. Fernandes, J.V. Numerical study of
plastic behaviour in tension of welds in high strength steels. International Jour-
nal of Plasticity, vol 20, pp. 1-18. 2004a.
Rodrigues, D.M. Menezes, L.F. Loureiro, A. The influence of the HAZ Softening
on the Mechanical Behaviour of Welded Joints Containing Cracks in the Weld
Metal. Engineering Fracture Mechanics, 71, issues13-14, pp. 2053-2064.
2004b.
Sampath, K. An understanding of HSLA-65 plate steels, Journal of Materials
Engineering and Performance, Vol 15 (1). 2006.
Satoh, K. Toyota, M. Joint Strength of Heavy Plates with Lower Strength Weld
Metal. The 56th AWS Annual Meeting. Welding Journal 54 9 p (Reprinted
Version). 1975.
Shi, Y. Han, Z. Effect of weld thermal cycle on microstructure and fracture
toughness of simulated heat-affected zone for a 800 MPa grade HSS. Journal
of materials processing technology 207, pp. 30-39. 2008.
Shi, Y. Han, Z. Fu, J. Effect of weld strength undermatch on fracture toughness
of HAZ notched in a HSLA steel. International Journal of Fracture, vol. 91, pp.
349-358. 1998.
Shishida et al: Study of Steel Manufacture 1987 326 36.
Tian, D. Microstructure, cleavage fracture and toughness of granular bainite in
simulated coarse-grained heat affected zones of low-carbon high-strength-

167
steels. Oulu: Oulun yliopisto, Acta Universitatis Ouluensis. Series C,
Technica, 113, ISBN 951-42-4802-5. 1998.
Toyoda, M. Practical Fracture Mechanics & Welding Mechanics (With particular
Reference to Structural Integrity in Weldments). Japan 1986. Osaka University.
P, 1-62. 1986.
Thewlis, G. Classification and quantification of microstructures in steels. Mate-
rials Science and Technology, vol 20, no 2, pp.143-160. 2004.
Umekuni, A. Masubuchi, K. Usefulness of Undermatched Welds for High-
Strength Steels. Welding Journal, vol. 76, No 7, pp. 256-263. 1997.
Vilpas, M. Tihekari, H. Karppi, R. Mechanical properties of SMA- and SA-
welded joints for quenched and tempered high-strength steel, N-A-XTRA 70.
Technical Research Centre of Finland. Research report 363. 1985.
Vähäkainu, O. Hitsaajan opas. Rautaruukin teräkset. Otavan kirjapaino. Keuruu.
2003. (in finnish)
Wang, J. Li, Y. Liu, P. Effect of weld heat input on toughness and structure of
HAZ of a new super-HSS, Material Science, Vol 26, No 3, pp 301-305. 2003.
Yayla, P. Kaluc, E. Ural, K. Effect of welding processes on the mechanical
properties of HY 80 steel weldment. Material and Design, vol 28, pp. 1898-
1906. 2007.
Yurioka, N. Okumura, M. Kasuya, T. Cotton, H. J. U. Prediction of hardness of
transformable steels, Metal Construction, vol 19, pp. 217-223. 1987.
Yasuyama, M. Uchihara, M. Fukui, K. Tailored blank technology of HSS sheet.
Welding International, vol. 21, no 4, pp. 251-254. 2007.

168
Zaczek, Z. Cwiek, J. Prediction of HAZ Hardness in Welds of Quenched and
Tempered HSLA Steels. Welding Journal, vol 72, no 1, pp. 37-40. 1993.
Zeman, M. Assesment of weldability of WELDOX 1100 high strength quenched
and tempered steel. Welding International, vol. 23, no 2, pp. 79-82, 2009a.
Zeman, M. Properties of welded joints made of weldox 1100 Steel. Welding In-
ternational, vol. 23, no 2, pp. 83-90, 2009b.
Zhang, Y. Q. Zhang, H, Q. Liu, W, M. Hou, H. Effects of Nb on microstructure
and continuous cooling transformation of coarse grain heat-affected zone in
610MPa class high-strength low-alloy structural steels. Materials Science and
Engineering A 499, p. 182–186. 2009.
Network documents
http://www.worldautosteel.org/uploaded/AHSSApplicationGuidelinesVersion4.p
df
(read 3.6.09)

Appendix 1.
169
Prequalified Welding Procedure Specification, pWPS, heat input 1.0 kJ/mm Base Materials
HSS, yield strength 700 MPa
Thickness 8 mm
Type of joint preparation
Weld pass sequence
Outside diameter of pipe
V-Groove 60 °
Welding process MAG
Welding position PA
Groove preparation machining
Groove cleaning
Fastening Edge fastener
Tack welding
Accesory equipment
Back gouging Non Electrode
Backing ring Fiberglass tape Cutting-edge angle
Filler material and shielding gas
Torch angle
0°
Classification of filler material
EN 440 SFA/AWS A5.18
Angle of tilt
Distance from workpiece
Working temperature
Trade mark of filler material
OK AUTROD 12.51
Elevated working temperature
Interpass temperature
20 °C
Powder
Preheating temperature
Shielding gas
Ar + 15 % CO2 Measuring of working temperature
Flow rate range
16 l/min Post-welding heat treathment
Plasma gas
Method
Flow rate range
Heating rate
Backing gas
Soaking temperature
Flow rate range
Soaking time
Type of current
DC Cooling rate
Polarity
+ pole Finishing
Notes: Backing ring was woven glass
Date and author: 07.04.2009 MPirinen
Bead
Welding Process
Filler
material Ø
Flow rate
range ( A )
Arc
voltage range ( V )
Welding speed range
(mm/min
Wire feed
range (m/min)
Heat input
range ( kJ/mm)
Length of free wire ( mm )
Oscillation frequence
( Hz )
Amplitude (
mm )
Notes!
1 MAG 1.2 220-225 22.3 243 5.8 1.0 15 - -
Measured values Kemppi Data pro DLI10
2 M A G 1 . 2 2 2 5 -2 3 0 2 5 . 5 2 7 5 6 . 8 1 . 0 3 1 9 - -
Measured values Kemppi Data pro DLI10
Customer
Accepted 7.4.2009 Markku Pirinen
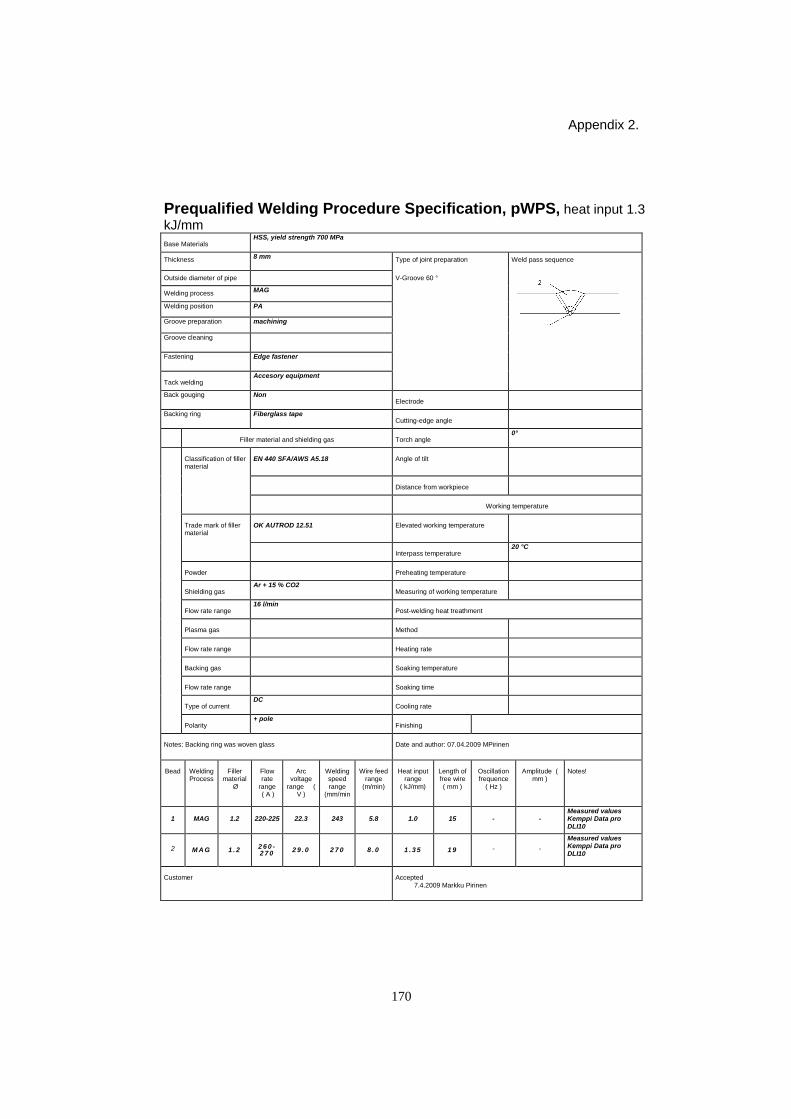
Appendix 2.
170
Prequalified Welding Procedure Specification, pWPS, heat input 1.3 kJ/mm Base Materials
HSS, yield strength 700 MPa
Thickness 8 mm
Type of joint preparation
Weld pass sequence
Outside diameter of pipe
V-Groove 60 °
Welding process MAG
Welding position PA
Groove preparation machining
Groove cleaning
Fastening Edge fastener
Tack welding
Accesory equipment
Back gouging Non Electrode
Backing ring Fiberglass tape Cutting-edge angle
Filler material and shielding gas
Torch angle
0°
Classification of filler material
EN 440 SFA/AWS A5.18
Angle of tilt
Distance from workpiece
Working temperature
Trade mark of filler material
OK AUTROD 12.51
Elevated working temperature
Interpass temperature
20 °C
Powder
Preheating temperature
Shielding gas
Ar + 15 % CO2 Measuring of working temperature
Flow rate range
16 l/min Post-welding heat treathment
Plasma gas
Method
Flow rate range
Heating rate
Backing gas
Soaking temperature
Flow rate range
Soaking time
Type of current
DC Cooling rate
Polarity
+ pole Finishing
Notes: Backing ring was woven glass
Date and author: 07.04.2009 MPirinen
Bead
Welding Process
Filler
material Ø
Flow rate
range ( A )
Arc
voltage range (
V )
Welding speed range
(mm/min
Wire feed
range (m/min)
Heat input
range ( kJ/mm)
Length of free wire ( mm )
Oscillation frequence
( Hz )
Amplitude (
mm )
Notes!
1 MAG 1.2 220-225 22.3 243 5.8 1.0 15 - - Measured values Kemppi Data pro DLI10
2 M A G 1 . 2 2 6 0 -2 7 0 2 9 . 0 2 7 0 8 . 0 1 . 3 5 1 9 - -
Measured values Kemppi Data pro DLI10
Customer
Accepted 7.4.2009 Markku Pirinen

Appendix 3.
171
Prequalified Welding Procedure Specification, pWPS, heat input 1.7 kJ/mm Base Materials
HSS, yield strength 700 MPa
Thickness 8 mm
Type of joint preparation
Weld pass sequence
Outside diameter of pipe
V-Groove 60 °
Welding process MAG
Welding position PA
Groove preparation machining
Groove cleaning
Fastening Edge fastener
Tack welding
Accesory equipment
Back gouging Non Electrode
Backing ring Fiberglass tape Cutting-edge angle
Filler material and shielding gas
Torch angle
0°
Classification of filler material
EN 440 SFA/AWS A5.18
Angle of tilt
Distance from workpiece
Working temperature
Trade mark of filler material
OK AUTROD 12.51
Elevated working temperature
Interpass temperature
20 °C
Powder
Preheating temperature
Shielding gas
Ar + 15 % CO2 Measuring of working temperature
Flow rate range
16 l/min Post-welding heat treathment
Plasma gas
Method
Flow rate range
Heating rate
Backing gas
Soaking temperature
Flow rate range
Soaking time
Type of current
DC Cooling rate
Polarity
+ pole Finishing
Notes: Backing ring was woven glass
Date and author: 07.04.2009 MPirinen
Bead
Welding Process
Filler
material Ø
Flow rate
range ( A )
Arc
voltage range (
V )
Welding speed range
(mm/min
Wire feed
range (m/min)
Heat input
range ( kJ/mm)
Length of free wire ( mm )
Oscillation frequence
( Hz )
Amplitude (
mm )
Notes!
1 MAG 1.2 220-225 22.3 243 5.8 1.0 15 - - Measured values Kemppi Data pro DLI10
2 M A G 1 . 2 2 6 0 -2 7 0 3 0 . 9 2 3 0 7 . 6 1 . 7 5 1 9 - -
Measured values Kemppi Data pro DLI10
Customer
Accepted 7.4.2009 Markku Pirinen

Appendix 4.
Table 1 Characteristic of nonmetallic inclusions (Ramirez 2008). Inclusion Characteristics
Inclusion Chemical Composition Description 1 Region A — 50.1O-0.7Mg-1.6Al-3.9Si-2.8S-19.6Ti-21.4Mn O, Al, Si, S, Ti, Mn rich
Region B — 48.2O-0.9Mg-1.6Al-3.4Si-2.3S-22.2Ti-21.4Mn 2 51.4O-1.4Al-4.5Si-1.7S-18.1Ti-22.8Mn O, Al, Si, S, Ti, Mn rich 3 Region A — 32.2O-0.5Al-1.3Si-0.9S-51.4Ti-13.7Mn (Ti-O2) Composite inclusion
Region b MnS, Region c Ti-Oxide 4 Region A — 32.3O-1.5Al-0.7Si-50.4Ti-15.1Mn Ti-Mn oxide
Region B — 35.4O-3.2Al-6.1Si-0.8S-26.5Ti-28.0Mn Region C — 35.3O-4.4Al-9.6Si-1.4S-3.6Ti-45.8Mn
5 30.9O-1.8Si-26.5S-3.5Ti-37.3Mn Mn, S, O rich 6 56.2O-1.3Al-5.5Si-2.1S-15.4Ti-19.5Mn Ti-Mn oxide 7 77.8O-0.9Si-1.3S-17.2Ti-2.8Mn O, Si, S, Ti, Mn rich 8 65.5O-0.5Si-1.4S-22.8Ti-9.8Mn Ti oxide 9 65.4O-2.5Si-13.0S-16.0Ti-3.1Mn O, S, Ti rich 10 67.9O-3.5Si-4.4S-21.1Ti-3.1Mn Ti Oxide 11 73O-1.9Al-6.9Si-1.0S-14.6Ti-2.7Mn O, Al, Si, Ti, Mn rich 12 55.1O-4.0Al-17.6Si-1.6S-3.6Ti-18.2Mn O, Si, Mn rich 13 55.9O-4.2Al-17.6Si-1.8S-2.4Ti-18.1 Mn O, Al, Si, Mn rich 14 Region A — 57.9O-4.6Al-17.4Si-1.9S-2.8Ti-15.5Mn Composite inclusion
Region B — 60.2O-1.7Al-2.2Si-0.6S-24.5-10.8 15 33.7O-2.3Al-15.4Si-3.5S-6.5Ti-38.7Mn O, Al, Si, S, Ti, Mn 16 53.7O-5.0Al-17.6Si-2.0S-4.1Ti-17.6Mn O, Al, Si, Ti, Mn rich 17 68.6O-0.9Al-15.6Si-1.5S-2.9Ti-10.5Mn O, Al, Si, S, Ti, Mn rich 18 80.6O-0.7Al-14.0Si-2.1S-2.6Ti O, Al, Si, S, Ti rich 19 Region A — 49.9O-10.9Si-1.1S-12.0Ti-26.2Mn O, Si, S, Ti, Mn rich
Region B — 49.3O-13.4Si-3.8S-3.9Ti-29.6Mn 20 12.1O-1.2Si-32.9S-53.8Mn O, Si, S, Mn rich 21 62.0O-9.8Si-0.7S-10.5Ti-17.0Mn O, Si, S, Ti, Mn rich 22 56.8O-1.9Al-16.0Si-2.1S-2.2Ti-21.1Mn O, Al, Si, S, Ti, Mn rich 23 47.0C-14.4N-10.9O-1.2Mg-2.0Al-24.5Zr Zr Carbo-Nitride - Al2O3 24 Region A — 23.0N-1.9Mn-7.9Al-66.6Zr-0.7Ti; Composite inclusion
Region B — 39.9N-23.4O-1.0Mg-30.3Al-5.4Zr 25 45.4C-14.6N-15.6O-0.8Al-23.9Zr Zr Carbo-Nitride 26 40.3C-13.0N-13.4O-1.7Mg-2.8Al-28.7Zr Zr Carbo-Nitride 27 Region A — 40.4O-10.9Mg-23.0Al-25.7Zr Composite inclusion
Region B — 48.9O-15.0Mg-36.1Al 28 Region A — 20.8N-33.2O-1.7Mg-1.6Al-42.7Zr Composite inclusion
Region B — 79.5O-20.5Zr Region A — 18.9N-29.2O-2.95Mg-3.0Al-46.0Zr Composite inclusion Region B — 17.2N-40.8O-3.8Mg-13.9Al-24.3Zr
29 11.2N-50.6O-14.2Mg-19.6Al-4.4Zr Composite inclusion 30 62.7O-3.4Mg-2.0Al-31.92Zr O, Mg, Al, Zr rich 31 56.0O-3.8Mg-29.5Al-10.8Zr O, Al, Mg, Zr rich 32 63.7O-36.3Si SiO2 33 59.3O-13.2Al-9.0.Si-6.1Ti-12.4Mn O, Al, Si, Ti, Mn rich 34 65.0O-10.0Al-5.9Si-6.7Ti-12.5Mn O, Al, Si, Ti, Mn rich 35 59.5O-10.4Al-13.8Si-2.3Ti-14.0Mn O, Al, Si, Ti, Mn rich 36 63.7O-5.3Al-5.2Si-11.1Ti-14.7Mn O, Al, Si, Ti, Mn rich

ACTA UNIVERSITATIS LAPPEENRANTAENSIS 473. HUHTANEN MIKKO. Software for design of experiments and response modelling of cake filtration
applications. 2012. Diss. 474. PARJANEN, SATU. Creating possibilities for collective creativity
Brokerage functions in practice-based innovation. 2012. Diss.
475. KUKKONEN, SAKU. Generalized differential evolution for global multi-objective optimization with constraints. 2012. Diss.
476. LAAKSONEN, JONNA. Tactile-proprioceptive robotic grasping. 2012. Diss. 477. KALLIO, ANNE. Enhancing absorptive capacity in a non-research and development context
An action research approach to converting individual observations into organizational awareness. 2012. Diss.
478. LÄTTILÄ, LAURI. Improving transportation and warehousing efficiency with simulation based deci-sion support systems. 2012. Diss.
479. OYOMNO, WERE. Usable privacy preservation in mobile electronic personality. 2012. Diss. 480. LINNALA, MIKKO. Simulation and optimization tools in paper machine concept design. 2012. Diss. 481. KORPIJÄRVI, JUHA. Aging based maintenance and reinvestment scheduling of electric distribution
network. 2012. Diss. 482. KORHONEN, JUHAMATTI. Active inverter output filtering methods. 2012. Diss. 483. KLODOWSKI, ADAM. Flexible multibody approach in bone strain estimation during physical activity:
quantifying osteogenic potential. 2012. Diss. 484. VUORENMAA, MARKKU. Osaamisen johtaminen pk-yrityksen kansainvälisen kasvun elinkaarella.
2012. Diss. 485. RAUTIAINEN, MARITA. Dynamic ownership in family business systems – a portfolio business ap-
proach. 2012. Diss. 486. LILIUS, REIJO. THE FINNISH IT INDUSTRIES IN TRANSITION Defining and measuring the Fin-
nish software product and IT services industries by applying theoretical frameworks . 2012. Diss. 487. TUOMINEN, PASI. The purpose of consumer co-operation: implications for the management and
governance of co-operatives. 2012. Diss. 488. SAARI, ESA. Suurnopeus-turbokoneroottoreiden termodynaaminen ja mekaaninen mallinnus sekä
rakenneanalyysi. 2012. Diss. 489. PAANANEN, MIKKO. On innovative search: the use of internal and external sources of innovation
among Finnish innovators. 2012. Diss. 490. BELOVA, POLINA. Quasiclassical approach to the vortex state in iron-based superconductors.
2012. Diss. 491. HIETANEN, IIRO. Design and characterization of large area position sensitive radiation detectors.
2012. Diss. 492. PÄSSILÄ, ANNE. A reflexive model of research-based theatre Processing innovation of the cross-
road of theatre, reflection and practice-based innovation activities. 2012. Diss.

493. RIIPINEN, TOMI. Modeling and control of the power conversion unit in a solid oxide fuel cell envi-
ronment. 2012. Diss. 494. RANTALAINEN, TUOMAS. Simulation of structural stress history based on dynamic analysis. 2012.
Diss. 495. SALMIMIES, RIINA. Acidic dissolution of iron oxides and regeneration of a ceramic filter medium.
2012. Diss. 496. VAUTERIN, JOHANNA JULIA. The demand for global student talent: Capitalizing on the value of
university-industry collaboration. 2012. Diss. 497. RILLA, MARKO. Design of salient pole PM synchronous machines for a vehicle traction application.
2012. Diss. 498. FEDOROVA, ELENA. Interdependence of emerging Eastern European stock markets. 2012. Diss. 499. SHAH, SRUJAL. Analysis and validation of space averaged drag model for numerical simulations of
gas-solid flows in fluidized beds. 2012. Diss. 500. WANG, YONGBO. Novel methods for error modeling and parameter identification of redundant hybr-
id serial-parallel robot. 2012. Diss. 501. MAXIMOV, ALEXANDER. Theoretical analysis and numerical simulation of spectral radiative proper-
ties of combustion gases in oxy/air-fired combustion systems. 2012. Diss. 502. KUTVONEN, ANTERO. Strategic external deployment of intellectual assets. 2012. Diss. 503. VÄISÄNEN, VESA. Performance and scalability of isolated DC-DC converter topologies in low vol-
tage, high current applications. 2012. Diss. 504. IKONEN, MIKA. Power cycling lifetime estimation of IGBT power modules based on chip tempera-
ture modeling. 2012. Diss. 505. LEIVO, TIMO. Pricing anomalies in the Finnish stock market. 2012. Diss. 506. NISKANEN, ANTTI. Landfill gas management as engineered landfills – Estimation and mitigation of
environmental aspects. 2012. Diss. 507. QIU, FENG. Surface transformation hardening of carbon steel with high power fiber laser. 2012.
Diss. 508. SMIRNOV, ALEXANDER. AMB system for high-speed motors using automatic commissioning.
2012. Diss. 509. ESKELINEN, HARRI, ed. Advanced approaches to analytical and systematic DFMA analysis. 2013. 510. RYYNÄNEN, HARRI. From network pictures to network insight in solution business – the role of in-
ternal communication. 2013. Diss. 511. JÄRVI, KATI. Ecosystem architecture design: endogenous and exogenous structural properties.
2013. Diss. 512. PIILI, HEIDI. Characterisation of laser beam and paper material interaction. 2013. Diss. 513. MONTO, SARI. Towards inter-organizational working capital management. 2013. Diss.