The Effects of Type 2 Diabetes on Lipoprotein Composition ... · apolipoprotein (apo) B containing...
10
The Effects of Type 2 Diabetes on Lipoprotein Composition and Arterial Stiffness in Male Youth Scott M. Gordon, 1 W. Sean Davidson, 1 Elaine M. Urbina, 2 Lawrence M. Dolan, 3 Anna Heink, 3 Huaiyu Zang, 4 L. Jason Lu, 4 and Amy S. Shah 3 Recent studies suggest HDL exists as numerous subpopulations with distinct protein/lipid compositions that are not reflected in the HDL cholesterol (HDL-C) number. In this study, we sought to evaluate HDL subpopulations in adolescents with type 2 diabetes (T2D) to determine if changes in HDL composition are associated with early vascular disease. T2D (n = 10), lean (n = 9), and obese (n = 11) youth were recruited. Plasma was fractionated using gel- filtration chromatography, and lipid-associated proteins were identified using mass spectrometry. Concurrently, vascular stiff- ness was assessed using pulse wave velocity (PWV). We found youth with T2D exhibited decreased phospholipid content in frac- tions containing large HDL particles that was inversely associated with PWV (P , 0.001). No association was noted between HDL-C and PWV. Proteomic analysis revealed changes in 7 of 45 identi- fied proteins in the T2D group, including apolipoprotein (apo) A-II, apoE, and paraoxonase-1 (P , 0.05). Our data demonstrate early changes in the lipid and protein compositions of specific HDL subspecies in adolescents with T2D that are related to early markers of arterial disease. These findings suggest that analyz- ing the composition of HDL, rather than HDL-C, may be useful in assessing cardiovascular risk in this population. Diabetes 62:2958–2967, 2013 T ype 2 diabetes (T2D) is a major risk factor for cardiovascular disease (CVD) (1), as ;70% of adults with T2D die of cardiovascular-related complications (2). A key feature linking diabetes to CVD is the presence of an atherogenic dyslipidemia characterized by reduced levels of HDL cholesterol (HDL- C) and increased concentrations of very LDLs (VLDLs) (3). While LDL cholesterol (LDL-C)–lowering therapy has proven effective for reducing CVD risk in adults with T2D, a higher than expected residual incidence of CVD remains in this group (4). Recent therapies aimed at reducing this residual CVD risk have focused on HDL because of its antiatherogenic properties. HDL is best recognized for its ability to shuttle excess cholesterol from peripheral tissues to the liver for excretion in the process of reverse cholesterol transport, likely contributing to the well-known inverse relationship between HDL-C and CVD. Additional cardioprotective roles for HDL have been identi fied that include anti- inflammatory, antioxidative, and antiapoptotic properties (5). Recent work suggests that the total pool of HDL within a given individual is actually composed of numerous HDL particle subpopulations with distinct protein and lipid compositions that are not fully represented by the HDL-C number. Proteomics studies consistently identify .50 dif- ferent proteins associated with HDL, suggesting each HDL particle may have a unique makeup that directs its specific function (6). These findings suggest that individuals pos- sess unique HDL portfolios that, when considered in total, may establish an individual’s risk for CVD. Previously, our group has used gel filtration chroma- tography to fractionate plasma and mass spectrometry (MS) to identify protein components of HDL subfractions. These results demonstrate HDL proteins exhibited distinct distribution patterns suggestive of proteomically distinct lipoprotein subspecies in healthy male adults (7). In this study, we examined the effects of T2D on the lipid and protein compositions of HDL subfractions in male youth. Additionally, we sought to relate compositional dif- ferences to early markers of vascular damage, carotid in- tima media thickness (IMT) and pulse wave velocity (PWV), that are known to predict cardiovascular events (8,9). We hypothesized that HDL lipid and protein composition would be altered in T2D and that these changes would be associ- ated with early markers of atherosclerosis. RESEARCH DESIGN AND METHODS Postpubertal adolescents and young adults ages 16–23 years old were recruited and seen at an in-person study visit at Cincinnati Children’s Hospital. Only males were considered to eliminate known differences in lipoproteins among sexes (10,11). Participants with T2D (n = 10) were classified as such based on the American Diabetes Association criteria (12), which included a fasting plasma glucose $126 mg/dL, a 2-h plasma glucose .200 mg/dL during an oral glucose tolerance test, or the classic symptoms of hyperglycemia (polyuria and polydipsia) and a random plasma glucose .200 mg/dL. Individuals with T2D were negative for GAD, islet cell autoantigen-512, and insulin autoanti- bodies (Barbara Davis Center, University of Colorado, Aurora, CO), indicating the absence of type 1 diabetes. Average duration of diabetes for the T2D group was 4 years 9 months. Antihyperglycemic therapies included metformin (n = 5) and insulin (n = 5). Two control groups were included to separate the effects of obesity from the effects of diabetes. Lean control participants (n = 9) lacked evidence of any chronic disease and either had a BMI less than the 85th percentile or ,25 if $20 years old. Obese control participants (n = 11) had a BMI greater than the 95th percentile or .30 if $20 years old. All obese participants underwent a 2-h oral glucose tolerance test to ensure they had no evidence of T2D (12). No participants were on lipid-lowering, antihypertensive therapy or had a history of smoking. All were normotensive. Written informed consent was obtained from participants $18 years old or the parent or guardian with written assent for participants ,18 years old. After a 10-h fast, blood was drawn. One aliquot was used for a fasting lipid panel and hemoglobin A1C. Measurements of total cholesterol (TC), HDL-C, and triglycerides (TGs) were performed enzymatically using a Roche Modular P analyzer (Roche). Determination of HDL-C was performed after precipitation of From the 1 Department of Pathology, University of Cincinnati College of Med- icine, Cincinnati, Ohio; the 2 Division of Cardiology, Cincinnati Children’s Hospital Medical Center, Cincinnati, Ohio; the 3 Division of Endocrinology, Cincinnati Children’s Hospital Medical Center, Cincinnati, Ohio; and the 4 Division of Biomedical Informatics, Cincinnati Children’s Hospital Medical Center, Cincinnati, Ohio. Corresponding author: Amy S. Shah, [email protected]. Received 13 December 2012 and accepted 15 April 2013. DOI: 10.2337/db12-1753 This article contains Supplementary Data online at http://diabetes .diabetesjournals.org/lookup/suppl/doi:10.2337/db12-1753/-/DC1. Ó 2013 by the American Diabetes Association. Readers may use this article as long as the work is properly cited, the use is educational and not for profit, and the work is not altered. See http://creativecommons.org/licenses/by -nc-nd/3.0/ for details. See accompanying commentary, p. 2662. 2958 DIABETES, VOL. 62, AUGUST 2013 diabetes.diabetesjournals.org ORIGINAL ARTICLE
Transcript of The Effects of Type 2 Diabetes on Lipoprotein Composition ... · apolipoprotein (apo) B containing...

The Effects of Type 2 Diabetes on LipoproteinComposition and Arterial Stiffness in Male YouthScott M. Gordon,
1W. Sean Davidson,
1Elaine M. Urbina,
2Lawrence M. Dolan,
3Anna Heink,
3
Huaiyu Zang,4L. Jason Lu,
4and Amy S. Shah
3
Recent studies suggest HDL exists as numerous subpopulationswith distinct protein/lipid compositions that are not reflected inthe HDL cholesterol (HDL-C) number. In this study, we sought toevaluate HDL subpopulations in adolescents with type 2 diabetes(T2D) to determine if changes in HDL composition are associatedwith early vascular disease. T2D (n = 10), lean (n = 9), and obese(n = 11) youth were recruited. Plasma was fractionated using gel-filtration chromatography, and lipid-associated proteins wereidentified using mass spectrometry. Concurrently, vascular stiff-ness was assessed using pulse wave velocity (PWV). We foundyouth with T2D exhibited decreased phospholipid content in frac-tions containing large HDL particles that was inversely associatedwith PWV (P , 0.001). No association was noted between HDL-Cand PWV. Proteomic analysis revealed changes in 7 of 45 identi-fied proteins in the T2D group, including apolipoprotein (apo)A-II, apoE, and paraoxonase-1 (P , 0.05). Our data demonstrateearly changes in the lipid and protein compositions of specificHDL subspecies in adolescents with T2D that are related to earlymarkers of arterial disease. These findings suggest that analyz-ing the composition of HDL, rather than HDL-C, may be usefulin assessing cardiovascular risk in this population. Diabetes62:2958–2967, 2013
Type 2 diabetes (T2D) is a major risk factor forcardiovascular disease (CVD) (1), as ;70% ofadults with T2D die of cardiovascular-relatedcomplications (2). A key feature linking diabetes
to CVD is the presence of an atherogenic dyslipidemiacharacterized by reduced levels of HDL cholesterol (HDL-C) and increased concentrations of very LDLs (VLDLs) (3).While LDL cholesterol (LDL-C)–lowering therapy hasproven effective for reducing CVD risk in adults with T2D,a higher than expected residual incidence of CVD remainsin this group (4).
Recent therapies aimed at reducing this residual CVDrisk have focused on HDL because of its antiatherogenicproperties. HDL is best recognized for its ability to shuttleexcess cholesterol from peripheral tissues to the liver forexcretion in the process of reverse cholesterol transport,likely contributing to the well-known inverse relationship
between HDL-C and CVD. Additional cardioprotectiveroles for HDL have been identified that include anti-inflammatory, antioxidative, and antiapoptotic properties (5).
Recent work suggests that the total pool of HDL withina given individual is actually composed of numerous HDLparticle subpopulations with distinct protein and lipidcompositions that are not fully represented by the HDL-Cnumber. Proteomics studies consistently identify .50 dif-ferent proteins associated with HDL, suggesting each HDLparticle may have a unique makeup that directs its specificfunction (6). These findings suggest that individuals pos-sess unique HDL portfolios that, when considered in total,may establish an individual’s risk for CVD.
Previously, our group has used gel filtration chroma-tography to fractionate plasma and mass spectrometry(MS) to identify protein components of HDL subfractions.These results demonstrate HDL proteins exhibited distinctdistribution patterns suggestive of proteomically distinctlipoprotein subspecies in healthy male adults (7).
In this study, we examined the effects of T2D on thelipid and protein compositions of HDL subfractions in maleyouth. Additionally, we sought to relate compositional dif-ferences to early markers of vascular damage, carotid in-tima media thickness (IMT) and pulse wave velocity (PWV),that are known to predict cardiovascular events (8,9). Wehypothesized that HDL lipid and protein composition wouldbe altered in T2D and that these changes would be associ-ated with early markers of atherosclerosis.
RESEARCH DESIGN AND METHODS
Postpubertal adolescents and young adults ages 16–23 years old were recruitedand seen at an in-person study visit at Cincinnati Children’s Hospital. Onlymales were considered to eliminate known differences in lipoproteins amongsexes (10,11). Participants with T2D (n = 10) were classified as such based onthe American Diabetes Association criteria (12), which included a fastingplasma glucose $126 mg/dL, a 2-h plasma glucose .200 mg/dL during an oralglucose tolerance test, or the classic symptoms of hyperglycemia (polyuriaand polydipsia) and a random plasma glucose .200 mg/dL. Individuals withT2D were negative for GAD, islet cell autoantigen-512, and insulin autoanti-bodies (Barbara Davis Center, University of Colorado, Aurora, CO), indicatingthe absence of type 1 diabetes. Average duration of diabetes for the T2D groupwas 4 years 9 months. Antihyperglycemic therapies included metformin (n = 5)and insulin (n = 5).
Two control groups were included to separate the effects of obesity from theeffects of diabetes. Lean control participants (n = 9) lacked evidence of anychronic disease and either had a BMI less than the 85th percentile or ,25 if$20 years old. Obese control participants (n = 11) had a BMI greater than the95th percentile or.30 if $20 years old. All obese participants underwent a 2-horal glucose tolerance test to ensure they had no evidence of T2D (12). Noparticipants were on lipid-lowering, antihypertensive therapy or had a historyof smoking. All were normotensive. Written informed consent was obtainedfrom participants $18 years old or the parent or guardian with written assentfor participants ,18 years old.
After a 10-h fast, blood was drawn. One aliquot was used for a fasting lipidpanel and hemoglobin A1C. Measurements of total cholesterol (TC), HDL-C,and triglycerides (TGs) were performed enzymatically using a RocheModular Panalyzer (Roche). Determination of HDL-Cwas performed after precipitation of
From the 1Department of Pathology, University of Cincinnati College of Med-icine, Cincinnati, Ohio; the 2Division of Cardiology, Cincinnati Children’sHospital Medical Center, Cincinnati, Ohio; the 3Division of Endocrinology,Cincinnati Children’s Hospital Medical Center, Cincinnati, Ohio; and the4Division of Biomedical Informatics, Cincinnati Children’s Hospital MedicalCenter, Cincinnati, Ohio.
Corresponding author: Amy S. Shah, [email protected] 13 December 2012 and accepted 15 April 2013.DOI: 10.2337/db12-1753This article contains Supplementary Data online at http://diabetes
.diabetesjournals.org/lookup/suppl/doi:10.2337/db12-1753/-/DC1.� 2013 by the American Diabetes Association. Readers may use this article as
long as the work is properly cited, the use is educational and not for profit,and the work is not altered. See http://creativecommons.org/licenses/by-nc-nd/3.0/ for details.
See accompanying commentary, p. 2662.
2958 DIABETES, VOL. 62, AUGUST 2013 diabetes.diabetesjournals.org
ORIGINAL ARTICLE

apolipoprotein (apo) B containing particles by dextran sulfate magnesium.LDL-C was calculated using the Friedewald equation or if TGs were.400 mg/dL,LDL-C was measured by direct assay. Hemoglobin A1C was measured inerythrocytes by using high-performance liquid chromatography.
A second aliquot was collected in a BD Vacutainer (BD Biosciences) usingcitrate as anticoagulant. Plasma was isolated by centrifugation and applied tothree Superdex 200 gel filtration columns (GE Healthcare) arranged in series aspreviously described (7). Eighteen collected fractions were analyzed forcholine-containing phospholipid (which is .90% of the phospholipid speciesin HDL (13) (Wako) and cholesterol (Pointe Scientific) content using colori-metric assays. Plasma was never frozen.
Detailed proteomic methods have been previously published (7). In brief,equal volumes of fraction were applied to a calcium silica hydrate phospho-lipid binding resin (Lipid Removal Agent; Supelco) to isolate lipoprotein par-ticles. Protein components were digested with trypsin while in contact withthe Lipid Removal Agent resin, and then peptide fragments were collected,reduced, and carbamidomethylated. Peptides were stored at 220°C until MSanalysis. Samples were injected onto a C-18 reverse-phase column (Grace218MS 150 3 0.500 mm, 5 mm) on line with an electrospray ionization time-of-flight mass spectrometer (QStar XL; Applied Biosystems). Acquired massspectra data, a surrogate for protein abundance (14), was scanned against theUniProtKB/Swiss-Prot Protein Knowledgebase (release 57.0, 03/2009) usingboth Mascot (version 2.1) and XTandem (version 2007.01.01.1) search enginesto identify proteins within the 18 fractions.
Positive protein identification required 90% confidence by Protein ProphetAlgorithm (15). Peptide counting was used to semiquantitate differences inproteins across fractions between groups (16). MS peptide counts were vali-dated to quantitative biochemical techniques: ELISA and Western blotting forthe common HDL proteins apoA-I and Western blot for apoE (SupplementaryFigs. 1 and 4). In no instance were peptide counts used to draw conclusionsabout the absolute quantity or concentration of a protein.
Following the blood draw, each participant underwent noninvasive arterialvessel imaging. Arterial thickness was evaluated in the carotid arteries usinghigh-resolution B-mode ultrasonography (GE Vivid 7; GE Healthcare) usinga 7.5-MHz linear array transducer. For each participant, the right and leftcommon carotid IMT from the far wall arteries were measured in millimetersand averaged. Images were read offline (Camtronic Medical System) usinga trace technique. Coefficients of variation for repeat readings were 4.1–5.3%.
Arterial stiffness was assessed by PWV using a SphygmoCor SCOR-PVxSystem (Atcor Medical, Sydney, Australia). The distance from a proximal artery(carotid) to distal artery recording site (femoral) was measured to the nearest0.1 cm twice and averaged. A tonometer was used to collect proximal and distalarterial waveforms gated by the R-wave on a simultaneously recorded elec-trocardiogram. PWV was then calculated as the distance from the carotid tofemoral arteries divided by the time delay measured between the feet of thetwo waveforms reported in meters per second (8). Carotid to femoral PWVrepresents aortic stiffness and is an index of arterial distensibility, and anincrease in PWV is associated with a future risk to develop coronary arterydisease and stroke (8). Three PWV recordings were obtained and averaged.Coefficient of variation for repeat measures is ,7% (17).
All data presented are mean 6 SE. Three-way group differences werecompared using one-way ANOVA. For proteomic data for which only two
groups were compared, two-tailed Student t test with unequal variance wasused. Bonferroni corrections were used to correct phospholipid, cholesterol,and proteomic data for multiple comparisons. A P value ,0.05 was consideredstatistically significant.
In general, there were lower peptide counts for most of the detected proteinsin the T2D versus lean group. Therefore, we devised a peptide count adjustmentprocedure to normalize the bulk of peptide counts across all groups. For eachprotein, an adjustment factor was calculated by dividing the T2D peptide countsby the lean counts. The averaged adjustment factor (1.42) from all identifiedproteins was multiplied by the raw T2D counts in each fraction to derive anadjusted peptide count. An example of this adjustment is shown in Supple-mentary Fig. 2. Then a two-tailed t test with Bonferroni corrections was per-formed to identify differences that were beyond those resulting from a generaldecrease in T2D plasma proteins.
RESULTS
Study population. The clinical characteristics of thestudy cohort are listed in Table 1. The three groups weresimilar in age with no significant differences in bloodpressure or LDL-C. Significant differences were seenacross the groups in BMI, TC, TGs, and HDL-C (P , 0.05).Compared with lean and obese youth, T2D youth had themost deleterious clinical lipid profiles with higher TC andTGs and lower HDL-C, consistent with previous reports inT2D youth (17,18). PWV was statistically different acrossgroups, with the T2D group having the highest PWV, in-dicating increased arterial stiffness, findings similar tothose seen in larger studies (17). There were no differ-ences in the common carotid IMT. Lack of carotid IMTdifferences are likely due to a small number of participantsor because changes in carotid IMT may reflect more ad-vanced arterial pathology compared with changes in PWV(19). Due to the lack of carotid IMT differences betweengroups, no further analyses were conducted using thisoutcome.Lipoprotein profiles. The phospholipid and cholesteroldistributions across the 18 lipid-containing plasma gel fil-tration fractions are shown in Fig. 1. In this technique,LDL/VLDL-sized particles migrate together in peak 1(fractions 14–18), and HDL particles are broadly distrib-uted across peak 2 (fractions 19–30), as the technique isoptimized to spread particles in the HDL size range (7).There were no differences in the LDL/VLDL fractions.Youth with T2D exhibited the lowest phospholipid contentin the larger HDL containing fractions 22 to 23, and thiswas statistically lower compared with both lean and obese
TABLE 1Study cohort
Variable Lean Obese T2D P value
n 9 11 10 —
Age (years) 21.8 6 0.9 22.2 6 0.8 21.5 6 0.8 0.831BMI (mg/kg2) 23.8 6 1.7 35.4 6 1.5 37.8 6 1.6 ,0.001TC (mg/dL) 157 6 14 187 6 13 211 6 13 0.031TGs (mg/dL) 78 6 63 105 6 57 286 6 59 0.042HDL-C (mg/dL) 50 6 3 44 6 3 33 6 3 0.001LDL-C (mg/dL) 90 6 13 122 6 12 124 6 13 0.128Systolic blood pressure (mmHg) 116 6 4 120 6 3 119 6 4 0.741Diastolic blood pressure (mmHg) 72 6 3 77 6 2 73 6 2 0.335PWV (m/s) 5.81 6 0.33 5.81 6 0.14 7.16 6 0.33 0.002Carotid IMT (mm) 0.48 6 0.03 0.56 6 0.02 0.53 6 0.03 0.102Hemoglobin A1C (%) NA 5.0 6 0.11 9.5 6 1.6 0.046Hemoglobin A1C (mmol/mol) 31 6 3.2 80 6 17.5
Data are mean and SE. P value indicates differences across the three groups using ANOVA, except for hemoglobin A1C, where t test was used.NA, not available.
S.M. GORDON AND ASSOCIATES
diabetes.diabetesjournals.org DIABETES, VOL. 62, AUGUST 2013 2959

groups (P , 0.05). The obese group tended to have thehighest cholesterol content in the large HDL fractions(though not statistically different), while the T2D grouphad the highest cholesterol content in the fractions con-taining small HDL, fractions 25–29 (P , 0.05 comparedwith lean group). These results are surprising given thatthe clinical measure of HDL-C (Table 1) indicated thehighest cholesterol content in the lean group, followed bythe obese and the lowest content in the T2D group. Thedisparity likely involves inherent differences between thegel-filtration separation and the clinical apoB precipitationmethodologies for assessment of HDL-C. Taken together,the phospholipid and cholesterol distributions indicatethat individuals with obesity and T2D generally havesmaller HDL particles that are enriched in cholesterolrelative to phospholipid, while lean adolescents exhibita population of larger, more phospholipid-rich HDL par-ticles, particularly in fractions 21–24.Clinical lipids and arterial stiffness. We first deter-mined if commonly used clinical lipid measures were as-sociated with arterial stiffness measurements in thiscohort. Univariate correlations between PWV and TC,LDL-C, and HDL-C are shown in Fig. 2. While a weakcorrelation was found between TC and PWV (Fig. 2A),there was no clear association between the clinical lipidmeasures of LDL-C or HDL-C and PWV (Fig. 2B and C).
Lipoproteins and arterial stiffness. Next, we sought todetermine if lipoprotein size subfractions from our gel fil-tration analysis were associated with PWV. Figure 3 showsthe correlation coefficients of PWV versus phospholipidcontent for each individual fraction with statistically sig-nificant correlation values (P , 0.05) falling outside thedotted lines. Combining all patients (n = 30), Fig. 3A showsthat the phospholipid content of LDL/VLDL fractions 14,15, and 16 and smaller HDL fractions 25, 26, and 27 weresignificantly and positively correlated with PWV, whilelarger HDL fractions 21, 22, and 23 were negatively cor-related (P , 0.05). Similar relationships were identified forthe cholesterol content (Supplementary Fig. 3), though thecorrelations with phospholipid content were stronger.When the same analysis was performed on data from thelean participants only (Fig. 3B), a similar pattern of cor-relations was apparent. However, in the obese and T2Dgroups (Fig. 3C and D), the correlations in the largephospholipid-rich HDL fractions 21–24 disappear. This wasparticularly striking in the T2D group because these par-ticipants effectively lack these particles.
The univariate correlations for the most significantfractions in each of the regions identified in Fig. 3A areshown in a scatterplot in Fig. 3E and G. The phospholipidconcentrations among the lean, obese, and T2D groupoverlap significantly in the VLDL/LDL (fraction 15, Fig. 3E)
FIG. 1. Lipid distribution profiles for all lean (green), obese (blue), and T2D (red) participants. Panel A displays the phospholipid content acrossthe multiple size-based plasma fractions. Panel B displays the cholesterol content across the multiple size-based plasma fractions. Data are meanand SE. *P < 0.05 between lean and T2D groups; #P < 0.05 between obese and T2D groups after corrections for multiple comparisons.
LIPOPROTEINS IN YOUTH WITH TYPE 2 DIABETES
2960 DIABETES, VOL. 62, AUGUST 2013 diabetes.diabetesjournals.org

and smaller HDL fractions (fraction 26, Fig. 3G). However,in the large HDL fraction (fraction 22, Fig. 3B), there isa well-defined breakpoint. All T2D participants exhibited,0.01 mg/mL phospholipid in this fraction. By contrast, alllean individuals and most in the obese group were abovethis threshold. In summary, the above indicate that: 1) thephospholipid content of fractions better predicted in-creased PWV compared with the clinical lipid measure-ments; and 2) the strongest association appears to be theinverse relationship between larger HDL fractions and PWV.Proteomics. We next set out to determine the proteomicmakeup of the fractionated lipoproteins. Given the laborintensity associated with conducting proteomic studies,only the lean and T2D groups were analyzed. Across allfractions and all participants, we identified 45 lipid-associatedproteins using our previous criteria (7). Nearly all proteinswere detected in both groups, with only two that wereunique to the lean group, serum amyloid A (SAA) andserotransferrin. Figure 4 shows that, compared with leanparticipants, youth with T2D exhibited decreased peptidecounts for most of the identified proteins, including themajor HDL protein apoA-I. This is consistent with theoverall lower amount of phospholipid that we detected in
the HDL fractions of T2D versus lean groups (Fig. 1A) andthe lower plasma HDL-C measured in the clinical assay(Table 1).
Figure 5A–C shows several examples of clear proteinabundance differences between the T2D and lean groupsamong the HDL fractions, while Fig. 5D–F shows distri-bution profiles for some examples of proteins that wereclearly similar. One of the most striking differences wasapoE, which was found in larger HDL species in leanindividuals, but its peptide counts were reduced nearlyfivefold and shifted toward smaller HDL particles in theT2D group. Confirmation of this finding by Western blot isshown in Supplementary Fig. 4. ApoA-II and paraoxonase-1 (PON1) also showed an overall lower peptide count inthe T2D group.
We attempted to correlate PON1 by MS with plasmaPON1 activity. However, the activity level in our fractionswas below the limit of detection of the assay (Invitrogen).Therefore, we compared whole plasma PON activity in thelean and T2D groups. We found no significant difference inwhole plasma PON activity between groups (lean, 22.5 64.96; T2D, 23.0 6 5.80 U/mL; P = 0.86). Potential expla-nations for these results include: 1) youth with T2D have
FIG. 2. Correlations of standard clinical lipid measures with PWV. TC (A), LDL-C (B), and HDL-C (C). Green diamonds, lean; blue triangles, obese;red squares, T2D.
S.M. GORDON AND ASSOCIATES
diabetes.diabetesjournals.org DIABETES, VOL. 62, AUGUST 2013 2961

similar amounts of PON1, but the enzyme undergoes a shiftin its HDL size distribution in diabetes; or 2) PON1 under-goes a posttranslational modification in diabetes (i.e.,glycation that reduces its detection by MS).
We noted no protein differences within the LDL/VLDLcontaining fractions (data not shown). We caution that ourtechniques are not optimized for LDL/VLDL analysis. Figure 6shows the P values resulting from a t test comparison ofthe total peptide counts measured in lean participants ver-sus the adjusted values from the T2D group. Statisticallysignificant differences are noted in gray after stringentBonferroni corrections. Differences without Bonferronicorrections are shown in Supplementary Fig. 5. Across allfractions, we noted significant differences in seven proteinsin the T2D versus the lean group. Interestingly, a majority ofthese changes occurred in fraction 22, the same fractionthat exhibited significant reductions in phospholipid in theT2D group (and was inversely correlated with PWV).
DISCUSSION
The hypothesis driving this study states that specific HDLsubpopulations may contribute to early atherosclerosis in
the setting of T2D. If this idea is correct, then identificationof specific altered lipoprotein subpopulations could lead tobetter, early biomarkers for assessing CVD risk in T2D.Using a plasma fractionation technique previously de-scribed by our laboratory (7), we correlated lipoproteinsubfractions with early arterial dysfunction in youth withT2D.
Before discussing the implications of our findings, it isworthwhile to clarify some issues surrounding lipoproteinnomenclature. Lipoproteins are most commonly isolatedby density ultracentrifugation, and the major classes, HDLand LDL, have been historically defined by their density(20). We elected to analyze lipoproteins by size throughgel-filtration chromatography because we and others havenoted fewer alterations in particle proteome comparedwith ultracentrifugation (6,7). Although lipoprotein sizeand density are roughly inversely correlated, there areexceptions to this rule (21). Thus, in order to relate our gel-filtration results to traditional density-centric definitions,we use the presence of apoB, the core constituent of LDL,as the key distinguisher. Therefore, the VLDL/LDL range isdefined as fractions 14–18 due to the presence of apoB. Weassigned the remaining fractions 19–30 as the HDL range
FIG. 3. Correlations of phospholipid fractions with PWV. A displays the correlation value (r) for all participants (black), B for lean (green), C forobese (blue), and D for T2D (red). Outer dotted lines indicate r values of P < 0.05. Panels E–G display individual fractions with the strongestcorrelations with PWV: fraction 16 (E), fraction 22 (F), and fraction 26 (G).
LIPOPROTEINS IN YOUTH WITH TYPE 2 DIABETES
2962 DIABETES, VOL. 62, AUGUST 2013 diabetes.diabetesjournals.org

because their diameters are consistent with measurementsfor density-isolated HDL and because of the abundanceof the major HDL protein apoA-I.
In this study, we noted a lack of correlation between theclassical measures of TC, LDL-C, or HDL-C and PWV. This
lack of association has also been noted in larger studies(17) and suggests that these measures are not robustenough to predict CVD risk in individuals. However, ourresults clearly identify specific lipoprotein size populationsthat strongly correlate with early vascular stiffness, despite
FIG. 4. The average phospholipid-associated proteins in the lean and T2D groups.
S.M. GORDON AND ASSOCIATES
diabetes.diabetesjournals.org DIABETES, VOL. 62, AUGUST 2013 2963
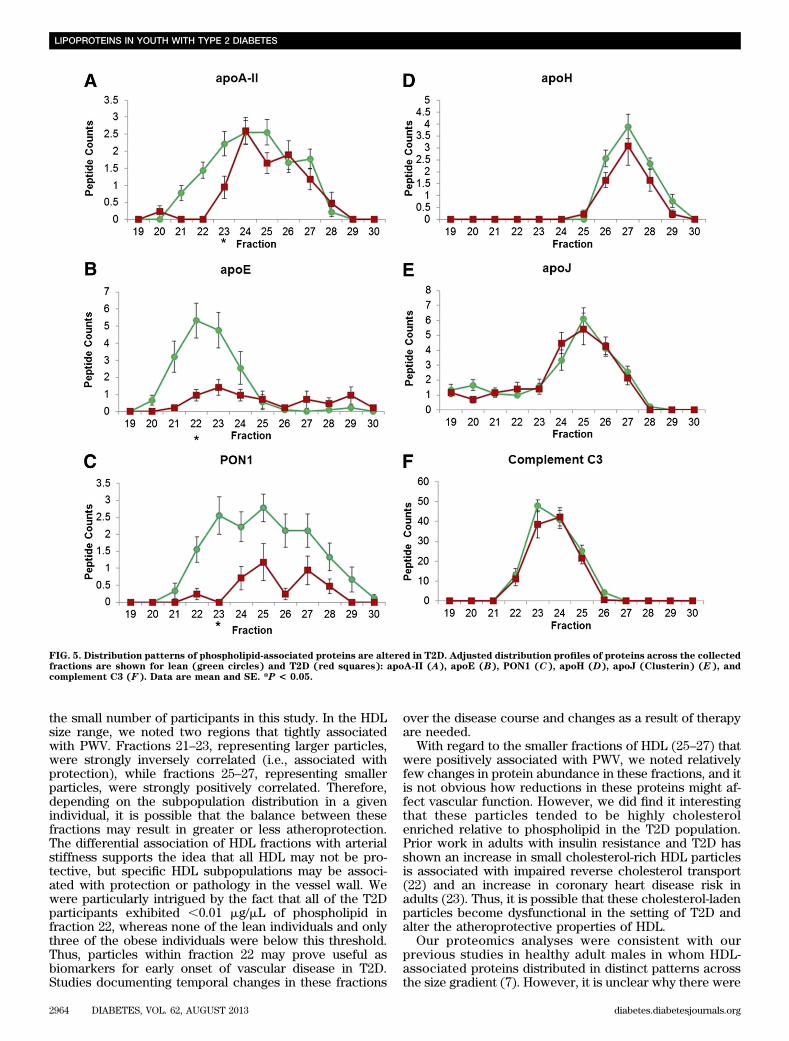
the small number of participants in this study. In the HDLsize range, we noted two regions that tightly associatedwith PWV. Fractions 21–23, representing larger particles,were strongly inversely correlated (i.e., associated withprotection), while fractions 25–27, representing smallerparticles, were strongly positively correlated. Therefore,depending on the subpopulation distribution in a givenindividual, it is possible that the balance between thesefractions may result in greater or less atheroprotection.The differential association of HDL fractions with arterialstiffness supports the idea that all HDL may not be pro-tective, but specific HDL subpopulations may be associ-ated with protection or pathology in the vessel wall. Wewere particularly intrigued by the fact that all of the T2Dparticipants exhibited ,0.01 mg/mL of phospholipid infraction 22, whereas none of the lean individuals and onlythree of the obese individuals were below this threshold.Thus, particles within fraction 22 may prove useful asbiomarkers for early onset of vascular disease in T2D.Studies documenting temporal changes in these fractions
over the disease course and changes as a result of therapyare needed.
With regard to the smaller fractions of HDL (25–27) thatwere positively associated with PWV, we noted relativelyfew changes in protein abundance in these fractions, and itis not obvious how reductions in these proteins might af-fect vascular function. However, we did find it interestingthat these particles tended to be highly cholesterolenriched relative to phospholipid in the T2D population.Prior work in adults with insulin resistance and T2D hasshown an increase in small cholesterol-rich HDL particlesis associated with impaired reverse cholesterol transport(22) and an increase in coronary heart disease risk inadults (23). Thus, it is possible that these cholesterol-ladenparticles become dysfunctional in the setting of T2D andalter the atheroprotective properties of HDL.
Our proteomics analyses were consistent with ourprevious studies in healthy adult males in whom HDL-associated proteins distributed in distinct patterns acrossthe size gradient (7). However, it is unclear why there were
FIG. 5. Distribution patterns of phospholipid-associated proteins are altered in T2D. Adjusted distribution profiles of proteins across the collectedfractions are shown for lean (green circles) and T2D (red squares): apoA-II (A), apoE (B), PON1 (C), apoH (D), apoJ (Clusterin) (E), andcomplement C3 (F). Data are mean and SE. *P < 0.05.
LIPOPROTEINS IN YOUTH WITH TYPE 2 DIABETES
2964 DIABETES, VOL. 62, AUGUST 2013 diabetes.diabetesjournals.org

overall reduced levels of nearly all proteins detected inthe T2D group. One possible explanation is that there isan enrichment of unstable TG-rich HDL particles thesetting of T2D (24), which resulted in decreased recoveryof proteins from the calcium silica hydrate phospholipid-binding resin. Another possibility is that there are post-translational modifications of plasma proteins in personswith diabetes that result in fewer peptide counts. UsingMascot and XTandem, we searched for known oxidation,carbamylation, phosphorylation, and glycosyl modi-fications, and none were detected. This does not elimi-nate the possibility of nonenzymatic glycation, nitration,or chlorination modifications of proteins as a result ofdiabetes (25). Because we cannot be sure of the reasonfor the lower peptide counts, we normalized based onpeptide counts taken from all detected proteins, ratherthan normalizing to one protein such as apoA-I. While thisrather conservative approach likely reduced our ability todetect some protein differences between groups, thelikelihood that detected differences were real is in-creased, particularly since Bonferroni corrections weretaken into consideration in the statistics. We identified
seven proteins that underwent abundance or size distri-bution changes. Interestingly, most of these changescorresponded with the fractions 22 to 23 that were nega-tively associated with PWV. One of the most striking wasapoE, which underwent a nearly fivefold reduction inpeptide counts.
ApoE is widely distributed on VLDLs, LDLs, and HDLs inhuman plasma and is known to associate with larger HDLparticles. Genetic ablation of apoE in mice is well-knownto cause a variety of vascular phenotypes including ath-erosclerosis (26), endothelial dysfunction (27), and vas-cular remodeling and restenosis (28). Recent workdemonstrates that large apoE-rich HDL may interferewith LDL binding to proteoglycans (PGs) in the vesselwall in humans (29). Entrapment of LDL by PG triggersinflammation, causing atherosclerosis (30). Decreasedcontent of large HDL particles in adults with T2D isthought to facilitate LDL–PG binding and contribute toincreased atherosclerosis in T2D. Our results are con-sistent with this idea.
Another protein that exhibited decreases in the HDLparticle size range was PON1. This is a serum esterase that
FIG. 6. Comparison of adjusted total peptide counts in the lean versus T2D groups across the HDL size distribution. Significant protein differencesof P < 0.05 (after Bonferroni corrections) are shaded in gray.
S.M. GORDON AND ASSOCIATES
diabetes.diabetesjournals.org DIABETES, VOL. 62, AUGUST 2013 2965

hydrolyzes organophosphates and has been shown bynumerous studies to play an important role in the pre-vention and scavenging of lipid peroxidation in LDLs (31).PON1 has been implicated in the severity of atheroscle-rosis in T2D adults (32) and may protect against diabetesvia antioxidative effects and/or through effects on insulinsecretion (33). Its activity is reduced in T2D, though thismay be due to reductions in specific activity rather thanlower serum concentrations (34).
ApoM was also lower in the larger HDL-sized particlesin the T2D group, consistent with whole plasma reduc-tions of ;10% noted by others (35). Karuna et al. (36)recently found that apoM mediates the enrichment ofsphingosine-1-phosphate content in HDLs, which isknown to promote arterial vasodilation by stimulatingendothelial nitric oxide production and inhibiting monocyterecruitment into the intima. Additionally, transgenic over-expression of apoM in mice leads to reduced atheroscle-rotic lesions, possibly by facilitating HDL remodeling,increased cholesterol efflux (37), or generating atheropro-tective pre-b forms of HDL (35).
Two proteins were found in only our lean group, SAAand serotransferrin. While chronically elevated levels ofSAA are associated with an increased risk for CVD (38),low levels are present in healthy individuals (7). Thus, thelow SAA presence in two lean individuals may reflect mildnonobesity or diabetes-related inflammation. Serotransferrinis a major iron-binding protein that is known to associatewith HDL (39). HDL containing serotransferrin inhibits invitro oxidation of LDL by copper, suggesting an athero-protective role for the protein (40), which explains itspresence in lean persons.
While it is tempting to speculate that the lipoprotein sizefractions identified in this study may be directly involvedin either vascular protection or pathology, we caution thatour data are purely correlative at this point. We do notknow if the identified particle populations are causative orare byproducts. Nevertheless, the strong correlations ofthe size subpopulations with arterial stiffness are clear,and we believe that our data strongly justify efforts to bio-chemically identify the specific particles that are changingin the early stages of diabetes.
ACKNOWLEDGMENTS
This research was supported by a Cincinnati Diabetes andObesity Center Research Award.
No potential conflicts of interest relevant to this articlewere reported.
S.M.G. performed data collection and statistical anal-ysis and wrote the manuscript. W.S.D. designed the studyand reviewed the manuscript. E.M.U. and L.M.D. helpedin study design and reviewed the manuscript. L.J.L.performed statistical analysis. A.H. performed the ex-periments and reviewed the manuscript. H.Z. helped inthe statistical analysis. A.S.S. designed the study, per-formed statistical analysis, and wrote the manuscript.A.S.S. is the guarantor of this work and, as such, had fullaccess to all the data in the study and takes responsibilityfor the integrity of the data and the accuracy of the dataanalysis.
Parts of this work were presented in abstract form at theArteriosclerosis, Thrombosis, and Vascular Biology 2013Scientific Sessions, Lake Buena Vista, Florida, 1–3 May2013 and the 73rd Scientific Sessions of the American Di-abetes Association, Chicago, Illinois, 21–25 June 2013.
REFERENCES
1. Grundy SM, Garber A, Goldberg R, et al. Prevention Conference VI: Di-abetes and Cardiovascular Disease: Writing Group IV: lifestyle and medicalmanagement of risk factors. Circulation 2002;105:e153–e158
2. Panzram G. Mortality and survival in type 2 (non-insulin-dependent) di-abetes mellitus. Diabetologia 1987;30:123–131
3. Adiels M, Olofsson SO, Taskinen MR, Borén J. Diabetic dyslipidaemia.Curr Opin Lipidol 2006;17:238–246
4. Fruchart JC, Sacks FM, Hermans MP, et al.; Residual Risk Reduction Ini-tiative (R3I). The Residual Risk Reduction Initiative: a call to action toreduce residual vascular risk in dyslipidaemic patient. Diab Vasc Dis Res2008;5:319–335
5. Gordon SM, Hofmann S, Askew DS, et al. High density lipoprotein: it’s notjust about lipid transport anymore. Trends Endocrinol Metab 2011;22:9–15
6. Gordon S, Durairaj A, Lu JL, Davidson WS. High-density lipoprotein pro-teomics: Identifying new drug targets and biomarkers by understandingfunctionality. Curr Cardiovasc Risk Rep 2010;4:1–8
7. Gordon SM, Deng J, Lu LJ, Davidson WS. Proteomic characterization ofhuman plasma high density lipoprotein fractionated by gel filtrationchromatography. J Proteome Res 2010;9:5239–5249
8. Laurent S, Cockcroft J, Van Bortel L, et al.; European Network for Non-invasive Investigation of Large Arteries. Expert consensus document onarterial stiffness: methodological issues and clinical applications. EurHeart J 2006;27:2588–2605
9. Bots ML, Hoes AW, Koudstaal PJ, Hofman A, Grobbee DE. Common ca-rotid intima-media thickness and risk of stroke and myocardial infarction:the Rotterdam Study. Circulation 1997;96:1432–1437
10. Johnson JL, Slentz CA, Duscha BD, et al. Gender and racial differences inlipoprotein subclass distributions: the STRRIDE study. Atherosclerosis2004;176:371–377
11. Pascot A, Lemieux I, Bergeron J, et al. HDL particle size: a marker of thegender difference in the metabolic risk profile. Atherosclerosis 2002;160:399–406
12. American Diabetes Association. Standards of medical care in diabetes—2012. Diabetes Care 2012;35(Suppl. 1):S11–S63
13. Skipski VP, Barclay M, Barclay RK, Fetzer VA, Good JJ, Archibald FM. Lipidcomposition of human serum lipoproteins. Biochem J 1967;104:340–352
14. Liu H, Sadygov RG, Yates JR 3rd. A model for random sampling and es-timation of relative protein abundance in shotgun proteomics. Anal Chem2004;76:4193–4201
15. Nesvizhskii AI, Keller A, Kolker E, Aebersold R. A statistical model foridentifying proteins by tandem mass spectrometry. Anal Chem 2003;75:4646–4658
16. Vaisar T, Pennathur S, Green PS, et al. Shotgun proteomics implicatesprotease inhibition and complement activation in the antiinflammatoryproperties of HDL. J Clin Invest 2007;117:746–756
17. Urbina EM, Kimball TR, Khoury PR, Daniels SR, Dolan LM. Increased ar-terial stiffness is found in adolescents with obesity or obesity-related type2 diabetes mellitus. J Hypertens 2010;28:1692–1698
18. Urbina EM, Kimball TR, McCoy CE, Khoury PR, Daniels SR, Dolan LM.Youth with obesity and obesity-related type 2 diabetes mellitus demon-strate abnormalities in carotid structure and function. Circulation 2009;119:2913–2919
19. Koivistoinen T, Virtanen M, Hutri-Kähönen N, et al. Arterial pulse wavevelocity in relation to carotid intima-media thickness, brachial flow-mediateddilation and carotid artery distensibility: the Cardiovascular Risk inYoung Finns Study and the Health 2000 Survey. Atherosclerosis 2012;220:387–393
20. Lindgren FT, Elliott HA, Gofman JW. The ultracentrifugal characterizationand isolation of human blood lipids and lipoproteins, with applications tothe study of atherosclerosis. J Phys Colloid Chem 1951;55:80–93
21. Terasaka N, Westerterp M, Koetsveld J, et al. ATP-binding cassettetransporter G1 and high-density lipoprotein promote endothelial NO syn-thesis through a decrease in the interaction of caveolin-1 and endothelialNO synthase. Arterioscler Thromb Vasc Biol 2010;30:2219–2225
22. Garvey WT, Kwon S, Zheng D, et al. Effects of insulin resistance and type2 diabetes on lipoprotein subclass particle size and concentration de-termined by nuclear magnetic resonance. Diabetes 2003;52:453–462
23. Arsenault BJ, Lemieux I, Després JP, et al. HDL particle size and the risk ofcoronary heart disease in apparently healthy men and women: the EPIC-Norfolk prospective population study. Atherosclerosis 2009;206:276–281
24. Hopkins GJ, Barter PJ. Role of triglyceride-rich lipoproteins and hepaticlipase in determining the particle size and composition of high densitylipoproteins. J Lipid Res 1986;27:1265–1277
25. Ahmed N, Babaei-Jadidi R, Howell SK, Beisswenger PJ, Thornalley PJ.Degradation products of proteins damaged by glycation, oxidation
LIPOPROTEINS IN YOUTH WITH TYPE 2 DIABETES
2966 DIABETES, VOL. 62, AUGUST 2013 diabetes.diabetesjournals.org

and nitration in clinical type 1 diabetes. Diabetologia 2005;48:1590–1603
26. Zhang SH, Reddick RL, Piedrahita JA, Maeda N. Spontaneous hypercho-lesterolemia and arterial lesions in mice lacking apolipoprotein E. Science1992;258:468–471
27. Yang R, Powell-Braxton L, Ogaoawara AK, et al. Hypertension and endo-thelial dysfunction in apolipoprotein E knockout mice. ArteriosclerThromb Vasc Biol 1999;19:2762–2768
28. Ali ZA, Alp NJ, Lupton H, et al. Increased in-stent stenosis in ApoEknockout mice: insights from a novel mouse model of balloon angioplastyand stenting. Arterioscler Thromb Vasc Biol 2007;27:833–840
29. Umaerus M, Rosengren B, Fagerberg B, Hurt-Camejo E, Camejo G. HDL2interferes with LDL association with arterial proteoglycans: a possibleathero-protective effect. Atherosclerosis 2012;225:115–120
30. Hurt E, Bondjers G, Camejo G. Interaction of LDL with human arterialproteoglycans stimulates its uptake by human monocyte-derived macro-phages. J Lipid Res 1990;31:443–454
31. Mackness MI, Arrol S, Durrington PN. Paraoxonase prevents accumulationof lipoperoxides in low-density lipoprotein. FEBS Lett 1991;286:152–154
32. Tartan Z, Orhan G, Kasikçioglu H, et al. The role of paraoxonase (PON)enzyme in the extent and severity of the coronary artery disease in type-2diabetic patients. Heart Vessels 2007;22:158–164
33. Koren-Gluzer M, Aviram M, Meilin E, Hayek T. The antioxidant HDL-associated paraoxonase-1 (PON1) attenuates diabetes development andstimulates b-cell insulin release. Atherosclerosis 2011;219:510–518
34. Abbott CA, Mackness MI, Kumar S, Boulton AJ, Durrington PN. Serumparaoxonase activity, concentration, and phenotype distribution in di-abetes mellitus and its relationship to serum lipids and lipoproteins. Ar-terioscler Thromb Vasc Biol 1995;15:1812–1818
35. Plomgaard P, Dullaart RP, de Vries R, Groen AK, Dahlbäck B, Nielsen LB.Apolipoprotein M predicts pre-beta-HDL formation: studies in type 2 di-abetic and nondiabetic subjects. J Intern Med 2009;266:258–267
36. Karuna R, Park R, Othman A, et al. Plasma levels of sphingosine-1-phosphateand apolipoprotein M in patients with monogenic disorders of HDL me-tabolism. Atherosclerosis 2011;219:855–863
37. Christoffersen C, Jauhiainen M, Moser M, et al. Effect of apolipoproteinM on high density lipoprotein metabolism and atherosclerosis in lowdensity lipoprotein receptor knock-out mice. J Biol Chem 2008;283:1839–1847
38. Johnson BD, Kip KE, Marroquin OC, et al.; National Heart, Lung, andBlood Institute. Serum amyloid A as a predictor of coronary artery diseaseand cardiovascular outcome in women: the National Heart, Lung, andBlood Institute-Sponsored Women’s Ischemia Syndrome Evaluation(WISE). Circulation 2004;109:726–732
39. Rezaee F, Casetta B, Levels JH, Speijer D, Meijers JC. Proteomic analysisof high-density lipoprotein. Proteomics 2006;6:721–730
40. Kunitake ST, Jarvis MR, Hamilton RL, Kane JP. Binding of transitionmetals by apolipoprotein A-I-containing plasma lipoproteins: inhibition ofoxidation of low density lipoproteins. Proc Natl Acad Sci USA 1992;89:6993–6997
S.M. GORDON AND ASSOCIATES
diabetes.diabetesjournals.org DIABETES, VOL. 62, AUGUST 2013 2967