the effects of student attendance on student achievement
103
THE IMPACT OF STUDENT ATTENDANCE, SOCIO-ECONOMIC STATUS AND MOBILITY ON STUDENT ACHIEVEMENT OF THIRD GRADE STUDENTS IN TITLE I SCHOOLS By Doris Jean Jones Dissertation submitted to the Faculty of the Virginia Polytechnic Institute and State University In partial fulfillment of the requirements for the degree of DOCTOR OF EDUCATION IN LEADERSHIP AND POLICY STUDIES Travis W. Twiford, Chair Rose Martin James Rayfield James Roberts April 7, 2006 Blacksburg, Virginia Keywords: Student Attendance, Socio-economic Status Mobility and Student Achievement
Transcript of the effects of student attendance on student achievement

THE IMPACT OF STUDENT ATTENDANCE, SOCIO-ECONOMIC STATUS AND
MOBILITY ON STUDENT ACHIEVEMENT OF THIRD GRADE STUDENTS IN
TITLE I SCHOOLS
By
Doris Jean Jones
Dissertation submitted to the Faculty of the
Virginia Polytechnic Institute and State University
In partial fulfillment of the requirements for the degree of
DOCTOR OF EDUCATION IN LEADERSHIP
AND POLICY STUDIES
Travis W. Twiford, Chair
Rose Martin
James Rayfield
James Roberts
April 7, 2006
Blacksburg, Virginia
Keywords: Student Attendance, Socio-economic Status
Mobility and Student Achievement

THE IMPACT OF STUDENT ATTENDANCE SOCIO-ECONOMIC STATUS AND
MOBILITY ON STUDENT ACHIEVEMENT OF THIRD GRADE STUDENTS IN TITLE
I SCHOOLS
By
Doris Jean Jones
Abstract
Today, regular school attendance is an important factor in school success (Rothman,
2001). Research has shown a direct correlation between good attendance and
student achievement (Dekalb, 1999). Poor attendance has been linked to poor
academic achievement (Ziegler, 1972). With the increase in accountability for school
districts in Virginia surrounding the Standards of Learning (SOL) test and the No
Child Left Behind (NCLB) legislation of 2001, educators are faced with a significant
challenge to reduce the rate of absenteeism to increase students’ achievement in
school. “Students who are absent from school receive fewer hours of instruction; they
often leave education early and are more likely to become long term unemployed,
homeless, caught in the poverty trap, dependent on welfare and involved in the
justice system” (House of Representatives, 1996 p. 3). Researchers have sought to
find factors that contribute to student non-attendance (Odell, 1923; Reid, 1999;
Mitchell, 1993). This study investigates the impact of student attendance, socio-
economic status and mobility on student achievement of third grade students in two
Title I schools in a Southeastern Virginia School District, with grades PK-3, as
determined by the Virginia Standards of Learning (SOL) English and math tests
scores.
ii

ACKNOWLEDGEMENTS
First giving honor to God, for all the blessing in my life.
To Dr.Travis Twiford, the doctoral committee chairperson, who kept me
motivated with his encouragement, analyzed my work, provided me with support
throughout the program and believed in my potential. Thank you.
To Dr. Rose Martin, a doctoral committee member, for agreeing to be a
member and providing valuable feedback. Thank you.
To Dr. James Rayfield, a doctoral committee member, for his graciousness and
being a great support system, since the beginning of this program in 2001. Thank you.
To Dr. James Roberts, a doctoral committee member, for his
generosity and willingness to extend his time and wisdom in guiding the
author through this process, it is greatly appreciated. Thank you.
To Dr. Heidi Janicki, the statistician, for assisting me with the data analyzes.
Thank you.
A very special thank you to my colleagues, my previous and current faculty and
staff for all your well wishes, support and willingness to do what is best for children.
iii

DEDICATION
I dedicate this dissertation to my parents, Edgar Browning Ausberry, Sr and Mary
Magdalene. You set the stage for my life-long journey of learning, for that, thank you.
To my awesome husband, Bernard, who I love and respect immensely. Your love,
patience, support, words of encouragement and belief in my ability enabled me to
complete this program. Thank you for all the “feel good” presents.
To my mother-in-law, Lumina Jones, for your unconditional love and support, Thank
you.
To my brothers; Edgar, Stanley, Arthur, Marshal and my sister, Brenda and their
families. I love each of you, and very thankful to have you in my life.
To my best friends, Angela, Luella, Liz .You are amazing people and I enjoy being
in your presence. Thank you for always caring, listening and encouraging.
To Jennifer Cary, a special appreciation for providing information, advice,
assistance and friendship. Thank you.
iv
LIST OF TABLES
Table 1 Descriptive Statistics for Overall Student Sample for English and
math ..................................................................................... 52
Table 2 Mean English SOL scores within the Attendance Grouping. 53
Table 3 Independent t-test for English scores within the
Attendance Grouping ........................................................... 53
Table 4 Mean Math SOL scores within the Attendance Grouping .... 54
Table 5 Independent t-test for Math scores within the Attendance
Grouping .............................................................................. 54
Table 6 English and Attendance Percentage Correlation ................. 55 Table 7 Math and Attendance Percentage Correlation ..................... 56
Table 8 Descriptive Statistics for Student F/R Lunch and Non F/R
Lunch for English ................................................................. 57
Table 9 Independent t-test for English and Socio-Economic Status.. 57
Table 10 Descriptive Statistics for Student F/R Lunch and Non-F/R
Lunch for Math ..................................................................... 58
Table 11 Independent t-test for Math and Socio-Economic Status ..... 59
Table 12 Three Categories of Mobility Frequencies ........................... 60 Table 13 Combined Categories of Medium and High Mobility ............ 60 Table 14 Mean English Scores for the Mobility Grouping ................... 61 Table 15 Independent t-test for English and Mobility .......................... 61
Table 16 Mean Math scores for the Mobility Grouping ....................... 61
v

Table 17 Independent t-test for Math and Mobility.............................. 62
Table 18 English and Mobility Percentage Correlation ....................... 62
Table 19 Math and Mobility Percentage Correlation ........................... 63
vi
LIST OF FIGURES
Figure 1 Conceptual Framework......................................................... 12
vii

TABLE OF CONTENTS
ABSTRACT .......................................................................................................... ii
ACKNOWLEDGEMENTS .................................................................................... iii
DEDICATION ....................................................................................................... iv
LIST OF TABLES................................................................................................. v
LIST OF FIGURES............................................................................................... vii
CHAPTER 1: INTRODUCTION............................................................................ 1
Historical Perspective...................................................................................... 2
Statement of the Problem................................................................................ 4
Significance of the Study................................................................................. 4
Purpose of the Study....................................................................................... 11
Research Questions........................................................................................ 11
Conceptual Framework ................................................................................... 12
Definition of Terms .......................................................................................... 13
Limitations of the Study ................................................................................... 14
Delimitations of the Study................................................................................ 15
Assumptions of the Study................................................................................ 15
Organization of the Study................................................................................ 15
CHAPTER 2: REVIEW OF LITERATURE............................................................ 17
Introduction ..................................................................................................... 17
Student Attendance......................................................................................... 20
Attendance Variables ...................................................................................... 29
viii

Conclusions and Implications.......................................................................... 35
Summary......................................................................................................... 36
CHAPTER 3: METHODOLOGY......................................................................... 39
Introduction ................................................................................................... 39
Research Design........................................................................................... 40
Data Analysis ................................................................................................ 42
Description of the Population ........................................................................ 43
Sampling ....................................................................................................... 43
Instrumentation ............................................................................................. 44
Validity/Reliability .......................................................................................... 45
Data Collection Procedures........................................................................... 45
Variables ....................................................................................................... 47
Methodology Summary ...................................................................................... 47
CHAPTER 4: REPORT OF FINDINGS.............................................................. 49
Introduction ................................................................................................... 49
Presentation of Data .......................................................................................... 51
Research Question 1 Attendance and Achievement..................................... 52
Research Question 2 Socio-Economic Status and Achievement .................. 55
Research Question 3 Mobility and Achievement ........................................... 58
Research Question 4 Factors with the Greatest Relationship and Achievement
...................................................................................................................... 63
Summary....................................................................................................... 64
CHAPTER 5: OVERVIEW.................................................................................. 66
ix

Summary of Findings .................................................................................... 67
Discussion of Findings .................................................................................. 69
Limitations of the Study................................................................................. 72
Implications ................................ .................................................................. 72
Recommendations for Practice ..................................................................... 73
Implications for Future Research ................................................................... 74
Reflections .................................................................................................... 75
REFERENCES................................................................................................... 78
APPENDIX A: Permissions Letter to Conduct Research .................................. 88
APPENDIX B: Southeastern Virginia School District Approval ......................... 89
APPENDIX C: University IRB Approval ............................................................. 90
APPENDIX D: University IRB Amendment Approval ......................................... 91
VITA ....................................................................................................................92
x

CHAPTER 1
Education is, “something that a decently functioning society obliges people to get
a certain amount of, even if they don’t really want to” (Finn, 1999, p. 1).
INTRODUCTION
Educators, parents, and politicians are continuously searching for that magic
solution that will reform our public education system and establish a flawless system
of education for our youth, by providing them with a quality education (Edwards,
2002). “The success of the school in carrying out its primary charge of educating and
socializing students is contingent on students attending school regularly” (Smith,
1998, p.1).
Smith (1998), in his study emphasizes that attendance is a priority for
educators. This study investigates attendance in the primary grades. The goal is to
identify early indicators of poor attendance at the primary level in order to provide
interventions that could have an impact on middle and high school students’
attendance. Research conducted in this area could provide school divisions with vital
information about student attendance patterns at the primary level that could reveal or
predict an influence on student attendance in the middle and high school level.
Students must be present in school in order to benefit from the academic
program in its entirety (DeKalb, 1999; Rothman, 2001). Schools and law enforcement
officials are getting tough by enforcing laws that mandate school attendance and by
holding parents responsible for their student’s attendance. Student non-attendance is
a problem that extends beyond the school. It affects the student, their families, and the
community (DeKalb, 1999; U. S. Department of Education, 2001). This study
1

investigates the impact of student attendance, socio-economic status and mobility on
student achievement of third grade students in two Title I schools with grades PK-3, as
determined by the Virginia Standards of Learning (SOL) English and math tests
scores.
Historical Perspective
Compulsory education in the United States is mandated by a complex system
of state laws requiring attendance at either public schools or at some other
acceptable learning environment (Pierce v. Society of Sisters, 1925). Compulsory
education has its roots in English legislation of the 16th and 17th centuries (Aikman,
W.F., & Kotin, L., 1940).
Individual states have primary authority over public education in the United
States. The first compulsory education law in America was enacted in 1642 in the
Colony of Massachusetts Bay. Since that time every state in the nation has
established a system of free public education and laws governing attendance
(Ensign, 1969). In addition, each state has developed a department of education and
enacted laws regulating finance, the hiring of school personnel, student attendance
and curriculum (Thattai, 2002). “Presently, all fifty states have laws that compel
children between specified ages, usually six to sixteen, to be educated. “To
accomplish this, compulsory school attendance laws have been enacted throughout
the nation” (Alexander, K. & Alexander, M. D., 1998, p. 15). State law defines and
enforces these requirements. “Compulsory attendance laws are enacted for the
protection of children” (Alexander, K. & Alexander, M. D., 1998, p.17). Compulsory
attendance embraced the political ideals of “liberty under law” that maintains that
2

there can be no real liberty, no true democracy without education, free, universal, and
compulsory for every citizen (Ensign, 1969). School is perceived as the key to
success for individuals and to the excellence of society (Mitchell, 1993).
Due to the increase of reported student absenteeism, the U.S. Department of
Education, National Center for Education Statistics, conducted a Schools and
Staffing Survey (1990-91). The statistical results from the teacher questionnaire show
that absenteeism and tardiness is a serious problem.
The Virginia General Assembly, in 1999, enacted legislation that amended the
Code of Virginia 22.1-254, related to compulsory school attendance. The law
stipulates that every child who has reached the age of 5 by September 30th and who
has not passed his or her eighteenth birthday must attend a public school or attend
the same number of days and hours at a private, denominational or parochial school
or taught by a tutor or teacher qualified by the Board of Education and approved by
the division superintendent or provide home instruction under the same
requirements. The legislation also requires each school board to send to the parents
or guardian of each student enrolled in the division a copy of the compulsory school
attendance law and the enforcement procedures and policies established by the
school board (Duke & Canady, 1991).
The Educational Research Service (1996) summarizes research on
absenteeism and provides policies, procedures, and programs that are being used by
school systems to help eliminate excessive absenteeism in schools (U.S. Department
of Education, 1996). Truancy has been labeled as one of the major problems in this
country’s schools, negatively affecting the future of our youth (DeKalb, 1999). When
3

students’ miss school, it hinders their learning (U. S. Department of Education, 2002).
Statement of the Problem
School accountability for student achievement has become more rigorous since
the implementation of the Virginia Standards of Learning (SOL) testing and the 2001
No Child Left Behind legislation (NCLB). Student attendance, mobility and socio-
economic status in schools are a focus for educators in order to improve student
achievement at all levels (Applegate, 2003). It is believed that regular school
attendance can help ensure student academic success (Rothman, 2001).
Significance of the Study
This study investigates the relationship of attendance on student achievement.
The focus of this educational research is directed toward determining the impact of
attendance on academic achievement of third grade students in two Title I schools on
the Virginia SOL English and math tests. This study also identifies other variables
that influence student achievement and attendance (Applegate, 2003). Student
mobility and socio-economic status are identified factors that impact student
attendance and academic achievement that were used in this study (Ziegler, 1972;
Mitchell, 1993; Rothman, 2001; Applegate, 2003).
Student absenteeism is listed as the number one problem in the daily
administration of the schools in the early 1970s, according to a random sample of
500 members of the National Association of Secondary School Principals (Defours,
1983; Rothman, 2001). Wright (1978) found a significant difference in attendance to
be associated with school location. Also, he reported that courses offered,
youthfulness of the teaching staff and programs were factors associated with student
4

attendance. Attention to predictors within the family, society, individual
circumstances, as well as academic surroundings and materials are important factors
to consider when addressing school attendance. Excessive absenteeism affects
student achievement and performance, teacher instruction and effectiveness,
principal discipline, administration, and funding (U.S. Department of Justice, 2001).
As students progress from the primary grades excessive absenteeism drains
community resources impacting human services such as truancy officers, social
workers, probation officers, school counselors, the courts and retail merchants who
are vulnerable to loitering and shoplifting (U.S. Department of Justice, 2001). It is
critical to identify strategies early in a child’s school career that will intervene
effectively with youth who are chronically truant and interrupt their progress to
delinquency and other negative behaviors by addressing the underlying reasons
behind their absence from school (U.S. Department of Justice, 2001).
Excessive absenteeism in the primary age child is usually a result of childhood
illnesses or parental educational neglect (Kozinetz, 1995). Bandura’s (1977), Social
Learning Theory, refers to observational learning, which takes place through
modeling the behaviors of others, which could account for some students’ non-
attendance. In addition, parental apathy or recollection of his or her negative past
school experience could hinder promoting the importance of education and school
attendance (Ndaayezwi, 2003).
Society and schools can not afford to allow a single child to leave school early,
or have excessive absenteeism. Schools and states continue to attempt to eliminate
absenteeism by establishing programs to keep students in school starting at the
5

primary level. Non-attendance is an early warning sign for future problems that
negatively affect student achievement (U. S. Department of Justice, 2001).
The No Child Left Behind (NCLB) Act of 2001 proposes to close the
achievement gap using accountability measures. One of the requirements of the
NCLB legislation is school attendance. Each sub-group must maintain at least a 94
percent attendance rate as a part of the requirements of Adequate Yearly Progress
(AYP). The NCLB Act is relying on states to develop dropout prevention strategies to
increase student attendance and academic achievement by implementing strategies
at all school levels that will help the school achieve the intent of the NCLB Act of
2001, which states that all students will be proficient in reading and math by 2014.
(Dynarski & Gleason, 1998; NCLB, 2001; Popham, 2004; Reid, 2004).
President Bush announced a two-part effort to support schools and
communities in preventing truancy (U.S. Department of Education, 1996). The U.S.
Department of Education (1996b) provided a Manual to Combat Truancy to every
school district in the United States. This manual reported that truancy is the first
indicator that a young person is giving up and losing motivation to attend school.
When young people start skipping school, they are telling their parents, school
officials and the community at large that they are in trouble and need help if they are
to keep moving forward in their education. Frequent absences affect student
academic performance (Kersting, 1967; U. S. Department of Justice, 2001). Students
with excessive absences lag behind peers in the classroom, which in turn increases
the probability that at-risk students will drop out of school (DeKalb, 1999).
6

Students with higher truancy rates have the lowest academic achievement
rates, and are more likely to drop out of school which indicates that there is a
relationship between student attendance and student achievement (U.S. Department
of Justice and Delinquency Prevention, 2001). Students with low attendance often
end up dropping out of school and put themselves at a long-term disadvantage in
becoming productive citizens. They are more likely to be welfare recipients, earn
much lower salaries and lead less productive lives (U.S. Department of Education,
1996). A number of studies have established that poor student attendance is an
important predictor of school failure. Barrington and Hendricks (1989) conducted a
longitudinal study on student behaviors with fifth grade at–risk students. They found
that these students attended school significantly less than students who succeeded
in school. In addition, a report from the United States Department of Education
(1992) revealed that attendance rates differed considerably between students
considered at-risk and non-at-risk students; at-risk students’ attendance rates
averaged 80 percent, while non at-risk students’ attendance rates averaged 92
percent. The problem of student non-attendance will never disappear entirely
(DeKalb, 1999). Some students willingly attend, but others do not, often because of
negative factors or influences in their lives. These students require intervention, for
the benefits of regular attendance may be the difference between a lifetime of
burdens and a lifetime of accomplishments (Garry, 1996).
Roderick (1993) found that there are variables that distinguish high school
dropouts from low achieving students who complete their schooling. One of these
variables was a significant drop in attendance during the middle school years (10+
7

days annual increase over elementary attendance). Wehlage and Rutter (1986)
according to data they collected from their study “High School and Beyond”, on
student dropout predictors concluded that low expectations, low grades combined
with discipline issues and truancy were the most common reasons for students
exiting schools early. They also added that students’ socio-economic factors, that are
related to being at-risk were factors that the school could not control, however the
determinants low expectations, low grades, combined with discipline and
absenteeism, were factors considered to be under the control of the school (Pallister,
1969).
Absenteeism is detrimental to students’ achievement, promotion, self-esteem,
and employment potential (Boloz, 1983; DeKalb, 1999). Students who miss school
fall behind peers in the classroom, which in turn increases the likelihood that that they
will become at-risk students and will drop out of school (DeKalb, 1999). In a study
conducted by Rothman (2001), high student absenteeism rates were found to affect
the achievement of students’ that attend regularly by disrupting the existing learning
groups (Zamudio, 2004). According to Schagen, Benton & Rutt (2004), contextual
variables such as, school size and location, have a large influence on the extent of
absence within schools. “The most important of the contextual variables is
percentage of free or reduced price meals within a school, which is associated with
increased levels of absence” (Schagen, Benton & Rutt, 2004, p. 66).
State laws have been enacted to ensure the states and localities have support
in controlling and eventually eliminating excessive absences (Duke & Canady, 1991).
Many attendance improvement programs are in place in schools throughout Virginia
8

to improve overall student attendance (U. S. Department of Education, 1996b).
The U.S. Department of Justice, Office of Juvenile Justice and Delinquency
Prevention evaluation reports from the Truancy Reduction Demonstration Programs
determined that the correlates of excessive absenteeism or truancy fall into four broad
categories.
• Family factors. These include lack of guidance or parental supervision,
domestic violence, poverty, drug or alcohol abuse in the home, lack of
awareness of attendance laws, and differing attitudes toward education (U.S.
Department of Justice, 2001).
• School factors. These include school climate issues – such as school size and
attitudes of teachers, other students, and administrators - and inflexibility in
meeting the diverse cultural and learning styles of the students. Schools often
have inconsistent procedures in place for dealing with chronic absenteeism and
may not have meaningful consequences available for truant youth (e.g., out of
school suspension) (U.S. Department of Justice, 2001).
• Economic influences. These include employed students, single-parent homes,
high mobility rates, parents who hold multiple jobs, and a lack of affordable
transportation and childcare (U.S. Department of Justice, 2001).
• Student variables. These include drug and alcohol abuse, lack of understanding of
attendance laws, lack of social competence, mental health difficulties, and poor
physical health (U.S. Department of Justice, 2001).
For the purpose of this study, student variables are less of a factor for primary
age children, however family factors, school factors and economic factors were
9

identified as causes related to student absenteeism (Rothman, 2001; U.S. Department
of Justice, 2001; Davidson, 2002; Applegate2003).
The amount of time actually spent in the classroom is in direct correlation to
a student’s access to education (Dekalb, 1999). Students who are tardy to school,
those that do not attend or skip classes give up their opportunity for an education.
They also interfere with other students’ opportunity to learn by being late, absent or
disruptive (Flanagan, & Murray, 2002). These negative practices of being consistently
late or absent will not benefit students well with their potential future employment
responsibilities (KDE Dropout Prevention Resource Guide, 2003).
Even though previous research has linked students’ socio-economic factors
that are associated with student absences that are beyond the control of the school,
educators can improve attendance, by monitoring students’ attendance, encouraging
personal development and building relationships with parents setting high
expectations (Rohrman, 1993). Schools and local law enforcement agencies need to
establish ongoing truancy prevention programs (Reid, 1999). Positive factors can
protect youth either by reducing the impact of risks or by changing the way, they
respond to risk factors (Garry, 1996). Developing an effective attendance program is
a way for schools to combat chronic absenteeism (U. S. Department of Education,
1996b).
There is still a need to address student attendance (Smith, 1998). Testing
programs, accountability issues, and student achievement, remains the focus for
educators today. The challenge is finding and implementing effective programs
10

designed to improve student attendance and academic achievement at all levels
(U.S.Department of Education,1996).
Purpose of the Study
This study investigated the impact of student attendance, socio-economic
status and mobility on student achievement of third grade students in two Title I
schools with grades PK-3, as determined by the Virginia Standards of Learning
(SOL) English and math tests scores. The Pearson r and t-tests were used to show
the effect between individual variables and the achievement of students, as well as
the extent of the relationship between variables and the achievement of students
using the variables of attendance, social economic status, and mobility.
Research Questions
1. Does attendance impact student achievement as measured by the third
grade Virginia English and math SOL tests?
2. Does socio-economic status impact student achievement as measured by
the third grade Virginia English and math SOL tests?
3. Does mobility impact student achievement as measured by the third grade
Virginia English and math SOL tests?
4. Which of the identified factors, attendance, socio-economic status or
mobility has the greatest impact on student achievement as measured by
the third grade Virginia English and math SOL tests?
Figure 1 is the Conceptual Framework for this study. The model shows the identified
factors and the relationship these factors have on student achievement as determined by
the third grade Virginia SOL English and math tests.
11

Conceptual Framework
SOCIO- ECONOMIC
STATUS
ATTENDANCE
MOBILITY
STUDENT ACHIEVEMENT
3rd GRADE ENGLISH
SOL TEST
3rd GRADE MATH
SOL TEST
Figure 1. Conceptual Framework
12

Definition of Terms
For the purpose of this research study the following terms are defined:
1. Truancy - unexcused chronic absence from school (U.S. Department of
Justice (2001).
2. Non-Attendance - The act of not being present (Virginia State Code, 22.1-
254).
3. Attendance - The actual school attendance of a pupil during the school day.
Defined by law and regulations of the state board of education (Virginia State
Code, 22.1-254).
4. Attendance Percentage – The 94 percentage required for Adequate Yearly
Progress (AYP) defined by the No Child Left Behind Act (NCLB) 2001. The 94
percent attendance requirement has been deemed as good, average
attendance for public schools, while 93 – 85 percent was determined as
needing improvement, and 84 percent and below as poor attendance (NCLB,
2001).
5. Race– Six Categories; American Indian or Alaska Native, Asian, Black or
African American, Native Hawaiian or Other Pacific Islander, White and Some
Other Race (U.S. Census Bureau for the 2000 census).
6. Ethnicity – Two Categories; Hispanic or Latino and Not Hispanic or Latino.
Hispanics and Latinos may be of any race (U.S. Census Bureau for the 2000
census).
7. Socio-economic status – Student participants in the federal free/reduce lunch
program (Norris, 2000).
13

8. Mobility – Movement between or changes of school, either once or on
repeated occasions (Strand, 2000).
9. Virginia Standard of Learning (SOL) test – Criterion reference test for the State
of Virginia given to all students in grades 3, 5, 8, and end of course (State
Department of Education, 2004). (other grades will be added in the 2005-2006
school year)
10. At-risk students – Students with excessive absences (Deschamps, 1992;
DeKalb, 1999).
11. Sub-groups – Economically disadvantaged families, children with disabilities,
children with limited English proficiency and children from each major racial or
ethnic group (NCLB, 2001).
12. Contextual variables – Circumstances in which an event occurs; a setting
(Schagen, Benton & Rutt (2004).
13. Dosage – “Participation in the 21st Century Community Learning Center’s
after-school program measured in days of attendance. Low dose is defined as
participating 35 or fewer days. High dose is defined as participating 36 or more
days (Chappel, 2004, p. 10).
14. Resilience – the process of coping with adversity, change, or opportunity in
the wake of high-risk situations or after setbacks (Chappel, 2004).
15. Adequate Yearly Progress (AYP) - Specific targets set in gradual but equal
increments of percentage points to reach 100 percent of students performing
at the proficient level by the target year of 2014 (NCLB, 2001).
16. Title I Schools – Schools that use Title I funding with other Federal, state and
14
local funds, in order to upgrade the educational program of the school. A Title I
school serves an eligible school attendance area, in which at least 40 percent
of the children are enrolled in the free/or reduced lunch program (NCLB,
2001).
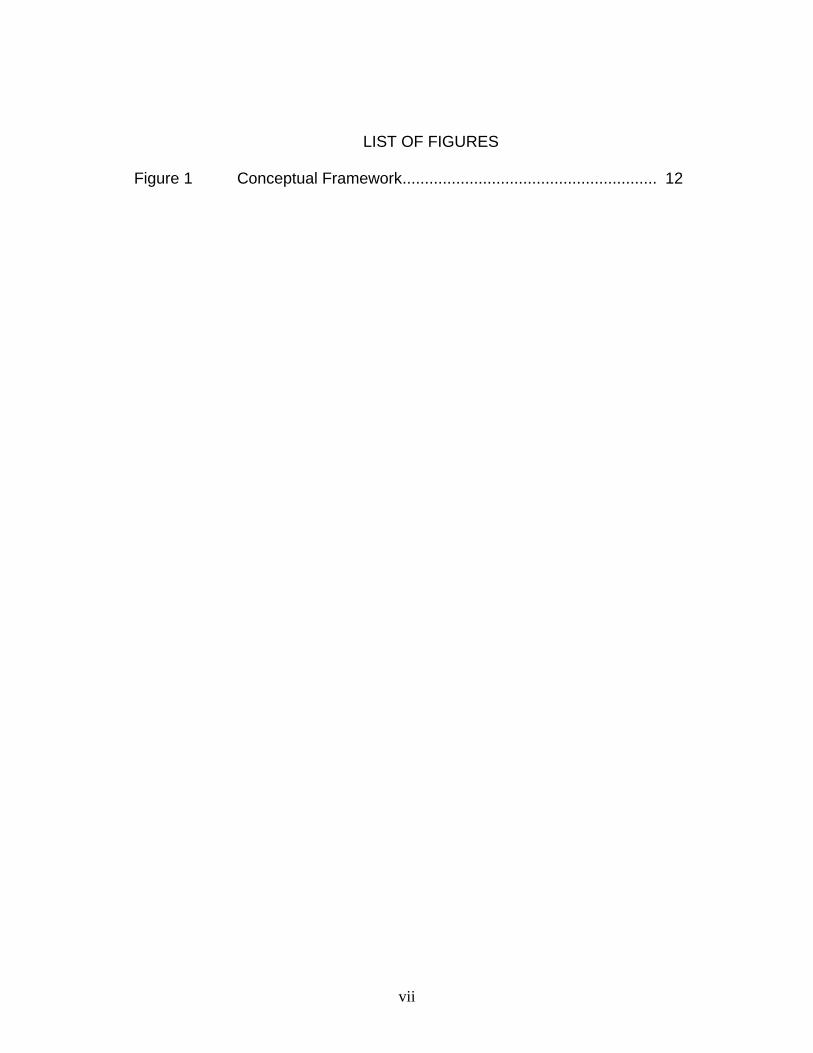
17. Transient – Children who change schools frequently (Lee, 2000).
Limitations of the Study
The sample used in this study was drawn from the student population of one
school system and only Title I schools within that division that house PK through
Third grade students. The results can only be generalized to those students and Title
I schools in that school district. The results may not be typical of other schools or
school districts in the state or country.
Delimitations of the Study
1. Virginia SOL data from 2005 Spring administration of the third grade test.
2. SOL third grade English scores of all students who were administered the
test.
3. SOL third grade math scores of all students who were administered the test.
Assumptions of the Study 1. That all students in a third grade Title I school with high attendance will
score higher on the SOL third grade English and math tests than students
with low attendance.
2. Students in PK-3 grade in Title I schools in the Southeastern Virginia School
District who remain in the same school for four school years score higher on
15
the Virginia SOL third grade English and math tests than students with
medium
or high mobility.
3. Students not enrolled in the free or reduced lunch program score
higher on the SOL third grade English and math tests than students enrolled in
the free or reduced lunch program.
Organization of the Study
This study is organized into five chapters. Chapter 1 of this study includes the
introduction, context. overview, historical perspective, statement of the problem,
significance, purpose, research questions, conceptual framework, definition of terms,
limitations, delimitations, major assumptions and organization of the study.
Presented in Chapter 2 is a review of related literature. The methodology of this study
is described in Chapter 3. Included in Chapter 4 of this study are the results and
findings after the manipulation of data. In conclusion, Chapter 5 of this study presents
a summary of the findings and conclusions, recommendations and implications for
future research studies.
16

CHAPTER 2
REVIEW OF LITERATURE
Introduction
Former President William Jefferson Clinton, State of the Union Address, February 4,
1997 challenged the nation:
Every state should adopt high national standards, and by 1999, every state
should test every 4th grader in reading and every 8th grader in math to make
sure that high standards are met. These standards represented what all
students must know to succeed in the knowledge economy of the 21st Century.
Every state and school must shape the curriculum to reflect these standards,
and train teachers to lift students up to them. To help schools meet the
standards and measure their progress, we will lead an effort over the next two
years to develop national tests of student achievement in reading and math.
Raising standards will not be easy, and some of our children will not be
able to meet them at first. The point is not to put our children down, but to lift
them up. Good tests will show us, who needs help, what changes in teaching to
make, and which schools need to improve.
More must be done to help all children read. Given that, 40% of
the eight year olds cannot read on their own. Clinton (1997) further stated that
we should make sure every child can read independently by the end of third
grade. (Excerpt taken from the 1997 State Address, United States Capitol, 105th
Congress: President William Clinton).
17
Today, “The No Child Left Behind (NCLB) Act has become the catalyst toward
improved student achievement” (Zamudio p.10, 2004). The NCLB Act requires schools to
educate all students with emphasis on subgroups, despite barriers that have an impact on
student attendance (NCLB, 2001). Researchers have attempted to define student
attendance and have investigated the importance of student attendance and its
relationship to academic achievement (Ziegler, 1972; Norris, 2000; Applegate, 2003).
Research supports that students who attend school regularly have higher grades
than those students with high absences (Redick & Nicoll, 1990). Fleming and Zafirau
(1982) found that over three-fourths of school failure rates were explained through student
attendance percentages. Many state departments of education and school boards have
redesigned existing school attendance policies, provided programs to improve attendance
issues, and installed a more rigorous monitoring system for schools, as well as applied
academic constraints for student non-attendance (Redick & Nicoll, 1990).
About one-third of the school divisions within Virginia had between 32 and 53
percent of their students miss more than 10 days of school (Office of Accountability Project
(Department of Education, 1996). During the years 1996-1998, the General Assembly
approved appropriations to fund Education Department grants for reducing truancy and
supporting safety in elementary and middle schools. Eligibility was based on the number of
elementary and middle schools in a school division that had the poorest attendance
records. The indicator of excessive absenteeism was the percentage of students absent
more than ten days in a school year (Wheat, 1998).
“The connection between attendance and achievement is grounded in common
sense” (Wheat, 1998, p2). Unless a student attends, he or she will have difficulty learning
18

what is taught in school (Wheat, 1998; Rothman, 2001). In the commonwealth’s public
schools it was estimated that by reducing excessive absenteeism by 25% it would enable
22,000 more young students to score above the national average on standardized tests
(Wheat, 1998).). In addition, research indicates that regardless of social and economic
factors the schools with higher attendance rates achieved higher test scores (Wheat, 1998;
Greene, 1990; Applegate, 2004). Based on data gathered from Virginia’s public schools
annual reporting of student absenteeism to the Virginia Department of Education, in 1996,
one-third of the school divisions had between 32 and 53 percent of the students missing
more than 10 days of school. “Unless a student is productively engaged in off-campus
research, he will find it difficult to learn what is taught at school in his absence” (Wheat,
1998, p.2). According to the research, by improving student attendance student
achievement would rise (Redick & Nicoll, 1990; Virginia Department of Education, 1997;
Rothman, 2001;).
This review of literature focuses on the importance of student attendance and its
impact on student achievement. Student attendance variables, which include; school
attendance policy, socio-economic status, and mobility, that affect student achievement
and influence student attendance were examined (Zamudio, 2004). The following sections
are included: (a) after-school program, (b) related studies on student variables, such as;
socio-economic status, and mobility, and (c) chapter summary. The proxy web server at
Virginia Polytechnic University and State University was the used to obtain relevant
research for this topic. This search of the literature was conducted using references from
research studies, books, dissertations, journals and databases (ERIC, INGENTA,
PROQUEST & ILLIAD). The descriptors used to locate studies for this literature review
19

were “student attendance”, “non-attendance”, truancy”, “at-risk students”, “school district’s
attendance policies”, and “student achievement”. Research studies that were not relevant
to the topic were eliminated after conducting the searches.
Student Attendance
“One crucial element of a child’s success in school is school attendance (Atkinson,
1998, p.12). When student non-attendance increases, research has shown a
corresponding decrease in student achievement (Herberling & Shaffer, 1995). Using a
causal comparative quantitative method Smith (1998) conducted a study to determine the
effects of the attendance policy and its affects on high school attendance and the
effectiveness of Saturday Redemptive School (SRS) after a one-year implementation of
the attendance program in Newport News Public Schools.
Newport News Public Schools during the time of Smith’s study had a total student
population of 32,000 students. The school district student population consisted of 55%
Black or African American, 43% White or Caucasian, and 2% other. Newport News Public
Schools had four early childhood centers, 28 elementary schools, nine middle schools, five
high schools, and three alternative schools (Smith, 1998).
The population used for Smith’s study was 4,236 high school students from three
schools in grades 9, 10, and 11. A stratified random sample was chosen to participate in a
survey that described their perceptions of the school division’s attendance policy and
attendance program (SRS) (Smith, 1998). A stratified random sample was selected to
ensure that identified sub-groups in the population were represented in the sample. The
sample consisted of 20% of the male and female student population. Parents of the
identified student sample participated in the survey and 20% of all high school teachers
20

participated in the survey to determine their perceptions of the new attendance policy and
attendance program. The SRS population was 549 high school students for the 1996-1997
school year. The total SRS population was used as the sample to determine if the
participants’ pass rate was affected by attendance (Smith, 1998). Attendance data were
collected from the attendance records of the high school students. The data were arranged
from the school year 1996 and the school year 1997 and categorized by high school
(Smith, 1998).
Surveys developed by Woog, (1992), for students, parents and administrators
were revised to meet the needs of this study by Smith. The revised version of the survey
was altered to provide data from teachers who described their perceptions of the
attendance policy and the Saturday Redemptive School program in the Newport News
Schools. The student survey questionnaire consisted of sixteen questions. The
questionnaire answer document used a Likert scale ranging from strongly agrees to
strongly disagree. The parent survey and teacher survey were the same as the student
survey except on the student survey, the students were asked to identify male or female by
selecting the appropriate box (Smith, 1998).
A two-way analysis of covariance (ANCOVA) was used to determine the
relationship among students in grades 9, 10, 11 and between gender (male, female), to
see if there was an interaction between the grade level and gender, during the year 1995-
1996 school year. Identical groups of students were used during the 1996-1997 school
year in grades 10, 11, 12 and between gender (male, female). To assess main effects and
interaction, the two-way ANCOVA was also used to test for significant interaction of
variables (Smith, 1998).
21

For the main effect, it was determined that (a) There is no statistically significant
difference among grade level (9, 10, 11, for year 1995-1996) with respect to year 1996-
1997 high school attendance after adjusting for initial differences on the 1995-1996 high
school attendance. For the main effect, the data shows that (b) There is no statistically
significant difference among gender (male, female) with respect to year 1996-1997 high
school attendance after adjusting for initial differences on the 1995-1996 high school
attendance. The results of the study show that (c) There is no statistically significant
difference among grade level (9, 10, 11, for year 1995-1996) and gender (male, female)
with respect to year 1996-1997 high school attendance after adjusting for initial differences
on the 1995-1996 high school attendance (Smith, 1998).
The independent variables grade level and gender are on the nominal scale of
measurement and the dependent variable (1996-1997 high school attendance) is on the
interval scale of measurement. The researcher employed pre-determined alpha level of .05
in this 3 X 2 factorial design to determine the significance of each hypothesis in the study
(Smith, 1998).
Smith used a Tukey post-hoc test to determine where among the three levels of
the independent variables (i.e. grade levels) the differences could be found. There was a
significant main effect for the hypothesis. The 1995-1996 high school attendance was
selected as the covariant because the 1995-1996 twelfth grade students graduated from
the school district thereby omitting their data from the study (Smith, 1998).
The findings of the study indicate that grade level and gender of high school
students in combination do not affect high school students’ attendance. The data revealed
that ninth, tenth, and eleventh grade students had better attendance in the previous year,
22

however there was a significant difference in the attendance between ninth and eleventh
(Smith, 1998).
A descriptive report of data identified the frequency distribution of each number
and the percent of respondents selecting each point on the Likert scale. The descriptive
report also gave an overall average rating for each survey question. Data from the student,
parent, and teacher surveys were collected and organized on the descriptive report (Smith,
1998).
The perceptions of students, parents and teachers regarding the new attendance
policy were examined along with a specially designed program, “Saturday Redemptive
School”. Findings showed that the new attendance policy was necessary and needed.
However, they disagreed that the new policy resulted in the reduction of the number of
days students were absent. There was an overall disagreement that the five day
unexcused absence rule was keeping students in school. The respondents to the survey
felt the Saturday Redemptive School did not meet the needs of high school students and is
not an effective intervention for the attendance policy and should be revised (Smith 1998).
The results of this study indicate a need to further study, review and analyze the
attendance data to see if attendance improves in high schools (Smith, 1998).
The limitations of the study, relate to the length of time used to determine
effectiveness of the attendance policy, the environmental variables that may have affected
the study and the lack of an effective system of tracking individual attendance.
deJung and Duckworth, (1986), in an article, “Coping with Student Absenteeism”;
they reported that some schools are using penalties for students that are in violation of the
school attendance policy. They further states that the penalties were only effective if
23

students were concerned about their grades. “A basic problem with all penalties is that
they use aversion to force students to participate in school. They do not build positive
motivation. The coerced attendee becomes the classroom teacher’s discipline problem”
(Duckworth, 1988, p.3).
Kovas (1986) found that schools that use attendance policies with grade penalties
have seen an increase in average daily attendance (ADA). The Texas school system uses
a similar policy with administrator input on excused and unexcused absences as well as
the Southeastern Virginia School District used for this study. Ligon (1990) in his evaluation
of the Austin School District found that the beginning stages of the five-day absence
attendance policy the attendance in high schools were high, however the number of
excused absences has risen making the five-day absence policy ineffective.
“School attendance is an integral part of a child’s success in school, the rate at
which children are absent from school is relevant” (Atkinson, 1998, p.4). Chappel (2004)
examined an after school program as a connection to regular school attendance and
academic achievement. “Linkage between after-school programs and the school day may
translate into transportable strategies for school leaders for improving student achievement
and attendance” (Chappel, 2004, p. 10). Chappel (2004) also examined the dosage
effects, which refers to the amount of student participation in a 21st Century Community
Learning Center’s after-school program. The program employed strategies to build
resilience, which refers to the process of coping with adversity, change, or opportunity in
the wake of high-risk situations or after setbacks (Deschamps, 1992), in children who
qualified for free or reduced price lunch. The study specifically examined dosage effects of
after-school programming on perceived competence, social acceptance, academic
24
achievement, and attendance in school for children in grades 3-5, the majority of whom
qualified for free or reduced price lunch. The study compared the perceived competence,
social acceptance, academic achievement, and attendance in school of students who
participated in an after-school resilience-building program for 36 or more days in the school
year to subjects who participated less than 35 days. This quantitative study examined self-
concept, academic success, and attendance in school for participants in an after-school
program. The population of the study consisted of 120 students, 8-10 years old, in grades
3-5 who registered for a 21st Century Community Learning Center after-school program in
an urban elementary school in Durham, North Carolina. There were 37 third graders, 42
fourth graders, and 41 fifth graders in the sample. Seventy-two were girls and 48 were
boys. Approximately 79% of the students participating in the study were African-American,
12% Latinos, 7.5% Whites, and 2% Multi-racial. The student participants in the after-school
program represented the total school population (Chappel, 2004).
The research design used was quasi-experimental based upon Campbell and
Stanley’s (1963) classic notation system. The classic notation system does not involve
random assignment of the subjects to the high dose and low dose groups. Dosage of after-
school programming was measured for this study in days of attendance. Students were
assigned to a group based upon the number of days they participated in the program
during the 2002-2003 school year (Chappel, 2004).
Teachers and counselors assigned students to the high dose and low dose
groups. Students were identified from grades 2-4 who needed support beyond the regular
school day. The factors used to select students for the learning center program were prior
year achievement scores, low school attendance, or need for after-school supervision. The
25

parents were contacted by the learning center manager and encouraged to register their
children for the program that was planned for the 2002-2003 school year. After the initial
registration, the program was advertised to the parents of all students in the school
(Chappel, 2004).
For all students participating in the after-school learning center program, data were
retrieved from the office of community education with pre-approval from the office of
research, development, and accountability. Data for the research consisted of
demographic data gathered from the school records identifying gender, ethnicity, grade,
program referral source, residence of the child and free or reduced price lunch status.
School attendance records and achievement levels from the prior year were also used.
Student names were removed from the data. A Pictorial Scale of Perceived Competence
and Social Acceptance for Young Children, PSPCSA (pretest) was administered to
children in individual meetings by trained school personnel prior to beginning in the
program and the PSPCSA (posttest) were administered again during the last two weeks of
school by trained school personnel (Chappel, 2004).
Chappel (2004) investigated whether or not there was a difference in dosage
effect on perceived competence and social acceptance, student achievement in reading
and math and attendance between a high dose group of students in grades 3-5 who
attended the after-school program of an urban elementary school for 36 or more days and
a low dose group of students in grades 3-5 who attended the school’s after-school
program for 35 or fewer days.
Descriptive statistics were used to describe the students’ similarities and
differences in the study. The data were analyzed for all students by grade, gender,
26

ethnicity, residence (who the child lives with), and program referral source. The data
were then disaggregated by group (high dose and low dose). The results
demonstrated that the characteristics of the two groups were similar to each other prior
to the after-school program’s intervention. The independent variables grade, gender,
ethnicity, and residence, did not demonstrate significant differences in the dependent
variables. There were no significant differences prior to the intervention (after-school
program) in the two groups for school attendance, reading and math achievement, and
perceived competence and social acceptance (Chappel, 2004).
For the variables associated with perceived competence and social acceptance
(subscales of cognitive competence, peer acceptance, physical competence, and
maternal acceptance) students in the high dose group demonstrated significant
differences in mean scores between the pre and posttest administrations. Student
scores across all subscales showed gains. This indicated a positive impact on
perceived competence and social acceptance for the students who received a high
dosage of after-school programming by participating more frequently. Students in the
low dose group were found to have a significant difference in mean scores in the
subscale labeled cognitive competence but not in any other subscale (Chappel, 2004).
For reading and math achievement, students who received a higher dosage of
after-school programming made significant gains over and above the gains
experienced by all of the students in the program. All of the students made some
improvement, but the increases in reading and math scores from pre to post for the
high dose group were significantly larger than the change pre to post of the low dose
group. The high dose group’s average reading scores percentage points changed from
27

2.48% to 3.15% and math scores changed from 2.69% to 3.33%. The low dose
group’s reading average scores changed from 2.68% to 2.81% and math scores
changed from 2.61% to 2.97%. There was a significant difference between the mean
scores on the end of grade test in both reading and math for the high dose group when
compared to the low dose group even after controlling for prior scores. The after-
school program may be a significant source of academic support for these students
(Chappel, 2004; Davis, 2004).
School attendance also improved significantly for the students who received a
higher dosage of after-school programming but it did not improve significantly for the
students who received a lower dosage of after-school programming. Average school
attendance for the high dose group improved from 172.3 days to 176.7 days. Before
the program began, the data for the low dose group for 2001-2001 indicated that the
students attended school at a slightly higher rate than the high dose group.
The analyses of the data for 2002-2003 found that the low dose group’s
attendance in school improved slightly from an average of 174.2 to 174.9, but this
improvement was not significant (Chappel, 2004). Students in the after-school program
enrolled as a result of three referral methods. The group of students with the lowest school
attendance was the group referred by the counselor while students referred by the teacher
or from parent interest attended at a similar rate. Students referred by the counselor to the
program attended significantly less than the other students (Chappel, 2004).
In summary, the significant outcomes for students in all areas studied suggested
that the program was successful in meeting the needs of the children it was designed to
support. The findings revealed that on average all of the children in the after-school
28

program made academic progress from one year to the next; however, the children who
received a higher dose of after-school programming by attending more frequently made
significantly more progress that those who participated 35 days or fewer in the school year.
Attendance in school was studied in this research primarily because of the interest of the
school’s leaders in improving attendance. Students in the high dose group made
significant gains over time in attendance. The students in the low dose group did not
improve their school attendance significantly. The higher attendance rate for students may
be linked to the relationship built in the school with students. Overall, the findings for this
research indicated that children in the study who received a high dose of after-school
programming, by attending at least 36 or more days, experienced significant gains in
reading, math, and school attendance (Chappel, 2004).
The limitations of the study include the demographics (students who participated in
an urban elementary after-school program in Durham, NC.) and the use of a non-random
sample (students who participated in the program by parent or guardian registration, even
if they were recommended and the possible instrumentation effects of the pretest and
posttest. Further research could include additional tools such as student observations,
interviews, and focus groups to add more depth to the findings (Chappel, 2004).
Attendance Variables
Before determining the most effective means of controlling student non-
attendance to improve student achievement, it is important to investigate the factors of
non-attendance (U.S. Department of Education, 2001). Applegate (2003) conducted a
one-year study to determine the relationship of attendance, socio-economic status,
and mobility and the achievement of seventh grade students as determined by the
29

Missouri Assessment Program (MAP) achievement scores. By identifying certain
factors or variables that relate to student achievement, Applegate felt that the
information discovered would be a valuable asset to teachers, counselors,
administrators, and members of the community (Applegate 2003).
The research design for this study was a non-experimental quantitative study,
using archival data to study the relationship between attendance, socio-economic
status, and mobility, and student achievement on the Missouri Assessment Program
(MAP) in communication arts classes. Interval data were used to determine if there
was a statistically significant relationship between student achievement and
attendance, socio-economic status, and mobility (Applegate 2003). The population for
this study consisted of 1,811 seventh grade students from a large mid-western school
district. All seventh graders in the school district are required to take the MAP
achievement test at the same time every year.
For Applegate’s study, the variable attendance was divided into three
categories. Category 1 represents (low) was determined as 84.9% and below,
Category 2 represents (medium) was determined as 85% to 93.9% and Category 3
represents (high) was determined as 94% and above. Socio-economic status was
divided into those students who qualify free or reduced lunch and those students who
do not qualify free or reduced lunch. Mobility was divided into students attending the
same school for two years, students attending two schools in that time period, and
students attending three or more schools in a two-year period (Applegate, 2003).
The findings of the study indicate that high attendance and high socio-economic
status is related to high achievement. The results further indicate that there is
30

significance in the relationship between the independent variable of attendance and
the dependent variable of achievement on the MAP in the area of communication
arts (Applegate, 2003).
These results also show that there are significant differences in how students
performed on the test depending on student placement within the student mobility
levels. The results indicated that low mobility is related to high achievement. The
findings of this study conclude that there is a significant relationship between student
achievement and variables such as attendance, socio-economic status, and mobility
(Applegate, 2003).
The following limitations have been identified that may have an impact on the
ability to generalize the results of this study to other school districts. A longer period
(more than a year) of assessment might produce different results. A comprehensive
report of achievement in all academic areas is not available, since the data used
include the communication arts portion of the MAP test only.
Applegate suggests that educational leaders focus on areas or predictors
within the family, society, or individual circumstances of the child, as well as on the
academic surroundings and materials. Finding ways to determine the success of
individual students by identifying certain variables early on could affect the teaching
methods, placement, additional services, or a variety of other factors used by schools
(Applegate, 2003).
Gamble (2004) conducted a quantitative research study to determine the
effect of student mobility on achievement and gain-score test results in both reading
and math. The population used for the study consisted of all students in the Knox
31

County School System in grades 3-5 at the time of the 2003 spring administration of
TCAP. The population consisted of 12,138 regular and special education students.
Data collected for each student included student ethnicity, gender, grade level,
mobility, school and socio-economic status.
The scale scores for the 2002 and 2003 TCAP test were obtained from the
web and subtracted from each other to obtain a gain-score test result. The results of
the study indicate that student mobility negatively effects student achievement in
reading and mathematics, which supports previous and current research (Rumberger
and Larson, 1993). “Students who move frequently suffer academically from the
discontinuity of instruction” (Horwitch, 2004, p.4).
Zamudio (2004) conducted a quantitative research study to determine the
relationship between mobility and achievement in elementary schools controlling for
student background characteristics (ethnicity, gender, and family income of the
students) and school characteristics (attendance rate, school setting, teacher
experience, teacher educational attainment, and per pupil expenditures of a school)
and if a negative effect on achievement is larger for low socio-economic status
students compared to high socio-economic status students.
The study sample consisted of 487 public elementary schools in Arizona that
housed third and fifth grade students. The Stanford 9 standardized test results for the
year 2001-2002 school year were utilized to measure academic achievement. For
this study, school mobility was measured as the percentage of students who transfer
in to a school or the percentage of students who transfer out of a school during a
given school year. Regression analysis was utilized to find the relationship between
32

student achievement and school mobility controlling for ethnicity and gender of
students, percentage of students who receive free or reduced lunch, attendance,
school setting, teacher experience, teacher education level, and per pupil
expenditures. Test scores derived from the Stanford 9 were analyzed for students in
third and fifth grades and for math, reading and language subjects (Zamudio, 2004).
The study findings show that mobility is negatively related to academic
achievement as measured by standardized test scores. The relationship remained
significant even when controlling for student/family background and school
characteristics (Zamudio, 2004). The results of this study highlight the negative
relationship between ethnicity and socio-economic status and academic
achievement; however, the negative relationship with mobility remained statistically
significant while controlling for ethnicity and socio-economic status. For all regression
analyses performed, Zamudio (2004) found that attendance had an effect on
academic achievement for students in all subject areas for both third and fifth grade
students. “Attendance appears to be positively correlated to academic achievement
for high SES students” (Zamudio, 2004, p.100). Results also confirmed that a
student’s family background characteristics are a stronger predictor of student
achievement as compared to school characteristics (Zamudio, 2004).
The study findings also revealed that the transfer out rate measurement of
mobility matters more as compared to the transfer in rate measure. The transfer out
rate remained significant in the regressions while the transfer in rate did not remain
significant once controls were added. Zamudio (2004) concluded that these results
could possibly be linked to the sample schools included in the study had higher
33

transfer out rates and /or that the transfer in rate only accounts for Arizona transfers,
therefore diminishing the actual number of transfers.
Zamudio (2004) found the following:
A plausible explanation is that the results reflect the composition of the sample.
He further stated that it is possible that the transfer-out rate is diminishing the climate
for the stable students by negatively affecting achievement due to the disruption of
existing learning groups. He determined that high performing students are possibly
being pulled out of school for an alternative schooling option. (p. 108)
Lastly the study revealed that mobility was not a significant predictor of
achievement for schools considered primarily made up of low SES students, however
the results indicate a consistent negative effect on academic achievement for schools
predominately of high SES composition (Zamudio, 2004). This finding was opposite
of what was hypothesized. “Perhaps low performing students are moving into a high
SES school therefore decreasing the average test scores and/ or low performing
students adjust better to school when moving as compared to affluent
students”(Zamudio, 2004, p.109)
Low SES students move frequently due to financial fluctuations therefore
moving has less impact on the student, where as high SES students move due to
family breakups or custody issues (Zamudio, 2004). The Kids Mobility Project (1998)
suggests that a major reason for student mobility is related to poverty, abuse and
divorce (Alexander, Entwisle, & Dauber, 1996).
The limitations noted in the study include the accuracy of the study results.
The collection of data could have included individual student data along with school
34

data. Separating migrant and non-migrant students could have provided more
exactness. There were some unmeasured factors such as parental structure, and
cultural values that could have affected the study results differently.
Norris (2000) conducted a similar study for the Omaha Public School district
(OPS) of predictors of student achievement as they relate to socio-economic status,
race/ethnicity, attendance and student mobility, due to the district identifying a gap in
the achievement levels of minority and non-minority students even though the
district’s test scores were above the national norm.
Norris (2000) found that the variables of socio-economic status, race/ethnicity,
attendance, and mobility were significantly and substantively correlated with
academic achievement. Socio-economic status was the strongest predictor of
academic achievement as well as race separate from socio-economic status, which
she interrupts as an indicator of a negative influential factor either external or internal
in the educational and instructional processes of the school district.
Conclusions and Implications
Researchers have identified a number of factors associated with student
achievement (Cotton, 2003). Based on the reviewed studies educational leaders will
find it necessary due to school’s student accountability requirements to focus on
areas or predictors within the family, society, or individual circumstances of the child,
as well as on the academic surroundings and materials in order to meet the diverse
needs of the students (Zamudio, 2004). “The educational process of a child is a team
effort, in which all members must do their part equally or suffer a significant loss”
(Applegate, 2003).
35
Summary
The above studies indicate that further research should be conducted to study
the effects of attendance, socio-economic status, mobility and the achievement of
students in primary grades in order to detect early signs of attendance issues in order
to provide intervention strategies. “Identification of the causes of student academic
success or failure has long been a topic studied by educators intent on creating an
environment that would more reliably bring about improvement in student
achievement” (Norris, 2000). There are factors that have been determined to have
an impact on student achievement over which schools have no control such as,
socio-economic status, race and mother’s education, however educators can
investigate those factors that schools can control (Alexander, Entwisle, & Bedinger,
1994; Norris, 2000; Rothman, 2001; McCarthy, 2004).
There is a need for further research in the area of primary school student
attendance and academic achievement (Atkinson, 1998). “It is no longer acceptable
to educate just a portion of our citizens to high levels, while leaving large groups
undereducated” (Bartman, 1997, p.7). The NCLB Act requires schools to educate all
students with emphasis on subgroups, despite barriers that have an impact on
student attendance (NCLB, 2001). Researchers have attempted to define student
attendance and have investigated the importance of student attendance and its
relationship to student achievement (Ziegler, 1972; Norris, 2000; Applegate, 2003).
Research supports that students who attend school regularly have higher
grades than students with high absences (Redick & Nicoll, 1990). This review of
literature has inspired me to focus on the need to investigate factors that influence
36
school attendance and the relationship those factors have on primary school student
achievement. Several of the studies reviewed focused on middle and high school
student achievement and attendance. Additional studies have shown that early
intervention procedures should be used to reduce student absenteeism to improve
student attendance (Smith, 1998). Another study focused on students in the
intermediate grades and student mobility and the negative impact on student
achievement (Zamudio, 2004; Rumberger & Larson,1998). The primary focus of each
of the studies shows that student attendance had a direct relationship with student
achievement. Even though the approach of the studies varied, the outcomes of all
the studies justify the need to further address student academic attendance and
student achievement in the primary schools. “All of our children deserve the best
schools can provide” (Deal & Peterson, p. 142, 1999).
School accountability for student achievement has become more rigorous,
since the implementation of high stakes testing; therefore, students need to be
present to learn. A research study that focuses on primary schools could be the
catalyst for additional studies to follow that address the needs in other school
districts. The results of this study would provide focus and direction to school
systems interested in improving the attendance and achievement of students from
the start of a child’s school career by providing early intervention strategies (Atkinson,
1998).
As a result of this literature review, more research on determining the impact
of student attendance, socio-economic status and mobility on student achievement in
the primary schools is necessary. This study will add to the body of knowledge by
37

determining the affect of student attendance, socio-economic status and mobility on
academic achievement. More importantly, this study is among the very first to
examine the impact of student attendance, socio-economic status and mobility on
student achievement of third grade students in Title I schools.
By the time students reach the third grade, it is possible to accurately predict
who will eventually drop out of school and who will earn a high school diploma based
on their achievement in English (Lloyd, 1978). This study could possibly contribute to
prior research studies that indicate student achievement is effected by student
attendance. The results of this study could possibly prompt early development of
intervention strategies in the area of improving student attendance and inadvertently
affecting student achievement. The reviewed studies indicate that nonattendance is
related to poor academic performance, and schools must take an active role in
enforcing attendance as a means of improving the performance of students
(Davidson, 2002).
38

CHAPTER 3
METHODOLOGY
“Tests have historically served as an important measurement function, helping
parents, students, teachers, and others to understand which students and schools
were succeeding in which areas, and to identify students or schools that might need
additional help” (Hamilton, Stecher, Klein, 2002 p. 3).
Introduction
This study investigates the impact of student attendance, socio-economic status
and mobility on student achievement of third grade students in two Title I schools with
grades PK-3, as determined by the Virginia Standards of Learning (SOL) English and
math tests scores. Student attendance has been linked to student achievement
(Rumberger and Larson, 1998).
“Identifying certain variables that influence student achievement could affect the
teaching methods, placement, additional services, or a variety of other factors used
by schools” (Applegate, 2003, p.45). Research studies have shown that there are
identifiable variables that are predictors of student achievement (Caldas, 1993).
As educators make every effort to provide the best educational environment for
all students, it is imperative to identify the levels of student absences that are
associated with a wide range of factors that influence attendance (Schagen; Benton;
& Rutt, 2004). Individual student attendance data were collected by accessing the
Southeastern Virginia School Districts statistical system database. The 2001-2005
school year attendance, socio-economic status and mobility data for each third grade
student was used for this study. A combined student population of 233 third grade
39

students’ English and math SOL tests scores were used for this study from two Title I
schools in the Southeastern Virginia School District. The 2004-2005 English and
math SOL test scores were obtained from the office of accountability and assessment
for each third grade student. The following research questions were used to guide
the study.
1. Does attendance impact student achievement as measured by the third
grade Virginia English and math SOL tests?
2. Does socio-economic status impact student achievement as measured by
the third grade Virginia English and math SOL tests?
3. Does mobility impact student achievement as measured by the third grade
Virginia English and math SOL tests?
4. Which of the identified factors, attendance, socio-economic status and
mobility has the greatest impact on student achievement as measured by
the third grade Virginia English and math SOL tests?
Research Design
The research design that was used for this study was causal-comparative in an
attempt to imply relationships among or between variables (Charles, 1995). The
methodology used for this study was non-experimental quantitative, which was used
to investigate traits and situations and produce statistical data (Charles, 1995). This
study was conducted using archival and current data to study the relationship of
student attendance, mobility, socio-economic status, on the academic achievement
of 233 third grade students as determined by the 2004-2005 school year Standards
of Learning (SOL) tests scores in English and math at two Title I PK-3 grade schools
40
in a selected Southeastern Virginia School District. The 2005 school year data were
used to determine if there is was a statistically significant relationship between
student achievement and attendance among third grade students. The 2005 school
year data were used to determine if there was a statistically significant relationship
between student achievement and socio-economic status among third grade
students. The 2005 school year data were used to determine if there was a
statistically significant relationship between student achievement and mobility among
third grade students. The p, <05 degree of significance was found in every statistical
analysis test confirming the relevance of the relationship between achievement and
attendance, socio-economic status and mobility.
The Commonwealth of Virginia measures student achievement and school
accreditation by the Standards of Learning (SOL) tests. The tests are scored on a
scale of 0-600. Students in third grade are expected to score a minimum of 400 in the
area of English and math to show proficiency. A score of 399 or below is considered
not proficient and a score of 500 or more is considered passed advanced. Each
category content score is averaged for the school and each school’s score is
combined to determine the school districts accreditation rating. The previous school
year’s test scores are used for the current school year’s accreditation status (Virginia
Department of Education,1996; U.S. Department of Education, 2002).
For the purpose of this study, socio-economic status was determined by a
student’s enrollment in the free or reduced lunch program which is reported to the
Virginia Department of Education in October by the school district as required by the
school nutrition program. Data collected during the 2001-2005 school years were
41

used in this study for mobility and the 2004 -2005 school year data were used for
attendance and socio-economic status. Student attendance data were determined by
the number of days a student is present based on 180 school days over a period of
one year. The attendance percentage of 94 percent was used as good attendance
for public schools, while 93-85 percent was used as needing improvement and 84
percent or below was used as poor attendance as defined by the No Child Left
Behind Act (NCLB) 2001. The needing improvement and poor attendance groups
were combined into one group. The number of schools a student has attended
between 2001-2005 school years was used to determine mobility. This data were
obtained from each school through the school statistical database system.
Data Analysis
The Statistical Package for the Social Sciences (SPSS) software version 13.0
was used to process the data for this study. The statistical tests that was used is the
t-tests and Pearson correlation, which analyzed data to determine if there is a
relationship between student attendance, socio-economic status, mobility on student
achievement. The t-tests and Pearson correlation determines if there is a relationship
between individual variables of attendance, socio-economic status and mobility as
related to the dependent variable academic achievement, as well as any significant
relationship of the combined combination of variables to student performance on the
2005 school year Virginia SOL English and math tests. “The resultant f value was
considered against a table of f distribution in order to determine the level of
significance” (Charles, 1995, p. 86).
Analysis of the data established the basis for further study educators in this
42

school district continue to research indicators that impact student achievement in
order to help all students succeed (Sparks, 2005).
Description of Population
This study was conducted in a Southeastern Virginia School District that has 28
elementary schools. There are seven schools that are PK-2, two schools PK-3, six
schools that are 3-5, one school that is 4-5 and 11 schools that are K-5. Thirteen of
these schools are Title I schools because the percentage of students receiving free
or reduced lunch. Third grade students from two Title 1 PK-3 grade schools were the
population selected for study because of their unique combination of grades as
compared to other schools within this school district.
The population that was used for this study consisted of 233 third grade
students from two PK-3 grade Title 1 schools. All third grade students in the school
district are required to take the Virginia Standards of Learning (SOL) tests. These
tests were used as the measure of student achievement in the areas of English and
math. Third grade student achievement test scores from the SOL assessment
instrument and attendance, socio-economic status and mobility variables were the
focus for this study.
Sampling
Third grade students from two Title 1 PK-3 grade schools in a large
Southeastern Virginia School District was the population used in this study because
of their unique combination of grades as compared to other schools within this school
district. The results of the 2004-2005 school year SOL English and math tests were
used for this study. All third grade students who received a score on the SOL English
43

and math tests at the school were used as the population for this study. The
Southeastern Virginia School District assessment and accountability office provided
the data for the third grade student testing population. The data were distributed to
the researcher without identifying characteristics to ensure anonymity. Using the
entire third grade student population with the Virginia SOL tests scores of 233
students will guarantee a valid representation for this study. Student records from the
school district’s statistical database system were used to collect student attendance,
free or reduced lunch status and the number of schools a student attended during the
2001-2005 school years.
Instrumentation
Assessment plays a vital role in today’s education system. Assessment results
are often the force that shapes the publics perception about the quality of a school
(Applegate, 2003, p.48). Accurately compiling, analyzing, and reporting assessment
data and using research to identify ways to help all students succeed is an important
task for educators and stakeholders (Sparks, 2005).
The Virginia SOL tests are designed to mirror legislative reforms and
assessment guidelines for Virginia’s Standards of Accreditation (SOA) by measuring
the academic progress of students. The SOL tests for third grade students include
English, math, social science and science assessments. For the purpose of this study
individual student English and math results were statistically analyzed. Assessments
are not timed; the English portion has two parts; English and writing, which produces
a combined score. All three assessments are administered on different days
determined by the school district within specific guidelines from the Virginia
44

Department of Education.
Validity/Reliability
The Standards of Learning (SOL) assessment is designed in accordance with
the Standards of Learning blueprint. The blueprint outlines the percentages and
number of questions that will come from each content area. The Standards of
Learning tests are in alignment with other criterion reference tests. The third grade
Standards of Learning (SOL) English and math tests were determined to be a quality
criterion for measuring students’ achievement in this study (U.S.Department of
Education,1996).
Data Collection Procedures
Data for this study were collected from the 2004-2005-school year Virginia SOL
tests scores in English and math. Attendance percentages data were collected from
the 2004-2005 school year, eligibility for free or reduced lunch (SES) as of February
1, 2005, and mobility data were collected from school year data. Data showing
individual student SOL scores for English and math, attendance percentages,
eligibility for free or reduce lunch (SES), and mobility rates were made available
through the school’s statistical database system and the assessment and
accountability office within the Southeastern Virginia School District. The selected
data used for this study are submitted by each public school division to the Virginia
Department of Education (VDOE) that will serve as an additional database for this
investigation. Permission for this study was obtained from the director of student
services. A request form to conduct research was filed with the district office, which
ensures confidentiality. The researcher also received IRB approval for this study from
45

the Research Compliance Office at Virginia Polytechnic Institute and State University,
Blacksburg, Virginia, which regulates human subject research.
Attendance percentages that were used for this study were decided based on
the 94 percent attendance requirement for Adequate Yearly Progress (AYP) that
comes from the No Child Left Behind Act (NCLB) 2001. The 94 percent attendance
requirement has been deemed as good, average attendance for public schools, while
93-85 percent was determined as needing improvement, and 84 percent and below
as poor attendance (U.S. Department of Education, 2001).
Socio-economic status was divided into two groups those students who qualify
or do not qualify for free or reduced lunch. Students who qualified for free or reduced
lunch were determined to have low socio-economic status, while those who do not
qualify were determined to have high socio-economic status.
Student mobility was determined by the number of schools the student attended
during the 2001-2005 school years. A higher number of schools attended by a
student would exhibit a higher degree of mobility; while a low number of schools
attended would exhibit a lower degree of mobility. Therefore, a higher number of
schools attended established that the student moved a various number of times
during his/her primary school years.
Similar to Applegate (2003), mobility was divided into three categories for the
purpose of this study. Students who attended only one school within the 2001-2005
school years were determined to have low mobility, those students attending two
schools within the 2001-2005 school years were determined to have medium
mobility, and those students attending three or more schools within the 2001-2005
46

school years were determined to have high mobility.
Variables
The dependent variable for this study was third grade individual student
achievement on the Standards of Learning (SOL) English and math tests. The
independent variables were student attendance, mobility and socio-economic status.
For the purpose of the study, third grade student achievement tests scores from the
Standards of Learning (SOL) assessment instrument and the effect of attendance,
socio-economic status and mobility on student achievement were examined.
The data for the SOL tests were reported as the mean scaled score. The
Virginia Department of Education targets the pass proficient category as the goal for
all students to obtain. Statistical analysis was performed on the 2004-2005 SOL data
to determine if attendance, socio-economic status and mobility are related to student
achievement.
Methodology Summary
This study investigated the impact student attendance, socio-economic status
and mobility had on achievement of third grade students in two Title I schools with
grades PK-3, as determined by the Virginia Standards of Learning (SOL) English and
math tests scores. “Identifying certain variables that influence student achievement
could affect the teaching methods, placement, additional services, or a variety of
other factors used by schools” (Applegate, 2003, p.45). There are certain identified
variables that are predictors of student achievement (Caldas, 1993).
The ANOVA was proposed but the data were not suitable to be analyzed with
an ANOVA. After further examination, the t-tests were used instead of the ANOVA
47
statistical tests to show the relationship between student attendance, socio-economic
status, mobility and academic achievement of students. The significance level of .05
was used in every statistical analyses test to validate the significance of the
relationship between attendance, socio-economic status, and mobility on academic
achievement.
48

CHAPTER 4
REPORT OF FINDINGS
Introduction
The purpose of this study was to determine the impact of student attendance,
socio-economic status and mobility on student achievement of third grade students in
two Title I schools with grades PK-3, as determined by the Virginia Standards of
Learning (SOL) English and math test scores. The following research questions
guided this study:
1. Does attendance impact student achievement as measured by the third
grade Virginia English and math SOL tests?
2. Does socio-economic status impact student achievement as measured by
the third grade Virginia English and math SOL tests?
3. Does mobility impact student achievement as measured by the third grade
Virginia English and math SOL tests?
4. Which of the identified factors of attendance, socio-economic status and
mobility has the greatest impact on student achievement as measured by
the third grade Virginia English and math SOL tests?
The descriptive statistics data were analyzed using correlational comparisons,
and t-tests. The ANOVA was proposed but the data was not suitable to be analyzed
with an ANOVA. After further examination, the t-tests were used instead of the
ANOVA statistical test. The significance level of .05 was used in every statistical
analyses test to validate the significance of the relationship between attendance,
socio-economic status, and mobility on academic achievement.
49

The analysis of data in this chapter presents the relationship of the independent
variables of attendance, socio-economic status, and mobility to the dependent
variable of achievement on the Virginia English and math SOL tests. In the area of
attendance, 19 (8.2%) of students were excluded based on the fact the students
were not enrolled in school all year. Attendance percentages were calculated based
on days present out of the 180 possible school days. Nineteen students were
excluded because they did not have a possible 180 days; therefore, the total group
involved in this study was 214 students. In accordance with Adequate Yearly
Progress (AYP) guidelines attendance percentages were decided based on the 94
percent attendance requirement that comes from the No Child Left Behind Act
(NCLB) 2001.
Socio-economic status was divided into two groups including those students
who qualified or did not qualify for free or reduced lunch. Students who qualified for
free or reduced lunch were determined to have low socio-economic status, while
those who did not qualify were determined to have high socio-economic status.
Student mobility was determined by the number of schools the student
attended during the 2001-2005 school years. A higher number of schools attended
by a student would exhibit a higher degree of mobility; while a low number of schools
attended would exhibit a lower degree of mobility. Therefore, a higher number of
schools attended established that the student moved a number of times during
his/her primary school years. Similar to Applegate (2003), mobility was divided into
three categories for the purpose of this study. Students who attended only one
school within the 2001-2005 school years were determined to have low mobility,
50

those students attending two schools within the 2001-2005 school years were
determined to have medium mobility, and those students attending three or more
schools within the 2001-2005 school years were determined to have high mobility.
Presentation of Data
The Commonwealth of Virginia measures student achievement and school
accreditation by the Standards of Learning (SOL) tests. The tests are scored on a
scale of 0-600. Students in third grade are expected to score a minimum of 400 in the
area of English and math to show proficiency. A score of 399 or below is considered
failed or not proficient and a score of 500 or more is considered passed advanced.
For this study, in the area of English 156 (74.6%) of the students were pass
proficient, 29 (13.9%) failed /not proficient and 24 (11.5%) of the students were pass
advanced. In the area of math 112 (52.3%) of the students were pass proficient, 35
(16.4%) failed/not proficient and 67 (31.3%) of the students were pass advanced.
Initially, 233 English and math SOL tests scores, were selected for analysis.
However, some tests scores were not analyzed because of missing or incomplete
achievement or attendance data. English and math SOL tests scores of 214 students
who were enrolled throughout the 2004-2005 school year in the selected school
district, were analyzed. However, some students did not have English test scores
reported. Of the total group of students included in the analyses, 209 (97.7%)
participated in the Virginia English SOL tests, while five (2.3%) students did not
participate in the Virginia English SOL test. Since the independent variables,
attendance, socio-economic status and mobility were analyzed separately to
determine the relationship to the dependent variable, students’ academic
51

achievement on the Virginia English and math SOL tests, 100% of the total
population in each group who participated in the tests was analyzed. In the area of
math, all 214 students participated in the Virginia math SOL test (see Table 1).
Table 1
Descriptive Statistics Overall Student Sample for English and math Grade 3
N = Potential Participants
Missing Scores N =Total Participants
English
214
5
209
Math
214 0 214
Note. N represents the number of students.
Research Question 1: Attendance and Achievement
The first research question focused on the impact of attendance on student
achievement as measured by the Virginia English and math SOL tests.
The attendance percentage of 94% was used as good average attendance for
public schools, while 93-85 percent was used as needing improvement and 84
percent or below was used as poor attendance as defined by the No Child Left
Behind Act (NCLB) 2001. Students in the good attendance group represented 176
(82.2%) of the students, 34 (15.9%) the students were in the needing improvement
attendance group and 4 (1.9%) of the students were in the poor attendance group.
Since the poor attendance group had too few students to keep as a separate group
the needing improvement and poor attendance group were combined into one group.
An Independent t-test was performed on the independent variable of
attendance and the dependent variable of the Virginia SOL English achievement.
Table 2 shows the mean score for students with good attendance (452.02) was
52
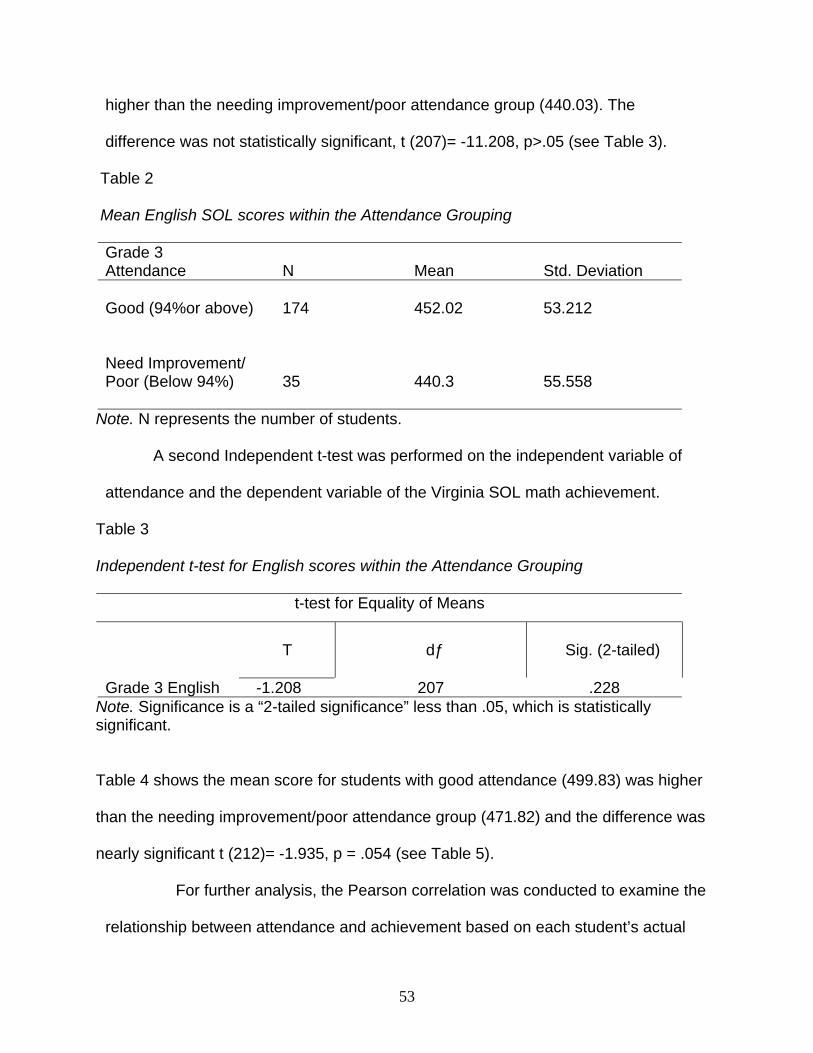
higher than the needing improvement/poor attendance group (440.03). The
difference was not statistically significant, t (207)= -11.208, p>.05 (see Table 3).
Table 2
Mean English SOL scores within the Attendance Grouping
Grade 3 Attendance
N
Mean
Std. Deviation
Good (94%or above) Need Improvement/ Poor (Below 94%)
174 35
452.02 440.3
53.212 55.558
Note. N represents the number of students.
A second Independent t-test was performed on the independent variable of
attendance and the dependent variable of the Virginia SOL math achievement.
Table 3
Independent t-test for English scores within the Attendance Grouping
t-test for Equality of Means
T
dƒ
Sig. (2-tailed)
Note. Significance is a “2-tailed significance” less than .05, which is statistically significant.
Grade 3 English -1.208 207 .228
Table 4 shows the mean score for students with good attendance (499.83) was higher
than the needing improvement/poor attendance group (471.82) and the difference was
nearly significant t (212)= -1.935, p = .054 (see Table 5).
For further analysis, the Pearson correlation was conducted to examine the
relationship between attendance and achievement based on each student’s actual
53

attendance rate and English and math scores. The correlation between attendance
percentage and English achievement was low and showed no significant relationship,
r =. 099, p = .155 (see Table 6). The correlation between attendance percentage and
math achievement showed a significant relationship, r = .136, p = .048 (see Table 7).
However, as shown by the correlation, the relationship was relatively weak.
Table 4
Mean Math SOL scores within the Attendance Grouping
Grade 3 Attendance
N
Mean
Std. Deviation
Good (94%or above) Need Improvement/ Poor (Below 94%)
176 38
499.83 471.82
80.317 83.755
Note. N represents the number of students.
Table 5
Independent t-test for Math scores within the Attendance Grouping
t-test for Equality of Means
T
dƒ
Sig. (2-tailed)
Note. Significance is a “2-tailed significance” less than .05, which is statistically significant.
Grade 3 English -1.935 212 .054
In summary, the results show there was a significant relationship between
attendance and students’ academic achievement on the Virginia math SOL test, but
the relationship was relatively weak. However, there was no significant relationship
54
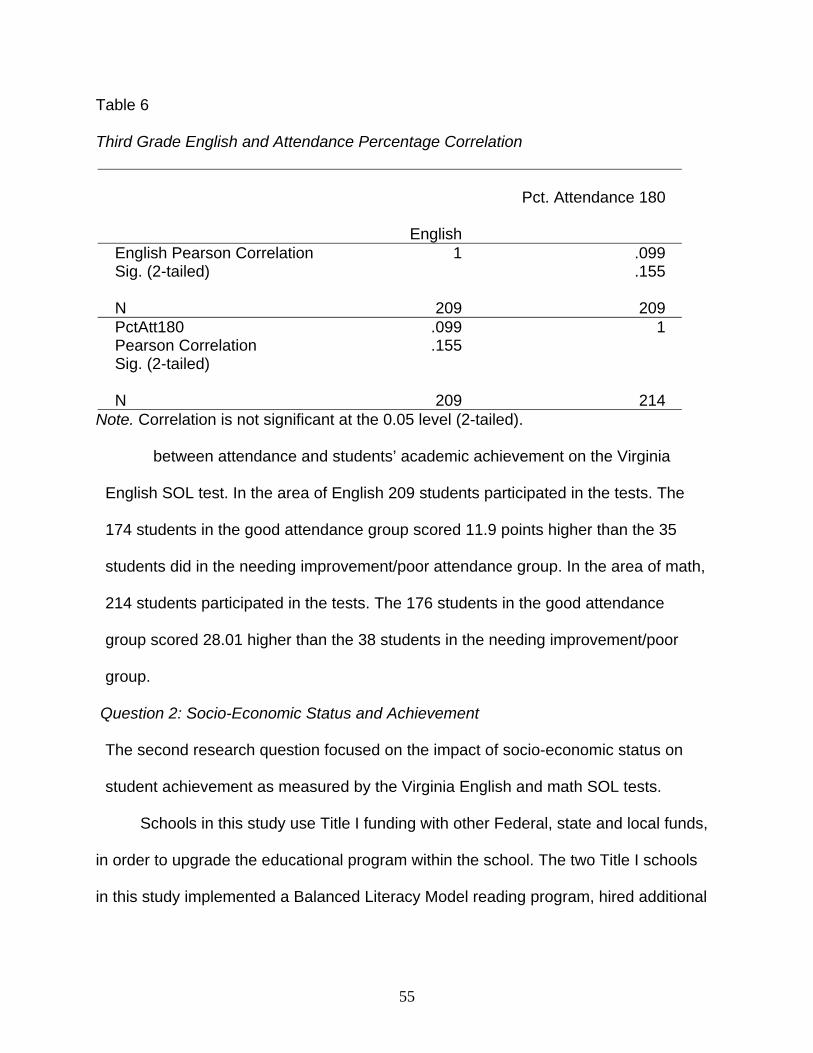
Table 6
Third Grade English and Attendance Percentage Correlation
English
Pct. Attendance 180
English Pearson Correlation Sig. (2-tailed) N
1
209
.099
.155
209 PctAtt180 Pearson Correlation Sig. (2-tailed) N
.099
.155
209
1
214 Note. Correlation is not significant at the 0.05 level (2-tailed).
between attendance and students’ academic achievement on the Virginia
English SOL test. In the area of English 209 students participated in the tests. The
174 students in the good attendance group scored 11.9 points higher than the 35
students did in the needing improvement/poor attendance group. In the area of math,
214 students participated in the tests. The 176 students in the good attendance
group scored 28.01 higher than the 38 students in the needing improvement/poor
group.
Question 2: Socio-Economic Status and Achievement
The second research question focused on the impact of socio-economic status on
student achievement as measured by the Virginia English and math SOL tests.
Schools in this study use Title I funding with other Federal, state and local funds,
in order to upgrade the educational program within the school. The two Title I schools
in this study implemented a Balanced Literacy Model reading program, hired additional
55

Table 7
Third Grade Math and Attendance Percentage Correlation
Math
Pct. Attendance 180
Math Pearson Correlation Sig. (2-tailed) N
1
214
.136 .048
214
PctAtt180Pearson Correlation Sig. (2-tailed) N
.136 .048
214
1
209
Note. Correlation is not significant at the 0.05 level (2-tailed).
reading support personnel and have reduced class size in order to accommodate the
needs of the students. These Title I schools serve an eligible school attendance area
in which at least 40 percent of the children are enrolled in the free/or reduced lunch
program (NCLB, 2001).
Socio-economic status was divided into two groups including those students
who qualified or did not qualify for free or reduced lunch. Students who qualified for
free or reduced lunch were determined to have low socio-economic status, while
those who do not qualify were determined to have high socio-economic status. Of the
overall group of 214 students, 110 (51.4%) received free or reduced lunch, while 104
(48.6%) did not.
An Independent t-test was performed on the independent variable of socio-
economic status and the dependent variable of the Virginia SOL English
achievement. Table 8 shows the mean score for students with higher socio-economic
status (459.31) was higher than the mean score for students with lower socio-
56

economic status (441.32), the difference was significant, t (207)=-2.450, p=. 015 (see
Table 9).
Table 8
Descriptive Statistics for Student (SES) F/R Lunch and Not F/R Lunch for English Grade 3 (SES)
N = Potential Participants
Mean Scores Std. deviation
Low SES
F/R Lunch
108
441.32
52.223
Higher SES
Not F/R Lunch
101 459.31 53.880
Note. N represents the number of students that took the English tests. Five students did not take the English tests.
Table 9
Independent t-test for English and Socio-Economic Status
t-test for Equality of Means
T
dƒ
Sig. (2-tailed)
Note. Significance is a “2-tailed significance” less than .05, which is statistically significant.
Grade 3 English -2.450 207 .015
A second Independent t-test was performed on the independent variable of
socio-economic status and the dependent variable of the Virginia SOL math
achievement. As shown in Table 10, the mean score for students with higher socio-
economic status (512.55) was higher than the mean score for students with lower
socio-economic status (478.13), the difference was significant, t (212) = -3.154, p=.
002 (see Table 11).
57

In summary, the results reveal a significant relationship exists between
students’ socio-economic status and academic achievement on the Virginia English
SOL test and a significant relationship between students’ socio-economic status and
academic achievement on the Virginia math SOL test. Students in the higher socio-
economic status scored 18 points higher than students in the low socio-economic
status group in the area of English. In the area of math, students in the high socio-
economic status group scored 34.42 points higher than students in the low socio-
economic status group. Since the independent variable socio-economic status is a
categorical variable the Pearson correlation was not used in the analysis.
Table 10
Descriptive Statistics for Student (SES) F/R Lunch and Not F/R Lunch for Math Grade 3 (SES)
N = Potential Participants
Mean Scores Std. deviation
Low SES
F/R Lunch
110
478.13
79.221
104 512.55 80.384 Higher SES
Not F/R Lunch Note. N represents the number of students that took the Math tests.
Question 3: Mobility and Achievement
The third research question focused on the impact of mobility on student
achievement as measured by the Virginia English and math SOL tests.
Initially, for the purpose of this study mobility was divided into three
categories. However, after performing frequencies on the mobility groups, the group
with high mobility only had four students and represented 1.9% of the sample (see
Table 12). Therefore, it was necessary to collapse the high and medium mobility
58

groups into one group in order to make the analysis more meaningful. This resulted
in 182 students in the low mobility group (85.0%) and 32 students (15.0%) in the
medium/high mobility group (see Table 13).
Table 11
Independent t-test for Math and Socio-Economic Status
t-test for Equality of Means
Note. Significance is a “2-tailed significance” less than .05, which is statistically significant.
Students who attended only one school within the 2001-2005 school years
were determined to have low mobility, those students attending two schools within
the 2001-2005 school years were determined to have medium mobility, and those
students attending three or more schools within the 2001-2005 school year were
determined to have high mobility.
An Independent t-test was performed on the independent variable of
mobility and the dependent variable of the Virginia SOL English achievement. Table
14 shows the mean score for students with medium/high mobility (449.57) was
somewhat higher than the mean for the low mobility group (452.58, the difference
was not significant, t (207)= -.288, p > .05 (see Table 15)
A second independent t-test was performed on the independent variable of
mobility and the dependent variable of the Virginia SOL math achievement. Table 16
T
dƒ
Sig. (2-tailed)
Grade 3 English -3.154 212 .002.
59
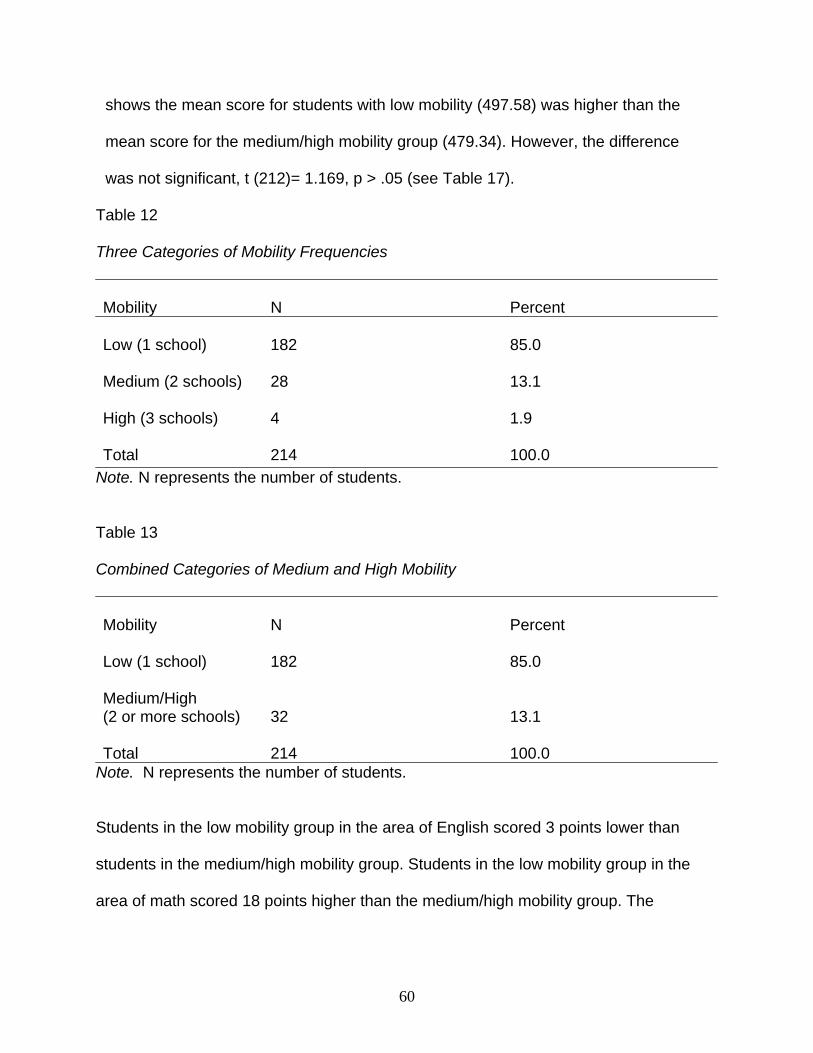
shows the mean score for students with low mobility (497.58) was higher than the
mean score for the medium/high mobility group (479.34). However, the difference
was not significant, t (212)= 1.169, p > .05 (see Table 17).
Table 12 Three Categories of Mobility Frequencies Mobility
N
Percent
Low (1 school) Medium (2 schools) High (3 schools) Total
182 28 4 214
85.0 13.1 1.9 100.0
Note. N represents the number of students.
Table 13
Combined Categories of Medium and High Mobility Mobility
N
Percent
Low (1 school) Medium/High (2 or more schools) Total
182 32
85.0 13.1
214 100.0 Note. N represents the number of students.
Students in the low mobility group in the area of English scored 3 points lower than
students in the medium/high mobility group. Students in the low mobility group in the
area of math scored 18 points higher than the medium/high mobility group. The
60

Table 14
Mean English SOL scores for the Mobility Grouping Grade 3 Mobility
N
Mean
Std. Deviation
Low (1 school) Med/High (2 or more schools)
178 31
449.47 52.290 452.58 61.859
Note. N represents the number of students.
Table 15
Independent t-test for English and Mobility
t-test for Equality of Means
T
dƒ Sig. (2-tailed)
Note. Significance is a “2-tailed significance” less than .05, which is statistically significant.
Grade 3 English -.288 207 .774
Table 16
Mean Math SOL scores for the Mobility Grouping
Grade 3 Mobility
N
Mean
Std. Deviation
Low (1 school) Med/High (2 or more schools)
182
497.58 80.742
32 479.34 84.968
Note. N represents the number of students.
61

Table 17
Independent t-test for Math and Mobility
t-test for Equality of Means
T
dƒ Sig. (2-tailed)
Note. Significance is a “2-tailed significance” less than .05, which is statistically significant.
difference in points could mean the difference between students passing
proficient, passing advanced, or not passing/ not proficient.
For further analysis, the Pearson correlation was also conducted to examine
the relationship between mobility and English and math scores. The results showed
no significant relationship between mobility and English achievement, r = -.013, p =
.851(see Table 18). The results also showed no significant relationship between
mobility and math achievement, r = -.100, p = .144 (see Table 19).
Table 18
Third Grade English and Mobility Percentage Correlation
English Mobility
Grade 3 English 1.169 212 .244
English Pearson Correlation Sig. (2-tailed) N
1
214
-.013 .851
209
Mobility Pearson Correlation -.013 1 Sig. (2-tailed) .851
N 209 209
Note. Correlation is not significant at the 0.05 level (2-tailed). N represents the number of students that took the English tests. Five students did not take the English tests.
62

In summary, the results of the t-tests and Pearson correlation were consistent
and showed there was no relationship between mobility and student achievement in
English and math.
Table 19
Third Grade Math and Mobility Percentage Correlation
Math Mobility
Math Pearson Correlation Sig. (2-tailed) N
1
214
-.100 .144
214
Mobility Pearson Correlation -.100 1 Sig. (2-tailed) .144 N 214 214
Note. Correlation is not significant at the 0.05 level (2-tailed). N represents the number of students that took the math tests. Question 4: Factors with the Greatest Relationship and Achievement
The fourth research question asked which of the identified factors had the
greatest impact on student achievement as measured by the Virginia English and
math SOL tests.
The data suggests that for the variable of attendance, student achievement
was only significant in the area of math. In addition, the Pearson correlation test
showed a relatively weak relationship between attendance and math achievement.
The variable that had the greatest impact on student achievement was socio-
economic status. There was a significant relationship between socio-economic status
and the level of student achievement on both the Virginia SOL English and math
tests. The results did not show significant relationships between mobility and student
achievement.
63

Summary
In this study, descriptive statistics data were examined to determine if there
was a relationship between student attendance, socio-economic status, mobility and
academic achievement of third grade students in two Title I schools with grades PK-
3, as determined by the Virginia Standards of Learning (SOL) English and math test
scores.
The correlations between the mean Virginia SOL English and math scores and
the independent variables of attendance and mobility using a Pearson Correlation
test with correlation significant at the .05 level are shown on Tables 6, 7, 17 and 18.
The Pearson Correlation was not used for the independent variable of socio-
economic status is a categorical variable the Pearson correlation test was not used.
The standard deviation for each is shown as well as the level of significance. A
positive correlation shows that as one variable goes up so does the other, such as
when attendance increases so does math achievement. A negative correlation shows
that as one variable increases the other variable decreases (Applegate, 2003). In
addition, the tables described how each level of the independent variables is affected
and to what extent. The main result of a correlation or “r” can range from –1.0 to
+1.0. The closer r is to +1 or –1, the more closely the two variables are related
(Hinkle, Wiersma and Jurs, 1998).
This chapter examined quantitative data received from a Southeastern Virginia
School District on student attendance, socio-economic status, mobility and the
student achievement levels of third grade students in two Title I schools on the
Virginia SOL English and math tests. Findings conclude that there is a significant
64

relationship between the variable socio-economic status and student achievement
and attendance and math achievement.
Chapter 5 will include the an overview, summary of the findings, discussion of
the findings, limitations of the study, implications, recommendations for practice,
implications for future research and conclusion.
65

CHAPTER 5
“ Identifying certain variables that influence student achievement could affect
the teaching methods, placement, additional services, or a variety of other factors
used by schools” (Applegate, 2003, p.45).
OVERVIEW
The purpose of this study was to determine the relationship between student
attendance, socio-economic status, mobility and the academic achievement of third
grade students in two Title 1 schools with grades PK-3, as determined by the Virginia
Standards of Learning (SOL) English and math test scores. This study focused on
third grade achievement on the SOL tests in the area of English and math and the
relationship with attendance, socio-economic status and mobility.
Research conducted regarding the relationship between student attendance,
socio-economic status, mobility and students’ academic achievement, with results
that are inconsistent with this study (Smith, 1998; Norris, 2000; Applegate, 2003;
Zamudio, 2004). “Predicting student achievement by identifying certain factors or
variables that relate to student success can be a valuable asset to teachers,
counselors, administrators, and members of the community. Student achievement
and success are the ultimate goals of the educational intuitions of today” (Applegate,
2003, p.75).
Information gathered from the results of this study can assist the Southeastern
Virginia School District exploring the findings and considering implications for future
research in an effort to find ways to improve student attendance and academic
achievement.
66

Summary of Findings
Analysis of the data produced the following findings:
1. There was a significant relationship found between the dependent variable of
students’ academic achievement on the Virginia math SOL test and the
independent variable of student attendance (212) = -1.935, p = .054, however
the correlation was relatively weak, r = .136, p= .048. There was no significant
relationship found in this study between English achievement and attendance
t (207) = -11.208, p> .05. For math, the good (94% or higher) attendance group
mean score (499.83) was higher than the poor/needing improvement
attendance group mean score (471.82). In the area of English, the good (94%
or higher) attendance group mean scores (452.02) were higher than the
poor/needing improvement attendance group mean scores (440.3), but not
significantly higher.
2. There was a significant relationship between students’ academic achievement
on the Virginia English SOL test and student socio-economic status, t (207) = -
2.450, p = .015 and a significant relationship between students’ academic
achievement on the Virginia math SOL test and student socio-economic status,
t (212) = -3.154, p= .002. Students who were not enrolled in the free or reduced
lunch program for English (459.31) and math (512.55) mean score was higher
than English (441.32) and math (478.13) mean score for students enrolled in
the free or reduced lunch program. The highest mean score for students not
enrolled in the free or reduced lunch program was in the area of math (512.55)
67

3. There was no significant relationship found between the dependent variable of
students’ academic achievement on the Virginia SOL English (t (207) = -.288, p
>.05) and math (t (212) = 1.169, p> .05). tests and the independent variable of
student mobility. Opposite of what was expected, students with low mobility, the
mean score (449.57) were somewhat lower than the mean score for students in
the medium/high mobility group (452.58) in the area of English. For math, the
mean score for students with low mobility (497.58) was higher than the mean
score for students in the medium/high mobility group (479.34), which was in the
expected direction.
4. There was a significant relationship between the independent variable of socio-
economic status and the level of student achievement on the Virginia English
and math SOL tests. Results have shown that the independent variable of
attendance has a significant relationship with math, t (212) = -3.154, p= .002;
however, the Pearson correlation test showed a relatively weak relationship.
Therefore, students’ socio-economic status had the greatest relationship with
student achievement as measured by the Virginia English and math SOL tests.
Through statistical analysis and treatment of the data it can be concluded that
the only independent variable that had a significant relationship to student
achievement on both the Virginia SOL English and math tests is socio-economic
status, however a significance was found between student attendance and student
achievement in the area of math. The significance of the relationship was not relevant
for both the dependent variables of student achievement unlike socio-economic
status. Therefore, statistical treatment of the quantitative data using correlation and t-
68

test analyses confirmed that the strongest relationship was between socio-economic
status and student achievement. These findings are significant for school districts
and principals in a No Child Left Behind (NCLB) legislation environment, which
separates students enrolled in the free or reduced lunch program into a subcategory.
The No Child Left Behind (NCLB) Act has targeted this unique group of students and
school systems are required to educate all students with emphasis on the subgroups,
despite barriers that impact student achievement. Therefore, specific research linked
to improving student achievement is vital for educators in order to reach the goals
under NCLB.
Discussion of Findings
Analyses of data revealed that the independent variable of students’ socio-
economic status is directly related to the dependent variable of student achievement
on the Virginia SOL tests in the area of English and math. Furthermore, a significant
but weak relationship was found between attendance and the Virginia SOL math test.
No statistically significant relationship was found between the independent variable of
mobility and the dependent variable of student achievement on the Virginia SOL
English or math tests. Likewise, the data did not reveal a statistically significant
relationship between the independent variable of attendance and the Virginia SOL
English test.
In the areas where no relationship was found between the independent and
dependent variables, this may be explained through the limitations of the study. The
findings of this study are limited to the sample used. The sample drawn from the
student population of one school system and included only Title I schools that house
69

PK through Third grade students. The results can only be generalized to those
students and Title I schools in that school district although there are possible
implications beyond these schools. Additional limitations are listed in the limitation
section of the research. However, the overall findings show that variables do exist in
Title I schools that have a relationship to student achievement.
Literature suggests that a relationship exists between attendance, socio-
economic status, mobility and student achievement (Applegate, 2003; Gamble, 2004;
Zamudio, 2004). Ziegler (1972) attempted to define student attendance and
investigated the importance of student attendance and its relationship to student
achievement. He concluded that student attendance is related to student
achievement in reading and math. In this study a relationship was found between
student attendance and math, however English achievement was not found to be
related to attendance. This could be a result of the reading program implemented in
these two Title I schools, lower class sizes, additional reading support personnel,
remediation programs or once the basic strategies of reading are taught students can
read independently of the teacher (Clay, 2002). Redick and Nicoll (1990) concluded
in their study that students who attend school regularly have higher grades than
those students with high absences, which support earlier research.
Additional studies reviewed used mobility, and socio-economic status as the
independent variables to determine the relationship between the dependent variable
student achievement. Rumberger and Larson, (1998) found mobility had a negative
impact on student achievement. “Students who move frequently suffer academically
from the discontinuity of instruction” (Horwitch, 2004, p.4).
70

Gamble (2004) indicated that student mobility negatively effects student
achievement in reading and mathematics, which supports previous research. The
findings of (Rumberger and Larson, 1998; Gamble, 2004; Horwitch, 2004), do not
support the findings of this study. In this current study there was no relationship found
between mobility and student achievement on the Virginia English and math SOL
tests. It is possible that mobility over the years does not affect achievement because
there are opportunities to provide academic interventions where as mobility within a
school year does, because it may be more difficult to effectively provide academic
remediation. In addition, mobility in this study was collapsed into two categories
because of the size of the population where as Applegate (2003) used three
categories, which could lead to different findings.
Zamudio (2004) revealed that socio-economic status was related to student
achievement for schools with a high socio-economic composition. The findings of this
study also showed a significant relationship between socio-economic status and
students’ academic achievement on the Virginia English and math SOL tests. These
findings substantiate previous study findings (Montano-Harmon, 1991; Zamudio,
2004; Applegate, 2003; Norris, 2000). Students in this study who were not enrolled in
the free or reduced lunch program for English and math had mean scores that were
higher than students enrolled in the free or reduced lunch program. The highest
mean score was in the area of math.
In the review of literature, no studies were found that addressed the
relationship between student attendance, socio-economic status, mobility and
student achievement of third grade students in Title I school with grades PK-3, as
71
determined by the Virginia Standards of Learning (SOL) English and math test
scores. There were studies that addressed the relationship between student
attendance, socio-economic status, mobility as well as additional variables not
included in this study and academic achievement of elementary, middle and high
school students. Similar study findings and the findings of this study revealed a
significant relationship between socio-economic status, attendance and students’
academic achievement.
Limitations of the Study
1. The study is limited to the sample used that was drawn from the student
population of one school system and two Title I schools that house PK through
Third grade students.
2. The study results are limited because the schools may not be typical of other
schools or school districts in the state or country.
4. The study results are limited because they were based on the 2005 third grade
Virginia SOL English and math tests. Other academic areas that were tested
were excluded from this study.
5. The study is limited because the Virginia SOL test is not a national testing
instrument, so achievement levels could differ using another assessment tool.
6. The study is limited because the data were combined from both schools,
therefore individual school variations were not apparent.
Implications
This study found that for this Southeastern Virginia School District’s third grade
students in two Title I schools there was a significant relationship between socio-
72

economic status and student achievement on the Virginia English and math SOL tests
and a statistically significant but weak relationship between student attendance and
student achievement on the Virginia math SOL test. The findings of this study indicate
that there are variables outside the classroom setting that affect students and their
academic achievement. Also, the findings of this study indicate a need for school
districts to provide more educational interventions and resources to those schools with
a high number of students who are enrolled in the free or reduced lunch program and
struggle with regular school attendance.
Based on the reviewed studies and school district’s accountability
requirements, educational leaders will find it necessary to focus on areas or
predictors within the family, society, or individual circumstances of the child, as well
as on the academic surroundings and materials in order to meet the diverse needs of
the students (Hickock, 2002; Zamudio, 2004).
Recommendations for Practice
Through analysis of the data and research conducted for this study, the
following recommendations for the Southeastern Virginia School District’s Title I
program are suggested in order to maximize student achievement.
1. The academic achievement of students enrolled in the free or reduced lunch
program should be monitored once they enter school. School districts should
provide those students who are achieving at lower levels with additional
educational support and educational resources in order to bridge the
achievement gap.
73

2. The school district maintain or develop strict guidelines for student attendance
and monitor factors that could hinder a student from attending school on a
regular basis.
Implications for Future Research
Through analysis of the data and research conducted in this study the
following implications for future research were revealed:
1. This study investigated the variables of attendance, socio-economic status,
mobility and the impact those variables had on student achievement.
Implications of the findings reveal the need to replicate this study using
gender and ethnicity as independent variables to determine if those
variables impact the dependent variable student achievement, in order to
provide the best education for all students.
2. Since the size of the sample was small and the low/medium socio-economic
status and medium/high mobility groups were collapsed into one group, it is
suggested that this study be replicated using all Title I PK-3 schools in the
Commonwealth of Virginia to determine if similar results are found to
substantiate the findings of this study.
3. Due to the increase in school systems accountability to raise student
achievement, replicating this study using primary non-Title I schools could
determine if all students are impacted by these factors in the same manner.
4. It is recommended that this study be replicated using multiple assessment
measures for analysis of students’ academic achievement to determine if
additional information is found that could enhance student achievement.
74

5. A longer period of assessment could produce different results and determine
if achievement gaps increase or decrease as students continue their
elementary, middle and high school years of schooling.
Reflections
This study identified the independent variable of socio-economic status to
have the greatest impact on the dependent variable of student achievement.
"Historically, poor children and minority children have been disproportionately at-risk
in our schools, even through research provides a more complex picture of students
at-risk ” (Applegate, 2003, p.23).
Societal dilemmas are at the root of the variables discussed in this study.
Educators need to focus on why and how school leaders can make improvements.
Monitoring and evaluating the educational process for students in the primary level is
essential in analyzing where and when the academic breakdown begins and what
intervention strategies should be developed to help students continue to achieve is
the first step to addressing specific issues associated with low socio-economic status
students.
One of the National educational goals in 2000, states that all children would
start school ready to learn (Bushweller, 1999). For students with low socio-economic
status, who do not have an opportunity to attend a childcare center that focuses on
school readiness, often lag behind their peers from the start of their school career
(Applegate, 2003).
The goal of the No Child Left Behind (NCLB) Act is to educate disadvantaged
children (NCLB, 2001). Children from lower socio-economic status have less learning
75

opportunities and fewer experiences to draw from when faced with learning situations
(Sanders & Epstein, 2000). Therefore, educators put forth a great deal of effort trying
to close the outside experience gaps using field trips, virtual tours and hands-on
activities to provide students with a chance to experience success and raise self-
esteem.
Attendance and mobility results were different than expected. Though the
impact of attendance only occurred statistically significant for student math
achievement, there were percentage point variations in math mean scores.
Percentage points could be the difference between whether or not students pass
proficient or fail. The data reveals that mobility and attendance are not a problem in
itself; it is a symptom of socio-economic status (Stover, 2000).
Therefore, while the socio-economic status of students, in this study, had a
statistically significant impact on student achievement in English and math, it also
affects the variables of student attendance and student mobility. This is why, for the
Southeastern Virginia School District, these findings warrant further investigation.
Conducting this study has given this researcher a great deal of understanding
and appreciation of the process of quantitative research. Collecting the data and
following the methodology to obtain the results was exciting. The proposed statistical
test had changed due to missing or incomplete data, which resulted in the exclusion
of students from the attendance group and students from the English group for non-
participation in the English test. The three separate groups of attendance and the
three separate groups of mobility were collapsed based on the sample size in the
categories to make the findings more meaningful.
76

The findings of this study will alert the school district to the urgency of
identifying students at the primary level for variables that negatively affect their
academic performance on Virginia English and math Standards of Learning tests
(SOL). Also the expectation for students under the No Child Left Behind (NCLB)
legislation require all students to be proficient in the area of English and math and
requirement goals established for Adequate Yearly Progress (AYP) (2001).
77

REFERENCES
Aikman W. F., & Kotin, L. (1940). Legal foundations of compulsory school
attendance. Port Washington, NY: Kennikat Press.
Alexander, K. & Alexander, M. D. (1998). American public school law (4th ed.).
Belmont, CA: Wadsworth.
Alexander, K. L., Entwisle, D. R. & Bedinger, S. D. (1994). When expectations work:
Race and socioeconomic differences in school performance. Social
Psychology Quarterly, 57(4), 283-299.
Applegate, K. (2003). The relationship of attendance, socio-economic status, and
mobility and the achievement of seventh graders (Unpublished doctoral
dissertation), Saint Louis University, St. Louis, MO.
Atkinson, C.L. H. (1998). An analysis of the impact of success for all, on reading,
attendance and academic self-efficacy with at-risk elementary school students.
(Unpublished doctoral dissertation), Virginia Polytechnic Institute and State
University, Blacksburg, VA.
Bandura, A. (1977). Self-efficacy: Toward a unifying theory of behavior change.
Psychologist. Psychological Review, 84, 191-215.
Barrington, B.L. & Hendricks, B. (1989). Differentiating characteristics of high school
graduates, dropouts and non-graduates. Journal of Educational Research,
82(6), 309-310.
Bartman, R. E. (1997). Raising the bar- closing the gap. Missouri Department of
Elementary and Secondary Education.
Boloz, S. A. et al. (1983). Combating student absenteeism: strategies for raising
78

attendance and achievement. Journal of American Indian Education. V22,
p25-30.
Bushweller, K. (1999). Goals 2000: Does our reach exceed our grasp? American
School Board Journal, 186(12), 6-27.
Chappel, L. (2004). Building resilience: a study of the academic achievement, school
attendance, and self-concept of students in grades 3-5 who participated in a
21st century community learning center’s after-school program (Unpublished
doctoral dissertation), University of North Carolina, Chapel Hill, NC.
Charles, C. M. (1995). Introduction to educational research (Rev. ed.). White Plains,
NY: Longman Publishers.
Clay, M. M. (2002). An observation survey of early literacy achievement. (Rev. ed.).
Portsmouth, NH: Heinemann Publishers.
Compulsory School Attendance Act, 1 Va. Stat. Section 14 - 1-254(West 2002).
Cotton, J. (2003). The instructional leadership proficiencies of elementary principals:
a study of preparation and continuing professional development needs
(Unpublished doctoral dissertation), George Washington University,
Washington, DC.
Davis, T. W. (2004). A study of an after-school program at a rural elementary school.
(Unpublished doctoral dissertation), Mississippi University, Mississippi.
Davidson, G. (2000). Compulsory school attendance (10841). Division of Public
Schools and Community Education. Florida, FL: Bureau of Instructional
Support and Community Service.
deJung, J.K.& Duckworth, K. (1986, April). Measuring student absences in the high
79
schools. Paper presented at the annual meeting of the American Educational
Research Association, San Francisco, CA.
Deal, T. E., & Peterson, K. D. (1999). Shaping school culture: the heart of leadership.
San Francisco: Jossey-Bass.
DeKalb, J. (1999). Student truancy. (Report No. EDO-EA-99-1). Washington, DC:
Office of Educational Research and Improvement. (ERIC Document
Reproduction Service No. ED429334).
Deschamps, A. (1992). An integrative review of research on characteristics of
dropouts. Dissertation Abstracts International, 54 (01), 0137. (UMI No.
AAG93114466.
Duckworth, K. (1988). Coping with student absenteeism. The Practitioner. 14(4), 2-
11.
Dufours, R. (1983). Compulsory school attendance and child labor. New York, NY:
Arno Press.
Duke, D. & Canady, R. (1991). School policy. New York, NY: McGraw-Hill, Inc.
Dynarski, M. & Gleason, P. (1998). How can we help? What we have learned from
recent federal dropout prevention evaluations. School Dropout Demonstration
Assistance Program Evaluation Report. Princeton, New Jersey. Mathematic
Policy Research, Inc. Retrieved June 23, 2000, from http://www.mathematica-
mpr.com/publicatioons/PDFs/dod-syn.pdf
Edwards, S. (2002). Creating professional learning communities. Symposium
Conducted at the Summer Leadership Academy, Springfield Public Schools,
Springfield, Missouri.
80

Ensign, F. C. (1969). Compulsory school attendance and child labor. New York, NY:
Arno Press.
Flanagan, A. E. & Murray, S.E. (2002). A decade of reform: The impact of school.
Reform in Kentucky. Paper presented at the Center for Education Research
Education Conference.
Fleming, M. & Zafirau, J. (1982). Grading issues in a desegregated system. Paper
presented at American Educational Research Association.
Finn, P. J. (1999). Literacy with an attitude: Educating working-class children in their
own self- interest. Albany: State University, New York Press.
Gamble, Z. P. (2004). The effect of student mobility on achievement and gain-score
test results (Unpublished doctoral dissertation), University of Tennessee,
Memphis, TN.
Garry, E. (1996). Truancy: First step to a lifetime of problems, Office of Juvenile
Justice and Delinquency prevention. Washington, D.C.
Greene, B. F. (1990). A study of attendance and achievement (Unpublished doctoral
dissertation), University of North Carolina, Chapel Hill, NC.
Hamilton, L. R., Stecher, B. M., & Klein, S. P. (2002). Making sense of test-based
accountability in education. Arlington, VA: Rand Publishing.
Herberling, K. & Shaffer, D. V. (1995). School attendance and grade point averages
of regular education and learning disabled students in elementary schools.
(ERIC Document Reproduction Service No. ED387264
Hinkle, D. E., Wiersma, W., & Jurs, S. G. (1998). Applied statistics for the behavioral
sciences. Boston, MA: Houghlin Mifflin Company.
81

Horwitch, L.R. (2004). Student mobility, academic achievement, and the California
Academic Performance Index: Unintended consequences in an era of high-
stakes accountability (Unpublished doctoral dissertation), University of
Southern California, CA.
KDE Dropout Prevention Resource Guide. (2003). Retrieved January 23, 2003, from
Kentucky Department of Education website: http://www.ihdi.uky.edu/dropout-
prevention/.
Kersting, J. (1967). Absences and averages. School and Community. 53, Feb. 17.
Kovas, M. A. (1986). A comparison of secondary school performance in attendance
and achievement with relationship to the use or nonuse of a restrictive and
punitive administrative control policy for attendance. (Unpublished Exit
Project), South Bend, ID. Indiana University at South Bend.
Kozinetz, C. A. (1995). Using administrative data to identify elementary schools at
increased risk for student absences. Journal of School Health. 65, 262-265.
Lee, A. (2000). Transient children: Perceptions of how often transient children come
and go (Unpublished doctoral dissertation), Auckland College, New Zealand.
Ligon, (1990). A failed attendance policy. American Educational Research
Association
Lloyd, D. N. (1978). Prediction of school failure from third grade data. Education and
Psychological Measurement, 38, 1193-1200.
McCargar, J. P. (2004). An analysis of student academic outcomes in high-poverty
schools (Unpublished doctoral dissertation), Tennessee State University,
Memphis, TN.
82

Mitchell, (1993). A comparison of achievement and attendance of fifth grade African
American male and female students attending same-gender classes and
coeducational classes in two inner city schools (Unpublished doctoral
dissertation), Virginia Polytechnic Institute and State University, Blacksburg,
VA.
Montano-Harmon, M. R. (1991). Discourse features of written Mexican Spanish:
current research in contrastive rhetoric and its implications. Hispania. 74(2),
417-425.
No Child Left Behind Act of 2001, Pub. L. No. 107-110, § 2, 104 STAT. 328 (1991).
Ndaayezwi, D. (2003). Parental involvement: The effect of home visits on academic
achievement, discipline, and attendance of high-school students (Unpublished
doctoral dissertation), Regent University, Virginia Beach, VA.
Norris, T. A. (2000). A longitudinal study of predictors of student achievement related
to socio-economic status, race/ethnicity, attendance and student mobility
(Unpublished doctoral dissertation), University of Nebraska, Omaha,
Nebraska.
Odell, C.W. (1923). The effect of attendance upon school achievement. Journal of
Educational Research. (12), 422-432.
Pallister, R. (1969). The determinants of elementary school attendance about 1850
Durham and Newcastle Research Review, 5.
Pierce v. Society of Sisters, 268 U.S. 510 (1925)
Popham, W. J. (2004). American’s failing schools: How parents and teachers can
cope with no child left behind. New York, NY: RoutledgeFalmer Publishing.
83

Redick & Nicoll (1990). Final Evaluation of the 15-day attendance policy, (p. 1). Mt.
Diablo Unified School District, San Francisco, CA.
Reid, K. (1999). Tackling truancy in schools: A practical manual for primary and
secondary schools. New York, NY: Taylor & Francis, Inc.
Reid, K. (2004). The views of head teachers and teachers on issues of attendance in
primary grade schools. Research in Education. 11(72), 60-76.
Roderick, M. (1993). The path to dropping out: Evidence for intervention. Westport,
Ct: Auburn House.
Rohrman, D. (1993). Combating truancy in our schools-a community effort. NASSP
(National Association of Secondary School Principals) Bulletin. 76(549), 40-51.
Rothman, S. (2001). School absence and student background factors: A multilevel
analysis. International Education Journal, 2(1), 59-68.
Rumberger, R. W. & Larson, K. A. (1998). Student mobility and the increased risk of
high school dropout. American Journal of Education, 107(1), 1-35.
Sanders, M, & Epstein, J. (2000). Building school-family-community partnerships in
middle and high schools. schooling students placed at-risk: research, policy,
and practice in education of poor and minority adolescents. Mahwah,
N.J.:Erlbaum.
Schagen, I., Benton, T., & Rutt, S. (2004). Study of attendance in England: Report for
National Audit Office. Sough: NFER.
Smith, W. (1998). An evaluation of the attendance policy and program and its
perceived effects on high school attendance in Newport News public schools.
84

(Unpublished doctoral dissertation), Virginia Polytechnic Institute and State
University, Blacksburg, Virginia.
Sparks, D. (2000). High-powered professional development for high poverty schools.
Principal Leadership, 1(4), 26-29.
Stover, D. (2000). The mobility mess of students who move. Education Digest, 66(3),
61-64.
Strand, S. (2000). Pupil mobility, attainment and progress during key stage 1: A case
study in caution. A paper presented at the British Educational Research
Association Annual Conference, Cardiff University, September 7-10, 2000.
Thattai, D. (2001). A history of public education in the United States.
Retrieved March 15, 2004, from http://www.servintfree.net/~aidmn-
ejournal/publications/2001-11/PublicEducationInTheUnitedStates.html
Thorpe, G. & Malcolm, H. (2000). Attending School: How much does it matter?
Better practice in school attendance: Monash University.
U.S. Census Bureau.2000. 2000 racial and ethnic classifications used in census
2000 and beyond. Retrieved October 20, 2005, from
http://factfinder.census.gov/home/saff/main.html
U. S. Department of Education (1992). National Education Longitudinal Study of
1988: Characteristics of at-risk students, NELS: 88 [Contractor Report, NCES
92-042]. Washington, D.C.: Office of Educational Research and Improvement,
National Center for Education Statistics.
U.S. Department of Education (1996). The problem of truancy in America’s
communities: Washington, DC: Government Printing Office.
85

U.S. Department of Education. Manual to combat truancy, (1996b). Washington, DC:
Government Printing Office.
U.S. Department of Education. 2002 no child left behind act of 2001. Retrieved
November 20, 2002, from
http://www.ed.gov./legislation/ESEA02/beginning.html.
U.S. Department of Education (2000). Analytic issues in the assessments of student
achievement. In Grissmer, D.W. & Ross, J. Michael (Eds). National
Improvement. Washington, D.C.
U.S. Department of Education (2001). Dropout Rates in the United States: 2000.
Washington, DC: National Center for Education Statistics.
U.S. Department of Justice (2001). Truancy reduction: Keeping students in school.
Office of Justice Programs. Office of Juvenile Delinquency Prevention.
Wehlage, G. G., Rutter, R. (1986). Evaluation of model program for at-risk students.
Paper presented at the annual meeting of the American Educational Research
Association, San Francisco, CA.
Wheat, I. D. Jr. (1998). Raining student attendance: Some low-cost strategies.
Thomas Jefferson Institute for Public Policy. Fairfax Station, VA. U.S.
Department of Justice (2001).
White, K. R. (1982). The relationship between socio-economic status and academic
achievement. Psychological Bulletin. 91(3), 461-481.
Woog, A. D. (1992). School attendance and its affects on unexcused absences.
University of Minnesota.
Wright, J. S. (1978). Student attendance: what relates where? NASSP Bulletin, 62
86
(2), 115-117.
Zamudio, G. (2004). Student mobility: the relationship between student population
stability and academic achievement. (Unpublished doctoral dissertation),
University of Arizona, Arizona.
Ziegler, C. W. (1972). School attendance as a factor in school progress (Rev. ed.).
New York, NY: AMS Press, Inc.
87

APPENDIX A
Permission Letter to Conduct Research Date
Supervisor of Student Services School Administration Building
Southeastern Virginia School District Dear: I am currently enrolled in a doctoral program at Virginia Polytechnic and State University. The dissertation topic is the impact of student attendance, socio-economic status and mobility on academic achievement. The purpose of this research study is to learn how attendance, mobility and socio-economic status affect student achievement. This research study will require access to the Southeastern Public School District’s information technology director in order to access information from the school system’s database for two Title I elementary schools third grade students from 2001-2005. The data will be distributed without identifying characteristics to ensure student anonymity. I am requesting permission from the Southeastern Virginia School District to conduct this research study. I have attached a copy of my prospectus for your review. A written request was sent to the Institutional Review Board for Virginia Polytechnic and State University for approval to conduct research. A copy of that approval will be available at your request. Thank you in advance for your consideration. I have worked closely with the Assistant Superintendent of Personnel for the Southeastern Virginia School District and plan to share my research with his department.
Sincerely,
D. Jean Jones
88

APPENDIX: B
Southeastern Virginia School District Approval
December 16, 2005
Mrs. D. Jean Jones Deep Creek Elementary School Chesapeake, VA 23323 Dear Mrs. Jones: Your request to conduct research on the impact of student attendance, socio-economic status and mobility on academic achievement for your doctoral research at Virginia Polytechnic and State University has been approved. The approval is granted with the understanding that the following conditions will apply:
• Participation of principals, teachers, parents and students is strictly voluntary.
• Questions are limited to those detailed in your prospectus. • Names of individuals, school names or the name of the school division
cannot be used in the reporting of the results of your findings without prior permission from the Office of Student Services.
You may use this letter as a cover letter when contacting the Director of Information Technology to retrieve data. Best wishes for a successful completion of your study. Should you have further questions, please feel free to contact me at 547-0153, Ext. 170. Sincerely, Sabrina Richards Supervisor of Student Services
89

APPENDIX C
University IRB Approval
90

APPENDIX D
University IRB Amendment Approval
91

VITA
Vita
Doris Jean Jones 2513 Longdale Court
Chesapeake, VA 23320
Education
Ed. D in Educational Leadership and Policy Studies
Virginia Polytechnic Institute and State University, 2006
M. Ed in Urban Education and Policy Studies Norfolk State University, 1994 BA in Elementary Education James Madison University, 1982
Professional Experience Principal, Deep Creek Elementary School, Chesapeake Public Schools, Chesapeake, Virginia. 7/05 – present. Principal, Norfolk Highlands Primary School, Chesapeake Public Schools, Chesapeake, Virginia. 1/01 - 7/05.
Assistant Principal, Norfolk Highlands Primary School, Chesapeake Public Schools, Chesapeake, Virginia. 7/00 - 12/00. Assistant Principal, Greenbrier Elementary School, Chesapeake Public Schools, Chesapeake, Virginia. 7/97 - 6/00. Assistant Principal, Southeastern Elementary School, Chesapeake Public Schools, Chesapeake, Virginia. 7/95 - 6/97. Elementary Teacher, Western Branch Elementary School, Chesapeake, Virginia 8/91 - 6/95. Elementary Teacher, John Kerr Elementary School, Winchester, Virginia, 6/90 -6/91.
92

Elementary Teacher, Spotswood Elementary School, Harrisonburg, Virginia, 8/82 - 6/90.
Professional Memberships Virginia State Reading Association Chesapeake Association for Principal Parent Teacher Association The Delta Kappa Gamma Society International National Association of Elementary School Principals Professional Activities and Awards Recipient, PTA Honorary Life Membership Award, Virginia State PTA, 2004 Recipient, Elementary Principal of the Year, 2003 Member, Board of Directors, James Madison University, 1982
93