The effect of provenance and spacing on stem straightness ...
12
Swedish University of Agricultural Sciences Faculty of Forestry Uppsala, Sweden The effect of provenance and spacing on stem straightness and number of spike knots of Scots pine in South and Central Sweden FlNNVlD PRESCHER Department of Forest Yield Research ERIK G. STAHL Department of Forest Yield Research Studia Forestalia Suecica NO. 172.1986 ISSN 0039-3150 ISBN 91-576-2597-2
Transcript of The effect of provenance and spacing on stem straightness ...

Swedish University of Agricultural Sciences Faculty of Forestry Uppsala, Sweden
The effect of provenance and spacing on stem straightness and number of spike knots of Scots pine in South and Central Sweden
FlNNVlD PRESCHER Department o f Forest Yield Research
ERIK G. STAHL Department of Forest Yield Research
Studia Forestalia Suecica NO. 172.1986
ISSN 0039-3150 ISBN 91-576-2597-2

Abstract
Prescher. F. & Stihl. E.G. 1985. The effect of proi.erzcrizce nnd spcrcing oil stem .strcrigl~tize.s.s and number of spike knots of Scots pine in So~rth and Ceilirol S ~ ~ e d e n . St L I ~ I ~ Forest aha Suecica 1 72. 12 pp. ISSN 0039-3150. ISBN 91-576-2597-2.
Ten provenance trials located between lat~tude 5S037' and 60"32' were studied. Over all locations. at the age of 30 years. 40% of the trees had at least one spike knot up to 5 metres height. Furthermore about 60% of the trees were not straight enough to produce a first class bottom log of saw t~mber. Significant differences existed between provenances for both tralts. Environmental differences also had a major effect on Scots pine quality. The southern. tallest. provenances were less straight than northern ones. On the contrary. withm each provenance the tall trees were also straighter and had less spike knots than short trees. Spacing effects showed that the number of trees suitable for first class saw t~mber were approximately 50 per cent higher in the 1.25 m spaclng than in the 2.0 m spacing. The joint effect of provenance transfer and spacing on stem straight- ness. indicated that with the same minimum requirements. a change in spacing from 2.0 ni to 1.25 m. corresponded to the effect of a southward provenance transfer of 2" of latitude.
Key words: Pin~ls vlvestris, L . , provenance. spacing effects. stem straightness. spike knot. ODC 232.12:232.43:174.7. Plnus sylvestris: 852.121.13.
Finnvid Prescher & Erik G. Stihl. Division of Forest Quality and Improvenient. Swed~sh Univer- sity of Agricultural Sciences. S-770 73 Garpenberg. Sweden.
Contents
Introduction, 3 Material, 3 Methods, 4 Field measurements, 4 Computations, 4
Results, 5 Discussion, 10 Summary, 11 References, 12
MS. accepted 19 December 1985 @ 1985 Swedish University of Agricultural Sciences, Uppsala
016 26 Tofters trycken ab OslervAla 1986

Introduction
In Sweden the quality of Scots pine (P ims sy1vestri.s L.) saw timber has gradually decreased during the last forty years (Anon, 1979). Silvicultural methods used in reforestation and stand treatment today. are probably making the situation worse (Persson, 1983). Forest tree improvement. aimed at an increased timber quality is a possibility, but the present pro- gramme will not increase timber quality (Werner & Ericsson, 1980).
Forest tree breeding can increase wood quality. but efforts must be concentrated on a few major char- acters. Stem straightness and number of spike knots are two of the characters of interest, when describing saw timber quality. Stem straightness affects the vo- lume of sawn goods. Severe bends can cause reaction wood, i.e. conlpression wood. As a consequence. bends are not accepted in timber sold for poles. ven- eer timber o r high quality saw timber. Occurrence of spike knots decreases the stability and strength of sawn products and therefore the value of timber.
Spike knots are also often combined with ingrown bark, which further decreases strength and beauty of sawn products.
Recent studies of genetic effects on quality have been concentrated on the number, angle and thick- ness of branches and on basic density (Poykko, 1982; Veiling, 1982). The effects of spacing on quality have also been studied (Persson, 1976, 1977; Huuri & Lahde, 1985). There are few studies on the combined effect of spacing and reforestation material. i.e. pro- venances. Neither stem straightness nor frequency of spike knots has been reported on any provenance trials in Sweden. although analyses have been made on three clone archives (Anderson & Hattemer, 1978; Lindgren, 1985).
The objective of this study is to describe the in- fluence of Scots pine provenances and spacing on stem straightness and number of spike knots in South and Central Sweden.
Material
In the years 1952-55, a large-scale Scots pine pro- sea level. From this series the ten southernmost trials venance series was planted in Sweden (Eiche. 1966). were chosen for this study. A total of 43 provenances The series comprises 29 trials located from latitudes was tested. Table 1 gives data on these trials. and on 56" to 68"N and from altitude 5 to 765 metres above provenances studied in a particular trial. Figure 1
Table 1. Description of trial locations and list of j~rovenaizcrs included irz each trial
Trial Latitude Longitude Altitude No. Namc "N "E nl a.s.1. Provenances
Gyllebo
Grankullav~k
Kobbebor
Boberg
Eckersholni
Stora Maim
Hensbacka
Holminge
Gravendal

Fig. I. Distribution of trial locations (B) and provenances (0).
shows both the origin of the studied provenances and the location of the trials.
Each site includes only 7 or 14 provenances. The experiments are incomplete Latin squares. so-called Youden squares (Cocliran & Cox. 1957). with seven treatments and four replications. The trials which comprise 14 provenances. are not true Youden squares. although the randoniization and restrictions included are based on the same assumptions. In each trial, two of the four replications have a 1.25 m x 1.25 m spacing. the other two. 2.0 m x 2.0 ni spac- ing. Each plot contains 80 or 50 trees at the narrow and the wide spacing. respectively.
The age of the trees from time of planting varied
between 29 and 31 year. depending on the year of establishment and on the years of assessment. Pre- commercial thinnings have been made twice in most of the trials. in 1968 and 1975.
Methods
Field measurements
The trees were assessed for height, bark thickness. height to first live branch. stem straightness and number of spike knots. Stem straightness was divided into five classes aiming at the utilization of saw timber: 1 = totally straight stem 2 = minor bend 3 = bend or bends affecting final timber quality 4 = severe bend or bends, poor timber quality 5 = not useful for saw timber due to bends.
This classification was made subjectively by the same experienced person at all trials.
The number of spike knots was counted between ground level and five metres above ground. Only the lower section of the trunk was studied, as it is the most valuable part for saw timber. Furthermore. the classification becomes more complicated if a longer part of the trunk is assessed. Trees were divided into five classes: 0 = no spike knot 1 = one spike knot 2 = two spike knots 3 = three spike knots 4 = four or more spike knots.
In the analysis. only trees taller than four meters were included. in order to avoid any bias in estimates caused by differences in tree length.
Computations
To detect differences in stem straightness and fre- quency of spike knots between populations. X1 analy- sis was used.
Because the X' test is a large-sample approxima- tion. and because the studied material is small. com- binations of classes had to be made to ensure that the smallest expectation was at least 1 in any class, as recommended by Snedecor & Coehran (1967). Differ- ent combinations were made at the different trial sites (Table 2).
The relationship between stem straightness and number of spike knots was studied, as well as the relationship between these two and height. diameter

Table 2. Number qf classes in the 2 ana&si.s and the corresponding number of degrees of,fi-eedon~
Frequency of spikc knots Stem straightness
Trial No. of Degrees of No. of Degrees of no. classes frecdom classes freedom
I 2 6 3 12 2 3 26 4 39 3 3 24 3 24 4 5 24 5 24 5 3 12 3 12 6 2 6 4 18
and volume per stem. For these studies correlation analysis was used. From statistical point of view the
Results
Table 3 shows mean values for the number and the frequency of trees without spike knots (spike knots class 0) and trees with a straight stem (straightness class 1 + 2) at the different trials. Mean values for height and volume per stem are also shown.
In Figure 2 assessments of frequency of spike knots are shown separately by provenances. The proven- ance and trial mean percentages are presented. as well as a significance test of variation between pro- venances at each trial. Corresponding data for stem straightness are given in Figure 3. Note that all trials showed significant differences between provenances for stem straightness in Figure 3.
Correlation coefficients are presented at each trial (Table 4). For the relationship between height and
use of correlation analysis for the qualitative char- acters stem straightness and number of spike knots could be argued to be doubtful. In spite of that. the number of classes studied and the distribution between classes in this material made us accept corre- lation analysis for stem straightness and number of spike knots.
Numbers of straight stems (class 1 + 2) per hectare and of stems without spike knots (class 0) per hectare was also calculated for wide and narrow spacing re- spectively. Numbers of straight trees per hectare were used as depcndent variables in a linear regression analysis with latitudinal transfer as independent var- iable. so as to study the transfer effect on stem straightness at different spacings.
Fig. 2. Percentage of trees w ~ t h o u t spike knots (class 0 ) in each provenance at the different trial locations. Sgnificance levels from X2 analysis. NS = not significant a t 1 % level. '* = significant a t 1% level.
Table 3. Number and percentage of trees without spike knots (class 0) and struight sterns (class I +2) respectively, height and volume per stem at the studied trials
Spike knot Stem straightness. class 0 class 1 +2 Volume!
Trial Height. stem. no. No. of trees 9% No. of trees 7c nl dm3
1 318 83 11 1 29 14.1 192 2 920 69 539 41 12.3 117 3 467 56 184 23 10.0 86 4 93 18 5 8 11 12.7 129 5 34 1 50 207 3 1 9.7 57 6 504 70 419 58 13.5 1 16 7 752 48 503 32 . 9.8 62 8 328 64 142 28 11.5 99
Mean 6 1 38

stem straightness the correlation coefficients are also calculated for each provenance (Table 5). Note that the positive relationship between height and stem straightness for tlie whole material changed to a ne- gative relationship within provenances.
To check that these results were not affected by single extreme values, i.e. some trees in class 1 or 5. the material was limited to class 2-4 and tested. Similar results were found, but these are not prescnt- ed.
Stem straightness and number of spike knots for
L i
different spacings a t each site are shown in Tables 6 O t* tt + tt e t* *'* tt A a n d 7 .
Sqnifconce level , ,, , Figure 4 shows the effect of provenance transfer on Trtal the number of straight stems at each spacing. The
Fig. 3. Percentage of trees with straight stems (class 1 + 2 ) In results can be used to calculate the appropriate PoPu- each provenance at thc different trial locations. Significance lation transfer for different minimum requirements of levels as In Figure 2. straight stems per hectare a t spacings of 1.25 m and
2.0 m. respectively.
Table 4. Correlation coefficients between differ-erlt chm-rrcters based on sirzgle tree v(11~1es at each trial
Number of spike knots Steni straightness
Trial Volume1 Volume1 No. of spike no. Height DBH stem Height DBH stem knots
* = significant at 5% level. ** = significant at I% Icvcl. *** = significant at 0.1% level

Table 5. Cor-1-elatioiz coefficients for the relatiorzship hetweerl srem .st/-uightr~ess arid height for all provemums (it each trial
Trial Total no. material
Pop. r
Pop. r
Pop. r
Pop. r
Pop. r
Pop. r
Pop. r
Pop. r
Table 6. Trees without spike knots, percentages and treesiha at dif frent trials
Table 7. 77ees with straight stems (class 1 +2), percen- tages and treesiha at different trials
- - - - - - - -
Trees wrthout spike. knots. class 0
9% No. of stemsiha Trial no. Spacing . . . 1.25 2.0 1.25 2.0
Trees wlth straight stems. class 1+2
7c No. of stemsiha Trial no. Spacing . . . 1.25 2.0 1.25 2.0
1 2 3 4 5 6 7 8 9
10
Mean
I 2 3 4 5 6 7 8 9
10
Mean

S i t e no.
1
2
3
4
5
800 1200 1600 2000 -1 N o of rtrotght stems/ho
\
2000 2400 N a of rtrotght stems/ha
-2-
-3-
-4-
-5-
\ 4 800 1200 1600 2000 2400
-1 \, N o of strolght stems /ho
-11 \ \ no. or rrn
-1 No. of stroight stems/ha
-2
-3 \ \
-4 \
-5 2 .0 2 \
Fig. 4. The dependence on latitud~nal transfer of provenances for the number of straight stems (class 1 +2) per hectare in 1 . 2 5 ~ 1.25 m spacing (-) and 2.0x2.0 m spacing (---I. A positive value on latitudinal transfer corresponds to a transfer northwards.

Site no.
6
7
8
9
10
40 \ 1200 1600 2000 2400 -1 ' \ No. of stroight stems/ho
-2 \
- . ~ - - -' 1 '\\ No. of stroight stems /ha
0 I 800 1200 1600 2000 2400
-1 - No. of straight sterns/ho
-3 -

Discussion
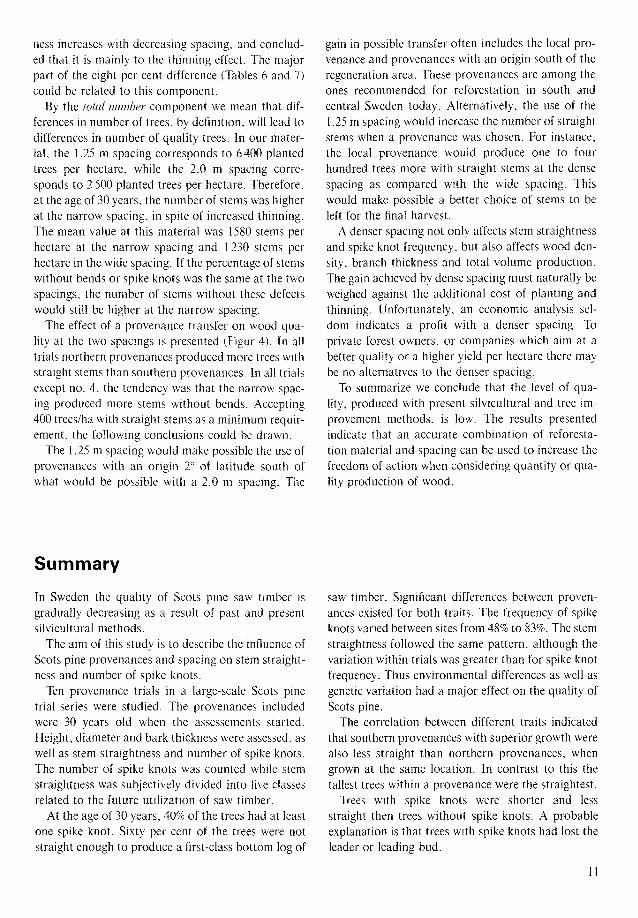
At the age of 30 years and for all ten trials. 40% of the remaining trees had at least one spike knot up to 5 metres height. Furthermore. about 60% of the trees were not straight enough to produce a first-class bot- tom log of saw timber (Figures 2 and 3).
This strongly indicates that something must be done to improve the poor quality. One way of doing this might be to change the silvicultural practices. another to include quality characteristics in the tree-improvement programme. In this paper we dis- cuss both concepts. The spacing effect and the varia- tion between provenances for two characters is dis- cussed separately as well as the combined effect of provenance variation and spacing.
The XZ test shows that significant differences exist- ed between provenances for stem straightness. and often for number of spike knots too. A comparison of stem straightness and spike knot frequency can be made for different sites in Figures 2 and 3.
The existence of significant genetic differences in stem straightness was shown by Anderson & Hat- temer (1978), who studied Scots pine clones. Werner & Ericsson (1980) presented differences between Scots pine progenies for straightness. as well as for frequency of spike knots. Differences also exist between provenances in a provenance trial at Remn- ingstorp in southern Sweden (Persson, pers. comm.).
Locality had a major effect on the quality of Scots pine. Figures 2 and 3 show the effect of locality on stem straightness and spike knot frequency.
The trial means for the percentage of trees without spike knots varied between 48% and 83%. excluding trial 4. This variation was probably not a genetic effect, but more probably a purely environmental effect, because the within-trial variation was quite constant. Similar results were found by Persson (1977). who showed that the frequency of spike knots varies very much (12%-56%) between different test localities.
Stem straightness followed the same pattern, alth- ough the variation within trial was greater than for spike knot frequency. Genotype x environment inter- actions were found for straightness on Pinus radiata by Burdon (1971).
Trial 4 had very few stems which were straight and the number of trees without spike knots was low. The reason for this could be that the trial is situated on abandoned farmland close to the Kattegat, with its strong western winds. It is the experience of the auth- ors that results from this trial, mainly of quantity
characters. are quite contradictory to what one could expect. Our study showed that quality characters also gave diverging results from normal in trial 4.
In this material there was a positive correlation between stem straightness and height. diameter, vo- lume per stem and frequency of spike knots. Corrcla- tion between the frequency of spike knots and height was negative (Table 4). Correlations within proven- ances between stem straightness and height were gen- erally negative (Table 5).
The results from the correlation study are more easily understood when it is noted that stem straight- ness and frequency of spike knots are characters where low values are desirable. Therefore. within a provenance, the tallest trees were the straightest. As a contrast to this. southern provenances with superior growth were also less straight than northern popula- tion when tested at the same site. Trees with spike knots had often lost the leader o r leading bud. As a consequence, trees with spike knots were generally shorter than trees without spike knots.
The correlation between frequency of spike knots and straightness could probably be related to the fact that the loss of the leading shoot o r leading bud led to a bend, as a lateral branch or bud took over the apical growth.
The effect of spacing on stem straightness and number of spike knots is presented in Tables 6 and 7. Although the percentages of trees with straight stems and trees without' spike knots were only 8% higher at the narrow spacing than at the wide spacing. the number of undamaged trees was approximately 50% higher. The effect of the spacing on stem straightness and number of spike knots was in reality an added effect of three components, i.e. the competitive com- ponent. the thinning component and the total nutnber component.
By the competitive component we mean that the increased competition by itself would change fre- quency of spike knots or stem straightness in a fa- vourable way. With the spacing used in this study the "competitive" effect was probably minor for stem straightness and number of spike knots. Huuri & Lahde (1985) indicated that at least 10000 stems per hectare are required to achieve a substantial competi- tive effect in a stand.
By the thinning effect we mean that through the -silvicultural process the narrow spacing will make an early reduction in the percentage of low quality trees possible. Persson (1977) showed that stem straight-
ness increases with decreasing spacing. and conclud- ed that it is mainly to the thinning effect. The major part of the eight per ccnt difference (Tables 6 and 7 ) could be related to this component.
By the total ncrmher component we mean that dif- ferences in number of trees, by definition. will lead to differences in number of quality trees. In our mater- ial. the 1.25 m spacing corresponds to 6400 planted trees per hectare, while the 2.0 m spacing corre- sponds to 2 500 planted trees per hectare. Therefore, at the age of 30 years. the number of stems was higher at the narrow spacing. in spite of increased thinning. The mean value at this material was 1580 stems per hectare at the narrow spacing and 1230 stems per hectare in the wide spacing. If the percentage of stems without bends or spike knots was the same at the two spacings. the number of stems without these defects would still be higher at the narrow spacing.
The effect of a provenance transfer on wood qua- lity at the two spacings is presented (Figur 4). In all trials northern provenances produced more trees with straight stems than southern provenances. In all trials except no. 4. the tendency was that the narrow spac- ing produced more stems without bends. Accepting 400 treeslha with straight stems as a minimum requir- ement. the following conclusions could be drawn.
The 1.25 m spacing would make possible the use of provenances with an origin 2" of latitude south of what would be possible with a 2.0 m spacing. The
Summary
In Sweden the quality of Scots pine saw timber is gradually decreasing as a result of past and present silvicultural methods.
The aim of this study is to describe the influence of Scots pine provenances and spacing on stem straight- ness and number of spike knots.
Ten provenance trials in a large-scale Scots pine trial series were studied. The provenances included were 30 years old when the assessements started. Height, diameter and bark thickness were assessed. as well as stem straightness and number of spike knots. The number of spike knots was counted while stem straightness was subjectively divided into five classes related to the future utilization of saw timber.
At the age of 30 years, 40% of the trees had at least one spike knot. Sixty per cent of the trees were not straight enough to produce a first-class bottom log of
gain in possible transfer often includes the local pro- venance and provenances with an origin south of the regeneration area. These provenances are among the ones recommended for reforestation in south and central Sweden today. Alternatively. the use of the 1.25 m spacing would increase the number of straight stems when a provenance was chosen. For instance. the local provenance would produce one to four hundred trees more with straight stcms at the dense spacing as compared with the wide spacing. This would make possible a better choice of stems to be left for the final harvest.
A denser spacing not only affects stem straightness and spike knot frequency, but also affects wood den- sity, branch thickness and total volume production. The gain achieved by dense spacing must naturally be weighed against the additional cost of planting and thinning. Unfortunately, an economic analysis sel- dom indicates a profit with a denser spacing. To private forest owners, or companies which aim at a better quality or a higher yield per hectare there may be no alternatives to the denser spacing.
To summarize we conclude that the level of qua- lity. produced with present silvicultural and tree im- provement methods. is low. The results presented indicate that an accurate combination of reforesta- tion material and spacing can be used to increase the freedom of action when considering quantity or qua- lity production of wood.
saw timber. Significant differences between proven- ances existed for both traits. The frequency of spike knots varied between sites from 48% to 83%. The stem straightness followed the same pattern, although the variation within trials was greater than for spike knot frequency. Thus environmental differences as well as genetic variation had a major effect on the quality of Scots pine.
The correlation between different traits indicated that southern provenances with superior growth were also less straight than northern provenances, when grown at the same location. In contrast to this the tallest trees within a provenance were the straightest.
Trees with spike knots were shorter and less straight then trees without spike knots. A probable explanation is that trees with spike knots had lost the leader or leading bud.

The number of straight trees without spike knots was approximately 50 per cent higher at the narrow spacing than at the wide spacing. The effect of spac- ing was argued to be an added effect of three com- ponents, i.e. the competitive, the tlzirzning and the totril
number component. In this material the competitive component was probably of minor importance.
The joint effect of provenance transfer and spacing effect on stem straightness was analysed. Northern provenances and narrow spacing produce more stems without bends. A 1.25 m spacing would make possi-
References
Anderson. E. & Hattemer. H . 1978. Vuriation ~rmong clones and ortet-ramet relutlonship in gt-ufted Scots pine (Pmus ylvestris L.) (Studia For. Suec. 148).
Anon. 1979. Svensk ti-iitekniks n~tliige oclz ~rtvecklirlgsr?z~jlig- heter (Ingenjorsvetcnskapsakademin. Rapport 148). Stockholm.
Burdon. R. D. 1971. Clonal repeatabilitles and clone-site interaction in Pinus rudiatu. Silv. Gerz. 20, 33-39.
Cochran. W. G. & Cox. G. M. 1957. Experrmental Des~gns, 2nd ed., 507-508. New York & London: John Wiley.
Eiche. V 1966. Cold d a n q e and plunt nzoi-talih I I I e.~perr- mental provenance plantations with Scots pine irz northern Sweden (Studia For. Suec. 36).
Huuri. 0. & Lahde. E. 1985. Influence of planting density on the yield. quality and quantity of Scots pine planta- tions. In: Crop physiolo@j offorest trees (ed. P.M.A. Ti- gerstedt). In press.
Lindgren. D. 1985. Genctisk effekt av urval for kvalitet. - Kvalitet - behover vi det? Skogsfukta. Korlferms nr 6, 1985, 21-22.
Persson. A. 1976. Forbnndets inverkan pd tallens s6gtinzmer- kvalitet (Skogshogskolan. Inst. f. skogsproduktion. Rapp. o . Upps. 42). Stockholm.
ble the use of provenances with an origin 2" of lati- tude south of that which could be used with a 2.0 m spacing, accepting the same minimum requirement for the number of straight stems.
Alternatively. at the 1.25 m spacing the local pro- venance would produce one to four hundred more trees with straight stems.
The results presented indicate that an accurate combination of reforestation material and spacing can be used to increase future timber quality.
Persson. A. 1977. Kval~tetsutveckling rnom yng-e fdrhandrfor- sok med tall (Skogshogskolan. Inst. f . skogsproduktion. Rapp. o. Upps. 45). Stockholm.
Persson. A. 1983. Kvalitetsuiveckling. forskning. In: Kvnli- tetsskog (ed. Anon. ). 15-3 1 . Projekt Kvahtetsskog.
Poykko. T. 1982. Genetic variation in quality characters of Scots pine. An evaluation by means of the heritability concept. Silv. Few. 16: 2. 135- 140.
Snedecor. G. W. & Cochran. W. G. 1967 Stutrsticul meth- ods, 6th ed.. 235. Ames. Iowa. USA: The Iowa State University Press.
Veiling. P. 1982. Genetic variation in qual~ty characterlstlcs of Scots pme. Silv. Fenn. 16: 2. 129-134.
Werner. M. & Ericsson. T. 1980. V~rkeskvalitetsstudier i avkommor f r h en tallfroplantage. Foreningerz Sk0g.y- tradsforadling, Institutet for- skogsjiirbuttrirzg, Jrrhok 1979, 40-69. Uppsala.
Acknowledgement. This study has been financially sup- ported by the Swedish Counsil of Forestry and Agricultural kesearch.
Electronic version O Studia Forestalia Suecica 2002 Edited by J.G.K.Flower-Ellis