The EEO Tabulation: Measuring Diversity in the … EEO Tabulation: Measuring Diversity in the...
21
The EEO Tabulation: Measuring Diversity in the Workplace ACS Data Users Conference May 29, 2014 Ana J. Montalvo Industry and Occupation Statistics Branch Social, Economic, and Housing Statistics Division U.S. Census Bureau
Transcript of The EEO Tabulation: Measuring Diversity in the … EEO Tabulation: Measuring Diversity in the...
The EEO Tabulation: Measuring
Diversity in the Workplace
ACS Data Users Conference
May 29, 2014
Ana J. Montalvo
Industry and Occupation Statistics Branch
Social, Economic, and Housing Statistics Division
U.S. Census Bureau
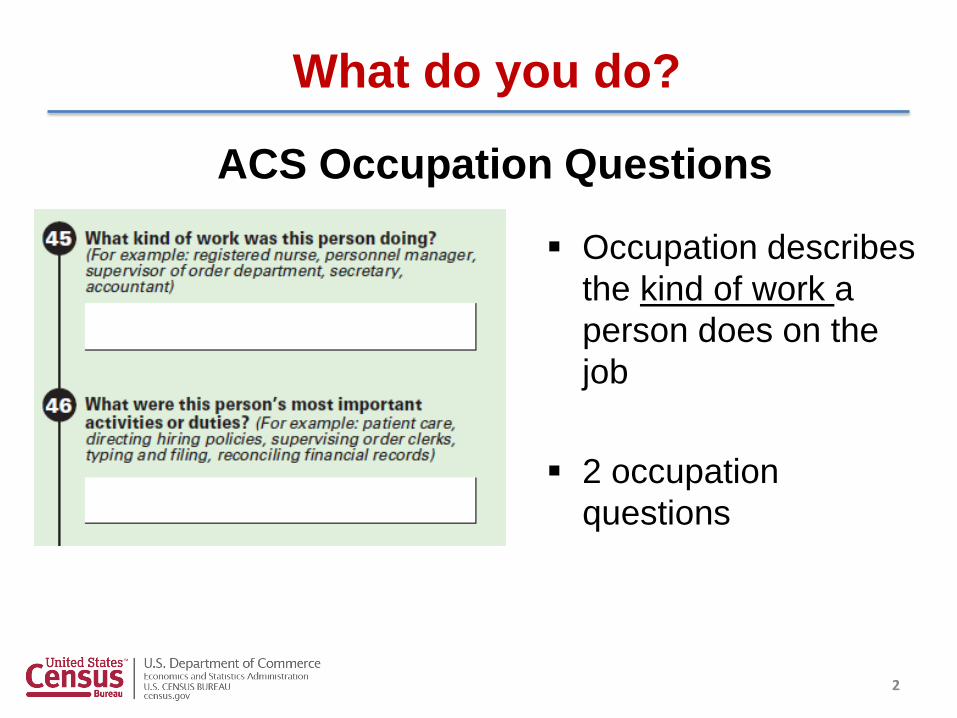
Occupation describes
the kind of work a
person does on the
job
2 occupation
questions
2
What do you do?
ACS Occupation Questions
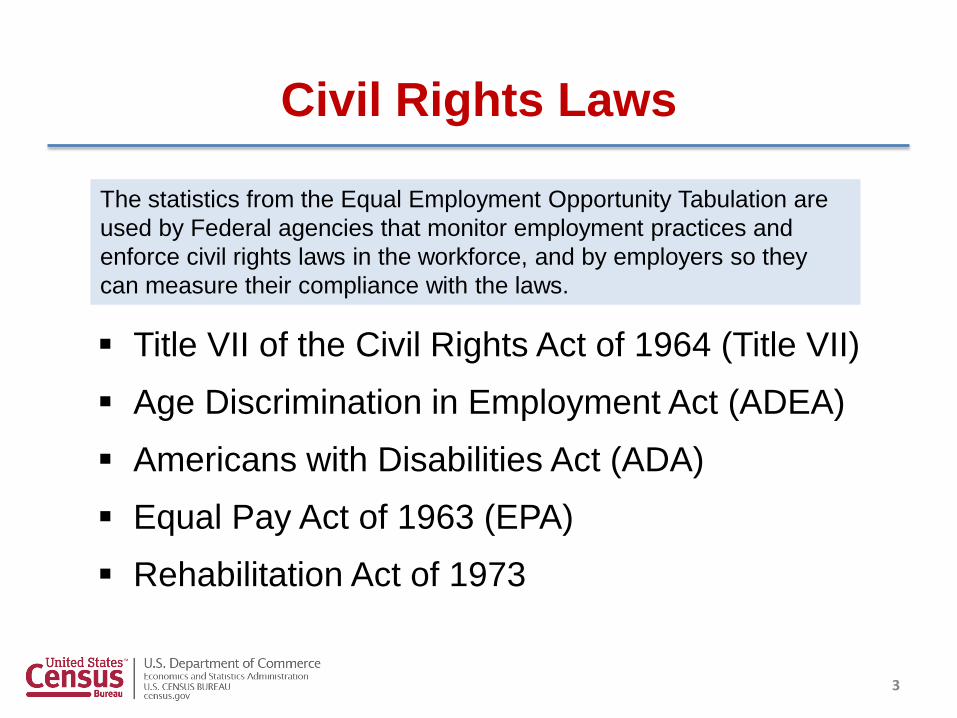
Civil Rights Laws
Title VII of the Civil Rights Act of 1964 (Title VII)
Age Discrimination in Employment Act (ADEA)
Americans with Disabilities Act (ADA)
Equal Pay Act of 1963 (EPA)
Rehabilitation Act of 1973
The statistics from the Equal Employment Opportunity Tabulation are
used by Federal agencies that monitor employment practices and
enforce civil rights laws in the workforce, and by employers so they
can measure their compliance with the laws.
3
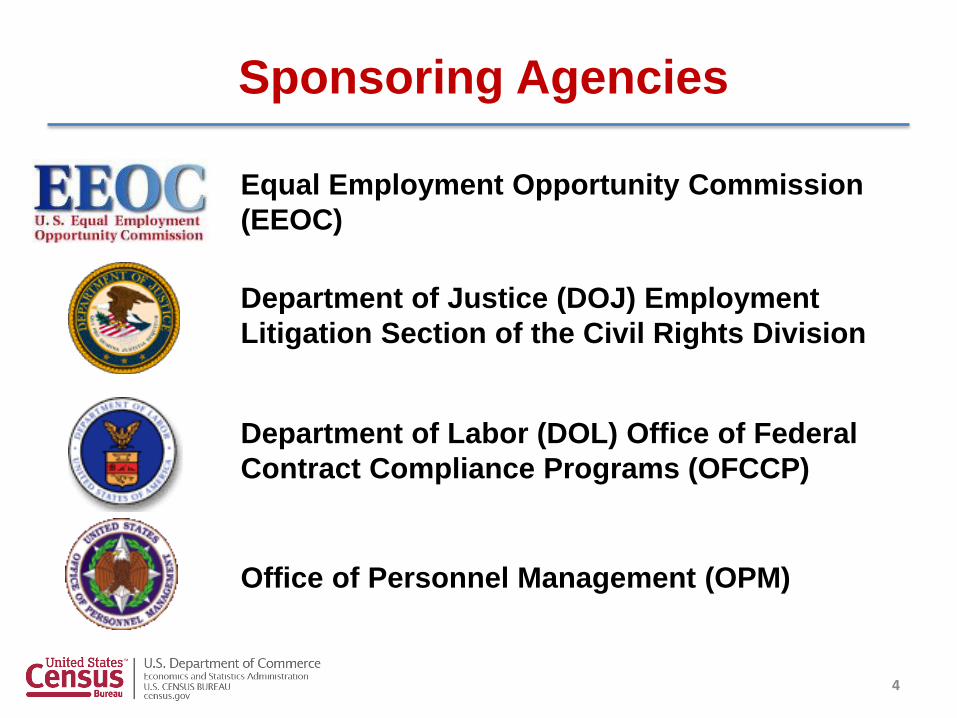
Sponsoring Agencies
Equal Employment Opportunity Commission
(EEOC)
Department of Justice (DOJ) Employment
Litigation Section of the Civil Rights Division
Department of Labor (DOL) Office of Federal
Contract Compliance Programs (OFCCP)
Office of Personnel Management (OPM)
4
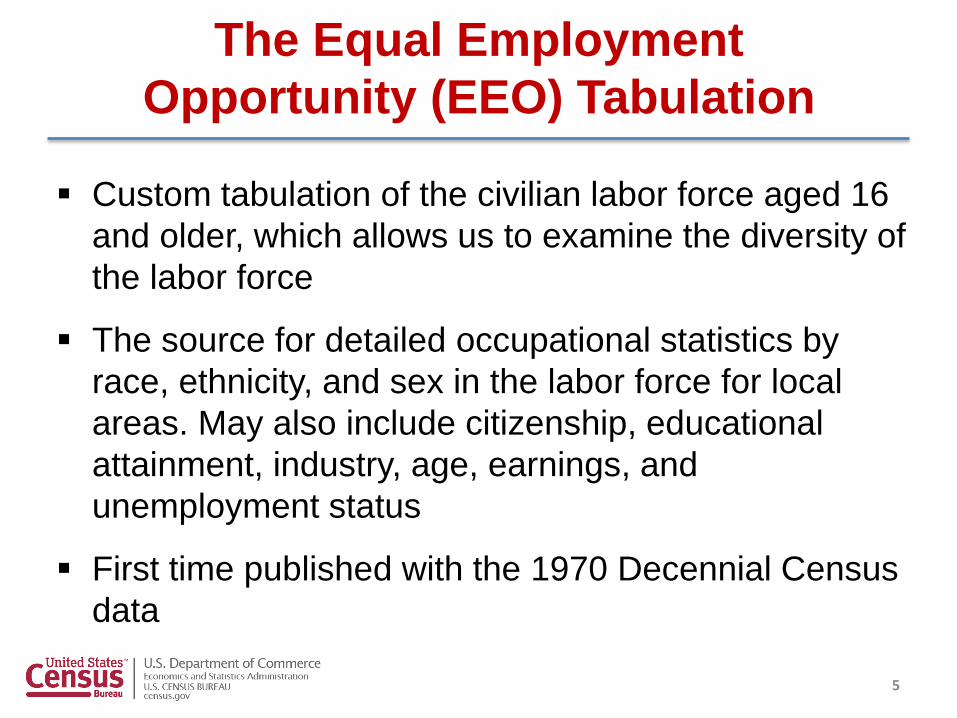
Custom tabulation of the civilian labor force aged 16
and older, which allows us to examine the diversity of
the labor force
The source for detailed occupational statistics by
race, ethnicity, and sex in the labor force for local
areas. May also include citizenship, educational
attainment, industry, age, earnings, and
unemployment status
First time published with the 1970 Decennial Census
data
The Equal Employment
Opportunity (EEO) Tabulation
5
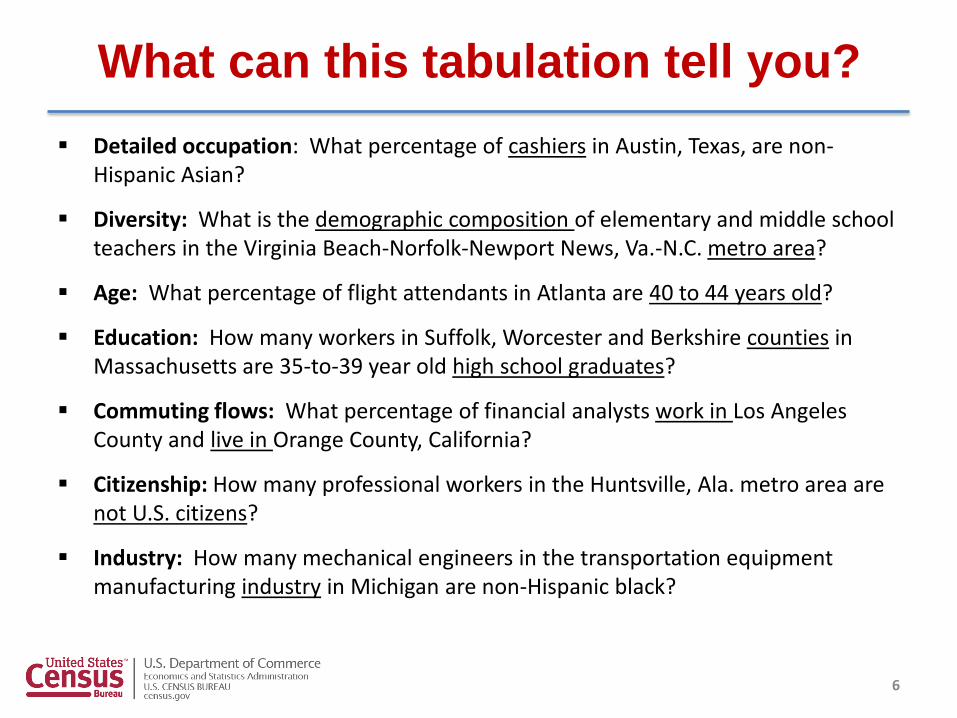
What can this tabulation tell you?
Detailed occupation: What percentage of cashiers in Austin, Texas, are non-Hispanic Asian?
Diversity: What is the demographic composition of elementary and middle school teachers in the Virginia Beach-Norfolk-Newport News, Va.-N.C. metro area?
Age: What percentage of flight attendants in Atlanta are 40 to 44 years old?
Education: How many workers in Suffolk, Worcester and Berkshire counties in Massachusetts are 35-to-39 year old high school graduates?
Commuting flows: What percentage of financial analysts work in Los Angeles County and live in Orange County, California?
Citizenship: How many professional workers in the Huntsville, Ala. metro area are not U.S. citizens?
Industry: How many mechanical engineers in the transportation equipment manufacturing industry in Michigan are non-Hispanic black?
6
7
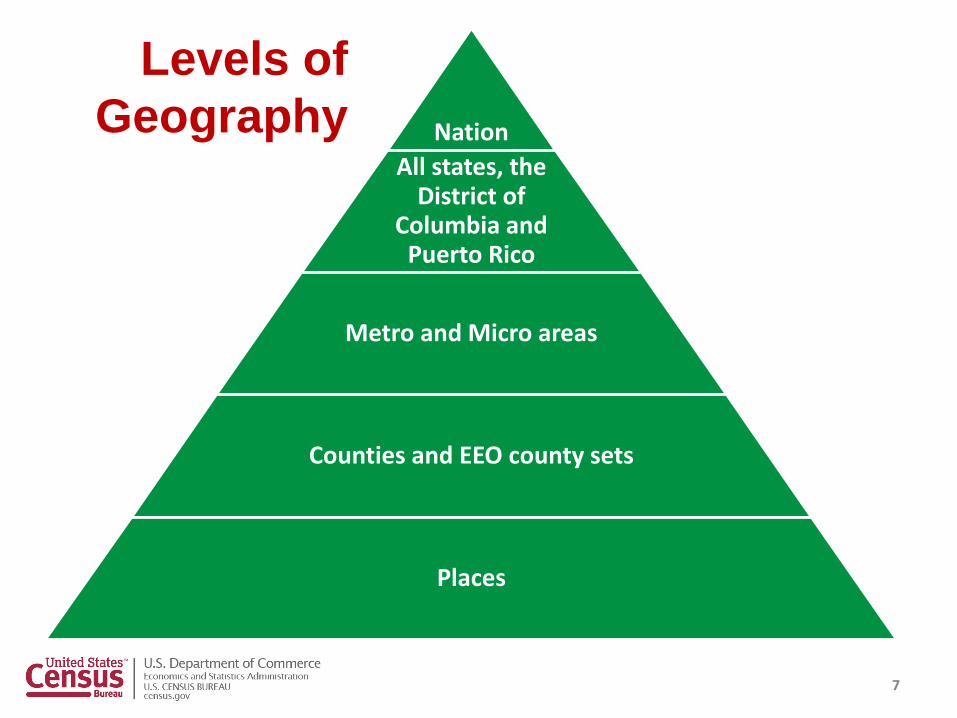
Nation
All states, the District of
Columbia and Puerto Rico
Metro and Micro areas
Counties and EEO county sets
Places
Levels of
Geography
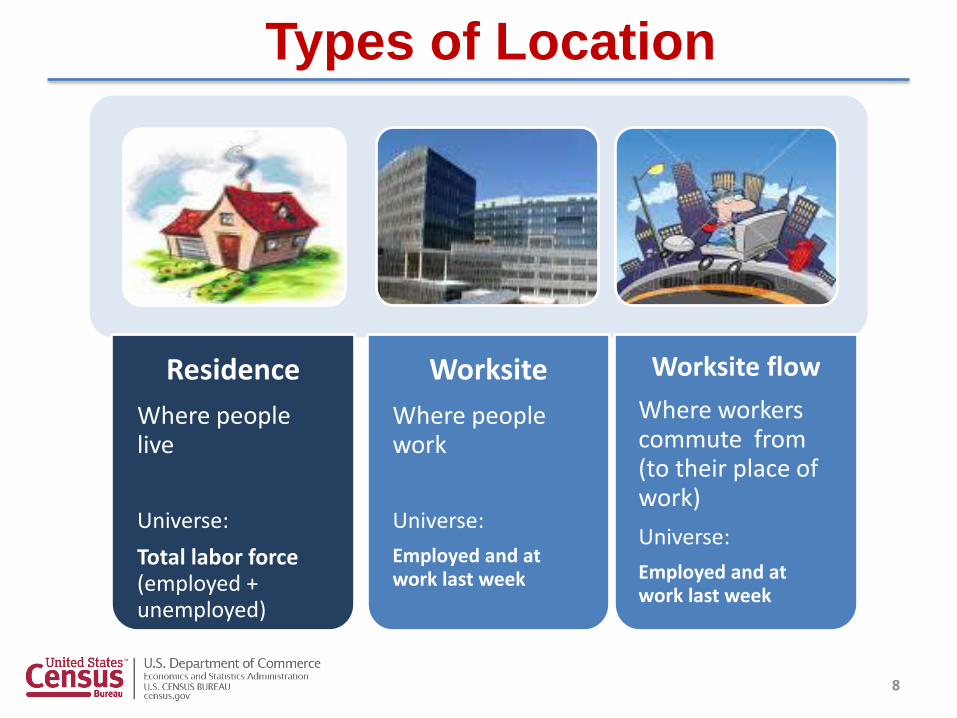
Types of Location
Residence
Where people live
Universe:
Total labor force (employed + unemployed)
Worksite
Where people work
Universe:
Employed and at work last week
Worksite flow
Where workers commute from (to their place of work)
Universe:
Employed and at work last week
8
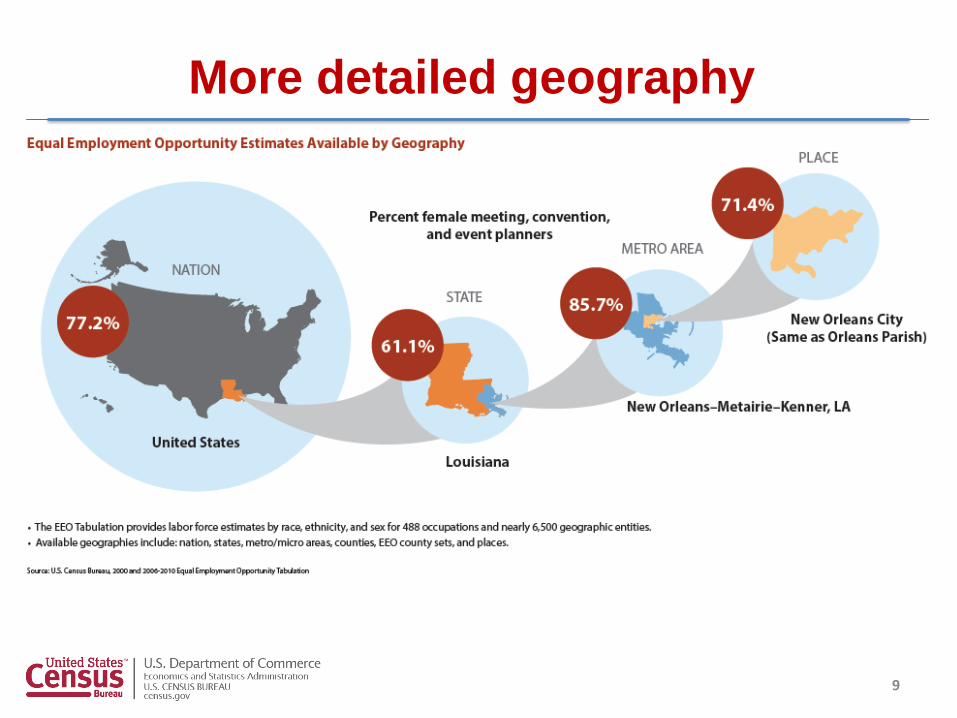
More detailed geography
9
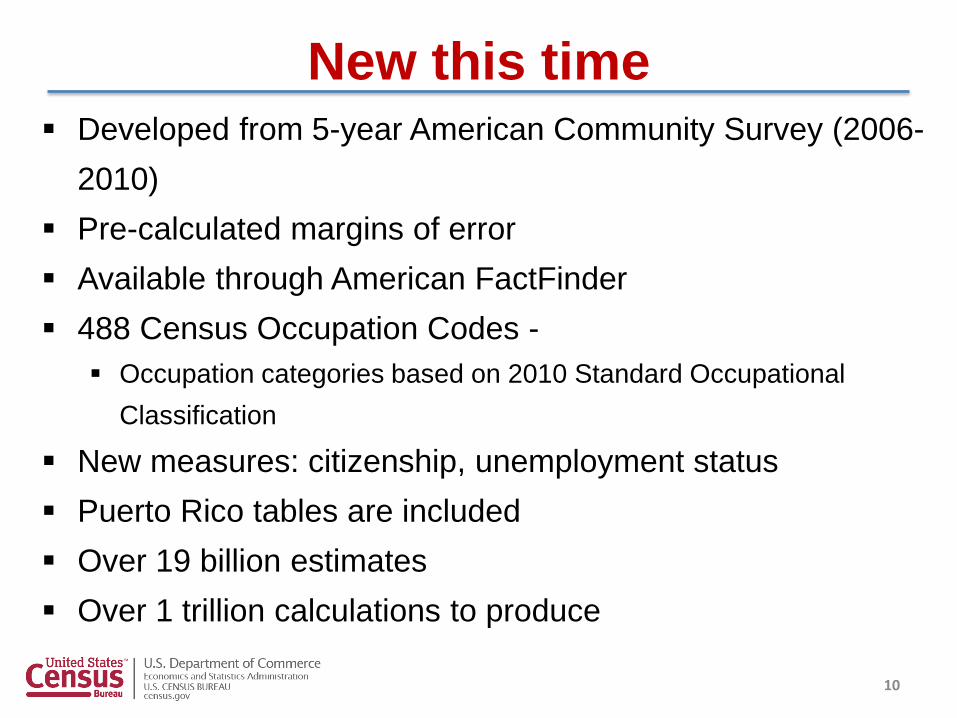
New this time Developed from 5-year American Community Survey (2006-
2010)
Pre-calculated margins of error
Available through American FactFinder
488 Census Occupation Codes -
Occupation categories based on 2010 Standard Occupational
Classification
New measures: citizenship, unemployment status
Puerto Rico tables are included
Over 19 billion estimates
Over 1 trillion calculations to produce
10
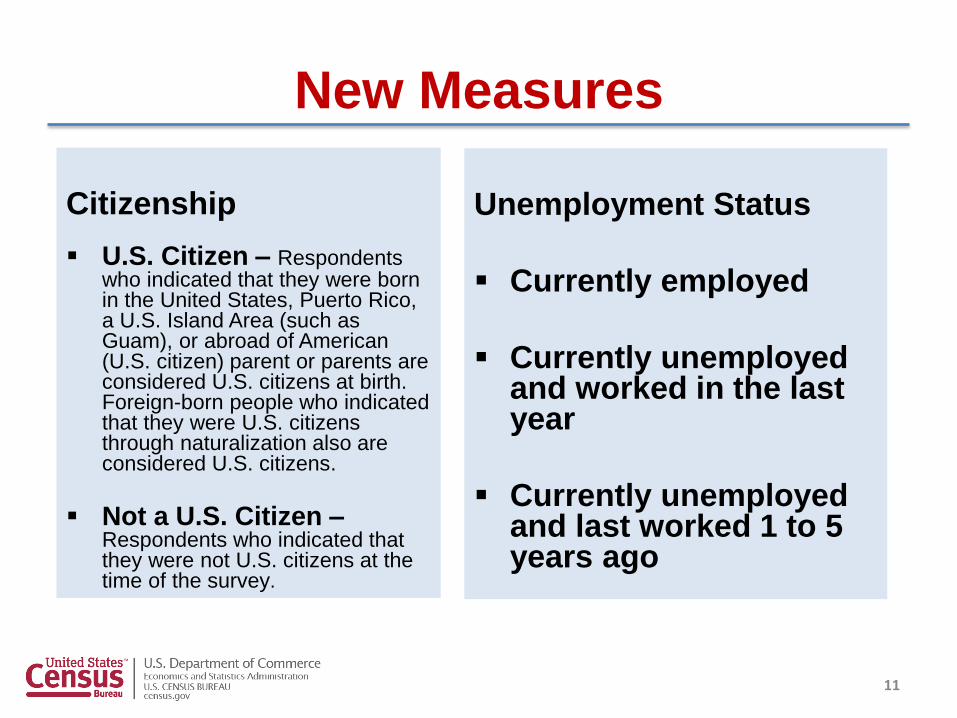
New Measures
Unemployment Status
Currently employed
Currently unemployed and worked in the last year
Currently unemployed and last worked 1 to 5 years ago
Citizenship
U.S. Citizen – Respondents who indicated that they were born in the United States, Puerto Rico, a U.S. Island Area (such as Guam), or abroad of American (U.S. citizen) parent or parents are considered U.S. citizens at birth. Foreign-born people who indicated that they were U.S. citizens through naturalization also are considered U.S. citizens.
Not a U.S. Citizen – Respondents who indicated that they were not U.S. citizens at the time of the survey.
11
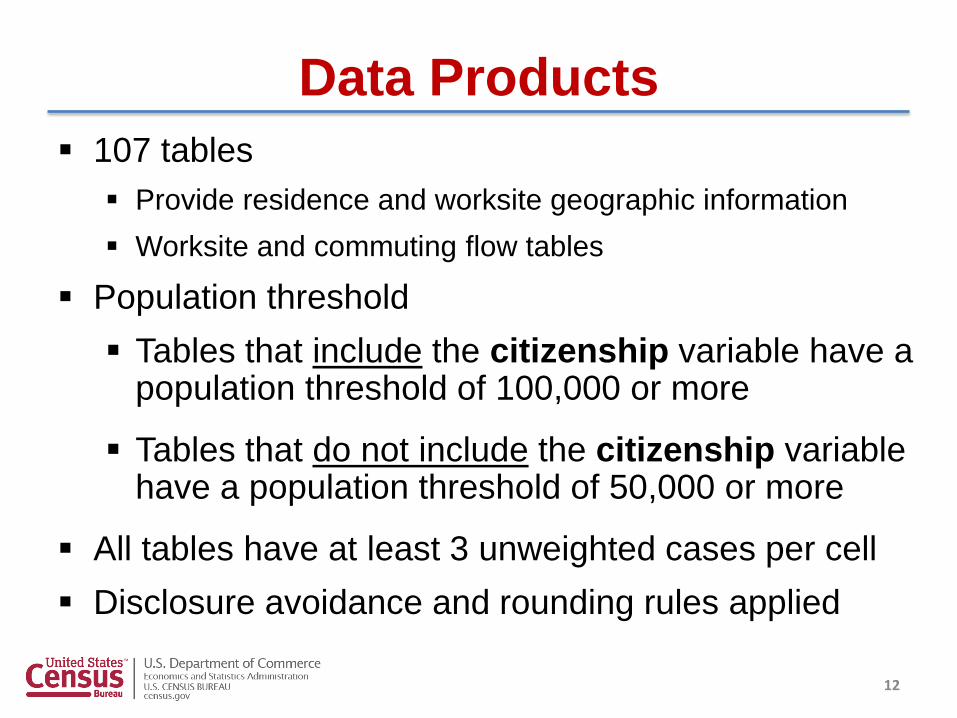
Data Products
107 tables
Provide residence and worksite geographic information
Worksite and commuting flow tables
Population threshold
Tables that include the citizenship variable have a population threshold of 100,000 or more
Tables that do not include the citizenship variable have a population threshold of 50,000 or more
All tables have at least 3 unweighted cases per cell
Disclosure avoidance and rounding rules applied
12
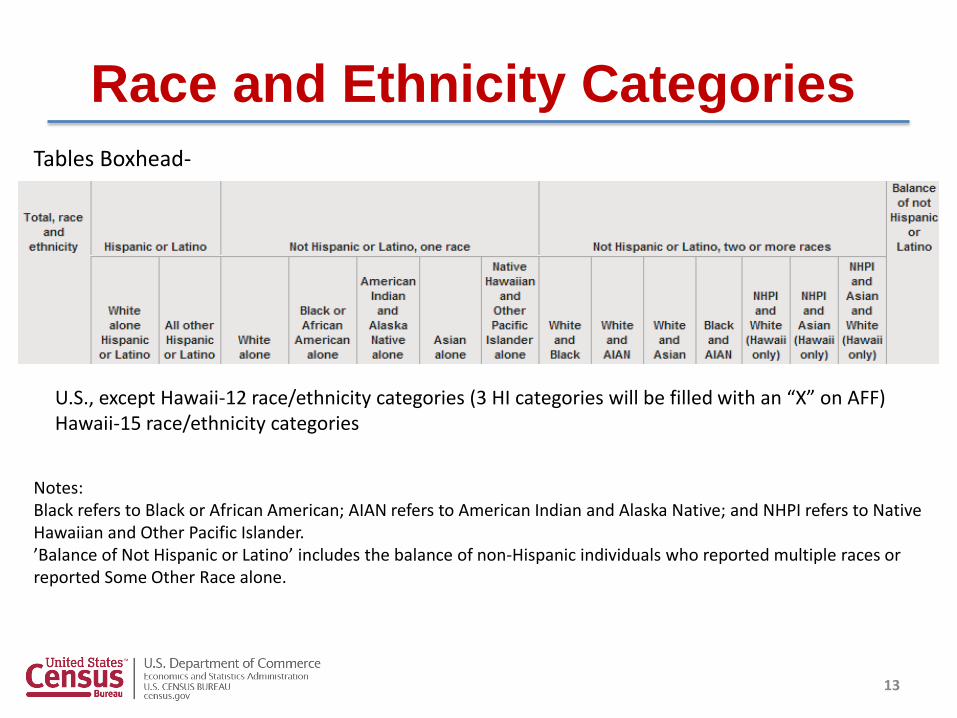
Race and Ethnicity Categories
Notes: Black refers to Black or African American; AIAN refers to American Indian and Alaska Native; and NHPI refers to Native Hawaiian and Other Pacific Islander. ’Balance of Not Hispanic or Latino’ includes the balance of non-Hispanic individuals who reported multiple races or reported Some Other Race alone.
Tables Boxhead-
U.S., except Hawaii-12 race/ethnicity categories (3 HI categories will be filled with an “X” on AFF) Hawaii-15 race/ethnicity categories
13
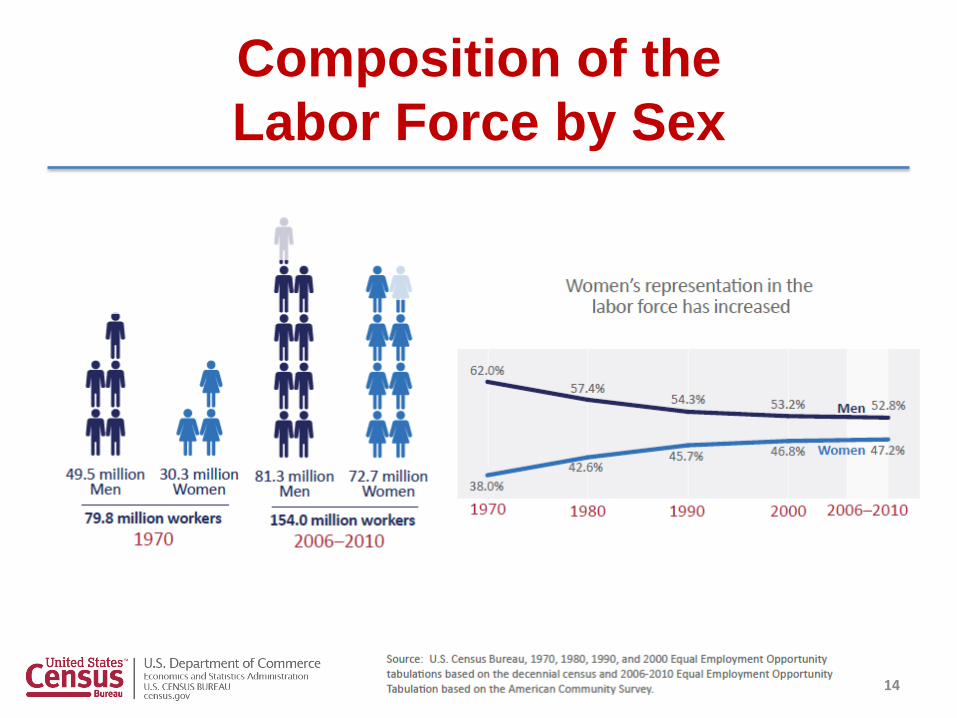
Composition of the
Labor Force by Sex
14
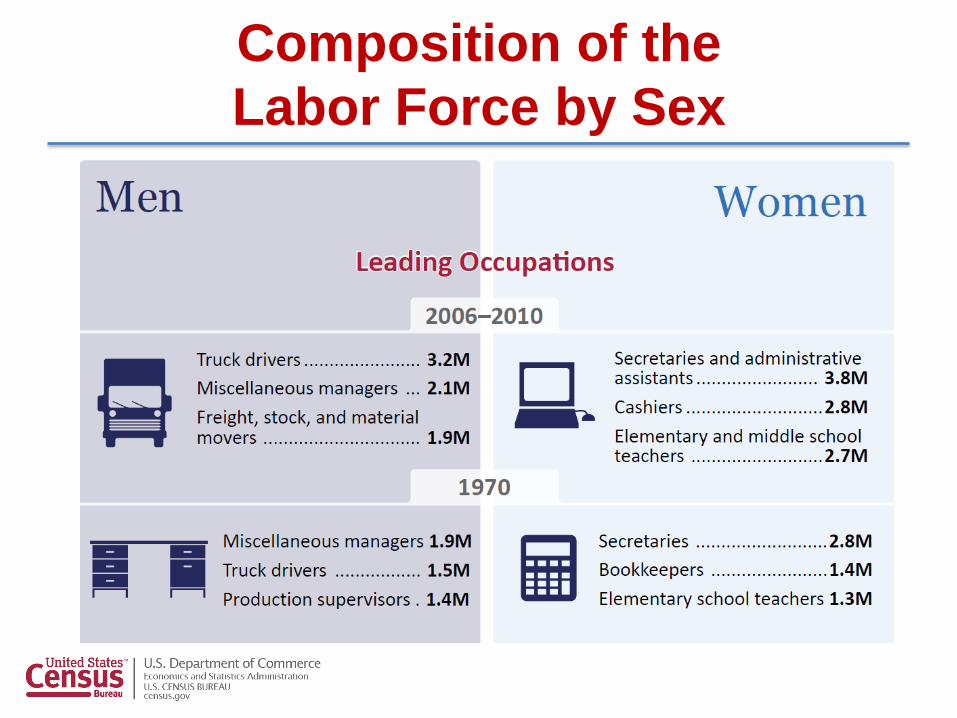
Composition of the
Labor Force by Sex
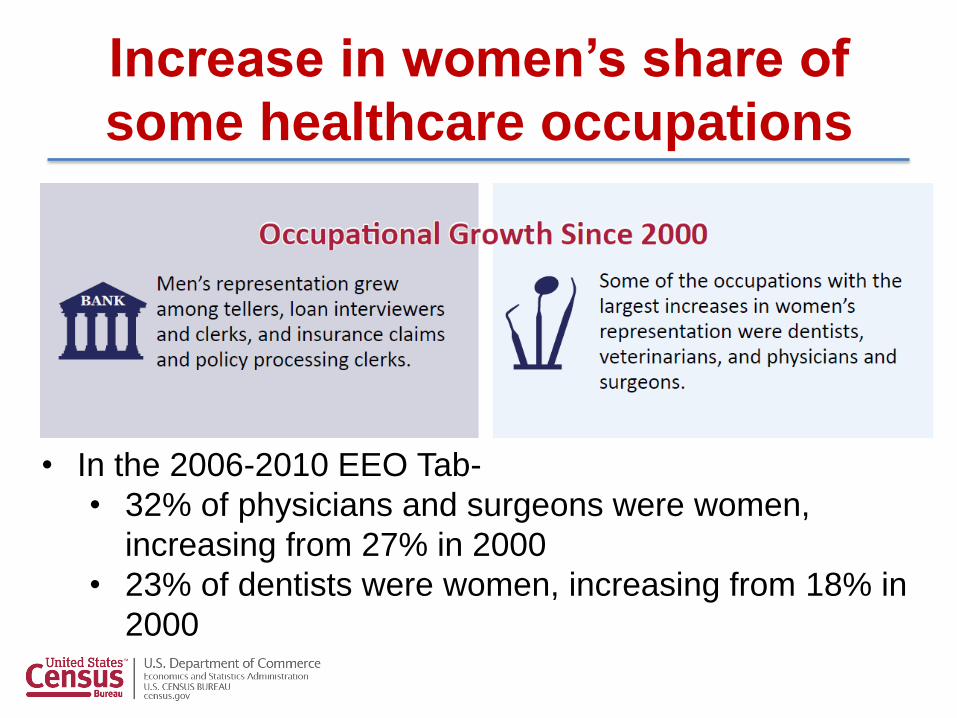
Increase in women’s share of
some healthcare occupations
• In the 2006-2010 EEO Tab-
• 32% of physicians and surgeons were women,
increasing from 27% in 2000
• 23% of dentists were women, increasing from 18% in
2000
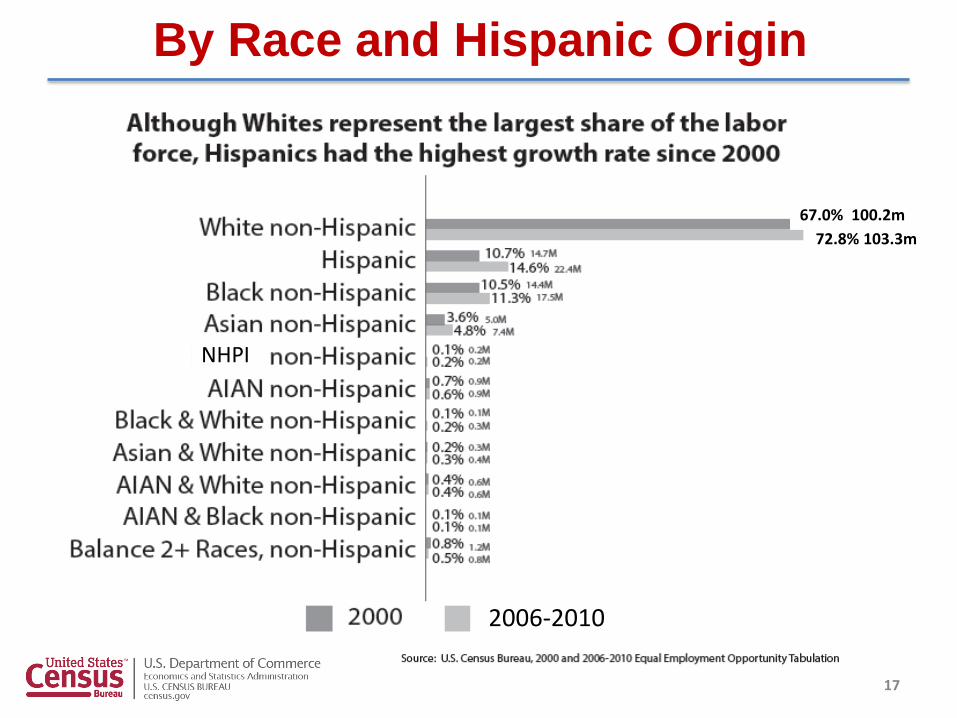
By Race and Hispanic Origin
17
NHPI
2006-2010
67.0% 100.2m
72.8% 103.3m
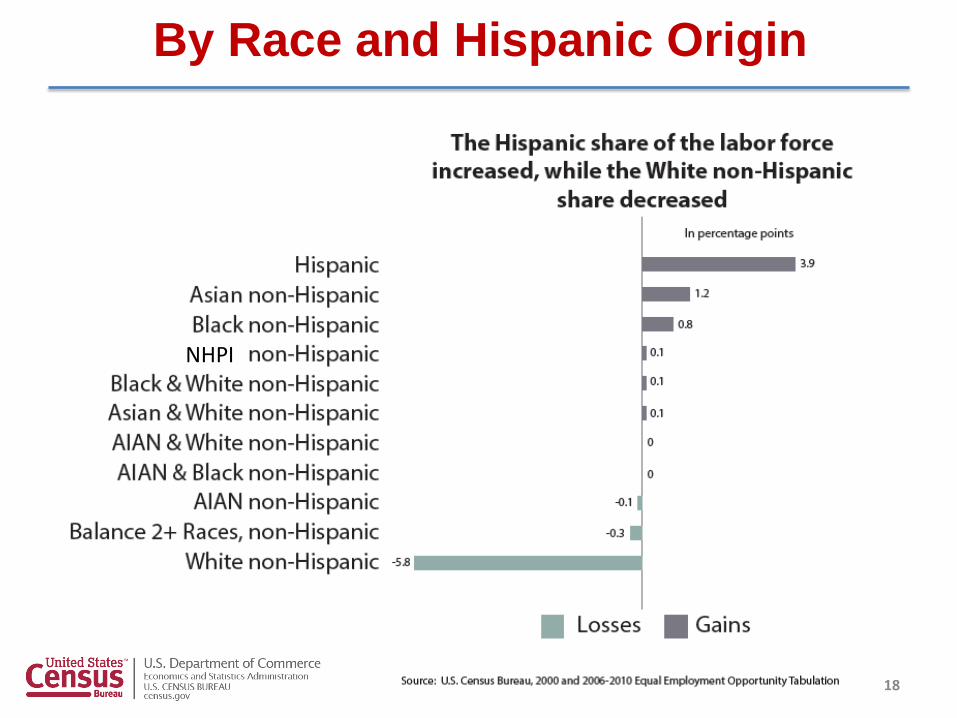
18
By Race and Hispanic Origin
NHPI
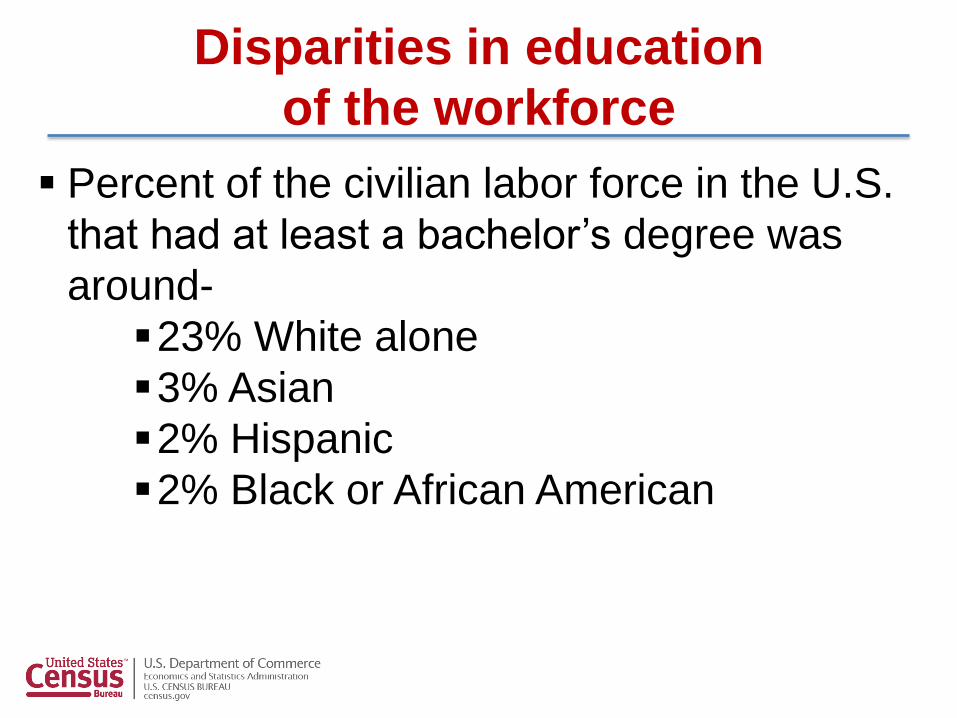
Percent of the civilian labor force in the U.S.
that had at least a bachelor’s degree was
around-
23% White alone
3% Asian
2% Hispanic
2% Black or African American
Disparities in education
of the workforce
How to access the
EEO Tabulation Data
EEO Tabulation Webpage from Census
website (http://www.census.gov/people/eeotabulation/)
American FactFinder’s Advanced Search or
Download Center (http://factfinder2.census.gov/faces/nav/jsf/pages/i
ndex.xhtml)
FTP site (http://www.census.gov/people/eeotabulation/)
20
For questions, contact:
Industry and Occupation Statistics Branch
Social, Economic, and Housing Statistics Division
U.S. Census Bureau
301-763-3239
http://www.census.gov/people/eeotabulation/
http://www.census.gov/people/eeotabulation/about/
faq5year.html
Ana J. Montalvo, Project Lead
301-763-5977
21