Measuring EEO Compliance
51
-
Upload
thomas-econometrics -
Category
Business
-
view
1.346 -
download
1
Transcript of Measuring EEO Compliance

EEO Policy Statement
EEO Policy Statement
“It is the policy of the Employer to provide equal employment opportunities to all qualified persons, and to recruit, hire, train, promote, and compensate persons in all jobs without regard to race, color, religion, sex, national origin, disability, or sexual orientation.”
EEO Policy Statement
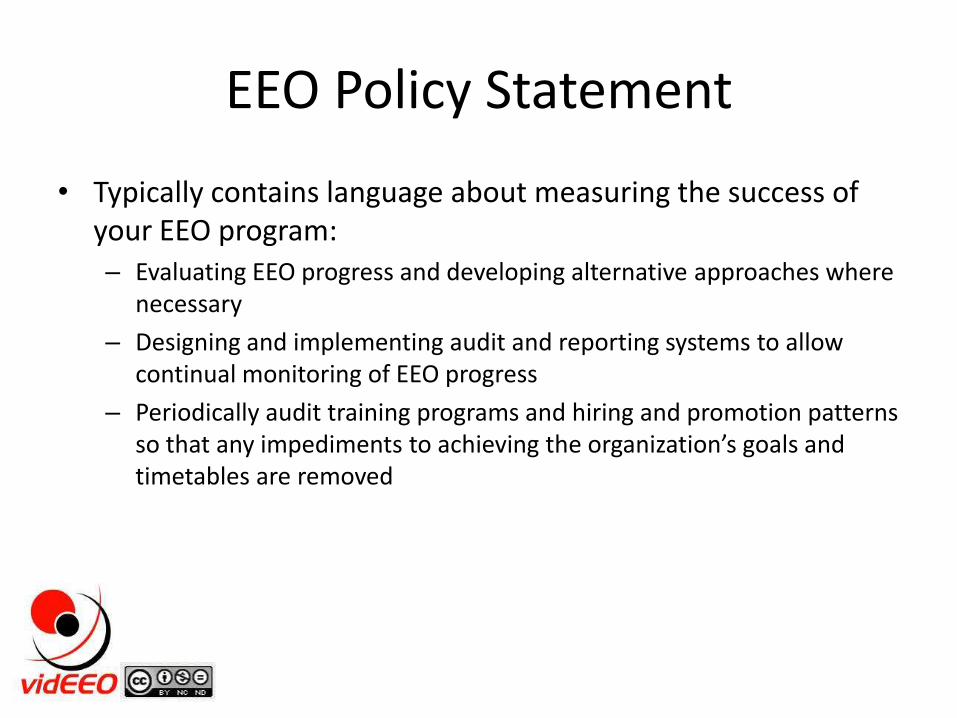
• Typically contains language about measuring the success of your EEO program:

EEO Policy Statement
• Typically contains language about measuring the success of your EEO program:– Evaluating EEO progress and developing alternative approaches where
necessary

EEO Policy Statement
• Typically contains language about measuring the success of your EEO program:– Evaluating EEO progress and developing alternative approaches where
necessary
– Designing and implementing audit and reporting systems to allow continual monitoring of EEO progress
EEO Policy Statement
• Typically contains language about measuring the success of your EEO program:– Evaluating EEO progress and developing alternative approaches where
necessary
– Designing and implementing audit and reporting systems to allow continual monitoring of EEO progress
– Periodically audit training programs and hiring and promotion patterns so that any impediments to achieving the organization’s goals and timetables are removed

How do we measure ourEEO “success”?

How do we measure ourEEO “success”?
Number of complaints brought to HR?
How do we measure ourEEO “success”?
Number of complaints brought to HR?
The amount of time spent on
EEO issues by the legal
department?

How do we measure ourEEO “success”?
Number of complaints brought to HR?
The amount of time spent on
EEO issues by the legal
department?
Number of lawsuits filed
against company?

How do we measure ourEEO “success”?
Total expenditures on
settlements, mediations and
conciliations of EEO claims?
Number of complaints brought to HR?
The amount of time spent on
EEO issues by the legal
department?
Number of lawsuits filed
against company?

How do we measure ourEEO “success”?
Total expenditures on
settlements, mediations and
conciliations of EEO claims?
Number of complaints brought to HR?
The amount of time spent on
EEO issues by the legal
department?
Number of lawsuits filed
against company?
These are all “reactionary” strategies
Quantifying – and Communicating –Success Can Be Difficult

Quantifying – and Communicating –Success Can Be Difficult
• Difficult to analyze and understand the data

Quantifying – and Communicating –Success Can Be Difficult
• Difficult to analyze and understand the data
• Difficult to communicate what the data reveal

Quantifying – and Communicating –Success Can Be Difficult
• Difficult to analyze and understand the data
• Difficult to communicate what the data reveal
• Difficult to educate managers in the legal requirements, technical content and statistical analysis of EEO data

Quantifying – and Communicating –Success Can Be Difficult
• Managers and supervisors can be overwhelmed with presentations and data

Quantifying – and Communicating –Success Can Be Difficult
• Managers and supervisors can be overwhelmed with presentations and data
• Even after presentations and discussions, many still have little idea of how they’re doing
Looking for a Bottom Line Solution
• Relatively easy to calculate from available data

Looking for a Bottom Line Solution
• Relatively easy to calculate from available data
• Easy to explain
Looking for a Bottom Line Solution
• Relatively easy to calculate from available data
• Easy to explain
• Intuitive

Looking for a Bottom Line Solution
• Relatively easy to calculate from available data
• Easy to explain
• Intuitive
• Bonus = can be displayed visually

The SMG Index
• Developed by Microsoft
• The SMG Index acronym comes from the three employees who collaborated on its development:
– Jonathan Stutz, PHR, senior diversity consultant;
– Randy Massengale, SPHR, senior diversity manager;
– Andrea Gordon, human resource director.

The SMG Index
• Provides a single, separate numerical index for each protected group

The SMG Index
• Provides a single, separate numerical index for each protected group
• Allows comparisons of organizational groups’ performance relative to goals or to other groups
The SMG Index
• Provides a single, separate numerical index for each protected group
• Allows comparisons of organizational groups’ performance relative to goals or to other groups
• Can be used as benchmark, measuring the success or failure of specific programs
The SMG Index
• “Original” SMG Index based on existing data points within standard required EEO reports

The SMG Index
• “Original” SMG Index based on existing data points within standard required EEO reports
• Can be modified to focus on different job groups, functional lines of business, department, etc.

Sample EEO-1 Report
Male Female White
Black or
African
American
Native
Hawaiian
or Other
Pacific
Asian
American
Indian or
Alaskan
Native
Two or
more
races
White
Black or
African
American
Native
Hawaiian
or Other
Pacific
Asian
American
Indian or
Alaskan
Native
Two or
more
races
A B C D E F G H I J K L M N
Executive/Senior
Level Officials and
Managers
1 0 2 1 0 2 0 0 2 0 0 1 1 0 10
First/Mid-Level
Officials and
Managers
0 1 9 1 0 1 0 0 5 2 0 1 0 0 20
Professionals 15 12 57 28 2 14 0 0 22 6 0 9 0 0 165
Technicians 11 0 41 11 0 7 0 0 3 2 0 0 0 0 75
Sales Workers 7 4 37 19 0 2 0 0 13 7 0 1 0 0 90
Administrative
Support Workers0 6 0 1 0 0 0 0 20 10 0 3 0 0 40
Craft Workers 0 0 0 0 0 0 0 0 0 0 0 0 0 0 0
Operatives 1 0 2 3 0 2 0 0 1 1 0 0 0 0 10
Laborers and Helpers 5 0 5 5 0 0 0 0 0 0 0 0 0 0 15
Service Workers 3 1 1 2 0 0 0 0 1 2 0 0 0 0 10
Total 43 24 154 71 2 28 0 0 67 30 0 15 1 0 435
Hispanic or LatinoMale Female
Job Categories
Total
Not-Hispanic or Latino
Race/Ethnicity
Number of Employees
(Report employees in only one category)

Additional
Availability Females
Job Category Total Female % Female Estimate Difference Needed
Executive/Senior Level Officials and Managers 10 4 40.0% 39.0% -1.0% -
First/Mid-Level Officials and Managers 20 9 45.0% 39.0% -6.0% -
Professionals 165 49 29.7% 30.0% 0.3% 0.5
Technicians 75 5 6.7% 8.0% 1.3% 1.0
Sales Workers 90 25 27.8% 30.0% 2.2% 2.0
Administrative Support Workers 40 39 97.5% 85.0% -12.5% -
Craft Workers 0 0 N/A N/A N/A N/A
Operatives 10 2 20.0% 15.0% -5.0% -
Laborers and Helpers 15 0 0.0% 10.0% 10.0% 1.5
Service Workers 10 4 40.0% 50.0% 10.0% 1.0
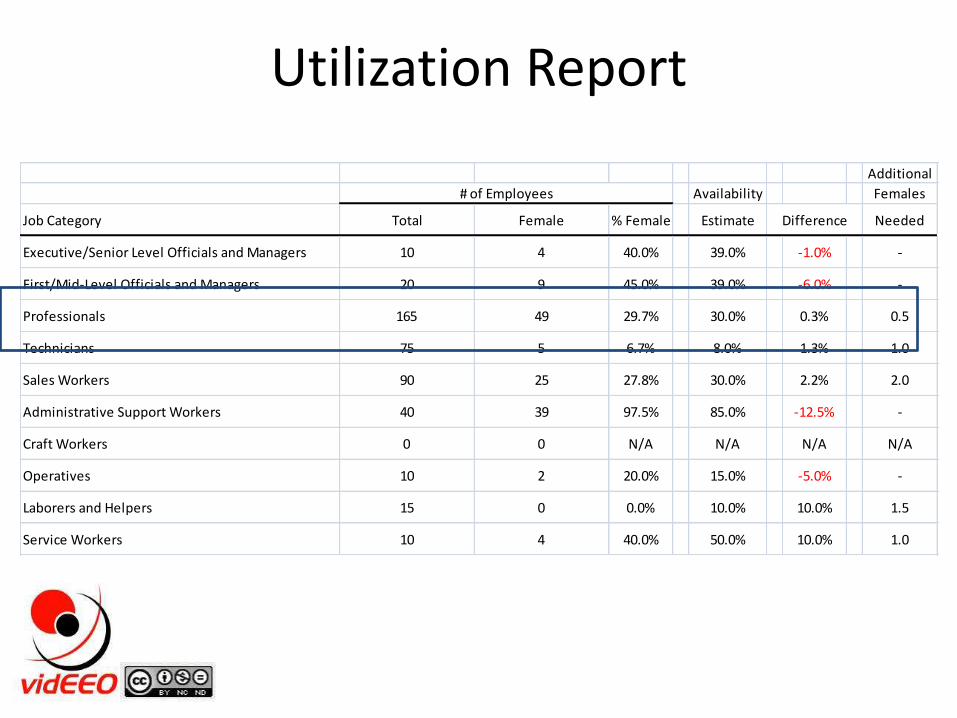
# of Employees
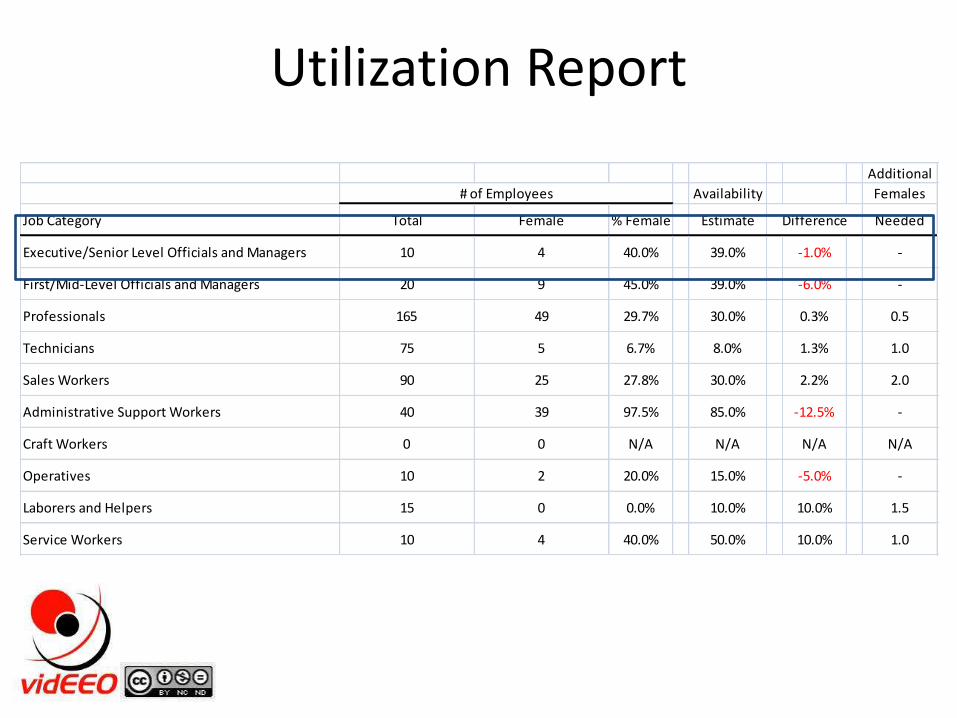
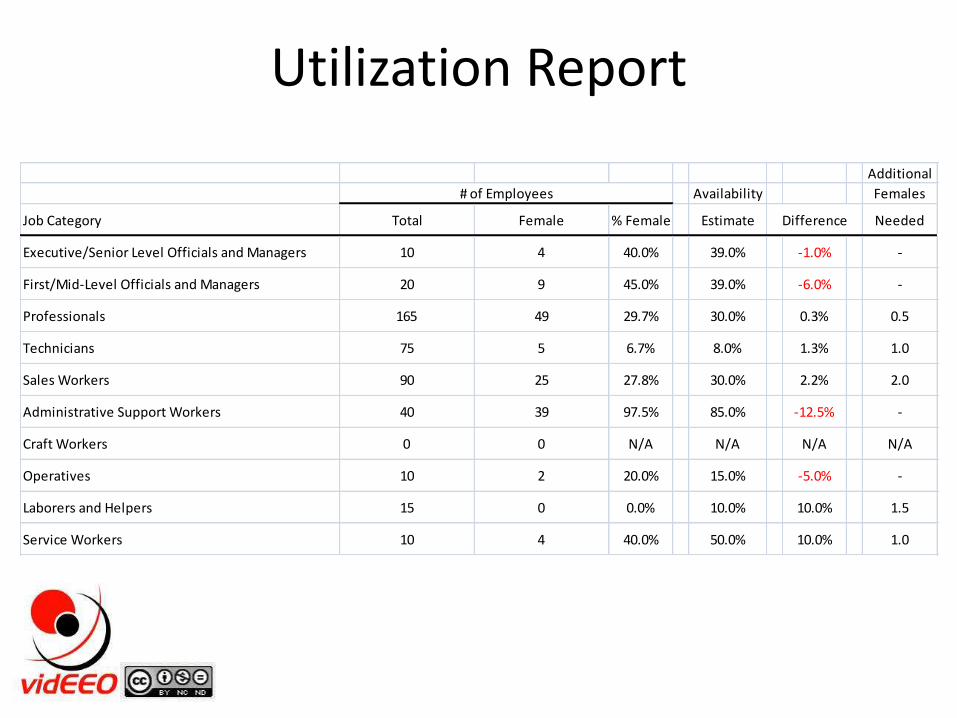
Utilization Report

Additional
Availability Females
Job Category Total Female % Female Estimate Difference Needed
Executive/Senior Level Officials and Managers 10 4 40.0% 39.0% -1.0% -
First/Mid-Level Officials and Managers 20 9 45.0% 39.0% -6.0% -
Professionals 165 49 29.7% 30.0% 0.3% 0.5
Technicians 75 5 6.7% 8.0% 1.3% 1.0
Sales Workers 90 25 27.8% 30.0% 2.2% 2.0
Administrative Support Workers 40 39 97.5% 85.0% -12.5% -
Craft Workers 0 0 N/A N/A N/A N/A
Operatives 10 2 20.0% 15.0% -5.0% -
Laborers and Helpers 15 0 0.0% 10.0% 10.0% 1.5
Service Workers 10 4 40.0% 50.0% 10.0% 1.0
# of Employees
Utilization Report

Additional
Females
Job Category Total Female % Female Expected Difference Needed
Executive/Senior Level Officials and Managers 0 0 N/A 40.0% N/A -
First/Mid-Level Officials and Managers 2 1 50.0% 45.0% -5.0% -
Professionals 17 4 23.5% 29.7% 6.2% 1.0
Technicians 8 0 0.0% 6.7% 6.7% 0.5
Sales Workers 19 5 26.3% 27.8% 1.5% 0.3
Administrative Support Workers 13 13 100.0% 97.5% -2.5% -
Craft Workers 0 0 N/A N/A N/A N/A
Operatives 22 4 18.2% 20.0% 1.8% 0.4
Laborers and Helpers 5 0 0.0% 0.0% 0.0% 0.0
Service Workers 2 1 50.0% 40.0% -10.0% -
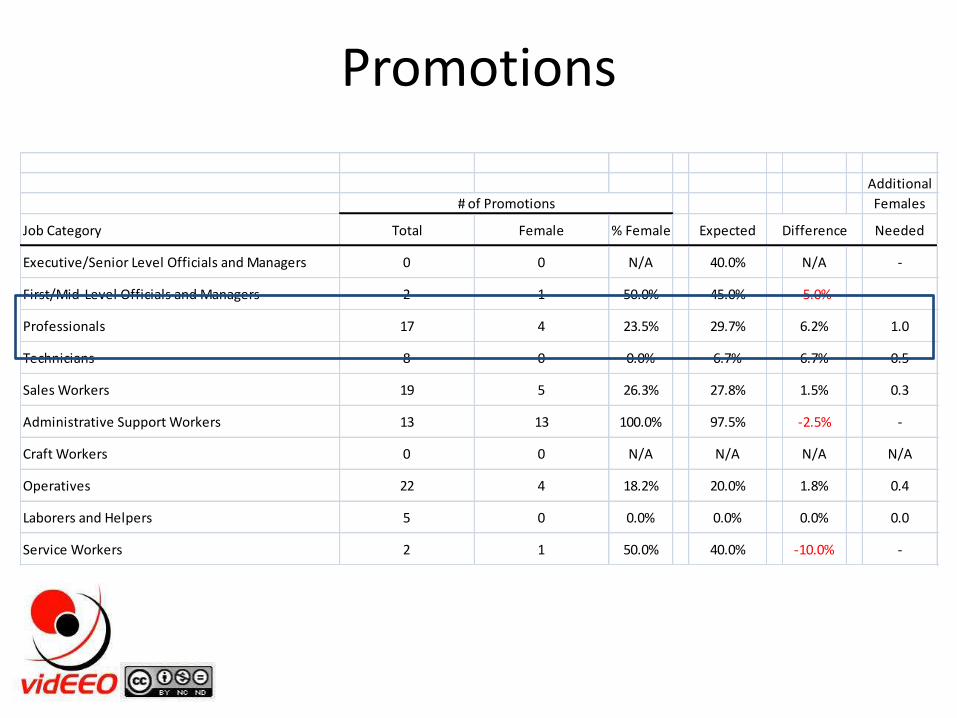
# of Promotions
Promotions

Additional
Females
Job Category Total Female % Female Expected Difference Needed
Executive/Senior Level Officials and Managers 0 0 N/A 40.0% N/A -
First/Mid-Level Officials and Managers 2 1 50.0% 45.0% -5.0% -
Professionals 17 4 23.5% 29.7% 6.2% 1.0
Technicians 8 0 0.0% 6.7% 6.7% 0.5
Sales Workers 19 5 26.3% 27.8% 1.5% 0.3
Administrative Support Workers 13 13 100.0% 97.5% -2.5% -
Craft Workers 0 0 N/A N/A N/A N/A
Operatives 22 4 18.2% 20.0% 1.8% 0.4
Laborers and Helpers 5 0 0.0% 0.0% 0.0% 0.0
Service Workers 2 1 50.0% 40.0% -10.0% -
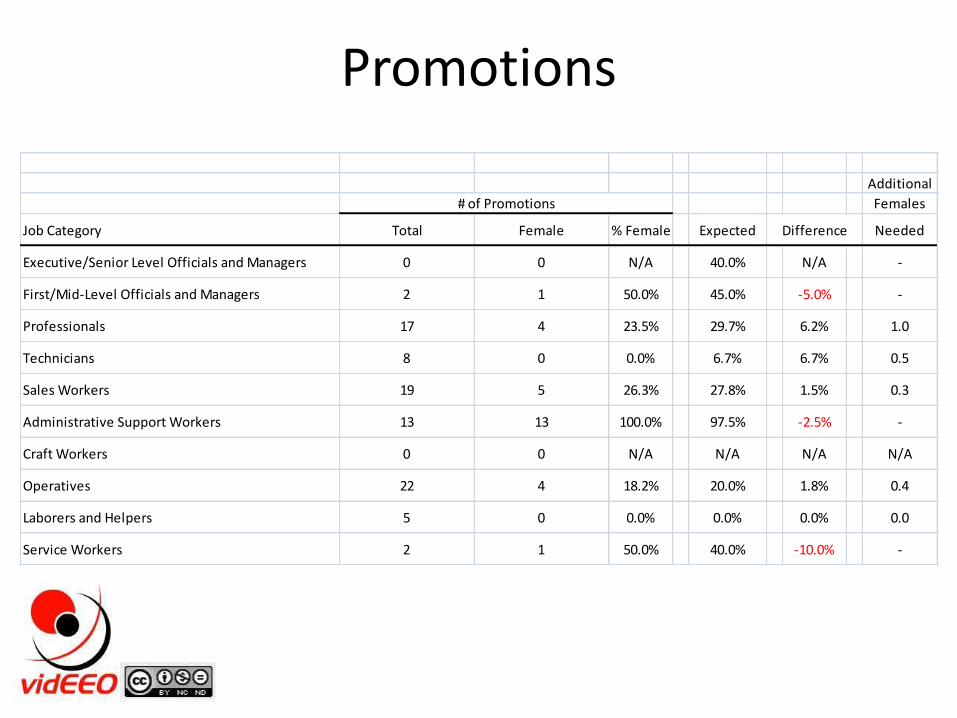
# of Promotions
Promotions
Additional
Females
Job Category Total Female % Female Expected Difference Needed
Executive/Senior Level Officials and Managers 0 0 N/A 40.0% N/A -
First/Mid-Level Officials and Managers 2 1 50.0% 45.0% -5.0% -
Professionals 17 4 23.5% 29.7% 6.2% 1.0
Technicians 8 0 0.0% 6.7% 6.7% 0.5
Sales Workers 19 5 26.3% 27.8% 1.5% 0.3
Administrative Support Workers 13 13 100.0% 97.5% -2.5% -
Craft Workers 0 0 N/A N/A N/A N/A
Operatives 22 4 18.2% 20.0% 1.8% 0.4
Laborers and Helpers 5 0 0.0% 0.0% 0.0% 0.0
Service Workers 2 1 50.0% 40.0% -10.0% -
# of Promotions
Promotions

Surplus
Female
Job Category Total Female % Female Expected Difference Terminations
Executive/Senior Level Officials and Managers 0 0 N/A 40.0% - -
First/Mid-Level Officials and Managers 1 0 0.0% 45.0% -45.0% -
Professionals 3 1 33.3% 29.7% 3.6% 0.1
Technicians 1 1 100.0% 6.7% 93.3% 0.9
Sales Workers 4 1 25.0% 27.8% -2.8% -
Administrative Support Workers 2 2 100.0% 97.5% 2.5% 0.1
Craft Workers 0 0 N/A N/A - -
Operatives 1 0 0.0% 20.0% -20.0% -
Laborers and Helpers 0 0 N/A 0.0% - -
Service Workers 0 1 N/A 40.0% - -
# of Terminations
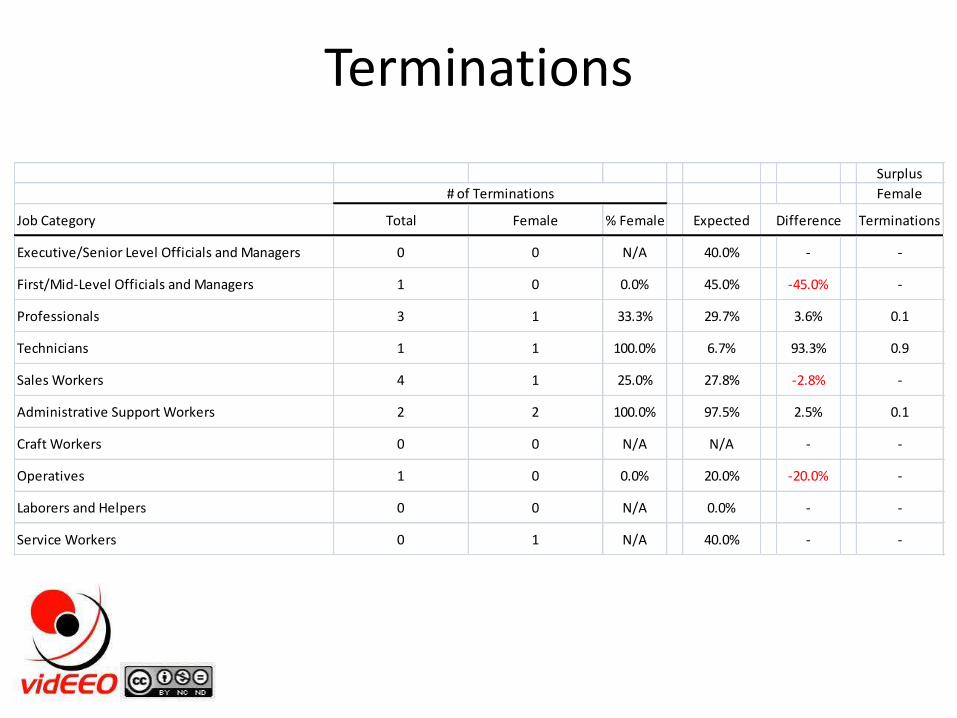
Terminations
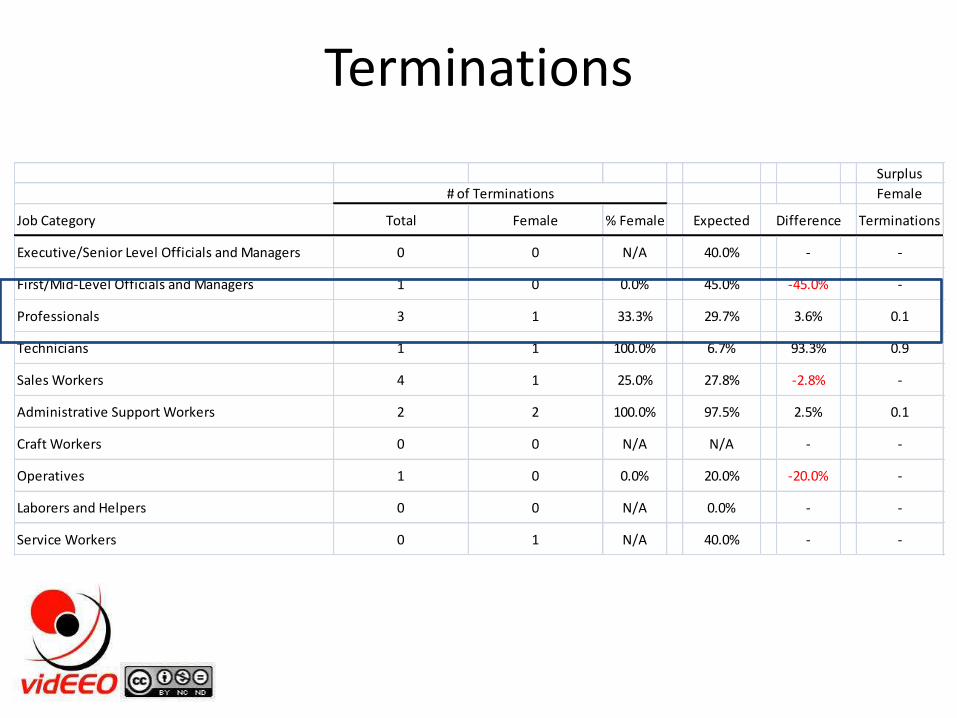
Surplus
Female
Job Category Total Female % Female Expected Difference Terminations
Executive/Senior Level Officials and Managers 0 0 N/A 40.0% - -
First/Mid-Level Officials and Managers 1 0 0.0% 45.0% -45.0% -
Professionals 3 1 33.3% 29.7% 3.6% 0.1
Technicians 1 1 100.0% 6.7% 93.3% 0.9
Sales Workers 4 1 25.0% 27.8% -2.8% -
Administrative Support Workers 2 2 100.0% 97.5% 2.5% 0.1
Craft Workers 0 0 N/A N/A - -
Operatives 1 0 0.0% 20.0% -20.0% -
Laborers and Helpers 0 0 N/A 0.0% - -
Service Workers 0 1 N/A 40.0% - -
# of Terminations
Terminations

Total
Job Category Employees Utilization Promotion Termination
Executive/Senior Level Officials and Managers 10 0.0 0.0 0.0 0.00
First/Mid-Level Officials and Managers 20 0.0 0.0 0.0 0.00
Professionals 165 0.5 1.0 0.1 0.01
Technicians 75 1.0 0.5 0.9 0.03
Sales Workers 90 2.0 0.3 0.0 0.03
Administrative Support Workers 40 0.0 0.0 0.1 0.00
Craft Workers 0 N/A N/A N/A N/A
Operatives 10 0.0 0.4 0.0 0.04
Laborers and Helpers 15 1.5 0.0 0.0 0.10
Service Workers 10 1.0 0.0 0.0 0.10
Additional FemalesSMG Index
The SMG Index

It’s not what you say,but how you say it
Which Do You Prefer?

Which Do You Prefer?Additional
Availability Females
Job Category Total Female % Female Estimate Difference Needed
Executive/Senior Level Officials and Managers 10 4 40.0% 39.0% -1.0% -
First/Mid-Level Officials and Managers 20 9 45.0% 39.0% -6.0% -
Professionals 165 49 29.7% 30.0% 0.3% 0.5
Technicians 75 5 6.7% 8.0% 1.3% 1.0
Sales Workers 90 25 27.8% 30.0% 2.2% 2.0
Administrative Support Workers 40 39 97.5% 85.0% -12.5% -
Craft Workers 0 0 N/A N/A N/A N/A
Operatives 10 2 20.0% 15.0% -5.0% -
Laborers and Helpers 15 0 0.0% 10.0% 10.0% 1.5
Service Workers 10 4 40.0% 50.0% 10.0% 1.0
# of Employees
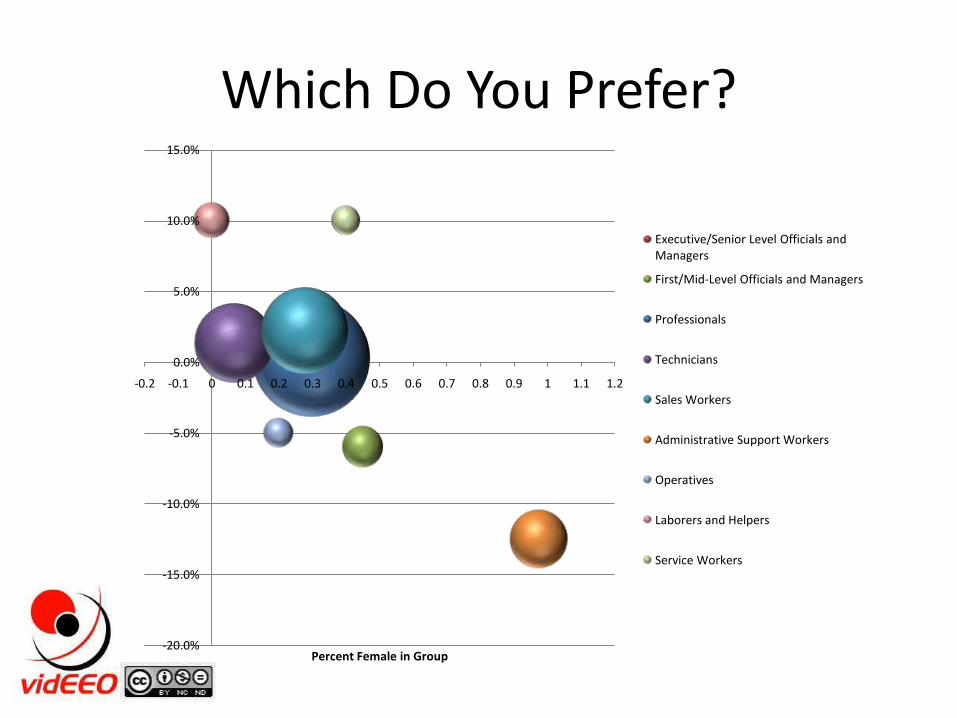
Which Do You Prefer?
-20.0%
-15.0%
-10.0%
-5.0%
0.0%
5.0%
10.0%
15.0%
-0.2 -0.1 0 0.1 0.2 0.3 0.4 0.5 0.6 0.7 0.8 0.9 1 1.1 1.2
Percent Female in Group
Executive/Senior Level Officials and Managers
First/Mid-Level Officials and Managers
Professionals
Technicians
Sales Workers
Administrative Support Workers
Operatives
Laborers and Helpers
Service Workers