The EEG and Automated sleep Staging - University of Oxfordgari/teaching/cdt/A3/15_A3... · The...
47
Dr. Gari D. Clifford, University Lecturer & Director, Centre for Doctoral Training in Healthcare Innovation, Institute of Biomedical Engineering, University of Oxford Sleep The EEG and Automated sleep Staging Centre for Doctoral Training in Healthcare Innovation Prof. Lionel Tarassenko Dr Gari Clifford
Transcript of The EEG and Automated sleep Staging - University of Oxfordgari/teaching/cdt/A3/15_A3... · The...

Dr. Gari D. Clifford, University Lecturer & Director, Centre for Doctoral Training in Healthcare Innovation, Institute of Biomedical Engineering, University of Oxford
Sleep The EEG and Automated sleep Staging
Centre for Doctoral Training in Healthcare Innovation Prof. Lionel Tarassenko Dr Gari Clifford

How the electroencephalogram (EEG) is recorded
How to interpret the EEG Epilepsy Sleep Vigilance Depth of Anesthesia …
Feature extraction and event detection in the EEG
Creating an automated sleep stager
Making a commercial system

The EEG signal is measured with Ag-AgCl electrodes
Placed in standard positions on the scalp
Signal is <100μV – Why?
(Recall ECG is ~1mV)
Heart: ~3x10⁹
Brain: ~1011

The EEG signal is measured with Ag-AgCl electrodes
Placed in standard positions on the scalp
Signal is <100μV – Why?
due to skull attenuation

The important information is in the frequency domain.
The frequency range from 0.5 to 30 Hz has been arbitrarily divided into 5 bands:
Delta 0.5-4Hz Deep Sleep
Theta 4-8 Hz Drowsiness / light sleep
Alpha 8-13 Hz Relaxed
Beta 13-22 Hz Alert
Gamma 22-30 Hz Short term memory tasks?

EEG analysis helps in the diagnosis of brain death, epilepsy and sleep disorders
EEG during an epileptic seizure

Quality of life is heavily dependent on quality of sleep.
Between 5 and 10% of the adult population suffers from some form of sleep disorder (insomnia, heavy snoring, Obstructive Sleep Apnoea (OSA), etc…)
Such people may be referred to a “sleep clinic” by their GP where various signals, including four channels of EEG, the EOG and oxygen saturation, will be recorded throughout the night.
The EEG and the other signals are printed out and reviewed by a trained sleep technician (requiring 2 to 5 hours for each record).

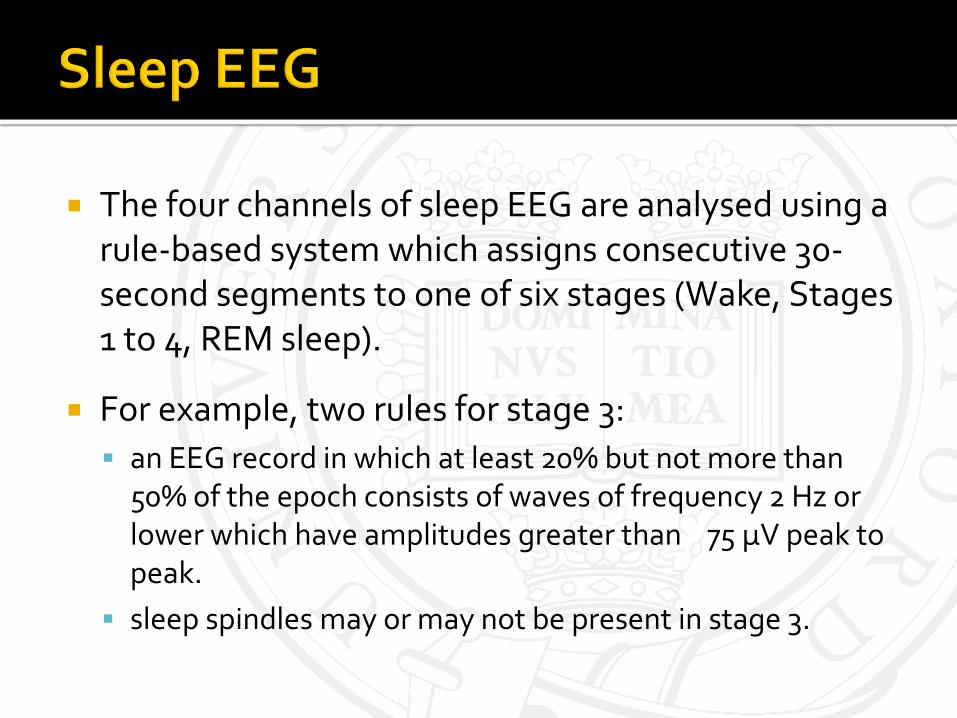
The four channels of sleep EEG are analysed using a rule-based system which assigns consecutive 30-second segments to one of six stages (Wake, Stages 1 to 4, REM sleep).
1= light, 3 & 4 = deep sleep
Recently stages 3&4 merged

The four channels of sleep EEG are analysed using a rule-based system which assigns consecutive 30-second segments to one of six stages (Wake, Stages 1 to 4, REM sleep).
For example, two rules for stage 3:
an EEG record in which at least 20% but not more than 50% of the epoch consists of waves of frequency 2 Hz or lower which have amplitudes greater than 75 μV peak to peak.
sleep spindles may or may not be present in stage 3.


The important information is in the frequency domain.
Use the Short-term Fourier Transform or an Auto-Regressive (AR) model to extract the frequency-domain information.

The notation AR(p) refers to the autoregressive model of order p. The AR(p) model is written as follows:
X t = ai X t-i + t (1 i p)
where the ai’s are the parameters of the model and εt is a white-noise process with zero mean.
An autoregressive model is essentially an infinite impulse response filter which shapes the white-noise input. The poles are the resonances of the filter and correspond to the spectral peaks in the signal.


Conventional computing A set of programmed instructions IF A = B THEN ADD 3 TO RESULT
ELSE SUBTRACT 5 Neural networks The solution to a problem is learnt from a
set of examples using error feedback

By analogy with the brain, artificial neural networks
consist of large numbers of small units (“neurons”)
with modifiable connections (“synapses”), ordered
in feedforward layers

Neural networks: A computational system which learns from examples how to recognise complex patterns in data, signals or images.
Learning: The process of modifying the neural network’s internal connections (the synaptic weights) until desired output responses are associated with the input patterns in the training set.
Generalisation: The ability to generate the correct output response for a test pattern, an input pattern not previously seen (i.e. not in the training set).

The signal recorded from one EEG channel is sampled at 128 Hz and segmented into one-second epochs.
The input data are the ten AR coefficients for each consecutive one-second epoch.
The multi-layer perceptron (MLP) neural network is trained to classify the input EEG data into three output classes: awake, light sleep or deep sleep. This involves the gradual modification of the synaptic weights in the hidden-output and input-hidden layers (error minimisation using gradient descent).

The training data are collected from human-scored sleep,
selecting only “consensus-scored” Wake, REM or stage 1 and stage 4 data (independently scored by three experts).
Once the network is trained, the intermediate stages for test EEG data are obtained by interpolation.

The neural network is trained to classify the input EEG data into three output classes: wakefulness, light sleep or deep sleep.
The trained neural network is used for the
automated analysis of the EEG recorded from new patients (test data).

Seven 20-minute recordings from patients with different levels of OSA used as test data
EEG scored by one expert according to the American Sleep Disorders Association (ASDA) rules
P(Wake) - P(Deep Sleep) used to represent the sleep-wake continuum
Transients shorter than 3 s discarded using median filtering


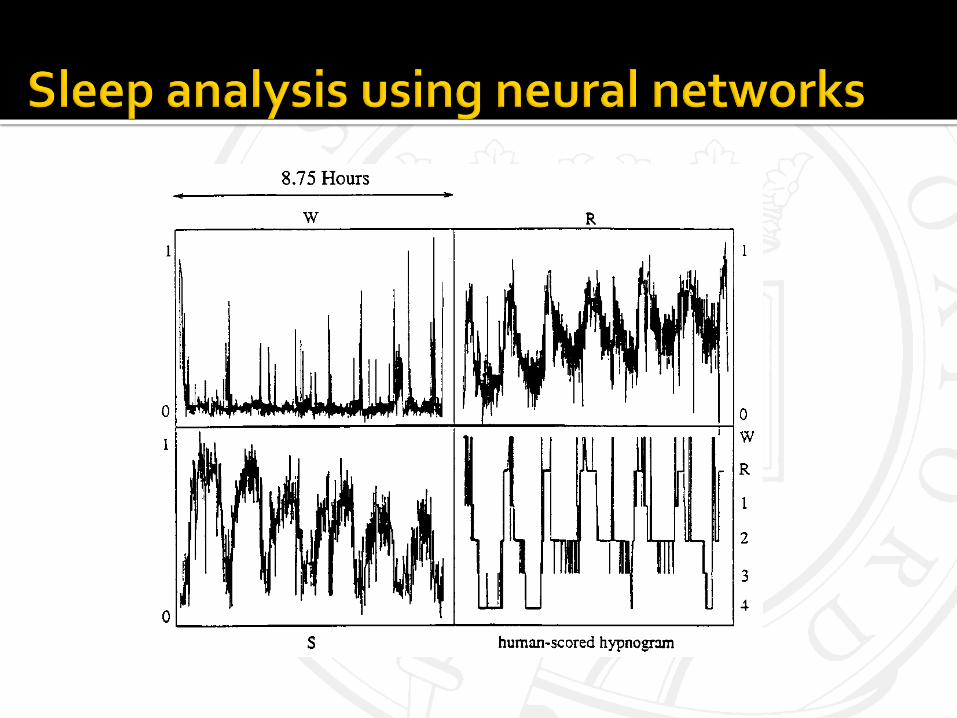
Sleep analysis using neural networks (20 mins of data)

Continuous tracking of sleep-wake continuum using single channel of EEG
Events on a 2 to 5-second timescale are clearly detected
This type of analysis is not possible with the traditional sleep scoring methods, which require several channels and only have 30-sec resolution
Oxford Medical incorporated neural network analysis as an option within their Sleep Analysis software

A change in management in Oxford Instruments (parent company of Oxford Medical)

Oxford Instruments’
share price

A change in management in Oxford Instruments
Developing a product from the original concept to (successful) commercial exploitation was and is still the main motivation
Creating new jobs
Financial reward?
July 1999: Preliminary discussions with Dr Tim Cook of Isis Innovation July 1999: Isis Project Manager appointed (Dr Herb Askew) August 1999: Meeting with Oxford Instruments CEO who gives green light

August 1999: Potential CEO becomes involved in drafting Business Plan September 1999: Business Plan is put together with the help of Deloitte & Touche October 1999: Initial version of Business Plan is discussed with Oxford Instruments

December 1999: Final version of Business Plan is approved and sent to
potential investors December 1999:
Heads of Agreement document drawn up by Isis Project Manager is signed by University and Oxford Instruments

January 2000: Following a presentation at Isis Innovation, Venture
Capital Fund agrees to invest in Oxford BioSignals February 2000: Investment from University Challenge Fund May 2000: Oxford BioSignals is set up, with all relevant IP
assigned or licensed to the company

Oxford BioSignals
Investment Agreement

Protected intellectual property


Protected intellectual property
On-going research for the medium to long-term
A first-class management team
A willingness to be flexible – jack of all trades

Continuous tracking of sleep-wake continuum from a single-channel of EEG
Automated analysis makes it possible to quantify severity of OSA (and other sleep disorders) before and after treatment.


Rest & Digest Fight & Flight
http://www.becomehealthynow.com/images/organs/nervous/sympth_parasymth.gif

http://sdic.sookmyung.ac.kr/pharmacotherapy/INSOM/sleep_cycle.jpg

Only short segments of data required Unit-free - no scaling issues Thought to reflect the sympathovagal balance

HRV changes
significantly in different sleep cycles and for different conditions:
Wakefulness Deep Sleep
Light Sleep
REM (Dream) Sleep


SNA: Sympathetic Nerve Activity (recorded from peroneal nerve)