Ar/ Ar dating
58
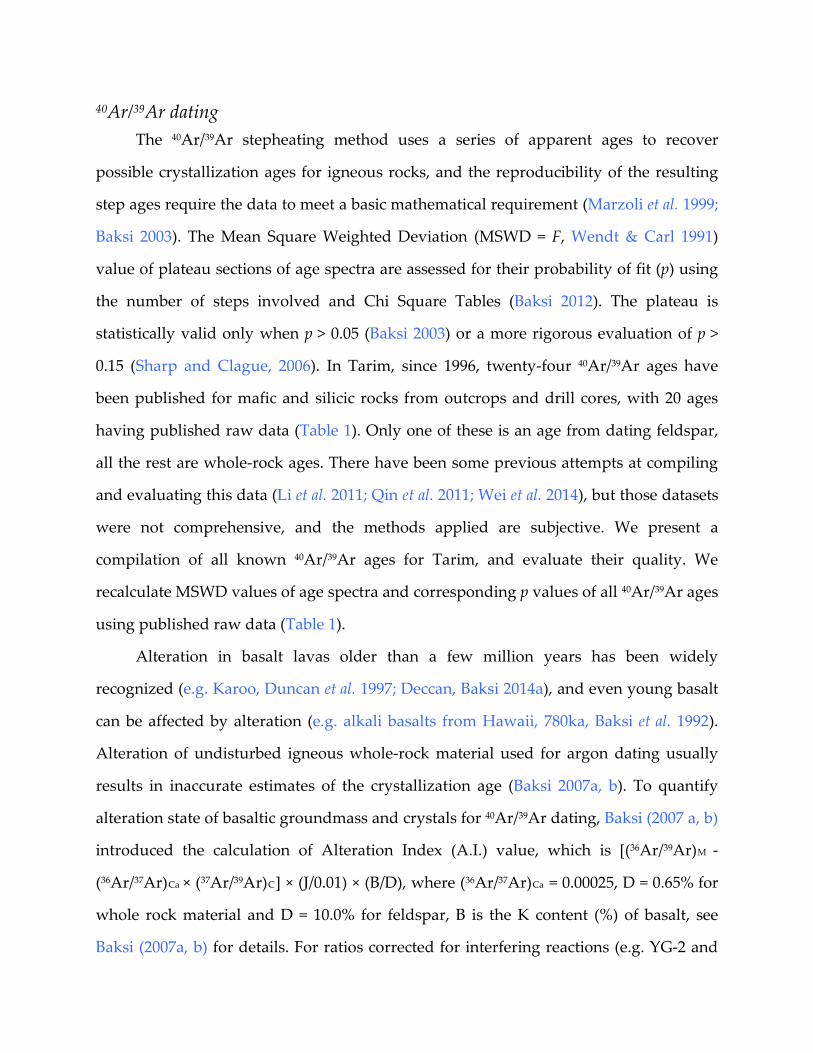
40 Ar/ 39 Ar dating The 40 Ar/ 39 Ar stepheating method uses a series of apparent ages to recover possible crystallization ages for igneous rocks, and the reproducibility of the resulting step ages require the data to meet a basic mathematical requirement (Marzoli et al. 1999; Baksi 2003). The Mean Square Weighted Deviation (MSWD = F, Wendt & Carl 1991) value of plateau sections of age spectra are assessed for their probability of fit (p) using the number of steps involved and Chi Square Tables (Baksi 2012). The plateau is statistically valid only when p > 0.05 (Baksi 2003) or a more rigorous evaluation of p > 0.15 (Sharp and Clague, 2006). In Tarim, since 1996, twenty-four 40 Ar/ 39 Ar ages have been published for mafic and silicic rocks from outcrops and drill cores, with 20 ages having published raw data (Table 1). Only one of these is an age from dating feldspar, all the rest are whole-rock ages. There have been some previous attempts at compiling and evaluating this data (Li et al. 2011; Qin et al. 2011; Wei et al. 2014), but those datasets were not comprehensive, and the methods applied are subjective. We present a compilation of all known 40 Ar/ 39 Ar ages for Tarim, and evaluate their quality. We recalculate MSWD values of age spectra and corresponding p values of all 40 Ar/ 39 Ar ages using published raw data (Table 1). Alteration in basalt lavas older than a few million years has been widely recognized (e.g. Karoo, Duncan et al. 1997; Deccan, Baksi 2014a), and even young basalt can be affected by alteration (e.g. alkali basalts from Hawaii, 780ka, Baksi et al. 1992). Alteration of undisturbed igneous whole-rock material used for argon dating usually results in inaccurate estimates of the crystallization age (Baksi 2007a, b). To quantify alteration state of basaltic groundmass and crystals for 40 Ar/ 39 Ar dating, Baksi (2007 a, b) introduced the calculation of Alteration Index (A.I.) value, which is [( 36 Ar/ 39 Ar) M - ( 36 Ar/ 37 Ar) Ca × ( 37 Ar/ 39 Ar) C] × (J/0.01) × (B/D), where ( 36 Ar/ 37 Ar) Ca = 0.00025, D = 0.65% for whole rock material and D = 10.0% for feldspar, B is the K content (%) of basalt, see Baksi (2007a, b) for details. For ratios corrected for interfering reactions (e.g. YG-2 and
Transcript of Ar/ Ar dating
40Ar/39Ar dating The 40Ar/39Ar stepheating method uses a series of apparent ages to recover
possible crystallization ages for igneous rocks, and the reproducibility of the resulting
step ages require the data to meet a basic mathematical requirement (Marzoli et al. 1999;
Baksi 2003). The Mean Square Weighted Deviation (MSWD = F, Wendt & Carl 1991)
value of plateau sections of age spectra are assessed for their probability of fit (p) using
the number of steps involved and Chi Square Tables (Baksi 2012). The plateau is
statistically valid only when p > 0.05 (Baksi 2003) or a more rigorous evaluation of p >
0.15 (Sharp and Clague, 2006). In Tarim, since 1996, twenty-four 40Ar/39Ar ages have
been published for mafic and silicic rocks from outcrops and drill cores, with 20 ages
having published raw data (Table 1). Only one of these is an age from dating feldspar,
all the rest are whole-rock ages. There have been some previous attempts at compiling
and evaluating this data (Li et al. 2011; Qin et al. 2011; Wei et al. 2014), but those datasets
were not comprehensive, and the methods applied are subjective. We present a
compilation of all known 40Ar/39Ar ages for Tarim, and evaluate their quality. We
recalculate MSWD values of age spectra and corresponding p values of all 40Ar/39Ar ages
using published raw data (Table 1).
Alteration in basalt lavas older than a few million years has been widely
recognized (e.g. Karoo, Duncan et al. 1997; Deccan, Baksi 2014a), and even young basalt
can be affected by alteration (e.g. alkali basalts from Hawaii, 780ka, Baksi et al. 1992).
Alteration of undisturbed igneous whole-rock material used for argon dating usually
results in inaccurate estimates of the crystallization age (Baksi 2007a, b). To quantify
alteration state of basaltic groundmass and crystals for 40Ar/39Ar dating, Baksi (2007 a, b)
introduced the calculation of Alteration Index (A.I.) value, which is [(36Ar/39Ar)M -
(36Ar/37Ar)Ca × (37Ar/39Ar)C] × (J/0.01) × (B/D), where (36Ar/37Ar)Ca = 0.00025, D = 0.65% for
whole rock material and D = 10.0% for feldspar, B is the K content (%) of basalt, see
Baksi (2007a, b) for details. For ratios corrected for interfering reactions (e.g. YG-2 and
YG-14), we use a simplified equation for A.I. = (36Ar/39Ar) × (J/0.01) × (B/D) (Baksi pers.
comm. 2014). Fresh material is defined as having A.I. < 0.00060. Such an approach has
proved successful in evaluating the alteration state of 40Ar/39Ar dating of basalts in some
continental flood basalts provinces (e.g. Columbia River Group, Baksi 2013; Deccan,
Baksi 2014a; Siberian Trap & Emeishan flood basalt, Baksi 2014b). In the Emeishan flood
basalts, Baksi (2014b) tested the proposed temporal link between such magmatic events
with Permo-Triassic boundary mass extinctions (Lo et al. 2002). However, all five whole
rock samples in Lo et al. (2002) are determined to be quite altered by the A.I. method
(Baksi 2014b). To further quantify whole rock 40Ar/39Ar dating results in Tarim, we
utilize this method to calculate the A.I. value of these dated basalts (Fig. 1a, Table 1).
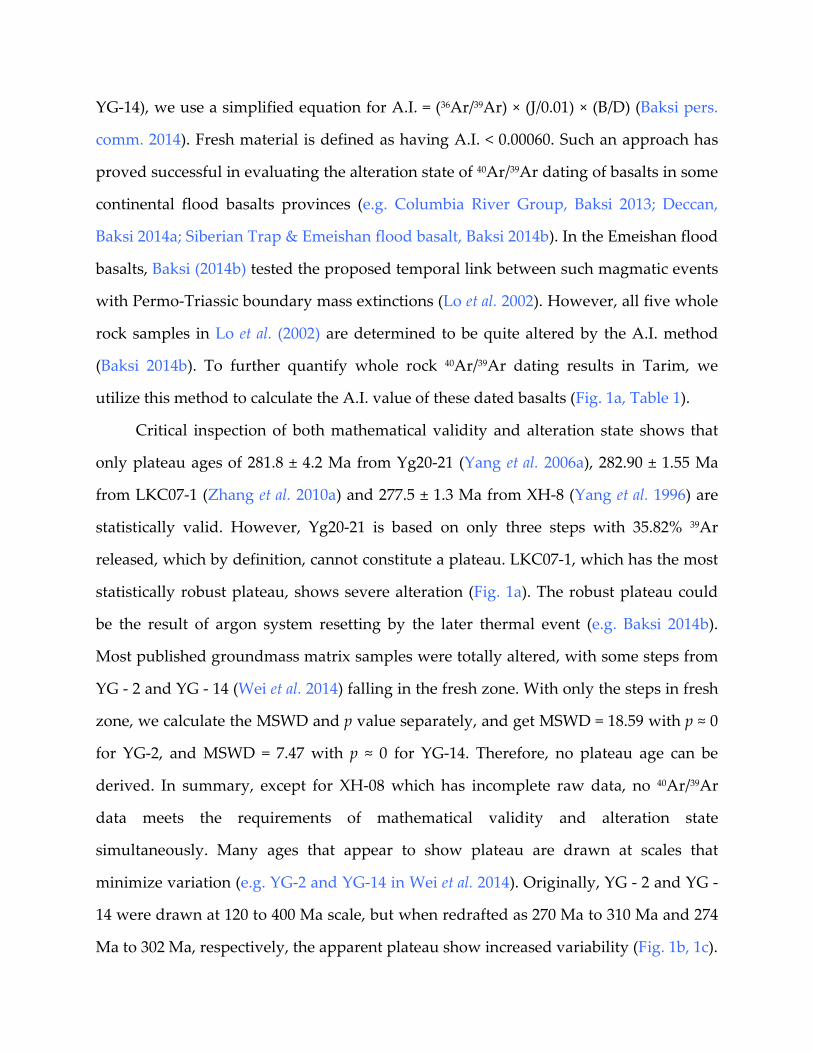
Critical inspection of both mathematical validity and alteration state shows that
only plateau ages of 281.8 ± 4.2 Ma from Yg20-21 (Yang et al. 2006a), 282.90 ± 1.55 Ma
from LKC07-1 (Zhang et al. 2010a) and 277.5 ± 1.3 Ma from XH-8 (Yang et al. 1996) are
statistically valid. However, Yg20-21 is based on only three steps with 35.82% 39Ar
released, which by definition, cannot constitute a plateau. LKC07-1, which has the most
statistically robust plateau, shows severe alteration (Fig. 1a). The robust plateau could
be the result of argon system resetting by the later thermal event (e.g. Baksi 2014b).
Most published groundmass matrix samples were totally altered, with some steps from
YG - 2 and YG - 14 (Wei et al. 2014) falling in the fresh zone. With only the steps in fresh
zone, we calculate the MSWD and p value separately, and get MSWD = 18.59 with p ≈ 0
for YG-2, and MSWD = 7.47 with p ≈ 0 for YG-14. Therefore, no plateau age can be
derived. In summary, except for XH-08 which has incomplete raw data, no 40Ar/39Ar
data meets the requirements of mathematical validity and alteration state
simultaneously. Many ages that appear to show plateau are drawn at scales that
minimize variation (e.g. YG-2 and YG-14 in Wei et al. 2014). Originally, YG - 2 and YG -
14 were drawn at 120 to 400 Ma scale, but when redrafted as 270 Ma to 310 Ma and 274
Ma to 302 Ma, respectively, the apparent plateau show increased variability (Fig. 1b, 1c).
Zircons from basalt Through new experimental petrology, Boehnke et al. (2013) have shown that high
concentrations of Zr (> 5000 ppm) are required to directly crystallize zircon from
basaltic liquids under simulated physicochemical conditions (1 GPa, 1175-1225 ℃).
Previous geochemical studies of the Keping and Damusi basalt have found Zr
concentrations < 500 ppm (191~495 ppm, Jiang et al. 2004a; 232~289 ppm, Yu 2009;
232~421 ppm, Yu et al. 2011b; 266~357 ppm, Zhou et al. 2009; 330~402 ppm, Damusi
basalt, Li et al. 2008). Therefore, it seems unlikely that zircons crystallized from these
basalts.
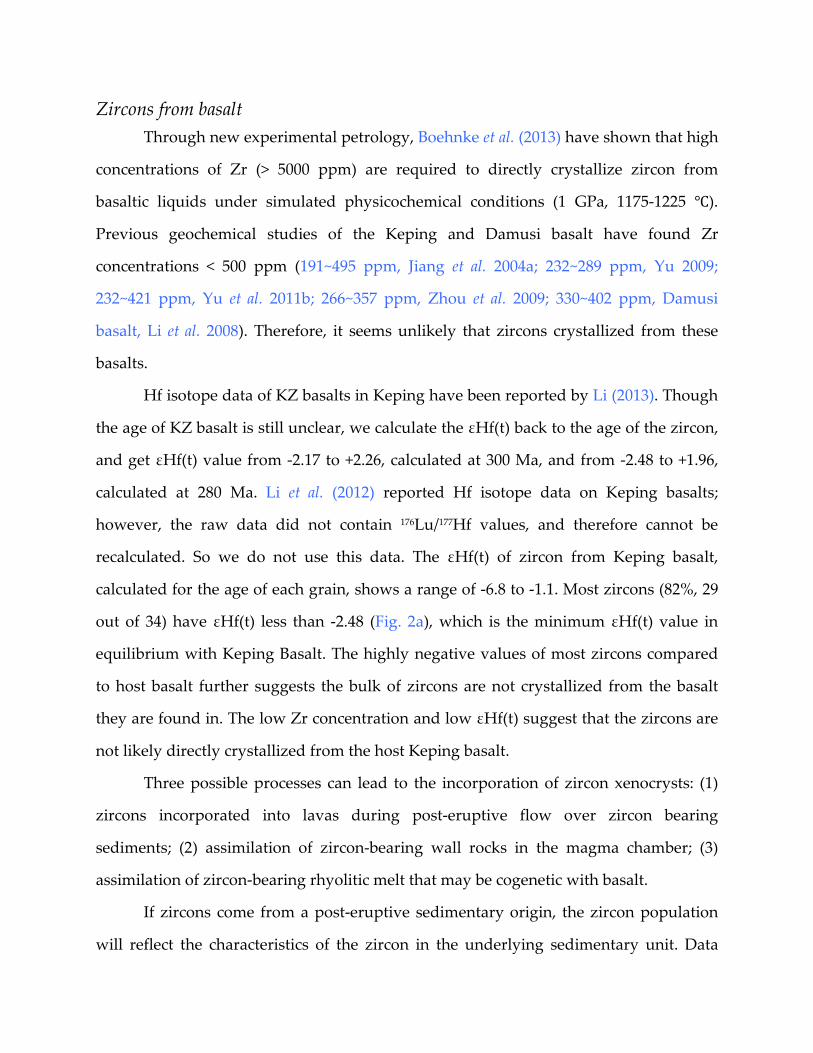
Hf isotope data of KZ basalts in Keping have been reported by Li (2013). Though
the age of KZ basalt is still unclear, we calculate the εHf(t) back to the age of the zircon,
and get εHf(t) value from -2.17 to +2.26, calculated at 300 Ma, and from -2.48 to +1.96,
calculated at 280 Ma. Li et al. (2012) reported Hf isotope data on Keping basalts;
however, the raw data did not contain 176Lu/177Hf values, and therefore cannot be
recalculated. So we do not use this data. The εHf(t) of zircon from Keping basalt,
calculated for the age of each grain, shows a range of -6.8 to -1.1. Most zircons (82%, 29
out of 34) have εHf(t) less than -2.48 (Fig. 2a), which is the minimum εHf(t) value in
equilibrium with Keping Basalt. The highly negative values of most zircons compared
to host basalt further suggests the bulk of zircons are not crystallized from the basalt
they are found in. The low Zr concentration and low εHf(t) suggest that the zircons are
not likely directly crystallized from the host Keping basalt.
Three possible processes can lead to the incorporation of zircon xenocrysts: (1)
zircons incorporated into lavas during post-eruptive flow over zircon bearing
sediments; (2) assimilation of zircon-bearing wall rocks in the magma chamber; (3)
assimilation of zircon-bearing rhyolitic melt that may be cogenetic with basalt.
If zircons come from a post-eruptive sedimentary origin, the zircon population
will reflect the characteristics of the zircon in the underlying sedimentary unit. Data
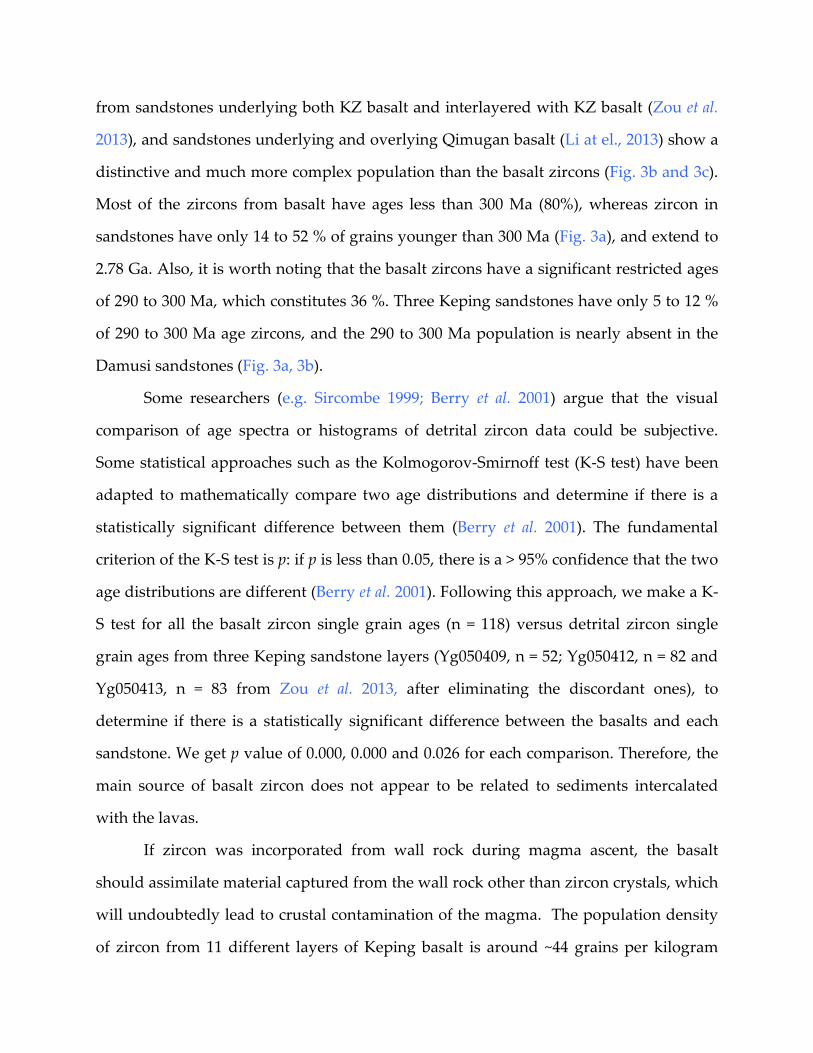
from sandstones underlying both KZ basalt and interlayered with KZ basalt (Zou et al.
2013), and sandstones underlying and overlying Qimugan basalt (Li at el., 2013) show a
distinctive and much more complex population than the basalt zircons (Fig. 3b and 3c).
Most of the zircons from basalt have ages less than 300 Ma (80%), whereas zircon in
sandstones have only 14 to 52 % of grains younger than 300 Ma (Fig. 3a), and extend to
2.78 Ga. Also, it is worth noting that the basalt zircons have a significant restricted ages
of 290 to 300 Ma, which constitutes 36 %. Three Keping sandstones have only 5 to 12 %
of 290 to 300 Ma age zircons, and the 290 to 300 Ma population is nearly absent in the
Damusi sandstones (Fig. 3a, 3b).
Some researchers (e.g. Sircombe 1999; Berry et al. 2001) argue that the visual
comparison of age spectra or histograms of detrital zircon data could be subjective.
Some statistical approaches such as the Kolmogorov-Smirnoff test (K-S test) have been
adapted to mathematically compare two age distributions and determine if there is a
statistically significant difference between them (Berry et al. 2001). The fundamental
criterion of the K-S test is p: if p is less than 0.05, there is a > 95% confidence that the two
age distributions are different (Berry et al. 2001). Following this approach, we make a K-
S test for all the basalt zircon single grain ages (n = 118) versus detrital zircon single
grain ages from three Keping sandstone layers (Yg050409, n = 52; Yg050412, n = 82 and
Yg050413, n = 83 from Zou et al. 2013, after eliminating the discordant ones), to
determine if there is a statistically significant difference between the basalts and each
sandstone. We get p value of 0.000, 0.000 and 0.026 for each comparison. Therefore, the
main source of basalt zircon does not appear to be related to sediments intercalated
with the lavas.
If zircon was incorporated from wall rock during magma ascent, the basalt
should assimilate material captured from the wall rock other than zircon crystals, which
will undoubtedly lead to crustal contamination of the magma. The population density
of zircon from 11 different layers of Keping basalt is around ~44 grains per kilogram
(from 13 to 104, with standard deviation = 24). The population density of zircon from
two Halahatang rhyolite samples is > 3000 grains per kilogram. An average of 15 g of
rhyolite will supply 1 kg of basalt with 45 zircon grains, which means that mixing of ~
1.5% rhyolitic magma would be sufficient to serve as a source for zircon xenocrysts in
basalt magma, and such a small amount of assimilation would not significantly impact
major element geochemistry. The strong 290 to 300 Ma zircon signature rules out the
possibility of sourcing basement zircon from the Tarim Carton, which has experienced
eight main phases of tectothermal events from 2950 to 400 Ma (Wu et al. 2012).
Therefore, assimilation of zircon-bearing rhyolitic material appears to be the most likely
source of basalt zircons, and the occurrence of intercalated rhyolites within the basalt
lavas suggests that silicic and basaltic magmas could have interacted.
Li et al. (2014) suggested that the Keping basalt zircons were probably from
coeval silicic volcanic and pyroclastic rock suites (VPR suite) in the South Tianshan
Orogen based on the zircon Hf isotope similarity, morphological characteristics and
Th/U ratios. Hf isotopes do discriminate between different components of Tarim
volcanism, and suggest a correlation between zircons from basalts and the VPR suite.
The Th/U ratio is not a good discrimination tool, and all Tarim zircons overlap (Fig. 2b).
Since zircon in basalt are not likely entrained after eruption, the most likely possibility
is pre-eruption assimilation. Considering that Keping basalt is more than 300 km away
from dacite outcrops in Tianshan, we propose that any genetic linkage between possible
zircon source and basalt magmas requires more constraints. Also, while the zirconium
saturation criteria of Boehnke et al. (2013) indicates that Keping basalts will not
crystallize zircon, the Watson & Harrison (1983) calculations used by Li et al. (2014) are
only applicable to silicic compositions.
Silicic extrusive and intrusive rocks In general, for silicic rocks we recalculate the error correlation (RHO value)
of 207Pb/235U-206Pb/238U ratios, and ages with RHO beyond the range of 0 to 1 are
eliminated. We interpret the zircon grains corresponding to discordant dates to be
affected by lead loss. However, the lead loss in zircon has several possible causes that
are difficult to quantify (e.g. radiation damage, diffusion, Mezger & Krogstad 1997), and
the high temperature annealing of zircon makes such issues even more complex
(Cherniak & Watson 2001). Detailed CL imaging analysis will help to identifying the
metamict zircons, which are highly likely to have lead loss. However, such data are
rarely available in previous Tarim studies. Therefore, a more robust scheme for dealing
with lead loss is to not use any zircon data that potentially suggests lead loss (Schoene
2014). The strategy we applied here is generally avoiding the discordant dates.
Xiaohaizi syenite intrusion The Xiaohaizi syenite intrusion, also referred to as the Mazhartage syenite
intrusion, is located in the Bachu uplift on the northwest margin of the Tarim basin (Fig.
4). This syenite body is circular in shape, with a radius of ~2.5 km. It is overprinted by a
more laterally extensive network of mafic dykes and quartz syenite porphyry dykes
that extent for tens to hundreds of meters in length, with widths of 0.6 to 4 m (Zhang et
al. 2008b). While there has been a lot of geochronologic work on this system, the outcrop
geology is not well constrained. The most recent publications bases their geologic map
on remote sensing data and field work (Zhang et al. 2008b). Original mapping divided
the intrusion into syenite and gabbro (Jiang et al. 2004c; Yang et al. 2006b, 2007; Sun et al.
2008). Sun et al. (2009) divided the intrusion into pyroxene syenite and amphibole
syenite. Recently, Chen et al. (2010), Wei & Xu (2011, 2013), Xu et al. (2014) followed the
map of Zhang et al. (2008b), which divides the intrusion into syenite, quartz syenite and
olivine gabbro. Wei & Xu (2011) also reported the occurrence of fayalite syenite and
amphibole syenite; however, the field relations remain complex because the extreme
topography restricts detailed mapping.
Eight zircon U-Pb ages, one whole rock (?) Ar-Ar age and one K-Ar age have
been reported on multiple lithologies from many different parts of the syenite intrusion
(Table 2). Excluding the K-Ar age, which does not have raw data, the ages range from
285.9 ± 2.6 Ma to 273.7 ± 1.5 Ma (Table 2).
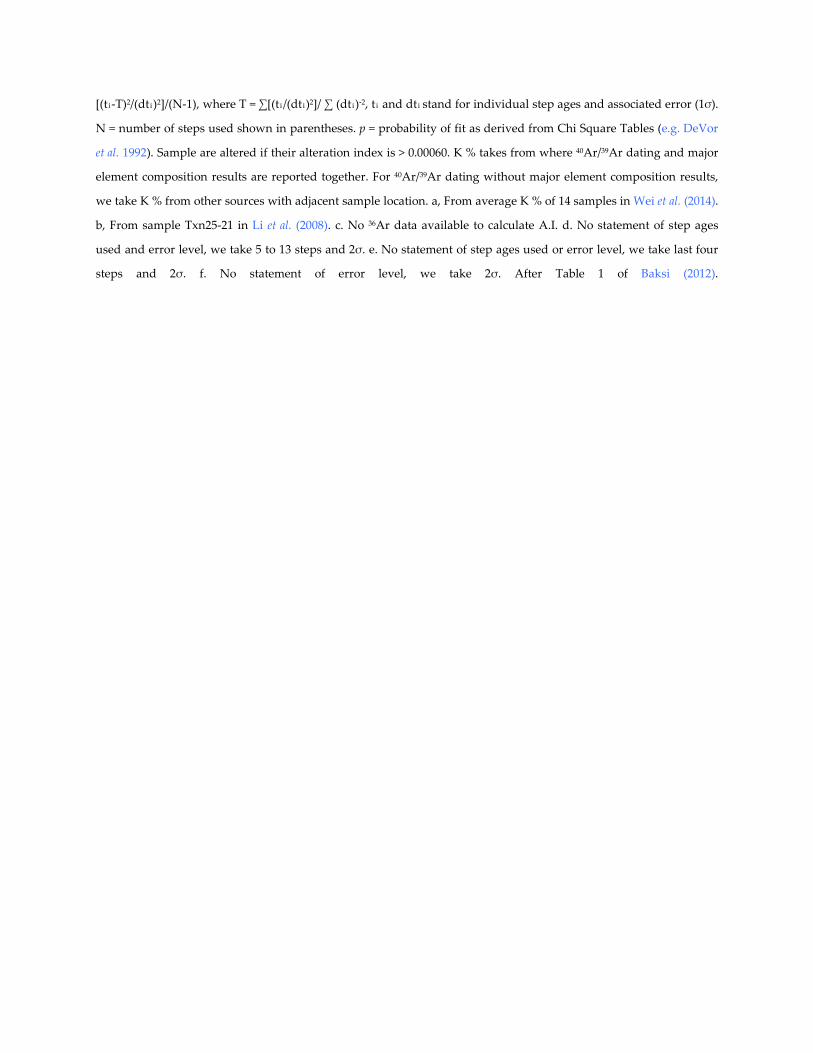
We recalculate every age using the published raw data and redraw every U-Pb
concordia plot (Fig. 5a). After eliminating spots with RHO (correlation coefficient, e.g.
Ludwig 1998, Schmitz & Schoene 2007) values out of the 0 to 1 range, which implies
that the uncertainty in the 207Pb/206Pb ratio is a significant source of dating (Mattinson
1987), or visually away from concordant curves, we get an average total age of 279.8 Ma,
with individual sample ages ranging from 285.2 ± 3.6 Ma (95 % conf.) to 272.3 ± 7.3 Ma
(95% conf.) (for details of recalculation, see Table 2 caption). Some important changes
occur compared to the original data, and will be discussed. Yang et al. (2006b) analyzed
15 zircons from one sample by SHRIMP U-Pb method, they eliminated four ages (253.7,
254.3, 301.7 and 248 Ma) and got a weighed mean average age of 277 ± 4 Ma. We
repeated his calculation with raw data from the rest 11 spots be used and get a
weighted mean average age of 271.4 ± 3.7 Ma. However, Yang et al. (2006b) did not
justify why the four ages should be thrown out, so we include them here because they
are concordant and appear robust. The new weighed mean average age of all the 15
zircons is 272.3 ± 7.3 Ma (95% conf.). All the spots in Zhang et al. (2008a) have negative
RHO value, indicating some issues with these data. Also, in Sun et al. (2008), the
percentage error of 207Pb/235U ratio is notably one magnitude larger than that of 206Pb/238U,
which results in fairly flat concordia plots (Fig. 5a).
Based on our recalculation of all of the Xiaohaizi syenite data, the ages are 285.2 ±
3.6 Ma to 272.3 ± 7.3 Ma (Table 2, Fig. 6b), with an age span totaling 12.9 Ma and
standard deviation of 4.3 Ma. The LA-ICP-MS zircon dating usually has a precision of 1 %
to 8 % for individual spot analyses, whereas SHRIMP and SIMS could be <5 %. The
difference between the oldest and youngest syenite ages equals ~4.7 % of the youngest
age, and so all of this difference could be attributed to analytical errors. However, due
to the lack of accurate geology mapping and precise sample location, it’s difficult to
conclusively assess the source of the age data scatter. It is possible that the large
diversity of composition reflects long-lived magmatism, and this may be producing the
observed age range.
The reported dating material includes syenite, quartz syenite, pyroxene syenite
and amphibole syenite (Table 2). To evaluate the possible diversity of igneous rocks, we
checked reported mineral assemblages of each sample. Some are mafic and olivine-
bearing, while others have quartz present, at up to 30 % by volume (Table 2). Also, for
three ages with published geochemistry data and additional geochemistry from Zhang
et al. (2008a), major element compositions vary dramatically, e.g. SiO2 ranges from
58.59 % to 69.07 % (Fig. 6a). By using a K-means approach to cluster the composition
groups, we cluster the 28 published data into four groups by SiO2-MgO-CaO content.
The center of each group is shown in Fig. 6a, with SiO2 content of 60.98%, 63.53%, 65.29%
and 68.12%, respectively. In summary, both the mineral assemblages and major element
data suggests a complex syenite intrusion, which requires more detailed study to fully
understand.
Long-lived syenitic centers are reported in East Greenland, which are
interpreted to be genetically linked to the North Atlantic Igneous Province (NAIP), and
have an age span of ~10 Ma (Riishuus et al. 2006). These systems contain a variety of
lithofacies including syenites, granites, quartz syenites and nepheline syenites, and
displays a temporal evolution in which SiO2 decreases with younging (74-56 %,
Riishuus et al. 2006). Similarly, we note that the three ages linked to geochemistry data
in the Xiaohaizi syenite intrusion also show a positive correlation between age and SiO2
content (Fig. 6a).
Granite plutons The Halajun area of northwest Tarim has eight granites (Fig. 7), two of which are
dated by SHRIMP U-Pb on zircon grains (Halajun 1 and Halajun 2), and the remaining
six by LA-ICP-MS U-Pb on zircon grains. The results range from 278 ± 3 Ma to 268.6 ±
1.5 Ma (Zhang et al. 2010a; Huang et al. 2012; Zhang & Zou 2013). We recalculate every
age using the published raw data and redraw every U-Pb concordia plot (Fig. 5b).
For the Halajun 1 pluton, Zhang et al. (2010a) obtained 14 analyses, and data
point 1.1 (289.8 ± 10.9 Ma) was eliminated due to its large error (Zhang et al. 2010a).
However, the large error of 206U/238Pb age is not reason enough to eliminate data. We
made a concordia plot for this pluton and find that data point 1.1 as well as 4.1 lie off of
the concordance line. For this reason, we eliminate these two data points, and get a
weighted mean average age of 274.6 ± 2.2 Ma.
For the Halajun 2 pluton, Zhang et al. (2010a) obtained 17 analyses, with data
point 1.1 (569.1 ± 10.7 Ma) being eliminated for having an old age and obvious bigger
grain size (Zhang et al. 2010a). On a concordia plot, it is clear that all the data points lie
off the concordance line, with the exception of point 1.1. However, this age is
significantly older than all the other ages from surrounding plutons, and without
additional data it is difficult to evaluate the geological context. So, we do not consider it
further here.
For the Halajun 3 pluton, Zhang & Zou (2013) obtained 20 analyses, within
which 8.1 (515.1 Ma), 9.1 (337.3 Ma) and 15.1 (293.2 Ma) were eliminated for variably
older ages, and in addition 8.1 and 9.1 have much larger grain sizes. The remaining 17
data points yielded a weighted mean average age of 271 ± 2 Ma with an MSWD = 8.5.
Considering the high MSWD, the author further eliminated zircons 6.1 (284.1 Ma) and
12.1 (280.7 Ma) to get a new age of 268.6 ± 1.5 Ma with a lower MSWD (1.6). However,
no justification was given for why these addition ages were eliminated. Analyses 6.1,
8.1 and 9.1 have 207U/235Pb ratio and 207U/235Pb ratios one magnitude larger than other
data points, which indicate a significant excess of 207Pb, and lie far off the concordance
line. In addition, the corresponding error of 207U/235Pb ratio for analysis 9.1 is one
magnitude larger than other data points, and yields RHO > 1. Also, 12.1 and 15.1 are off
the concordance line due to relatively higher 207Pb/235U and 206Pb/238U ratio respectively.
After eliminating these five analysis, we get a weighted mean average of 268.6 ± 2.0 Ma.
For the Halajun 4 pluton, Zhang & Zou (2013) obtained 20 analyses, and
eliminated 5.1 and 6.1 for their significantly younger ages, which they attributed to
inclusions in zircon grains observed in transmitted photos. Analyses 5.1 and 6.1 have
RHO value 1.01 and -0.59 respectively, which indicate something may be impacting the
covariation of 207Pb/235U and 206Pb/238U, and the existence of inclusions would be a
reasonable explanation. In addition, 13.1 also has a negative RHO (-0.13) value, and
may also contain inclusions. On a concordia plot, 17.1 is one magnitude larger in error
for the 207Pb/235U and 206Pb/238U ratios, which may be due to the low U concentration (23
ppm), and may cause larger uncertainty in the age calculation. Analyses 18.1 is off the
concordance line due to its high 207Pb/235U ratio. After eliminating these five data points
(5.1, 6.1, 13.1, 17.1 and 18.1), the remaining 15 data points yield a weighed mean average
age of 268.7 ± 1.6 Ma.
For the Halajun 5 pluton, Zhang & Zou (2013) obtained 20 analyses, with 3.1, 5.1,
8.1 and 12.1 being eliminated for their younger ages, and the authors attributed these
four younger zircons to metamictization. The reported absolute error of 207Pb/206Pb
ranges from 2.01 to 3.62, with 207Pb/206Pb ratio from 0.0053 to 0.0115, and absolute error
of 207Pb/235U ratio is from 0.1857 to 0.3386, with 207Pb/235U ratio from 0.8 to 1.25. Therefore
the percentage error would be more than 30,000% for 207Pb/206Pb and ~ 35% for 207Pb/235U.
For the Kezile pluton, Zhang & Zou (2013) obtained 25 analyses (note that the
published data listed as Kezile does not correspond to the plot for this pluton. We use
the table data as correct. On a concordia plot, all the analysis are concordant, and yield a
weighted mean average age of 268.7 ± 1.6 Ma, with MSWD of 0.94.
For the Guerlale pluton, Zhang & Zou (2013) obtained 17 analyses. Three
analyses have distinctive higher 207Pb/206Pb ratios than other analyses, with two of them
(3 and 15) off the concordance line and, one (10) with a negative RHO value. Analyses 2
and 10 also have negative RHO values, which indicate a proportional negative variation
between 207Pb/235U ratio and 206Pb/238U ratio, which can be further confirmed by their
old 207Pb/235U ages (523 Ma and 420 Ma, respectively). Analyses 16 has an age of 257 ± 1
Ma, and is concordant without any evidence of lead loss or anomaly in experiment.
However, it is distinctively younger and does not overlap with any other single grain
age from the surrounding plutons within 1σ error, so we do not use it in the weighted
mean average age calculation. The remaining 13 analyses yield an age of 271.4 ± 1.6 Ma.
For the Kezi’ertuo pluton, Huang et al. (2012) obtained 35 analyses, and all the
analyses are concordant, and yielded an age of 272.7 ± 1.1 Ma (Table 3, Fig. 5b).
After recalculation, the ages for Halajun plutons range from 275.3 ± 1.1 Ma to
268.6 ± 2.0 Ma, with an age span of 6.7 Ma (Fig. 6c). It should be noted that the single
zircon ages of the Kezile and Guerlale plutons show age ranges of 11 Ma and 9 Ma,
respectively, and have high MSWD values of 3.6 and 5.5. This suggests that the zircons
reflect a complex magmatic history. Several distinctive zircon populations can be
recognized on the weighted mean average plot for the above two plutons (Fig. 8a and
8b). In addition, granites with relatively low MSWD also show large spans between the
oldest and youngest grains. For example, Halajun 4 pluton has a span of 15.3 Ma, from
275.9 Ma to 260.6 Ma (Fig. 6c).
Advances in zircon TIMS and SIMS analyses result in reduced analytical
uncertainty. Studies have shown that the timeframe of granitic pluton assembly is
potentially several million years (e.g. > 5 Ma for Mt. Stuart, WA., USA; > 8 Ma for
Tuolumne, CA., USA; Miller et al. 2007). The granitic plutons presented here could be
characterized by continuous or episodic growth and the dating of granite emplacement
could also be complicated by multi-stage growth of zircon. Possible approaches to
address such complexity could be coupled back-scattered electron (BSE) and
cathodoluminescence (CL) imaging with chemical analyses of zircon (e.g. Gagnevin et al.
2010).
For all granite plutons, only one concordant age is distinctively older than other
single grain ages (1.1 of the Halajun 2 pluton: 569.1 Ma). There appears to be a notable
lack of xenocrystic zircons in these plutons, for xenocrysts would presumably have to
be appreciably older than the majority of zircon crystals. Considering the big age scatter
in individual plutons in this area, it is more likely that the majority of zircon
populations either grew continuously or sporadically within these magmas.
Miller et al. (2003) observed a suite of fifty-four granitoids, and found that the
plutons with a lot of inherited zircons usually have Zr saturation temperature (Tzr) <
800 ℃ and those without have Tzr > 800 ℃. (Tzr is calculated using the empirical
equation by Watson & Harrison 1983). It is intriguing that the granite plutons in the
Halajun area show variable MSWD value, from 5.5 to 0.74. The lack of published zircon
CL images of these plutons makes it impossible to identify different zircon population
by morphological characteristics. So, to attempt to quantify the extent of inherited
zircons, we calculated the standard deviation (SD) of single zircon ages of individual
plutons instead of using the MSWD value. Because some analyses were done by LA-
ICP-MS and some by SHRIMP, we cannot directly compare MSWD. We calculate the Tzr
of the six granite plutons with concordant ages, and find that a negative correlation (Fig.
6d). Fitting curve: standard deviation = -0.0303 Tzr + 29.854) can be observed between Tzr
and standard deviation. Following the interpretation of Miller et al. (2003), we propose
that the preservation of inheritance is reflected by Tzr values. The higher Tzr values, such
as Kezi’ertuo, indicate increasingly zirconium undersaturated melt which do not
support the preservation of older zircons. The lower Tzr values, such as Halajun 3,
indicate the more saturated melts, which are not prone to dissolve previous zircons,
and therefore will have higher inheritance. The remaining four granites plot at
intermediate Tzr values and may have some inherited zircons. This is reflected in the
decreasing scatter of single zircon ages of these plutons with increasing Tzr.
Silicic extrusive rocks Rhyolite and dacite silicic extrusive rocks are widely reported in drill core in
northern Tarim (e.g. Shun and Yingmai drilling area, Yu et al. 2011a; Tian et al. 2010)
and Wenquan outcrop by the north margin of Tarim (Liu et al. 2014). Five rhyolites have
been dated, three of which were done by zircon U-Pb LA-ICP-MS method, one by
zircon U-Pb SHRIMP, and one by zircon U-Pb CA-TIMS (Table. 4; Tian et al. 2010; Liu et
al. 2014), with an age range of 290.9 ± 4.1 Ma to 271.7 ± 2.2 Ma. Seven dacite ages have
been reported, all of which were done by zircon U-Pb LA-ICP-MS (Li et al. 2007; Zhang
et al. 2009; Tian et al. 2010; Yu et al. 2011a), with an age range of 286.6 ± 3.3 Ma to 273.7 ±
3.2 Ma.
We recalculated every age using the published raw data, and find that both the
data quality and interpretation of one rhyolite SHRIMP age and four rhyolite (or dacite)
LA-ICP-MS ages in Tian et al. (2010) are good. All the four dacite LA-ICP-MS ages in Yu
et al. (2011a) have underestimated MSWD values, which should be 1.76 for S102-1, 1.69
for S114, 1.78 for S79-3 and 1.73 for S99. For the remaining two LA-ICP-MS data, the
authors showed rather convincing reasons for eliminating discordant data points and
obvious xenocrysts (Li et al. 2007; Zhang et al. 2009). While the remaining data are
concordant, they exhibit single grain ages that span more than one magnitude bigger
than single grain errors (1σ) and exceed 15 % of the weighted mean average age (e.g. 57
Myr span for Shun 1 in Li et al. 2007; Fig. 8c). The continuous zircon age distribution
reflects a complex magmatic process, which could be attributed to continuous magma
recharge and accompanying zircon crystallizat
ion (e.g. Miller et al. 2007). Therefore the significance of the weighed mean
average age will be ambiguous. So, such data could only provide a relatively loose
constraint on emplacement time of the rhyolite or dacite.
Recently, Liu et al. (2014) reported a zircon U-Pb CA-TIMS age of Wenquan
rhyolite (WQ09-2) of 286.8 ± 0.5 Ma (95% conf., MSWD = 2.0). Given the high MSWD
value, it is obvious that the variability in single grain ages cannot be explained by
analytical scatter alone (Wendt & Carl 1991; Schoene et al. 2013). In the consideration of
high precision of TIMS dating, scientists usually regard the observed age scatter which
is more than one magnitude bigger than the analytical error as the involvement of
antecrystic zircons, and use the weighted mean age of statistically equivalent youngest
population (e.g. Michel et al. 2008; Memeti et al. 2010) or the youngest single grain age
(e.g. Schaltegger et al. 2009; Schoene et al. 2010; Barboni et al. 2013) to estimate the timing
of magma emplacement, and the former approach is presumably more conservative.
The data from Liu et al. (2014) could be interpreted as at least two distinct groups, with
the youngest four analyses and oldest three analyses having weighted mean average
ages of 287.56 ± 0.71 Ma (95% conf., MSWD = 0.039) and 284.20 ± 1.60 Ma (95% conf.,
MSWD = 0.074) (Fig. 8d). The 3.36 million year (>1 %) age gap is one magnitude larger
than the expected precision of zircon U-Pb CA-TIMS method, which should be better
than 0.1 % (Mattinson 2005). Therefore, we consider it to be real and reflect different
populations of zircons. The youngest single grain age is 283.4 ± 7 Ma, which is
overlapped with the youngest population (284.20 ± 1.60 Ma) within analytical error. We
interpret the oldest population (287.56 ± 0.71 Ma) as recording the oldest identifiable
magmatic activity, and adopt the youngest population (284.20 ± 1.60 Ma) as recording
late-stage crystallization, which could be the best approximation of eruption age.
Silicic dykes Silicic dykes are reported in the Xiaohaizi and Wajilitag area, including quartz
syenitic porphyry (Zhang et al. 2008b; Yu 2009; Li et al. 2011; Fig. 4), potash-feldspar-
granite vein (Sun et al. 2009) and granodiorite (Zhang et al. 2009). The potash-feldspar-
granite vein for geochronology study intruded into the Xiaohaizi syenite intrusion (Sun
et al. 2009), the samples in Chen et al. (2010) and Li et al. (2011) were taken from the
quartz syenitic porphyries that intrude into sediments, the contact relationships of
granodiorite in Zhang et al. (2009) study was not clearly documented.
In the Xiaohaizi area, Yu (2009) reported zircon U-Pb SHRIMP dating of quartz
syenitic porphyry, which is 278.4 ± 2.2 Ma. By recalculating and plotting and their raw
data, we propose that one analysis is discordant (analysis 10.1) among the total thirteen,
and the remaining data yield a weighted mean average age of 279.2 ± 2.5 Ma. At least
two distinctive age groups can be recognized, indicating possible prolonged or complex
magmatic processes (Fig. 8j). Sun et al. (2009) reported zircon U-Pb LA-ICP-MS result of
potash-feldspar-granite vein, which had eleven analysis, and yielded a weighted mean
average age of 282.0 ± 3.7 Ma. Li et al. (2011) reported zircon U-Pb SHRIMP results of a
quartz syenite porphyry, and got a weighted mean average age of 284.3 ± 2.8 Ma. It
should be noted that the error of the 207Pb/235U ratio is one magnitude higher than the
error of the 206Pb/238U ratio, which is shown by the compressed error ellipses in the
concordia plot, and this may due to the low concentration of 207Pb or experimental
issues (Fig. 5d). In the Wajilitag area, Zhang et al. (2009) reported forty-one analyses of
zircon by the U-Pb LA-ICP-MS method for granodiorite, with an age of 295.9 ± 2.1 Ma.
We recalculate and replot the raw data (Fig. 5d), and get a weighted mean average age
of 295.8 ± 1.8 Ma, with MSWD = 2.1. Based on the data we have, the silicic dykes in
Xiaohaizi area are younger than Wajilitag granodiorite, despite their close proximity. In
summary, the silicic dykes have a narrower age range than the mafic dykes, and the
linkage of the silicic dykes in the Xiaohaizi and Wajilitag areas requires more constraint.
Detrital zircon ages The detrital zircon data from sedimentary rocks intercalated with Tarim
volcanism has only just started being investigated. Recently, Zou et al. (2013) dated the
detrital zircons from three sandstone layers underlying and interbedded with the KZ
Fm basalt, and Li et al. (2013) carried out detrital zircon age dating from three sandstone
layers underlying and overlying the Qimugan basalt (Fig. 3a, 3b and 3c). Both of their
interpretations were restricted to simply using the weighted mean average age of the
youngest population to constrain the maximum depositional age of the sandstone, and
in turn to constrain the maximum emplacement age of the overlying basalt (Fig. 3c).
However, their selection of the youngest zircon populations require more explanation.
Dickinson & Gehrels (2009) tested four alternate measures of youngest detrital
zircon ages (mainly dated by LA-ICP-MS) using sediments from the Colorado Plateau
with depositional ages known independently by biostratigraphy. They proposed the
four measures, from least to most statistically robust, as follows: (a) youngest single
grain age (YSG), (b) youngest graphical age peak controlled by more than one grain age
(YPP), (c) mean age of the youngest two or more grains that overlap in age at 1σ
(YC1σ(2+)), and (d) mean age of the youngest three or more grains that overlap in age at
2σ (YC2σ(3+)). We use these four measures to reevaluate the maximum depositional
ages of the sandstones presented in Zou et al. (2013) and Li et al. (2013), and the results
are shown in Table 6.
For the Yg050409 sample in Zou et al. (2013), the YSG age (244 ± 3 Ma) is
significantly younger (> 10 Ma) than the other three corresponding ages (YPP: 270.7 Ma,
YC1σ(2+): 255.3 ± 2.6 Ma, YC2σ(3+): 263.7 ± 3.9 Ma), as well as the second youngest
grain (253 Ma). This could be interpreted as contamination from a younger source. The
second youngest single grain age is 253 ± 2 Ma, and is in accordance with YC1σ(2+) age
(255.3 ± 2.6 Ma). The YPP age (263.7 Ma at chest) is compatible with YC1σ(2+) age (263.7
± 3.9 Ma). So we take ~263 Ma as a statistically robust estimate of the maximum
depositional age of the host sandstone (Fig. 3b). Zou et al (2013) used 284 Ma.
For the Yg050412 in Zou et al. (2013), the YSG age (255 ± 3 Ma) is ~12 Ma younger
than the other three corresponding ages (YPP: 267.7 Ma, YC1σ(2+): 267 ± 3.4 Ma,
YC2σ(3+): 267 ± 3.4 Ma), as well as the second youngest grain (266 Ma), and could also
be interpreted as contamination. The second youngest single grain age is 266 ± 3 Ma,
which is in accordance with the YPP (267.7 Ma), YC1σ(2+) (267 ± 3.4 Ma) and YC2σ(3+)
(267 ± 3.4 Ma) ages. Therefore, we take ~ 267 Ma as a statistically robust estimate of the
maximum depositional age of the host sandstone (Fig. 3b). Zou et al (2013) used 287 Ma.
For the Yg050413 in Zou et al. (2013), the YSG age (247 ± 3 Ma) is more than 20
Ma younger than the other three corresponding ages (YPP: 278.2Ma, YC1σ(2+): 267 ± 4.2
Ma, YC2σ(3+): 276 ± 3.8 Ma), and 19 Ma younger than the second youngest grain (266
Ma) , which could be attributed to contamination as well. The second youngest single
grain age is 266 ± 3 Ma, which is in accordance with YC1σ(2+) age (267 ± 4.2 Ma). The
YYP age is 278.2 Ma and the YC2σ(3+) age of 286.7 ± 3.8 Ma contains twenty-one
analyses , which is a robust but potentially conservative estimate of the maximum
emplacement age of their overlying basalt (Fig. 3b). Zou et al (2013) used 291 Ma.
When all the data are compiled (217 analysis, excluding analyses off the
concordance line), we calculate the YC1σ(2+) age of 255.2 ± 2.4 Ma representing five
grains. An additional twenty grains are younger than 275 Ma, constituting 11.5 % of the
total dates, and the YC2σ(3+) age of 282.4 ± 3.1 Ma is based on ninety grains.
Using the four measures they defined in their case study, Dickinson & Gehrels
(2009) inferred that the YC2σ(3+) age is most likely to yield a result compatible with
depositional age and also the most conservative measure among the above four
measures. Following this interpretation, we propose that the three Zou et al (2013)
samples have maximum depositional ages of 263.7 ± 3.4, 267 ± 3.4 and 287.6 ± 3.8 Ma.
Therefore, such maximum depositional ages of the sandstone require that the overlying
basalts are younger or equal to those ages.
In Li et al. (2013), they reported the youngest population age for QMG1106 as 284
± 4 Ma, which is in accordance with our calculation of the YSG, YPP, YC1σ(2+) and
YC2σ(3+) ages, all of which are in the range of 285 to 284 Ma. In combination, this
makes a robust constrain of the maximum depositional age at ~ 284 Ma. For QMG1112,
the YC1σ(2+) age is based on the youngest group with two grains having a weighted
mean average age of 268 ± 5.5 Ma and the YC2σ(3+) age is derived from the second
youngest group with four grains having a weighted mean average age of 284.1 ± 4.7 Ma.
We take the YC2σ(3+) age as the most conservative estimate of the maximum
depositional age of the sandstone (Fig. 3b). In summary, the maximum emplacement
age of Qimugan basalt is constrained by the maximum depositional age of the
underlying sandstone at ~ 284 Ma.
Mafic dykes Geochronology work have been carried out on mafic dykes from Xiaohaizi,
Tangwangcheng and Wajilitag sections in the Bachu area, Yijianfang, Dawangou and
Yingan sections in the Keping area, and two drill cores from Fang 1 and Yudong 2 well
(Li et al. 2007; Zhang et al. 2009; Yu 2009; Zhang et al. 2010c; Liu et al. 2012; Wei & Xu
2013; Table 5). In the Xiaohaizi section, diabase dykes cut through some parts of the
syenite body (Li et al. 2007; Zhang et al. 2010c; Wei & Xu 2013; Fig. 4); in the
Tangwangcheng section, diabase intruded into carbonates of unknown age (Zhang et al.
2010c); in the Dawangou section, diabase dykes intruded into Silurian carbonates
(Zhang et al. 2010c); in the Yingan sections, diabase dykes intruded into basalts (Yu
2009); and in the Yudong 2 well, diabase dykes intruded into carbonate (Liu et al. 2012).
In Wajilitag and Yijianfang sections and Fang 1 well, no clear relationships between the
dated gabbro dykes and the wall rock were described.
The mafic dykes in the Xiaohaizi area are believed to be derived from
decompression melting of convecting mantle because of their OIB-like trace element
signatures, and are interpreted as representing the later episode of the Tarim volcanism
in the early Permian (Wei et al. 2014). However, the genetic link between mafic dykes in
different locations is unclear, and some authors assumed these mafic dykes formed
simultaneously and used them as a horizontal marker (e.g. Chen et al. 2009; Li et al.
2011).
Twelve ages of mafic dykes are reported, five of which were done by whole
rock 40Ar-39Ar methods, with seven done by zircon U-Pb LA-ICP-MS SHRIMP and SIMS
methods (Table 5). The whole rock 40Ar-39Ar dating results have already been discussed
(see 40Ar-39Ar dating part). Yu (2009) reported zircon U-Pb SHRIMP result of six grains
from diabase in the Yingan area with ages of 268, 290, 291, 753, 769 and 1133 Ma
respectively. Similarly, Wei & Xu (2013) reported zircon U-Pb SIMS results of seventeen
grains from diabase in the Xiaohaizi area, with ages range from 717 to 2390 Ma.
Obviously, inherited zircons occur in the above two samples and complicate the
interpretation, so we do not consider them further. The remaining five zircon U-Pb LA-
ICP-MS ages range from 283.1 ± 3.2 Ma to 265 ± 16 Ma (Table 5), with an 18.1 million
year age span.
Using the published raw data and replotting the five ages, we find that none of
the ages for Xiaohaizi gabbro is robust (Fig. 5c). The Yijianfang gabbro from Li et al.
(2007) and Yijianfang diabase from Zhang et al. (2009) both had a large number of
discordant ages, and the remaining concordant ages have a large age span of ~ 25 Myr
(Fig. 8e and 8g). The Wajilitag gabbro data from Zhang et al. (2009) also show big scatter,
with concordant analyses having an age span of 75.4 Myr (Fig. 8i). No additional
information can be applied to interpret the large age spans of the above three samples,
so we propose that they cannot provide precise emplacement ages. One Xiaohaizi
diabase sample from Li et al. (2007) yielded a weighted mean average age of 271.8 ± 5.8
Ma, with MSWD = 12 and 52 Myr age span (Fig. 8f). The big age span is probably
affected by inherited zircon involvement, and the sample location and field relationship
with the wall rock is unclear in the original source. Therefore, the geological
significance of such age is lacking. One Xiaohaizi gabbro date from Zhang et al. (2009)
yields a weighted mean average age of 282.9 ± 2.9 Ma, with MSWD = 3.6 and 30.6 Myr
age span (Fig. 8h). In consideration of the prevalent inherited zircons in other mafic
dykes we discussed above, we suggest this age could only be used for reference, and
more work should be done to clarify the inherited zircon effect.
Zircon crystallizes in differentiated gabbroic environment and can be used to
represent the crystallization age of host rock (e.g. Kaczmarek et al. 2008). However,
zircons in mafic environment usually experience a complex history, which makes it
necessary to identify zircon origins and group populations by variable approaches such
as zircon chemistry and morphology (e.g. Grimes et al. 2009). The large age span here
indicates the occurrence of different zircon populations either crystallized from or
entrained by the mafic dykes. In summary, the ages of mafic dykes are still not well-
constrained, and the assumption of homogeneity of mafic dykes in different locations is
not supported by the current data.
In summary, the genetic link between geographically isolated (e.g. Yingan dyke
is 150 km away from Xiaohaizi dyke) mafic dykes is unclear. Based on current data, it is
unlikely that the mafic dykes were emplaced synchronously, although the large range
in zircon ages makes this difficult to assess.
Kimberlite mineral U-Pb dating Field relationships and chemistry
Ultramafic cryptoexplosive breccia has been reported in the Wajilitag region by a
number of researchers (Du, 1983; Wang & Su 1987, 1990; Liang & Fang 1991; Su 1991; Li
et al. 2001; Jiang et al. 2004b; Bao et al. 2009; Li et al. 2010; Zhang et al. 2013). The original
work by Wang & Su (1987) reported six breccia pipes based on negative topography
and identified the pipes as having two phases: vent and crater. On the basis of
abundant pyroxenite xenoliths and clinopyroxene xenocrysts in the breccia, Li et al.
(2001) interpreted the brecciated pipes as mica-olivine pyroxenite. Li et al. (2001)
believed that the pyroxenite and clinopyroxene came from the nearby layered intrusion,
and therefore suggested that the breccia pipes formed after the solidification of the
layered intrusion.
Jiang et al. (2004b) reported the major and trace element compositions of 7 breccia
clasts and 6 matrix samples from the breccia pipes. They interpreted the breccia and
matrix compositions to be similar, and the samples to be homogeneous, based on
selected trace element patterns. They considered a matrix sample with MgO = 18.78 %
to represent a primary magma composition. Jiang et al. (2004b) also recognized dykes
and other intrusions in the area, which they inferred to be related to the breccia pipes,
and described chlorite and serpentine alteration in the breccia.
Bao et al. (2009) used REE and trace element to classify the breccia as kimberlitic
brecciated peridotite, based on trace element patterns. They noted there were
differences from typical kimberlites in major oxide composition, higher HREE
concentrations, and the absence of indicator minerals such as high-Cr chromite, pyrope
and magneso-ilmenite. In contrast, Li et al. (2010) reported whole rock major and trace
element results on five samples analyzed in bulk as well as analyses of separated
breccia clasts and matrix. Their reported SiO2 contents in breccia and matrix phases
were 41.86 % and 31.25 %, respectively, which were higher than their reported whole
rock data (average = 30.10 %). They classified the breccia as picritic in composition.
While the pyroxenite xenoliths are postulated to come from the Wajilitag layered
intrusion, no geochemical or field relationships have been observed to confirm this. No
relative age relationships can be confirmed between the breccia pipes, associated dykes
and Wajilitag layered intrusion. While some chemical features suggest the breccia pipes
are similar to kimberlites in composition, pervasive alteration of breccia makes
conclusive classification challenging. Associated dykes appear less altered, and may
provide more robust geochemical data. The dykes also have significantly less
heterogeneity than is seen in kimberlite pipes (Le Maitre 2002; Patterson et al. 2009; and
references therein).
Bachu breccia pipe geochronology Li et al. (2001) reported an 40Ar-39Ar age of phlogopite in a breccia pipe as 252.7
Ma. Zhang et al. (2013) reported a single-crystal perovskite U-Pb age on a breccia pipe
with 23 grains as 299.8 ± 4.3Ma (2σ) and two single-crystal baddeleyite U-Pb ages on 2
samples with 21 spots each from the same dyke as 300.8 ± 4.7 Ma (2σ) and 300.5 ± 4.4
Ma (2σ). For perovskite dating, Zhang et al. (2013) analyzed bulk breccia that was
powdered after visible xenoliths had been manually removed. Bao et al. (2009) and Li et
al. (2010) noted that it would be difficult to remove all xenoliths in this way.
The age span of perovskite ages is 30.6 Ma, from 284.2 to 314.8 Ma (Fig. 9a).
These ages do not overlap within analytical error (Fig. 9a). Perovskites appear
heterogeneous, with Th concentrations ranging from ~400 to ~6300 ppm. Heterogeneity
in perovskite has been observed in the Elliot County kimberlite, where multiple
perovskite populations differ in size, morphology and composition, and have Th
concentrations ranging from 43 to 1726 ppm, and the 206Pb/238U ages vary from 79.4 to
102.8 Ma (Heaman 1989). Additional studies have shown perovskite morphology,
composition and age can be very complicated in kimberlites (e.g. Heaman & Kjarsgaard
2000; Sarkar et al. 2011). Bachu perovskite morphology and composition appear quite
complex (Bao et al. 2009; Zhang et al. 2013), and therefore the large observed age range
may be attributed to heterogeneity in perovskite populations. While the Bachu dykes
have been inferred to be the same age as Bachu breccia (Zhang et al. 2013), other
kimberlite localities such as Buffonta (Kirkland Lake fields, Canada) show breccia and
dykes that are recognizably different in age (breccia: 146 Ma, dykes: 153 Ma, Heaman &
Kjarsgaard 2000). Moreover, the analytical error (1σ) of 207Pb/235U ratio of perovskite
dating in Zhang et al. (2013) is remarkably large, with an average of 42 % and up to 94 %,
which is more than an order of magnitude higher than corresponding errors
of 207Pb/206Pb and 206Pb/238U ratio. Without additional information on the experiment, it is
hard to access the source of the large error of 207Pb/235U ratio. This also affects the
reliability of this data.
The baddeleyite U-Pb ages also show a large range within each sample, from
278.2 to 328.6 Ma for DW21-1 and 272.6 to 321.2 Ma for DW21-4 in Zhang et al. (2013).
For both samples, more than half of individual spot ages do not overlap each other
within error (Fig. 9b and 9c). Weighted mean average data for DW21-1 show five
distinctive age groups, with weighted mean ages of each group at 278.2 ± 7.6 Ma, 288.5 ±
7.2 Ma, 301.5 ± 6.1 Ma, 310.5 ± 7.6 Ma and 326 ± 10 Ma (Fig. 9c). This suggests that
baddeleyite populations are heterogeneous, and the age clusters may represent several
episodes of crystallization, occurring at 10 to 16 Myr intervals. The Th concentration for
baddeleyites varies dramatically, from 1 to 40 ppm for DW21-1 and from 2 to 221 ppm
for DW21-4. Such big age spans and chemical variation are outside analytical error (~5%
for SIMS dating). Instead, it could be linked to magma mixing of multiple pulses.
Further investigation of geochronological work on the Bachu breccia and dykes is
required to address this.
Bachu breccia geochemistry It is difficult to obtain reliable geochemical signatures of primary, unaltered
kimberlite due to the combined effects of crustal assimilation and element mobility
during post-emplacement alteration processes (e.g. Mitchell 2008; Donatti-Filho et al.
2013; Sarkar et al. 2014). Researchers usually use fresh hypabyssal kimberlite to try to
minimize the effects of contamination and secondary alteration (e.g. Le Roex et al. 2003;
Harris et al. 2004; Becker & Le Roex, 2006). However, the published geochemistry data
of Tarim are all from surface samples of brecciated material (Jiang et al. 2004b; Bao et al.
2009; Li et al. 2010) which has been altered (Li et al. 2001; Jiang et al. 2004b; Bao et al.
2009). This makes it complicated to identify geochemical signatures of primary magma
compositions.
Recently, Beyer et al. (2013) reported a relatively large set of partition coefficient
(D) values of incompatible elements (15 elements) between perovskite and kimberlite
melt at 1.5 GPa and 1200 ℃. Sarkar et al. (2014) suggested that the perovskite
composition and D value could be used to calculate liquid compositions in equilibrium
with measured perovskite minerals, in an effort to quantify the original uncontaminated
magma composition. Following this approach, we use a suite of trace element
concentrations of perovskite measured in previous works to calculate the magma
composition in equilibrium with those perovskites (Nb, La, Ce, Pr, Nd, Sm, Eu and Gd,
Table 7). Calculated melt compositions from perovskite data systemically shows an
order of magnitude higher concentrations than those measured from the breccia pipe
data (Fig. 9d, see figure caption for detail). This suggests that perovskites are not in
equilibrium with the host matrix composition. Furthermore, the large-ion lithophile
element concentrations (LILE, e.g. K, Rb and Ba) vary dramatically among different
samples, by 300%, 2300% and 580%, respectively. REE concentrations are quite uniform
and incompatible element pairs such as La/Sm and Zr/Nb only vary by 90% and 64%,
respectively. These indicate that the REE are not as affected by alteration as the LILE,
and REE may be more robust in estimate the pre-alteration condition of Bachu pipes.
In summary, the large diversity of Th concentrations and large age span among
single grains of both perovskite and baddeleyite, together with the large analytical error
of 207Pb/235U ratio of perovskite, and age clusters of baddeleyite, make the dating
complex. The disequilibrium between perovskite and kimberlite further hinders a
proper interpretation of the dating. All the evidences indicates magma mixing of

multiple pulses, which have been widely recognized in other kimberlite fields (e.g.
Gibeon kimberlite, Namibia, Davies et al. 2001; Sparks 2013), which is inconsistent with
the idea that these kimberlites were emplaced as a single magmatic event.
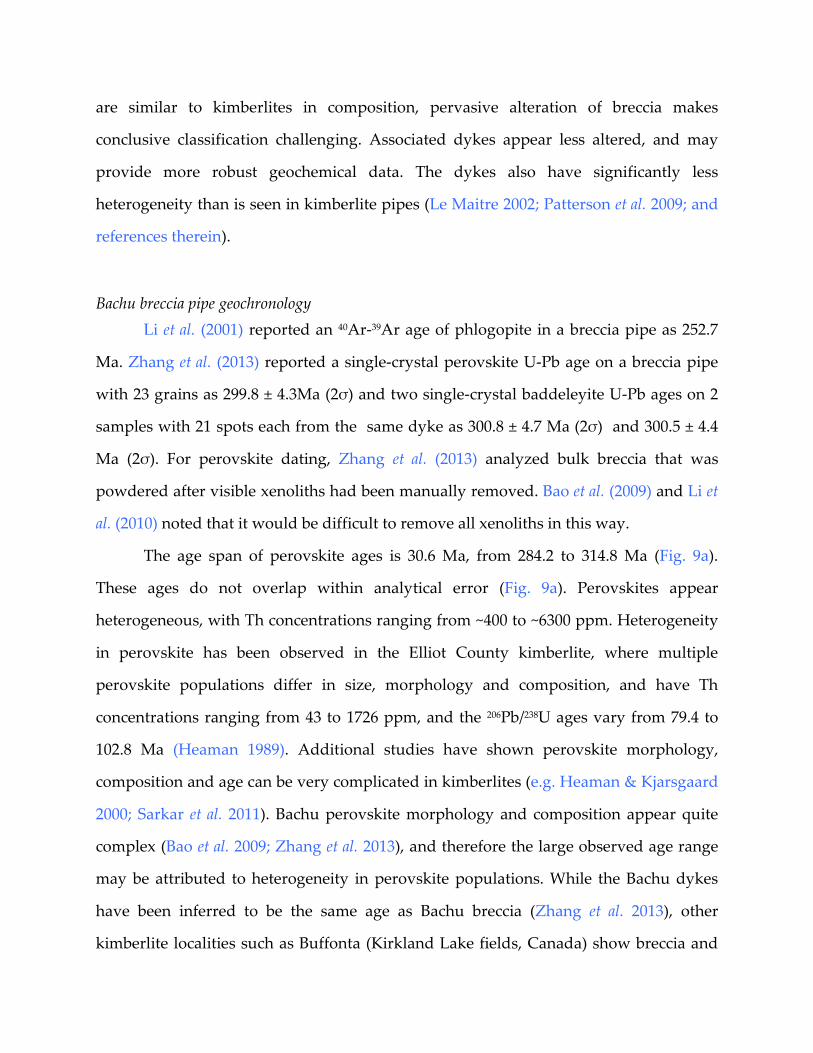
Fig. 1. (a), Assessing the alteration state (A.I.) of 11 basaltic samples for plateau ages.
The plot on a log scale is normalized to J = 0.010, and K = 0.65% (see Baksi 2007a, b for
details). The cutoff for freshness is shown by the dashed line at A.I. = 0.00060. Sample
Yg20-21, Txn25-21, DWG07-4, LKC07-1, Z1-6, Z16-2, YT6-1, YT6-2, YT6-3 are totally
altered. Only some steps in YG-2 and YG-14 fall into fresh zone. Yg20-21 and Txn25-21
from Yang et al. (2006); DWG07-4, LKC07-1, Z1-6 and Z16-2 from Zhang et al. (2010);
YT6-1, YT6-2 and YT6-3 from Liu et al. (2012); YG-2 and YG-14 from Wei et al. (2014). A.I.
are plotted on a log scale. After Fig. 2 of Baksi (2012). (b) and (c), 40Ar/39Ar plateau age
spectra for YG-2 and YG-14 from Wei et al. (2014). The small figures in right corners are

the original scale spectra (120 Ma to 400 Ma), which can give visually acceptable
plateaus. The redrawn plateau age spectra show clear “bumps” and no plateau. Fresh
parts stand for the steps that pass the A.I. test (A.I. < 0.0006).
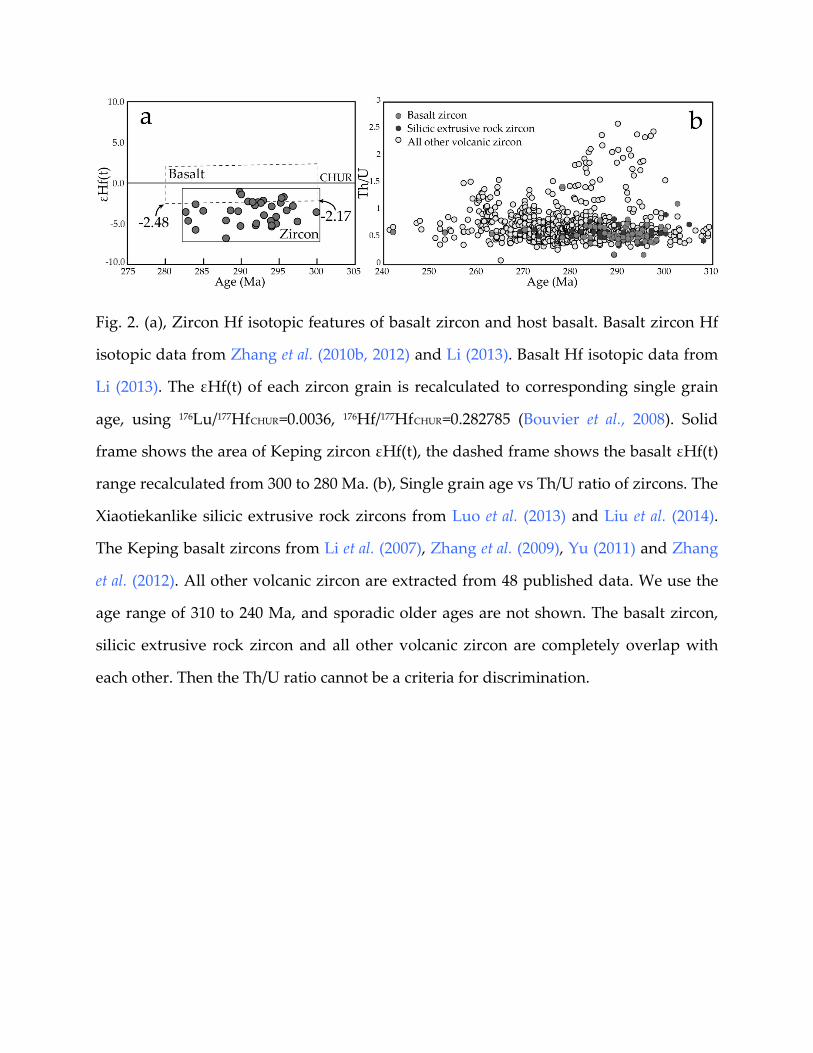
Fig. 2. (a), Zircon Hf isotopic features of basalt zircon and host basalt. Basalt zircon Hf
isotopic data from Zhang et al. (2010b, 2012) and Li (2013). Basalt Hf isotopic data from
Li (2013). The εHf(t) of each zircon grain is recalculated to corresponding single grain
age, using 176Lu/177HfCHUR=0.0036, 176Hf/177HfCHUR=0.282785 (Bouvier et al., 2008). Solid
frame shows the area of Keping zircon εHf(t), the dashed frame shows the basalt εHf(t)
range recalculated from 300 to 280 Ma. (b), Single grain age vs Th/U ratio of zircons. The
Xiaotiekanlike silicic extrusive rock zircons from Luo et al. (2013) and Liu et al. (2014).
The Keping basalt zircons from Li et al. (2007), Zhang et al. (2009), Yu (2011) and Zhang
et al. (2012). All other volcanic zircon are extracted from 48 published data. We use the
age range of 310 to 240 Ma, and sporadic older ages are not shown. The basalt zircon,
silicic extrusive rock zircon and all other volcanic zircon are completely overlap with
each other. Then the Th/U ratio cannot be a criteria for discrimination.
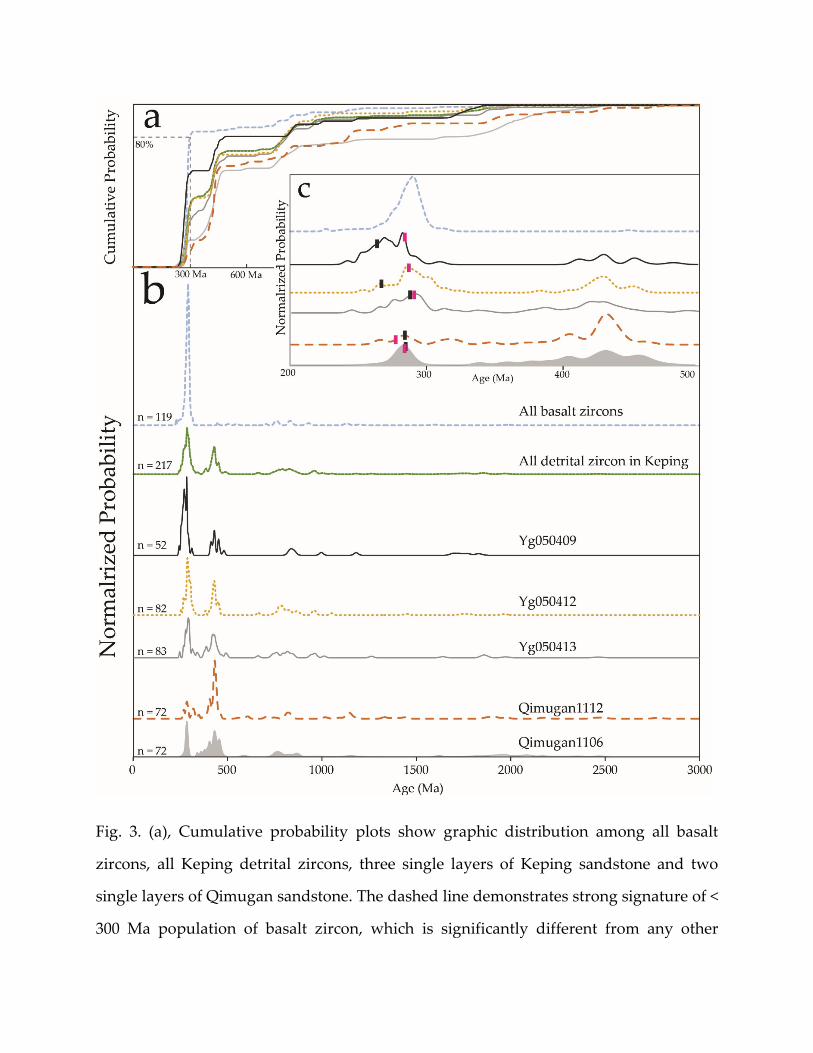
Fig. 3. (a), Cumulative probability plots show graphic distribution among all basalt
zircons, all Keping detrital zircons, three single layers of Keping sandstone and two
single layers of Qimugan sandstone. The dashed line demonstrates strong signature of <
300 Ma population of basalt zircon, which is significantly different from any other
detrital zircon pattern. See basalt zircon section for detail. (b), Diagram showing the
distribution of basalt zircon ages and detrital zircon ages. Each curve is constructed by
summing all of the concordant individual ages and uncertainties and then normalizing
by the number of analyses (shown on the left) such that each curve contains the same
area. Calculated 206Pb/238U ages were used for zircons younger than 1 Ga, whereas
the 206Pb/207Pb ages were reported for older zircons (Gehrels et al., 2008; Gehrels 2012).
(c), Detail of Figure B, with 200 to 500 Ma grains. A more monotonous basalt zircon age
pattern can be seen, further rule out the possibility of sediments source. The black bars
marked on the curve show the YC2σ(3+) of each sample. The pink bars marked the
“weighted mean average age of youngest population” in Zou et al. (2013) and Li et al.
(2013). Diagrams are constructed with programs from the Arizona LaserChron Center
Web site (http://www.laserchron.org).
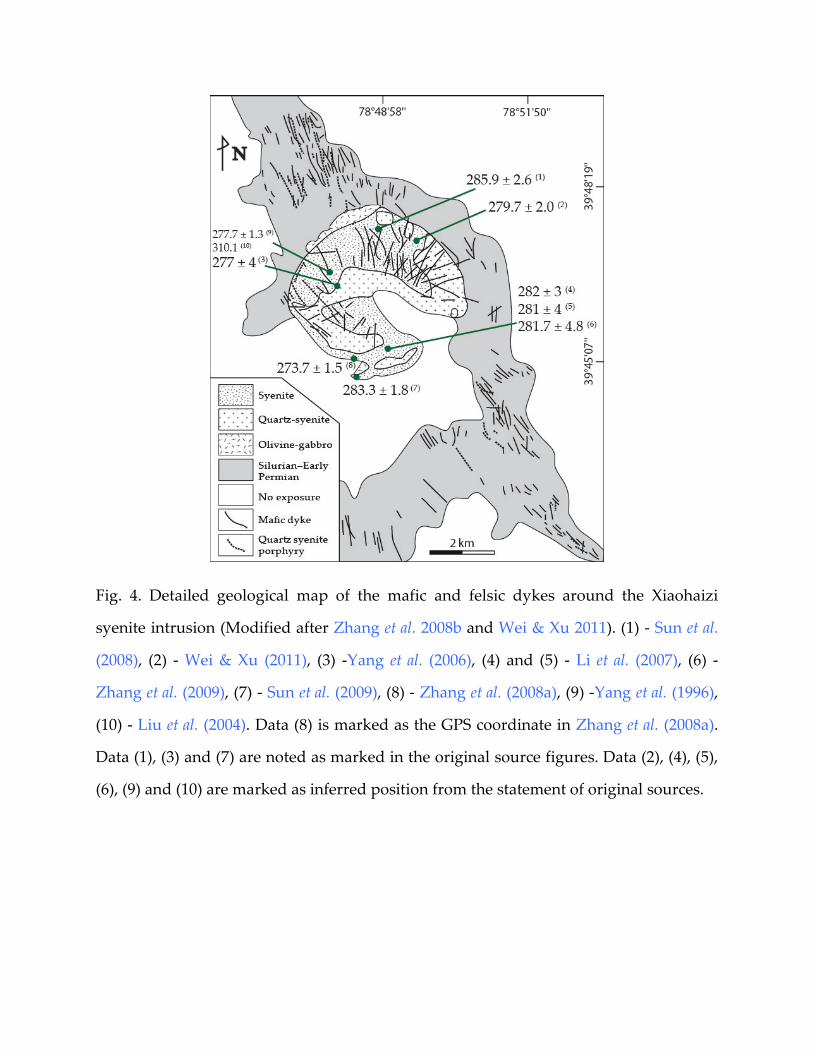
Fig. 4. Detailed geological map of the mafic and felsic dykes around the Xiaohaizi
syenite intrusion (Modified after Zhang et al. 2008b and Wei & Xu 2011). (1) - Sun et al.
(2008), (2) - Wei & Xu (2011), (3) -Yang et al. (2006), (4) and (5) - Li et al. (2007), (6) -
Zhang et al. (2009), (7) - Sun et al. (2009), (8) - Zhang et al. (2008a), (9) -Yang et al. (1996),
(10) - Liu et al. (2004). Data (8) is marked as the GPS coordinate in Zhang et al. (2008a).
Data (1), (3) and (7) are noted as marked in the original source figures. Data (2), (4), (5),
(6), (9) and (10) are marked as inferred position from the statement of original sources.
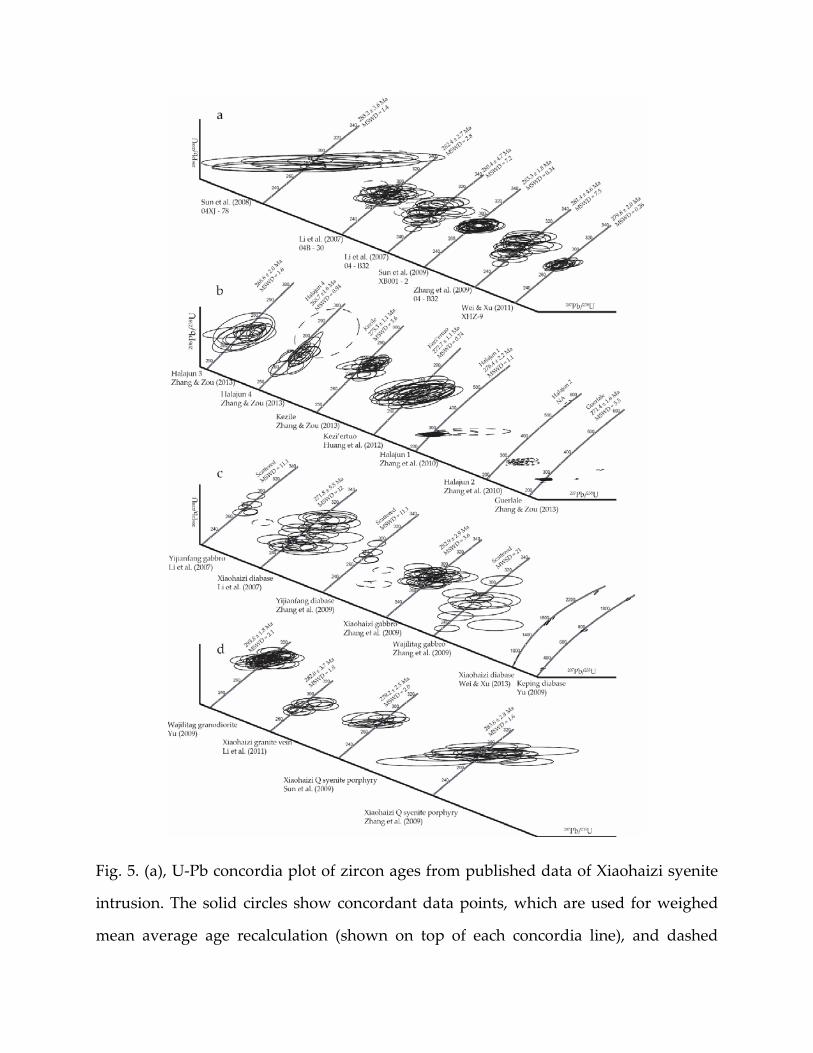
Fig. 5. (a), U-Pb concordia plot of zircon ages from published data of Xiaohaizi syenite
intrusion. The solid circles show concordant data points, which are used for weighed
mean average age recalculation (shown on top of each concordia line), and dashed
circle show the data points eliminated (see text for detail). Uncertainties are shown at
the 1σ level. Diagram was constructed with the use of Isoplot version 3.6 (Ludwig 2008).
The sample BC03 from Zhang et al. (2008) has uniformly negative RHO, and is not
plotted. The sample XH-13 from Yang et al. (2006) does not have 207Pb/235U ratio raw
data, and is not plotted. (b), U-Pb concordia plot of ages of zircon from published data
of seven granite plutons in the Halajun area. The solid circles show the concordant data
points, which are used for weighed mean average recalculation (shown on top of each
concordia line), and dashed circles show the data points eliminated (see text for detail).
Uncertainties are shown at the 1σ level. Data points of 6, 8, 12, 15 of Halajun 3 and point
18 of Halajun 4 are not shown because they are out of figure range. Note the difference
in scale of the concordance lines. (c), U-Pb concordia plot of ages of zircon from mafic
dikes in Tarim. The solid circles show the concordant data points, which are used for
weighed mean average age recalculation (shown on top of each concordia line), and
dashed circles show the data points eliminated (see text for detail). (d), U-Pb concordia
plots of ages of zircon from silicic dikes in Tarim. The solid circles show the concordant
data points, which are used for weighed mean average age recalculation (shown on top
of each concordia line).
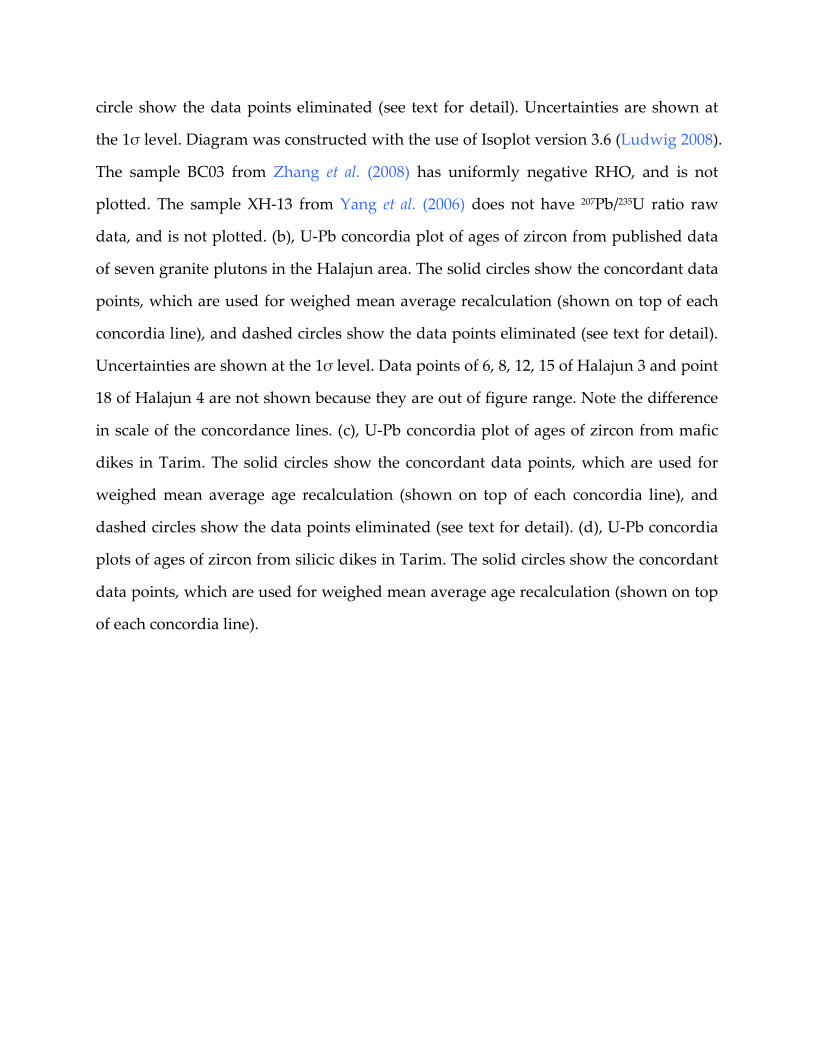
Fig. 6. (a), SiO2 vs. MgO vs. CaO three-dimensional diagram of Xiaohaizi syenite
intrusion, with corresponding ages marked. The published major element geochemistry
data can be clustered into four groups by using K-means approach (Stuart 1982), with
the clustering center of each group having SiO2 content of 60.98%, 63.53%, 65.29% and
68.12% respectively. For syenite geochemistry data, see Supplementary material 4.
Diagram was constructed with the use of R project version 3.1.0 (R Development Core
Team 2008). (b), Age distribution of published data of Xiaohaizi syenite intrusion and
the results of recalculation. Black solid dot and bar shows the data derived by zircon U-
Pb method, black hollow dot and bar shows the data derived by whole rock 40Ar/39Ar
method, and the grey solid dot and bar shows the result after recalculation. (c), The age
distribution after recalculation, and single grain ages. Still, big spans occur within each
sample, indicating complex magmatism. (d), The Zr saturation temperature (Tzr) vs.
standard deviation of single grain ages of individual sample. The zircon saturation
temperature is calculated using the empirical equation by Watson & Harrison (1983).
TZr = 12,900 / [2.95 + 0.85M + ln(496,000 / Zrmelt)], whereas M = [(Na + K + 2·Ca)/(Al·Si),
all in cation fraction]. A negative correlation can be observed, with the fitting curve
standard deviation = -0.0303 Tzr + 29.854. The granite geochemistry data used to
calculate Tzr are summarized in Supplementary material 4. (e), the age distribution of
silicic dikes after recalculation, and single grain ages after eliminating of discordant
data points and obvious xenocrysts. (1) - Yu (2009); (2) - Li et al. (2011); (3) - Sun et al.
(2009); (4) - Zhang et al. (2009).
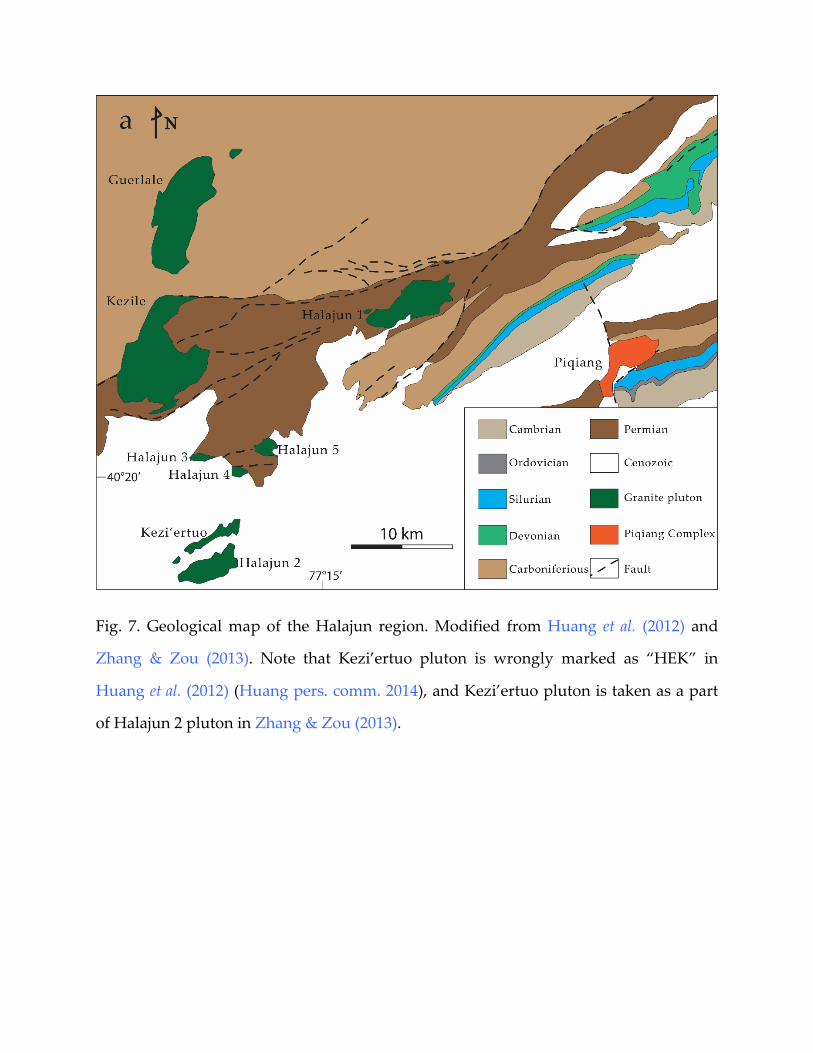
Fig. 7. Geological map of the Halajun region. Modified from Huang et al. (2012) and
Zhang & Zou (2013). Note that Kezi’ertuo pluton is wrongly marked as “HEK” in
Huang et al. (2012) (Huang pers. comm. 2014), and Kezi’ertuo pluton is taken as a part
of Halajun 2 pluton in Zhang & Zou (2013).
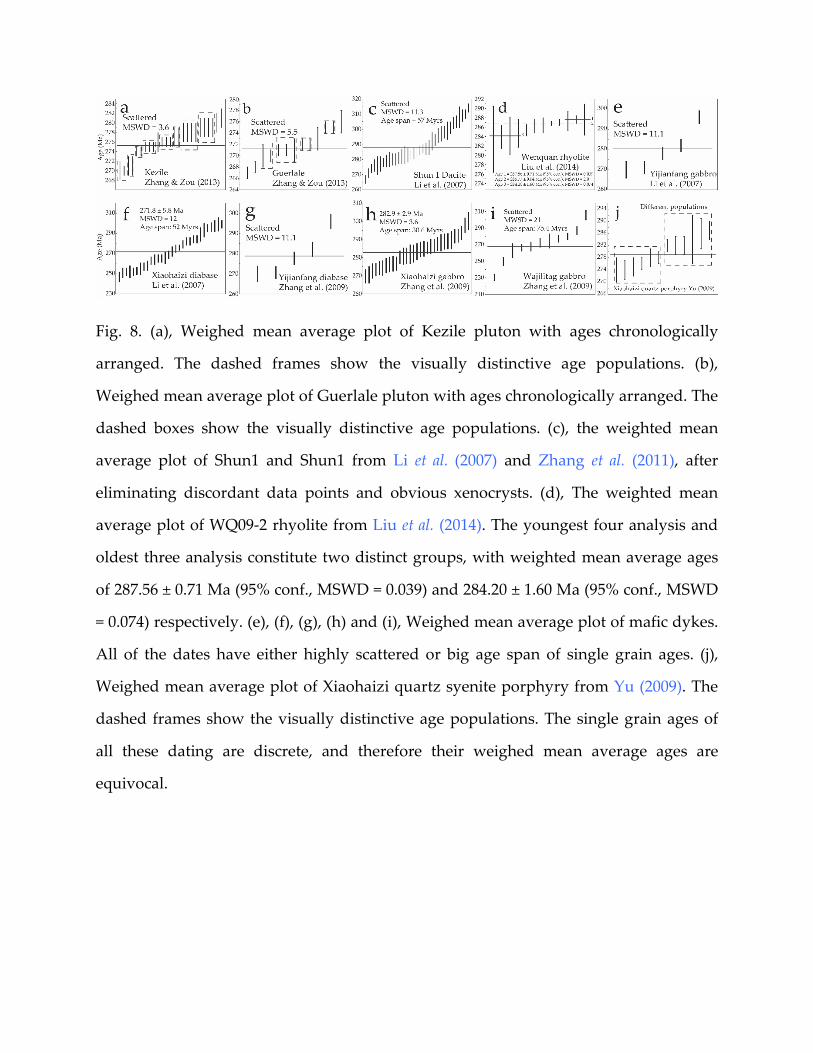
Fig. 8. (a), Weighed mean average plot of Kezile pluton with ages chronologically
arranged. The dashed frames show the visually distinctive age populations. (b),
Weighed mean average plot of Guerlale pluton with ages chronologically arranged. The
dashed boxes show the visually distinctive age populations. (c), the weighted mean
average plot of Shun1 and Shun1 from Li et al. (2007) and Zhang et al. (2011), after
eliminating discordant data points and obvious xenocrysts. (d), The weighted mean
average plot of WQ09-2 rhyolite from Liu et al. (2014). The youngest four analysis and
oldest three analysis constitute two distinct groups, with weighted mean average ages
of 287.56 ± 0.71 Ma (95% conf., MSWD = 0.039) and 284.20 ± 1.60 Ma (95% conf., MSWD
= 0.074) respectively. (e), (f), (g), (h) and (i), Weighed mean average plot of mafic dykes.
All of the dates have either highly scattered or big age span of single grain ages. (j),
Weighed mean average plot of Xiaohaizi quartz syenite porphyry from Yu (2009). The
dashed frames show the visually distinctive age populations. The single grain ages of
all these dating are discrete, and therefore their weighed mean average ages are
equivocal.
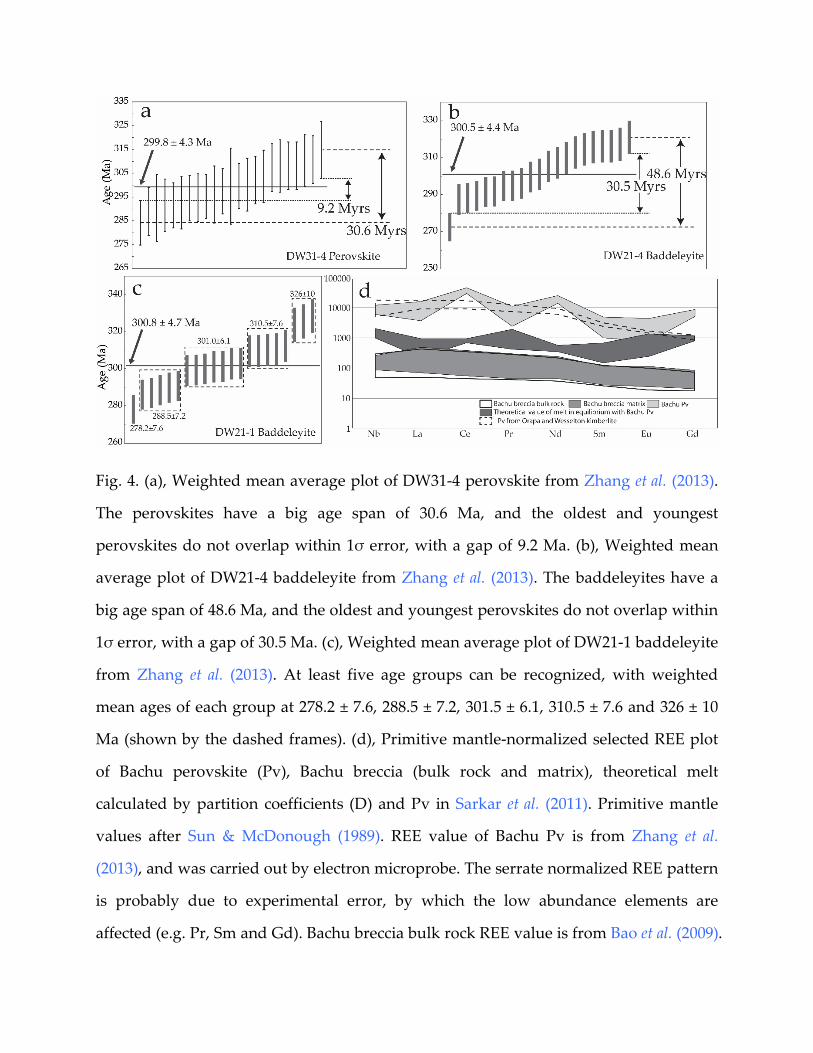
Fig. 4. (a), Weighted mean average plot of DW31-4 perovskite from Zhang et al. (2013).
The perovskites have a big age span of 30.6 Ma, and the oldest and youngest
perovskites do not overlap within 1σ error, with a gap of 9.2 Ma. (b), Weighted mean
average plot of DW21-4 baddeleyite from Zhang et al. (2013). The baddeleyites have a
big age span of 48.6 Ma, and the oldest and youngest perovskites do not overlap within
1σ error, with a gap of 30.5 Ma. (c), Weighted mean average plot of DW21-1 baddeleyite
from Zhang et al. (2013). At least five age groups can be recognized, with weighted
mean ages of each group at 278.2 ± 7.6, 288.5 ± 7.2, 301.5 ± 6.1, 310.5 ± 7.6 and 326 ± 10
Ma (shown by the dashed frames). (d), Primitive mantle-normalized selected REE plot
of Bachu perovskite (Pv), Bachu breccia (bulk rock and matrix), theoretical melt
calculated by partition coefficients (D) and Pv in Sarkar et al. (2011). Primitive mantle
values after Sun & McDonough (1989). REE value of Bachu Pv is from Zhang et al.
(2013), and was carried out by electron microprobe. The serrate normalized REE pattern
is probably due to experimental error, by which the low abundance elements are
affected (e.g. Pr, Sm and Gd). Bachu breccia bulk rock REE value is from Bao et al. (2009).
Bachu breccia matrix REE value is from Jiang et al. (2004) and Li et al. (2010). Theoretical
value of melt in equilibrium with Bachu Pv is calculated using partition coefficients (D)
from Beyer et al. (2013) and Melluso et al. (2008) (for the elements with no D available in
Beyer et al. (2013)). Primitive mantle-normalized REE value of Pv in Sarkar et al. (2011)
is shown for reference, which are from twelve Orapa and one Wesselton kimberlite
samples in Botswana and South Africa respectively. Notice that the theoretical value of
melt in equilibrium with Bachu Pv is one magnitude higher than both Bachu breccia
bulk rock and matrix. For kimberlite geochemistry data, see Supplementary material 4.
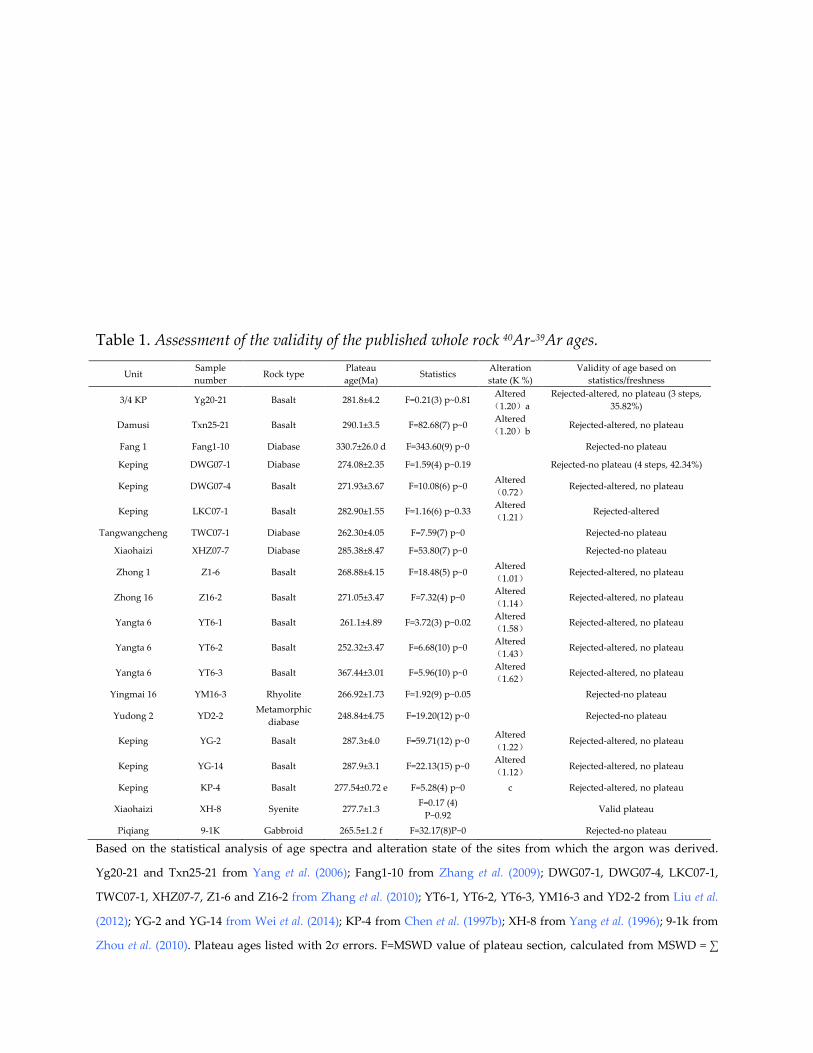
Table 1. Assessment of the validity of the published whole rock 40Ar-39Ar ages.
Unit Sample number
Rock type Plateau age(Ma)
Statistics Alteration state (K %)
Validity of age based on statistics/freshness
3/4 KP Yg20-21 Basalt 281.8±4.2 F=0.21(3) p~0.81 Altered(1.20)a
Rejected-altered, no plateau (3 steps, 35.82%)
Damusi Txn25-21 Basalt 290.1±3.5 F=82.68(7) p~0 Altered(1.20)b
Rejected-altered, no plateau
Fang 1 Fang1-10 Diabase 330.7±26.0 d F=343.60(9) p~0
Rejected-no plateau
Keping DWG07-1 Diabase 274.08±2.35 F=1.59(4) p~0.19
Rejected-no plateau (4 steps, 42.34%)
Keping DWG07-4 Basalt 271.93±3.67 F=10.08(6) p~0 Altered(0.72)
Rejected-altered, no plateau
Keping LKC07-1 Basalt 282.90±1.55 F=1.16(6) p~0.33 Altered(1.21)
Rejected-altered
Tangwangcheng TWC07-1 Diabase 262.30±4.05 F=7.59(7) p~0
Rejected-no plateau
Xiaohaizi XHZ07-7 Diabase 285.38±8.47 F=53.80(7) p~0
Rejected-no plateau
Zhong 1 Z1-6 Basalt 268.88±4.15 F=18.48(5) p~0 Altered(1.01)
Rejected-altered, no plateau
Zhong 16 Z16-2 Basalt 271.05±3.47 F=7.32(4) p~0 Altered(1.14)
Rejected-altered, no plateau
Yangta 6 YT6-1 Basalt 261.1±4.89 F=3.72(3) p~0.02 Altered(1.58)
Rejected-altered, no plateau
Yangta 6 YT6-2 Basalt 252.32±3.47 F=6.68(10) p~0 Altered(1.43)
Rejected-altered, no plateau
Yangta 6 YT6-3 Basalt 367.44±3.01 F=5.96(10) p~0 Altered(1.62)
Rejected-altered, no plateau
Yingmai 16 YM16-3 Rhyolite 266.92±1.73 F=1.92(9) p~0.05
Rejected-no plateau
Yudong 2 YD2-2 Metamorphic
diabase 248.84±4.75 F=19.20(12) p~0
Rejected-no plateau
Keping YG-2 Basalt 287.3±4.0 F=59.71(12) p~0 Altered(1.22)
Rejected-altered, no plateau
Keping YG-14 Basalt 287.9±3.1 F=22.13(15) p~0 Altered(1.12)
Rejected-altered, no plateau
Keping KP-4 Basalt 277.54±0.72 e F=5.28(4) p~0 c Rejected-altered, no plateau
Xiaohaizi XH-8 Syenite 277.7±1.3 F=0.17 (4)
P~0.92 Valid plateau
Piqiang 9-1K Gabbroid 265.5±1.2 f F=32.17(8)P~0 Rejected-no plateau
Based on the statistical analysis of age spectra and alteration state of the sites from which the argon was derived.
Yg20-21 and Txn25-21 from Yang et al. (2006); Fang1-10 from Zhang et al. (2009); DWG07-1, DWG07-4, LKC07-1,
TWC07-1, XHZ07-7, Z1-6 and Z16-2 from Zhang et al. (2010); YT6-1, YT6-2, YT6-3, YM16-3 and YD2-2 from Liu et al.
(2012); YG-2 and YG-14 from Wei et al. (2014); KP-4 from Chen et al. (1997b); XH-8 from Yang et al. (1996); 9-1k from
Zhou et al. (2010). Plateau ages listed with 2σ errors. F=MSWD value of plateau section, calculated from MSWD = ∑
[(ti-T)2/(dti)2]/(N-1), where T = ∑[(ti/(dti)2]/ ∑ (dti)-2, ti and dti stand for individual step ages and associated error (1σ).
N = number of steps used shown in parentheses. p = probability of fit as derived from Chi Square Tables (e.g. DeVor
et al. 1992). Sample are altered if their alteration index is > 0.00060. K % takes from where 40Ar/39Ar dating and major
element composition results are reported together. For 40Ar/39Ar dating without major element composition results,
we take K % from other sources with adjacent sample location. a, From average K % of 14 samples in Wei et al. (2014).
b, From sample Txn25-21 in Li et al. (2008). c. No 36Ar data available to calculate A.I. d. No statement of step ages
used and error level, we take 5 to 13 steps and 2σ. e. No statement of step ages used or error level, we take last four
steps and 2σ. f. No statement of error level, we take 2σ. After Table 1 of Baksi (2012).
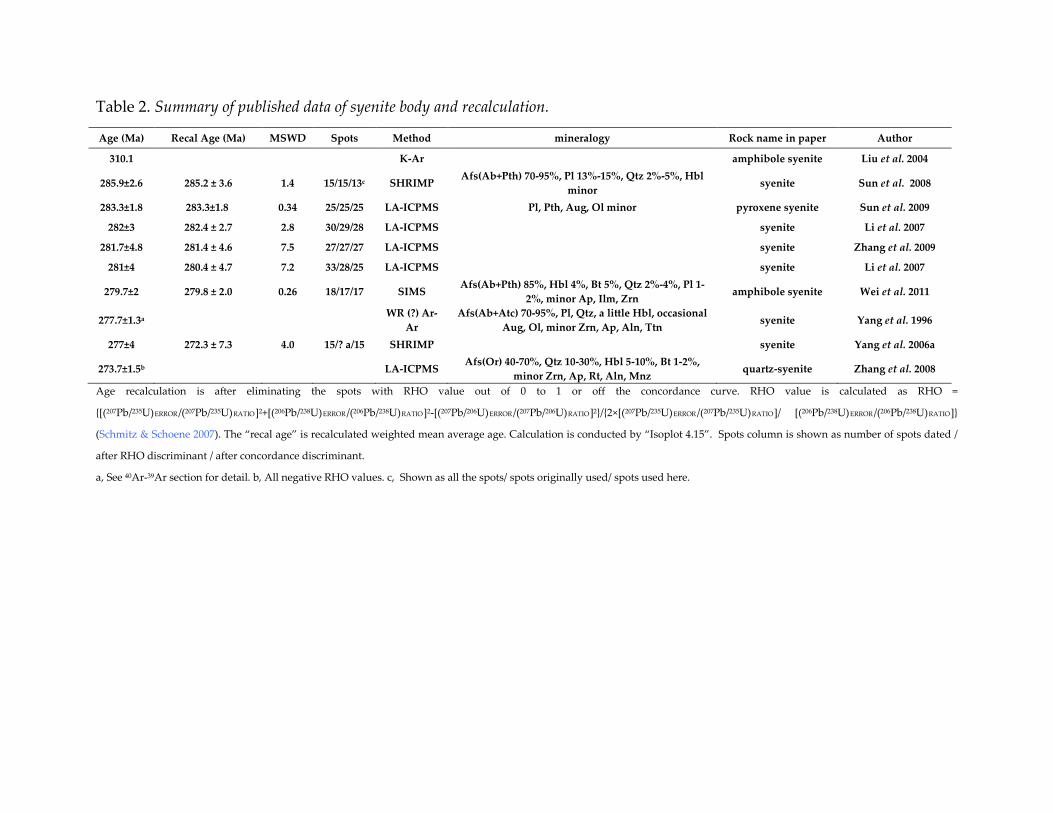
Table 2. Summary of published data of syenite body and recalculation.
Age (Ma) Recal Age (Ma) MSWD Spots Method mineralogy Rock name in paper Author
310.1 K-Ar amphibole syenite Liu et al. 2004
285.9±2.6 285.2 ± 3.6 1.4 15/15/13c SHRIMP Afs(Ab+Pth) 70-95%, Pl 13%-15%, Qtz 2%-5%, Hbl minor syenite Sun et al. 2008
283.3±1.8 283.3±1.8 0.34 25/25/25 LA-ICPMS Pl, Pth, Aug, Ol minor pyroxene syenite Sun et al. 2009
282±3 282.4 ± 2.7 2.8 30/29/28 LA-ICPMS syenite Li et al. 2007
281.7±4.8 281.4 ± 4.6 7.5 27/27/27 LA-ICPMS syenite Zhang et al. 2009
281±4 280.4 ± 4.7 7.2 33/28/25 LA-ICPMS syenite Li et al. 2007
279.7±2 279.8 ± 2.0 0.26 18/17/17 SIMS Afs(Ab+Pth) 85%, Hbl 4%, Bt 5%, Qtz 2%-4%, Pl 1-2%, minor Ap, Ilm, Zrn amphibole syenite Wei et al. 2011
277.7±1.3a WR (?) Ar-Ar
Afs(Ab+Atc) 70-95%, Pl, Qtz, a little Hbl, occasional Aug, Ol, minor Zrn, Ap, Aln, Ttn syenite Yang et al. 1996
277±4 272.3 ± 7.3 4.0 15/? a/15 SHRIMP syenite Yang et al. 2006a
273.7±1.5b LA-ICPMS Afs(Or) 40-70%, Qtz 10-30%, Hbl 5-10%, Bt 1-2%, minor Zrn, Ap, Rt, Aln, Mnz quartz-syenite Zhang et al. 2008
Age recalculation is after eliminating the spots with RHO value out of 0 to 1 or off the concordance curve. RHO value is calculated as RHO =
{[(207Pb/235U)ERROR/(207Pb/235U)RATIO]2+[(206Pb/238U)ERROR/(206Pb/238U)RATIO]2-[(207Pb/206U)ERROR/(207Pb/206U)RATIO]2}/{2×[(207Pb/235U)ERROR/(207Pb/235U)RATIO]/ [(206Pb/238U)ERROR/(206Pb/238U)RATIO]}
(Schmitz & Schoene 2007). The “recal age” is recalculated weighted mean average age. Calculation is conducted by “Isoplot 4.15”. Spots column is shown as number of spots dated /
after RHO discriminant / after concordance discriminant.
a, See 40Ar-39Ar section for detail. b, All negative RHO values. c, Shown as all the spots/ spots originally used/ spots used here.
Table 3. Summary of published data of granite plutons and recalculation.
Location Age (Ma) Recal Age (Ma, 2σ) MSWD Method Data points deleted Points
used Age span Tzr STD Author RHO out of 0 - 1 Away from Concordant line
Halajun 1 278 ± 3 274.6 ± 2.2 1.1 SHRIMP None 1.1, 1.3 14/13/12 14.4 828 5.59 Zhang et al. (2010)
Halajun 2 278 ± 3 a NA SHRIMP None All 17/16/0 NA 804 NA Zhang et al. (2010)
Halajun 3 268.6 ± 1.5 268.6 ± 2.0 1.6 LA-ICPMS 9 6, 8, 12, 15 20/15/15 10.8 766 7.27 Zhang et al. (2013)
Halajun 4 286.8 ± 1.7 268.7 ± 1.6 0.94 LA-
ICPMS 5, 6, 13 17 20/15/16 15.3 822 5.08 Zhang et al. (2013)
Halajun 5 271 ± 2.2 b NA LA-ICPMS All None 15/9/0 NA 818 NA Zhang et al. (2013)
Kezile 268.8 ± 1.7 275.3 ± 1.1 3.6 LA-ICPMS None None 25/ ? /25 11 824 4.4 Zhang et al. (2013)
Guerlale 272.4 ± 1.1 271.4 ± 1.6 5.5 LA-ICPMS 2, 10, 13 3, 15, 16c 21/ ? /15 9 820 4.54 Zhang et al. (2013)
Kezi'ertuo 272.7 ± 1.1 272.7 ± 1.1 0.74 LA-ICPMS None None 35/35/35 14 883 2.98 Huang et al. (2012)
a, Halajun 2 is not recalculated because all of the data points are off the Concordia line, with an exceptional point having an age of 569.1 Ma.
b, Halajun 5 is not recalculated because all data points have negative RHO value.
c, Data point 16 in Guerlale is away from the main cluster and does not overlap with any other data point within error.
d, Zhang et al. (2013) mixed up the Concordia plots and raw data between Kezile and Guerlale pluton in the published paper. We assume the raw data to be correct.
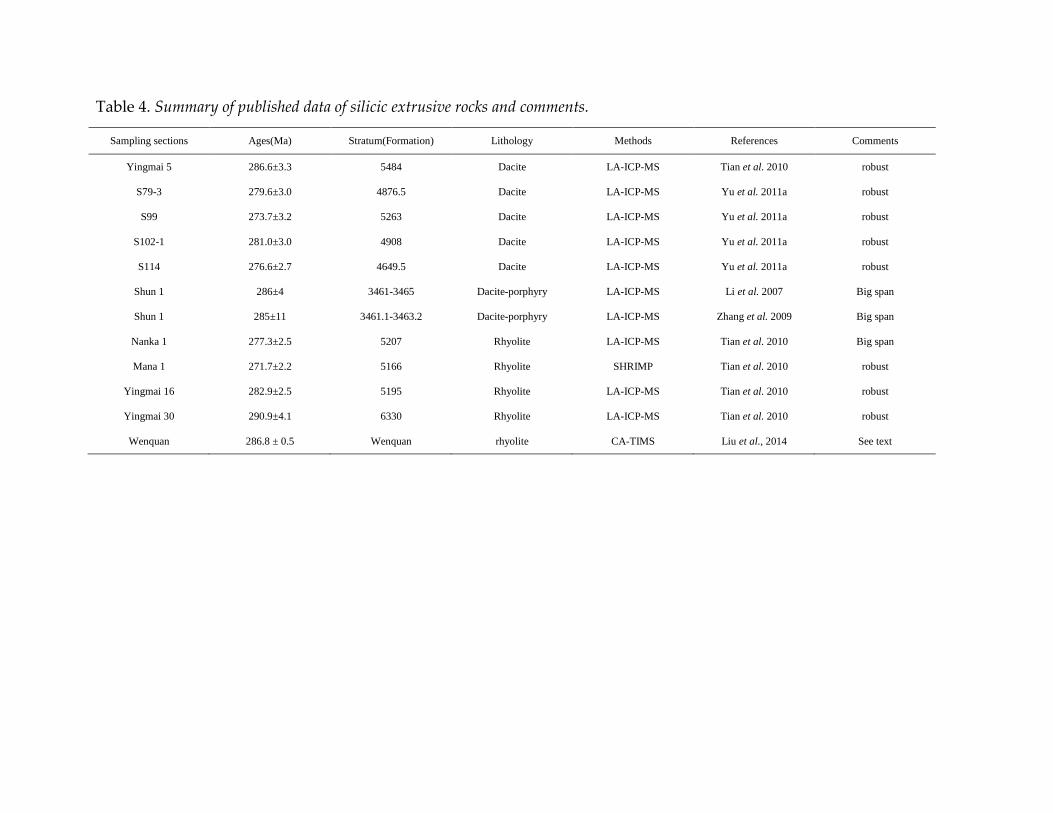
Table 4. Summary of published data of silicic extrusive rocks and comments.
Sampling sections Ages(Ma) Stratum(Formation) Lithology Methods References Comments
Yingmai 5 286.6±3.3 5484 Dacite LA-ICP-MS Tian et al. 2010 robust
S79-3 279.6±3.0 4876.5 Dacite LA-ICP-MS Yu et al. 2011a robust
S99 273.7±3.2 5263 Dacite LA-ICP-MS Yu et al. 2011a robust
S102-1 281.0±3.0 4908 Dacite LA-ICP-MS Yu et al. 2011a robust
S114 276.6±2.7 4649.5 Dacite LA-ICP-MS Yu et al. 2011a robust
Shun 1 286±4 3461-3465 Dacite-porphyry LA-ICP-MS Li et al. 2007 Big span
Shun 1 285±11 3461.1-3463.2 Dacite-porphyry LA-ICP-MS Zhang et al. 2009 Big span
Nanka 1 277.3±2.5 5207 Rhyolite LA-ICP-MS Tian et al. 2010 Big span
Mana 1 271.7±2.2 5166 Rhyolite SHRIMP Tian et al. 2010 robust
Yingmai 16 282.9±2.5 5195 Rhyolite LA-ICP-MS Tian et al. 2010 robust
Yingmai 30 290.9±4.1 6330 Rhyolite LA-ICP-MS Tian et al. 2010 robust
Wenquan 286.8 ± 0.5 Wenquan rhyolite CA-TIMS Liu et al., 2014 See text
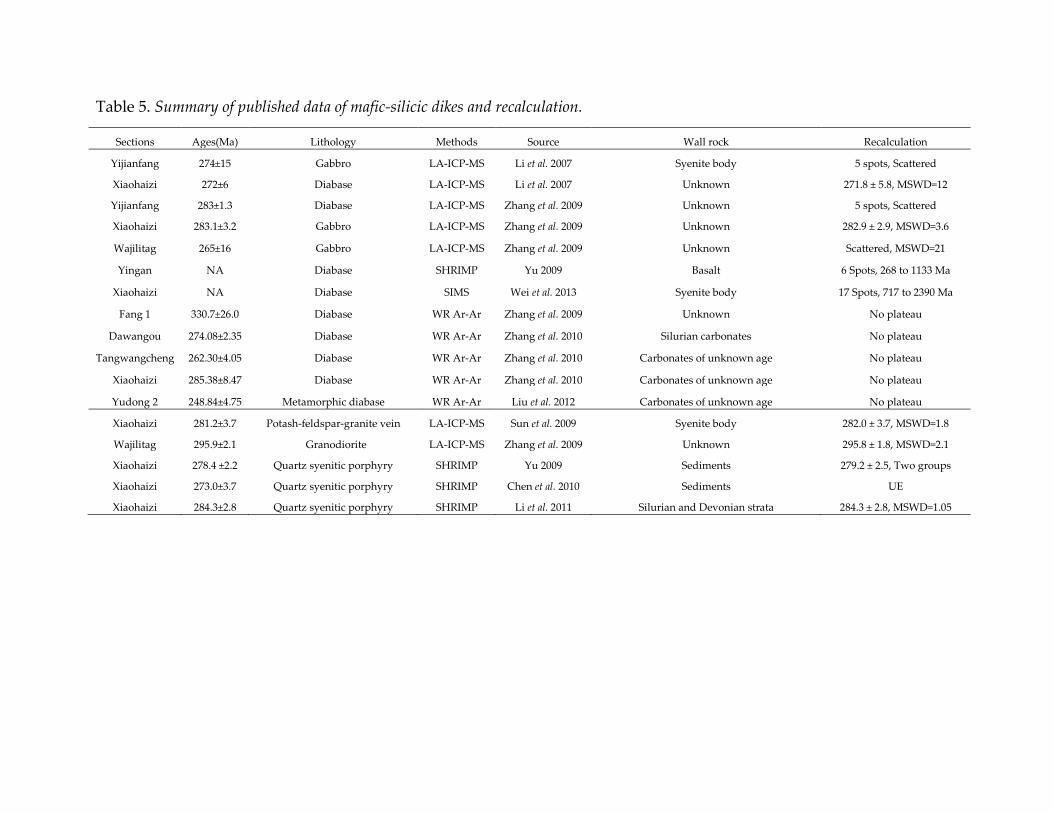
Table 5. Summary of published data of mafic-silicic dikes and recalculation.
Sections Ages(Ma) Lithology Methods Source Wall rock Recalculation
Yijianfang 274±15 Gabbro LA-ICP-MS Li et al. 2007 Syenite body 5 spots, Scattered
Xiaohaizi 272±6 Diabase LA-ICP-MS Li et al. 2007 Unknown 271.8 ± 5.8, MSWD=12
Yijianfang 283±1.3 Diabase LA-ICP-MS Zhang et al. 2009 Unknown 5 spots, Scattered
Xiaohaizi 283.1±3.2 Gabbro LA-ICP-MS Zhang et al. 2009 Unknown 282.9 ± 2.9, MSWD=3.6
Wajilitag 265±16 Gabbro LA-ICP-MS Zhang et al. 2009 Unknown Scattered, MSWD=21
Yingan NA Diabase SHRIMP Yu 2009 Basalt 6 Spots, 268 to 1133 Ma
Xiaohaizi NA Diabase SIMS Wei et al. 2013 Syenite body 17 Spots, 717 to 2390 Ma
Fang 1 330.7±26.0 Diabase WR Ar-Ar Zhang et al. 2009 Unknown No plateau
Dawangou 274.08±2.35 Diabase WR Ar-Ar Zhang et al. 2010 Silurian carbonates No plateau
Tangwangcheng 262.30±4.05 Diabase WR Ar-Ar Zhang et al. 2010 Carbonates of unknown age No plateau
Xiaohaizi 285.38±8.47 Diabase WR Ar-Ar Zhang et al. 2010 Carbonates of unknown age No plateau
Yudong 2 248.84±4.75 Metamorphic diabase WR Ar-Ar Liu et al. 2012 Carbonates of unknown age No plateau
Xiaohaizi 281.2±3.7 Potash-feldspar-granite vein LA-ICP-MS Sun et al. 2009 Syenite body 282.0 ± 3.7, MSWD=1.8
Wajilitag 295.9±2.1 Granodiorite LA-ICP-MS Zhang et al. 2009 Unknown 295.8 ± 1.8, MSWD=2.1
Xiaohaizi 278.4 ±2.2 Quartz syenitic porphyry SHRIMP Yu 2009 Sediments 279.2 ± 2.5, Two groups
Xiaohaizi 273.0±3.7 Quartz syenitic porphyry SHRIMP Chen et al. 2010 Sediments UE
Xiaohaizi 284.3±2.8 Quartz syenitic porphyry SHRIMP Li et al. 2011 Silurian and Devonian strata 284.3 ± 2.8, MSWD=1.05
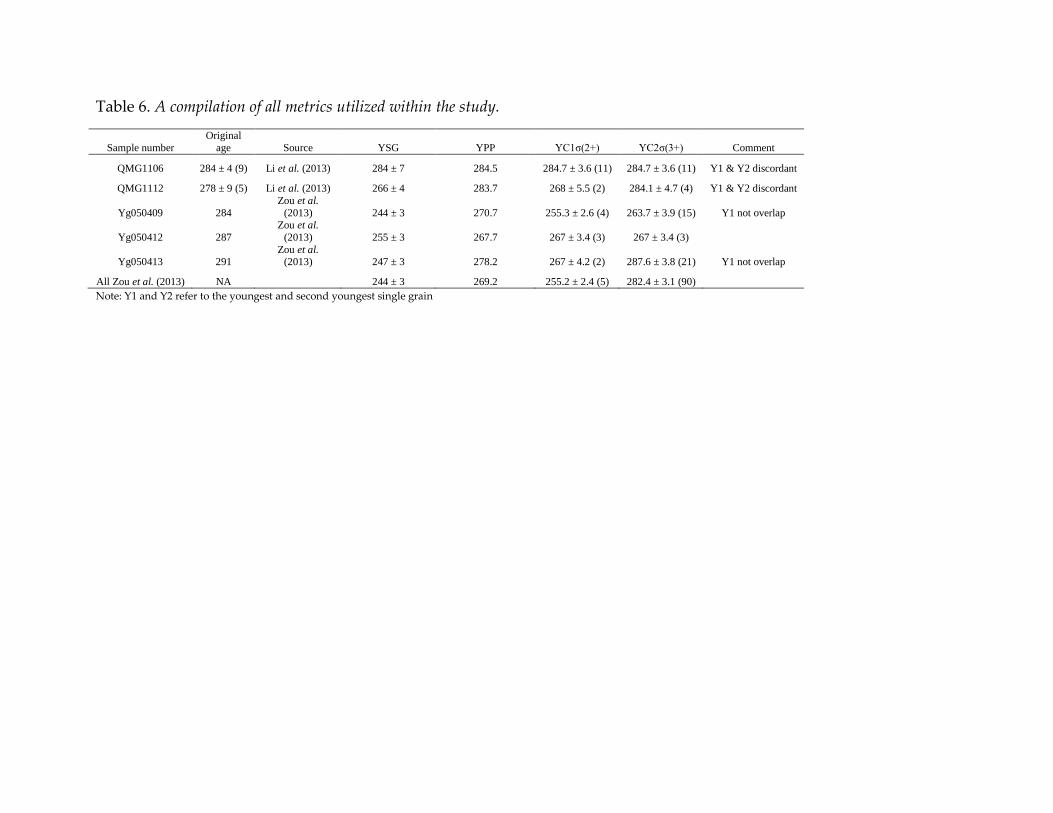
Table 6. A compilation of all metrics utilized within the study. Sample number
Original age Source YSG YPP YC1σ(2+) YC2σ(3+) Comment
QMG1106 284 ± 4 (9) Li et al. (2013) 284 ± 7 284.5 284.7 ± 3.6 (11) 284.7 ± 3.6 (11) Y1 & Y2 discordant
QMG1112 278 ± 9 (5) Li et al. (2013) 266 ± 4 283.7 268 ± 5.5 (2) 284.1 ± 4.7 (4) Y1 & Y2 discordant
Yg050409 284 Zou et al.
(2013) 244 ± 3 270.7 255.3 ± 2.6 (4) 263.7 ± 3.9 (15) Y1 not overlap
Yg050412 287 Zou et al.
(2013) 255 ± 3 267.7 267 ± 3.4 (3) 267 ± 3.4 (3)
Yg050413 291 Zou et al.
(2013) 247 ± 3 278.2 267 ± 4.2 (2) 287.6 ± 3.8 (21) Y1 not overlap
All Zou et al. (2013) NA 244 ± 3 269.2 255.2 ± 2.4 (5) 282.4 ± 3.1 (90) Note: Y1 and Y2 refer to the youngest and second youngest single grain
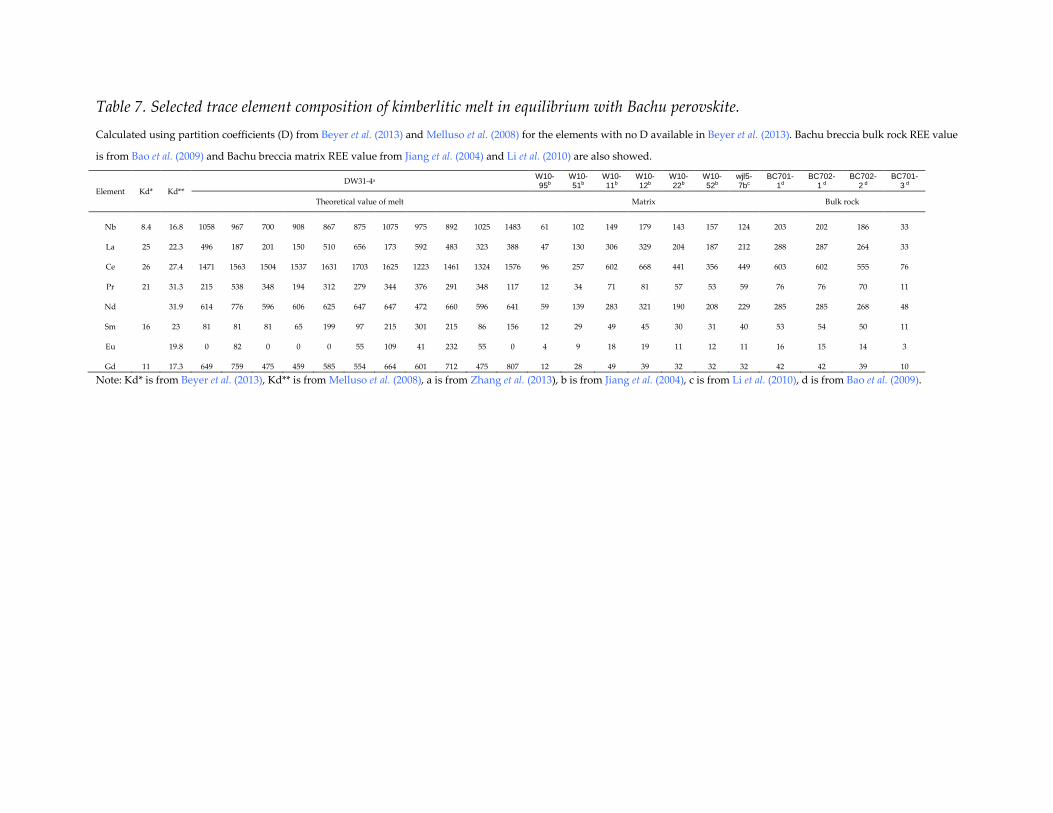
Table 7. Selected trace element composition of kimberlitic melt in equilibrium with Bachu perovskite. Calculated using partition coefficients (D) from Beyer et al. (2013) and Melluso et al. (2008) for the elements with no D available in Beyer et al. (2013). Bachu breccia bulk rock REE value
is from Bao et al. (2009) and Bachu breccia matrix REE value from Jiang et al. (2004) and Li et al. (2010) are also showed.
Element Kd* Kd** DW31-4a W10-
95b W10-51b
W10-11b
W10-12b
W10-22b
W10-52b
wjl5-7bc
BC701-1d
BC702-1 d
BC702-2 d
BC701-3 d
Theoretical value of melt Matrix Bulk rock
Nb 8.4 16.8 1058 967 700 908 867 875 1075 975 892 1025 1483 61 102 149 179 143 157 124 203 202 186 33
La 25 22.3 496 187 201 150 510 656 173 592 483 323 388 47 130 306 329 204 187 212 288 287 264 33
Ce 26 27.4 1471 1563 1504 1537 1631 1703 1625 1223 1461 1324 1576 96 257 602 668 441 356 449 603 602 555 76
Pr 21 31.3 215 538 348 194 312 279 344 376 291 348 117 12 34 71 81 57 53 59 76 76 70 11
Nd
31.9 614 776 596 606 625 647 647 472 660 596 641 59 139 283 321 190 208 229 285 285 268 48
Sm 16 23 81 81 81 65 199 97 215 301 215 86 156 12 29 49 45 30 31 40 53 54 50 11
Eu
19.8 0 82 0 0 0 55 109 41 232 55 0 4 9 18 19 11 12 11 16 15 14 3
Gd 11 17.3 649 759 475 459 585 554 664 601 712 475 807 12 28 49 39 32 32 32 42 42 39 10
Note: Kd* is from Beyer et al. (2013), Kd** is from Melluso et al. (2008), a is from Zhang et al. (2013), b is from Jiang et al. (2004), c is from Li et al. (2010), d is from Bao et al. (2009).
Reference
Baski, A.K., Hsu, V., McWilliams, M.O. & Farrar, E. 1992. 40Ar/39Ar dates of the Brunhes-Matuyama
geomagnetic field reversal. Science, 256, 356-357.
Baksi, A.K. 2003. Critical evaluation of 40Ar/39Ar ages for the central Atlantic magmatic province: timing,
duration and possible migration of magmatic centers. In: Hames, W.E., McHone, J.G., Renne, P.R.,
Ruppel, C. (Eds.), The Central Atlantic Magmatic Province: Insights from Fragments of Pangaea, 136.
American Geophysical Union Monograph, Washington D.C, pp. 77–90.
Baksi, A.K. 2007a. A quantitative tool for detecting alteration in undisturbed rocks and minerals -I: water,
chemical weathering and atmospheric argon. In: Foulger, G.R., Jurdy, D.M. (Eds.), Plates, plumes and
planetary processes: Geological Society of America Special Paper, 430, 285–303.
Baksi, A.K. 2007b. A quantitative tool for detecting alteration in undisturbed rocks and minerals - II:
application to argon ages related to hotspots. In: Foulger, G.R., Jurdy, D.M. (Eds.), Plates, plumes and
planetary processes: Geological Society of America Special Paper, 430, 305–333.
Baksi, A.K. 2012. New 40Ar/39Ar dates of the Grande Ronde lavas, Columbia River Basalts, USA:
Implications for duration of flood basalt eruption episodes” by Barry et al. (2010)-Discussion. Lithos,
146, 293–299.
Baksi, A.K. 2013. Timing and duration of volcanism in the Columbia River Basalt Group: A review of
existing radiometric data and new constraints on the age of the Steens through Wanapum Basalt
extrusion. Geological Society of America Special Paper, 497, 67–85.
Baksi, A.K. 2014a. The Deccan Trap-Cretaceous-Paleogene boundary connection; new 40Ar/39Ar ages
and critical assessment of existing argon data pertinent to this hypothesis. Journal of Asian Earth
Sciences, 84, 9-23.
Baksi, A.K. 2014b. 40Ar/39Ar ages of flood basalts provinces in Russia and China and their possible link to
global faunal extinction events: a cautionary tale regarding alteration and loss of 40Ar*. Journal of
Asian Earth Sciences, 84, 118-130.
Bao, P.S., Su, L., Zhai, Q.G. & Xiao, X.C. 2009. Compositions of the kimberlitic brecciated peridotite in the
Bachu area, Xijiang and its ore-bearing potentialities. Acta Geologica Sinica, 83, 1276–1301. (in Chinese
with English abstract)
Berry, R.F., Jenner, G.A., Meffre, S. & Tubrett, M.N. 2001. A North American provenance for
Neoproterozoic to Cambrian sandstones in Tasmania? Earth and Planetary Science Letters 192 207-222.
Barboni, M., Schoene, B., Ovtcharova, M., Bussy, F., Schaltegger, U. & Gerdes, A. 2013. Timing of
incremental pluton construction and magmatic activity in a back-arc setting revealed by ID-TIMS
U/Pb and Hf isotopes on complex zircon grains. Chemical Geology, 342, 76-93.
Beyer, C., Berndt, J., Tappe, S. & Klemme, S. 2013. Trace element partitioning between perovskite and
kimberlite to carbonatite melt: new experimental constraints. Chemical Geology, 353, 132–139.
Boehnke, P., Watson, E. B., Trail, D., Harrison, T. M. & Schmitt, A. K. 2013. Zircon saturation re-revisited.
Chemical Geology, 351, 324-334.
Becker, M. & Le Roex, A.P. 2006. Geochemistry of South African on- and off-craton, Group I and Group II
kimberlites: petrogenesis and source region evolution. Journal of Petrology, 47 (4), 673–703.
Chen, M.M., Tian, W., Zhang, Z.L. & Guan, P. 2010. Geochronology of the Permian basic-intermediate-
acidic magma suite from Tarim, northwest China and its geological implications. Acta Petrologica
Sinica, 26, 559-572. (in Chinese with English abstract)
Cherniak, D.J. & Watson, E.B. 2001. Pb diffusion in zircon. Chemical Geology, 172, 5–24.
Davies, G. R., Spriggs, A. J. & Nixon, P. H. 2001. A non-cognate origin for the Gibeon kimberlite
megacryst suite, Namibia: implications for the origin of Namibian kimberlites. Journal of Petrology,
42(1), 159-172.
DeVor, R.E., Chang, T-H. & Sutherland, J.W. 1992. Statistical quality design and control, Prentice-Hall,
Upper Saddle River, New Jersey, 787-797.
Dickinson, W. R. & Gehrels, G. E. 2009. Use of U–Pb ages of detrital zircons to infer maximum
depositional ages of strata: a test against a Colorado Plateau Mesozoic database. Earth and Planetary
Science Letters, 288(1), 115-125.
Donatti-Filho, J. P., Tappe, S., Oliveira, E. P. & Heaman, L. M. 2013. Age and origin of the Neoproterozoic
Brauna kimberlites: Melt generation within the metasomatized base of the São Francisco craton, Brazil.
Chemical Geology, 353, 19-35.
Du, P.L. 1983. Brief introduction of geological characters of kimberlite body at Wajilitag in Bachu County,
Xinjiang. Xinjiang Geology 1, 55-64. (in Chinese with English abstract)
Duncan, R.A., Hooper, P.R., Rehacek, J., Marsh, J.S. & Duncan, A.R. 1997. The timing and duration of the
Karoo igneous event, southern Gondwana. Journal of Geophysical Research [Solid Earth], 102, 18127-
18138.
Gagnevin, D., Daly, J. S. & Kronz, A. 2010. Zircon texture and chemical composition as a guide to
magmatic processes and mixing in a granitic environment and coeval volcanic system. Contributions
to Mineralogy and Petrology, 159(4), 579-596.
Gehrels, G.E., Valencia, V.A. & Ruiz, J. 2008. Enhanced precision, accuracy, efficiency, and spatial
resolution of U-Pb ages by laser ablation-multicollector-inductively coupled plasma-mass
spectrometry: Geochemistry, Geophysics, Geosystems, 9, 1-13.
Gehrels, G.E. 2012. Detrital zircon U-Pb geochronology: Current methods and new opportunities, in
Busby, C. and Azor, A., eds., Tectonics of sedimentary basins: Recent advances: West Sussex, John
Wiley & Sons, 45-62. doi:10.1002/9781444347166.ch2
Grimes, C.B., John, B.E., Cheadle, M.J., Mazdab, F.K., Wooden, J.L., Swapp, S. & Schwartz, J.J. 2009. On
the occurrence, trace element geochemistry, and crystallization history of zircon from in situ ocean
lithosphere. Contributions to Mineralogy and Petrology, 158(6), 757-783.
Harris, M., Le Roex, A. & Class, C. 2004. Geochemistry of the Uintjiesberg kimberlite, South Africa:
petrogenesis of an off-craton, group I, kimberlite. Lithos, 74 (3–4), 149–165.
Heaman, L.M. 1989. The nature of the subcontinental mantle from Sr-Nd-Pb isotopic studies on
kimberlitic perovskite. Earth and Planetary Science Letters, 92(3-4), 323-334.
Heaman, L.M. & Kjarsgaard, B.A. 2000. Timing of eastern North American kimberlite magmatism:
continental extension of the Great Meteor hotspot track? Earth and Planetary Science Letters, 178, 253–
268.
Huang, H., Zhang, Z.C., Kusky, T., Santosh, M., Zhang, S., Zhang, D.Y., Liu, J.L. & Zhao, Z.D. 2012.
Continental vertical growth in the transitional zone between South Tianshan and Tarim, western
Xinjiang, NW China: Insight from the Permian Halajun A1-type granitic magmatism. Lithos, 155, 49–
66.
Jerram, D. A. & Widdowson, M. 2005. The anatomy of Continental Flood Basalt Provinces: geological
constraints on the processes and products of flood volcanism. Lithos, 79(3), 385-405.
Jia, C.Z. 1997. Tectonic Characteristics and Oil-Gas, TarimBasin. Petroleum Industry Press, China, Beijing
(in Chinese).
Jiang, C.Y., Zhang, P.B., Lu, D.R., Bai, K.Y., Wang, Y.P., Tang, S.H., Wang, J.H. & Yang, C. 2004a.
Petrology, geochemistry and petrogenesis of the Kalpin basalts and their Nd, Sr and Pb isotopic
compositions. Geology Review, 50(5), 492–500. (in Chinese with English abstract)
Jiang, C.Y., Zhang, P.B., Lu, D.R. & Bai, K.Y. 2004b. Petrogenesis and magma source of the ultramafic
rocks at Wajilitag region, western Tarim Plate in Xinjiang. Acta Geologica Sinica, 20, 1433–1444. (in
Chinese with English abstract)
Jiang, C.Y., Jia, C.Z., Li, L.C., Zhang, P.B., Lu, D.R. & Bai, K.Y. 2004c. Source of the Fe-enriched type high-
Mg magma in Mazhartag region, Xinjiang. Acta Geologica Sinica, 78, 770–780. (in Chinese with
English abstract)
Kaczmarek, M.A., Müntener, O. & Rubatto, D. 2008. Trace element chemistry and U–Pb dates of zircons
from oceanic gabbros and their relationship with whole rock composition (Lanzo, Italian Alps).
Contributions to Mineralogy and Petrology, 155(3), 295-312.
Katayama, I., Muko, A., Lizuka, S., Terada, K., Tsutsuimi, Y., San, Y., Zhang, R.Y. & Liou, J.G. 2003.
Dating of zircon from Ticlinohumite-bearing garnet peridotite: implication for timing of mantle
metasomatism. Geology, 31, 713–716.
Kemp, A.I.S., Wormald, R.J., Whitehouse, M.J. & Price, R.C. 2005. Hf isotopes in zircon reveal contrasting
sources and crystallization histories for alkaline to peralkaline granites of Temora, southeastern
Australia. Geology, 33(10), 797-800.
Le Maitre, R.W. (ed.) 2002. Igneous Rocks. A Classification and Glossary of Terms. Recommendations of
the International Union of Geological Sciences Subcommission on the Systematics of Igneous Rocks,
2nd ed. xvi + 236 pp. Cambridge, New York, Melbourne: Cambridge University Press.
Le Roex, A.P., Bell, D.R. & Davis, P. 2003. Petrogenesis of group I kimberlites from Kimberley, South
Africa: evidence from bulk-rock geochemistry. Journal of Petrology, 44 (12), 2261–2286.
Lo, C.H., Chung, S.L., Lee, T.Y. & Wu, G. 2002. Age of the Emeishan flood magmatism and Permo-
Triassic boundary events. Earth and Planetary Science Letters 198, 449–458.
Liang, R.X. & Fang, Q.S. 1991. The new insights of Wajilitag “kimberlite” in Bachu, Xinjiang. Geological
Review, 37, 95-96. (in Chinese).
Liu, H.Q., Xu, Y.G., Tian, W., Zhong, Y.T., Mundil, R., Li, X.H. & Shangguan, S. M. 2014. Origin of two
types of rhyolites in the Tarim Large Igneous Province: Consequences of incubation and melting of a
mantle plume. Lithos, 204, 59-72
Li, C.N., Lu, F.X. & Chen, M.H. 2001. Research on petrology of the Wajilitag complex body in north edge
in the Tarim Basin. Xinjiang Geology 19 (1), 38–43. (in Chinese with English abstract)
Li, H.Y., Huang, X.L., Li, W.X., Cao, J., He, P.L. & Xu, Y.G. 2013. Age and geochemistry of the Early
Permian basalts from Qimugan in the southwestern Tarim basin. Acta Petrological Sinica, 29(10),
3353-3368. (in Chinese with English abstract).
Li, Y., Su, W., Kong, P., Qian, Y.X., Zhang, K.L., Zhang, M.L., Chen, Y., Cai, X.Y. & You, D.H. 2007. Zircon
U–Pb ages of the Early Permian magmatic rocks in the Tazhong–Bachu region, Tarim Basin by LA-
ICP-MS. Acta Petrologica Sinica, 23(5), 1097–1107. (in Chinese with English abstract)
Li, Y.Q., Li, Z.L., Sun, Y.L., Chen, H.L., Yang, S.F. & Yu, X. 2010. PGE and geochemistry of Wajilitag
ultramafic cryptoexplosive brecciated rocks from Tarim Basin: implications for petrogenesis. Acta
Petrologica Sinica, 26, 3307–3318. (in Chinese with English abstract)
Li, Y.Q. 2013. Study on magma dynamics and ore potential of the Early Permian Tarim large igneous
province. Ph.D. Dissertation. Hangzhou: Zhejiang University, 1-122. (in Chinese with English
summary)
Li, Y.Q., Li, Z.L., Yu, X., Santosh, M., Langmuir, C.H., Yang, S.F., Chen, H.L., Tang, Z.L., Song, B. & Zou,
S.Y. 2014a. Origin of the Early Permian zircons in Keping basalts and magma evolution of the Tarim
Large Igneous Province (northwestern China). Lithos, 204, 47-58.
Li, Z.L., Yang, S.F., Chen, H.L., Langmiur, C.H., Yu, X., Lin, X.B. & Li, Y.Q. 2008. Chronology and
geochemistry of Taxinan basalts from the Tarim Basin: evidence for Permian plume magmatism. Acta
Petrologica Sinica, 24(5), 959–970. (in Chinese with English abstract)
Li, Z.L., Chen, H.L., Song, B., Li, Y.Q., Yang, S.F. & Yu, X. 2011. Temporal evolution of the Permian large
igneous province in Tarim Basin, Northwest China. Journal of Asian Earth Sciences, 42, 917–927.
Li, Z.L., Li, Y.Q., Chen, H.L., Santosh, M., Yang, S.F., Xu, Y.G., Langmuir, C.H., Chen, H.L., Yu, X. & Zou,
S.Y. 2012. Hf isotopic characteristics of the Tarim Permian large igneous province rocks of NW China:
Implication for the magmatic source and evolution. Journal of Asian Earth Sciences, 49, 191-202.
Ludwig, K. R. 1998. On the treatment of concordant uranium-lead ages. Geochimica et Cosmochimica
Acta, 62(4), 665-676.
Ludwig, K.R. 2008. Isoplot 3.6: Berkeley Geochronology Center Special Publication 4, 77.
Luo, J. H., Che, Z. C., Zhou, N. C., Yang, W., Song, H. X., Hou, X. J. & Han, K. 2013. Geochemistry and
isotopic geochronology of dacites from the Lower Permian Xiaotikanlike Formation in the southern
margin of South Tianshan, and its tectonic significances. Acta Geologica Sinica, 87 (1), 29–37 (in
Chinese with English abstract).
Marzoli, A., Renne, P.R., Piccirillo, E.M., Ernesto, M., Bellieni, G. & De Min, A. 1999. Extensive 200-million
year old continental flood basalts of the Central Atlantic Magmatic Province. Science, 284, 616–618.
Mattinson, J. M. 1987. U-Pb ages of zircons: A basic examination of error propagation. Chemical Geology:
Isotope Geoscience section, 66(1), 151-162.
Mattinson, J. M. 2005. Zircon U–Pb chemical abrasion (“CA-TIMS”) method: combined annealing and
multi-step partial dissolution analysis for improved precision and accuracy of zircon ages. Chemical
Geology, 220(1), 47-66.
Melluso, L., Lustrino, M., Ruberti, E., Brotzu, P., de Barros Gomes, C., Morbidelli, L., Morra, V., Svisero, D.
P. & d’Amelio, F. 2008. Major-and trace-element composition of olivine, perovskite, clinopyroxene,
Cr–Fe–Ti oxides, phlogopite and host kamafugites and kimberlites, Alto Paranaiba, Brazil. The
Canadian Mineralogist, 46(1), 19-40.
Memeti, V., Paterson, S., Matzel, J., Mundil, R. & Okaya, D. 2010. Magmatic lobes as “snapshots” of
magma chamber growth and evolution in large, composite batholiths: An example from the
Tuolumne intrusion, Sierra Nevada, California. Geological Society of America Bulletin, 122(11-12)
1912-1931.
Mezger, K. & Krogstad, E.J. 1997. Interpretation of discordant U–Pb zircon ages: An evaluation. Journal of
Metamorphic Geology, 15, 127–140.
Michel, J., Baumgartner, L., Putlitz, B., Schaltegger, U. & Ovtcharova, M. 2008. Incremental growth of the
Patagonian Torres del Paine laccolith over 90 ky. Geology, 36(6), 459-462.
Miller, C. F., McDowell, S. M. & Mapes, R. W. 2003. Hot and cold granites? Implications of zircon
saturation temperatures and preservation of inheritance. Geology, 31(6), 529-532.
Miller, J. S., Matzel, J. E., Miller, C. F., Burgess, S. D. & Miller, R. B. 2007. Zircon growth and recycling
during the assembly of large, composite arc plutons. Journal of Volcanology and Geothermal Research,
167(1), 282-299.
Mitchell, R. H. 2008. Petrology of hypabyssal kimberlites: relevance to primary magma compositions.
Journal of Volcanology and Geothermal Research, 174(1), 1-8.
Patterson, M., Francis, D. & McCandless, T. 2009. Kimberlites: magmas or mixtures? Lithos, 112, 191–200.
Qin, K.Z., Su, B.X., Sakyi, P.A., Tang, D.M., Li, X.H., Sun, H., Xiao, Q.H. & Liu, P.P. 2011. SIMS zircon U–
Pb geochronology and Sr-Nd isotopes of Ni–Cu-bearing mafic–ultramafic intrusions in eastern
Tianshan and Beishan in correlation with flood basalts in Tarim Basin (NW China): constraints on a ca.
280 Ma mantle plume. American Journal of Science, 311, 237–260.
R Development Core Team. 2008. R: A Language and Environment for Statistical Computing, R
Foundation for Statistical Computing, Vienna, Austria, ISBN 3-900051-07-0.
Riishuus, M. S., Peate, D. W., Tegner, C., Wilson, J. R., Brooks, C. K. & Harris, C. 2006. Temporal
evolution of a long-lived syenitic centre: the Kangerlussuaq Alkaline Complex, East Greenland. Lithos,
92(1), 276-299.
Sarkar, C., Storey, C.D., Hawkesworth, C.J. & Sparks, R.S.J. 2011. Degassing in kimberlite: oxygen isotope
ratios in perovskites from explosive and hypabyssal kimberlites. Earth and Planetary Science Letters,
312(3–4), 291–299.
Sarkar, C., Storey, C. D. & Hawkesworth, C. J. 2014. Using perovskite to determine the pre-shallow level
contamination magma characteristics of kimberlite. Chemical Geology, 363, 76-90.
Schaltegger, U., Brack, P., Ovtcharova, M., Peytcheva, I., Schoene, B., Stracke, A., Marocchi, M. & Bargossi,
G. M. 2009. Zircon and titanite recording 1.5 million years of magma accretion, crystallization and
initial cooling in a composite pluton (southern Adamello batholith, northern Italy). Earth and
Planetary Science Letters, 286(1), 208-218.
Schmitz, M. D. & Schoene, B. 2007. Derivation of isotope ratios, errors, and error correlations for U-Pb
geochronology using 205Pb-235U-(233U)-spiked isotope dilution thermal ionization mass spectrometric
data. Geochemistry, Geophysics, Geosystems, 8(8).
Schoene, B., Guex, J., Bartolini, A., Schaltegger, U. & Blackburn, T. J. 2010. Correlating the end-Triassic
mass extinction and flood basalt volcanism at the 100 ka level. Geology, 38(5), 387-390.
Schoene, B., Condon, D. J., Morgan, L. & McLean, N. 2013. Precision and accuracy in geochronology.
Elements, 9(1) 19-24.
Schoene, B. 2014. U-Th-Pb Geochronology, in Treatise on Geochemistry 2nd Edition, ch. 3.10, Rudnick R,
ed.
Sharp, W.D. & Clague, D.A. 2006. 50-Ma initiation of the Hawaiian-Emperor Bend records major change
in Pacific plate motion. Science, 313, 1281–1284.
Sircombe, K.N. 1999. Tracing provenance through the isotope ages of littoral and sedimentary detrital
zircon, eastern Australia. Sedimentary Geology, 124, 47-67.
Sparks, R. 2013. Kimberlite Volcanism. Annual Review of Earth and Planetary Sciences, 41, 497–528.
Stuart, P. L. 1982. Least squares quantization in PCM. IEEE Transactions on Information Theory, IT-28,
129–137.
Su, L. 1991. A research on magmatic inclusions in minerals from kimberlite in Bachu County, Xinjiang,
China. Periodical of Xi'an Geological Mineral Institute, 32, 15–33. (in Chinese).
Sun, S. S. & McDonough, W. 1989. Chemical and isotopic systematics of oceanic basalts: implications for
mantle composition and processes. Geological Society of London Special Publications, 42(1), 313-345.
Sun, L.H., Wang, Y.J., Fan, W.M. & Zi, J.W. 2008. A further discussion of the petrogenesis and tectonic
implication of the Mazhashan syenites in the Bachu area. Journal of Jilin University (Earth Science
Edition), 38(1), 8-20. (in Chinese with English abstract)
Sun, Y., Xiao, Y.F., Zhao, X.K., Qian, Y.X., Xiao, G.W. & Liu, H.Q. 2009. The zircon U-Pb age of
Mazha’erTage alkalic complex in the Tarim Basin and its geologic significance. Acta Geologica Sinica,
83(6), 775-781. (in Chinese with English abstract)
Tian, W., Campbell, I.H., Allen, C., Guan, P., Pan, W., Chen, M.M., Yu, H. & Zhu. W. P. 2010. The Tarim
picrate-basalt-rhyolite suite, a Permian flood basalt from northwest China with contrasting rhyolites
produced by fractional crystallization and anatexis. Contributions to Mineralogy and Petrology, 160
(3), 407-425.
Wang, Y.S. & Su, L. 1987. Petro-mineral characteristics of Wajilitag kimberlites and contrast with some
correlation region, Bachu, Xinjiang. Periodical of Xi'an Geological Mineral Institute, 15, 47-56. (in
Chinese)
Wang, Y.S. & Su, L. 1990. Composition characteristics and forming condition of phlogolites in Wajilitage
kimberlites, Bachu, Xinjiang. Periodical of Xi'an Geological Mineral Institute, 28, 47-55. (in Chinese)
Watson, E. B. & Harrison, T. M. 1983. Zircon saturation revisited: temperature and composition effects in
a variety of crustal magma types. Earth and Planetary Science Letters, 64(2), 295-304.
Wendt, I. & Carl, C. 1991. The statistical distribution of the mean squared weighted deviation. Chemical
Geology: Isotope Geoscience Section, 86(4), 275-285.
Wei, X. & Xu, Y.G. 2011. Petrogenesis of Xiaohaizi syenite complex from Bachu area, Tarim. Acta
Petrologica Sinica, 27(10), 2984- 3004. (in Chinese with English abstract)
Wei, X. & Xu, Y.G. 2013. Petrogenesis of the mafic dykes from Bachu and implications for the magma
evolution of the Tarim large igneous province, NW China. Acta Petrologica Sinica, 29(10), 3323- 3335.
(in Chinese with English abstract)
Wei, X., Xu, Y.G., Feng, Y.X. & Zhao, J.X. 2014. Plume–lithosphere interaction in the generation of the
Tarim large igneous province, NW China: geochronological and geochemical constraints. American
Journal of Science, 314, 314–356.
Wu, G.H., Li, H.W., Xu, Y.L., Su, W., Chen, Z.Y. & Zhang, B.S. 2012. The tectonothermal events,
architecture and evolution of Tarim craton basement palaeo-uplifts. Acta Petrologica Sinica, 28(8),
2435 - 2452. (in Chinese with English abstract)
Xu, Y.G., Wei, X., Luo, Z.Y., Liu, H.Q. & Cao, J. 2014. The Early Permian Tarim Large Igneous Province:
Main characteristics and a plume incubation model. Lithos, 204, 20-35.
Yang, S.F., Chen, H.L., Dong, C.W., Jia, C.Z. & Wang, Z.G. 1996. The discovery of Permian syenite inside
Tarim Basin and its geodynamic significance. Geochimica, 25(2), 121-128. (in Chinese with English
abstract).
Yang, S.F., Li, Z.L., Chen, H.L., Xiao, W.J., Yu, X., Lin, X.B. & Shi, X.G. 2006a. Discovery of a Permian
quartz syenitic porphyritic dyke from the Tarim Basin and its tectonic implications. Acta Petrologica
Sinica, 22 (5), 1405–1412. (in Chinese with English abstract)
Yang, S.F., Li, Z.L., Chen, H.L., Chen, W. & Yu, X. 2006b. 40Ar/39Ar dates of basalts from Tarim Basin, NW
China and its implication to a Permian thermal tectonic event. Journal of Zhejiang University - Science
A 7 (Supp. II), 170–174.
Yang, S.F., Li, Z.L. & Chen, H.L. 2007. Permian bimodal dyke of Tarim Basin, NW China: Geochemical
characteristics and tectonic implications. Gondwana Research, 12, 113-120.
Yu, X. 2009. Magma evolution and seep geological processes of Early Permian Tarim Large Igneous
Province. Ph.D. Dissertation. Hangzhou: Zhejiang University, 1-136. (in Chinese with English
summary)
Yu, X., Yang, S.F., Chen, H.L., Chen, Z.Q., Li, Z.L., Batt, G.E. & Li, Y.Q. 2011b. Permian flood basalts from
the Tarim Basin, Northwest China: SHRIMP zircon U-Pb dates and geochemical characteristics.
Gondwana Research, 20(2-3), 485-497.
Zhang, H.A., Li, Y.J., Wu, G.Y., Su, W., Qian, Y.X., Meng, Q.L., Cai, X.Y., Han, L.J., Zhao, Y. & Liu, Y.L.
2009. Isotopic geochronology of Permian igneous rocks in the Tarim Basin. Chinese Journal of
Geology, 44 (1), 137–158. (in Chinese with English abstract).
Zhang, C.L., Li, X.H., Li, Z.X., Ye, H.M. & Li, C.N. 2008a. A Permian layered intrusive complex in the
Western Tarim Block, northwestern China: product of a Ca. 275–Ma mantle plume? Journal of
Geology, 116 (3), 269–287.
Zhang, C.L., Xu, Y.G., Li, Z.X., Wang, H.Y. & Ye, H.M. 2010a. Diverse Permian magmatism in the Tarim
Block, NW China: Genetically linked to the Permian Tarim mantle plume? Lithos, 119 (3-4): 537-552.
Zhang, C.L. & Zou, H.B. 2013. Permian A-type granites in Tarim and western part of Central Asian
Orogenic Belt (CAOB): Genetically related to a common Permian mantle plume? Lithos, 172, 47-60.
Zhang, D.Y., Zhang, Z.C., Santosh, M., Cheng, Z., He, H. & Kang, J. 2013. Perovskite and baddeleyite
from kimberlitic intrusions in the Tarim large igneous province signal the onset of an end-
Carboniferous mantle plume. Earth and Planetary Science Letters, 361, 238–248.
Zhang, Z.L., Qin, Q.M., Tian, W., Cao, B., Li, B.S. & Chen, M.M. 2008b. Emplacement characteristics and
spatial distribution of Permian Mazhartager basic dike swarms in Bachu area, Tarim basin. Acta
Petrologica Sinica, 24(10), 2273-2280 (in Chinese with English abstract).
Zhou, M.F., Zhao, J.H., Jiang, C.Y., Gao, J.F., Wang, W. & Yang, S.H. 2009. OIB–like, heterogeneous
mantle sources of Permian basaltic magmatism in the western Tarim Basin, NW China: implications
for a possible Permian large igneous province. Lithos, 113, 583–594.

Zou, S.Y., Li, Z.L., Ren, Z.Y., Li, Y.Q., Yang S.F., Chen, H.L., Song, B. & Yu, X. 2013. U-Pb dates and Hf
isotopic compositions of the detrital zircons from Permian sedimentary rocks in Keping area of Tarim
Basin, Xianjiang, China: Constraints on geological evolution of Tarim Block. Acta Petrologica Sinica,
29(10), 3369-3388. (in Chinese with English abstract).