The Effect of Knudsen Number on Transient Times …gobbert/papers/GobbertCaleIJMCE2005.… · The...
20
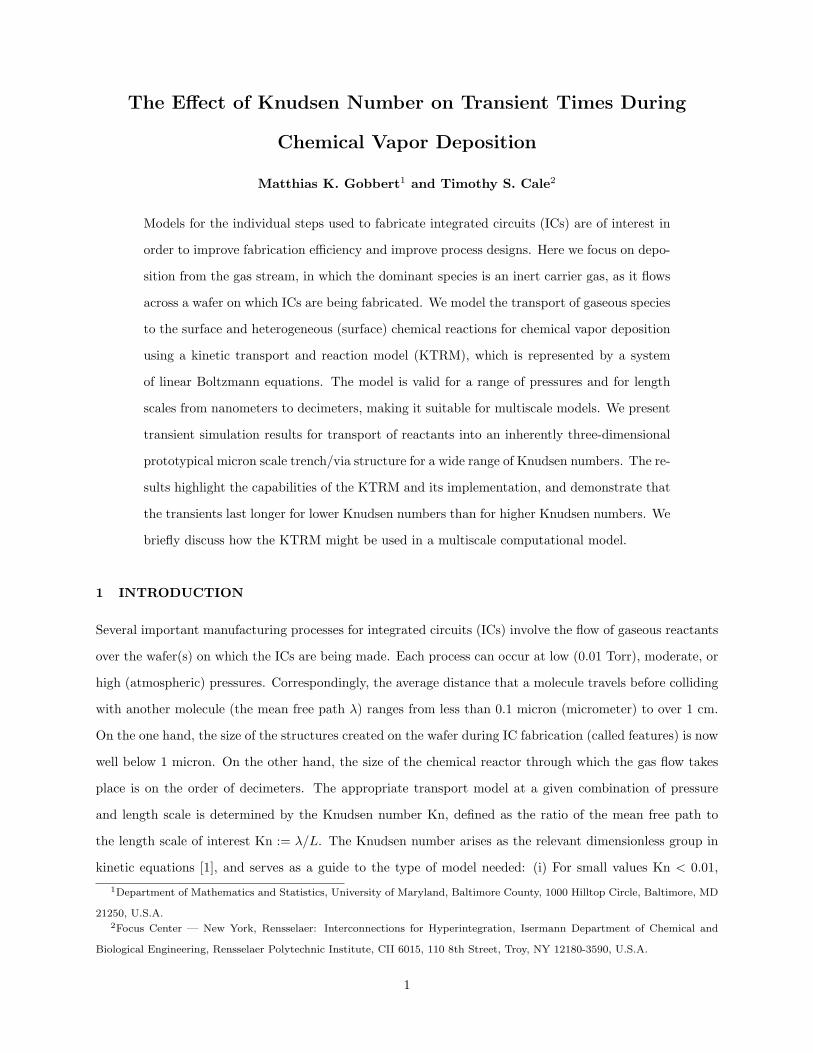
The Effect of Knudsen Number on Transient Times During Chemical Vapor Deposition Matthias K. Gobbert 1 and Timothy S. Cale 2 Models for the individual steps used to fabricate integrated circuits (ICs) are of interest in order to improve fabrication efficiency and improve process designs. Here we focus on depo- sition from the gas stream, in which the dominant species is an inert carrier gas, as it flows across a wafer on which ICs are being fabricated. We model the transport of gaseous species to the surface and heterogeneous (surface) chemical reactions for chemical vapor deposition using a kinetic transport and reaction model (KTRM), which is represented by a system of linear Boltzmann equations. The model is valid for a range of pressures and for length scales from nanometers to decimeters, making it suitable for multiscale models. We present transient simulation results for transport of reactants into an inherently three-dimensional prototypical micron scale trench/via structure for a wide range of Knudsen numbers. The re- sults highlight the capabilities of the KTRM and its implementation, and demonstrate that the transients last longer for lower Knudsen numbers than for higher Knudsen numbers. We briefly discuss how the KTRM might be used in a multiscale computational model. 1 INTRODUCTION Several important manufacturing processes for integrated circuits (ICs) involve the flow of gaseous reactants over the wafer(s) on which the ICs are being made. Each process can occur at low (0.01 Torr), moderate, or high (atmospheric) pressures. Correspondingly, the average distance that a molecule travels before colliding with another molecule (the mean free path λ) ranges from less than 0.1 micron (micrometer) to over 1 cm. On the one hand, the size of the structures created on the wafer during IC fabrication (called features) is now well below 1 micron. On the other hand, the size of the chemical reactor through which the gas flow takes place is on the order of decimeters. The appropriate transport model at a given combination of pressure and length scale is determined by the Knudsen number Kn, defined as the ratio of the mean free path to the length scale of interest Kn := λ/L. The Knudsen number arises as the relevant dimensionless group in kinetic equations [1], and serves as a guide to the type of model needed: (i) For small values Kn < 0.01, 1 Department of Mathematics and Statistics, University of Maryland, Baltimore County, 1000 Hilltop Circle, Baltimore, MD 21250, U.S.A. 2 Focus Center — New York, Rensselaer: Interconnections for Hyperintegration, Isermann Department of Chemical and Biological Engineering, Rensselaer Polytechnic Institute, CII 6015, 110 8th Street, Troy, NY 12180-3590, U.S.A. 1
Transcript of The Effect of Knudsen Number on Transient Times …gobbert/papers/GobbertCaleIJMCE2005.… · The...
The Effect of Knudsen Number on Transient Times During
Chemical Vapor Deposition
Matthias K. Gobbert1 and Timothy S. Cale2
Models for the individual steps used to fabricate integrated circuits (ICs) are of interest in
order to improve fabrication efficiency and improve process designs. Here we focus on depo-
sition from the gas stream, in which the dominant species is an inert carrier gas, as it flows
across a wafer on which ICs are being fabricated. We model the transport of gaseous species
to the surface and heterogeneous (surface) chemical reactions for chemical vapor deposition
using a kinetic transport and reaction model (KTRM), which is represented by a system
of linear Boltzmann equations. The model is valid for a range of pressures and for length
scales from nanometers to decimeters, making it suitable for multiscale models. We present
transient simulation results for transport of reactants into an inherently three-dimensional
prototypical micron scale trench/via structure for a wide range of Knudsen numbers. The re-
sults highlight the capabilities of the KTRM and its implementation, and demonstrate that
the transients last longer for lower Knudsen numbers than for higher Knudsen numbers. We
briefly discuss how the KTRM might be used in a multiscale computational model.
1 INTRODUCTION
Several important manufacturing processes for integrated circuits (ICs) involve the flow of gaseous reactants
over the wafer(s) on which the ICs are being made. Each process can occur at low (0.01 Torr), moderate, or
high (atmospheric) pressures. Correspondingly, the average distance that a molecule travels before colliding
with another molecule (the mean free path λ) ranges from less than 0.1 micron (micrometer) to over 1 cm.
On the one hand, the size of the structures created on the wafer during IC fabrication (called features) is now
well below 1 micron. On the other hand, the size of the chemical reactor through which the gas flow takes
place is on the order of decimeters. The appropriate transport model at a given combination of pressure
and length scale is determined by the Knudsen number Kn, defined as the ratio of the mean free path to
the length scale of interest Kn := λ/L. The Knudsen number arises as the relevant dimensionless group in
kinetic equations [1], and serves as a guide to the type of model needed: (i) For small values Kn < 0.01,
1Department of Mathematics and Statistics, University of Maryland, Baltimore County, 1000 Hilltop Circle, Baltimore, MD
21250, U.S.A.2Focus Center — New York, Rensselaer: Interconnections for Hyperintegration, Isermann Department of Chemical and
Biological Engineering, Rensselaer Polytechnic Institute, CII 6015, 110 8th Street, Troy, NY 12180-3590, U.S.A.
1
the usual continuum models describe the gas flow well. (ii) At intermediate values Kn ≈ 1, kinetic models
based on the Boltzmann transport equation capture the influence of both transport of and collisions among
the molecules; this is called the transition regime. (iii) For large values Kn > 100, kinetic models are still
appropriate, with the collision term being small; this is called the free molecular flow, or ballistic transport,
regime. We are interested in models for species transport and chemical reactions on the sub-micron scale
(1 nm to 10 micron) to millimeter scale (10 micron to 1000 micron), over a range of pressures. This results
in Knudsen numbers ranging from less than 0.01 to greater than 100; i.e., all three transport regimes.
The focus of this paper is to study the effect of Kn on the time it takes for transients to be essentially
complete; e.g., how long does it take for the effects of a change in fluxes into the modeled domain to
stop changing the local concentration and kinetic density through the domain. The studies presented here
extend reports in [2, 3, 4]. Studies in Ref. [2] focus on the parallel scalability of the numerical method on
a distributed-memory cluster. Ref. [3] focuses on a full introduction to the modeling and careful reference
simulations that provide a validation of the model, and Ref. [4] focuses on studies of the numerical method
and its convergence that provide a validation of the numerical method. The studies in Ref. [3] validated
the model against EVOLVE (discussed in [5] and references therein), a well-established code that provides
steady state solutions to low pressure transport and reaction inside features on patterned wafers. The
KTRM computed distribution of flux of incoming species along the surface of a feature compares well with
that computed by EVOLVE. The agreement improves with increasing number of velocity terms, as expected,
as confirmed by the studies focussing on the numerical method in Ref. [4]. The studies in [2, 3, 4] considered
the Knudsen number as a dimensionless group that characterizes the flow regime, but did not specifically
address the Kn dependence on how long it takes for a transient to disappear. Since the transient time
dependency needs to be taken into account when developing an efficient multiscale simulator, we extend our
work to include this issue here.
These authors have coupled models on several length scales, from feature scale to reactor scale, to form
a single, or concurrent multiscale reactor simulator using a pseudosteady state approach [6, 7]. Continuum
models were used for all but the feature scale; free molecular flow was appropriate at that scale, as Kn > 100.
The current work provides the basis for creating a multiscale model which is valid over a wider pressure range,
uses finite element methods and parallel code on all scales, and can deal with process transients; e.g., in
atomic layer deposition [8, 9, 10, 11, 12]. Such a multiscale model will require well-tested and validated
models and numerical methods for each length scale of interest [5].
The following section summarizes the kinetic transport and reaction model (KTRM) developed for the
processes under consideration. Section 3 briefly describes the numerical methods used. The main part of
this paper is the presentation and discussion of simulation results for a micron scale model of chemical vapor
2

deposition (CVD) in Section 4. Finally, Section 5 summarizes the conclusions drawn from the numerical
results.
2 THE MODEL
We have developed the kinetic transport and reaction model (KTRM) [3, 9, 10] to model flow of reactive
species in a gas flow dominated by an inert carrier that is assumed to be an order denser than the reactive
species. The KTRM is then represented by a system of linear Boltzmann equations, one for each of the ns
reactive species∂f (i)
∂t+ v · ∇xf (i) =
1Kn
Qi(f (i)), i = 1, . . . , ns, (2.1)
with the linear collision operators
Qi(f (i))(x,v, t) =∫
R3σi(v,v′)
[Mi(v)f (i)(x,v′, t)−Mi(v′)f (i)(x,v, t)
]dv′,
where σi(v,v′) = σi(v′,v) ≥ 0 is a given collision frequency model and Mi(v) denotes the Maxwellian
distribution of species i. See [3] for a derivation of the model and more details on its assumptions and
non-dimensionalization. The left-hand side of (2.1) models the advective transport of molecules of species i
(local coupling of spatial variations via the gradient ∇xf (i)), while the right-hand side models the effect of
collisions (global coupling of all velocities in the integral operators Qi). The Knudsen number arises as the
relevant dimensionless group in (2.1), because the transport on the left-hand side is non-dimensionalized with
respect to the typical domain size, while the collision operator on the right-hand side is non-dimensionalized
with respect to the mean free path. Thus, the values of Kn are affected by both the scale of interest of the
model and by the operating conditions of the chemical reactor. The unknown functions f (i)(x,v, t) in this
kinetic model represent the (scaled) probability density, called the kinetic density in the following, that a
molecule of species i = 1, . . . , ns at position x ∈ Ω ⊂ R3 has velocity v ∈ R3 at time t. Its values need
to be determined at all points x in the three-dimensional spatial domain Ω and for all three-dimensional
velocity vectors v at all times 0 < t ≤ tfin. This high dimensionality of the space of independent variables is
responsible for the numerical complexity of kinetic models, as six dimensions need to be discretized, at every
time step for transient simulations. Notice that while the equations in (2.1) appear decoupled, they actually
remain coupled through the boundary condition at the wafer surface that models the surface reactions and
is of crucial importance for the applications under consideration.
3

3 THE NUMERICAL METHOD
The numerical method for (2.1) needs to discretize the spatial domain Ω ⊂ R3 and the (unbounded) velocity
space R3. We start by approximating each f (i)(x,v, t) by an expansion f(i)K (x,v, t) :=
∑K−1`=0 f
(i)` (x, t)ϕ`(v).
Here, the basis functions ϕ`(v) in velocity space are chosen such that they form an orthogonal family of
functions in velocity space with respect to a weighted L2-inner product that arises from entropy considerations
for the linear Boltzmann equation [13]. The basis functions are constructed as products of polynomials and
a Maxwellian; hence, they are most appropriate if the flow regime is not too far from a Maxwellian regime.
This is suitable for the flows that will be considered here. Flows with other properties can however be
approximated by this method by constructing different basis functions.
Inserting the expansion for f (i)(x,v, t) and testing successively against ϕk(v) with respect to the inner
product approximates (2.1) by a system of linear hyperbolic equations [13]
∂F (i)
∂t+ A(1) ∂F (i)
∂x1+ A(2) ∂F (i)
∂x2+ A(3) ∂F (i)
∂x3=
1Kn
B(i) F (i), i = 1, . . . , ns, (3.1)
where F (i)(x, t) := (f (i)0 (x, t), ..., f (i)
K−1(x, t))T is the vector of the K coefficient functions in the expansion in
velocity space. Here, A(1), A(2), A(3), and B(i) are constant K×K matrices. Using collocation basis functions,
the coefficient matrices A(1), A(2), A(3) become diagonal matrices [4]. Note again that the equations for all
species remain coupled through the crucial reaction boundary condition at the wafer surface.
The hyperbolic system (3.1) is now posed in a standard form as a system of partial differential equations
on the spatial domain Ω ⊂ R3 and in time t and amenable to solution by various methods. Figure 1 shows two
views of a representative domain Ω ⊂ R3; more precisely, the plots show the solid wafer surface consisting of
a 0.3 micrometer deep trench, in which is etched another 0.3 micrometer deep via (round hole). The domain
Ω for our model is the gaseous region above the solid wafer surface up to the top of the plot box at x3 = 0.3
micrometers in Figure 1. Since typical domains in our applications such as this one are of irregular shape, we
use the discontinuous Galerkin method (DGM) [14], relying on a finite element discretization of the domain
into tetrahedra.
The degrees of freedom (DOF) of the finite element method are the values of the ns species’ coefficient
functions f(i)` (x, t) in the Galerkin expansion at K discrete velocities on the 4 vertices of each of the Ne
tetrahedra of the three-dimensional mesh. Hence, the complexity of the computational problem is given by
4 Ne K ns at every time step. To appreciate the size of the problem, consider that the mesh of the domain in
Figure 1 uses Ne = 7,087 three-dimensional tetrahedral elements; even in the case of a single-species model
(ns = 1) and if we use just K = 4 × 4 × 4 = 64 discrete velocities in three dimensions, as used for the
application results in the following section, the total DOF are N = 1,814,272 or nearly 2 million unknowns
to be determined at every time step. Extensive validations of the numerical method and convergence studies
4

for a wide range of Knudsen numbers are the focus of [4]. Based on these results, the choice of discrete
velocities here is sufficient to obtain reliable results.
The size of problem at every time step motivates our interest in parallel computing. For the parallel
computations on a distributed-memory cluster, the spatial domain Ω is partitioned in a pre-processing step,
and the disjoint subdomains are distributed to separate parallel processes. The discontinuous Galerkin
method for (3.1) needs the flux through the element faces. At the interface from one subdomain to the next,
communications are required among those pairs of parallel processes that share a subdomain boundary.
Additionally, a number of global reduce operations are needed to compute inner products, norms, and other
diagnostic quantities. The performance of the parallel implementation was studied in [2] and confirmed that
a distributed-memory cluster is very effective in speeding up calculations for a problem of this type.
4 APPLICATION RESULTS
As an application example, we present a model for chemical vapor deposition. In this process, reactants
are supplied from the gas-phase interface at the top of the domain at x3 = 0.3 in Figure 1. The reactants
flow downwards throughout the domain Ω until they reach the solid wafer surface shown in Figure 1, where
some fraction of the molecules form a solid deposit. The time scale of all simulations corresponds to forming
only a very thin layer; hence the surface is not moved within a simulation. Here, we use a single-species
model with one reactive species (ns = 1) and drop the species superscript in the following discussion. The
deposition at the wafer surface can then be modeled using a sticking factor 0 ≤ γ0 ≤ 1 that represents
the fraction of molecules that are modeled to deposit at (“stick to”) the wafer surface. The re-emission
into Ω of gaseous molecules from the wafer surface is modeled as re-emission with velocity components in
Maxwellian form and proportional to the flux to the surface as well as proportional to 1−γ0. The re-emission
is scaled to conserve mass in the absence of deposition (γ0 = 0). The studies shown use a sticking factor of
γ0 = 0.01, that is, most molecules re-emit from the surface, which is a realistic condition [5]. The collision
operator uses a relaxation time discretization by choosing σ1(v,v′) ≡ 1/τ1 with (dimensionless) relaxation
time τ1 = 1.0 that characterized the time to return to steady-state under appropriate boundary conditions.
The temperature on the scale of this micron-scale domain is assumed constant and uniform throughout the
domain and is set at T = 500 K [3]. We focus on how the flow behaves when starting from no gas present
throughout Ω, modeled by initial condition f ≡ 0 at t = 0 for the reactive species; the inert species is already
present throughout the domain [3].
5

4.1 Concentration Results
Figures 2 through 5 show the results of transient simulations for the values of the Knudsen numbers
Kn = 0.01, 0.1, 1.0, and 100.0, respectively, at six selected times throughout the simulation; notice that
different times are selected for different cases. The quantity plotted for each (re-dimensionalized) time is the
(dimensionless) concentration
c(x, t) :=∫
R3f(x,v, t) dv
across the domain Ω. The values of the dimensionless concentration 0 ≤ c ≤ 1 is represented by the gray-
scale on each of the horizontal slices through Ω at the vertical levels at six values of x3; the shapes of all
slices together indicate the shape of the domain Ω.
In Figure 2 for Kn = 0.01, a value that indicates near fluid-dynamic regime, we see that the top-most
slice at x3 = 0.15 is always darker than the slices below it, indicating higher concentration of molecules has
reached this level from the inflow at the top of the domain than the lower levels deeper in the feature. More
specifically, at the early times 5 ns and 10 ns, relatively few molecules have reached the inside of the feature.
By 10 ns, the slice at x3 = 0 shows that the concentration at the flat parts of the wafer surface has reached
relatively high values than above the mouth of the trench (0.3 ≤ x1 ≤ 0.7); this is explained by the ongoing
flow of molecules into the trench. By 50 ns, we observe the same phenomenon at the slice for x3 = −0.3,
where the concentration has reached a higher value in the flat areas of the trench bottom as compared to
the opening into the via (round hole) below. The following plots for times 100, 150, and 200 ns show how
the fill of the entire domain with gaseous molecules continues over time.
Figure 3 shows slice plots of c(x, t) across Ω for the case of Kn = 0.1 at selected times t; notice that the
first two plots are at the same times 5 and 10 ns as the previous figure, but the remaining times are different
than in the previous figure. Comparing the plots at t = 5 ns in Figures 3 and 2 with each other, the one
for the smaller Kn has generally lighter color indicating a slower fill of the feature with gas. The smaller
Knudsen number means more collisions among molecules, leading to a less directional flow than for the larger
Knudsen number. Since the bulk direction of the flow is downward because of the supply at the top with
downward velocity, the feature fills faster with molecules in this case. This comparison also applies to time
10 ns. The following plots show again how the fill of the entire domain with gaseous molecules continues
over time; as the times are 15, 20, 25, and 30 ns here, we see that the fill occurs substantially faster for this
larger Knudsen number of Kn = 0.1.
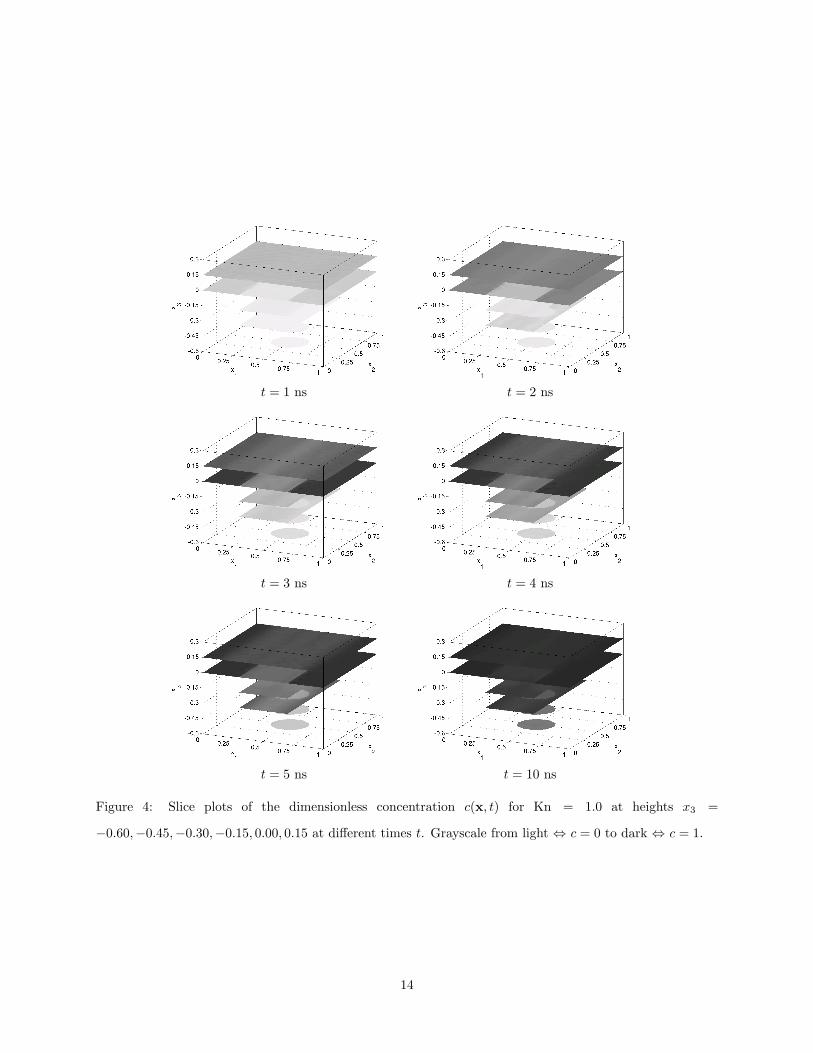
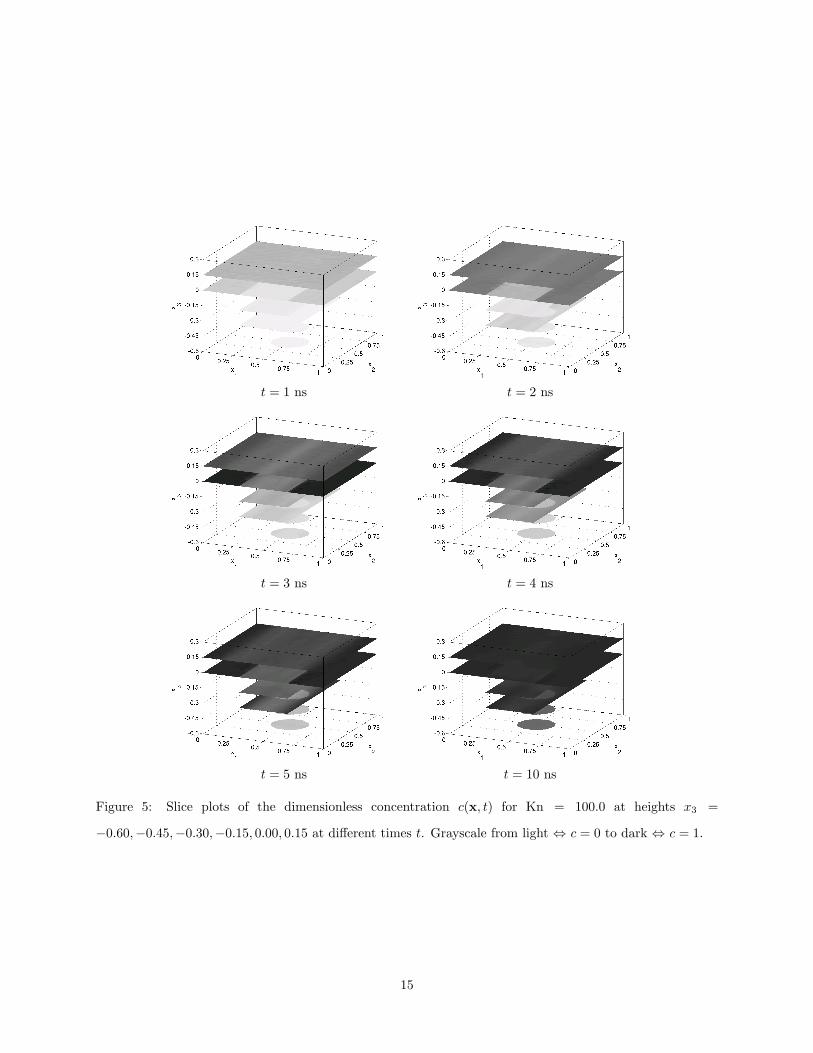
Figures 4 and 5 extend the comparison of slice plots of c(x, t) to the Knudsen numbers Kn = 1.0 and
100.0, respectively; notice that smaller times are selected here, but the times 5 and 10 ns are still available
for comparison, now in the final two plots. We notice first that the behavior of the two cases in Figures 4
6
and 5 appears nearly identical, up to the resolution of the plots. We also note that the overall behavior of
the feature filling with molecules is similar to the previous cases of smaller Knudsen numbers, but it clearly
occurs a lot faster. By time 10 ns, steady-state is rapidly being approached already, where in the previous
plots at 10 ns, in particular the inside of the via had only been reached by few molecules.
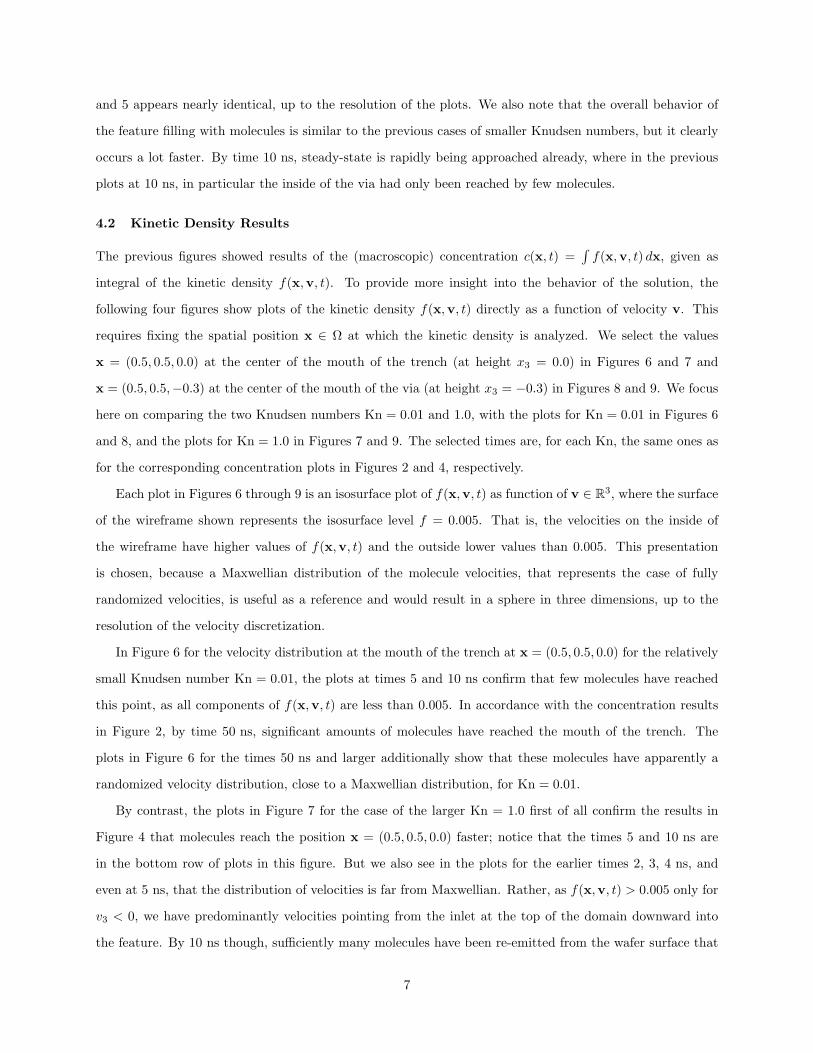
4.2 Kinetic Density Results
The previous figures showed results of the (macroscopic) concentration c(x, t) =∫
f(x,v, t) dx, given as
integral of the kinetic density f(x,v, t). To provide more insight into the behavior of the solution, the
following four figures show plots of the kinetic density f(x,v, t) directly as a function of velocity v. This
requires fixing the spatial position x ∈ Ω at which the kinetic density is analyzed. We select the values
x = (0.5, 0.5, 0.0) at the center of the mouth of the trench (at height x3 = 0.0) in Figures 6 and 7 and
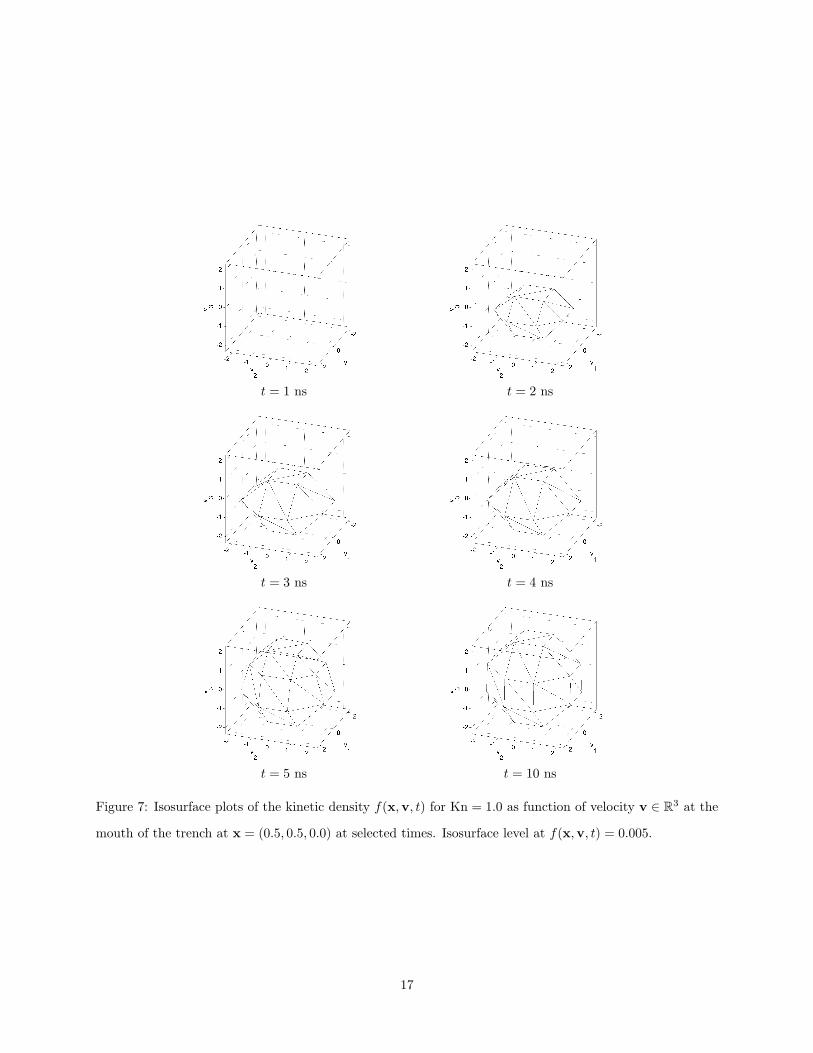
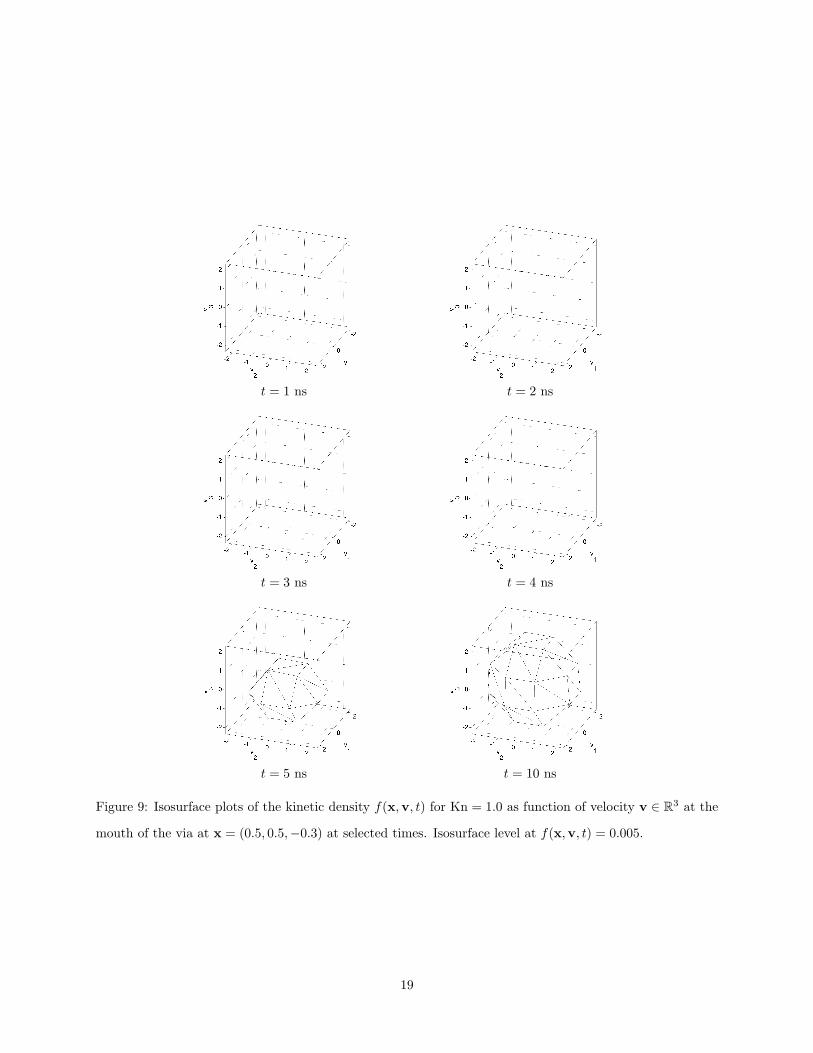
x = (0.5, 0.5,−0.3) at the center of the mouth of the via (at height x3 = −0.3) in Figures 8 and 9. We focus
here on comparing the two Knudsen numbers Kn = 0.01 and 1.0, with the plots for Kn = 0.01 in Figures 6
and 8, and the plots for Kn = 1.0 in Figures 7 and 9. The selected times are, for each Kn, the same ones as
for the corresponding concentration plots in Figures 2 and 4, respectively.
Each plot in Figures 6 through 9 is an isosurface plot of f(x,v, t) as function of v ∈ R3, where the surface
of the wireframe shown represents the isosurface level f = 0.005. That is, the velocities on the inside of
the wireframe have higher values of f(x,v, t) and the outside lower values than 0.005. This presentation
is chosen, because a Maxwellian distribution of the molecule velocities, that represents the case of fully
randomized velocities, is useful as a reference and would result in a sphere in three dimensions, up to the
resolution of the velocity discretization.
In Figure 6 for the velocity distribution at the mouth of the trench at x = (0.5, 0.5, 0.0) for the relatively
small Knudsen number Kn = 0.01, the plots at times 5 and 10 ns confirm that few molecules have reached
this point, as all components of f(x,v, t) are less than 0.005. In accordance with the concentration results
in Figure 2, by time 50 ns, significant amounts of molecules have reached the mouth of the trench. The
plots in Figure 6 for the times 50 ns and larger additionally show that these molecules have apparently a
randomized velocity distribution, close to a Maxwellian distribution, for Kn = 0.01.
By contrast, the plots in Figure 7 for the case of the larger Kn = 1.0 first of all confirm the results in
Figure 4 that molecules reach the position x = (0.5, 0.5, 0.0) faster; notice that the times 5 and 10 ns are
in the bottom row of plots in this figure. But we also see in the plots for the earlier times 2, 3, 4 ns, and
even at 5 ns, that the distribution of velocities is far from Maxwellian. Rather, as f(x,v, t) > 0.005 only for
v3 < 0, we have predominantly velocities pointing from the inlet at the top of the domain downward into
the feature. By 10 ns though, sufficiently many molecules have been re-emitted from the wafer surface that
7

there are also many molecules with upward velocities.
The next two Figures 8 and 9 show the same quantity as the previous plots at the same times, but with
the point x = (0.5, 0.5,−0.3) chosen at the mouth of the via (round hole) half-way down the feature. Since
this position lies deeper inside the feature than x = (0.5, 0.5, 0.0), it is expected that there is a time lag
for molecules to reach this position. This can be seen for each Kn by comparing Figure 8 with Figure 6
for Kn = 0.01 and Figure 9 with Figure 7 for Kn = 1.0. Particularly, the kinetic density at t = 50 ns in
Figure 8 has smaller values than those in Figure 6, but they are equally randomized due to relatively frequent
collisions for Kn = 0.01. Analogously, the density at t = 5 ns in Figure 9 has smaller values than the density
in Figure 7, but it is also still more directional and less randomized.
4.3 Kinetic Saturation Results
The final plots in Figures 6 through 9 all appear to show that kinetic density has reached a Maxwellian velocity
distribution in the final plot. To determine if this is indeed the case, we now plot the kinetic saturation
0 ≤ f(x,v, t)/M(v) ≤ 1 that shows how close to a Maxwellian the kinetic density f is. Moreover, all results
in the previous four figures bear out that at positions x in the center of the feature (x1 = x2 = 0.5) the
kinetic density f(x,v, t) does not depend on the velocity components v1 and v2 in the x1- and x2-directions,
respectively, and we use this observation to plot f/M as a function of v3 only, for v1 = v2 = 0 fixed, in
Figures 10 and 11. Each line shows the result at a particular time, as listed in the figure captions; these
times are the same ones for each Kn as before, but different for the two Kn.
Figure 10 shows the saturation f/M at the trench mouth and via mouth for Kn = 0.01. In both cases,
the saturation increases over time. Overall, the saturation levels are lower at the via mouth than at the
trench mouth, which is consistent with the concentration results in Figure 2; notice the different scales on
the vertical axes. We notice that the last lines are closer to each other than earlier lines, so a steady-state is
being approached; notice that only the final four times are uniformly spaced. Finally, each line shows larger
values of f/M for v3 < 0 (the left side of the plot) than for f3 > 0 (the right side). This means that the
velocity distribution has a downward direction. This detail could not be clearly determined in Figure 6 or 8;
in fact, many of the plots of the kinetic density could not be distinguished from Maxwellians there, but the
present plots of the saturation allow us to establish clearly that they are not Maxwellians.
Figure 11 shows the saturation f/M for Kn = 1.0. The same observations as for Figure 10 hold concerning
the level of saturation being higher at the trench mouth than the via mouth and concerning a generally
downward velocity distribution. But additionally, we notice that the difference between the f/M values for
v3 < 0 and v3 > 0 is sharper for most of the times; this corresponds to fewer collisions for this larger Kn = 1.0
compared to more collisions for Kn = 0.01 that tend to smooth out the velocity distribution. However, by
8
the final time, sufficiently many molecules have been re-emitted from the wafer surface that also upward
velocity components are present in the distribution and hence the saturation plot has become more uniform.
5 CONCLUSIONS
The results presented in the previous section highlight the capabilities of the KTRM and the numerical
method used to model an important chemical process. We see that the flow associated with larger Knudsen
numbers is more directional and the transients due to the change in flux of reactant species are shorter for
higher Kn. This is highlighted by looking at the local kinetic density function at selected times. Access to
the kinetic density is thus important to understanding such systems.
The studies presented point out the need to consider Kn when deciding how long transients due to
perturbations might last. That is, when deciding the simulation time for a particular case, its Knudsen
number must be taken into account, because different times will be appropriate for different Kn. This is
important in our effort to develop a multiscale simulator for processes of this type.
ACKNOWLEDGMENTS
The hardware used in the computational studies was partially supported by the SCREMS grant DMS–
0215373 from the U.S. National Science Foundation with additional support from the University of Maryland,
Baltimore County. See www.math.umbc.edu/~gobbert/kali for more information on the machine and the
projects using it. Prof. Cale acknowledges support from MARCO, DARPA, and NYSTAR through the
Interconnect Focus Center. We also thank Max O. Bloomfield for supplying the original mesh of the domain.
REFERENCES
[1] Kersch, A., Morokoff, W.J.: Transport Simulation in Microelectronics. Volume 3 of Progress in Numer-
ical Simulation for Microelectronics. Birkhauser Verlag, Basel (1995)
[2] Gobbert, M.K., Breitenbach, M.L., Cale, T.S.: Cluster computing for transient simulations of the
linear Boltzmann equation on irregular three-dimensional domains. In Sunderam, V.S., van Albada,
G.D., Sloot, P.M.A., Dongarra, J.J., eds.: Computational Science—ICCS 2005. Volume 3516 of Lecture
Notes in Computer Science., Springer-Verlag (2005) 41–48
[3] Gobbert, M.K., Cale, T.S.: A kinetic transport and reaction model and simulator for rarefied gas flow
in the transition regime. J. Comput. Phys., in press (2006)
9
[4] Gobbert, M.K., Webster, S.G., Cale, T.S.: A Galerkin method for the simulation of the transient
2-D/2-D and 3-D/3-D linear Boltzmann equation. J. Sci. Comput., accepted (2006)
[5] Cale, T.S., Merchant, T.P., Borucki, L.J., Labun, A.H.: Topography simulation for the virtual wafer
fab. Thin Solid Films 365 (2000) 152–175
[6] Gobbert, M.K., Merchant, T.P., Borucki, L.J., Cale, T.S.: A multiscale simulator for low pressure
chemical vapor deposition. J. Electrochem. Soc. 144 (1997) 3945–3951
[7] Merchant, T.P., Gobbert, M.K., Cale, T.S., Borucki, L.J.: Multiple scale integrated modeling of
deposition processes. Thin Solid Films 365 (2000) 368–375
[8] Gobbert, M.K., Cale, T.S.: A feature scale transport and reaction model for atomic layer deposition. In
Swihart, M.T., Allendorf, M.D., Meyyappan, M., eds.: Fundamental Gas-Phase and Surface Chemistry
of Vapor-Phase Deposition II. Volume 2001–13., The Electrochemical Society Proceedings Series (2001)
316–323
[9] Gobbert, M.K., Webster, S.G., Cale, T.S.: Transient adsorption and desorption in micrometer scale
features. J. Electrochem. Soc. 149 (2002) G461–G473
[10] Gobbert, M.K., Prasad, V., Cale, T.S.: Modeling and simulation of atomic layer deposition at the
feature scale. J. Vac. Sci. Technol. B 20 (2002) 1031–1043
[11] Gobbert, M.K., Prasad, V., Cale, T.S.: Predictive modeling of atomic layer deposition on the feature
scale. Thin Solid Films 410 (2002) 129–141
[12] Prasad, V., Gobbert, M.K., Bloomfield, M., Cale, T.S.: Improving pulse protocols in atomic layer
deposition. In Melnick, B.M., Cale, T.S., Zaima, S., Ohta, T., eds.: Advanced Metallization Conference
2002, Materials Research Society (2003) 709–715
[13] Ringhofer, C., Schmeiser, C., Zwirchmayr, A.: Moment methods for the semiconductor Boltzmann
equation on bounded position domains. SIAM J. Numer. Anal. 39 (2001) 1078–1095
[14] Remacle, J.F., Flaherty, J.E., Shephard, M.S.: An adaptive discontinuous Galerkin technique with an
orthogonal basis applied to compressible flow problems. SIAM Rev. 45 (2003) 53–72
10

Figure 1: Two views of the solid wafer surface boundary of the trench/via domain. The gas domain of the
model is the region above the wafer surface up to the top of the plot box.
11

t = 5 ns t = 10 ns
t = 50 ns t = 100 ns
t = 150 ns t = 200 ns
Figure 2: Slice plots of the dimensionless concentration c(x, t) for Kn = 0.01 at heights x3 =
−0.60,−0.45,−0.30,−0.15, 0.00, 0.15 at selected times t. Grayscale from light ⇔ c = 0 to dark ⇔ c = 1.
12

t = 5 ns t = 10 ns
t = 15 ns t = 20 ns
t = 25 ns t = 30 ns
Figure 3: Slice plots of the dimensionless concentration c(x, t) for Kn = 0.1 at heights x3 =
−0.60,−0.45,−0.30,−0.15, 0.00, 0.15 at different times t. Grayscale from light ⇔ c = 0 to dark ⇔ c = 1.
13
t = 1 ns t = 2 ns
t = 3 ns t = 4 ns
t = 5 ns t = 10 ns
Figure 4: Slice plots of the dimensionless concentration c(x, t) for Kn = 1.0 at heights x3 =
−0.60,−0.45,−0.30,−0.15, 0.00, 0.15 at different times t. Grayscale from light ⇔ c = 0 to dark ⇔ c = 1.
14
t = 1 ns t = 2 ns
t = 3 ns t = 4 ns
t = 5 ns t = 10 ns
Figure 5: Slice plots of the dimensionless concentration c(x, t) for Kn = 100.0 at heights x3 =
−0.60,−0.45,−0.30,−0.15, 0.00, 0.15 at different times t. Grayscale from light ⇔ c = 0 to dark ⇔ c = 1.
15

t = 5 ns t = 10 ns
t = 50 ns t = 100 ns
t = 150 ns t = 200 ns
Figure 6: Isosurface plots of the kinetic density f(x,v, t) for Kn = 0.01 as function of velocity v ∈ R3 at the
mouth of the trench at x = (0.5, 0.5, 0.0) at selected times. Isosurface level at f(x,v, t) = 0.005.
16
t = 1 ns t = 2 ns
t = 3 ns t = 4 ns
t = 5 ns t = 10 ns
Figure 7: Isosurface plots of the kinetic density f(x,v, t) for Kn = 1.0 as function of velocity v ∈ R3 at the
mouth of the trench at x = (0.5, 0.5, 0.0) at selected times. Isosurface level at f(x,v, t) = 0.005.
17

t = 5 ns t = 10 ns
t = 50 ns t = 100 ns
t = 150 ns t = 200 ns
Figure 8: Isosurface plots of the kinetic density f(x,v, t) for Kn = 0.01 as function of velocity v ∈ R3 at the
mouth of the via at x = (0.5, 0.5,−0.3) at selected times. Isosurface level at f(x,v, t) = 0.005.
18
t = 1 ns t = 2 ns
t = 3 ns t = 4 ns
t = 5 ns t = 10 ns
Figure 9: Isosurface plots of the kinetic density f(x,v, t) for Kn = 1.0 as function of velocity v ∈ R3 at the
mouth of the via at x = (0.5, 0.5,−0.3) at selected times. Isosurface level at f(x,v, t) = 0.005.
19

trench mouth via mouth
Figure 10: Line plots of the saturation of the kinetic density f(x,v, t)/M(v) for Kn = 0.01 for (v1, v2) = (0, 0)
as function of v3; at the mouth of the trench at position x = (0.5, 0.5, 0.0) and at the mouth of the via at
position x = (0.5, 0.5,−0.3); at times: × = 5 ns, + = 10 ns, 3 = 50 ns, 2 = 100 ns, = 150 ns, 4 = 200 ns.
Notice the different scales of the vertical axes.
trench mouth via mouth
Figure 11: Line plots of the saturation of the kinetic density f(x,v, t)/M(v) for Kn = 1.0 for (v1, v2) = (0, 0)
as function of v3; at the mouth of the trench at position x = (0.5, 0.5, 0.0) and at the mouth of the via at
position x = (0.5, 0.5,−0.3); at times: × = 1 ns, + = 2 ns, 3 = 3 ns, 2 = 4 ns, = 5 ns, 4 = 10 ns.
20