BRAZIL - -: National-Biodiversity Eproject Brazilian ... · GLOBAL ENVIRONMENT FACILITY //+523 BRAZIL

63
THE ECONOMICS OF BIODIVERSITY IN BRAZIL: THE CASE OF FOREST CONVERSION
Ronaldo Seroa da Motta
Originally published by Ipea in October 1996 as number 433 of the series Texto para Discussão.


DISCUSSION PAPER
63B r a s í l i a , J a n u a r y 2 0 1 5
Originally published by Ipea in October 1996 as number 433 of the series Texto para Discussão.
THE ECONOMICS OF BIODIVERSITY IN BRAZIL: THE CASE OF FOREST CONVERSION
Ronaldo Seroa da Motta1
1. Coordinator of Environmental Studies Research Institute of Applied Economics (Ipea)

DISCUSSION PAPER
A publication to disseminate the findings of research
directly or indirectly conducted by the Institute for
Applied Economic Research (Ipea). Due to their
relevance, they provide information to specialists and
encourage contributions.
© Institute for Applied Economic Research – ipea 2015
Discussion paper / Institute for Applied Economic
Research.- Brasília : Rio de Janeiro : Ipea, 1990-
ISSN 1415-4765
1. Brazil. 2. Economic Aspects. 3. Social Aspects.
I. Institute for Applied Economic Research.
CDD 330.908
The authors are exclusively and entirely responsible for the
opinions expressed in this volume. These do not necessarily
reflect the views of the Institute for Applied Economic
Research or of the Secretariat of Strategic Affairs of the
Presidency of the Republic.
Reproduction of this text and the data it contains is
allowed as long as the source is cited. Reproductions for
commercial purposes are prohibited.
Federal Government of Brazil
Secretariat of Strategic Affairs of the Presidency of the Republic Minister Roberto Mangabeira Unger
A public foundation affiliated to the Secretariat of Strategic Affairs of the Presidency of the Republic, Ipea provides technical and institutional support to government actions – enabling the formulation of numerous public policies and programs for Brazilian development – and makes research and studies conducted by its staff available to society.
PresidentSergei Suarez Dillon Soares
Director of Institutional DevelopmentLuiz Cezar Loureiro de Azeredo
Director of Studies and Policies of the State,Institutions and DemocracyDaniel Ricardo de Castro Cerqueira
Director of Macroeconomic Studies and PoliciesCláudio Hamilton Matos dos Santos
Director of Regional, Urban and EnvironmentalStudies and PoliciesRogério Boueri Miranda
Director of Sectoral Studies and Policies,Innovation, Regulation and InfrastructureFernanda De Negri
Director of Social Studies and Policies, DeputyCarlos Henrique Leite Corseuil
Director of International Studies, Political and Economic RelationsRenato Coelho Baumann das Neves
Chief of StaffRuy Silva Pessoa
Chief Press and Communications OfficerJoão Cláudio Garcia Rodrigues Lima
URL: http://www.ipea.gov.brOmbudsman: http://www.ipea.gov.br/ouvidoria
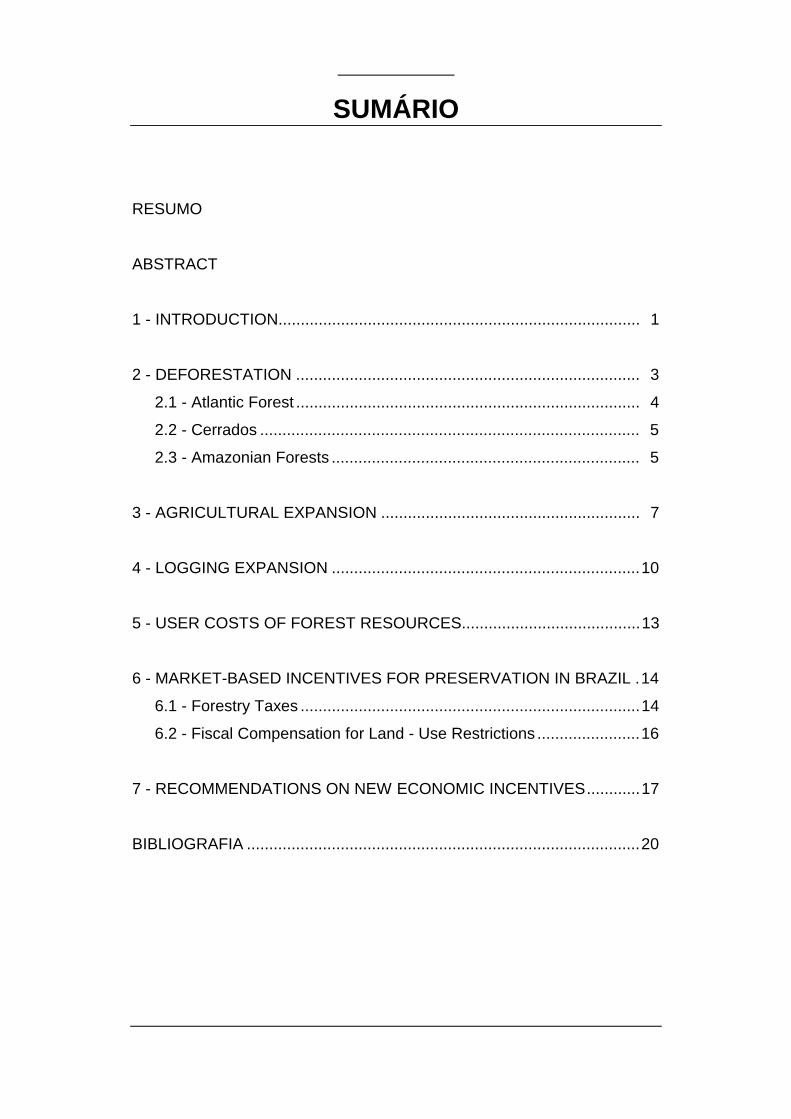
SUMÁRIO
RESUMO
ABSTRACT
1 - INTRODUCTION................................................................................. 1
2 - DEFORESTATION ............................................................................. 3
2.1 - Atlantic Forest ............................................................................. 4
2.2 - Cerrados ..................................................................................... 5
2.3 - Amazonian Forests ..................................................................... 5
3 - AGRICULTURAL EXPANSION .......................................................... 7
4 - LOGGING EXPANSION .....................................................................10
5 - USER COSTS OF FOREST RESOURCES........................................13
6 - MARKET-BASED INCENTIVES FOR PRESERVATION IN BRAZIL .14
6.1 - Forestry Taxes ............................................................................14
6.2 - Fiscal Compensation for Land - Use Restrictions .......................16
7 - RECOMMENDATIONS ON NEW ECONOMIC INCENTIVES............17
BIBLIOGRAFIA ........................................................................................20

RESUMO
A economia da biodiversidade neste texto será analisada como os fatoresindutores ao desmatamento no Brasil que ameaçam os recursos da biodiversidadee, portanto, o principal objeto de análise será o padrão de uso dos recursosflorestais no país. Alguns destes fatores somente poderão ser removidos casoajustes estruturais na economia ocorram para corrigir as desigualdades de renda, aconcentração fundiária e a fragilidade institucional das agências ambientais.Entretanto, conforme será discutido, o uso de instrumentos econômicos na gestãoambiental poderá mitigar estes fatores indutores e alterar a tendência aodesmatamento e as perdas de biodiversidade.

ABSTRACT
This paper focuses on the role of economic factors inducing deforestation inBrazil and thereby threatening biodiversity, giving particular attention to theexploitation pattern of forest resources in Brazil. Some economic factors cannotbe easily reverted since reversion would require long-term structural adjustmentsto alleviate social inequalities, to accomplish a satisfactory land tenure reform andto solve renumeration issues inhibiting human resource enhancement ingovernmental agencies. However, there is still room to introduce economicincentives in order to mitigate the current trend towards deforestation andbiodiversity losses.

THE ECONOMICS OF BIODIVERSITY IN BRAZIL: THE CASE OF FOREST CONVERSION
1
1 - INTRODUCTION
One may define biodiversity at three levels: genetic diversity, species diversity andecosystem diversity.1 In the case of Brazil, diversity at each of these levels isextremely important and rich (see Box 1). Consequently, Brazil’s environmentallegislation has established numerous legal norms and rules restricting land use inforests, fragile areas of water catchment, estuaries, dunes and so on. In addition, strictcontrols on hunting, fishing and capture of endangered species are in place. A ban onfurther clearing of the remaining Atlantic Forest, the most altered forest ecosystem,was recently established. Moreover, logging activities and other wood-based activitiesmay only be licensed if they comply with reforestation plans supplying woodconsumption equivalents. Conservation units, first established by the Forest Code of1930, correspond today to almost 18% of national territory if indian reserves arecounted. Recently, the Environment Ministry created a national programme to supportresearch and information dissemination (see Box 2).
However, legal instruments to protect biodiversity have not been sufficient tocounteract the economic dynamics of forest conversion and water pollution.2 Thehealth of aquatic fauna and flora is a significant concern in light of water pollutionlevels from household, industrial and agricultural sources [see Seroa da Motta (1996and 1995)], but water pollution control policies can be ineffective if forests are beingquickly cleared. Therefore, we will here consider deforestation issues to be the maincontributing factor to biodiversity losses in Brazil. The paper will focus on the role ofeconomic factors inducing deforestation -- thereby threatening biodiversity -- and theexploitation pattern of Brazil’s forest resources.
Deforestation in Brazil is caused mainly by agricultural and logging activities.Expansion of these activities into open access areas has been very active despite legalrestrictions and enforcement actions. Apart from institutional limitations preventingeffective enforcement of norms and rules, deforestation of important ecosystems isalso a result of several economic factors, namely:
(i) A highly concentrated land tenure system where small farms (with less than 10hectares (ha)) cover less than 3% of the total farming area while the share of big farms(with more than 10,000 ha) is above 40%. Additionally, very low average productivitylevels per unit of area under this system of land concentration creates incentives forcontinuous forest clearance.
(ii) A high concentration of personal income, with 66.1% of total income accruing tothe top 20% of wage-earning families, while just 2.3% accrues to the lowest 20percent.3 Such inequality creates an immense surplus of low-income workers ready toseek occupations in frontier areas.
1See Biodiversity Unit (1995) for a discussion on this taxonomy.2Due to lack of data, overfishing and poaching, which are also important causes of biodiversity losses in Brazil, will not bediscussed in this paper.3See Bonelli and Ramos (1993).

THE ECONOMICS OF BIODIVERSITY IN BRAZIL: THE CASE OF FOREST CONVERSION
2
(iii) A credit and fiscal system that favors agricultural activities that have no regard forsoil agroecological features or managerial practices, resulting in an inappropriatereplication of agricultural technologies in areas with distinct ecological conditions.
(iv) Land reclamation and taxation rules based on land use (e.g., area allocated tofarming) which encourage and legalise clearing.
(v) High wood values in frontier areas which give logging activities an important rolein financing clearing and in taking advantage of legal licensing for clearing4.
(vi) Regional development programmes in frontier areas based on road constructionwhich, although mostly phased out, has contributed immensely to stimulatingeconomic activities and promoting migration flows.
Some of these factors cannot be easily reverted since reversion would require long-term structural adjustments to alleviate social inequalities, to accomplish a satisfactoryland reform and to solve remuneration issues inhibiting human resources enhancementin governmental agencies. However, as will later be discussed, efforts to changeeconomic incentives still have a significant role to play in mitigating the current trendtowards deforestation and biodiversity losses.
The next section presents specific indicators of deforestation in three important forestecosystems in Brazil, namely the Atlantic Forest, Cerrados and the Amazonian Forest.Sections 3 and 4 discuss the role of agricultural and logging activities in deforestationin Brazil. Section 5 presents very crude and limited estimates of forest user costs.Section 6 describes and analyses three existing market-based instruments applied inBrazil to promote biodiversity preservation. The final section makes a number ofrecommendations for economic incentives for biodiversity protection, from changes inthe assignment of property rights for forest exploitation to credit incentive criteria foragricultural activities.
4 See Seroa da Motta (1993) for a detailed discussion of the Forest Code in Brazil.

THE ECONOMICS OF BIODIVERSITY IN BRAZIL: THE CASE OF FOREST CONVERSION
3
BOX 1 - Biodiversity in BrazilOccupying a total area of 8,511,996 km2 between 5°16’N and 33°44’S, Brazil has a broad climatic andgeomorphologic variety. This variety is responsible for the presence of several important biomes andecosystems, which lodge about 10% to 20% of the world’s known living species. Among them, a largenumber is unique to Brazil, and many probably remain yet undescribed. It has been estimated that about2 million plant, animal and microorganism species exist in Brazil.
The most important biomes in Brazil are the Amazonian rainforest and deciduous forests in the north,the eastern coast moist forest (known as Mata Atlântica), the savannah areas (Cerrado) in the center, thethorn forest (Caatinga scrubs) in the northeast and north, the Pantanal wetlands in the mid-west and thepine forests and the Pampa fields in the south. Also deserving attention are the wet riparian forest innorth-western Amazonia (Campinarana), the coastal mangroves, sand dunes and salt marshes, alltransition zones and many small areas where special combinations of climate, altitude and soilbackground produce singular ecosystems. Some of these great biomes were heavily damaged by humanactivities, such as the Mata Atlântica and the southern pine forests. Today, the agriculture frontieradvances over large Cerrado areas in central Brazil and over some areas in Amazonia, especially in theRondônia and Pará states.
According to the Brazilian Fund for Biodiversity (FUNBIO), Brazilian flora comprises about 55,000described species, a number that representing 22% of world’s total (FUNBIO, 1995). Brazil has therichest palm (approximately 390 species) and orchid (2,300 species) flora. Brazilian fauna is also verydiverse, totalling nearly 6,000 vertebrate species. Among them, over 3,000 fish, 1,573 bird, 502amphibian, 468 reptile and 394 mammal species have been described. These figures correspond toabout 17% of total bird species and to 10% of all known amphibians and mammals. Brazilianinvertebrate fauna are also among the world’s most diverse, and the identification process is still incourse.
Some native Brazilian species already have economic significance, such as many hardwood trees, therubber tree, brazilian nuts, manioc and cashew. Pharmacological use of Brazilian species is growingsteadily, and its economic potential is limitless. About 40% of Brazilian GNP comes fromagroindustries, 4% from forestry and 1% from fisheries. Biodiversity activities, such as fishing andforest extractive activities employ more than 3 million people, and 17% of energy productionnationwide comes from sugarcane alcohol and fuelwood. However, Brazilian agriculture relies mostlyon exotic species, such as coffee, soybean, orange and sugarcane. About 31% of Brazilian exports comefrom these products. Almost all cattle bred in the country consists of bovine cattle and poultry that arenot native species and that feed (in the case of cattle) on African grasses. Even silviculture relies mostlyon foreign eucalyptus and pines.
The potential of Brazilian biodiversity remains almost untapped due to the lack of basic research andthe prevailing production system that hampers alternative uses for species. Currently, a significanteffort is being made on research to unveil new uses of biodiversity products in the country. There are inBrazil more than 300 M.Sc. and 150 Ph.D. level courses on biologically-related issues. In addition, theworld’s greatest tropical conservation units are located in Brazil, including the most complete tropicalgermoplasm bank.
2 - DEFORESTATION
This section presents some indicators reflecting the degree of deforestation in the mainecosystems in Brazil. The analysis will be focused on the Atlantic Forests, theAmazonian Forests and Cerrados, where data is available due to the ecological andeconomic importance of these areas. Not only do they have the richest biodiversity,but they also occupy economically dynamic regions of the country.5
5The Caatinga is also rich in biodiversity and plays an important role in the climatic conditions in the semi-arid northeasternregions of Brazil.

THE ECONOMICS OF BIODIVERSITY IN BRAZIL: THE CASE OF FOREST CONVERSION
4
2.1 - Atlantic Forest 6
As can be seen in Table 1, considering the country as a whole, the area now coveredby Atlantic Forest vegetation is only about 8% of the total original area. The AtlanticForests are, by far, the most threatened ecosystem in Brazil. This alarming situationsparked the introduction of a 1990 law forbidding any kind of activity which may leadto deforestation in areas covered with this vegetation. In addition, major efforts arebeing made to create and implement conservation units in the remaining areas topreserve the biodiversity values of this ecosystem.
The regional distribution of the Atlantic Forest shown in Table 1, predominant in thesouthern states, coincides with the regional development pattern which historicallywas characterized by agricultural and industrial development. Forest conversion hasbeen a result of economic expansion, particularly in the last fifty years.
Table 1
Atlantic Forest Original and Remaining Areas — 1990 (Ha)
States Original Forest Area Remaining Forest Area
ha ha %
Bahia 11 575 425 1 267 478 11.0
Espírito Santo 4 000 000 402 392 10.1
Minas Gerais 30 356 792 876 504 2.9
Paraná 16 782 400 1 503 098 7.6
Rio de Janeiro 4 294 000 896 234 20.9
Santa Catarina 9 571 647 1 527 794 16.0
São Paulo 20 450 000 1 731 472 8.5
Rio Grande do Sul 11 202 705 656 717 4.0
Total 108 232 969 8 861 689 8.2
Sources: SOS Mata Atlântica (1993) and May & Rocha (1995).
In the last twenty years, the expansion of the agricultural frontier also took place,following the same development model adopted in the southern regions, in the centraland northern regions of the country where the Cerrados and the Amazonian Forestsare located, respectively. That expansion resulted in large areas of forest conversion.This was due first to the highly concentrated income and land tenure distributionexisting in the country, which encouraged migration. Second, and not less important,occupation of these regions was determined by ambitious regional developmentprogrammes.
6See SOS Mata Atlântica (1993) and May and Rocha (1995) for details on this deforestation process.

THE ECONOMICS OF BIODIVERSITY IN BRAZIL: THE CASE OF FOREST CONVERSION
5
2.2 - Cerrados
The occupation of Cerrados by agricultural activities is very manifest. According todata from the latest agricultural census (1985), an area of 50.7 million ha had beenconverted to cropping and livestock. More recent projections from the World WildlifeFund indicate that almost 40% of the original Cerrados area, or approximately 70million ha, has already been converted, reflecting an annual deforestation rate of0.77% in the period 1985-94 (WWF, 1994). To give this agricultural occupation amore tangible dimension, the total area that had been converted in Cerrados prior to1985 was already bigger than the territory of Spain.
The massive conversion in such a short period can be explained mainly by thefavourable credit system offered to the agricultural sector in the region where ruralsouthern families migrated to avoid the increasing land prices exacerbated byconcentrated land tenure in their original regions. Since transport costs are high inthis remote area, the region has intensified its activities to cash crops and cattleraising. The quality of soil in the region has demanded highly intense chemical inputpractices, producing obvious threats to biodiversity.
2.3 - Amazonian Forests 7
Economic activities in the Amazonian region were mostly undertaken in cycles due tofluctuation of external demand for commodities of the region, installation ofcolonisation settlements and governmental development programmes and policies.
Prior to the invention of rubber vulcanisation in 1839 and its subsequent worldwidecommercialisation, exploitation of the region only involved some extractive goods andsparse agricultural activities such as cocoa plantations. After the emergence ofvulcanisation, rubber extraction became the main activity until its decline after WorldWar I with the expansion of Asian production. During this period, Japaneseimmigrants in the states of Pará and Amazonas introduced jute and spice cultivation.The rubber cycle in the region was also responsible for Henry Ford’s initiativecreating rubber plantation activities in the region from 1927 to 1945 to supply theAmerican market. With the launching of “Operation Amazonia” in 1966, livestockactivities were encouraged in the region by governmental policies, though withoutsignificant impact on forest occupation. Following Henry Ford’s example, anotheragroforestry complex was established in the Jari River basin in the state of Pará. Foreconomic reasons, this project was transferred to Brazilian owners in 1982 withgovernment financing.
However, it was only during the 1970s that the federal government began ambitiousprogrammes of roads, mineral poles, colonisation and fiscal incentives for crop andlivestock activities which greatly diversified the region’s production and generated aprocess of rapid urbanization with significant migration flows from the southern partsof the country. Discoveries of large mineral deposits created the conditions conduciveto the arrival of thousands of mineral prospectors.8 All of these actions in the region
7See Seroa da Motta (1993) for a complete review of past and current issues in Amazonian deforestation.8 It is estimated that around six hundred thousand mineral prospectors are living in the region today.

THE ECONOMICS OF BIODIVERSITY IN BRAZIL: THE CASE OF FOREST CONVERSION
6
caused a rapid deforestation process which consequently also affected the localcommunities such as the indians and those pursuing extractive activities.
While the positive economic and distributive results of this occupation are unclear, theresult in terms of deforested area is pronounced. Deforestation in Amazonia cannotbe measured on the basis of remaining area because it is a recent frontier region withan area four times bigger than the original Atlantic Forests. In fact, the actualAmazonian Region covers almost 50% of the country area. Table 2 presentsdeforestation rates for Amazonia. As can be seen in this table, when recent occupationwas its the peak in 1978-89, annual deforestation was occurring at a rate of 0.54% oran equivalent area of 21,000 ha. At this rate, the region would have been totallydeforested in 130 years.
In the late 1980s, the deforestation rate declined to 0.30% or less than 11,000 ha peryear. Economic recession and the consequent lack of public and private resources tomaintain the costly development programmes, along with increasing monitoringforced by external pressure, can explain the decreasing deforestation rates. Thedownward trend was reversed again during the 1990s, when the deforestation rateincreased to 0.40% (almost 15,000 ha per year) in the period 1992-94. This reversaloccurred mainly in frontier states and may be explained by favourable agriculturalcredit and pricing policies and the federal environmental protection agency’s(IBAMA) budget cuts arising from macroeconomic stabilisation programmes.
Table 2
Annual Rate of Gross Deforestation in Legal Amazonia
STATES/AREA 78/89 88/89 89/90 90/91
Km²/year %/year Km²/year %/year Km²/year %/year Km²/year %/year
Acre 620 0.42 540 0.39 550 0.39 380 0.28
Amapá 60 0.06 130 0.12 250 0.23 410 0.37
Amazonas 1 510 0.10 1 180 0.08 520 0.04 980 0.07
Maranhão 2 450 1.79 1 420 1.30 1 100 1.03 670 0.63
Mato Grosso 5 140 1.01 5 960 1.31 1 020 0.90 2 840 0.64
Pará 6 990 0.62 5 750 0.55 4 890 0.47 3 780 0.37
Rondônia 2 340 1.11 1 430 0.78 1 670 0.91 1 110 0.62
Roraima 290 0.18 630 0.39 150 0.10 420 0.27
Tocantins 1 650 2.97 730 2.00 580 1.61 440 1.26
Legal Amazônia 21 130 0.54 17 860 0.48 13 810 0.37 11 130 0.30
Source: INPE (1996).
Although the total deforested area prior to 1992 is no more than 10% of the totaloriginal area (see INPE (1996)), this deforested area turns out to be approximatelyequivalent to the size of the United Kingdom.

THE ECONOMICS OF BIODIVERSITY IN BRAZIL: THE CASE OF FOREST CONVERSION
7
BOX 2 - Recent Governmental Initiatives on Biodiversity Protection in BrazilBiodiversity issues have been the subject of very important governmental actions which can be seen asnecessary steps toward more comprehensive policies in which economic incentives may be introduced.Their successful implementation will depend, however, on political will and institutional capability. Themost recent actions are the following:z UNCED Biodiversity Convention was approved by the Brazilian Congress in February 1994.z In December 1994, a Presidential Decree established the Brazilian Biological Diversity Programme(PRONABIO) which aims to promote joint actions between governmental agencies and civil society inorder to stimulate research (including inventories), international cooperation and disseminationactivities on biodiversity issues and problems (including a national network). In the Programme’sSteering Committee, half of the twelve seats are allocated to non-governmental representatives. So far,PRONABIO has two funding mechanisms. FUNBIO (The Brazilian Fund for Biodiversity), mainlydevoted to private actions, is funded with US $20 million from the Global Environment Facility (GEF)and run by a committee composed of businessmen, scientists, NGOs and environmental agencies. Theother fund is PROBIO (Pro-Biodiversity), which also has US $20 million, is coordinated by CNPq (TheNational Research Council), and focuses primarily on research activities.z An economic and ecological diagnosis of Amazonia was recently released, the indicators from whichwill be used as a zoning tool for activity licensing and policy orientation.
Very recently, in August 1996, the Environment Ministry sent a bill to the NationalCongress to limit the legal area for agricultural clearing in the Amazonian Forest toonly 20% of farming area. In addition, the bill bans the exporting of mogno and virolawoods for a period of two years. The bill has been facing strong opposition from smalllandowners in the region arguing that the bill induces land concentration, and fromlarge landowners arguing that it creates a barrier for profitable farming. Woodexporters also claim that it will lead to severe losses. While it is very early to predictthe result of this political dispute, these measures can be seen as the first steps towardreorienting forest exploitation to non-agricultural activities and sustainable logging.The future trend of deforestation in this region will depend mainly on political andeconomic conditions which at this point favor the diminution of factors inducingdeforestation. A radical change in land property rights assignment and theintroduction of economic incentives for sustainable activities, as will be laterdiscussed, can play an important role in slowing the deforestation process.
3 - AGRICULTURAL EXPANSION
As has been discussed, agricultural expansion is a very important factor in forestconversion in Brazil. Apart from the application of sustainable practices inagricultural activities, one effective way to mitigate biodiversity losses and rationaliseforest conversion is to induce agricultural expansion according to the agroecologicalfeatures of soils. That is, expansion should be directed toward areas where soils aremore appropriate to cropping and livestock, and where ecosystems will be lessaffected.
In doing so, agricultural activities can attain higher levels of productivity with lowerintensity of chemical inputs and soil losses, thereby reducing expansion over virginforests. As will be further discussed, this does not seem to be the agricultural patternof soil use in Brazil.

THE ECONOMICS OF BIODIVERSITY IN BRAZIL: THE CASE OF FOREST CONVERSION
8
A study on agroecological features of Brazilian soils was carried out by EMBRAPA(1991)9 in which areas are classified according to their appropriate uses, such ascropping, livestock and extractive activities/preservation10. The main criteria todefine these features were (i) ecosystem fragility and (ii) investments required topursue agricultural activities. The ecosystem fragility concept adopted by EMBRAPA(1991) is somewhat vague in terms of biodiversity, although it intends to captureecosystem uniqueness and singularity and resilience to anthropic actions.
Table 3 presents areas in each region of Brazil according to the appropriateagroecological soil uses indicated in EMBRAPA (1991), the current uses of soil anddifferences between appropriate and current uses. Cropping and livestock uses wereestimated from areas identified in the latest agricultural census (1985), including allproductive areas. Extractive activities/preservation current uses were defined in thestudy as areas officially devoted to conservation units, indian reserves and privateforests within farms.
The differences between appropriate and current uses in Table 3 offer a goodindication of the sustainability of agricultural expansion in Brazil and its impacts onecosystems. First, it can be seen that the area occupied by livestock activities, in thecountry as a whole, exceeds by about 800,000 km² the area suitable for them. Morethan 90% of this excess activity takes place in the North and Central Regions wheremost recent deforestation is occurring. That is, except in the Northeast Region, cattleraising is occupying inappropriate areas and, therefore, is responsible for theconversion of fragile ecosystems either through livestock expansion itself or bypushing cropping towards inappropriate areas.
An impressive area suitable for crops of about 1.6 million km² for the country as awhole is still available. It is important to note that appropriate areas available forcropping in southern regions are twice as big as in the North Region. That is, ifagroecological features are taken into account, the current expansion of agriculturalactivities towards Amazonia cannot be recommended.
BOX 3 - Soil Erosion Costs in BrazilSoil protection is one important ecosystem service with a sensitive market value. Due to Brazil’scontinental size and variety of soil, soil erosion costs cannot be easily estimated on a national basis. Fordifferent regions, physical soil loss estimates have varied from 9.5 to 179 tons per ha. The most recentand lowest estimate was presented in Cavalcanti (1995) corresponding to 6.77 ton/ha for the SãoFrancisco River Basin. This region is characterized by very diversified agricultural activity, includingirrigated and subsistence cropping and extensive areas of pasture. The same study calculated that theestimated Sao Francisco River Basin soil losses would be equivalent to US $32.16 in nutrient losses,i.e., the cost of nutrient reposition per hectare. Since this estimate is a lower-limit and the regionsomewhat reflects the Brazilian agricultural profile, multiplying the national agricultural area by thisestimate and deducting it from the current farming fertiliser expenditure will allow one to arrive at aconservative and impressive national value for total soil erosion cost of US $5.9 billion or 14% of thenational agricultural product.
9EMBRAPA is a state-owned company undertaking agricultural research.10In fact, the classification is broader, but the categories have been aggregated here to allow for calculations.

THE ECONOMICS OF BIODIVERSITY IN BRAZIL: THE CASE OF FOREST CONVERSION
9
Tabela 3 no arquivo Td0433t

Table 3SOIL USE PATTERN IN BRAZILSOIL AVAILABILITY BRAZIL NORTH NORTHEAST CENTRAL SOUTHEAST SOUTH BY AGROECOLOGICAL FEATURES km² % km² % km² % km² % km² % km² %Cropping 2 509 072 29.48 314 987 8.71 271 335 17.44 1 093 553 58.42 460 154 50.39 369 043 66.80Livestock 996 649 11.71 68 958 1.91 407 610 26.20 0.00 389 209 42.62 130 872 23.69Preservation 2 632 189 30.92 1 136 958 31.42 665 954 42.80 712 876 38.08 63 843 6.99 52 558 9.51Extractive activities 2 374 030 27.89 2 097 437 57.97 211 051 13.56 65 542 3.50 0.00 0.00Total 8 511 940 100.00 3 618 340 100.00 1 555 950 100.00 1 871 971 100.00 913 206 100.00 552 473 100.00
CURRENT SOIL USESCropping * 873 296 17.22 93 531 4.99 327 227 35.59 120 735 11.03 161 762 22.63 170 041 36.30Livestock 1 791 884 35.34 208 764 11.15 351 481 38.23 592 441 54.12 424 874 59.43 214 323 45.75Conservation Units 484 570 9.56 404 026 21.57 20 707 2.25 26 087 2.38 21 346 2.99 12 405 2.65Indian Reserves 1 030 634 20.33 869 153 46.41 20 648 2.25 138 143 12.62 793 0.11 1 897 0.41Private Forests 889 836 17.55 297 303 15.87 199 254 21.67 217 350 19.85 106 173 14.85 69 756 14.89Total 5 070 221 100.00 1 872 777 100.00 919 318 100.00 1 094 756 100.00 714 948 100.00 468 422 100.00
DIFFERENCE BETWEEN SOIL AVAILABILITY AND CURRENT USESCropping 1 635 776 19.22 221 456 6.12 -55 892 -3.59 972 818 51.97 298 392 32.68 199 002 36.02Livestock -795 235 -9.34 -139 806 -3.86 56 129 3.61 -592 441 -31.65 -35 665 -3.91 -83 451 -15.11Extractive activities ** 2 601 178 30.56 1 663 913 45.99 636 396 40.90 396 838 21.20 -64 469 -7.06 -31 500 -5.70Total 3 441 719 40.43 1 745 563 48.24 636 632 40.92 777 215 41.52 198 258 21.71 84 051 15.21
*Including all productive areas.**Including conservation units, indian reserves and privates forests.Source: EMBRAPA (1991), 1985 IBGE (Brazilian Institute of Geography andStatistics) Agricultural Census and IBGE (1994).

Table 5Round Wood Production in Brazil - 1980-1990/91
Region Native Forests (% total Brazil) Planted Forests (% total Brazil) TOTAL
1980 1990/91* Variation** 1980 1990/91* Variation** 1980 1990/91* Variation**
1000m³ % 1000m³ % % 1000m³ % 1000m³ % % 1000m³ % 1000m³ % %
North 19 880 9.2 54 312 22.5 173.2 1 392 2.4 1 586 2.1 13.9 21 272 7.8 55 898 17.6 162.8Northeast 74 496 34.6 73 872 30.7 -0.8 n.a. n.a. 1 498 2.0 n.a. 74 496 27.2 75 370 23.8 1.2Central 21 631 10.0 23 472 9.7 8.5 353 0.6 4 401 5.8 1146.7 21 984 8.0 27 873 8.8 26.8Southeast 64 665 30.0 63 217 26.2 -2.2 48 510 82.8 44 000 58.0 -9.3 113 175 41.3 107 217 33.8 -5.3South 34 804 16.2 26 095 10.8 -25.0 8 346 14.2 24 428 32.2 192.7 43 150 15.7 50 523 15.9 17.1
Brazil - Total 215 476 100.0 240 968 100.0 11.8 58 601 100.0 75 913 100.0 29.5 274 077 100.0 316 881 100.0 15.6Source: Prado (1995).(n.a.) = not available* Average value of 1990/91. ** Variation between 1990/91 and 1980 values.

THE ECONOMICS OF BIODIVERSITY IN BRAZIL: THE CASE OF FOREST CONVERSION
10
The huge surplus in appropriate areas for cropping in the Central Region becomesrelatively less impressive if one considers the large deficit of appropriate areas forlivestock. Results from Table 3 also show the complete lack of protected areas whenextractive activities/preservation uses are compared. While in southern regionsconservation units and private forests are already matching their agroecological areas,in the rest of the country a great proportion of land deemed appropriate for extractiveactivities and preservation is used for other purposes. In the case of the North Regionand Cerrados, less than 50 percent of the areas recommended for conservation andextractive activities are already under conservation, whereas in the Northeast Regionthis percentage drops to less than 28 percent.
In summary, agricultural expansion in Brazil needs to be reoriented in terms of spatialdimension to reflect soil suitability if ecosystems in Brazil are to be preserved.
4 - LOGGING EXPANSION
The importance of logging expansion in the deforestation process can be shown inTable 4 where estimates of effective and potential wood commercial production fromagricultural cleared areas11 in the Amazonian region are presented for the period 1975-91 based on Prado (1995). Effective extraction refers to the wood output currentlygenerated, while potential production is an estimate of the wood output which couldbe generated. The ratio of these two output values provides a good indicator of howmuch wood extraction is taking place through clearing for agricultural purposes.
Table 4Potential and Effective Wood Extraction in the North Region of Brazil - 1975-1991
Time Period Converted Forest Area(ha/year)
(A) Potential WoodExtraction fromConverted Area
(1000 m³)
(B) Effective WoodExtraction (1000m³)
B/A
1975/78 1 619 300 32 386 4064 0.13
1978/80 2 323 550 46 471 11476 0.25
1980/88 5 940 987 118 820 19539 0.16
1989/91 2 064 600 41 292 39087 0.95
Source: Prado (1995).
11”Cleared areas” refers to those observed during in the period, and includes legal and illegal clearing.

THE ECONOMICS OF BIODIVERSITY IN BRAZIL: THE CASE OF FOREST CONVERSION
11
From Table 4 one may note that ratio values increased from 13 % in 1975 to 95% in1991. That is, wood extraction is currently associated with clearing for agriculturalpurposes. Wood extraction output finances clearing, and legal licenses for agriculturalclearing legalise wood extraction. This synergy generates private economic value todeforested lands much higher than the value that could be derived either frompreservation activities or sustainable agroforestry. For instance, field surveys intraditional Amazonian logging areas presented in Almeida and Uhl (1995) estimatedfinancial rates of return higher than 300% for wood extraction and processingactivities for logging undertaken in rent lands (i.e., land for agricultural clearing).When supplies of wood come from sustainable logging undertaken in lands onlydevoted to logging (and not to clearing), rates of return drop to approximately 20%.Saw mills can thus count on low-cost legal and illegal supplies of wood, allowing fora very profitable financial return with which sustainable logging cannot compete.
This association was also previously observed in the Atlantic Forest. In fact, loggingactivities in Brazil are still mostly relying on native forests from which more than 75%of Brazil’s round wood is produced. As can be seen in Table 5, the share in thenational wood production coming from Amazonian wood production (North Region)increased from 9.2% in 1980 to 23.1% in 1991. This impressive share increase clearlyreveals the growing importance of Amazonian wood species in logging activities.

THE ECONOMICS OF BIODIVERSITY IN BRAZIL: THE CASE OF FOREST CONVERSION
12
Tabela 5 no arquivo Td0433t

THE ECONOMICS OF BIODIVERSITY IN BRAZIL: THE CASE OF FOREST CONVERSION
13
5 - USER COSTS OF FOREST RESOURCES
It has not yet been possible to make accurate estimates of biodiversity values in Brazil.In fact, it was only very recently that government actions were taken to determine theprecise economic dimension of ecosystem services, biological resources and socialbenefits arising from biodiversity in the country12 in order to guide biodiversitypolicies and generate indicators for project evaluation.
Seroa da Motta (1994) and May (1993) present crude estimates of extractive outputforegone due to forest conversion in terms of commercial product values which couldhave been generated on a sustainable basis if clearing had not occurred. The coststream was measured as sustainable production of wood and extractive productsforegone in each cleared hectare of converted forest according to each major Brazilianecosystem. Deforestation generates a lump-sum value in, say, wood, but it foregoes asustainable flow of wood production which would take place if vegetation werepreserved. This sustainable flow was calculated based on the forest’s naturalvegetative growth and valued at extractive product and wood export prices.
Table 6 presents these estimates for the period 1971-85. Percentage values reflect theoutput foregone as a proportion of agricultural value added per converted hectare. Theannual differences follow this rule: the higher the ratio between total converted area tototal remaining area in each ecosystem, the higher is the proportion of user cost tovalue added.
Table 6Output Foregone Values of Extractive Forest Resources in Brazil due to Deforestation - 1971-85(US$000)Years Wood Product (1) Non-Wood Products (2) Total (1)+(2) % of Converted Land Value Added1971 137 984 38 250 174 233 128.21972 150 468 n.a. 150 468 97.11973 192 622 52 933 244 955 140.81974 316 127 52 309 368 436 190.91975 400 987 56 878 459 665 183.91976 399 021 40 780 439 401 146.31977 425 469 39 041 463 510 136.41978 364 806 41 262 406 089 114.71979 348 760 48 805 397 567 108.01980 286 808 38 172 324 981 104.51981 232 051 26 679 258 730 103.71982 167 324 32 518 199 835 113.71983 161 552 35 741 197 293 108.21984 154 929 38 992 193 731 102.61985 93 592 25 617 119 610 61.2
Sources: Based on estimates from Seroa da Motta (1994) and May (1993).Notes: (1) Round wood.(2) Extractive products: latex, chestnut, babaçu, palm cabbage and carnauba.
12As a first step, the author’s institute (IPEA) has been recently assigned to elaborate guidelines on these evaluation issues.

THE ECONOMICS OF BIODIVERSITY IN BRAZIL: THE CASE OF FOREST CONVERSION
14
Proportions of user cost to value added were thus far above 100% during the 1970swhen deforestation of Atlantic Forests and Cerrados was intense, substantiallyreducing the original areas. From 1980 onwards deforestation was concentrated inthe Amazonian Forest but did not significantly reduce the original forest areas; hencethe sharp decline in user cost proportion, which reached approximately 61% in 1985.Due to lack of data on agricultural expansion it was not possible to calculate currentvalues from 1985 afterwards. In light of the already discussed increase indeforestation in the Amazonian Forest region, it is reasonable to assume that user costproportion values will tend to be much higher in the 1990s.13
In summary, biodiversity commercial values in Brazil are impressive when comparedto agricultural alternative land-uses. Taking into account other biodiversity benefits,one could estimate still higher values. However, such estimates would need to berefined and further explored.
6 - MARKET-BASED INCENTIVES FOR PRESERVATION IN BRAZIL 14
Three important economic instruments have been applied in Brazil in order to controldeforestation. Two of them are basically forestry taxes and the other is fiscalcompensation. In the case of frontier areas such as Amazonia and Cerrados, theapplication of taxes is very difficult to enforce due to their immense territory, lack ofinfrastructure and low population density. Therefore, one may expect that suchinstruments can play only a limited role in creating market-based mechanisms forbiodiversity control, but can also be a very powerful means of raising revenue tostrengthen institutional capacity. Fiscal compensation, on the other hand, involves ofvery low administrative costs and creates an actual incentive for those engaged inpreservation measures. A very brief description of these existing instruments in Brazilwill be presented including some recommendations for their revision.
6.1 - Forestry Taxes
6.1.1 - The National Forestry Reposition Fund
The Brazilian Forestry Code states that those exploiting or utilising forestry rawmaterials are obliged to undertake forestry reposition of appropriate species equivalentto the exploiter’s consumption level. This requirement covers logging as well asconsumption of charcoal and firewood with unknown origin. Since 1978, however, a
federal norm15 allows for those consuming less than 12,000 m3 of forest raw materialper year the option of paying a deforestation contribution instead of investing inreforestation. The rationale for this contribution is based on the assumption thatreforestation by small consumers is costly to monitor and also to undertake (i.e., thereare no benefits from economies of scale). A governmental fund created from
13In Seroa da Motta (1994) and May (1993) the values in Table 6 were discounted according to depletion periods in whichforests would be completely deforested. These estimates reflected user cost values as proposed by El Serafy (see Seroa da Motta(1994)). Since user costs are low when resources are abundant, and in light of the large portion of the Amazonian Forest that isstill remaining, the user cost values were only around of 2-3% of converted land value added.14This section is based on Seroa da Motta and Reis (1994).15This norm was created by the former Brazilian Institute for Forestry Development which is today part of the federal EPA (IBAMA).

THE ECONOMICS OF BIODIVERSITY IN BRAZIL: THE CASE OF FOREST CONVERSION
15
deforestation contributions, on the other hand, would generate enough revenue toimplement a more efficient forest reposition, taking into account social and politicalconcerns.
The contribution, which may be regarded as a type of tax, was not primarily conceivedas an economic incentive to curb deforestation and, in fact, did not work out as such.
Apart from the institutional limitations of IBAMA (The Brazilian FederalEnvironmental Agency) to carry out an effective collection of that contribution, whichis legally under its responsibility, the level of the contribution value seems to be themain explanation for the failure of this instrument to change forestry productionpatterns in Brazil. Even if mainly intended for funding purposes, the contributioncould have led to private decisions to invest in reforestation, so long as it was highenough to do so. But that was clearly not the case, since all those consuming less thanthe legal limit have opted to pay the contribution rather than invest in reforestation.
Moreover, the value was fixed at a constant level of approximately US $4 per m3 ofwood which generated a revenue of 7 million dollars in 1992. Although indexed toprice inflation, the real value has been kept constant over time without accounting forreforestation price escalation. In addition, there is no variation in contributionrequirements according to species (except for non-wood species) and region.
Finally, funds from the contribution have mostly been used for budgetary purposes ofIBAMA rather than for reforestation activities. Only recently has the governmentallowed part of this revenue to be diverted to states and NGOs willing to invest inforest activities in municipalities where reforestation may either create economicopportunities or recover deforested areas.
6.1.2 - Forestry Tax in Minas Gerais State
Since 1968 the state of Minas Gerais has imposed a forest tax in order to finance thestate Forest Institute in its activities of monitoring and enforcement. Taxation isexercised on all forest products -- from logs and firewood to roots and seeds --consumed or transformed in economic activities. Taxes are also collected in the caseof legal deforestation. The tax is set at 3% of the value of forest products and iscollected by the State Treasury.
For almost ten years the tax legislation was subject to judicial dispute since it wasunderstood that the state value added tax (ICMS) was supposed to fulfil any budgetaryneed, and that the forest tax therefore constituted a double taxation. The outcome ofthis dispute was a change in the law introducing a tax level varying according to eachtype of forest product. In addition, reductions up to 50% of the tax due can now begranted to those undertaking reforestation which generates forest productionequivalent to their consumption level. The alterations made the tax acceptable andturned it into what may almost be called a deforestation tax. Since it varies withspecies and products, the tax allows the Forest Institute to penalise certain uses byaltering the percentages. That approach, in fact, was the strategy adopted in December1993, when a new table of percentages was published. Use of charcoal and firewoodfrom native forests, an important source of deforestation in the state, was charged,respectively, four and five times more than previously, whereas the values of other

THE ECONOMICS OF BIODIVERSITY IN BRAZIL: THE CASE OF FOREST CONVERSION
16
items have increased no more than 100%. It is estimated that a revenue of US $11million was collected in 1993.
Although it is very early to assess, the pattern of wood consumption in the state seemsto be changing. The share of wood supply from native forests in total woodconsumption for charcoal production has declined from 70% in the 1980s to almost50% in recent years16. The resulting environmental effects are, however, hard todetermine. On the one hand, an increase in reforestation initiatives has been inevidence; on the other hand, it is also known that part of the state demand for woodhas been met by supply from other neighbouring states where such heavy taxes are notapplied.
Such supply deviation, apart from inevitable losses of forest resources in the supplyregions, has promoted rapid urbanization in remote areas without adequateinfrastructure. The Minas Gerais forestry tax can thus be seen as a typical case oftaxation producing distortions in spatial resource use. However, it is worth noting thatthis tax was primarily conceived as a cost-recovery instrument. Its use as an economicincentive is a matter of the political will currently prevailing in the state; thedetermination of tax levels is still made on ad-hoc basis without detailed modellingregarding changes in the user’s economic behaviour.
6.2 - Fiscal Compensation for Land — Use Restrictions
Four states in Brazil -- Paraná, São Paulo, Rio de Janeiro and Minas Gerais -- areimplementing fiscal compensation for their municipalities in which Protected Areasand/or water supply sources are located. Since 1992, in Paraná state, 1.25% of therevenue from the state tax on goods and services (ICMS, a type of value-added tax) isdiverted to 112 municipalities where restrictions on land use exist in order to protectecosystems and water supply sources. This transfer payment is deducted from the 25%share of the state tax revenue due to the municipalities, which is mainly distributedaccording to the value-added generated in the municipality. The payment can be seenas an attempt to place an economic value on protection activities in order to create anincentive for their conservation. Distribution of the compensation allowance is setaccording to the importance of the protected area, as determined by the degree ofrestriction stated in the creation decree. The state environmental protection agency(Environmental Institute of Paraná) then evaluates the compliance of themunicipalities with the required environmental quality in the protected areas todetermine the amount to be paid. The compliance monitoring system is still underimplementation, but it already has successfully encouraged several municipalities toconsider activities more appropriate to their natural endowment, such as ecotourism.In addition, the compensation allowance has been seen as promoting investments insanitation and other urban infrastructure services.
In São Paulo, similar legislation was approved at the end of 1993 for areas dedicatedto ecosystem protection and generation of hydroelectricity with a more modest fiscalcompensation equivalent to 0.2% of the ICMS revenue. Since the measure is veryrecent and small in fiscal magnitude, it is difficult to predict the resulting impacts on
16It must be noted that technological changes and enforcement of sanctions have also contributed to the decline.

THE ECONOMICS OF BIODIVERSITY IN BRAZIL: THE CASE OF FOREST CONVERSION
17
municipalities. However, another law related to preservation areas is under discussionin the state legislative and is expected to offer higher incentive levels. In the state ofRio de Janeiro, similar legislation was also presented in 1993 for approval by the statelegislative. The 8% level initially set in the legislation was reduced to 3% (i.e., thepercentage of the ICMS revenue due to municipalities which will be deducted andredirected). The distribution criteria would promote preservation of importantecosystems and water supply sources as well as the implementation of environmentalplanning in these municipalities.
Very recently in the state of Minas Gerais a similar percentage of 3% was set,although the distribution criteria will be more comprehensive, with revenue going tomunicipalities with programs for sanitation coverage and solid waste collection.Estimated annual revenue arising from the fiscal compensation program in the fourstates may reach as high as US $157 million.
7 - RECOMMENDATIONS ON NEW ECONOMIC INCENTIVES
As has been discussed, agricultural and logging activities are the main economicfactors leading to deforestation. To change this deforestation pattern, one couldrecommend the following set of economic incentives:
1) The introduction of very solid sustainable criteria for agricultural credit incentives.In fact, the government has recently proposed legislation entitled Protocolo Verde(Green Protocol) which states that any public loan or credit incentive for any kind ofeconomic activity can only be granted if the applicant can prove (through thepossession of a green certificate) that he is complying with environmental legislationand has no outstanding environmental sanction.17 In the case of industrial, utility andcommercial activities, environmental licensing and documentation on sanctionedfirms regulated by environmental agencies will be the key instruments to assign thisgreen certificate. However, for agricultural activities there is no such environmentalregulation and farms, as previously discussed, are not obliged to comply with anyestablished technology or agroecological criteria. As noted in the legislation, theProtocolo Verde is intended to define technical parameters and rules for agriculturalactivities which may be applied by governmental banks.18
2 - Sustainable management practices for logging are already in the law. However, asalready discussed , they do not succeed since plentiful wood supply is available fromagricultural expansion. Even with the introduction of sustainable criteria toagricultural practices, forest clearing will continue to be a major source of woodsupply. However, removing clearing criteria for titling and taxation is also regarded asan incentive for land concentration19. A promising policy alternative for forestry is asystem of public concessions20, similar to those applied in countries like Canada and
17In fact, existing legislation already included this restriction, although it did not mention sanctions and pre-operation licensingwas accepted as environmental compliance. Protocolo Verde can thus be understood as a regulation pertaining to this existinglegislation.18Economic-ecological zoning described in Box 2 can be applied in this case.19Private forest reserves can be exempted from property tax if owners comply with very strict forestry standards. Since land taxlevels are not high nor fully enforced, and represent less than 0.01% of GDP, such incentive is of very limited scope.20This sub-section is based on Seroa da Motta (1994).

THE ECONOMICS OF BIODIVERSITY IN BRAZIL: THE CASE OF FOREST CONVERSION
18
Sweden, where long-term leasing contracts of large tracts of forests are made, byinternational auction, to private corporations. Contract clauses specify acceptedconditions for the use of land and natural resources. Non-compliance with sustainablepractices defined in concession licensing would be subject to sanctions and concessiontermination. Supervision and monitoring of these concessions could be shared withNGO’s.
This scheme would be particularly feasible, for example, in Amazonia where therestill is a large availability of unclaimed areas -- more than 25 percent according torecent surveys of the Agrarian Reform Institute (Incra). Apart from the difficulties inmanaging serious technical procedures (e.g., managerial practices, concession periods,stumpage fees), such a change in property right assignments may face numerouspolitical barriers.
3) Besides forestry concessions, such fiscal instruments as the forestry tax used inMinas Gerais can be of immense importance in regulating current forestry activity ifapplied nationwide. The tax should be defined on the basis of marginal user costcurves in order to induce users to change their behaviour and to shift to a desirablelevel of forestry activity or preservation. Since forestry taxes are somewhat difficultto design and to implement due to institutional weaknesses in the environmentalagencies, the revenue generated should be partially earmarked to those agencies toimprove their enforcement capacity and to forestry scientific research centres whererelevant expertise can be developed.
4) Fiscal compensation plans for municipalities drawn from value-added tax revenuealready in place in some Brazilian states could be applied nationally. Similiarly,compensation levels could also be set on the basis of output foregone in restrictedareas, rather than only on the basis of area and enforcement criteria.
5) Very generous credit and fiscal incentives for technology (R&D) are offered toBrazilian companies in Brazil. Notwithstanding, in most sectors those firms have notsucceeded to increase substantially their R&D expenditure. The case of biodiversityresearch is not an exception. It seems, then, that these incentives should also beoffered for joint-ventures with international companies, although the issues ofproperty rights sharing and compensation still present barriers for such an alternative.
Finally, it must be noted that public awareness regarding biodiversity issues is ofparamount importance in sustaining political support for biodiversity policies in Braziland elsewhere. In this particular field, economic science has no normativeprescription. International programmes addressing global ecological problems can beof great importance for Brazil given the country’s immense biodiversity values.However, these programmes should consider significant compensation paymentsrather than donation procedures, considering the ecological services rendered to theworld by Brazil. So far, international programmes have attempted to impose donors’environmental standards and behaviour on countries like Brazil without any regard to(i) cultural parameters and (ii) structural constraints which are, as this paper hasdiscussed, the main factors affecting biodiversity losses. In light of these factors,compensation should take place without being necessarily linked to specificconservation projects, since such compensation can be a valuable source of

THE ECONOMICS OF BIODIVERSITY IN BRAZIL: THE CASE OF FOREST CONVERSION
19
government revenue to revert the economic factors leading to deforestation in Brazil.Moreover, decoupling compensation and specific, often misguided, donor countryconservation requirements will also generate positive public opinion and create morefavourable conditions for the desirable pursuit of coherent biodiversity policies.

THE ECONOMICS OF BIODIVERSITY IN BRAZIL: THE CASE OF FOREST CONVERSION
20
BIBLIOGRAFIA
ALMEIDA, O.T. and UHL, C. Identificando os custos de usos alternativos do solopara o planejamento municipal da Amazônia - o caso de Paragominas (PA).In:MAY, P. (org.). Economia Ecológica, Ed. Campus, 1995.
BIODIVERSITY UNIT. Biodiversity and its value, Biodiversity Series, Paper 1,Biodiversity Unit, Department of the Environment, Sport and Territories,Canberra, Austrália, 1995.
BONELLI, R. and RAMOS, L. Distribuição de renda no Brasil: avaliação dastendências de longo prazo e mudanças na desigualdade desde meados dos anos70, Texto para discussão 288, IPEA/DIPES, January 1993.
CALDEIRON, S.S. (coord.). Recursos Naturais e Meio Ambiente: Uma Visão doBrasil, IBGE, Rio de Janeiro, 1993.
CAVALCANTI, J.E.A. Valoração econômica das perdas de solo no Vale do Rio SãoFrancisco, Relatório Final de Consultoria, CODEVASF/FAO, 1995.
EMBRAPA. Delineamento Macroecológico do Brasil, Serviço Nacional deLevantamento e Conservação de Solos Rio de Janeiro, EMBRAPA, 1991.
FUNBIO. Cerimônia de instalação do Conselho deliberativo do Fundo Brasileiro paraa Biodiversidade - FUNBIO. Speech notes, mimeo, Fundação Getúlio Vargas, Riode Janeiro, 1995.
IBGE. Cadastro de Unidades de Conservação do Brasil, Diretoria de Geociências,IBGE, 1994.
INPE. Levantamento das Áreas Deflorestadas na Amazônia Legal no Período de1991-94, Instituto de Pesquisas Especiais, 1996.
MAY, P. Perdas ambientais devido ao desmatamento no Brasil. IPEA/DIPES, mimeo,Rio de Janeiro, 1993.
MAY, P. and ROCHA, R. A Mata Atlântica do cacau: sistemas de produção e meioambiente no Sul da Bahia, FGB/BIRD, mimeo, Rio de Janeiro, 1995.
PRADO, A. C. Exploração Florestal Madeireira, Documento 1, FUNATURA/ITTO,1995.
SEROA DA MOTTA, R. Past and current policy issues concerning tropicaldeforestation in Brazil, Kiel Working Paper 566, The Kiel Institute of WorldEconomics, March 1993.
__________. Política e gestão florestal. In: O Brasil no Fim do Século: Desafios ePropostas para a Ação Governamental, IPEA, Rio de Janeiro, 1994.

THE ECONOMICS OF BIODIVERSITY IN BRAZIL: THE CASE OF FOREST CONVERSION
21
__________. Indicadores ambientais no Brasil: aspectos ecológicos, de eficiência edistributivos, Texto para Discussão 403, IPEA/DIPES, February 1996.
__________. Water quality and policy in Brazil: estimates of health costs assiciated tosanitation services and simulation of pollution taxes applied in river basins. SérieSeminários 8/95, IPEA/DIPES, July 1995.
__________. Estimativas de depreciação do capital natural no Brasil. In: Perspectivasda Economia Brasileira - 1994, IPEA/DIPES, 1994.
SEROA DA MOTTA, R. and REIS, E.J. The application of economic instruments inenvironmental policy: the Brazilian Case, OECD/UNEP, Workshop on The Useof Economic Policy Instruments for Environmental Management, Paris, 26-27May, 1994.
SOS MATA ATLÂNTICA Atlas da Evolução dos Remanescentes Florestais eEcossistemas Associados do Domínio da Mata Atlântica no Período 1985-1990,Fundação SOS Mata Atlânica/INPE, São Paulo, 1993.
WWF Cerrado: Impactos do Processo de Ocupação, World Wildlife Fund, Brasília,1995.


Ipea – Institute for Applied Economic Research
PUBLISHING DEPARTMENT
CoordinationCláudio Passos de Oliveira
SupervisionEverson da Silva MouraReginaldo da Silva Domingos
TypesettingBernar José VieiraCristiano Ferreira de AraújoDaniella Silva NogueiraDanilo Leite de Macedo TavaresDiego André Souza SantosJeovah Herculano Szervinsk JuniorLeonardo Hideki Higa
Cover designLuís Cláudio Cardoso da Silva
Graphic designRenato Rodrigues Buenos
The manuscripts in languages other than Portuguese published herein have not been proofread.
Ipea Bookstore
SBS – Quadra 1 − Bloco J − Ed. BNDES, Térreo 70076-900 − Brasília – DFBrazilTel.: + 55 (61) 3315 5336E-mail: [email protected]


Composed in Adobe Garamond 11/13.2 (text)Frutiger 47 (headings, graphs and tables)
Brasília – DF – Brazil


Ipea’s missionEnhance public policies that are essential to Brazilian development by producing and disseminating knowledge and by advising the state in its strategic decisions.