The Economics of Ecosystems and Biodiversity: Report for ... · The Economics of Ecosystems and...
24
1st Global Business of Biodiversity Symposium London, 13 July 2010 The Economics of Ecosystems and Biodiversity: Report for Business Editors: Joshua Bishop (IUCN), Cornis van der Lugt (UNEP), Francis Vorhies (Earthmind), Linda Hwang (BSR), Mikkel Kallesoe (WBCSD), Nicolas Bertrand (UNEP), Sean Gilbert (GRI), William Evison (PricewaterhouseCoopers)
Transcript of The Economics of Ecosystems and Biodiversity: Report for ... · The Economics of Ecosystems and...

1st Global Business of Biodiversity Symposium
London, 13 July 2010
The Economics of Ecosystems and Biodiversity:
Report for Business
Editors:
Joshua Bishop (IUCN), Cornis van der Lugt (UNEP), Francis Vorhies (Earthmind),
Linda Hwang (BSR), Mikkel Kallesoe (WBCSD), Nicolas Bertrand (UNEP),
Sean Gilbert (GRI), William Evison (PricewaterhouseCoopers)

TEEB for Business (Deliverable 3)
1. Business, biodiversity and ecosystem services
2. Business impacts & dependence on biodiversity and
ecosystem services
3. Measuring & reporting biodiversity and ecosystem
impacts & dependence
4. Scaling down biodiversity & ecosystem risks to business
5. Increasing biodiversity business opportunities
6. Business, biodiversity and sustainable development
7. A recipe for biodiversity and business growth

Chap 1: Business, biodiversity and ecosystem services (BES)
• The value of nature is changing:
� Increasing scarcity of natural resources� Increasing visibility of ecosystem values� More demanding citizens, consumers and public policies� New technologies that add value to biodiversity & ecosystems
• All businesses are affected, directly or indirectly
• New and growing BES risks must be managed
• Just as climate change has stimulated new technologies, business models and markets, BES offer opportunities for investors and entrepreneurs
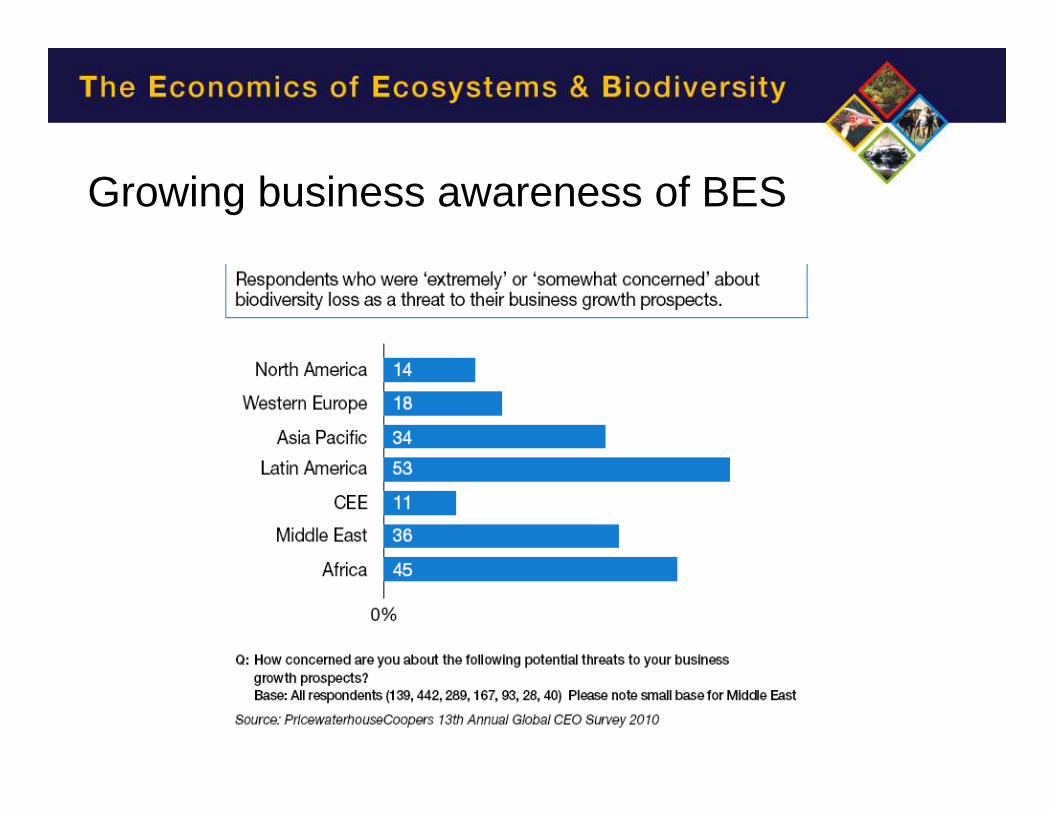
Growing business awareness of BES

Chap 2: Impacts and dependence
Millennium Ecosystem Assessment (2005)

Valuing business impacts on BES: Deforestation in China (Trucost plc)
Ecosystem service losses (1950-88)
US$12.2 Bn
Property loss from flooding 5.5%
Loss of river transport capacity 1.7%
Sedimentation of water bodies 0.3%
Desertification (crop yields) 7.7%
Reduced lumber output 7.9%
Loss of plant nutrients 16.7%
Reduced water runoff 27.2%
Reduced precipitation 33.0%
Source: Hongchang, W. (1997)

• Michigan blueberries: US$ 124 million/year, 90% reliant on pollination by bees at cost of US$ 1.5 million per year
• Domesticated bees threatened by hive collapse ()
• Operation Pollinator launched in 2009 in the USA and EU (13 countries)
• Restore native pollinators in agricultural landscapes by creating suitable habitat (field margins)
• Wild bees are natural ‘back-stop’ for managed hives
Valuing business dependence on BES: Blueberries in Michigan (Syngenta)

• BES information management and accounting systems
• BES in capital investment• Collecting & using BES information:
– product level– group level
• Recommendations– Technical– Market– Disclosure
Chap 3: Measuring & reporting BES impacts and dependence

Reporting BES impacts & dependence: Water reporting by SAB Miller
• Target: increase water productivity by 25% by 2015
• Potential savings: 20 billion litres of water/year

Top 100 companiesAnnual reports
Top 100 companiesSustainability reports
Don't produce sustainability report
No mention of biodiversity or ecosystems
Passing mention of biodiversity or ecosystems
Discuss approach to reduce impact on biodiversity
Identify biodiversity as a key strategic issue
Don't produce sustainability report
No mention of biodiversity or ecosystems
Passing mention of biodiversity or ecosystems
Discuss approach to reduce impact on biodiversity
Identify biodiversity as a key strategic issue
82%
12%
4% 2%
42%
23%
15%
9% 11%
Source: PwC input to TEEB Report for Business
More work needed on reporting
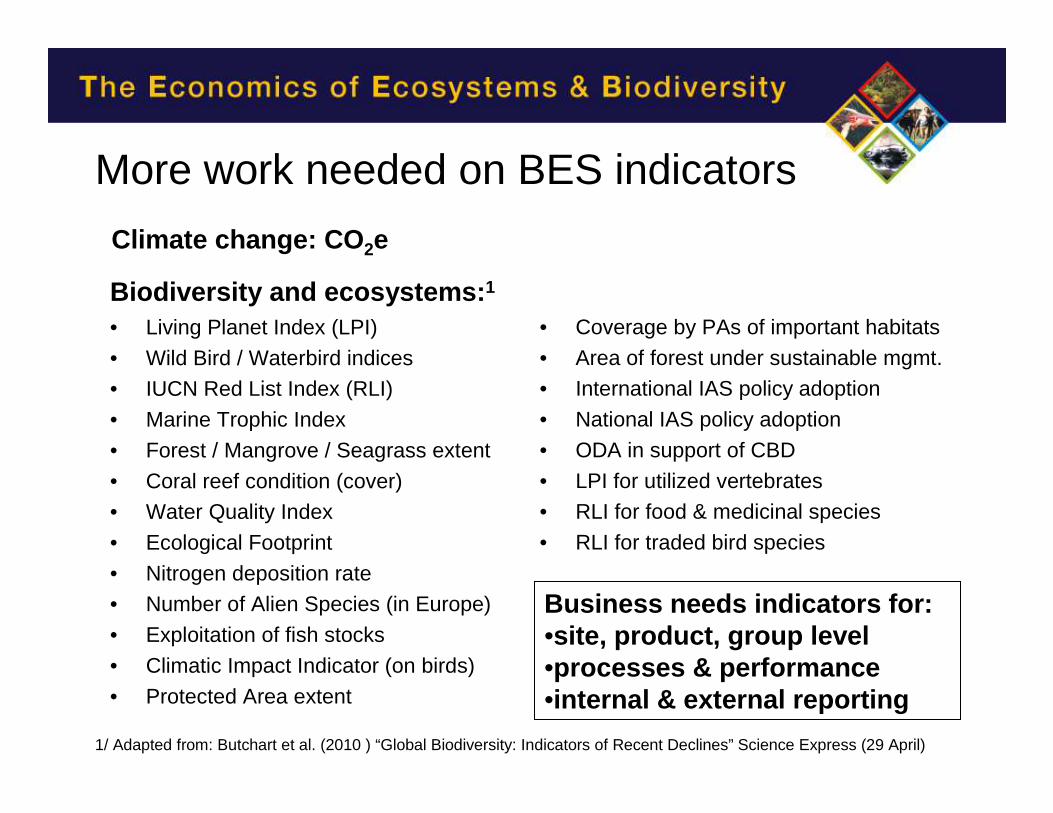
More work needed on BES indicators
Climate change: CO2e
• Coverage by PAs of important habitats
• Area of forest under sustainable mgmt.• International IAS policy adoption
• National IAS policy adoption
• ODA in support of CBD
• LPI for utilized vertebrates• RLI for food & medicinal species
• RLI for traded bird species
Business needs indicators for:•site, product, group level•processes & performance•internal & external reporting
Biodiversity and ecosystems:1
• Living Planet Index (LPI)
• Wild Bird / Waterbird indices• IUCN Red List Index (RLI)
• Marine Trophic Index
• Forest / Mangrove / Seagrass extent
• Coral reef condition (cover)• Water Quality Index
• Ecological Footprint
• Nitrogen deposition rate• Number of Alien Species (in Europe)
• Exploitation of fish stocks
• Climatic Impact Indicator (on birds)
• Protected Area extent
1/ Adapted from: Butchart et al. (2010 ) “Global Biodiversity: Indicators of Recent Declines” Science Express (29 April)

Drivers of improved BES reporting
• Stakeholder expectations– Global Reporting Initiative– Carbon Disclosure Project
– Forest Footprint Disclosure Project
• Accountancy standards– UK Environment Agency & ICAEW “Environmental
Issues and Annual Financial Reporting” (2009)
• Regulatory requirements– US Securities and Exchange Commission
“Guidance Regarding Disclosure Related to Climate Change” (February 2010)
• Potential extension to BES?

Chap 4: Scaling down biodiversity & ecosystem risks to business
• Integrated Biodiversity Assessment Tool– http://www.biodiversityinfo.org/ibat/
– GIS database for site-level risk assessment
– Based on World Database of Protected Areas, World Biodiversity Database, IUCN Red List of Threatened Species
• Business and Biodiversity Offsets Program– http://www.forest-trends.org/biodiversityoffsetprogram/
– Guidance on designing and implementing biodiversity offsets to ensure “no net loss”– Led by Forest Trends, Wildlife Conservation Society and Conservation International
• Certification and labelling– http://www.isealalliance.org/– Global hub for social and environmental standards
– Members represent fair trade, forest stewardship, organic agriculture, fisheries, etc.

Net benefits of wetland restoration: Aggregate Industries UK
• Proposed extension of existing quarry in North Yorkshire• Farming > sand and gravel extraction > wetland and lake• Potential benefits:
– Biodiversity GB£ 1.4 million (£53/ha/hh)– Recreation GB£ 356,000– Flood storage GB£ 224,000– Carbon storage GB£ 4,700
• Expected costs:– Lost agricultural output GB£ 722,000– Restoration & management costs GB£ 176,000
• Net benefits: GB£ 1.1 million (NPV) Source: Olsen & Shannon 2010

Chap 5:Increasing biodiversity business opportunities
Adding BES to existing business• Agriculture• Biodiversity mgmt services• Cosmetics• Extractive industries• Finance• Fisheries• Forestry• Garments• Handicrafts• Pharmaceuticals• Retail• Tourism
• New markets for biodiversity and ecosystem services
• Bio-carbon & REDD
• Biodiversity banking
• Enabling policy & tools


Biodiversity offsets and banking: Wetland mitigation banks in the USA
• Authorized under federal Clean Water Act• Developers must compensate for loss of wetlands• Most compensation is ‘in-kind’ and within the same
watershed as the damage• Developers can do it themselves or purchase wetland
‘credits’ from approved ‘banks’• 450+ approved wetland banks, most privately financed
on commercial basis• US market currently worth ~$2 billion/year
Source: Ecosystem Marketplace 2009

Enabling policy for markets for BES
• Subsidy reform (agriculture, fisheries, water, transport, etc)
• Tax credits and other incentives for conservation
• Certification and eco-labelling (voluntary / mandatory)
• Payment for Ecosystem Services (national, international)
• Environmental responsibility (EU Environmental Liability
Directive, damage assessment and compensation)
• Environmental trading schemes (REDD+, USA wetland and
species mitigation, Australia biodiversity banking)
• Public access to information (Global Reporting Initiative,
Carbon / Forest / Water footprint disclosure projects)

• Integrating BES and social development– Food security, health, human rights, labor rights, poverty reduction
• Business impacts on BES relevant to the poor
• Governance, property rights and benefit-sharing
Chap 6: Business, biodiversity and sustainable development

• Net Positive Impact (NPI) policy entails impact avoidance, mitigation, restoration and offsets
• Support for conservation project (60,000 ha lowland forest)• Potential benefits:
– Carbon storage US$26.7 million
– Wildlife habitat US$2.7 million
– Hydrological regulation US$760,000– Eco-tourism US$2.5 million
• Potential costs:– PA start-up and management US$3.2 million
– Lost agricultural output & NTFPs US$9.7 million
• Benefit-sharing with local communities (REDD revenue)
Aligning BES and development: Rio Tinto in Madagascar
Source: Olsen & Anstee (2010)

Chap 7: A recipe for biodiversity and business growth
• Millennium Ecosystem Assessment: Synthesis for Business• IUCN & WBCSD Handbook for Corporate Action• International Council on Mining and Metals• International Petroleum Industry Environmental Conservation Assoc.• Global Reporting Initiative• World Economic Forum / Global Agenda Council on Valuing Nature• In Good Company: German Business & Biodiversity Initiative• Canadian Business and Biodiversity Initiative• FRB/Orée Biodiversity Accountability Framework• Declaration of Biodiversity (Japan, Nippon Keidanren)• Guidelines for Private Sector Engagement in Biodiversity (Japan gov’t)
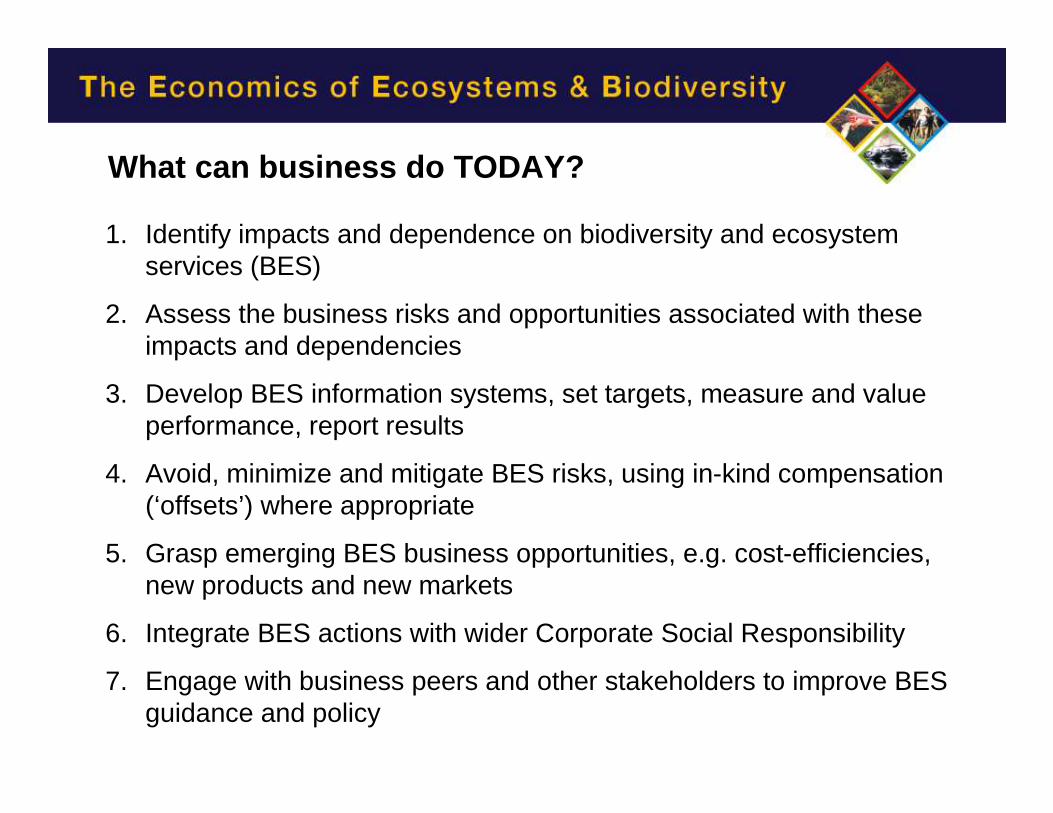
What can business do TODAY?
1. Identify impacts and dependence on biodiversity and ecosystem services (BES)
2. Assess the business risks and opportunities associated with these impacts and dependencies
3. Develop BES information systems, set targets, measure and value performance, report results
4. Avoid, minimize and mitigate BES risks, using in-kind compensation (‘offsets’) where appropriate
5. Grasp emerging BES business opportunities, e.g. cost-efficiencies, new products and new markets
6. Integrate BES actions with wider Corporate Social Responsibility
7. Engage with business peers and other stakeholders to improve BESguidance and policy

The TEEB for Business report is available at:
(www.teebweb.org)
Main TEEB funders:
Main D3 writers:
Deadline for comments and contributions:
6 September 2010