
THE ECONO:MICS OF ARTIFICIAL INSEMINATION REGULATIONS …
101
THE ECONO:MICS OF ARTIFICIAL INSEMINATION REGULATIONS IN THE EQUINE BREEDING INDUSTRY: MONOPOLY VERSUS TRANSACTION COSTS EXPLANATIONS by Valerie Anne Thresher A thesis submitted in partial fulfillment of the requirements for the degree of Master of Science m Applied Economics MONTANA STATE UNIVERSITY Bozeman, Montana December 1996
Transcript of THE ECONO:MICS OF ARTIFICIAL INSEMINATION REGULATIONS …

THE ECONO:MICS OF ARTIFICIAL INSEMINATION REGULATIONS IN THE EQUINE BREEDING INDUSTRY: MONOPOLY VERSUS
TRANSACTION COSTS EXPLANATIONS
by
Valerie Anne Thresher
A thesis submitted in partial fulfillment of the requirements for the degree
of
Master of Science
m
Applied Economics
MONTANA STATE UNIVERSITY Bozeman, Montana
December 1996

11·
APPROVAL
of a thesis submitted by
Valerie Anne 1bresher
This thesis has been read by each member of the thesis committee and has been found to be satisfactory regarding content, English usage, format, citations, bibliographic style, and consistency, and is ready for submission to the College of Graduate Studies.
Randal Rucker
Approved for the Department of Agricultural Economics and Economics
Douglas Young (Signature) Date
Approved for the College of Graduate Studies
Robert Brown (Signature) Date

iii
STATEMENT OF PERMISSION TO USE
In presenting this thesis in partial fulfillment of the requirements for a master's
degree at Montana State University-Bozeman, I agree that the Library shall make it
available to borrowers under rules of the Library.
If I have indicated my intention to copyright this thesis by including a copyright
notice page, copying is allowable only for scholarly purposes, consistent with "fair use"
as prescribed in the U.S. Copyright Law. Requests for permission for extended quotation
from or reproduction of this thesis in whole or in parts may be granted only by the
copyright holder.
Signature----------
Date

IV
ACKNOWLEDGMENTS
The reassuring encouragement and guidance I received from Dr. Randal Rucker
generated the academic and mental support that kept me focused. His consistent
dedication to both the project, and my well being, enabled me to complete this thesis in a
reasonable time frame. Dr. Daniel Benjamin contributed time and energy at all stages of
the project to ensure that the theories developed were logical and faithfully reflected in
the empirical analysis. The comments and thoughts of Dr. David Buschena forced me to
defend the theories presented and resulted in a significantly improved thesis.
I would like to thank Kathy Shank at the Keeneland Library in Lexington,
Kentucky, who spent many hours on the phone clarifying points of confusion about the
race horse industry. In addition, she suggested other contacts and allowed me to use her
name as a means of introduction. Also deserving of thanks are the breed registries and
stallion owners who responded promptly and throughly to my respective questionnaires.
I am especially grateful to Sheila Smith and Jan Chovosta for their computer
support at all hours of the day any day of the week, and to Lara Salazar for editorial
assistance.

v
TABLE OF CONTENTS
Page
LIST OF TABLES ................................................... VIt
LIST OF FIGURES . . . . . . . . . . . . . . . . . . . . . . . . . . . . . . . . . . . . . . . . . . . . . . . . . . viii
ABSTRACT .............. , . . . . . . . . . . . . . . . . . . . . . . . . . . . . . . . . . . . . . . . . . ix
1. INTRODUCTION .................................................. ·. 1
Purpose ......................................................... 1 Scope ......................................................... 1 Breed Registry Explanations for Restricting AI ......................... 2 Economic Explanations for Restrictions on AI . . . . . . . . . . . . . . . . . . . . . . . . . . 5 Organization of Chapter Topics . . . . . . . . . . . . . . . . . . . . . . . . . . . . . . . . . . . . . 5
2. GENERAL ECONOMIC OVERVIEW .................................. 7
Importance of the Equine Industry . . . . . . . . . . . . . . . . . . . . . . . . . . . . . . . . . . . 7 Development ofBreed Registries .......................... : . . . . . . . . . 8 Technological Development of AI ................................... 9
3. LITERATURE REVIEW ............................................ 13
Economic Framework . . . . . . . . . . . . . . . . . . . . . . . . . . . . . . . . . . . . . . . . . . . 14 Related Literature . . . . . . . . . . . . . . . . . . . . . . . . . . . . . . . . . . . . . . . . . . . . . . 16
4. THEORETICAL MODELS AND EMPIRICAL TESTS .................... 19
Opportunistic Behavior I: The Advent of Affordable DNA Genotyping ...... 19 Opportunistic Behavior II: Variations in Stud Fees ...................... 27 Monopoly Argument . . . . . . . . . . . . . . . . . . . . . . . . . . . . . . . . . . . . . . . . . . . . 31 Relative Versus Absolute Performance ....................... : . ...... 38 Relative Versus Abso'lure Performance 1: The Importance of Winning . . . . . . . 44 Relative Versus Absolute Performance II: Standardbreds Versus Thoroughbreds . . . . . . . . . . . . . . . . . . . . . . . . . . . . . . . . . . . . . . . . . . . . . . . . . 50 Extending the Monopoly Model to Include Alternative Explanations . . . . . . . . 54

Vl
5. USING AI TO IMPROVE ABSOLUTE PERFORMANCE IN OTHER LIVESTOCK INDUSTRIES ........................................ 61
AI and the Cattle Industry . . . . . . . . . . . . . . . . . . . . . . . . . . . . . . . . . . . . . . . . 61 AI and the Poultry, Swine and Sheep Industries ........................ 63 Rewards for Improving Absolute Performance . . . . . . . . . . . . . . . . . . . . . . . . . 64
6. CONCLUSIONS .................................................. 66
REFERENCES CITED ................................................ 69
BIBLIOGRAPHY ............................................. : ....... 72
APPENDICES ....................................... , .............. 77 Appendix A-Data for Opportunistic Behavior I: The Advent of
Affordable DNA Genotyping . . . . . . . . . . . . . . . . . . . . . . . . . . 78 Appendix B-Surnrnary Statistics, Data, and Additional Regression Results
for Opportunistic Behavior II: Variations in Stud Fees . . . . . . . 81 Appendix C-Surnrnary Statistics and Data for Relative Performance I:
The Importance ofWinning . . . . . . . . . . . . . . . . . . . . . . . . . . . . 84 Appendix D-Data for Relative Performance II: Standardbreds Versus
Thoroughbreds . . . . . . . . . . . . . . . . . . . . . . . . . . . . . . . . . . . . . 89 Appendix E-Surnrnary Statistics and Data for Combination Model . . . . . . . . . 91

Vll
LIST OF TABLES
Table Page
1. Adoption Dates of Artificial Insemination ................................... 3
2. Effect of the Discovery of PCR on Artificial Insemination Regulations .......... 26
3. Effect of Variations in Stud Fees on Artificial Insemination Regulations ......... 30
4. Ray and Grime Monopoly Model1985 Data ............................... 35
5. Ray and Grimes Monopoly Model1995 Data .............................. 36
6. Winning and Its Effect on Stud Fees ................................ · ..... 48
7. Faster Horses and Their Effect on Purses .................................. 54
8a Coefficients of Alternative Explanatory Variables .......................... 58
. 8b. CoefficientS of Alternative Explanatory Variables .......................... 59
Vlll
LIST OF FIGURES
Figure Page
1. 'Monopolist and Cost Reducing Technology ............ ~ ................... 37
2. Positional Externalities Associated with AI ................................ 41
3. Effective Cartel ...................................................... 42
4. 'Partial Cartel ........................................................ 43
5. Finish Times: Kentucky Derby and Kentucky Futurity ....................... 50

lX
ABSTRACT
Artificial insemination is a technological development that lowers the cost of producing livestock while providing a means for accelerating the development of genetic characteristics. The adoption of artificial insemination by the equine industry has been inconsistent across breed registries and varied over time. The question arises as to why any registry would resist the introduction of a technology that lowers the cost of production. Identification of the characteristics that influence the decision by a breed registry to place restrictions on the use of artificial insemination will provide economic reasons to explain why the restrictions exist.
Various explanations are hypothesized to provide a basis for empirical models. Regression analysis is run to test for the significance of the following factors; opportunistic behavior, monopoly power, and the importance of relative versus absolute performance. It is established that all three factors contribute to a registry's decision whether or not to impose restrictions on the use of artificial insemination.
There are two separate conclusions drawn from the results. Where opportunistic behavior (i.e. cheating) generates rewards not otherwise attainable, artificial insemination will be restricted. Where relative performance matters and a breed is able to exert monopoly power, artificial insemination will be restricted.

1
CHAPTER 1
INTRODUCTION
Purpose
This thesis examines economic reasons for restrictions on the use of artificial
insemination in the equine industry. When artificial insemination became a technological
option for horse breeders, mariy breed registries instituted some form of regulation
restricting its use. The regulations have been varied and dynamic, modified through time
as influencing factors change. It is the purpose of this thesis to determine the economic
forces that influence a registry's decision to restrict artificial insemination (AI).
Scope
At the outset, it was my intention to compare artificial insemination use and
regulations in the equine industry with the cattle industry. It quickly became apparent
that the use and regulation of artificial insemination in the equine industry varied across
breeds and over time. Further investigation revealed unexpected differences among
seemingly similar breeds. For example, two associations with almost identical purposes,
to promote the sport of horse racing, have completely opposite policies regarding the use
of artificial insemination. The United States Trotting Association, the ruling body for
Standardbreds, has never instituted any restrictions on the use of artificial insemination.
In sharp contrast, The Jockey Club, the ruling body for Thoroughbreds, has never, and

2
still has no intention of, permitting the use of artificial insemination. A meaningful
economic analysis comparing .the equine and cattle industries cannot be forthcoming
without first understanding the various artificial insemination regulations in the equine
industry. The equine industry proved sufficiently complex that this study focuses on
identifying the economic factors that determine artificial insemination regulations in
horse breeds. The adoption of AI in other livestock industries will be described and some
general conclusions will be drawn.
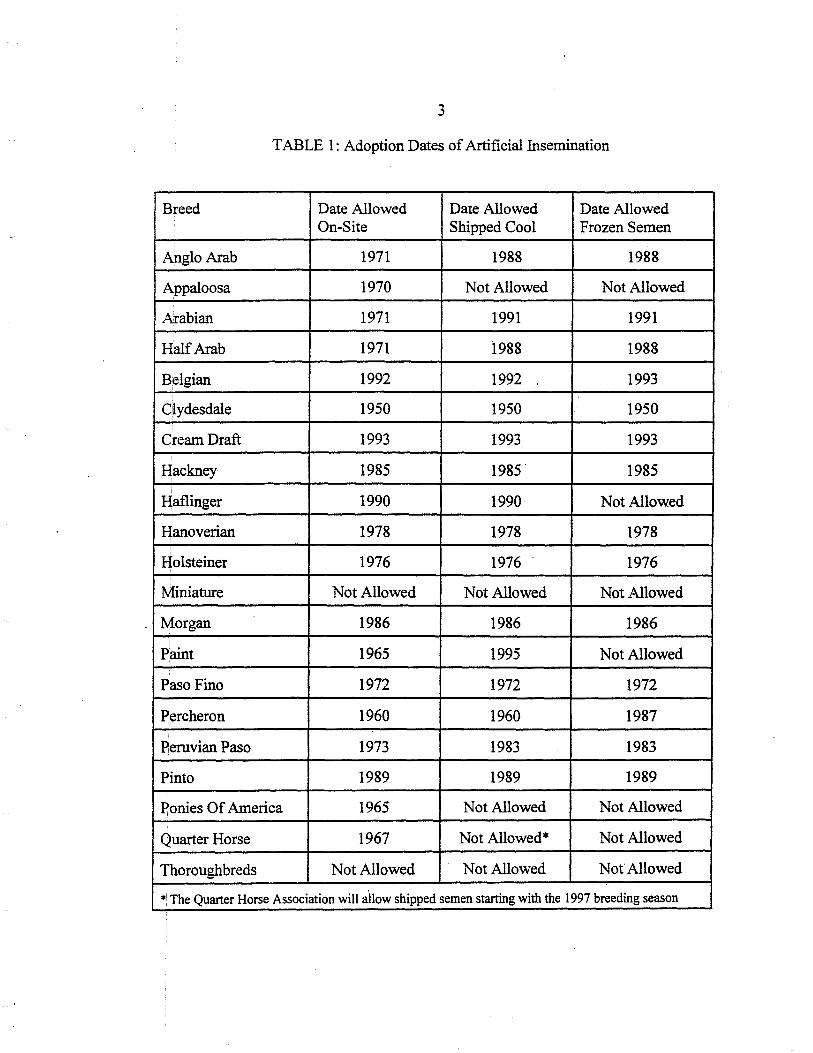
Each breed registry has acted independently when making decisions regarding
the use of AI by its members. There are three distinct types of AI and each are regulated
independently. The first, on-site, requires that the semen be collected from the stallion
and used immediately (within an hour) to inseminate a mare located on the premises. The
second, shipped cooled semen, allows for short-term storage of semen (three to four days)
before inseminating the mare. The third, frozen semen, can be stored for an indefinite
period of time before insemination. Table 1 (on the next page) illustrates the variation in
the adoption patterns of AI by equine breed registcies. Restrictions have not been static,
rather they have evolved and changed over time.
Breed Registry Explanations for Restricting AI
There are two common reasons given by breed registries justifying restrictions
on AI. First, artificial insemination makes it too difficult to maintain accurate lineage
records. Second, artificial insemination narrows the genetic base of a herd population and
will lead to excessive inbreeding.
3
TABLE 1: Adoption Dates of Artificial Insemination
Breed Date Allowed Date Allowed Date Allowed On-Site Shipped Cool Frozen Semen
Anglo Arab 1971 1988 1988
Appaloosa 1970 Not Allowed Not Allowed
Arabian 1971 1991 1991
Half Arab 1971 1988 1988
Belgian 1992 1992 1993
Ciydesdale 1950 1950 1950
Cream Draft 1993 1993 1993
Hackney 1985 1985 1985
Haflinger 1990 1990 Not Allowed
Hanoverian 1978 1978 1978 I
Holsteiner 1976 1976 1976
Miniature Not Allowed Not Allowed Not Allowed
Morgan 1986 1986 1986
Paint 1965 1995 Not Allowed
Paso Fino 1972 1972 1972
Perc heron 1960 1960 1987
Peruvian Paso 1973 1983 1983
Pinto 1989 1989 1989
Ponies Of America 1965 Not Allowed Not Allowed
Quarter Horse 1967 Not Allowed* Not Allowed
Thoroughbreds Not Allowed Not Allowed Not Allowed
* The Quarter Horse Association will allow shipped semen starting with the 1997 breeding season

4
Breed registries originally developed as groups of horse owners voluntarily
agreed to collaborate to maintain accurate lineage records. These groups were interested
in breeding horses with specific characteristics to perform specialized tasks. Repeatedly
matching stallions and mares who possess similar desirable traits virtually ensures a
population of horses bred to excel at a specific task. When AI was introduced as a
technological option for breeders, many registries worried that shipped semen would lead
to errors of identity, and consequently incorrect pedigree recordings as a result of
mislabeled semen vials, whether accidental or fraudulent. Requiring natUral cover, a
physical mating between the stallion.and the mare, guarantees (with witnesses) that any
resulting foal is the product of a specific stallion. The true origin of shipped semen is
essentially unknown and many registries were not willing to base their stud books on the
integrity of the senders: instead they prohibited shipped semen.
The second common justification for AI regulations is that unrestricted use of AI
will narrow the genetic base of the herd population. With artificial insemination, for
reasons to be discussed later, popular s~lions can sire a larger proportion of the herd
population. Consequently, assuming demand for foals is constant, the resulting annual
foal crops will carry less genetic variation. Whether this will weaken or strengthen
bloodlines is ardently debated without any firm scientific conclusions available. 1
1For further discussions on the argument of whether genetic narrowing will weaken or strengthen bloodlines see, Ray (1987,1988,1989) Ray and Grimes (1991), Walther (1995), Biles (1995), Aronson, Henry, Fraser (1994), Amann et al (1987).

5
Economic Explanations for Restrictions on AI
Three economic explanations for AI restrictions will be proposed and empirically
tested in this thesis. The first examines a monopoly based argument. 2 The monopoly
argument states that requiring natural cover effectively restricts output. If the annual
supply of foals is kept below the laissez faire market-clearing quantity, then prices will be
higher than their 'true' value and current horse owners will accumulate rents. This
argument, as documented, is problematic. There are inconsistencies in the logic and a
section in Chapter 4 strives to resolve the conflict.
The second explanation is that registries restrict AI to reduce opportunistic
behavior. This argument hypothesizes that as opportunities for successful fraudulent
transactions decrease, AI restrictions relax.
The third argument explores the effects of relative versus absolute performance.
The prediction from this argument is the more important relative performance is to horse
owners the greater Will be the incentive of the breed registry to impose AI restrictions.
Organization of Chapter Topics
This thesis begins with a general overview, in Chapter 2, of the equine industry.
The structure of the equine industry is discussed along with a technical overview of
artificial insemination technology and its development. In Chapter 3, a review of literature
provides the background for possible economic explanations of restrictions on the use of
artificial insemination. Chapter 4 presents the empirical results of theoretical inodels that
2Ray (1987), Ray and Grimes (1991), Coelho and McClure (1987).

6
models that have been developed using the data to be found in Appendices A, B, C, D
and E. Several hypotheses are proposed and then tested for the purpose of identifying the
economic rationale underlying breed registry regulations that prohibit the use of AI by
their members. A brief history on the development of artificial insemination in other
livestock industries, particularly the cattle industry, will be giv~n in Chapter 5.
Concluding remarks are the subject of Chapter 6.

7
CHAPTER2
GENERAL ECONOMIC OVERVIEW
Importance of the Equine Industry
According to the American Horse Council's "1995 Horse Industry Directory" the
equine industry is a $15.2 billion industry, accounting for over ten percent of the gross
national product of the Agriculture, Forestry, and Fisheries sector of the U.S. economy.
Additionally, in 1993, an estimated $14 billion was wagered at equine race tracks,
contributing $493 million in state tax revenues. Based on these numbers, it would appear
that the equine industry is a significant contributor to the national economy.
All horses can be placed into one of two categories, grade or registered. A grade
horse is one whose lineage is unrecorded. A registered horse has a traceable linage that is
recorded with a breed registry. Because the production of grade animals is not
constrained by breed registries this thesis will focus exclusively on registered animals.
The equine industry is composed of 144 breed registries and associations. Each
registry, and each association, operates independently to pursue its own objectives, but
collectively these self-regulated organizations determine the direction of growth of the
equine industry. Growth resulting from the development of new technologies will occur
when the perceived benefits to the decision makers of adopting the technology are greater
than the costs associated with change. Simultaneous adoption of a technological

8
innovation throughout the industry is unlikely because the varied objectives of each
organization will determine their own specific costs and benefits.
Development of Breed Registries
Each breed registry promotes specific traits and characteristics that constitute its
ideal horse. Whether based on blood lines, color, or performance, each registry sets strict
guidelines to establish for itself those characteristics that constitute an eligible h<;>rse. For
example, the Pinto registry specifies that to be eligible for registration "horses two years
or 0lder must exhibit at least 15 square inches of white with underlying pink skin". The
Jockey Club, the breed registry for Thoroughbreds, requires that ''the foal's pedigree
authentically traces in all its lines to horses recorded in The American Stud Book or a
foreign stud book recognized by the Jockey Club". 1 Simply stated, only foals born from a
stallion and a mare who are both registered with the Jockey Club are eligible for
registration with the Jockey Club.
The governing structure of each registry varies, but for the majority of registries
the individual horse owners control the decision making process: either directly through a
majority vote, where each member has one vote, or indirectly through an elected board of
directors. The one important (for this thesis) exception to this generalization is the
Jockey Club. The Jockey Club establishes, and enforces, the rules and regulations
binding Thoroughbred breeders. The Jockey Club is a corporation consisting of
1Pinto information is from the Pinto Horse Association of America, Inc. and Thoroughbred information is from the Jockey Club's "The American Stud Book: Principle Rules and Requirements".

9
anywhere from ninety-five to one hundred "members". Current members nominate new
members who must receive a majority vote of the whole membership to be elected. New
members are nominated based on their long term contribution to the Thoroughbred
indust.I"f. The entire organization is governed by a nine person Board of Stewards which
is elected from the membership of the Jockey Club. Individual Thoroughbred owners,
who are not members of the Jockey Club, exert no influence, by means of an electoral
process, on the members of the Jockey Club or the policies it adopts.
Technological Development of AI
The perpetuation of a breed depends on the success of its breeding program.
Mare owners wishing to produce a foal seek out a stallion that possesses desirable traits.
The advent of artificial insemination and shippable semen had the potential to
dramatically alter the traditional breeding regimen. It is much cheaper to send a vial of
semen via an overnight courier service than it is to transport a horse. Shipped semen
allows mare owners to make breeding decisions based on genetic suitability without
regard to geographical convenience.
The optimal breeding schedule for an average mature stallion is one ejaculation
every other day. Stallions that are used more often for an extended period of time
experience· dramatic drops in their fertility rates and often become bored, exhausted and
2"Long term contribution to the Thoroughbred industry" is a rather vague qualifier applied without any specific determinants. The members are usually race horse owners, breeders, trainers or some combination of the three.

10
unmanageable. 3
Traditionally mares contracted for breeding are transported to the stallion. On
average, a mare needs two and a half inseminations per oestrus cycle, for two cycles, to
become pregnant with a conception rate of ninety percent. 4 Mares who have traveled
long distances will usually remain at the stallion's facility until it is determined that the
mare is pregnant.
The equine breeding season starts in February and is effectively over by June.5
These dates do not coincide with the horses' natural breeding season, which would run
from early May through August, but rather result from an industry wide practice that
standardizes January 1 as the birth date of every horse. A horse born in February and one
born in September are both classified as being one year olds as of January 1 of the year
following their birth. This age standardization has effectively limited the breeding season
to no more than 150 days. Breed registries that sanction shows and races offer events
categorized by age. In a show or race open to two year olds, a horse born six months later
than the rest of his competitors will be severely disadvantaged, both in its physical
maturity and the amount of training it has (or has not yet) received. Not until about the
fifth year is this difference in physical and mental maturity no longer a significant factor.
The limited time frame of the breeding season pressures stallions, who are
3Blanchard and Varner (1996).
4Barth (1993)
5The gestation period for a horse is eleven months.

11
booked to cover forty mares (not an unreasonable number for a good stallion), to be bred
more than once a day. Artificial insemination reduces the breeding pressures put on a
stallion because one ejaculation can be used to inseminate multiple mares. Depending on
the, fertility of the stallion's semen one ejaculation can be split to inseminate up to twenty
mares. Semen collected from a stallion every other day for the one hundred and fifty day
breeding season can inseminate many more than forty mares. Moreover, the ability to
freeze semen enables breeders to collect and store it throughout the year for use during
the breeding season.
The first historical mention of the possibility of birthing a foal conceived using
artificial insemination dates back to the twelfth century: legend tells of an Arabian prince
who stole semen from an enemy kingdom's prized stallion. The scientific records of
successful conceptions using artificial insemination date much later-toward the end of
the nineteenth century.
By the mid 1930s scientists in Russia and England had developed the technology
. necessary to collect, store and ship bull semen. Stallion semen proved to be more fragile;
it did not maintain its fertility after being cooled. It was not until the early 1960s that
artificial insemination using shipped cooled semen became a technological option for
horse breeders. Conception rates, using "correctly'' cooled semen, are comparable to
natural service: 50-60 per cent with two inseminations in a single oestrus cycle and 85-92
per cent with two inseminations/per oestrus cycle over three oestrus cycles.6 "Correctly"
6Boyle (1994)

12
cooling semen involves taking an ejaculation and adding an appropriate extender (a
protein supplement that feeds the sperm while they are out of the body) and cooling the
semen to 4 °C. The single most significant factor affecting the fertility of the cooled
semen is that it be warmed at the same rate at which it was cooled.
The first successful foaling using frozen stallion semen was reported in 1966.
Currently attainable conception rates of under fifty percent (two inseminations per oestrus
cycle, over three cycles) using frozen semen do not compare well wi~ those achievable
through natural covers or cooled semen; a fact that diminishes frozen semen's current
commercial potential.

13
CHAPTER3
LITERATURE REVIEW
This chapter is divided into two sections. The first section presents the
economic framework that will provide a foundation for the theoretical and empirical
analysis in Chapter 4. The second section reviews literature that deals specifically with
the breeding restrictions in the equine industry.
The economic framework underlying the historical pattern of adoption of AI
acFoss breeds starts with Griliches (1960) and his research on regional adoption patterns
of technological innovations. A paper written by Klein and Leffler (1981) describes how
market forces prevent or encourage cheating behavior and how firms can signal to
consumers their commitment to honest transactions. Stallion owners engage in many of
the behaviors and practices described by Klein and Leffler as methods of demonstrating
to consumers their commitment to _honest transactions. A brief survey then follows to
outline the results of research pertaining to the effects of relative performance and
restrictions on competition in major league sports. A parallel is drawn between
restrictions in sports leagues and restrictions on artificial insemination in breed registries.
The second section reviewing relevant equine literature starts with a paper
published by Ray and Grimes, The Determinants of Breeding Regulation in the Horse
Industry: An Empirical Analysis. Next a paper by Coehlo and McClure (1987) will be

14
reviewed that focuses exclusively on Thoroughbreds and concludes that AI restrictions
keep the quantity ofhigh quality horses below what the market demands and generates
rents for current Thoroughbred horse owners. This section ends with a discussion of an
article in the Maryland Horse, "As Opposed to Thoroughbreds, Standardbreds Getting
Faster" which concludes that the use of AI has resulted in improved finish times for
Standardbred races.
Economic Framework
It is important to remember that individual horse breeders were, and in many
cases remain, reluctant to use artificial insemination. Breeders of European Warmbloods
and Standardbreds are the most active users of AI but they comprise no more than fifteen
percent of the total equine population. Many of the other breed registries that do allow AI
report that the number of foals conceived using AI is minimal. The lack of interest by
horse breeders in using AI is evidenced by the smaller amount of research dedicated to
developing AI technologies for horses in contrast to other livestock, particularly cattle.
Research in equine AI technologies lags far behind, both in the dollar amounts spent for
research and in the technologies that have. been developed. This illustrates a general
principle that not until individuals are limited by their constraints will they take any
action to ch,ange them. Restrictions on the use of AI are not important until individual
breeders want to use it.
In the late 1950s Zvi Griliches published three papers that discussed the
economics of technological change, in the context of adoption patterns for hybrid com
seeds by U.S. farmers. Farmers in Iowa and surrounding areas were the fastest adopters

15
of the new seed, while farmers in the Southeast and Mississippi Delta were the slowest.
Griliches concludes that the difference in the rates of acceptance was the result of demand
phenomena, not of different supply conditions. The rate at which farmers accept a new
technology depends, among other things, on the magnitude of the profit to be realized
from the change over. This in turn depends on the absolute superiority of the new
product.
The next paper reviewed, "The Role of Market Forces in Assuring Contractual.
Performance" by Klein and Leffler, argues that regulations may not be necessary to
ensure contractual performance. The authors describe how advertising, name brands and
other non-salvageable firm-specific capital investments are guarantees to consumers that
the firm is committed to long-term continued production of high quality goods.
The development of AI technology and shipped semen in particular, while
reducing certain costs of production, also increased the possibilities for fraud. Klein and
Leffler's argument would hypothesize that a stallion owner who has invested a substantial
amount of money into firm-specific capital is less likely to engage in fraudulent
transactions than a stallion owner who has made little or no investment in firm speci~c
nonsalvageable capital.
The influence of relative performance on AI restrictions is based on theories
already developed in the sports economic literature. Dougan and Synder determine that if
sports fans derive satisfaction simply from watching a talented home team, then the
competitive equilibrium is efficient. If fans also care about their team's performance
relative to the rest of the league the unrestricted equilibrium will generally not be
16
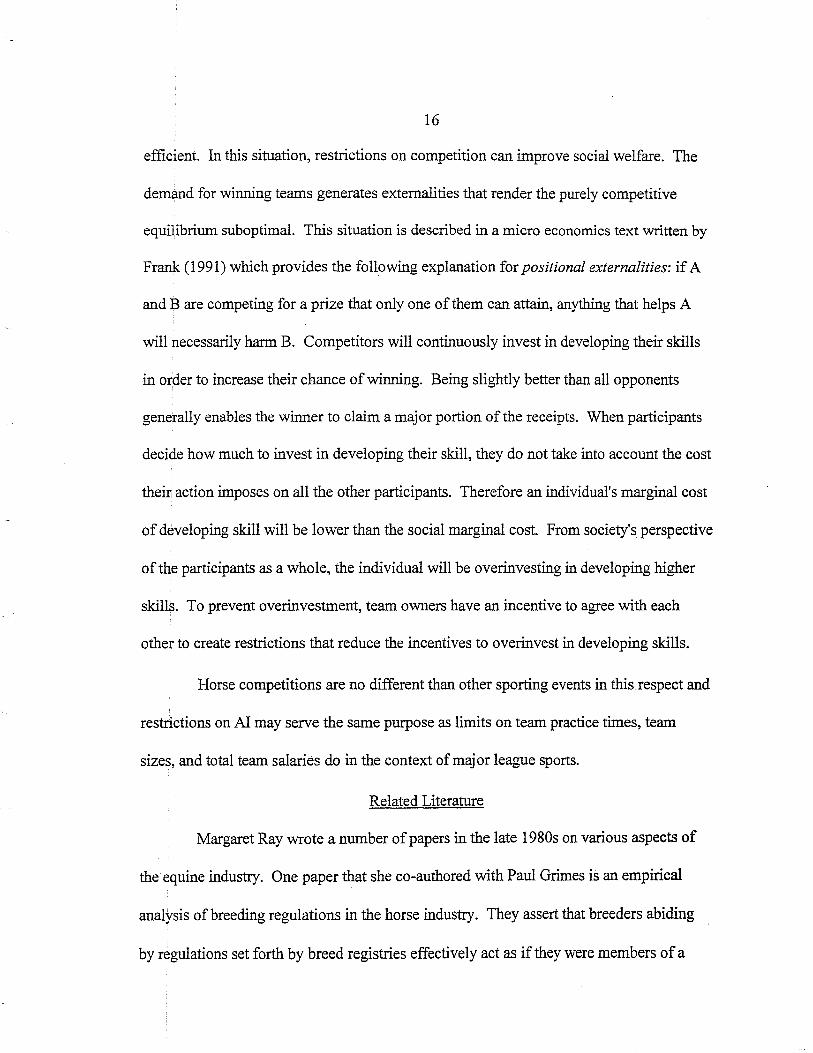
efficient. In this situation, restrictions on competition can improve social welfare. The
demand for winning teams generates externalities that render the purely competitive
equilibrium suboptimal. This situation is described in a micro economics text written by
Frank (1991) which provides the following explanation for positional externalities: if A
and B are competing for a prize that only one of them can attain, anything that helps A
will necessarily harm B. Competitors will continuously invest in developing their skills
in order to increase their chance of winning. Being slightly better than all opponents
generally enables the winner to claim a major portion of the receipts. When participants
decide how much to invest in developing their skill, they do not take into account the cost
their action imposes on all the other participants. Therefore an individual's marginal cost
of developing skill will be lower than the social marginal cost. From society's perspective
of the participants as a whole, the individual will be overinvesting in developing higher
skills. To prevent overinvestment, team owners have an incentive to agree with each
other to create restrictions that reduce the incentives to overinvest in developing skills.
Horse competitions are no different than other sporting events in this respect and
restrictions on AI may serve the same purpose as limits on team practice times, team
sizes, and total team salaries do in the context of major league sports.
Related Literature
Margaret Ray wrote a number of papers in the late 1980s on various aspects of
the· equine industry. One paper that she co-authored with Paul Grimes is an empirical
analysis of breeding regulations in the horse industry. They assert that breeders abiding
by regulations set forth by breed registries effectively act as if they were members of a

17
cartelized industry. The primary feature of a successful cartel is its ability to raise the
industry price and generate additional revenues for its members. The more inelastic the
demand curve facing a cartelized industry the greater the profits rewarded to each firm.
The authors conclude that the more inelastic the demand is for a breed's foals the more
likely the breed registry will be to impose AI restrictions.
Coehlo and McClure (1987) address the monopoly status enjoyed by the Jockey
Club in regulating the Thoroughbred racing industry. They conclude that prohibiting AI
limits the annual availability ofhigh quality breeding mares and stallions. High quality
refers to an animal that has had, or is expected to have, a successful track record. Coehlo
and McClure focus their study on the market for high quality foals.
They start their analysis with a downward sloping demand curve for high quality
foals. This seems reasonable because as the number of high quality foals increases, the
expected earnings to any individual foal will fall. The marginal cost of stallion services
will start as a horizontal line when only high quality stallions are used, but becomes
upward sloping when lower quality stallions are brought into production, reflecting the
fact that a lower quality stallion must sire more foals to produce a foal at the level of the
average foal sired by high quality stallions. A similar marginal cost curve will exist for
mares. The rising marginal cost curves lead to the accumulation of economic rents.
The authors argue that these rents are capitalized into the price of the animal.
Introducing AI would allow each high quality stallion to produce more foals and may also
increase the number of high quality mares used because location would not be a binding
constraint. This would extend the horizontal portion of the marginal cost curve and lower

18
. the rents accumulating to current horse owners. Consequently, Coehlo and McClure
argue that the Jockey Club has no incentive to adopt AI into their breeding regime.
An article published in the Maryland Horse, "As Opposed to Thoroughbreds,
Standardbreds Getting Faster", compares the winning times of Standardbreds and
Thoroughbreds over the last hundred years. It is evident that Standardbreds are getting
faster while Thoroughbreds are not. The winning times of Thoroughbred races are not
significantly different from those recorded a century ago. In sharp contrast, the winning
times of Standardbred races are considerably faster than those recorded fifty, even twenty,
years ago. In the past seventy years many Standardbred race times have dropped by a full
twenty seconds. New technologies such as better running surfaces and redesigned racing
equipment have undoubtedly played an important role in these faster times. The article
postulates that similar technological developments, like improved track surfaces, must also
have entered into the Thoroughbred industry; "they [Standardbred technology developers]
can't be that smart". The article concludes that the widespread introduction of AI into the
Standardbred breeding regimen in the early 1970s is largely responsible for the
dramatically improved finishing times. The next chapter will determine whether
consumers value these faster horses.

19
CHAPTER4
THEORETICAL MODELS AND EMPIRJCAL TESTS
This chapter presents testable hypotheses and theoretical models developed to
explain artificial insemination regulations. Empirical results are reported following a
discussion of each hypothesis. Opportunistic behavior and the rewards of successful
fraudulent transactions are considered first. Next, a monopoly model developed by Ray
and Grimes (1991) to explain AI restrictions in 1985 is re-evaluated using 1995 data. To
resolve questions arising from the monopoly model the issue of relative versus absolute
performance is then introduced. Finally, a model that incorporates all three explanations
is developed and tested.
Opportunistic Behavior I: The Advent of Affordable DNA Genotyping
"Opportunistic behavior typically involves reneging on contracts or promises
with the intent of extracting a larger share of the rents generated in the transaction."1 If
all horses were identical, or if perfect information were to exist, opportunistic behavior
would not be a factor in the present analysis. But horses are not identical and gathering
information on the specific attributes of a horse is costly. Genetics play a central role in
evaluating a foal's potential to perform a specified task. Where genetics are important,
1Carlton and Perloff. (P.451)

20
natural cover, with witnesses, guarantees lineage. When transported semen is used no
one witnesses the copulation of a particular stallion with the mare. The party receiving
the semen shipment relies on the integrity of the supplier to send the semen contracted
for. "Quality cheating problems are less severe the higher the level of quality that can be
detected prepurchase. "2 There is no way for a mare owner to determine with certainty the
source of the semen that arrives in a test tube. Discovering that a foal is not the progeny
of a specific stallion is costly to the mare owner both because the foal is not what was
contracted for, and because a full year will pass before the mare is able to produce another
foal. Therefore, stallion owners must demonstrate to consumers a commitment to
complete the transaction honestly.
Stallion owners interested in establishing reputations for quality and honesty
invest heavily in firm-specific capital. Brand names, expensive signs, fancy logos and
personalized carpets are examples given by Klein and Leffler of firm-specific capital
investments. Firm specific capital investments are nontransferable and nonsalvageable
costs. A firm that has invested heavily in firm-specific capital has significantly raised its
costs of cheating.
Stallion owners establish name brands based on the ability of their stallions to
produce offspring of high quality consistently. Almost every breed registry publishes a
journal for its members. Stallion owners pay to advertise their stallions qualifications and
accomplishments in these journals. Some stallion owners offer to pay for advertisements
2K.lein and Leffler (1981).

21
announcing the accomplishments of their stallions progeny. Additionally, stallion owners
may offer to pay their offspring's entry fees to shows and races because successfully
competing offspring advertise the stallion. Often the names of the offspring include an
obvious reference to their sire, for example Slewacide, Slew City Slew, Slew Dancer,
Slew 0' Gold, Slew's Royalty, Slew The Coup, Slew The Knight, Slew The Slewor,
Slewvescent and Slewpy are all offspring of Seattle Slew, the winner of the 1977
Kentucky Derby. Every time one of these horses competes, the public is reminded by its
name that it is an offspring of Seattle Slew. Product identification resulting from
intensive advertising is expensive and non-recoverable in the context that the stallion
owner cannot recoup any of the costs if he goes out of business. If a stallion owner is
caught cheating all the money invested to establish a reputation will be lost.
Futurities are another type of firm specific nonsalvageable investment that
stallion owners can purchase. Futurities are competitions that are open to offspring of
nominated stallions only. The cost to an owner of registering a stallion is one breeding.
An owner nominates his stallion by donating one breeding to the breed association which
then offers it at auction through a write-in sealed bid. A minimum price is set (usually
$1 ,000) and if the breeding is not sold the stallion is not registered as a futurity
nominating stallion. Foals registered for futurities increases their marketability and so
increase demand for the stallion. Once a stallion has been registered as a futurity
producer all his offspring are eligible to participate in futurity events. Participation in
futurity events is both prestigious and financially lucrative to the top placing horses. If a
stallion owner chooses to register his stallion as a futurity horse he has invested a

22
substantial amount of money in a nonsalvageable product to produce higher valued
offspring. Registration as a futurity stallion is another form of firm-specific non
recoverable capital investment because registration is not transferable to another stallion
and a stallion owner cannot unregister his horse and recover the fee paid to register it. A
stallion owner who has invested in registering his horse as a futurity horse is unlikely to
substitute semen from a low-quality stallion because if the offspring are not of sufficient
quality to compete successfully at futurity events, then demand for the stallion will fall.
Though there is no viable process to identify the source of semen in a test tube,
the advent of affordable DNA testing in 1985 made it much cheaper for consumers to
detect inaccuracies in lineage once the foal has been born. In 1985 Dr. Kary Mullis, of
Cetus Company, invented the polymerase chain reaction (PCR) method for selectively
targeting DNA sequences. PCR is a process that generates multiple reproductions of a
single DNA strand. Using PCR, scientists can amplify a minute amount of DNA (less
than lOOng of DNA is sufficient) to create enough DNA strands to conduct identification
tests. Scientists then look at a minimum of ten different DNA regions, or loci. At each
loci the offspring gets two alleles, one from each parent. For example, if the sire has
alleles A&B and the dam has alleles C&D then any offspring's locus must be, with equal
probability, A/Cor AID orB/Cor BID. Animals related as parent and offspring must
share an allele, and two animals that do not share an allele for a locus cannot be parent
and offspring.
Until recently, blood typing was the common method of parental verification
available to breed registries when a foal's lineage was in question. Blood typing, or any

23
other parentage verification test (including DNA testing), does not absolutely prove
parentage; it verifies whether or not !:!: was possible that a specific mating produced a
specific offspring.3 Genetic researchers have calculated traditional blood typing used to
detect incorrect paternity (or maternity) to be about 96 percent effective4 in
Thoroughbreds and Arabians, and as high as 98 percent effective in other U.S. breeds
such as Standardbreds, Morgans, Quarter Horses, Paso Finos and Peruvian Pasos. DNA
genotyping is substantially more accurate at identifying mistakes in lineage records.
DNA genotyping raises these numbers to 99 percent for Thoroughbreds and Arabians and
as high as 99.9 percent for the other breeds.5
With the discovery of PCR, breed registries concerned that unrestricted use of
AI might increase the potential number of fraudulent registrations now had access to a
cheap and accurate procedure to identify erroneous registrations easily. Currently it costs
a horse owner $50 to conduct either a DNA genotyping test or a blood typing parental
verification test. Although the cost to the horse owner is the same, DNA genotyping is
more accurate. DNA genotyping reduces the probablity of obtaining a false test result by
up to 75 percent. Traditionally, registries only required blood testing when questionable
circumstances arose, but within the last four years there has been a strong movement
among most of the breed registries to DNA genotype all registered animals. If AI
3American Quarter Horse Journal (1994).
4Th,e term 96 percent effective means that if there are 1 00 horses for whom it is known their identity is incorrect on average 96 of the errors will be detected.
5Bowling (1995).

24
restrictions exist to safeguard accurate records, the advent of affordable DNA genotyping
should lead to their relaxation.
A regression will be run to determine whether the discovery of the Taq
polymerase enzyme in 1985, responsible for affordable DNA genotyping, affected the
decision by breed registries to allow shipped semen. Clearly any breed registry that
allowed shipped semen prior to 1985 was not influenced by the discovery ofPCR
Among the breed registries that did not allow shipped semen in 1985, are there breeds for
which PCR is responsible for subsequently allowing shipped semen? An affirmative
answer to this question would provide empirical support for the hypothesis that the higher
the likelihood of opportunistic behavior the more likely the breed registry will be to
impose restrictions on AI.
The following equation is estimated to determine whether PCR hastened the
acceptance of shipped semen:
Where:
Allow Shipping
Allow On-Site
PCR
Allow Shipping = a0 + a1 Allow On-Site + ~ PCR + E
=The proportion of breed registries that allow shipped semen.
=The proportion of breed registries that allow on-site AI.
= A dummy variable for the discovery date of the Taq polymerase enzyme.
= 0 for the years 1950-1984 = 1 for the years 1985-1995
A time series data set was created that starts in 1950, the year when commercial
application of AI became practical, and carries through to 1995. This data set includes

25
the following annual information about the 29 breed registries in the sample: how many
breed registries were in existence, whether they restricted on-site AI and whether they
restricted shipped semen. A zero-one dummy variable, where one equals the years 1985-
1995, is included to distinguish the breeds that did not allow shipping prior to 1985 from
those that did.
The proportion of breeds that Allow On-Site AI is included to pick up non DNA
factors that influence a registry's decision to allow shipped semen. A positive sign is
expected for this coefficient. If a breed registry permits on-site AI, then it is more likely
to permit shipped semen than a breed not allowing on-site AI. A positive coefficient on
the PCR dummy will be consistent with the hypothesis that the discovery of PCR
influenced a registry's decision to allow shipped semen.
A Durbin-Watson statistic of0.53 indicated that Ordinary Least Squares (OLS)
estimators are inefficient. Standard t and F tests will be misleading because the
computed variances and standard errors are incorrect. The Proc Autoreg procedure in
SAS transforms the model, using maximum likelihood estimators, so that the error terms
are independent. The estimators resulting from this transformed model will be BLUE
(best linear unbiased estimators).
The data are presented in Appendix A. The OLS and maximum likelihood
regression results are presented below in Table 2:
TABLE 2: Effect of the Discovery ofPCR on AI Regulations

26
TABLE 2: Effect ofthe Discovery ofPCR on AI Regulations
Dependent Variable: Proportion ofBreeds Allowing Shipped Semen
Variable
Intercept
Proportion of
Breeds Allowing
On-Site
PCRDummy
Number of
Observations
OLS
Parameter T-Value Estimates
0.0072 0.352
0.3751 7.481**
0.2991 9.622**
46
Maximum Likelihood
Parameter T:.Value Estimates
0.1587 0.940
0.4196 4.355**
0.05663 2.175*
46
Significance levels for one tail t-values in Table 2 are as follows: **significant at O.Ollevel; *significant at 0.05 level.
The estimated coefficients for Number of Breeds Allowing On-Site and the PCR
dummy both have the predicted signs and are statistically significant at the 0.05 confidence
level for a one tailed t-test. The significance of the coefficient for the PCR dummy implies
that the advent of affordable DNA genotyping has had a significant effect on a breed
registry's decision to permit shipped semen. In fact, the results suggest that controlling for
the effects of the Allow On-Site, an additional5.7 percent of the breed registries in our
sample adopted AI between 1985 and 1995 as a result of the discovery ofPCR
27
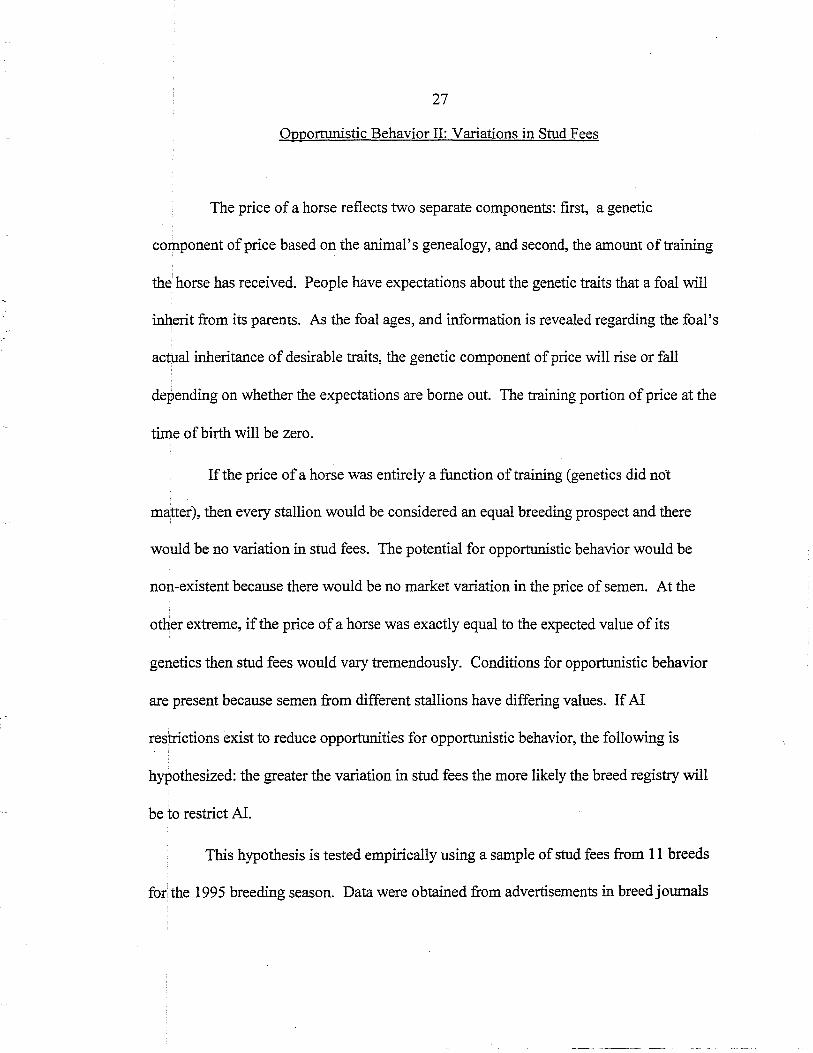
Opportunistic Behavior II: Variations in Stud Fees
The price of a horse reflects two separate components: first, a genetic
component of price based on the animal's genealogy, and second, the amount of training
the horse has received. People have expectations about the genetic traits that a foal will
inherit from its parents. As the foal ages, and information is revealed regarding the foal's
actual inheritance of desirable traits, the genetic component of price will rise or fall
depending on whether the expectations are borne out. The training portion of price at the
time of birth will be zero.
If the price of a horse was entirely a function of training (genetics did not
matter), then every stallion would be considered an equal breeding prospect and there
would be no variation in stud fees. The potential for opportunistic behavior would be
non-existent because there would be no market variation in the price of semen. At the
other extreme, if the price of a horse was exactly equal to the expected value of its
genetics then stud fees would vary tremendously. Conditions for opportunistic behavior
are present because semen from different stallions have differing values. If AI
restrictions exist to reduce opportunities for opportunistic behavior, the following is
hypothesized: the greater the variation in stud fees the more likely the breed registry will
be to restrict AI.
This hypothesis is tested empirically using a sample of stud fees from 11 breeds
for the 1995 breeding season. Data were obtained from advertisements in breed journals

28
and mail surveys sent to stallion owners.6 The standard deviation of each breed's sample
of stud fees was divided by its mean to obtain the coefficient of variation. The coefficient
of variation normalizes each observation so that comparisons can be made without
concern for the relative magnitude of the numbers.
The following regression will be run to test the effect of variation in stud fees on
a registry's level of AI restrictions:
Where:
AI Score
aFIIl
AI Score= a 0 + a 1 a FIJI + E
=Measure of the restrictiveness ofa breed's AI regulations. (See explanation below).
= Coefficient of variation of a breed's sample stud fees.
The variable AI Score compares each breed's degree of restrictiveness towards
AI. An increase in the value of this variable indicates a less restrictive policy towards the
use of AI. The AI Score variable is constructed from two components of equal weight;
on-site AI and shipped semen. Using 1950 as the date when AI was available for
commercial application, a breed registry that never restricted the use of on-site AI
receives a score of 1. The score for all other breeds is determined in the following
manner: if a breed registry allowed on-site AI in 1960, they have allowed AI for thirty-
five out of a possible total of forty-five years and receive an on-site AI score of35/45 =
0. 77- they have allowed on-site AI seventy-seven percent of the total time it has been
6Considerable effort was expended to increase the sample size of this data set. The journals available from other breeds did not advertise the fees charged and surveys that were sent out were•not returned.

29
available. An identical process is used for determining the breed's score for shipped
semen. The two numbers are added to obtain the AI Score for the breed. The variable
will range from zero to two. A zero is assigned to any breed that has never, and still does
not; permit the use of AI.
The higher the variation in stud fees the more opportunity for opportunistic
behavior and the more restrictive the breed will be regarding the use of AI. The
prediction is for a negative sign on the coefficient of variation.
OLS is not used to estimate this regression because the dependent variable, AI
Score, has been truncated to take a value between zero and two. The basic assumption
behind this model is that if AI score is less than or equal to zero the value of the
dependent variable is set equal to zero and the expected value of the error term is no
longer zero. OLS will result in estimators that are biased and inconsistent. Tobin (1958)
developed a method for dealing with limited dependent variables known as Tobit models,
or censored regressions. The Tobit model is estimated using maximum likelihood
estimation to distinguish between those observations for which AI score is greater than
zero from those which AI Score is less than or equla to zero. This procedure will yield
unbiased, efficient estimators. 7
Summary statistics for the data set can be found in Appendix B. The empirical
results are presented below in Table 3:
7Pindyck and Rubinfeld (1991).

30
TABLE 3: Effect ofVariations in Stud Fees on AI Regulations
Dependent Variable: AI Score
Variable
Intercept
Coefficient of
Variation
Number of Observations
Parameter Estimate
1.484**
-1.868*
11
T-Value
3.551
-2.133
Significance levels for one tail t-values in Table 3 are as follows:*significant at 0.05 level; **significant at 0.0 I
Although the limited size of the data set prevents drawing any conclusions with
a high level of confidence, the coefficient does have the predicted sign and is significant
at the five percent level for a one tailed t-test. To test whether the coefficient of variation
is being driven by ahy outliers in the data set, the observation for Thoroughbreds, (the
most obvious outlier) is dropped. Appendix B presents the results of the regressions.
Dropping Thoroughbreds has no effect on the regression results until the fourth decimal
place where a small change occurs. Dropping Miniatures (the other outlier) has a small
effect on the parameter estimate for the Coefficient ofVariation but is still statistically
significant at the ten percent level. When Thoroughbreds and Miniatures are both
dropped Coefficient of Variation and Stud Fees exhibit no systematic relationship. This
regression provides evidence that breeds with higher coefficients of variation have more
restrictive AI policies.

31
The two different empirical models developed above both support the hypothesis
that the potential for opportunistic behavior has played a significant role in the decision
by a breed registry to restrict AI. The lower the cost of cheating the greater its expected
rewards. Breed registries impose AI restrictions to raise the cost of cheating. When the
cost of detecting cheating dropped in 1985 there was a general movement across breed
registries to relax their AI restrictions.
Monopolv Argument
This section presents Ray and Grimes' (1991) monopoly argument for breeding
restrictions and re-estimates their model using 1995 data.
The equine breeding industry lends itself to classification as monopolistic
competition. Hirshleifer and Glazer (1991) define monopolistic competition as follows:
In the market structure known as monopolistic competition, it is assumed that-as in pure competition-firms do not collude on price or quantity, and that free entry into the industry (or exit from it) is possible. The monopolistic element in monopolistic competition is product differentiation: each firm has its own unique variety of product. Each enterprise has a clientele that prefers the firm's product even if another firm offers a similar product at a lower price.
Stallion owners have an individualized input that they provide. Mare owners
seek out a particular stallion because it has a known history and temperament that they
believe best complements their mare. Horse breeders are not a homogeneous group and
stallion owners have differentiated their product. Price collusion is unlikely because
producers are heterogeneous and specialize in offering individualized products to
consumers. There are close-though not perfect-substitutes for each stallion.

32
Carlton and Perl off (1991) write "an association of firms that explicitly agrees to
coordinate their activities is called a cartel-a cartel that includes all firms in an industry
is effectively a monopoly." The primary feature of a successful cartel is its ability to raise
the industry price and generate additional revenues for its members. The more inelastic
the demand curve facing a cartelized industry the greater the profits returned to each firm.
Ray and Grimes argue that each breed registry is able to operate with a degree of
monopoly power because all breeders who wish to produce registerable foals must abide
by the registry's by-laws, in effect coordinating to form a cartel. The authors conclude
that the more inelastic the demand for foals of a particular breed the more likely that
breed's registry will be to restrict AI (the rewards for effectively cartelizing will be
larger). They suggest that the price elasticity of demand for foals can be viewed as
depending on the function for which the horse is being bred. They hypothesize that the
more specialized the task a horse is expected to perform the smaller the degree of
substitutability with other breeds, and therefore the more price inelastic will be the
demand for foals within the breed.
To test their hypothesis empirically they estimate the equation given below. The
independent variables were chosen to reflect both the elasticity of demand for the breed
and other factors inherent in a monopolistically competitive market i.e. the number of
potential beneficiaries of the regulation, the homogeneity of interests among members,
and the level of concentration in the industry:

Where:
AI
Age
Shows
Races
33
AI= o:0 + o:1Age + o:2Shows + o:3Races + o:4Members + o:5Govern + e
= A dummy variable for AI regulation l = breed registry restricts AI 0 = breed registry does not restrict AI
= The age of the breed registry (Years)
= A dummy variable for breed only shows 1 = breed registry sanctions breed only shows 0 = breed registry does not sanction breed only shows
= A dummy variable for breed only races l = breed registry sanctions breed only races 0 = breed registry does not sanction breed only races
Members = A dummy variable indicating the relative size of the registry 1 =breed registry has less than 1500 members
Govern
0 =breed registry has more than 1500 members
=A dummy variable representing the decision making process of the registry
1 = majority of votes by all members . 0 =majority vote by a central board of directors
Ray and Grimes offer the following explanations and predictions for each
explanatory variable. AI is a dummy variable indicating whether or not the registry
placed any restrictions on artificial insemination for the 1985 breeding season. No
distinction is made between a registry that prohibits all forms of AI and one that allows
on-site use but no shipping. Also no distinction is made with respect to the timing of
when AI was allowed.
Age is included to measure the concentration of a breed and a negative
coefficient is predicted. The authors argue that the older a breed, the less concentrated. it

34
coefficient is predicted. The authors argue that the older a breed, the less concentrated it
will be, and therefore the less likely the breed will be to regulate AI. This conclusion
implicitly assumes that breeds will diffuse geographically over time. The authors do not
specify further the assumptions that led to this conclusion. Additionally, this assumption
contradicts empirical conclusions presented by Ray in her dissertation (1988) where she
showed that the geographical concentration of Quarter Horses actually mcreased between
1980 and 1987.
Shows and races are included to capture the level of specialization relating to the
elasticity of demand for the breed and positive signs are predicted for both. If a registry
sanctions one (or more) show(s) or race(s) they are assigned a one respectively for the
Shows or Races dummy variables. No distinction is made between a registry that
sanctions one show a year and a registry that sanctions two thousand a year. Ray and
Grimes hypothesize that the demand for a foal registered with a breed registry that
sanctions its own shows or races will be more inelastic than one that does not sanction
any shows and races. The more inelastic the demand for the breed the ·more likely the
registry will be to regulate AI.
Membership size and the manner in which the breed is Governed are included to
reflect homogeneity of interests of members. Negative signs are predicted for both
coefficients. The authors suggest that breeds with smaller memberships are newer and
face more elastic demand schedules. They argue that these breeds are interested in
expanding their population base and AI is an efficient way to accomplish this. The
argument contradicts the authors reasoning for the Age variable that older breeds are less

35
likely to restrict AI than newer breeds. The Govern variable is included to account for the
decision making process of each breed; a centrally elected board of directors versus one
member-one vote on each issue. The authors predict that a centrally elected board of
directors will be more likely to coordinate themselves (act as a monopoly) and will be
able to regulate AI more easily than registries where each member votes on every issue.
In the ten years between 1985 and 1995, a substantial number ofbreed registries
have changed their regulations governing the use of AI. The regression is re-estimated
using data from 1995. Ray and Grimes use univariate probit techniques to estimate their
regression and the same is done for the 1995 data. The results from both regressions are
provided in Tables 4 and 5.
TABLE 4: Ray and Grimes Monopoly Model1985 Data8
Dependent Variable: AI Dummy
OLS PROBIT
Variable Parameter Estimate T-value Parameter Estimate T-value
Intercept 0.43 1.61 * -0.38 -0.33
Age -0.04 -1.87* -0.02 -1.77*
Shows 0.13 0.67 0.62 0.58
Races 0.24 1.25 1.15 1.37*
Members -0.23 -1.35* -0.81 -1.38*
Govern -0.24 -1.40* -0.90 -1.41 *
F-Value 4.22 Chi-Square 17.68
R2 0.47 Prediction 83%
Significance levels for one tailed t-values in Table 4 are as follows: *significant at 0.1 level
8The regression results from 1985 are reproduced from the Ray and Grimes paper.

36
TABLE 5: Ray and Grimes Monopoly Model1995 Data
Dependent Variable: AI Dummy
OLS PRO BIT
Variable Parameter T-value Parameter T-value Estimate Estimate
Intercept 0.0779 0.637 2.573 1.842*
Age 0.012 0.601 -0.017 0.616
Shows 0.003 0.820 -0.0014 0.758
Races l.lxl05 1.808* -0.0018 0.808
Members 4.2x10⁷ 0.137 l.lx1 05 0.841
Govern -0.216 -1.117 12.270 0.977
F-Value 2.506 Chi-Square 10.437
R2 0.2207 Prediction 87.7%
Significance levels for one tailed t-values in Table 5 are as follows: *significant at 0.1 level
All the coefficients in Table 4 have the signs predicted and four of the variables,
Age, Races, Members and Govern are significant at the 0.10 level for a one tailed t-test.
When the equation is estimated using analogous data from 19959, none of the coefficients
are significant at the 0.10 confidence level.
The poor empirical results are not surprising given the questionable explanations
and predictions for the explanatory variables. The question is whether the variables or the
theory need amending. The following discussion suggests that there are problems with
9Ray and Grimes use a sample of30 breed registries in 1985. The 1995 data set contains information on 29 breed registries, 18 that are the same. The 1995 sample contains different breeds because those from the 1985 refused to return the questionnaire.

37
the theory.
In a traditional monopoly model where there is only one seller, or a group of
sellers who operate as one, the producer will always adopt a technology that lowers his
costs. Figure 1 diagrams the monopolist condition.
Figure 1: Monopolist and Cost Reducing Technology
Proals
' I\ I I \ I , I I \ .MR I I ,
I ' QNOAI QAI
C:D Profits without AI
~ Profits with AI
MCNOAI
MCAI
D
Qfoals
A monopolist will always produce where marginal revenue is greater than zero
and demand is inelastic. Anywhere in the inelastic portion of the demand curve, lowering
price and increasing quantity always incre/ases revenues. Marginal costs decrease with
the introduction of a new technology and under normal circumstances total costs will fall
accordingly. Total profits (total revenues minus total costs) must be greater with the new,
lower marginal cost, technology. Stating that breed registries restrict AI and do not allow

38
the marginal cost curve to fall because they have monopoly power seems implausible. A
resolution to this seeming contradiction will be offered, but the concept of relative
performance must be introduced first.
Relative Versus Absolute Performance
The rewards to most athletic competitions and contests are awarded on the basis
of relative performance. The winner outperforms all other contestants in a particular
meeting. Because the winner has to perform better than all the other contestants entered,
each contestant has an incentive to devote significant resources to becoming better.
Any individual who improves his skills and is able to increase his chance of
winning imposes a cost on all other contestants.· If two contestants, A and B, have equal
probability of winning, and A is able to increase his chance of winning from 0.5 to 0.75,
then B's chance of winning must fall from 0.5 to 0.25. This external cost is referred to as
. a positional externality. Frank (1991) defines positional externalities as any type of
performance enhancing activity that decreases everyone else's chance of winning. Each
individual will continue to invest in developing his skills until his expected earnings
equal the additional private cost of achieving that level of performance. From society's
point of view the individual will overinvest in developing skills because he will not take
into account the additional cost his actions impose on the other contestants. The marginal
social cost of his action will be higher than his private marginal cost. It is this disparity
between the private and social marginal cost curves that leads to a plausible monopoly
based story to explain AI restrictions.
In an extreme case, where only relative performance matters, an increase in

39
absolute skill levels will not affect the total rewards available. The quest to produce
faster horses yields no real benefits for race horse owners as a whole because consumers
do not value improved performance levels per se. There is no increase in demand as skill
levels increase. Without increased consumer demand the total amount of rents available
to the industry does not change. Resources expended by individual competitors to
develop higher skill levels dissipate any rents available to the industry. In this situation,
firms in the industry may be able to limit rent dissipation by restricting the use of
technologies that serve to ehance performance. Artificial insemination is used by
livestock breeders as a performance enhancing technology to increase rapidly the genetic
base of a herd. Where relative performance matters incentives exist to restrict
p~rformance enhancing activities and one would e~pect to find restrictions on the use of
AI.
At the other extreme, in a world where only absolute performance matters, one
person's success does not affect anyone else's chance of succeeding. Any individual who
satisfies a defmed objective standard receives the designated reward without lowering
what is available for anyone else. Private and social marginal costs are equal and there
are no positional externalities. In this situation the industry has an incentive to promote
the adoption of performance enhancing technologies because everyone gains from them.
One would not expect to fmd restrictions on the use of AI. This is the situation described
above where an ordinary monopoly will always adopt a technology that lowers marginal
cost.
A registry will only want to restrict AI if its use as a performance enhancing
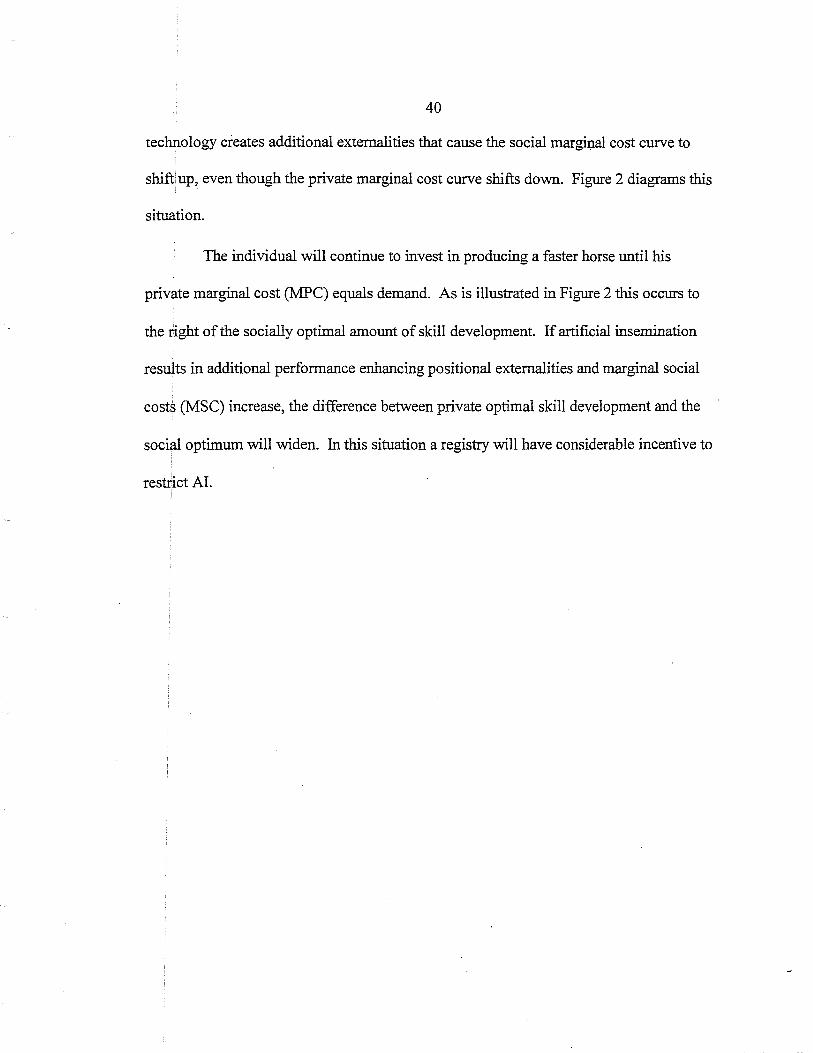
40
technology creates additional externalities that cause the social marginal cost curve to
shift up, even though the private marginal cost curve shifts down. Figure 2 diagrams this
situation.
The individual will continue to invest in producing a faster horse until his
private marginal cost (MPC) equals demand. As is illustrated in Figure 2 this occurs to
the right of the socially optimal amount of skill development. If artificial insemination
results in additional performance enhancing positional externalities and marginal social
costs (MSC) increase, the difference between private optimal skill development and the
social optimum will widen. In this situation a registry will have considerable incentive to
restrict AI.

41
Figure 2: Positional Externalities Associated with AI
p skill developmmt
MPCAI
Osocial Qprivatc Qskill developement
If a registry is going to restrict AI it must possess some form of power over its
members. Consider two ways a registry acting with monopoly, or cartel, power can
restrict output. Either the registry cari operate as an effective cartel and restrict output
directly or it can operate as a partial cartel and restrict any technology, or performing
enhancing technologies, that serve to increase output. Some breed registries did restrict
output directly. These registries specified a limit on the number of foals they would
register from any one stallion. In 1994 a group ofMorgan breeders brought legal action
against the Morgan Association claiming that restricting the number of foals they could
registerwas in violation of the Sherman Anti-Trust Law. The Association backed down
and eliminated its limit on the number of foals it would register annually. All other breed

42
registries that had similar restrictions abolished them quickly. 10 In a partial monopoly the
registry is unable to restrict output directly, and instead prohibits the use of the
performance enhancing technology. These registries simply do not allow breeders to use
AI. The following figures illustrate the two types of monopolies.
Figure 3 illustrates an effective cartel and Figure 4 illustrates a partial cartel. 11
p skill development
' ' ' ' ' '
' ' '
Figure 3: Effective Cartel
' '
Q effective cartel
\MR
Q private Q private NO AI AI
MPCAI
D
Qskill development
10Information obtained from conversations with Terry Threlkeld, the owner of Goin' for Approval, the 1995 World Champion Appaloosa stallion.
11For simplicity this analysis assumes parallel shifts of the marginal cost curves.

p slcill development
43
Figure 4: Partial Cartel
' ' ' \MR
Q Q private Q private
partial cartel N 0 AI AI
MPCAI
D
Qslcill development
These figures illustrate situations when a registry will want to restrict AI. In
both graphs the distance between the social optimum amount of skill development and
the private amount of skill development is smaller when AI is restricted than when it is
not. To conclude this discussion, however, it is imperative to prove that relative
performance is important to horse owners.

44
Relative Versus Absolute Performance I: The Importance ofWinning
The monetary rewards of owning a race horse are determined by competitions
based on relative performance, where ·a slightly faster horse will capture the majority of
the purse money. Usually the purse is divided so that the winner receives between sixty
and seventy-five percent of the total purse money available, second place receives ten to
twenty percent and the remaining money is given to the third place finisher. The purse
for a race is determined in advance by the race track. Most tracks advertise the purses for
individual races before the racing season begins. Each purse is offered based on the
track's expected earnings for that race. Earnings are generated by consumers through
attendance fees, simulcast royalties and money wagered. 12 Tracks reserve the right to
change the purses during the season if actual revenues turn out to be significantly
different from those predicted. If consumer interest in horse racing rises relative to
expectations, for example, track revenues increase and the purses offered may be
augmented. It is not uncommon for racetracks to announce mid-season that all advertised
purses for the following week are being raised (or lowered) by, say, five percent. 13 The
link between consumer demand and purse is important for the analysis that follows
because purse will be used as a proxy for consumer demand.
This section hypothesizes that restrictions on the use of artificial insemination
exist in an attempt to preserve rents and minimize resources spent 'trying to win'. The
12Simulcasting royalties are generated when a track sells the rights to broadcast its races live to other racetracks, bars, casinos etc.
13Information obtained through phone conversations with a librarian and researcher at the at the Keeneland Library in Lexington, Kentucky.
45
restrictions are in place to prevent artificial insemination from acting as a catalyst to
hasten the production of ever faster horses.
In support of this hypothesis it will be shown that a horse's record of wins brings
additional market value not already captured in career earnings. Once it has been
established that winning, ceteris paribus, is economically important to horse owners, the
assertion that AI restrictions are in place to minimize overinvestment in skill
development is, at the least, plausible.
To test the economic importance of winning to race horse owners, a regression is
run using advertised stallion fees (stud fees) as a measure of a horse's value. A stallion's
own racing record and his ability to produce successfully performing offspring are
determinants of the stud fee. A horse's racing record is measured by total career earnings
and the number of races won, together with information regarding how many years the
horse raced and the number of races run. A horse's career earnings are determined by the
number of races run and its placing in each race.
The following regression is run to establish those aspects of a stallion's racing
record that are important in establishing stud fees. For present purposes only stallions
that have recently started breeding and for which information about their offspring is not
yet available will be used. Once a stallion has sired a significant number of racing
offspring, the success of these offspring will supersede the stallion's own record in
establishing its stud fee. In general, stallions do not race and stand at stud
simultaneously. A stallion's career as a breeding stallion usually begins after he stops
racing. Information regarding the success of his offspring will not be available for at least

46
three years from his first year at stud.
Stud Fee = a0 + a 1 Career Earnings+ a2 Number ofYears Raced+ a 3Number of Wins + a 4 Number of Starts + a5 Livefoal Guarantee+ a6 Nomination to the Breeders Cup + E
Where:
Stud Fee
Real Career Earnings
Number of Years Raced
Number of Wins
Number of Starts
Livefoal Guarantee
= The 1995 stud fee for a particular stallion
=The stallion's total career earnings (in millions) 14
=The number of years the stallion raced
= The number of races the stallion won
= The number of races the stallion entered
= Dummy variable set equal to one if the stud fee includes a livefoal guarantee
Nomination to Breeders Cup =Dummy variable set equal to one is the stallion's offspring are nominated to the Breeders Cup
A positive sign is predicted for the coefficient on Career Earnings. Stud fees, as
a proxy for a stallion's value, should be higher for a horse that won more money over its
lifetime than another horse who, all else equal, made less money. Holding wins and
earnings constant, a negative sign is predicted for Number of Years Raced-a horse that
runs very successfully its first or second year on the track is likely to be retired to avoid
the risk of a bad season or injury. Similarly, holding the number of wins and total
earnings constant, a horse that runs in more races is unlikely to be as valuable as a horse
14Real Career Earnings are adjusted using the chain price index where 1992=100.

47
who ran in fewer races. Correspondingly, a negative sign is predicted for Number of
Starts.
The Livefoal guarantee dummy is included to account for the effect such a
guarantee has on stud fees. Livefoal guarantees are a type of insurance contract and vary
in their individual specifications. Some stallion owners offer a free breeding in the
following season if a live foal is not produced; others do not require payment of the stud
fee until the foal stands and nurses. Regardless of the precise specification, the livefoal
guarantee should have a positive effect on stud fees.because the breeder does not have to
bear the risk of paying for a stallion's services and not have the mare produce a healthy
foal. Nomination to the Breeder's Cup is also predicted to have a positive effect on stud
fees. The Breeder's Cup races are the most prestigious series of races for Thoroughbreds.
Only foals born from registered stallions are eligible to participate in the Breeders Cup
races. This nomination should confer additional value on each foal.
The Number ofWins is the variable of primary interest in this regression. If the
coefficient is both positive and significant this provides empirical evidence that, ceteris
paribus, the more wins a stallion has the higher the stud fee charged for his service. This
is central to supporting the hypothesis presented earlier. If winning is an important
determinant of value, this is evidence that relative performance matters. This in turn
supports the argument that positional externalities are present in the horse racing industry
and that private marginal and social marginal cost curves diverge.
A data set was constructed that contains information on the services of 219
active breeding stallions advertised for the 1995 breeding season. The data were gathered
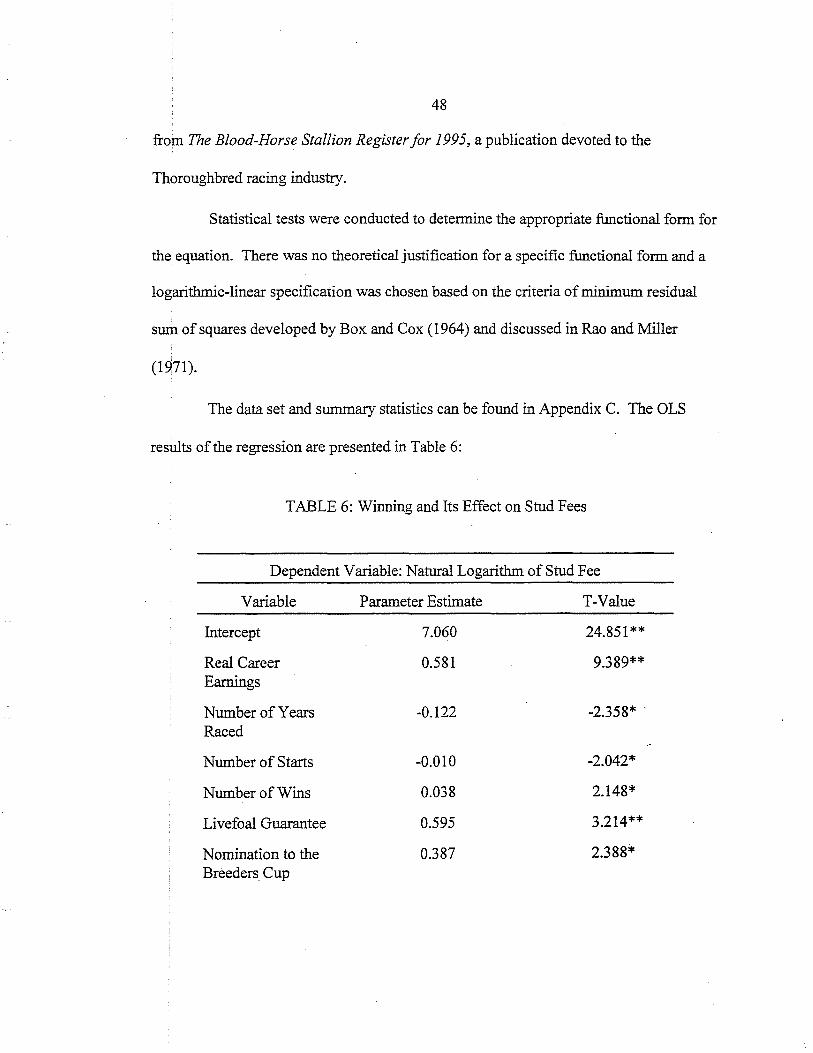
48
from The Blood-Horse Stallion Register for 1995, a publication devoted to the
Thoroughbred racing industry.
Statistical tests were conducted to determine the appropriate functional form for
the equation. There was no theoretical justification for a specific functional form and a
logarithmic-linear specification was chosen based on the criteria of minimum residual
sum of squares developed by Box and Cox ( 1964) and discussed in Rao and Miller
(1971).
The data set and summary statistics can be found in Appendix C. The OLS
results of the regression are presented in Table 6:
TABLE 6: Winning and Its Effect on Stud Fees
Dependent Variable: Natural Logarithm of Stud Fee
Variable Parameter Estimate T-Value
Intercept 7.060 24.851 **
Real Career 0.581 9.389** Earnings
Number of Years -0.122 -2.358* . Raced
Number of Starts -0.010 -2.042*
Number of Wins 0.038 2.148*
Livefoal Guarantee 0.595 3.214**
Nomination to the 0.387 2.388* Breeders Cup

F-Value
Adjusted R2
Number of Observations
49
33.341
0.4709
219
Significance levels for one tail t-values in Table 6 are as follows: *significant at 0.05 level; **significant at 0.01 level.
The estimated signs on the coefficients all carry the predicted signs and all the
variables are significantly different from zero at a 0.05 level. Career Earnings, not
surprisingly, is an important determinant of stud fees. The coefficient can be interpreted
to read that an additional million dollars in earnings will raise the stud fee by 58 percent.
The variable of interest, Number ofWins, does have a significant effect on stud fees,
ceteris paribus. The coefficient on Number of Wins implies that each additional win
raises the stud fee by 3.8 percent. 15
The above empirical results support the hypothesis that industry participants are
rewarded for owning race horses that win. The incentive to overinvest in developing
faster horses is present. It seems reasonable to assert that AI restrictions imposed by the
Jockey Club serve the same purpose as restrictions imposed by major sports leagues to
limit the amount of investment spent to develop skill levels. While each individual has
the incentive to be better than everyone else, an industry wide attempt by everyone to
become better will result in an overall field of better performers without providing
additional rewards, while many of the rents expended to produce better performers are a
15The regression was run including offspring data for each stallion and this information dominated the stallion's own racing record. For the purposes of this hypothesis the offspring information did not provide any additional explanatory power.

50
net loss to the industry as a whole.
Relative Versus Absolute Performance II : Standardbreds Versus Thoroulilibreds
The Standardbreds are another breed with an extensive racing industry.
Standardbreds are split into two categories, trotters and pacers, a difference in the
movement and speed of the gait. Instead ofbeing ridden Standardbreds pull a sulky
(cart). The Standardbred breed, descended from Thoroughbreds, was developed in the
United States. Like Thoroughbreds the financial rewards of owning a Standardbred race
horse are determined on the basis of relative performance. Unlike the Jockey Club,
however, the United States Trotting Association (the governing body for Standardbreds)
does not restrict AI.
Figure 5: Finish Times Kentucky Derby and Kentucky Futurity
135~~---.--.---r-~--~r--r-~---r~
Bo I I . ~I 111 I I I I I I I Cf.l
"0 s= ~ 125 [=t~71;i~~"::J,~At-J.:-~--=~=r=j ~120r===r---j--lf-~~~~~~~~~J[J:~ <1)
115 CTI---t-t-++~-~LJ 110+---~--~--~~---+---+---r---r--;-__,
1900 1920 1940 1960 1980 2000 Year
- Kentucky Derby - Kentucky Futurity

51
The finish times of major Thoroughbred races are not much different than those
recorded a century ago. The finish times of Standardbred races, on the other hand are
substantially faster than those recorded as recently as two decades ago. The tremendous
improvement in Standardbred finish times, as compared to Thoroughbred finish times is
unquestionable. A comparison between the Kentucky Derby (a Thoroughbred triple
crown race) and the Kentucky Futurity (a Standardbred triple crown race) illustrates the
striking difference. In 1911 the winning time for the Kentucky Derby was 2 minutes 5
seconds. In 1995 the winning time was 2 minutes 11/ 5 seconds. The winning time for the
Kentucky Futurity in 1911 was 2 minutes 71/ 2 seconds. In 1995 the winning time was 1
minute 5J2/5 seconds. Figure 5 graphs the finish times for both races for the years 1911
through 1995.
There is no single explanation as to why Standardbreds are running faster.
Improvements in equipment and track surfaces undoubtedly have played an important
role, but as stated in the literature review, Thoroughbreds have not been isolated from
similar technological improvements. An article published in Maryland Horse, "As
Opposed to Thoroughbreds, Standardbreds Getting Faster," hypothesizes that the
widespread use of artificial insemination in Standardbred breeding practices is largely
responsible for the rapid improvement in Standardbred finishing times. It is beyond the
scope of this thesis to determine the actual contribution of each factor to improvements in
Standardbred finishing times. Instead, taking as given that Standardbred horses are
improving in their absolute performance while Thoroughbreds are not, this section seeks

52
to determine whether consumers of horse races value, and reward improvements in,
absolute performance in an activity in which winnings are allocated on the basis of
relative performance.
The following empirical test, using the Kentucky Derby and the Kentucky
Futurity, is designed to measure whether the improvements in absolute performance
experienced in the Standardbred industry have resulted in increased consumer demand for
Standardbred racing.
These two particular races were chosen because they are races of comparable
caliber, and are held in close proximity to one another. The locational proximity of the
two races eliminates any population and income disparities that might otherwise influence
consumer demand if the two races being compared were run in different parts of the
country. Therefore, the empirical specification below does not include demographic or
income variables.
The following regression is run to determine whether Standardbred racing has
attracted more consumer demand due to the decrease in its finishing times relative to
Thoroughbred racing.
Purse SB t = PurseTB
a0 + a 1 Finish Time SB t + E
Finish Time TB
Where, for year t:
Purse SB t. Purse TB
Finish Time SB t Finish Time TB
= The ratio of the purses for each race
= The ratio of fmishing times for each race

53
Purse is used as a proxy for consumer demand. The change in consumer
demand for Standardbreds relative to Thoroughbreds is measured in the Purse ratio. The
Finish Time ratio measures how the purses for Standardbred races have changed as a
result of their improved finish times relative to Thoroughbreds. Ifthe estimated
coefficient on the ratio of Finish Times is negative and significant, the implication will be
that consumer demand for Standardbred racing has increased relative to consumer
demand for Thoroughbred racing in reponse to the increased speed of Standardbreds.
Such a result would indicate that consumers value absolute performance.
The data set was collected from various sources. The Kentucky Derby
information came from a Churchill Downs publication, "One Hundred and Twenty
Second Kentucky Derby" that chronicles the race since its first running in 1875.
Information on the Kentucky Futurity came from the Horseman and Fair World, a weekly
publication dedicated to the Standardbred racing industry. All dollar values are adjusted
using the chain price index where 1992=100.
A Durbin-Watson statistic of 0.724 indicated that OLS would not produce
efficient estimators. Maximum likelihood estimation was used in the following
regressions to produce BLUE estimators. The· data set can be found in Appendix D. The
results of the regression are presented in Table 7:

54
TABLE 7: Faster Horses and Their Effect on Purses
Dependent Variable: Purse Ratio
Variable Parameter T-value Estimate
Intercept 0.288* 6.366
Finish Time -0.008 -1.088
Number of Observations 60 Adjusted R2 0.7255
Significance levels for a one tail t-test in Table 7 are as follows: *significant at 0.05 level.
The sign on Finish Time is negative, but not significantly different from zero.
These results imply that absolute performance is not important to consumers. These
results combined with the earlier results provide evidence that relative performance
influences the decisions ofbreed registries. If positional externalities exist with artificial
insemination such that marginal social costs rise, then, knowing that relative performance
matters, a breed registry that can operate with monopoly power will restrict AI.
Extending the Monopoly Model to Include Alternative Explanations
This section develops and estimates a model that combines the monopoly
hypothesis with the opportunistic behavior and relative performance explanantions for AI
restrictions. It is anticipated that this expanded model will improve the explanatory
power of the original monopoly model.
The two opportunistic behavior tests-the advent of cheap DNA testing to
identifY inaccurate paternity (and maternity) records, and the coefficient of variation in
stud fees, are added to the variables included in the monopoly model discussed earlier.

55
The hypothesis remains that the more favorable the conditions for opportunistic behavior
the more likely the breed registry will be to restrict AI. The variables from the monopoly
model are the age of the breed, the number of shows and races sanctioned by the registry
and the size of the membership. The Govern variable is included as another monopoly
variable where the prediction is, a board of directors will be able to issue monopoly type
regulations more easily than a registry with a one member-one vote governing policy. The
AI score variable used for the regression in Table 3 is used as the dependent variable.
This specification scales the level of restrictiveness of each breed, with the variable
ranging from zero to two, where two indicates that the breed has never restricted AI in
any form and zero indicates that the breed has never, and still does not, permit the use of
AI in any form. The following equation will be estimated using data from 1994:
AI score=a0+a1Age +a2Shows+a3Races+a4Members +a5Govern +a6PCR +a7oF/Jl + e
Where:
AI score
Age
Shows
Races
Members
Govern
PCR
oF/).!.
= A measure of the degree of restrictiveness of a breed registry towards AI
=Age of the breed registry in 1994
= The number of shows sanctioned by the registry in 1994
= The number of races sanctioned by the registry in 1994
= The membership size of the registry in 1994
=A dummy variable reflecting the governing structure of the registry
= A dummy variable measuring whether PCR affected a breed registry's decision to allow unrestricted use of AI
= Coefficient of variation of 1994 stud fees
56
Shows and Races capture the effects of relative performance and monopoly
power without an obvious way to separate out the individual effects. Both theories
predict that the greater the number of registry sanctioned shows and races, the greater the
restrictions placed on AI. The monopoly explanation rests on the hypothesis that the
more shows and races sanctioned, where substituting a horse from another breed is not an
option, the more inelastic the demand for a horse of that breed and the more likely the
breed will be to restrict AI. The relative performance argument hypothesizes that where
relative performance is important, i.e. there are many breed only sanctioned shows, the
more likely it is that the breed registry will restrict AI. Therefore a breed is going to be
more restrictive of AI if it sanctions a large number of shows and races where the winner
is decided on the merits of relative performance. Negative signs are predicted by both
theories for both variables.
The Members variable is included as a monopoly variable. In general, the larger
a group of individuals who have to cooperate the less likely they will be to form an
effective monopoly. The a priori prediction for the Members coefficient is that it will be
positively signed. The larger the membership of the breed the less restrictive the registry
will be towards AI. The Govern dummy variable is assigned a one where the registry is
governed with a one member-one vote process and a zero when a board of directors
(elected or not) governs the registry. A positive sign is predicted for Govern because the
monopoly argument would hypothesize that a board of directors will be more restrictive
than a whole membership vote.
The PCR dummy variable essentially splits the data into two groups, early and

57
late adopters of AI. If a breed registry allowed unrestricted use of AI prior to 1985 its
decision could not have been influenced by the discovery ofPCR. For these breeds the
PCR dummy is assigned a value of zero. If a breed registry did not allow its members to
ship semen for AI until after 1985, or still does not allow it members to use AI, the PCR
dummy is assigned a value of one. The significance of the coefficient on the PCR
dummy variable will indicate whether, ceteris paribus, the discovery ofPCR affected a
registry's decision to allow AI. The coefficient must be negatively signed due to the
definition of the dummy variable.
The regression is run with these variables using a data set containing information
for twenty-nine registries. Because data for Coefficient ofVariation exist only for eleven
breeds, the regression will be run first without the coefficient of variation and the results
are presented in Table 8a Modell pr-esents the results ofthe equation defmed above.
Model 2 includes PCR interactive terms. These variables are included to determine
whether the explanatory variables for breeds that adopted AI before and afterl985.
In Table 8b the regression is run again including the coefficient of variation, but
limited to the eleven registries for which data are available. Model 3 presents the results.
To ensure that the changes in the parameter estimates are resulting from the inclusion of a
new explanatory variable, the Coefficient ofVariation, and not simply resulting because
of the new data set, the regression is re-run using the eleven 11 observations but the
variable specification from Modell (the Coefficient ofVariation is not included). These
results are presented in Table 8b, Model4.
Maximum Likelihood estimators are calculated using the Tobit procedure
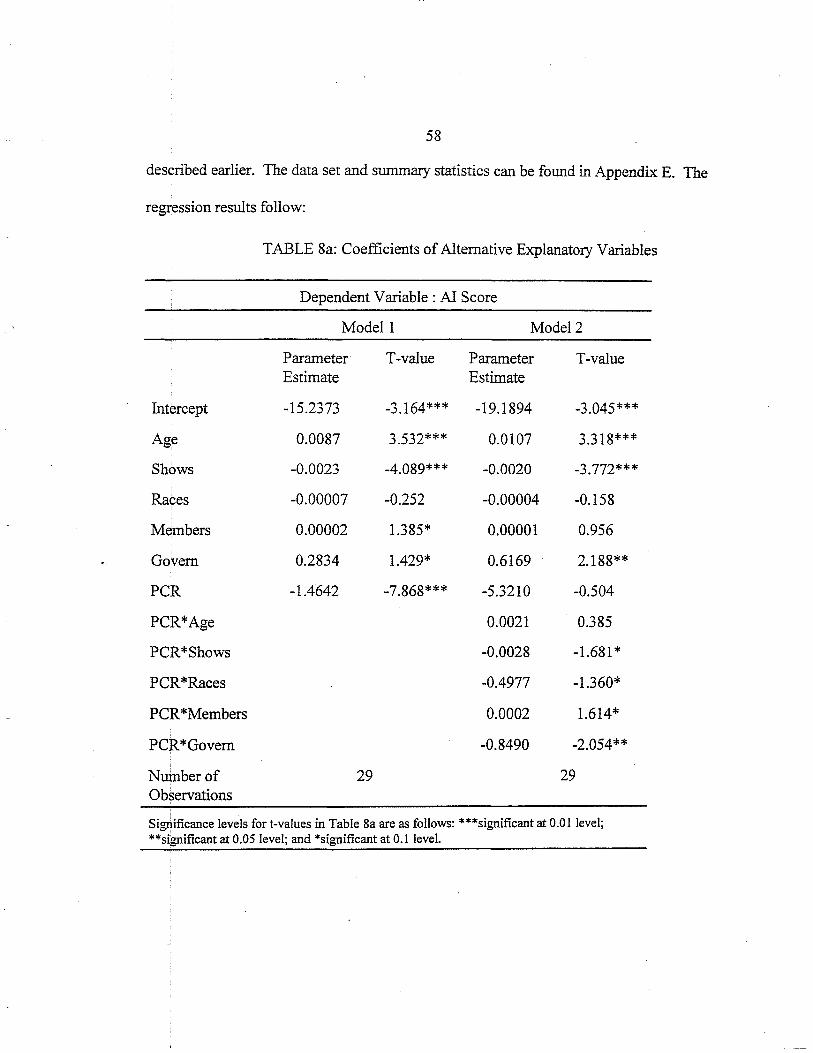
58
described earlier. The data set and summary statistics can be found in Appendix E. The
regression results follow:
TABLE 8a: Coefficients of Alternative Explanatory Variables
Dependent Variable : AI Score
Modell Model2
Parameter T-value Parameter T-value Estimate Estimate
Intercept -15.2373 -3.164*** -19.1894 -3.045***
Age 0.0087 3.532*** 0.0107 3.318***
Shows -0.0023 -4.089*** -0.0020 -3.772***
Races -0.00007 -0.252 -0.00004 -0.158
Members 0.00002 1.385* 0.00001 0.956
Govern 0.2834 1.429* 0.6169 2.188**
PCR -1.4642 -7.868*** -5.3210 -0.504
PCR*Age 0.0021 0.385
PCR*Shows -0.0028 -1.681 *
PCR*Races -0.4977 -1.360*
PCR *Members 0.0002 1.614*
PCR*Govern -0.8490 -2.054**
Number of 29 29 Observations
Significance levels fort-values in Table 8a are as follows: ***significant at 0.0 I level; **significant at 0.05 level; and *significant at 0.1 level.

59
TABLE 8b: Coefficients of Alternative Explanatory Variables
Dependent Variable : AI Score
Model3 Model4
Parameter T-value Parameter T-value Estimate Estimate
Intercept -9.0972 -2.955** -8.5383 -2.153*
Age 0.0064 3.927** 0.0052 2.457**
Shows -0.0031 -5.146*** -0.0023 -4.241 *
Races -0.0020 -1.933* -0.0001 -0.458
Members 0.0001 2.264* 0.00002 1.571
Govern -0.0809 -0.475 0.2458 2.088*
PCR -1.3506 -7.980*** -1.2565 -6.830***
Coefficient of -5.1560 1.937* Variation
Number of 11 11 Observations
Significance levels fort-values in Table 8b are as follows: ***significant at 0.0 I level; **significant at 0.05 level; and *significant at 0.1 level.
All the estimated coefficients have the predicted signs except for the Govern
variable in Model3, but the parameter estimate is not significantly different from zero.
The negative coefficients on Shows and Races imply that the more breed-only events the
registry sanctions, the more restrictive that breed is towards AI. The positive coefficient
on the Members variable supports the argument that registries with more members are
less likely to have the monopoly power necessary to restrict the use of AI. The positive
·significant sign on Govern supports the hypothesis that a registry governed by a central

60
board of directors will be more restrictive of AI. The significant and positive coefficient
for the PCR dummy verifies that the discovery ofPCR had a large impact on a breed
registry's decision to relax AI restrictions. The significance of the interactive terms
implies that breeds that adopted AI before 1985 responded differently to the explanatory
variables than breeds that adopted AI after 1985 or still have not yet adopted AI. Finally,
the significance of the Coefficient of Variation variable implies that the greater the
opportunities for cheating, the more restrictive the registry will be of AI.
Combining variables from each individual hypothesis presented in this chapter
provides a robust model to explain the different levels of AI restrictions imposed by breed
registries. The significance of each of the variables representing different explanations
suggests that AI restrictions exist not as a consequence of any one particular factor but of
a combination of factors.

61
CHAPTERS
USING AI TO IMPROVE ABSOLUTE PERFORMANCE IN OTHER LIVESTOCK INDUSTRIES
The previous chapter focused on explaining AI restrictions in the equine
industry. This chapter will provide a brief extension of the importance of relative versus
absolute performance and apply the hypothesized predictions to other livestock industries.
The hypothesis developed in the preceding chapter stated that, where absolute
performance matters, AI restrictions are not likely to exist and, where relative
performance matters, AI restrictions are likely to exist if the registry has the power to
enact regulations.
AI and the Cattle Industry
Artificial insemination has become a standard breeding procedure in the cattle
industry. Vials ofbull semen are shipped around the country and the world. Artificial
insemination has developed into its own industry with clearing houses established to act
as middlemen in artificial insemination transactions.
Dairy cattlemen in the United States were quick to adopt artificial insemination.
Beginning in 1906, the dairy industry was targeted by the Bureau of the Dairy Industry, a
department of USDA, with programs that focused on improving the genetic potential of
dairy herds. As mentioned in the introduction, by the mid 1930s, scientists in Russia and

62
easily and efficiently, and AI became available for commercial application. Dairy cattle
breed registries promoted the advantages that AI offered and the first farmer-owned
artificial breeding cooperative in the United States began operation in New Jersey in
1938. The increase in the average milk production per cow following the adoption of AI
was dramatic. 23,671,000 cows produced 109.4 billion pounds of milk in 1940. By 1978
the number of milk cows fell by more than half to 10,848,000 while total milk production
rose by more than ten percent to 121.9 billion pounds.
Beef producers were much slower than dairy producers to adopt AI. Dairy cattle
are handled everyday and facilities already exist to implement AI. Beef cattle are free
roaming and the labor intensiveness of AI was not practical. Few beef producers
expressed an interest in AI and the beef registries imposed the restriction that offspring
conceived through AI were only registerable if the bull and cow were owned by the same
proprietor. In the early 1950s many dairy cattlemen converted to beef operations in
response to the diminishing number of dairy cattle required to satisfy the market for milk.
These individuals, having previously recognized AI advantages of faster weight gain and
better conception rates, soon began to put pressure on the beef breed associations to
remove restrictions on AI.
Converted dairy farms had the structural facilities to handle many cows
individually and costs of adopting AI were not as high. Eventually, on January 15, 1968,
the U.S. Department of Justice filed a complaint against the American Angus Association
of St. Joseph, Missouri, charging that the restricted use of AI was a violation of the
Sherman Act involving restraint of interstate trade and commerce. On July 13, 1970, the

63
Sherman Act involving restraint of interstate trade and commerce. On July 13, 1970, the
Department of Justice agreed to a proposed consent judgement that terminated the anti
trust suit. The Angus Association was no longer allowed to impose limitations on the
sale of Angus semen. At the time the lawsuit was filed most of the eleven beefbreed
registries restricted AI. By the time the lawsuit was terminated two years later all beef
breed registries had eliminated AI restrictions.
AI and the Poultry, Swine and Sheep Industries
Artificial insemination has become the exclusive breeding procedure of the
turkey industry. The breasts on male turkeys have become so large that they are.unable
to mate naturally. Consequently there are no restrictions on AI use among turkey
registries. For their part, chicken breeders do not use AI exclusively, but there are no
restrictions placed on its use by any of the registries.
The use of AI in swine became a technological option only within the last three
years, chiefly because scientists had a difficult time maintaining the fertility of swine
semen once it had been cooled. Currently, twenty percent of commercial pedigree swine
breeders are using AI and that number is growing rapidly. The swine registries are
actively promoting AI and do not restrict its use in any form.
The use of AI in sheep is not widespread. Until recently it was difficult to
achieve good conception rates because physical problems existed in getting the semen
into a ewe's cervix. Two years ago, however, a transcervical procedure was developed
that has improved AI conception rates. Like the swine registries, sheep registries are
encouraging their members to adopt AI. Its use in commercial sheep breeding is expected

64
to grow. Meanwhile, no sheep registry imposes any restrictions on the use of AI.
Rewards for Improving Absolute Performance
An animal that is being bred for commercial production, whether it be for meat,
milk, or wool, will be valued according to the market price of its output as measured in
terms of quality and quantity. Genetic concepts, combined with artificial insemination,
have the potential to improve rapidly those characteristics that add market value to an
animal. In dairy cattle, for example, the amount of milk produced by a cow is used as the
performance measure. Bulls that have consistently sired cows with above average milk
production are considered more valuable and are selected for AI use. In the beef industry,
standardized performance measures, for example expected progeny differences (EPDs),
have been developed that rate bulls on their ability to produce offspring with above (or
below) average weight gains. Turkey breeders are rewarded on the basis of the size of the
breast of the bird produced. The swine industry has established standardized performance
measures for hogs, national sire summaries, which serve the same purpose as EPDs.
Sheep producers are either rewarded on the quality and absolute quantity of wool
produced, and/or on the pounds of meat taken to the butcher. All these species of
livestock have recognized industry-wide standards for use in determining the specific
characteristics of an economically valuable animal. Artificial insemination permits the
spread of desired genes throughout the national herd much more rapidly than would be
possible without it.
According to Improving Cattle by the Million, a 1981 text written by H.
Herman, before the development ofEPDs, beef breeders judged bulls on aesthetics in the

65
show ring1• In effect, a bull's value was determined on the basis of relative performance.
Not until the development ofEPDs did the beef breeder have information on a bull's
ability to sire calves that would be good weight gainers.
Artificial insemination is a technology that improves the genetic base of a herd
of livestock by spreading superior genes among females more quickly than would be
possible in the absence of AI. When there is a standardized measure for identifying
genetically superior animals, such as increased milk production in the case of a dairy cow,
technology advances that speed attainment of genetically superior animals will be
adopted. Improved absolute performance is a singular criterion for determining the
usefulness of any new breeding technology.
This chapter supports the hypothesis presented in Chapter 4 that, where absolute
performance matters, private and social marginal costs are equal and any technology that
lowers costs will be adopted. Moreover, for livestock evaluated on the basis of absolute
performance, the prediction is borne out that adoption of AI is more likely than for
livestock whose value is determined by relative performance.
1Although there were perfonnance measures that pre-dated EPDs, EPD's were the first ones to be widely accepted.

66
CHAPTER6
CONCLUSIONS
Artificial insemination revolutionized the traditional breeding structure of all
livestock industries. Among its more important advantages has been a considerable
lowering of the cost of producing offspring. Not only does it lower the risk of injury
inherent in any natural breeding, but it also reduces transportation costs because the male
and female do not have to be brought to the same physical location. An owner of female
breeding stock can choose a stallion without being bound by geographical limitations.
Artificial insemination also increases the number of females to which any one male can
be bred, because one ejaculation can be divided up to inseminate a number of females.
The advantages offered by AI in terms of increased production efficiency are
indisputable.
There does not appear to be any consensus on the disadvantages of artificial
insemination. AI certainly has the potential to narrow the gene pool of a species. Top
sires can produce larger proportions of the herd population. Additionally, should a
champion sire have an undiscemed genetic defect, widespread use of AI will spread the
defect more rapidly through the herd population than with natural breeding. A good
example of this is provided by the case of a champion Quarter Horse stallion, named
Impressive, who, unknown to breeders at the time, passed on a gene to many of his

67
offspring that causes a central nervous disorder. This disorder, in turn, brings on
epileptic-type seizures and can cause paralysis. Through the use of AI, Impressive was
bred to many more females than would have been possible without AI. The widespread
penetration of his dehabilitating genetic defect into the Quarter Horse breeding population
has alarmed many breeders beyond the Quarter Horse industry itself.
Proponents of artificial insemination argue that, with AI, the use of genetically
inferior sires will be reduced and the genetic traits of the breed will improve. When
natural covers· are required, inferior local sires are used where the costs of transportation
are prohibitive. AI gives many more breeders access to superior sires, resulting in
improved quality of offspring.
Proponents and opponents of AI seem to agree that the widespread use of AI will
reduce the genetic base of a herd population. The argument focuses on how this affects
the genetic quality of the breed. Proponents believe that AI will improve the quality of
offspring by removing inferior sires. Opponents believe that narrowing the genetic base
of the herd population will result in serious inbreeding and hence weakened bloodlines.
There are two explanations offered by breed registries to justify AI restrictions.
The first is their fear ·of the unknown consequences of narrowing the genetic base of a
herd. The second is a concern that maintaining accurate lineage records will be more
difficult and susceptible to fraud. Without a natural cover there is no guarantee that the
offspring is indeed the product of a specific stallion. "Before the advent of DNA
genotyping, blood typing was the only parental identification process available. The
ability to detect inaccurate registrations was far more limited with blood typing than it is

68
with DNA genotyping. DNA genotyping is almost one hundred percent effective as a
' tool for identifying a foal's lineage. Breed registries that imposed restrictions on AI to
safeguard the accuracy oflineage records now have the ability, through DNA genotyping,
to determine the lineage of any foal conceived by AI at a ninety-nine percent level of
accuracy. Consequently, imposing AI restrictions to ensure accurate lineage records is no
longer necess.ary.
This thesis has examined the economic motives of an equine breed registry to
restrict the use of artificial insemination. In summary, tests of the hypotheses proposed in
Chapter 4 provide empirical evidence that:
I. The advent of affordable DNA genotyping has resulted in relaxation of AI restrictions.
2. The higher the variation in stud fees for a particular breed, the more likely a registry will be to restrict AI.
3. Restrictions on the use of AI imposed by the Jockey Club on Thoroughbred breeders serve the same purpose that restrictions on team sizes, practice times and salaries serve in major league sports: to limit the amount of resources spent developing skill levels above the socially efficient optimum. Where relative performance is important, social and private marginal costs are different.
4. The monopoly theory developed by Ray and Grimes (1991) and Coehlo and Synder (1987) to explain the presence of AI restrictions is, at best, an incomplete explanation. In addition to monopoly power, opportunistic behavior and the importance of relative performance combine to provide a more complete explanation of why different registries have such varied policies regarding the use of AI.


70
American Horse Council 1995 Horse Industrv Directory.
Aronson, T. As opposed to Thoroughbreds. Standardbreds Getting Faster. Maryland Horse.
Barth, A.D. (1993). Factors Affecting Fertility with AI. Veterinary Clinics of North America. Food Animal Practice. July. 9(2):275-289
Blanchard, T.L. and D.V. Dickson (1996). Evaluating Breeding Soundness in Stallions. Veterinary Medicine. February. 144-155.
Bowling, A.T. (1985). The Use and Efficacy ofHorse blood Typing Tests. Equine Veterinary Science. 5:195-199. ·
Box, G.E.P. and D.R. Cox. An Analvsis of Transformations. Journal of the Royal Statistical Society (Series B): 211-243. ·
Boyle, M.S. (1992). Artificial Insemination in the Horse. Ann Zootech. 41: 311-318.
Carlton , W. and J. Perloff (1990). Modem Industrial Organization Harper Collins Publishers.
Coelho, P. and J. McClure (1987). Barriers to Entry in the Market for Stud Services: Government and "Non-Profit" Institutions in Collusion. Economic Inquiry. October 25: 659-670.
Dougan, W. and J. Snyder. Optimal Market Restrictions in Professional Sports. Working Paper.
Frank, R.H. (1991). Microeconomics and Behavior. McGraw-Hill, Inc. New York.
Griliches, Z. (1960). Hybrid Com and the Economics oflnnovation. Science. July 29, 132(3422):275-280.
Herman, H. (1981). Improving Cattle by the Million: NAAB and the Development and Worldwide Application of Artificial Insemination. University of Missouri Press. Columbia.
Hirshleifer, J. and A. Glazer. (1992). Price Theory and Applications. Prentice Hall, New Jersey.

71
Klein, B. and K. Leffler (1981). The Role of Market Forces in Assuring Contractual Performance. Journal of Political Economy. 89:41.
One Hundred and Twentv-Second Kentucky Derbv. Churchill Downs. Louisville, Kentucky. 1996.
Pindyck R.S. and D.L. Rubinfeld (1991). Econometric Models and Economic Forecasts. McGraw-Hill, Inc., New York.
Ray, M. (1988). Technological Change. Production Efficiencv. and Regulation in the Equine Industry. PhD Dissertation. University ofTennessee, Knoxville.
Ray, M. and P. Grimes (1991). The Determinants ofBreedimr Rewlation in the Horse Industry: An Empirical Analysis. The Journal of Socio-Economics. 20(2): 169.:180.
Trotting and Pacing Guide. United States Trotting Association. 1996.
Why'd They do That? ... And Answers to Other Questions About AQHA's Change to DNA Testing for Parentage Verification (1994). The Quarter Horse Journal. December.

73
Allen, W., J.M. Bowen, C.J. Frank, L.B. Jeffcott and P.D. Rossdale. (1976). The Current Position of AI in Horse Breeding. Equine Veterinary Journal. 8:72-74.
Alston, J.M. Norton,G.W. and P.G. Pardey (1995). Science Under Scarcity. Cornell University Press. Ithaca.
Armann, R.P. and B. W. Pickett. (1987). Principles pf Crvopreservation and a Review of Cryopreservation of Stallion Spermatozoa. Equine Veterinary Science. 7:3.
Bailey, M.T., R.M. Bott and T. Gimenez. (1995). Breed Registries' Regulations on Artificial Insemination and Embryo Transfer. Journal of Equine Veterinary Science. 15:2 60-66.
Becker, G.S. and G. Stigler (1977). De Gustibus Non Est Disputandum. American Economic Review. 67:76-90.
Biles, D.B. (1995). Why Not AI. The Blood-Horse. December.
Bowling, A.T. and R.S. Clark. (1985). Blood Group and Protein Polvmorphism Gene Frequencies for Seven Breeds of Horses in the United States. Animal Blood Groups and Biochemical Genetics. 16:93-108.
Bowling, A.T., M.C.T. Penedo, M.L. Stott, and W. Malyj. (1995). Blood typing and DNA Testing for Parentage Verification. The Morgan Horse. January.
Cunningham, P. (1991). The Genetics ofThoroughbred Horses. Scientific American. May.
Davis, L.E, and North, D.C. (1971). Institutional Change and American Economic Growth. Cambridge University Press.
Frank, R.H. (1985). Choosing the Right Pond. Oxford University Press: New York.
Fraser, P. (1994). Your Decision will Impact the Future. Paint Horse Journal. August.
Fudenberg D. and E. Maskin (1986). The Folk Theorem in Repeated Games with Discounting or with Incomplete Information. Econometrica. May. 54(3): 533- · 554.

74
Griliches, Z. (1958). Research Costs and Social Returns: Hybrid Corn and Related Innovations. Journal of Political Economy. October. 66(5):419-432.
Griliches, Z. (1957). Hvbrid Corn: An Exploration in the Economics of Technological Chan2:e. Econometrica. October. 25(4):501-522.
Henry, V. (1981). Utilizing Artificial Insemination to Maximize Production. Dept. of Agriculture, Colby Community College. Colby, Kansas.
Kreps, D.M. and R. Wilson (1982). Reputation and Imperfect Information. Journal of Economic Theory. August 27(2):253-279.
Loomis, P. The Eguitainer for Cooled Transported Equine Semen HamiltonThorn. Danvers, MA. (Pamphlet, date unknown).
Lynch, B. (1996). To Ship or Not To Ship?. Classic Horseman. January.
Malafosse, A. (1990). Propag:ating: oflmproved Breeds Using Artificial Insemination and Embryo Transplants. Revue Scientifique et Technique. September. 9(3):795-824.
Mansfield, E. (1982). Technology Transfer. Productivity. and Economic Policy. W. W. Norton and Company. New York.
Mansfield, E. (1968). The Economics ofTechnological Change. W.W. Norton and Company, Inc. New York.
McVey, J (1984). Letter from Janet McVey to ApHC Transported Semen/DNA Committee.
Milgrom, P. and Roberts, J. (1982). Predation, Reputation. and Entry Deterrence. Journal of Economic Theory. August 27(2):280-312.
Ni, H. and M. A. Blajchman (1994). Understanding the Polymerase Chain Reaction. Transfusion Medicine Reviews. October 8( 4): 242-252.
North, D.C. (1990). Institutions. Institutional Change and Economic Performance. Cambridge University Press. Cambridge.
North, D.C. (1981). Structure and Change in Economic History. Norton. New York.

75
O'Ferrall, G.J.M. and E.P. Cunningham (1974). Heritability of Racing Performance in Thoroughbred Horses. Livestock Production Science. 1:87-97.
Posner, R.A. (1974). Theories ofEconomic Regulation. The Bell Journal of Economics. 5(2):335-358.
Rao, P. and R.L. Miller (1971). Applied Econometrics. Wadsworth Publishing, Belmont, California.
Ray, M. (1988). The Economics of Artificial Insemination. Appaloosa Journal. December.
Ray, M. (1989). The Economic Impact of Artificial Insemination on the Morgan Horse Breed. The Morgan Horse. June.
Ray, M. (1991). Advertising and Pricing Policies in the Equine Breeding Industry or Sex and the Single Stallion. Applied Economics. 23:755-762.
Ryan, B. (1948). A Studv in Technological Diffusion. Rural Sociology. 13(3): 273:.285).
Schmidt, P. and R.P. Strauss (1975). The Prediction of Occupation Using Multiple Logit Models. International Economic Review. 16(2): 471-486.
Schmitz, D. (1993). Sires. Starters. And Stud Fees. The Blood-Horse. March. 1168-1170.
Steele, C.N. (1995). Discovery, Transaction Costs, and Growth. Advances iri Austrian Economics. 2B:447-459.
Streeter, D. (1994). The Transported Semen Partnership. Paint Horse Journal. December. 58-60.
Stormont, C. andY. Suzuki. (1964). Paternity Tests in Horses. Serology Laboratory, School ofVeterinary Medicine, University of California, Davis. California.
Tesio F. (1958). Breeding the Racehorse. J.A. Allen and Company, London.
Tierney, J.S. and L.R. Schaeffer. (1994). Inclusion of Semen Price ofthe Sire in an Animal Model to Account for Preferential Treatment. Journal of Dairy Science. February. 77(2):576-582.

76
Tierney, J.S. and L.R. Schaeffer. (1994). Inclusion of Semen Price ofthe Sire in an Animal Model to Account for Preferential Treatment. Journal of Dairy Science. Febnuiry. 77(2):576-582.
Walther, A. (1995). The Fiscal Side of AI. The Horse. September.


79
Year Number of Established Number of Breeds that Number of Breeds that Breed Registries Allow On-Site AI Allow Shiped Semen
1950 13 2 1
1951 15 2 1
1952 15 2 1
1953 15 2 1
1954 16 2 1
1955 16 2 1
1956 17 2 1
1957 17 2 1
1958 17 2 1
1959 17 2 1
1960 17 3 2
1961 17 3 2
1962 18 3 2
1963 18 3 2
1964 18 3 2
1965 18 5 2
1966 18 5 2
1967 18 6 2
1968 18 6 2
1969 18 6 2
1970 20 7 2
1971 21 11 3
1972 22 13 4
1973 22 13 4
1974 23 13 4

80
Year Number of Established Number of Breeds that Number of Breeds that Breed Registries Allow On-Site AI Allow Shipped Semen
1975 23 14 4
1976 25 15 5
1977 26 15 5
1978 27 16 6
1979 27 16 6
1980 27 16 6
1981 27 16 7
1982 28 17 7
1983 29 18 8
1984 29 18 9
1985 29 19 11
1986 29 21 13
1987 29 21 13
1988 29 21 15
1989 29 22 16
1990 29 23 17
1991 29 24 20
1992 29 25 21
1993 29 26 22
1994 29 26 22
1995 29 26 23

81
B. SUMMARY STATISTICS, DATA AND ADDITIONAL REGRESSION RESULTS FOR OPPORTUNISTIC BEHAVIOR IT:
VARIATIONS IN STUD FEES

82
Breed Minimum Maximum Mean Median Coefficient AI (# Obs) Stud Fee Stud Fee Stud Fee Stud Fee of Variation Score
Appaloosa 200 2000 627 525 0.41 0.53 (161)
Arabian 500 5000 1812 1500 0.43 0.62 (216)
Belgian 100 600 307 300 0.37 0.12 (85)
Miniature 200 5000 1369· 1000 0.84 0 (88)
Morgan 250 5000 1455 1200 0.52 0.40 (99)
Perc heron 100 500 273 275 0.34 1.54 (30)
POA 100 600 230 200 0.35 0.73 (150)
Quarter 250 4000 1093 1000 0.65 0.62 (159)
Tennesse 150 1500 483 400 0.52 0.92 Walker (415)
Thorough- 0 125000 5872 3000 1.74 0 bred (547)
Trakehner 650 3000 1185 1200 0.31 0.84 (63)

83
ADDITIONAL REGRESSION RESULTS
Modell- No Thoroughbreds Model2- No Miniatures Model 3 -No Thoroughbreds or Miniatures
Dependent Variable : AI Score
Model 1 Model2
Variable Parameter T-value Parameter T-value Estimate Estimate
Intercept 1.484292 3.551 ** l.l73506 3.550**
Coefficient -1.868138 -2.133** -1.092473 -1.594* of Variation
Model3
Parameter T-value Estimate
1.064668 2.064*
-0.836413 -0.723
Significance levels for one tailed t-values are as follows:**significant at 0.05 level; *significant at O.llevel


Variable
Stud Fee
Career Earnings (in Millions)
Years Raced
Number of Starts
Number of Wins
Mean
3973
0.652710
3.8082
24.0593
6.6347
85
Standard Deviation
4283
0.8045828
1.2669
16.5734
4.0697
OBS STUDFEE EARNED YRSRACED WINS
1 2 3 4
5 6 7 8 9 10 11 12 13 14 15 16 17 18 19 20 21 22 23 24 25 26 27 28 29 30 31 32 33 34 35 36 37 38 39
2000 0.24246 1000 0.30948 2000 0.02487 7500 0.93069 5000 0.81187 2000 0.35448
500 0.01109 3500 0.09708 2500 0.04270 5000 0.26117
15000 2.27278 1500 0.24724 5000 0.31372
15000 3.60117 1000 0.57001 2000 0.22885 2500 1.00388 1500 0.68240 2000 0.31598 7500 0.38055 3500 0.39153 2500 0.02611 2000 0.87549 1500 0. 71134 7500 0.92141 2500 1.30084 2500 0.24152
15000 1.59379 1500 0.13697 3500 0.19487 3000 0. 27113 3500 0.39272 6000 1.09754 1500 0.09106 3000 0.16311 1000 0.15448 3000 0.04051 5000 1.74261 3000 0.03182
4 7 4
3 4 5 3 3 4 2 4 7 4 4 6 4 7 5
3 2 1
3 5 6 3 5 3 3 2 2 4
4 2 5 6 4
3 4 2
5
19 1
9 10
5 1 2 2 7 9
12 8
18 17
7 13
8 4 4 4
1 6 9
11 10
4 7 2 3 4
5 3 3
13 6
3 6 1
Minimum
200
0
1
1
0
STARTS
19 63
4 18 35 23 12 11
8 16 26 77 21 45 58 27 81 18 13
6 8
15 67 34 25 34 10 20 10 14 13 26 10 26 67 26
5 26
7
LIVE FOAL
1 1 1
1 1 1 1 1 1 1 1 1 1 1 1 1 1 0 1 1 1
1 1 1 1 1 1 1 1 1
1 1
1 1 1 1 1 1 1
Maximum
30000
4.7964476
8
124
22
BREED CUP
1 1 1 1 1 1 0 1 1 1 1 1 1 1 1 1 0 1 1 1 1 1
1 1 1 1 1 1
1 1 1 1
1 0 1 0 1 1 1

OBS
40 41 42 43 44 45 46 47 48 49 so 51 52 53 54 55 56 57 58 59 60 61 62 63 64 65 66 67 68 69 70 71 72 73 74 75 76 77 78 79 80 81 82 83 84 85 86 87 88 89 90 91 92 93 94 95 96 97 98 99 100 101 102
STUD FEE
3500 4000
25000 750
1000 2500 3000 6500 2500 2000 3500 5000 1500 2500
750 1500 3500 2500 2000 5000 2500 2500 3500 7500 4000 2500 8500 -7500 5000 2500
10000 5000 2500 2500 1000 1000 3500 2500
30000 1000 2500 5000
20000 1000 5000 3000
10000 2000
200 3000 2500 2000 1000
500 7500 5000 1000 2500 1500 1000 1500 3500 3000
EARNED
0.45669 0.14794 3. 62036 0. 03272 0.11074 0.49543 0.60501 0.22566 0.59975 0.71629 1.68466 0.63156 0.52813 0.07645 0.22959 0.40418 1. 06836 0.20109 0.54116 3.09527 2.34686 0.40816 0.18699 2.33095 1.66295 0.46673 1.40359 0.48849 0.34120 0 .. 69187 0.95125 0.77751 0.40557 0.10213 0.17496 0.15754 0.40278 4.28063 3.01807 0.02349 0.20340 0.17878 1.31378 0.12329 0.04773 1.78917 1.25192 0.13323 0.10109 0.28816 0.61029 0.21428 0.14505 0.15993 1.43751 0.18584 0.63540 0.13315 O.H015 0.13996 0.07692 0.51814 0.17433
YRSRACED
2 3 4 2 4
4 4 4 5 4
3 2 4
4
5 4
5 5 3 3 4
5 6 4
5 3 4
4 2 5 2 3 3 3 6 5 4 4
2
2 3 3 3 2
3 4 5 2 2 2 4 4
5 6 3 3 7 4
3 3 3 3 4
86
WINS
5 1
11 2 5 9 6 3
11 9
12 6
9 4 9 5 8 4 9 8 9 7
12 12 10
7 6 8 4
15 4 6
14 4 4
8 8 8 7 2
3
5 15
3 2
ll 8 3 3 3 8 7 7 6
7 4
22 5
5 4
3 3 6
STARTS
14 13 36
8 14 20 25 15 50 32 22 15 38
6 37 24 14 33 32 23 24 44 51 33 27 39 22 23 16 41
6 15 23 15 20 43 15 34 14
8 14 24 22
9 9
25 20 11 11 13 28 52 24 43 13 16
124 21 27
7 n 15 22
LIVEFOAL
1 1 1 1 1 1
1 1
1 1 1 1 1 1 1 1 1
1 1 1 1 1 1 1 1 1 1 1 1 1 1 1 1 1 1 1 1 1 1 1
1 1 1 1 1 1 1 1 0 1 1 1 1 1 1 1 1 1 1 1 1
1 1
BREEDCOP
1 1 1 1
0 1 1 1 1 1 1 1 1 1 0
1
1 1 1 1 1 1 1 1 1 1 1 1 1 1 1 1 1 1 1 0
1 1 1
1 1 1 1 1 1 1 1 1 1 1 1 0 0 1 1 1 1 1 1 1 1 1
1

OBS
103 104 105 106 107 108 109 110 111 112 113 114 115 116 117 118 119 120 121 122 123 124 125 126 127 128 129 130 131 132 133 134 135 136 137 138 139 140 141 142 143 144 145 146 147 148 149 150 151 152 153 ;!.54 155 156 157 158 159 160 161 162 163 164 165
STlJDFEE EARNED
1500 0.38350 10000 2.93719
sao o.oo882 3500 1.16179 3000 0.09747
10000 . 1.91697 2500 0.73653 5000 0.36460 7500 1.44142 2500 0.11362 1500 0.36715 1000 0.04954 1000 0.42228
500 0.17665 3500 0. 71033 3000 0.22064 3000 0.24356 4000 0.40824 2500 0.59896 5000 1.49673
10000 1.78148 1000 0.04310 3500 0.75380
500 0. 66206 1500 0.09730 7500 0.45908
10000 1.25523 2000 0.25655 3500 1.61934
15000 2.79668 3500 0.08600
10000 0.36120 1500 0.01753 1000 0.19499 4000 0.20127 2000 0.75823 7500 2.41726 2500 0.00306 2500 0.33958 1000 0.41657
10000 1.87527 10000 0.80612
1000 0.20092 1000 0.15120 1000 0.20335 1000 0.04962 1000 0.13385 2500 0.89898 2500 0.28841 2500 0.62215 2000 1. 31436 7500 0.69981 6000 0.37708 4000 0.64019 3500 0.37390 5000 0.53622 1000 o. 30887 3000 0.09118 3000 0.83788 3500 1.13436
200 0.00758 1000 0.45465
15000 3.33032
YRSRACED
3 5 3 4 2 5 3 5 2 4 5 3 6 4 5
6 5 3 5 3 4 5 4 6 5 2 2 4
4 4 3 2 3 4 3 5 4 2 6 5 4 4 3 6 5 4 5 4 4 4
4
3 4 4 3 2
6 2
3 4
4 4 4
87
WINS
4 10
1 12
4 8
16 5 6 4 9 2 7 2 8 7 6 5 9 9
10 2
8 20 11
4 7 0
10 9 4
5 3 3 3
15 9 0
5 11
5 4 4 8 3 2 7 6 5 7
14 4 6
9 2 7
8 3 6
11 1
4
15
STARTS
11 36 14 52 12 42 20 25 11 10 43 13 43 18 19 19 30 14 24 17 30 19 25 59 23
8 11 16 38 32 11
9 6
25 13 42 17
3 24 39 19 12 23 58 17 19 18 29 21 21 33 14 22 35 17 21 58
4 22 32
5 16 29
LIVE FOAL
1 1 0 1 1
1 1 1 1 1 1 1 1 1 1 0 1 1 1 1 1 1 1
0 1 1 1 1 1 0 1
1 1 1 1 1 1 1 1
1 1 1 1 1 0 1 1 1 1 1 1 1 1 1 1 1
1 1 1
1
0 1 1
BREED CUP
1 1 1 1 1 1 1 1 1 1 1 1 1 1 1 1 1 1 1 1 1 1 1 0 1 1 1 1 1 1 0
1 1 0 1 1 1 1 0 1
1 1 1 1 1 1 1 1 1 1 1 1 1 1 1 1 0 1 1 0
1 1 1

OBS
H6 ~67
~68
~69
~70
~7~
~72
~73
~74
~75
~76
~77
~78
~79
~80
~8~
~82
~83
~84
~85
~86
~87
~88
~89
~90
~9~
~92
~93
~94
~95
~96
~97
~98
~99
200 20~
202 203 204 205 206 207 208 209 2~0
211 2~2
n3 2~4
2~5
2~6
2~7
2~8
2~9
STUD FEE
~500
2500 ~000
2500 ~500
~000
~11~
~000
~500
600 5000 2000 2000 3500 2500
25000 2000 ~000
7500 7500 2000 4000 2000 ~500
2000 5000 4500 5000 7500 5000 2500 2500 ~000
2500 2500 2000 ~000
500 7500 ~0000
20000 ~000
5000 3000 3000 3500 5000 ~500
~500
~000
5000 ~500
500 5000
EARNED
0.00000 0.35370 0.0~603
0.59329 0.3~743
0.03659 0.0370~
0. 0~572 0.26592 0.04026 0.94~37
0.3370~
~-245~8
0.38863 0.07480 ~.63582
0.0705~
0.004~0
0.43943 L 66113 0.84943 0.~7020
0.79404 0.~2327
O.H779 0.~9220
0.39385 0.27457 L~69B
~.02~0~
0.44788 0.~9764
0.11564 0.06290 0.93300 0.2~802'
0.09089 0.06684 2.323~8
0.22680 4.79645 0.~6785
L6~649
0.~9909
0.~2459
0.83473 ~-0~~82
L2056~
0.33232 o.2n26 0.35~74
0.32496 0.22858 0.27780
YRSRACED
2 5 2 5 4
2 2 3 4 5 4 4 8 3 4 2 3 3 3 3 6 3 5
2 4
5 4
3 3 4 4 5 7 3 4
4 3 4
5 2 3 4
5 4 2 4
4 5 2 6 3 5 2 3
88
WINS
0 8 ~
~4
6 2 ~
~
6 2
~0
~0
~7
7 2 6 4
0 6 9
11 3 8 3 5 4
6 5 4
8 9 8 8 2 9 7
4 4
~3
5
8 5
8 7 2 9
~0
8 5
~8
5 11
4
5
STARTS
2 25
7 57 26
4 6 4
22 13 27 33 79 ~9
27 11 14 ~
~9
23 4~
~7
32 5
22 ~8
22 8
20 ~9
28 2~
n 5
37 2~
~7
20 32
6 24 ~2
48 27
7 29 29 45
8 65 24 48 ~2
B
LIVE FOAL
0 ~
~
~
~
~
~
~
~
0 ~
~
~
~
~
~
~
~
~
~
~
~
~
~
~
0
~
~
~
~
~
~
~
~
~
~
~
~
~
~
1 1 1 0
1 ~
1 ~
1 0 1 1 1
1
BREED CUP
1 ~
1 ~
~
~
0 ~
~
0 ~ .1
1 1 ~
1 ~
~
1 ~
1 ~
1 1 1 1 1 1 1 1 1 1 1 ~
~
~
1 1 1 1 1 1 1 1 1 1 1 ~
~
0 ~
1 1 1

00
\0

OBS
].
2 3 4 5 6 7
8 9
:10 ].].
:12 :13 :14 :15 :16 :17 :18 :19 20 2:1 22 23 24 25 26 27 28 29 30 3:1 32 33 34 35 36 37" 38 39 40 4:1 42 43 44 45 46 47 48 49 50 5:1 52 53 54
YEAR
:1936 :1937 :1938 :1939 :1940 :194:1 :1946 :1947 :1948 :1949 :1950 :195:1 J.952 J.953 :1954 :1955 :1956 J.957 J.958 J.959 J.960 J.96J. J.962 J.963 J.964 J.965 J.966 J.967 J.968 J.969 :1970 :L97J. J.973 :1975 J.976 :1977 :1978 :1979 J.980 :L98J. :1982 J.983 J.984 J.985 :1986 :1987 :1988 :1989 J.990 J.99J. :1992 J.993 J.994 :1995
90
SBPURSE
J.OOOO 9259 9570 9000 9075 8330
2578J. 36905 5007J. 57J.54 54665 66659 6623J. 67458 63J.2:L 62702 5373:1 50460 53330 538J.O 64040 59330 55230 6J.J.28 57096 65J.33 6J.602 58642 57398 54757 7635J. 634J.5 64:173
J.OOOOO J.OOOOO J.OOOOO :100000 J.OOOOO J.OOOOO :1243].]. :L:L6200 J.50000 J.84800 J.85500 J.60530 J.J.6837 J.709:LO :177230 :180000 J. 78J.40 J. 72000 J.57000 J.62700 J.5J.600
TBPURSE
45000 55000 55000 55000 80000 80000
J.05000 J.:L4660 J.J.6450 :129650 :125700 J.3J.J.OO J.34350 J.23J.OO J.29J.OO :157500 J. 72550 J.57050 :165500 :168750 :163950 J.68000 J.67J.50 J.56400 J.6J.800 J.59500 J.68000 J.67200 J.70J.OO J.60700 ]. 73300 J.93000 203800 277:100 232700 282200 254400 335400 384300 457415 590J.OO 573000 752400 62J.800 824400 833600 826200 789200 796000 945800
J.OJ.4800 :1025900
9J.8800 997400
SBWIN TBWIN
J.2J..25 :123.6 J.2J..25 J.23.2 J.20.75 J.24.8 J.22.50 J.23.4 J.22.00 :125.0 J.22.25 J.2J..4 J.20.50 126.6 J.24.20 J.26.8 J.23.40 :125.4 J.25.40 :124.2 122. 00 J.2J.. 6 J.2J..40 J.22.6 J.20.00 J.2J..6 J.20.60 J.22.0 J.2J.. 00 :123. 0 J.20. 60 J.2J.. 8 :122.00 :123.4 J.22.20 J.22.2 J.J.9.20 :125.0 J.2J..20 :122.2 1:18.60 :122.4 ].].8.20 :124.0 J.J.9.20 J.20.4 lJ.7.20 J.2J..B lJ.8.20 J.20.0 ].].9. 60 :L2J.. 2 J.J.9.60 J.22.0 1:19.60 J.20.6 lJ.7.00 J.22.2 J.J.9.00 J.2J..8 :L:L9.80 J.23.4 1:18.20 :123.2 J.J.9.20 J.J.9.4 :L:L9.60 J.22.0 :L:L9. 00 J.2J.. 6 1:17.60 J.22.2 J.J.B .60 :L2J..2 1J.7.80 122.4 :L:LB.OO 122.0 1:17.60 :122.0 1J.7.00 122.4 1:15.80 J.22.2 J.J.5.60 J.22.4 1J.5.40 J.20.2 J.J.5.40 J.22.8 1:15.00 J.23.4 J.J.5.00 J.22.2 1J.4.40 J.25.0 J.J.4.40 J.22.0 J.J.4.60 J.23.0 J.J.4.6 :123.0 J.J.2.6 J.22.4 J.J.3.6 J.23.6 :LJ.5. 4 J.2J.. 2

rn r:n ! ...:::
r:n ~ ..... r:n
>-1
.....
()
r:n ~ t:J
\0
~ .....
..
>
"''"j
0 ?d
()
0 ~ ~ ~ ~
0 t:J
tr1 ~

Variable
AGE SHOWS RACES MEMBERS
BREED AGE
Angloarab ~95~
Appaloosa ~938
Arabian ~908
Half arab 1951 Belgian ~887
Clydesdale ~879
cream Draft ~944
Hackney ~977
Haflinger ~976
Hanoverian ~978
Holstiener H76 Minature ~970
Morgan ~909
National } Show Horse ~982
Paint ~962
Pasofino ~972
Percheron ~876
Peruvian Paso H70 Pinto 1.956 Ponies of America J ~954
Quarter ~940
Racking 1.971. Saddlebreds ~89~
Shetland 1.888 Suffolk ~900
Tennessee } Walkers 1.935 Thorougbred 1.894 Trakehner 1.974 Dutch Warm } Blood ~983
N
29 29 29 29
Mean
~941. ~0
237.275862~
2858.2~
~8~48.45
SHOWS RACES
432 0 733 800 428 723 432 0
25 0 4 0 0 0 0 0 0 0 0 0 0 0
~50 0 ~4 3
~ 0 ~01.6 27~
~20 0 0 0
36 0 200 0
325 0 2288 1.0398
200 0 0 0
50 0 0 0
423 0 0 70693 4 0
0 0
92
Std Dev
36.~439037
468.06325~0
B~88.~2
5~322.76
MEMBERS
750 28673 22339 29828
5500 700
36 490 400
~000
500 2000
11500
850 48089
4922 2500
1.300 6200
2200 2751.64
3000 7277 3200
200
~5687
50000 ~000
~000
Minimum
~876.00
0 0
36.0000000
PCR.ON COEFVAR
0 0 0.4~
0 0.43 0 ~ 0.37 0 ~
~
~
0 0 ~ 0.84 ~ 0.52
0 0 0 0 0.34
0 1.
0 0.35 0 0.65 0 0 1. 1.
0 0.52 1. l. 74 1. 0.31.
0
Maximum
~983.00
2288.00 70693.00
275~64.00