The Economic Outlook for the U.S. and Indiana - IN.gov Economic Outlook for the U.S. and Indiana Jim...
32
The Economic Outlook for the U.S. and Indiana Jim Diffley Senior Director Chief Regional Economist IHS Global Insight April 15, 2011
Transcript of The Economic Outlook for the U.S. and Indiana - IN.gov Economic Outlook for the U.S. and Indiana Jim...

The Economic Outlook for
the U.S. and Indiana
Jim Diffley
Senior Director
Chief Regional Economist
IHS Global Insight
April 15, 2011

Copyright © 2010 IHS Global Insight. All Rights Reserved.
2
Global Outlook Summary
• The global economic expansion is continuing at a healthy
pace, but risks are mounting.
• Japan’s economy will recover from the devastating March 11
earthquake; global supply chains face near-term disruptions.
• Turbulence in MENA presents risks to oil supplies and prices.
• Europe faces an extended period of weak growth as sovereign
debt problems are resolved.
• Emerging markets continue to offer the best growth prospects.

Copyright © 2010 IHS Global Insight. All Rights Reserved.
3
-8
-6
-4
-2
0
2
4
6
8
2001 2003 2005 2007 2009 2011 2013
3
4
5
6
7
8
9
10
11
Real GDP Growth (Left scale) Unemployment Rate (Right scale)
(Annual percent change) (Percent)
A Growing U.S. Economy Will Cut Unemployment

Copyright © 2010 IHS Global Insight. All Rights Reserved.
4
2009 2010 2011 2012
Real GDP -2.6 2.9 2.8 2.9
Consumption -1.2 1.7 2.6 2.6
Residential Investment -22.9 -3.0 -1.0 25.9
Business Fixed Investment -17.1 5.7 9.0 7.7
Federal Government 5.7 4.8 -0.1 -3.3
State & Local Govt. -0.9 -1.4 -1.8 -1.0
Exports -9.5 11.7 9.9 9.6
Imports -13.8 12.6 5.8 6.7
(Percent change)
U.S. Economic Growth by Sector

Copyright © 2010 IHS Global Insight. All Rights Reserved.
5
Is Inflation Heating Up?
• Inflationary pressures
• Rapid growth in emerging markets
• Expansionary monetary policies
• Oil supply disruptions in Libya
• Rising commodity prices
• Countervailing restraints
• Excess productive capacity
• Slack labor markets
• Global competition

Copyright © 2010 IHS Global Insight. All Rights Reserved.
6
0
1
2
3
4
5
2000 2001 2002 2003 2004 2005 2006 2007 2008 2009 2010 2011
In U.S. Dollars In GDP-Weighted Currency Basket
(IHS Global Insight Indexes, 2002:1=1.0)
Industrial Materials Prices Have Surged

Copyright © 2010 IHS Global Insight. All Rights Reserved.
7
(Year-over-year percent change)
-2
-1
0
1
2
3
4
5
6
1998 2000 2002 2004 2006 2008 2010 2012 2014
All-Urban CPI Core CPI Employment Cost Index
U.S. Core Inflation Will Drift Upward

Copyright © 2010 IHS Global Insight. All Rights Reserved.
8
(Percent)
0
2
4
6
8
10
12
1990 1993 1996 1999 2002 2005 2008 2011 2014
Federal Funds 10-Year Treasury 30-Year Mortgage Rate
U.S. Interest Rates Will Rise in 2012
Copyright © 2010 IHS Global Insight. All Rights Reserved.
9
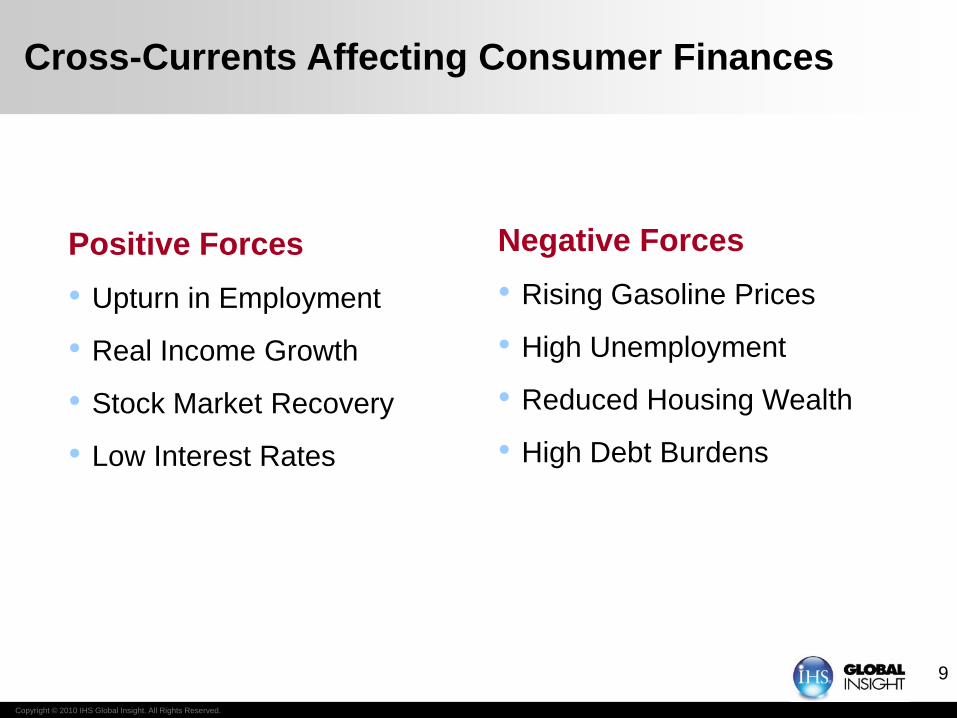
Cross-Currents Affecting Consumer Finances
Positive Forces
• Upturn in Employment
• Real Income Growth
• Stock Market Recovery
• Low Interest Rates
Negative Forces
• Rising Gasoline Prices
• High Unemployment
• Reduced Housing Wealth
• High Debt Burdens

Copyright © 2010 IHS Global Insight. All Rights Reserved.
10
-4
-2
0
2
4
6
8
2001 2003 2005 2007 2009 2011 2013
50
60
70
80
90
100
110
Real Consumption Growth Consumer Sentiment
(Annual percent change) (Reuters/Michigan Index, 1966=100)
Consumers Are Cautious: Real Spending Growth

Copyright © 2010 IHS Global Insight. All Rights Reserved.
11
-6
-3
0
3
6
9
12
2000 2002 2004 2006 2008 2010 2012 2014
Durable Goods Nondurable Goods Services
(Percent change, chained 2005 dollars)
Durable Goods Lead the Ups and Downs in Real
U.S. Consumer Spending

Copyright © 2010 IHS Global Insight. All Rights Reserved.
12
A Delayed Recovery in Housing Markets
• The recession led to a drop-off in household formation.
• Home affordability has greatly improved, boosting demand.
• High mortgage foreclosure rates are adding to excess supply,
depressing prices and holding back new construction.
• Sustained job growth will spark a housing market recovery.
• Multifamily units’ share of housing starts will rise.

Copyright © 2010 IHS Global Insight. All Rights Reserved.
1313
0.0
0.4
0.8
1.2
1.6
2.0
2.4
2003 2004 2005 2006 2007 2008 2009 2010 2011 2012 2013
165
175
185
195
205
215
225
Housing Starts (Left scale) FHFA House Price Index (Right scale)
(Million units)
U.S. Housing Starts Have Hit Bottom:
Prices Not Quite There Yet
(Purchase-only index, 1991Q1 = 100)

Copyright © 2010 IHS Global Insight. All Rights Reserved.
14
Risks to the US Forecast
Downside Risks
– Oil supply disruptions spread, causing prices to soar.
– Financial instability returns; housing recession drags on.
– Consumers retrench after setbacks to asset values and purchasing power.
– Businesses are reluctant to hire or invest.
Upside Risks
– Credit channels function smoothly, supporting investment.
– Rapid technological progress boosts real income growth.
– Robust growth in many emerging markets fuels exports.

Copyright © 2010 IHS Global Insight. All Rights Reserved.
15
-8
-6
-4
-2
0
2
4
6
2007 2008 2009 2010 2011 2012 2013
Baseline (60%) Pessimistic (20%) Optimistic (20%)
(Percent change, annual rate)
Real GDP Growth in Alternative Scenarios
Copyright © 2010 IHS Global Insight. All Rights Reserved.
16
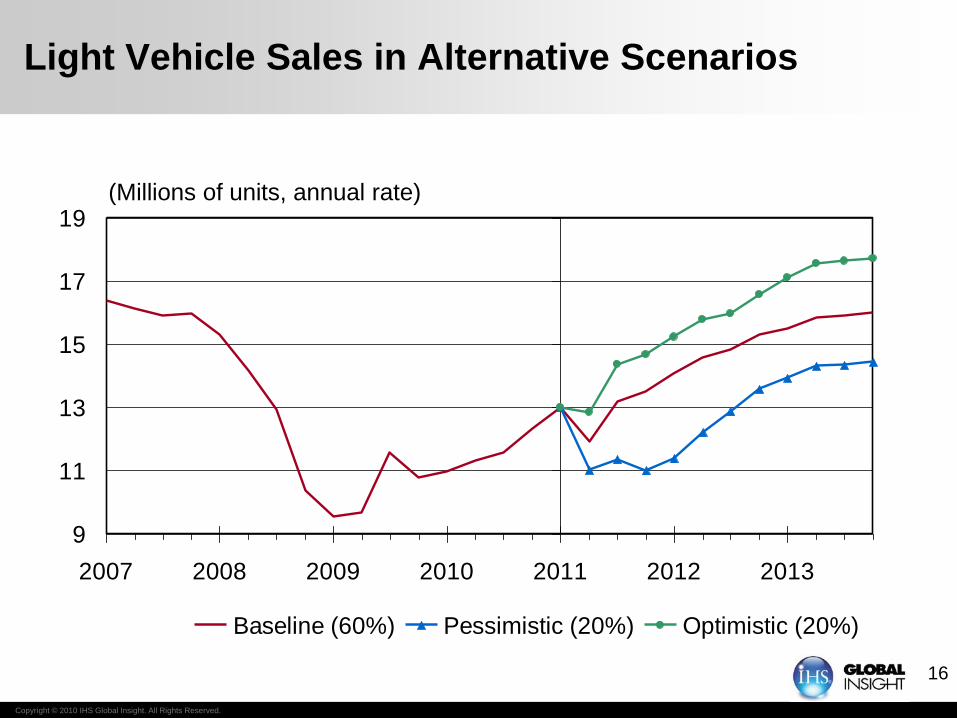
9
11
13
15
17
19
2007 2008 2009 2010 2011 2012 2013
Baseline (60%) Pessimistic (20%) Optimistic (20%)
(Millions of units, annual rate)
Light Vehicle Sales in Alternative Scenarios

Copyright © 2010 IHS Global Insight. All Rights Reserved.
17
Bottom Line
• The economic recovery is on a self-sustaining course, barring a
major oil market disruption.
• Job growth will enable consumers to spend more confidently.
• Business equipment investment, exports, consumer durables,
and housing construction will drive the expansion.
• Although food and energy prices are accelerating, high
unemployment will restrain wage gains and core inflation
• The federal government needs an “exit strategy” from deficit
spending or financial markets will eventually impose one.

Regional Outlook

Copyright © 2010 IHS Global Insight. All Rights Reserved.
Percent
-0.7 to 0.0
0.1 to 0.8
0.8 to 2.3
2.3 to 3.5
3.6 to 4.6
Labor markets reverse coursed in 2010
Year-over-year Employment Change, December 2010, %; Indiana 0.8%

Copyright © 2010 IHS Global Insight. All Rights Reserved.
West South
Central
-2
-1
0
1
2
3
4
5
-1.0 -0.5 0.0 0.5 1.0 1.5 2.0 2.5 3.0
Year/year (%)
3-m
th a
vg
an
nu
ali
ze
d (
%)
New England Mid Atlantic South Atlantic
East North Central West North Central East South Central
West South Central Mountain Pacific
Expanding
Contracting Slipping
Improving
Momentum is building in most regions
Employment Momentum
February 2011
TX: -2.6%

Copyright © 2010 IHS Global Insight. All Rights Reserved.
Peak
-14.2 to -9.0
-8.9 to -6.2
-6.2 to -3.7
-3.6 to 0.6
0.6 to 4.3
But many states are still deep in the hole
Peak to February 2011 Employment Change, %US: -5.6%
IN : -6.8%

Copyright © 2010 IHS Global Insight. All Rights Reserved.
Percent
0.8 to 1.3
1.4 to 1.6
1.6 to 1.8
1.9 to 2.4
Recovery gathers momentum in 2011
Employment Growth 2011Q4, year-over-year %
US: 1.5%
IN: 1.8%

Copyright © 2010 IHS Global Insight. All Rights Reserved.
Percent
1.9 to 2.4
2.4 to 2.7
2.8 to 3.1
3.1 to 3.8
Medium-term performance: GSP
Real Gross State Product Growth 2011-2016, % annual rate
TX: 3.8%
US: 3.0%
IN : 2.8%

Copyright © 2010 IHS Global Insight. All Rights Reserved.
Percent
1.1 to 1.3
1.4 to 1.7
1.7 to 2.0
2.1 to 2.6
Medium-term performance: Jobs
Employment Growth 2011-2016, % annual rate
US: 1.8%
IN: 1.8%

Copyright © 2010 IHS Global Insight. All Rights Reserved.
Return To Peak
2010 to 2011
2012
2013
2014 to 2015
Past 2015
Indiana will recover lost jobs early in 2014
Year of Return to Peak Employment

Indiana Outlook

Copyright © 2010 IHS Global Insight. All Rights Reserved.
27
Bottom Line
• Deeper, earlier recession than most
• Among 2010 growth leaders early in the year
– Transportation equipment rebound
– Low paying temp and business services jobs
• Slow recovery, but a recovery is indeed in place
• Medium term performance near average among states
– Outpacing other midwest manufacturing giants
Copyright © 2010 IHS Global Insight. All Rights Reserved.
28
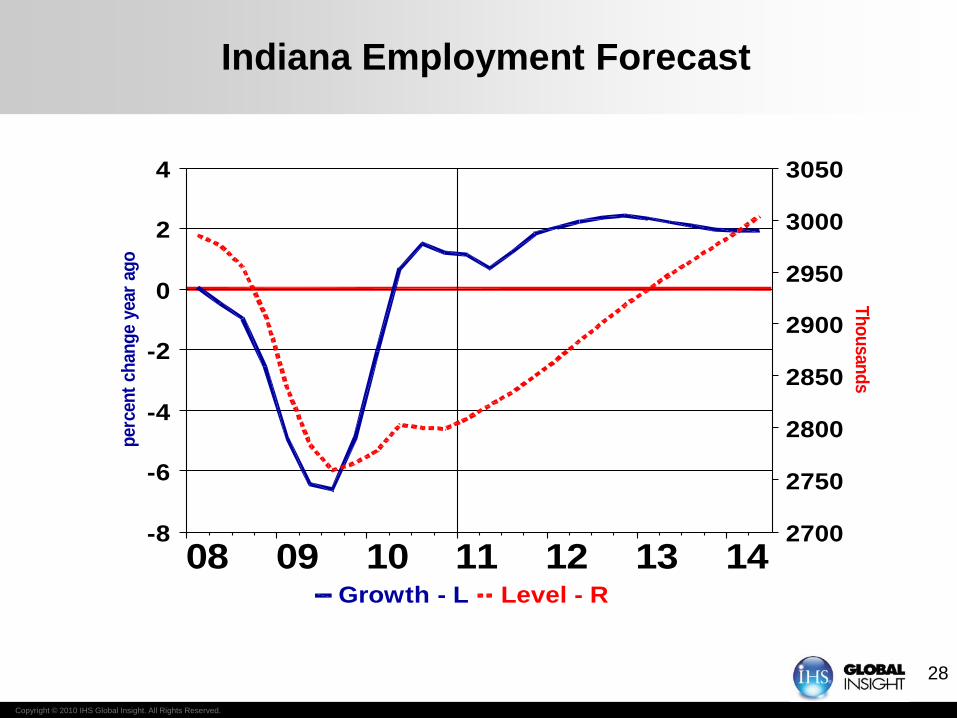
Indiana Employment Forecast
14131211100908
4
2
0
-2
-4
-6
-8
3050
3000
2950
2900
2850
2800
2750
2700
perc
en
t ch
an
ge y
ear
ag
o
Th
ou
san
ds
Growth - L Level - R

Copyright © 2010 IHS Global Insight. All Rights Reserved.
29
Wage Gains Return
(nominal total wages and salaries)
131211100908
10
5
0
-5
-10
-15
10
5
0
-5
-10
-15
per
cen
t ch
ang
e ye
ar a
go
percen
t chan
ge year ag
o
Indiana US

Copyright © 2010 IHS Global Insight. All Rights Reserved.
30
Cars and Houses
131211100908
400
350
300
250
200
150
100
50
30
25
20
15
10
tho
usa
nd
s tho
usan
ds
Indiana New Car Registrations - LIndiana Housing Starts - R

Copyright © 2010 IHS Global Insight. All Rights Reserved.
31
(Percent unless otherwise noted)
Forecast Summary
2009 2010 2011 2012
Employment -5.7 0.3 1.2 2.3
Unemployment Rate 10.4 10.2 8.8 8.5
Personal Income -2.4 3.2 5.0 3.1
Housing Starts (000) 13.1 13.2 13.7 21.7
Retail Sales -7.2 6.6 7.6 5.3
Real Gross State Product -5.0 2.0 2.4 3.1

Thank you!
Jim Diffley
Senior Director
Chief Regional Economist
IHS Global Insight