Presented by: Jim Diffley Phil Hopkins Jeannine Cataldi US Regional Services January 21, 2003...
25
Copyright© 2002 D R I W EFA , Inc. Presented by: Presented by: Jim Diffley Jim Diffley Phil Hopkins Phil Hopkins Jeannine Cataldi Jeannine Cataldi US Regional Services US Regional Services January 21, 2003 January 21, 2003 Regional Housing Outlook: Regional Housing Outlook: Prices, Affordability, Construction Costs Prices, Affordability, Construction Costs
-
Upload
marcus-john-green -
Category
Documents
-
view
216 -
download
3
Transcript of Presented by: Jim Diffley Phil Hopkins Jeannine Cataldi US Regional Services January 21, 2003...

Copyright © 2002 DRIWEFA, Inc.
Presented by:Presented by:
Jim DiffleyJim Diffley
Phil HopkinsPhil Hopkins
Jeannine CataldiJeannine Cataldi
US Regional ServicesUS Regional Services
January 21, 2003January 21, 2003
Regional Housing Outlook:Regional Housing Outlook:Prices, Affordability, Construction CostsPrices, Affordability, Construction Costs

2Copyright © 2002 DRIWEFA, Inc.
• Past bubblesPast bubbles• California late 1980s• New England mid 1980s• Oil Patch early-mid 1980s
• Current Trend: OFHEO appreciation (year ago)Current Trend: OFHEO appreciation (year ago)• 2001q1 9.0%• q2 8.7• q3 8.7• q4 7.7• 2002q1 7.0• q2 7.3• q3 6.2

3Copyright © 2002 DRIWEFA, Inc.
CaliforniaCalifornia
2005200019951990198519802520151050-5-102520151050-5-10percent change year ago percent change year agoAverage Existing House Price GrowthPersonal Income Growth
200520001995199019851980
25
20
15
10
5
0
-5
-10
25
20
15
10
5
0
-5
-10
perc
ent c
hang
e ye
ar a
gopercent change year ago
Average Existing House Price GrowthPersonal Income Growth
4Copyright © 2002 DRIWEFA, Inc.
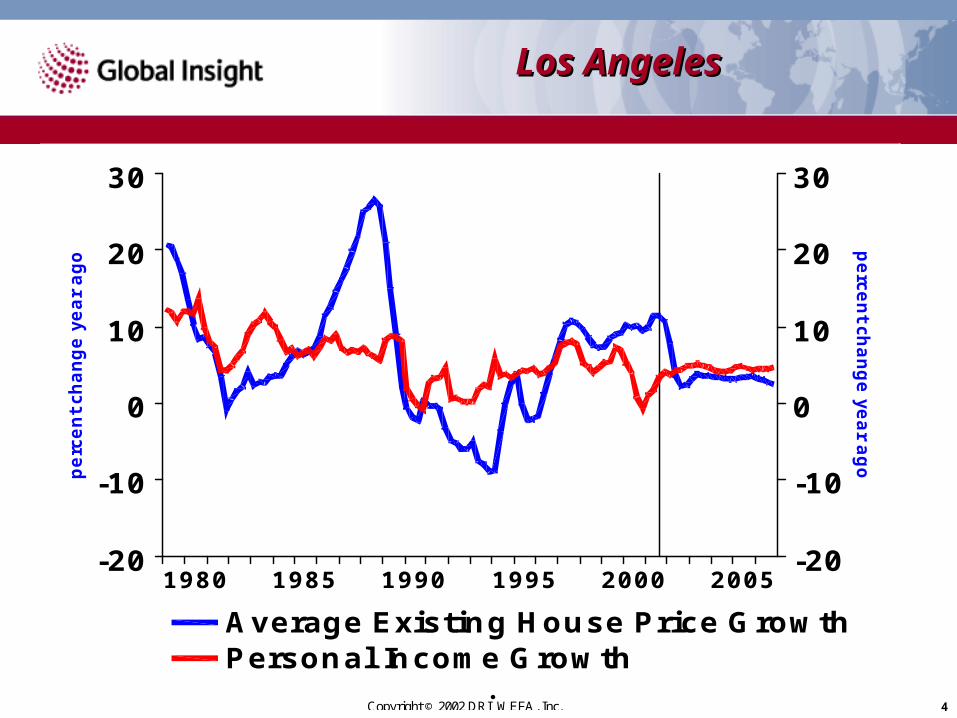
Los AngelesLos Angeles
200520001995199019851980
30
20
10
0
-10
-20
30
20
10
0
-10
-20
perc
ent c
hang
e ye
ar a
gopercent change year ago
Average Existing House Price GrowthPersonal Income Growth

5Copyright © 2002 DRIWEFA, Inc.
San JoseSan Jose
200520001995199019851980
40
30
20
10
0
-10
40
30
20
10
0
-10
perc
ent c
hang
e ye
ar a
gopercent change year ago
Average Existing House Price GrowthPersonal Income Growth

6Copyright © 2002 DRIWEFA, Inc.
MassachusettsMassachusetts
200520001995199019851980
30
20
10
0
-10
-20
30
20
10
0
-10
-20
perc
ent c
hang
e ye
ar a
gopercent change year ago
Average Existing House Price GrowthPersonal Income Growth

7Copyright © 2002 DRIWEFA, Inc.
BostonBoston
200520001995199019851980
40
30
20
10
0
-10
-20
40
30
20
10
0
-10
-20
perc
ent c
hang
e ye
ar a
gopercent change year ago
Average Existing House Price GrowthPersonal Income Growth

8Copyright © 2002 DRIWEFA, Inc.
TexasTexas
2005200019951990198519801975
20
15
10
5
0
-5
-10
-15
20
15
10
5
0
-5
-10
-15
perc
ent c
hang
e ye
ar a
gopercent change year ago
Average Existing House Price GrowthPersonal Income Growth

9Copyright © 2002 DRIWEFA, Inc.
HoustonHouston
2005200019951990198519801975
2520
15105
0-5
-10
-15
2520
15105
0-5-10
-15
perc
ent c
hang
e ye
ar a
gopercent change year ago
Average Existing House Price GrowthPersonal Income Growth

10Copyright © 2002 DRIWEFA, Inc.
FloridaFlorida
200520001995199019851980
20
15
10
5
0
-5
20
15
10
5
0
-5
perc
ent c
hang
e ye
ar a
gopercent change year ago
Average Existing House Price GrowthPersonal Income Growth

11Copyright © 2002 DRIWEFA, Inc.
DenverDenver
200520001995199019851980
20
15
10
5
0
-5
-10
20
15
10
5
0
-5
-10
perc
ent c
hang
e ye
ar a
gopercent change year ago
Average Existing House Price GrowthPersonal Income Growth

12Copyright © 2002 DRIWEFA, Inc.
Price / IncomePrice / Income
20001995199019851980
8
7
6
5
4
3
2
8
7
6
5
4
3
2
San Jose BostonMiami DenverNew York Atlanta

13Copyright © 2002 DRIWEFA, Inc.
AffordabilityAffordability
20001995199019851980
250
200
150
100
50
250
200
150
100
50
San Jose BostonMiami DenverNew York Atlanta

14Copyright © 2002 DRIWEFA, Inc.
2002 Price Gains (OFHEO)2002 Price Gains (OFHEO)
• 2002/2001q3 2002/1997
• New England 9.8% 62.0% • Middle Atlantic 9.2
43.1• Pacific 7.6 52.2• South Atlantic 6.7 36.5 • West North Central 5.1 37.8 • Mountain 3.7 31.7• East North Central 3.7 28.9 • West South Central 3.1 28.6• East South Central 3.1 23.6

15Copyright © 2002 DRIWEFA, Inc.
Recent DevelopmentsRecent DevelopmentsNovember dataNovember data
• Existing Home Sales Existing Home Sales • median price +9.7% y/y• average price +11.2%
• SF Bay Area prices declining 5 consecutive monthsSF Bay Area prices declining 5 consecutive months• higher end homes the culprit

16Copyright © 2002 DRIWEFA, Inc.
Top 10 States (OFHEO q3)Top 10 States (OFHEO q3)
• Rhode IslandRhode Island 14.1% 14.1%
• New JerseyNew Jersey 11.0 11.0
• New YorkNew York 10.2 10.2
• MarylandMaryland 10.1 10.1
• Maine Maine 10.0 10.0
• New HampshireNew Hampshire 10.0 10.0
• MassachusettsMassachusetts 10.0 10.0
• FloridaFlorida 9.49.4
• ConnecticutConnecticut 8.98.9
• CaliforniaCalifornia 8.88.8
17Copyright © 2002 DRIWEFA, Inc.
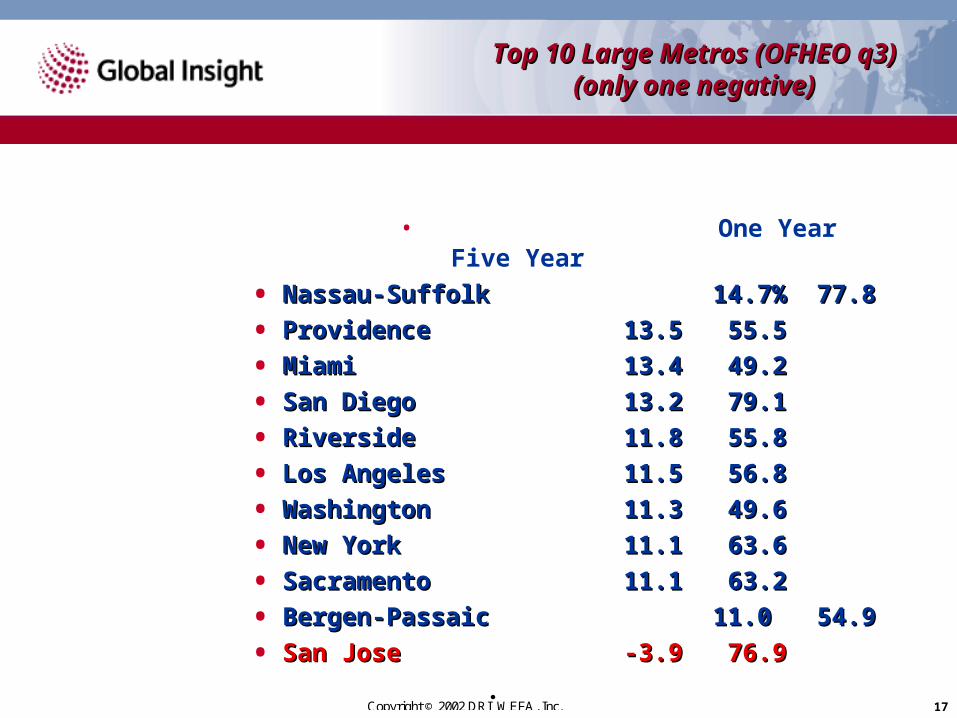
Top 10 Large Metros (OFHEO q3)Top 10 Large Metros (OFHEO q3)(only one negative)(only one negative)
• One Year Five Year
• Nassau-SuffolkNassau-Suffolk 14.7% 14.7% 77.877.8
• ProvidenceProvidence 13.5 13.5 55.555.5
• MiamiMiami 13.4 13.4 49.249.2
• San DiegoSan Diego 13.2 13.2 79.179.1
• Riverside Riverside 11.8 11.8 55.855.8
• Los AngelesLos Angeles 11.5 11.5 56.856.8
• WashingtonWashington 11.3 11.3 49.649.6
• New YorkNew York 11.1 11.1 63.663.6
• SacramentoSacramento 11.1 11.1 63.263.2
• Bergen-PassaicBergen-Passaic 11.0 11.0 54.954.9
• San JoseSan Jose -3.9 -3.9 76.976.9

18Copyright © 2002 DRIWEFA, Inc.
Top 10 Large Metros (NAR q3)Top 10 Large Metros (NAR q3)
• SacramentoSacramento 24.6% 24.6%
• Providence Providence 24.1 24.1
• Nassau-SuffolkNassau-Suffolk 23.9 23.9
• San DiegoSan Diego 21.5 21.5
• Orange CountyOrange County 20.3 20.3
• New YorkNew York 19.4 19.4
• Los AngelesLos Angeles 17.6 17.6
• NewarkNewark 17.2 17.2
• WashingtonWashington 17.0 17.0
• MiamiMiami 16.2 16.2

19Copyright © 2002 DRIWEFA, Inc.
Avg. Price Existing Single Family Home Avg. Price Existing Single Family Home over Disposable Income per Hhld 2002q2over Disposable Income per Hhld 2002q2
Large Metros Population >1 MillionLarge Metros Population >1 Million
• San Francisco 5.40San Francisco 5.40
• Oakland 4.92Oakland 4.92
• San JoseSan Jose 4.79 4.79
• Los AngelesLos Angeles 4.67 4.67
• Orange County 4.67Orange County 4.67
• San Diego San Diego 4.61 4.61
• Boston Boston 4.32 4.32
• New York 4.14New York 4.14
• Sacramento 3.72Sacramento 3.72
• Bergen-Passaic 3.56Bergen-Passaic 3.56
• Seattle 3.52 Seattle 3.52

20Copyright © 2002 DRIWEFA, Inc.
Avg. Price Existing Single Family Home Avg. Price Existing Single Family Home over Disposable Income per Hhld 2002q2over Disposable Income per Hhld 2002q2
Other Metros Population <= 1 MillionOther Metros Population <= 1 Million
• Santa Barbara 6.22Santa Barbara 6.22
• Santa Cruz 5.71Santa Cruz 5.71
• Salinas 5.63Salinas 5.63
• Santa Rosa Santa Rosa 5.02 5.02
• Honolulu 4.83Honolulu 4.83
• Venture Venture 4.34 4.34
• Boulder 4.17Boulder 4.17
• Vallejo 4.10Vallejo 4.10
• Bellingham 3.99Bellingham 3.99
• Greeley 3.81Greeley 3.81
• Santa Fe 3.81 Santa Fe 3.81

21Copyright © 2002 DRIWEFA, Inc.
Housing Price & Income TrendsHousing Price & Income Trends 2002q2 vs. 1992q2 2002q2 vs. 1992q2
• Same Point in the Business Cycle – 3 quarters after end of Same Point in the Business Cycle – 3 quarters after end of recessionrecession
• Ratio of Sales Price of Existing Single Home over Disposable Ratio of Sales Price of Existing Single Home over Disposable Income per HouseholdIncome per Household• In 245 out of 278 MSAs 2002q2 ratio > 1992q2 ratio• Rising Ratio Reflects Increase In Equity from Price
Appreciation• Affordability must consider combined effects from interest
rate decline, income growth & price appreciation• Decline in interest rates and PI growth has offset price
rises, maintaining affordability in most areas• Some MSAs with high price/income ratios may see sharp
declines in prices if interest rates and income growth slows
22Copyright © 2002 DRIWEFA, Inc.
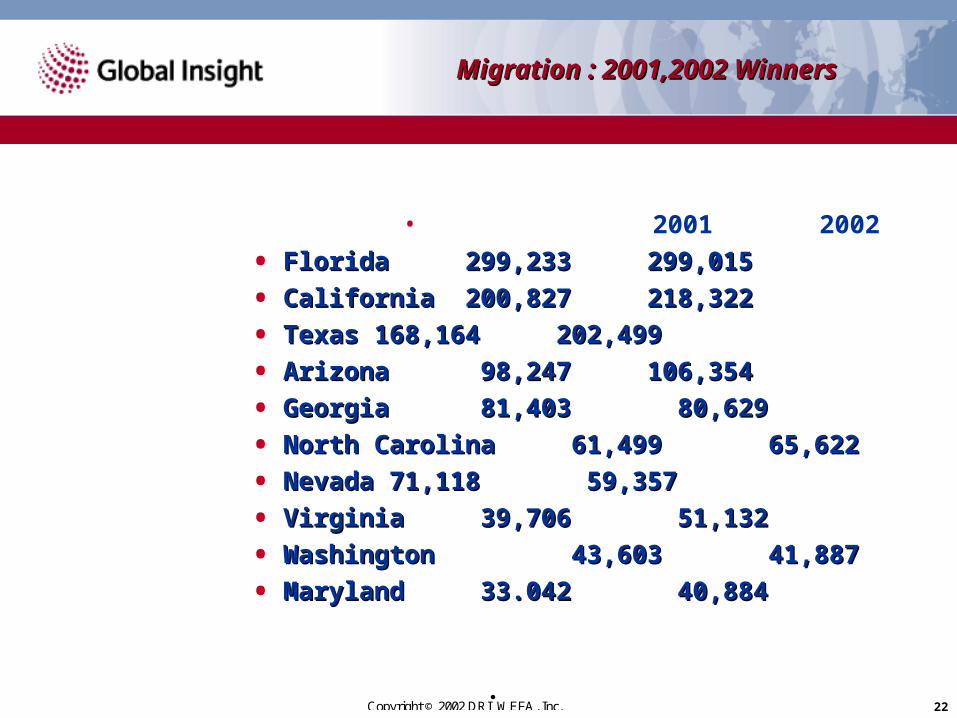
Migration : 2001,2002 WinnersMigration : 2001,2002 Winners
• 2001 2002
• FloridaFlorida 299,233299,233 299,015299,015
• CaliforniaCalifornia 200,827200,827 218,322218,322
• TexasTexas 168,164168,164 202,499202,499
• ArizonaArizona 98,247 98,247 106,354106,354
• GeorgiaGeorgia 81,403 81,403 80,629 80,629
• North CarolinaNorth Carolina 61,499 61,499 65,622 65,622
• NevadaNevada 71,118 71,118 59,357 59,357
• VirginiaVirginia 39,706 39,706 51,132 51,132
• WashingtonWashington 43,603 43,603 41,887 41,887
• MarylandMaryland 33.042 33.042 40,884 40,884

23Copyright © 2002 DRIWEFA, Inc.
Vacancy Rates : 2000Vacancy Rates : 2000 (exc. 2nd homes) (exc. 2nd homes)
• New Hampshire New Hampshire 2.9%2.9%
• MassachusettsMassachusetts 3.23.2
• MinnesotaMinnesota 3.23.2
• VermontVermont 3.73.7
• CaliforniaCalifornia 3.93.9
• Rhode IslandRhode Island 4.14.1
• New JerseyNew Jersey 4.14.1
• WisconsinWisconsin 4.14.1
• ColoradoColorado 4.34.3
• ConnecticutConnecticut 4.44.4

24Copyright © 2002 DRIWEFA, Inc.
Regional Construction WagesRegional Construction Wages2002q22002q2
• Average Annual Wage Growth
• New England $48,657 2.0% • Middle Atlantic 47,979 2.2• East North Central 44,848 3.6• Pacific 44,596 -0.2• West South Central 44,481 0.7• West North Central 40,735 3.1• Mountain 38,931 0.4• South Atlantic 37,295 3.2 • East South Central 35,168 1.9

25Copyright © 2002 DRIWEFA, Inc.
Regional CPI (2002q3 ya)Regional CPI (2002q3 ya)
• New EnglandNew England 2.01%2.01%
• Middle AtlanticMiddle Atlantic 1.791.79
• South AtlanticSouth Atlantic 1.721.72
• East South CentralEast South Central 1.861.86
• East North CentralEast North Central 1.821.82
• West North CentralWest North Central 1.751.75
• West South CentralWest South Central 1.771.77
• MountainMountain 1.751.75
• PacificPacific 1.561.56
• USUS 1.751.75
• Max:Max: Rhode IslandRhode Island 2.89 2.89
• Min:Min: IdahoIdaho -1.15 -1.15