The Economic Impact of the Stanislaus County Food
46
The Economic Impact of the Stanislaus County Food Processing Industry and the Food Processing By- Products Use Program California Institute for the Study of Specialty Crops Funding for this project has been made available by the Governor’s Buy California Initiative, the California Department of Food and Agriculture (“CDFA”) and the U.S. Department of Agriculture (“USDA”). The content of this publication does not necessarily reflect the views or policies of CDFA or USDA, nor does any mention of trade names, commercial products and organizations imply endorsement of them by CDFA or USDA.
Transcript of The Economic Impact of the Stanislaus County Food

The Economic Impact of the Stanislaus County Food Processing
Industry and the Food Processing By-Products Use Program
California Institute for the Study of Specialty Crops
Funding for this project has been made available by the Governor’s Buy California Initiative, the California Department of Food and Agriculture (“CDFA”) and the U.S. Department of Agriculture (“USDA”). The content of this publication does not necessarily reflect the views or policies of CDFA or USDA, nor does any mention of trade names, commercial products and organizations imply endorsement of them by CDFA or USDA.

Foreword
This report contains two studies of the Stanislaus County Processing Industry and the Food Processing By-Products. This program has been in place since 1978. The is program allows food processors to take their by-products to local agricultural producers, who in turn reuse the by-products by feeding it to their livestock or spreading it across their fields as a soil amendment. Since its inception, the county has reported that over 6 million tons of by-products have been reused by agricultural producers and consequently diverted from local landfills.
Within the last couple of years, the Regional Water Quality Control Board (RWQCB) has brought concerns to Stanislaus County that this program may pose a risk to the county’s surface and ground water resources. The RWQCB proposed that program participants evaluate the program for environmental risk and to identify the types and level of product and environmental monitoring needed to properly address those risks. If additional product and environmental monitoring is required beyond the current requirements, the cost of participating in the program would obviously increase.
As a result of the pending proposal, food processors and producers who have taken the by-product in the county have been investigating what the new cost of the program would be. A few of the food processors have come to the conclusion that one of the proposed environmental monitoring requirements, i.e. groundwater monitoring at the level proposed would make the program prohibitively costly. They believe that the change would result in their withdrawal from the program. Furthermore, they believe that the program in its current state has allowed them to maintain their competitiveness in a domestic and international marketplace which has kept them from moving out of the county.
The primary emphasis of this study is to investigate what economic impact would occur if one of the food processors decided to leave the county due to a change in the current policy. The first study by Hurley and Bylsma is a regional economic impact study that estimates the economic impacts of a food processors leaving Stanislaus County. The second study by Paggi, et al study is a representative farm model analysis of the impact of a producer charge back fee for cannery removal of the by-product waste to an alternative disposal site. Jay E. Noel, Ph.D. Director, the California Institute for the Study of Specialty Crops
ii

iii

Dr. Sean Hurley Jessica Bylsma*
Prepared: October 30, 2007 *Sean Hurley is Associate Professor, in the Department of Agribusiness at the California Polytechnic State University—San Luis Obispo. Jessica Bylsma is a Research Assistant at the California Polytechnic State University—San Luis Obispo
iv

Executive Summary
In 1978, the County of Stanislaus took a proactive stance on the issue of food processing by-product by developing the Stanislaus County Food Processing By-Product Use Program (Program). This program allows food processors to take their by-products to local agricultural producers, who in turn reuse the by-products by feeding it to their livestock or spreading it across their fields as a soil amendment. Since its inception the county has reported that over 6 million tons of by-products have been reused by agricultural producers and consequently diverted from local landfills. Within the last couple of years, the Regional Water Quality Control Board (RWQCB) has brought concerns to Stanislaus County that this program may pose a risk to the county’s surface and ground water resources. The RWQCB proposed that program participants implement several new levels of product and environmental monitoring. Program participants believe that the current program is environmentally sound and that additional monitoring may be unnecessary.
In response to RWQCB proposal, program participants are funding research under
direction and supervision of the RWQCB and Stanislaus County to evaluate the program for environmental risk and to identify the types and level of product and environmental monitoring needed to properly address those risks. If additional product and environmental monitoring is required beyond the current requirements, the cost of participating in the program would obviously increase.
As a result of the pending proposal, food processors and producers who have taken the
by-product in the county have been investigating what the new cost of the program would be. A few of the food processors have come to the conclusion that one of the proposed environmental monitoring requirements, i.e. groundwater monitoring at the level proposed would make the program prohibitively costly. They believe that the change would result in their withdrawal from the program. Furthermore, they believe that the program in its current state has allowed them to maintain their competitiveness in a domestic and international marketplace which has kept them from moving out of the county.
The primary emphasis of this study is to investigate what economic impact would occur
if one of the food processors decided to leave the county due to a change in the current policy. Data was collected from two processors who currently use the program. One of these processors operates in Stanislaus County while the other is located in San Joaquin County. This data was used to develop three scenarios related to these processors leaving the county they reside. Another two scenarios used as their basis an average processor in the Stanislaus food manufacturing industry and an average processor in the Stanislaus fruit and vegetable processing industry. Four economic impacts were studied—output, value-added, taxes, and employment.
It was estimated in this study that if Processor 1 decided to leave Stanislaus County
because the Program was no longer viable for it, a significant negative impact would be felt by the county. It is estimated that the county should expect to see a loss of $482.656 million to
v

$651.656 million in total economic output. Job losses are estimated to be in the range of 2,248 to 2,715 jobs where a majority of those jobs will be felt by supporting industries in the county.
It was found in this study that not only does Stanislaus County have a vested interest in
making sure that the Stanislaus County Food Processing By-Product Use Program remains a viable program for processors, San Joaquin County will also feel the effects of this program being unviable. If the program ceases to be useful and a processor in San Joaquin must relocate outside of the county, then the county should expect a loss of economic activity of approximately $80.896 million and a loss of approximately 503 jobs.
vi

vii
Table of Contents
Introduction..............................................................................................................1
Background...............................................................................................................2
National Waste Reduction ....................................................................2 National Recycling Rates......................................................................3 California Waste and Recycling ...........................................................3 California Solid Waste Bill ...................................................................4 California Food Processing...................................................................6 Food Processing By-Product Use Program ..........................................6 Methodology .............................................................................................................8 Input-Output Modeling .........................................................................8 IMPLAN ...............................................................................................9 Data Collection....................................................................................13 Scenarios Examined Using IMPLAN.................................................13 Limitations to the Analysis .................................................................15 Results .....................................................................................................................15 Summary and Conclusions....................................................................................21 Works Cited............................................................................................................23 Appendix .................................................................................................................25

Introduction In the late 1970’s, Stanislaus County recognized that there existed a potential issue with
the disposal of food processing by-products. The concern at the time was that the disposal of the
by-products could be handled in a more efficient manner that could benefit all interested
stakeholders. In 1978, the county took a proactive stance on the issue and brought together a
group of producers, UC extension representatives, management from local food processors, and
other interested stakeholders to discuss better ways of handling the by-products that came from
processing agricultural products. As a result of these discussions, Stanislaus County developed
the Stanislaus County Food Processing By-Product Use Program. This program allows food
processors to take their by-products to local agricultural producers, who in turn reuse the by-
products by feeding it to their livestock, drying, composting, or spreading across their field as a
soil amendment. The county through a self-supporting permitting process oversees how
producers use the by-product to minimize any potential deleterious effects that could occur to
society due to the program (Stanislaus County Board of Supervisors).
Since its inception the county has reported that over 6 million tons of by-products have
been reused by agricultural producers and consequently diverted from local landfills. Within the
last couple years, the Regional Water Quality Control Board (RWQCB) has brought concerns to
Stanislaus County that the Stanislaus County Food Processing By-Product Use Program may
have a potential negative effect to local groundwater. The RWQCB has proposed that Stanislaus
County start conducting groundwater testing and monitoring which would increase the expense
of operating and participating in the program. To offset these potential new expenses, the county
would need to increase the cost of the permitting process and the participating producers would
incur greater expenses for the monitoring program (Stanislaus County Board of Supervisors).
This new expense would make the program less palatable to all who are involved.
1

In response to the proposal of starting groundwater monitoring at a greater expense to all
those involved, food processors and producers who have taken the by-product in the county have
been investigating what the new cost of the program would be. A few of the food processors
have come to the conclusion that the groundwater monitoring system would make the program
prohibitively costly. They believe that the change in the program would require them to no
longer participate in the program. Furthermore, they believe that the program in its current state
has allowed them to maintain their competitiveness in the industry and has kept them from
moving out of the county. Some processors have indicated that without the program in its
current state, they may consider relocating outside of Stanislaus County to regain the
competitiveness loss due to the increased expense.
This study is designed to examine what current regional economic impact the food
processing industry has on Stanislaus County. It also investigates what economic impact would
occur if one of the food processors decided to leave the county due to a changing of the current
Stanislaus County Food Processing By-Product Use Program.
Background National Waste Production
The growth of the US population has put enormous pressure on domestic landfills to keep
up with the copious production of municipal waste resulting from the seemingly unending
expansion of the population. In October of 2006, the US Census Bureau estimated that there
were 300 billion people in the US (Tolbert). While this represented a major landmark for the
country and the economy, it represents a continually growing level of stress for the country’s
landfills. Unfortunately, the population increase has resulted in a proportional decrease in
landfill capacity, which is further compounded by the fact that per capita waste generation has
experienced a marked increase from 2.7 pounds per day to 4.5 pounds per day since 1960
2

(USEPA). Each of these factors has contributed to the substantive increase in the pollution
emanating from local dumping sites.
National Recycling Rates In an effort to moderate the consequences of this increase, numerous recycling programs
have been implemented across the nation. In 2005, the United States generated 245 million tons
of municipal solid waste, with an average recycling rate of 32% or approximately 72 million tons
(USEPA). While this represents a significant victory for the programs in place, this rate of
recycling is not enough to eliminate the issues caused by current waste production.
Consequently, there is increasing concern for the integrity of the nation’s water supply and
general air quality in the surrounding environment.
California Waste and Recycling According to the United States Census Bureau, California’s estimated population was
approximately 36.5 billion people in 2006, making it the most populous state in the nation
(2007). With such a large population, it is especially important for California to manage its
waste disposal practices. In 2006, statewide waste production was estimated to be 92.2 million
tons, which represents an increase of well over 40 million tons in the last two decades and a
substantial portion of total US waste generation (Stephens). Fortunately, this increase in
production has been met by a similar increase in diversion. California boasts an exceptionally
high diversion rate of 54 percent or over 50.1 million tons (Stephens). While this is an important
accomplishment in the state’s fight to preserve its dwindling landfill space, the growth of the
population continues to put immense pressure on the state’s landfills.
While it is natural to measure diversion by volume, it can also be measured based on its
economic benefits. Numerous state studies have concluded that diversion generates superior
economic externalities compared to disposal. One such study was conducted by Goldman and
3

Ogishi regarding the economic impact waste diversion has on the California economy. In this
study, the authors state that the “statewide economic impacts from disposal and diversion at 1999
rates were estimated to be 17 to 20 percent higher than the impacts if all the waste had been
disposed” (p. vii).
Table 1 presents the average statewide impacts for additional disposal and diversion of
waste to landfills estimated by Goldman and Ogishi. These statistics reflect the reality of the
economic climate of California. Based on the findings of the study, the 1999 rate of diversion
generated $3.12 billion in additional revenue and an extra 25,100 jobs (Goldman and Ogishi). In
other words, for every ton of waste disposed during that year, the authors estimated that there
was $108 in total income impacts to the California economy and another $144 in value-added
impacts to the state economy (Goldman and Ogishi). Conversely, for every ton of waste that was
diverted, the authors estimated that the state benefited from “$209 in total income impacts and
$290 in value-added impacts” (Goldman and Ogishi, p. viii). However, the monetary statistics
underestimate the benefits of diversion. Average estimates indicate that for every 1,000 tons of
waste generation, disposal creates 2.5 jobs, but for the same amount of waste, diversion creates
4.7 positions in similar industries (Goldman and Ogishi).
Table 1: 1999 Average Impacts Statewide for Additional Disposal or Diversion Disposed Diverted Additional Gain from Diversion Total Sales ($/ton) $119 $254 $135 Output Impact ($/ton) $289 $564 $275 Total Income Impact ($/ton) $108 $209 $101 Value Added Impact ($/ton) $144 $290 $146 Jobs Impact (Jobs/ton) 2.46 4.73 2.27 Source: Goldman and Ogishi, 2001 California Solid Waste Bill
In an effort to mitigate the onerous side effects of the state’s landfills and hopefully enjoy
some of the benefits associated with diversion, Governor George Deukmejian signed Assembly
4

Bill 939 (AB 939) into law on September 29, 1989 (Stanbra). The new law restructured the
state’s waste logistics and ideas concerning waste management. This was accomplished by
developing an “integrated waste management hierarchy” (Stanbra).
The principle sustaining this new approach to waste management was founded on the
idea that prioritizing the waste entering the landfills would result in a decrease in the volume
plaguing the environment. The bill obligated California counties and cities to develop plans to
meet ambitious diversion goals. Each of the agendas was expected to include eight different
components including source reduction, recycling, composting, special waste, public education
and information, disposal facility capacity, funding, and integration (Stanbra). The initial
mandate required that counties decrease their waste production 25% by the year 1995 and 50%
by the year 2000 (Stanbra). Unfortunately, few municipalities have successfully managed to
meet the objectives of the bill despite the threat of incurring fines. This is largely because those
fines were rarely levied against the offending county. Instead, the original deadlines were
extended in the hope that they would continue to strive to meet their objectives (Stanbra). As a
result of this reality, the effective rate of diversion for each of the California jurisdictions varies;
not only as a result of the differences in initial waste production, but also because of inconsistent
program compliance.
In response to mounting political pressures, each region was given the liberty to tackle
waste diversion with its own instruments based on what local governments deemed prudent
under their unique circumstances. Stanislaus County responded by implementing a number of
different mechanisms. However, one of the solutions employed, Stanislaus County Food
Processing By-Product Use Program, had actually been in place before the passage and
implementation of the new bill and appears to be an integral part in the county’s compliance with
5

the new waste requirements. This program addressed waste disposal issues plaguing the local
food processing industry.
California Food Processing Since food consumption is relatively stable, industries (e.g., food processing) that cater to
food consumption tend to have a stable source of income. This is largely because demand for
processed food items is relatively inelastic and does not show significant change during times of
economic instability by comparison to other manufacturing industries (RDI). This is evidenced
by the relative immunity of the industry to the most recent economic recession. This stability
can be very attractive to a region because industries that support food consumption are a reliable
tax basis and source of employment.
According to the 2002 Economic Census, there were 230 establishments in the fruit and
vegetable canning, pickling, and drying industry in California, which employs approximately
24,101 people who are paid over $800 million in annual payroll (United States Census Bureau,
2002). Stanislaus County constitutes a significant percentage of this industry and is one of the
top ten largest counties in terms of agricultural production in the US. Fruit and vegetable
canning and drying is the largest industry in the county based on output (MIG, Inc.). Due to the
sheer volume of processed by-product, this industry is highly affected by restrictions on reusing
the by-product.
Food Processing By-Product Use Program In an effort to ease strain on local landfills, the Stanislaus County Food Processing By-
Product Use Program was established in 1978 to address escalating concern surrounding the
problematic disposal of food processing by-products. These by-products were defined as
materials generated from product processing, such as culls, stems, and other fruit and vegetable
by-products (CRWQB). The program redirects these by-products to avenues where they may
6

serve as alternative inputs for other agricultural operations, such as animal feeds or soil
amendments. During the first two decades of the program, more than 6 million tons of food by-
products were diverted to other beneficial applications (Stanislaus County Board of Supervisors).
If not for the program, these by-products would have been disposed of in the nearest landfill and
the county would not be in compliance with the diversion requirements of AB 939.
In order to ensure that the program has only minimal externalities, participants must go
through a permitting process to participate. In order to obtain a by-product application permit for
a given location a detailed plan of operation must be submitted. This application must include
information regarding the drainage system, the daily maximum amount of residue expected to be
received, and the residue handling method (McHargue). To further solidify the health of the
program, the county frequently conducts inspections at each site during the season that the
participant is receiving the by-product (McHargue). Each inspection includes an analysis of the
fly population, unfavorable odors, and improper drainage.
Externality issues are the predominant concerns for program inspectors because it is
important to the health of the program that negative externalities are minimized. The affected
operations typically include dairies, feedlots, crops with land spreading operations, and animal
feed processors (McHargue). Most of the by-product entering these facilities originates from
fruit and vegetable processing establishments within Stanislaus County and has demonstrated to
be a valuable organic commodity. Consequently, it is Stanislaus County that derives the greatest
benefit from the success of the program. “Sites are required to keep current information
regarding delivery dates, types of residue, amount of residue, and the hauling companies who
deliver the residue” (McHargue). This ensures that the program’s operations can be accurately
monitored and regulated. Additionally, this guarantees that the funding for the program varies
7

proportionally with the time consumed by each operation. The land owners receiving the by-
product are charged for the inspector’s hours, consequently creating a program that is self-
sufficient. This makes it an environmentally and fiscally ideal solution to a major disposal
management issue.
While there is substantial pecuniary incentive for the program, it is also important to
consider the cost of the disposal alternatives if the program was discontinued. Currently, it
provides an economically efficient channel for disposal. However, without this outlet for their
by-products, food processors could potentially face a large increase in their disposal expenses.
For processors in the county, the absence of this program would mean that their by-products
would have to be hauled to neighboring landfills at significant expense; not only contributing to
the problem of decreasing landfill space, but also increasing air pollution as a result of the trucks
hauling the by-product longer distances.
Methodology Input-Output Modeling
To measure the importance of the food processors in Stanislaus County who might use
Stanislaus County Food Processing By-Product Use Program, an input-output model was
employed to develop a picture of its influence on the local economy. Input-output modeling is a
mechanism for examining relationships among firms, industries, and institutions within a local
economy (Mulkey and Hodges, 2001). This approach is often used to analyze the impact of a
specific industry activity on an economy. It encompasses all fiscal transactions for a given time
period. Holland and Yeo describe input-output modeling as a system that describes “the circular
flow of income and product throughout an economy” (p. 2). Hall and Skaggs elaborate on this
description by explaining that these models represent “all consumption and production in an
8

economy, which is divided into sectors that include firms or organizations with similar
characteristics or activities” (p. 3).
IMPLAN In order to create a model of Stanislaus County, this study employed an economic
modeling program known as IMpact Analysis for PLANning (IMPLAN). Numerous researchers
have used IMPLAN to evaluate the regional economic impacts of agriculture and agribusiness.
The program has been recognized for its value as an economic modeling system in other studies
done in California, Arkansas, Washington, and Idaho.
IMPLAN simulates how much of an economic impact would occur if a change was made
to a local economy. It estimates these impacts by using social accounts and I/O (Input/Output)
multipliers that are generated from the U.S. Department of Commerce, the U.S. Bureau of Labor
Statistics, and other federal and state government agencies. Data are collected for 528 distinct
producing industry sectors of the national economy corresponding to the Standard Industrial
Categories (SICs). Industry sectors are classified on the basis of the primary commodity or
service produced. Corresponding data sets are also produced for each county in the United
States, allowing analyses at the county level and for geographic aggregations such as clusters of
contiguous counties, individual states, or groups of states. Data provided for each industry sector
include outputs and inputs from other sectors, value added, employment, wages and business
taxes paid, imports and exports, final demand by households and government, capital investment,
business inventories, marketing margins, and inflation factors (deflators). These data are
provided both for the 528 producing sectors at the national level and for the corresponding
sectors at the county level. Data on the technological mix of inputs and levels of transactions
between producing sectors are taken from detailed input-output tables of the national economy.
9

National and county level data are the basis for IMPLAN calculations of input-output tables and
multipliers for local areas.
IMPLAN was originally developed in 1970 by the USDA Forest Service in cooperation
with government agencies in an effort to improve land and resource management. However, in
1993 the Minnesota IMPLAN Group was established to privatize the software and all of its
future developments (MIG, Inc). The most recent version available, IMPLAN Professional 2.0,
was utilized in this research in addition to the 2004 economic data for California. At the time of
the study, this was the most recent data available. The data gathered to run this analysis was in
terms of either 2006 dollars or 2002 dollars. IMPLAN has a tool to deflate/inflate these 2006
dollars to 2004 dollars. Once the economic impact was estimated, all results, unless otherwise
stated, were adjusted to represent 2007 dollars.
IMPLAN has developed three descriptive classes to express the economic impacts of a
select industry. These classes qualify each impact as either direct, indirect, or induced effects.
These titles are indicative of the manner in which the transaction affects the economy. Direct
effects represent the impact that occurs that are directly related to the event. In terms of this
study, direct effects are the dollar value directly associated with a departure of a firm or a
downsizing in the food processing industry. These in turn produce a ripple effect that echoes
throughout the industry known as indirect effects. These effects are changes that occur as other
industries produce and sell more or less as a consequence of the direct effects in the study
industry. The last class of economic impacts is the induced effects. These effects occur due to
changes in the direct and indirect effects. Impacts of this nature manifest as changes in local
consumer spending resulting from direct and indirect changes in affected economic sectors.
10

The IMPLAN model that was developed to determine these figures for Stanislaus County
was constructed using basic multipliers. These multipliers have a magnifying effect on direct
economic changes that cause an economic impact. These numbers are derived from industry
response to final demand. As the study industry increases or decreases output based on
consumption patterns, they generate demand for goods and services in the industries that support
them (MIG, Inc). Multipliers take into account that when an economic impact occurs to an
industry, its direct effect reverberates through the economy causing effects to related industries.
The multipliers that IMPLAN uses represent these transactions and their impact on the economy.
There are three different types of multipliers that IMPLAN uses to estimate economic
impacts: Type I, Type II, or Type SAM. For the purposes of this analysis Type SAM multipliers
were used for two primary reasons. First, Type I multipliers can only account for direct and
indirect effects and do not take into consideration induced effects. Type II and Type SAM
multipliers both take into account induced effects. Second, Type SAM multipliers take into
account more induced effects than Type II multipliers. Type II multipliers are based on resident-
only income, whereas, Type SAM multipliers account for effects that go beyond residential
income, e.g., social security and income tax leakages (MIG, Inc.).
The multipliers calculated by IMPLAN are used to establish the direct, indirect, and
induced effects of changes within an industry. These effects can be estimated for total output,
employment, value-added, and tax impacts. These four factors offer a glimpse of how Stanislaus
County will be affected as a result of changes in the food processing industry. In terms of this
study, the event being analyzed is the closure of a food processing company due to the loss or
elimination of the Stanislaus County Food Processing By-Product Use Program.
11

One of the economic impacts that IMPLAN estimates due to a change is for total output.
For the purposes of this study, total output is defined as the dollar value of production for an
industry in a given time period which is usually a calendar year (MIG, Inc). This can be
measured in one of two ways; either by the total value of purchases by intermediate and final
consumers or by “intermediate outlays plus value-added” (MIG, Inc). More simply, it can be
thought of as the national output per worker multiplied by the state/county employment statistics.
The output numbers derived from this analysis represent the output value that would be loss to
the Stanislaus County economy as a result of one or more of the food processors exiting.
Another economic impact estimated by IMPLAN is in terms of employment numbers.
Changes in employment resulting from the loss of a food processing facility include both wage
and salaried employees, in both full-time and part-time positions. These jobs are measured based
on Full-Time Equivalence (FTE), where IMPLAN uses 2,080 hours in a year to represent one
FTE employee. The job impacts reported by IMPLAN represent those that will be lost when a
firm chooses to leave the county. In other words, it reflects the total employment impact and the
number of people forced to seek alternative employment.
A third calculation made by IMPLAN is regarding the economic impacts due to the
value-added impacts. This impact is a subset of the total output impact and is contingent on four
components: employee compensation, proprietor income, other property income, and indirect
business taxes (MIG, Inc). These encompass employee and proprietary income, benefits, and
taxes paid to businesses by consumers during normal operations.
The fourth economic impact that IMPLAN estimates is the tax impact. This calculation
is a measurement of the changes in tax revenues resulting from a change made in the industry.
12

This is a simple estimate of taxes generated by the change in final demand and reflects the loss in
revenue to the government due to the change (MIG, Inc).
Data Collection In order to analyze the effects of the program on the county, data had to be collected from
the businesses known to rely on the program as part of their daily operations. To determine
exactly who to contact in an effort to collect this data, the Stanislaus County Department of
Environmental Resources (DER) was contacted. The county DER is credited with running the
program and therefore has access to much of this information. Nine companies were identified
as potential participants for this study.
Once the program participants were established, a letter was sent out to each company
outlining the goals of this project and requesting the company data that would be required to run
the analysis. This included some relatively private business information including: 1) total dollar
output, 2) number of employees, 3) total payroll expenses, 4) the percentage of employees
residing in Stanislaus County, and 5) disposal alternatives. Due to the proprietary nature of the
data that was being requested, only two companies were willing to provide the information
needed to conduct the analysis. In order to maintain the anonymity of these companies, they will
be referred to only as Processor 1 and Processor 2. Since only two companies provided the
information needed, information was gathered from the U.S. Census Bureau to use as proxies for
companies who may be affected.
Scenarios Examined Using IMPLAN There were five scenarios that were run through IMPLAN to gauge the potential effect if
the Stanislaus County Food Processing By-Product Use Program was no longer usable to the
participating food processors and they left their county of operation. The first two scenarios
were derived from Processor 1’s information. This company provided all the necessary
13

information except a solid value on revenue. Instead this company provided a range of revenue
that was between $300 million and $400 million. Since this company provided a range, it was
decided that two scenarios should be run for this company. The first scenario, which is denoted
as Processor 1A, simulated this company leaving Stanislaus with an estimated revenue base of
$300 million and 1,025 fulltime equivalents. The second scenario, which is denoted by
Processor 1B, maintained the same employment level as Processor 1A, but used the upper stated
revenue of $400 million.
The third scenario investigated the economic impacts related to Processor 2’s
information. Processor 2 reported yearly revenue that was slightly over $51 million and had a
fulltime equivalent employee base of 302. This company participates in the Stanislaus County
Food Processing By-Product Use Program but has its operation in San Joaquin County. While
this project was initially going to examine the impacts that only economically affected Stanislaus
County. It was judged that this scenario would be useful information in understanding the
impact that would occur if the Stanislaus County Food Processing By-Product Use Program was
no longer tenable for the processors using it.
Since few of the participants were willing to provide their proprietary data, two scenarios
were developed from US Census Bureau data. The fourth scenario investigated a $40 million
reduction in revenue with employment and total revenue numbers taken from the US Census
Bureaus 2002 Census statistics for the food manufacturing sector in Stanislaus County. The
reason $40 million was used is because it represents the average revenue for firms in the food
manufacturing industry in the county. The fifth scenario used statistics from the census
regarding the fruit and vegetable canning industry. The economic impact used for this scenario
14

was $120 million which represents the average size firm in the fruit and vegetable canning sector
in Stanislaus County.
Limitation to the Analysis One of the primary limitations of IMPLAN needs to be addressed before examining the
results. IMPLAN as it is used in this study does not take into account any industry that may fill
the gap if the processing firm leaves Stanislaus. In a sense, IMPLAN is only being used to
investigate the initial effect if a food processor leaves Stanislaus. It is possible that another
industry and/or firm may enter into the county to absorb some of the negative effect that may
occur due to the processor exiting. No attempt was made in this study to examine what
industries may fill the gap if a processor decided to leave.
Another limitation to this study is that the processors who participated in this study
provided information that could not be directly verified by the researchers for this project. To
handle this particular issue, scenarios 4 and 5 were developed to take into consideration average
producers in the industry who may use the Stanislaus County Food Processing By-Product Use
Program.
A third limitation to this study is that it only examined the effects of one processor
exiting its county due to the loss in the viability of the Stanislaus County Food Processing By-
Product Use Program by stakeholders. It does not assess the probability that any processor
would leave or what specific conditions would make the processor exit the county. This study
examined what would be the short-run economic impact of one processor leaving that fit the
profile of the scenarios that were investigated.
Results Using IMPLAN, it is estimated that Stanislaus County had a total output of $27.484
billion dollars in industry output in 2004 which inflates to $29.629 billion in terms of 2007
15

dollars. Focusing on the fruit canning and drying industry, it is estimated that this industry
directly provided $1.840 billion to the Stanislaus economy in 2004 which equates to $1.984 in
2007 dollars. This implies that this industry contributed approximately 6.7% output to the total
Stanislaus economy without considering the indirect or induced effects due to the industries
existence.
Examining table 2 shows the estimated economic impact in total output terms that would
occur under five different scenarios discussed above. All of these impacts are in terms of 2007
dollars. This table shows that if processor 1 could no longer use the Stanislaus County Food
Processing By-Product Use Program and decided to exit the county because of loss of
competitiveness, then the county should expect that it would lose between $482.656 million to
$651.656 million in total economic output. Approximately 63% of this loss comes from the
direct effect of the firm no longer operating in Stanislaus. Thirty-seven percent of this loss will
affect other industries, government, and local households through indirect and induced effects.
These indirect and induced effects show that loss of a single processor has significant
ramifications to other sectors in Stanislaus County outside of the processors industry.
Table 2: Potential Loss in Output in Terms of Dollars under Differing Scenarios Scenario Direct Indirect Induced Total* Processor 1A $ 307,657,664 $ 126,945,129 $ 48,053,234 $ 482,656,022 Processor 1B $ 410,210,208 $ 182,105,452 $ 59,604,642 $ 651,920,310 Processor 2 $ 52,570,080 $ 17,665,499 $ 10,660,543 $ 80,896,120 Stanislaus Food Manufacturing $ 43,902,204 $ 18,639,484 $ 6,697,857 $ 69,239,547 Stanislaus Fruit and Vegetable Processors $ 131,706,616 $ 47,780,034 $ 22,634,264 $ 202,120,907
* Totals may not sum to direct, indirect, and induced due to rounding errors. Processor 2, who uses the Stanislaus County Food Processing By-Product Use Program
but resides in San Joaquin County, is estimated to have a total effect to San Joaquin County of
$80.896 million. If this processor decides to leave San Joaquin County because the program no
16

longer is a viable option to it, San Joaquin County can expect to lose over $80 million in
economic activity. Sixty-five percent of this total impact comes from the processor leaving,
while 35% of the impact will affect supporting industries, governments, and households.
Examining Processor 2 shows that Stanislaus County is not the only county that will be affected
by the loss of viability of the program.
If an average Stanislaus County food manufacturer uses the Stanislaus County Food
Processing By-Product Use Program and decided to exit due to any changes in the program, it is
estimated that the county of Stanislaus would lose a total of $69.240 million in economic
activity. Thirty-seven percent of this impact, i.e., $25.337 million, will be felt by households,
government, and supporting industries through indirect and induced effects. The direct affect
alone of the firm leaving is $43.902 million.
The average food processor tends to be smaller and less likely to use the Stanislaus
County Food Processing By-Product Use Program than a typical fruit and vegetable processor.
If an average fruit and vegetable producer decided to leave Stanislaus because of the loss of
viability of the Stanislaus County Food Processing By-Product Use Program, then the county
should expect $202.121 million loss to the local economy. This comes from $131.707 million
loss in direct output provided by the processor plus another $70.414 million in indirect and
induced effects.
A subset of the total output that an economy generates is the value-added area which
encompasses employee compensation, proprietor income, other property income, and indirect
business taxes. Using IMPLAN, it is estimated that Stanislaus County has a total value-added of
$14.092 billion in terms of 2004 dollars which inflates to $15.191 billion in 2007 terms. This
total value-added equates to 51% of the total output generated in the Stanislaus economy. The
17
fruit canning and drying industry represents $457.399 million of this value-added in terms of
2007 dollars.
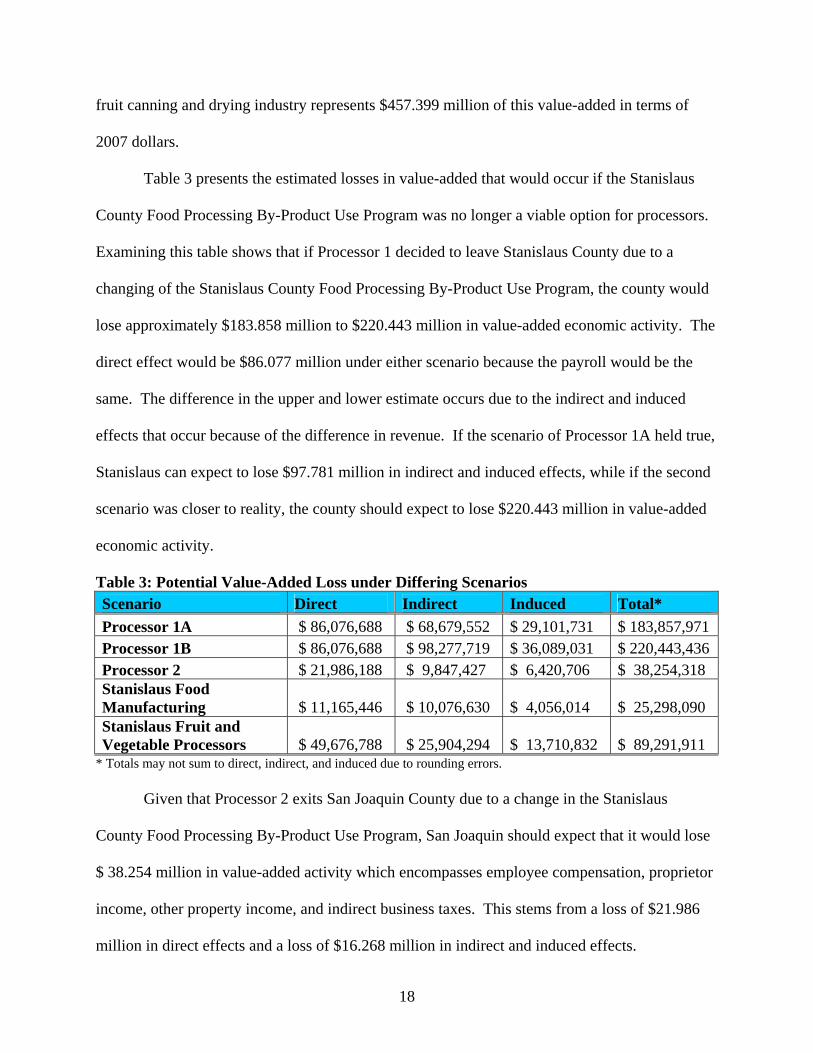
Table 3 presents the estimated losses in value-added that would occur if the Stanislaus
County Food Processing By-Product Use Program was no longer a viable option for processors.
Examining this table shows that if Processor 1 decided to leave Stanislaus County due to a
changing of the Stanislaus County Food Processing By-Product Use Program, the county would
lose approximately $183.858 million to $220.443 million in value-added economic activity. The
direct effect would be $86.077 million under either scenario because the payroll would be the
same. The difference in the upper and lower estimate occurs due to the indirect and induced
effects that occur because of the difference in revenue. If the scenario of Processor 1A held true,
Stanislaus can expect to lose $97.781 million in indirect and induced effects, while if the second
scenario was closer to reality, the county should expect to lose $220.443 million in value-added
economic activity.
Table 3: Potential Value-Added Loss under Differing Scenarios Scenario Direct Indirect Induced Total* Processor 1A $ 86,076,688 $ 68,679,552 $ 29,101,731 $ 183,857,971 Processor 1B $ 86,076,688 $ 98,277,719 $ 36,089,031 $ 220,443,436 Processor 2 $ 21,986,188 $ 9,847,427 $ 6,420,706 $ 38,254,318 Stanislaus Food Manufacturing $ 11,165,446 $ 10,076,630 $ 4,056,014 $ 25,298,090 Stanislaus Fruit and Vegetable Processors $ 49,676,788 $ 25,904,294 $ 13,710,832 $ 89,291,911
* Totals may not sum to direct, indirect, and induced due to rounding errors. Given that Processor 2 exits San Joaquin County due to a change in the Stanislaus
County Food Processing By-Product Use Program, San Joaquin should expect that it would lose
$ 38.254 million in value-added activity which encompasses employee compensation, proprietor
income, other property income, and indirect business taxes. This stems from a loss of $21.986
million in direct effects and a loss of $16.268 million in indirect and induced effects.
18

Assuming that the average Stanislaus food manufacturer is a participant in the Stanislaus
County Food Processing By-Product Use Program, Stanislaus County should expect a loss of
$25.298 million in value-added activity if this processor decides to leave due to a change in the
program. This loss is derived from an $11.165 million direct effect, a $10.077 million indirect
effect, and a $4.056 million induced effect. On the other hand, if the participant in the program
can be represented by the average fruit and vegetable processor, then the county should expect a
loss of $89.292 million in total value-added activity. Nearly 56% of this loss comes from direct
effects, while the rest occurs because of indirect and induced effects.
Table 4 provides a look at what would happen to tax revenues if any of the scenarios put
forth in this study come to fruition. To interpret the results from this table, the reader should
realize that these results are predicated on the processor going out of business or moving their
operations out of the country. If the processor decided to leave Stanislaus County and moved to
another county in California, the federal government would lose very little to nothing and the
state portion of the tax dollars would remain approximately the same. Only the local county
taxes would be affected by the processor leaving. A breakdown of the taxes that support Table 4
are provided in the Appendix which gives more detail of what taxes would be affected.
Table 4: Potential Tax Loss in Output under Differing Scenarios (2004 Dollars) Scenario Federal State/Local Total* Processor 1A $ 23,032,849 $ 18,612,133 $ 41,481,786 Processor 1B $ 27,984,966 $ 22,915,048 $ 50,701,248 Processor 2 $ 4,912,644 $ 3,704,440 $ 8,579,926 Stanislaus Food Manufacturing $ 3,185,196 $ 2,584,702 $ 5,747,295 Stanislaus Fruit and Vegetable Processors $ 11,064,786 $ 8,720,982 $ 19,707,106
* Totals may not sum to direct, indirect, and induced due to a transfer that occurs from the government to the processor.
If Processor 1 decided to leave the county due to a change in the Stanislaus County Food
Processing By-Product Use Program, the local, state, and federal government could expect a loss
19

in tax revenue of approximately $41.482 million and $50.701 million. The state and local
government should expect 45% of this total tax revenue. If Processor 2 decides to leave San
Joaquin County, the local, state, and federal government is estimated to lose approximately
$8.580 million in tax revenue where the state and local government receive 43% of this total.
Assuming that an average size food manufacturer who participates in the program decides to
leave, the state and local government should expect to lose $2.585 million in tax revenue while
the federal government could lose $3.185 million in taxes. Stanislaus County should expect a
bigger tax impact if an average size vegetable and fruit processor leaves the county. It is
estimated that this average processor generates $19.707 million in total taxes with $8.721 million
going to state and local tax coffers.
The results of this report have focused on the dollar impact that would be felt by the local
economy if a particular food processor went out of business due to a change in the Stanislaus
County Food Processing By-Product Use Program. To this point, all of these impacts to the local
economy have been measured in terms of dollars. IMPLAN allows for one other important
impact to be estimated—the loss of employment opportunities. It is estimated using IMPLAN
that there were 4,287 employees in the fruit and vegetable canning and drying industry in 2004.
Table 5 presents the estimated loss in employment due to a processor leaving the county
it produces in. It is estimated that if Processor 1 leaves Stanislaus County, the county should
expect the loss of 2,248 to 2,715 jobs. Since over half of these jobs are coming from indirect and
induced effect, the loss of employment would hit employees in supporting industries more than
the employees who work for Processor 1. Processor 2 does not have quite the same effect as
Processor 1. More than half of the 503 job losses that would occur in San Joaquin County would
happen to employees working for Processor 2. Only 43% of the total job losses would affect
20

employees in supporting industries. The job losses if an average Stanislaus food manufacturer
left the county are estimated at 310 jobs for the county. A majority of these jobs, 59%, would
come from supporting industries. If an average Stanislaus food and vegetable manufacturer left
Stanislaus due to the Stanislaus County Food Processing By-Product Use Program becoming
unviable, then the county should expect to lose 1,076 jobs. The highest job loss at 51% would
occur to those employees who were directly employed by the processor. The rest of the job
losses, 522, would be felt by industries that support the fruit and vegetable processor.
Table 5: Number of Potential Job Losses under Differing Scenarios* Scenario Direct Indirect Induced Total** Processor 1A 975 819 455 2,248Processor 1B 975 1,175 565 2,715Processor 2 287 118 98 503Stanislaus Food Manufacturing 126 120 63 310Stanislaus Fruit and Vegetable Processors 554 308 214 1,076
*Job numbers are in terms of 2004 values. ** Totals may not sum to direct, indirect, and induced due to rounding errors.
Summary and Conclusions This report highlighted the economic impacts that would occur if a food processor no
longer produced in its county because the Stanislaus County Food Processing By-Product Use
Program became an unviable option for them to use. Data was collected from two processors
who currently use the program. One of these processors resides in Stanislaus County while the
other is located in San Joaquin County. This data was used to develop three scenarios related to
these processors leaving the county they reside. Another two scenarios used as their basis an
average processor in the Stanislaus food manufacturing industry and an average processor in the
Stanislaus fruit and vegetable processing industry. Four economic impacts were studied—
output, value-added, taxes, and employment.
21

It was estimated in this study that if Processor 1 decided to leave Stanislaus County
because the Stanislaus County Food Processing By-Product Use Program was no longer viable
for it, a significant negative impact would be felt by the county. It is estimated that the county
should expect to see a loss of $482.656 million to $651.656 million in total economic output.
Job losses are estimated to be in the range of 2,248 to 2,715 jobs where a majority of those jobs
will be felt by supporting industries in the county.
It was found in this study that not only does Stanislaus County have a vested interest in
making sure that the Stanislaus County Food Processing By-Product Use Program remains a
viable program for processors, San Joaquin County will also feel the effects of this program
being unviable. If the program ceases to exist and the processor in San Joaquin must relocate
outside of the county, then San Joaquin County should expect a loss of economic activity of
$80.896 million and a loss of 503 jobs.
22

Works Cited
California Integrated Waste Management Board (CIWMB). "Statewide Profile for the State of California." http://www.ciwmb.ca.gov/Profiles/Statewide/, Accessed July 7, 2007a.
California Integrated Waste Management Board (CIWMB). "History of California Solid Waste
Law, 1985-1989." http://www.ciwmb.ca.gov/Statutes/Legislation/CalHist/1985to1989.htm, Accessed July 7, 2007b.
California Regional Water Quality Control Board (CRWQB). “Stanislaus County Food
Processing by-Products Use Program.” Department of Environmental Resources. June 28, 2006, http://www.swrcb.ca.gov/rwqcb5/adopted_orders/Resolutions/R5-2006-0052.pdf, Accessed August 10, 2007.
Goldman, George, and Aya Ogishi. “The Economic Impact of Waste Disposal and Diversion in
California.” A report submitted to the California Integrated Waste Management Board, April 4, 2001, http://are.berkeley.edu/extension/EconImpWaste.pdf, accessed August 10, 2007.
Hall, T. Y. and R. K. Skaggs. “Economic Impact of Southern New Mexico Vegetable
Production and Processing.” Report 9 for the New Mexico Chile Task Force, May 2003, http://spectre.nmsu.edu/dept/docs/cnas/CTF9.pdf, Accessed August 10, 2007.
Holland, D. and J. H. Yeo (2001). The Economic Impact of Potatoes in Washington State.
XB1039, Agricultural Research Center, College of Agriculture and Home Economics, Washington State University, Pullman, Washington, 2001, http://www.agribusiness-mgmt.wsu.edu/AgbusResearch/docs/eb1925.pdf, Accessed: August 9, 2007.
McHargue, Jim. "Stanislaus County: Best Waste Prevention Program." 2001 Trash Cutter
Awards Program Case Studies. California Integrated Waste Management Board. http://www.ciwmb.ca.gov/Trashcutters/Winners/2001/Stanislaus.htm, Accessed: July 16, 2007.
MIG, Inc. (2000). IMPLAN PRO User’s Guide, 2nd ed. Minnesota IMPLAN Group, Inc.,
Stillwater, Minnesota. Mulkey, D. and A. W. Hodges. (2001). Using IMPLAN to Assess Economic Impacts.
www.fred.ifas.ufl.edu/impact. Department of Food and Resource Economics, IFAS, University of Florida, Gainesville, Fla.
Regional Development Institute (RDI). “Comprehensive Industry Analysis: Food Processing
Industry.” Northern Illinois University Outreach, DeKalb, IL, November 2005,
23

http://www.rockfordil.com/pdf/pubs/Winnebago%20Food%20Processing%20Industry.pdf, Accessed August 10, 2007.
Stanbra, Ryan. "History of California Solid Waste Law." California Integrated Waste
Management Board. http://www.ciwmb.ca.gov/Statutes/Legislation/CalHist/, Accessed August 10, 2007.
Stanislaus County Board of Supervisors. “Action Agenda Summary.” Board Agenda # B-19.
June 13, 2006, http://www.co.stanislaus.ca.us/bos/AGENDA/2006/20060613/B19.pdf, Accessed: August 10, 2007.
Stephens, Larry."California's 2006 Statewide Diversion Rate Estimate." California Integrated
Waste Management Board (CIWMB), July 24, 2007. http://www.ciwmb.ca.gov/LGCentral/Rates/Diversion/2006/Default.htm, Accessed August 10, 2007.
Tolbert, Mark. “Nation’s Population to Reach 300 Million on Oct. 17.” Press Release from the
United States Department of Commerce, Washington, D.C., October 12, 2006, http://www.census.gov/Press-Release/www/releases/archives/population/007616.html.
United States Census Bureau. 2002 Economic Census.
http://www.census.gov/econ/census02/data/ca/CA000_31.HTM, Accessed August 10, 2007.
United States Census Bureau. “State and County Quick Facts: California.”
http://quickfacts.census.gov/qfd/states/06000.html, accessed August 10, 2007. United States Environmental Protection Agency (USEPA). "Municipal Solid Waste in the
United States: Facts and Figures." Publication number: EPA530-R-06-011 October 2006.
24

Appendix
25

Table A1: Tax Impact for Processor 1A Total in 2004 Dollars
Transfers -163,195Enterprises (Corporations) Total -163,195
Corporate Profits Tax 5,609,631Indirect Bus Tax: Custom Duty 286,727Indirect Bus Tax: Excise Taxes 878,639Indirect Bus Tax: Fed NonTaxes 306,416Personal Tax: Estate and Gift Tax 0Personal Tax: Income Tax 6,548,561Personal Tax: NonTaxes (Fines- Fees) 0Social Ins Tax- Employee Contribution 4,854,113Social Ins Tax- Employer Contribution 4,548,761
Federal Government NonDefense
Total 23,032,849Corporate Profits Tax 1,594,493Dividends 3,256,238Indirect Bus Tax: Motor Vehicle Lic 84,085Indirect Bus Tax: Other Taxes 833,038Indirect Bus Tax: Property Tax 3,571,043Indirect Bus Tax: S/L NonTaxes 400,801Indirect Bus Tax: Sales Tax 4,936,832Indirect Bus Tax: Severance Tax 1,515Personal Tax: Estate and Gift Tax 0Personal Tax: Income Tax 2,270,173Personal Tax: Motor Vehicle License 92,302Personal Tax: NonTaxes (Fines- Fees) 871,050Personal Tax: Other Tax (Fish/Hunt) 16,166Personal Tax: Property Taxes 37,914Social Ins Tax- Employee Contribution 149,600
State/Local Government NonEducation
Social Ins Tax- Employer Contribution 496,885 Total 18,612,133 Total Federal, State, and Local 41,481,786Copyright MIG 2007
26

Table A2: Tax Impact for Processor 1B Total in 2004 Dollars
Transfers -198,766Enterprises (Corporations) Total -198,766
Corporate Profits Tax 6,412,743Indirect Bus Tax: Custom Duty 364,319Indirect Bus Tax: Excise Taxes 1,116,411Indirect Bus Tax: Fed NonTaxes 389,337Personal Tax: Estate and Gift Tax 0Personal Tax: Income Tax 8,158,302Personal Tax: NonTaxes (Fines- Fees) 0Social Ins Tax- Employee Contribution 6,003,644Social Ins Tax- Employer Contribution 5,540,210
Federal Government NonDefense
Total 27,984,966Corporate Profits Tax 1,822,771Dividends 3,722,423Indirect Bus Tax: Motor Vehicle Lic 106,839Indirect Bus Tax: Other Taxes 1,058,470Indirect Bus Tax: Property Tax 4,537,416Indirect Bus Tax: S/L NonTaxes 509,263Indirect Bus Tax: Sales Tax 6,272,805Indirect Bus Tax: Severance Tax 1,926Personal Tax: Estate and Gift Tax 0Personal Tax: Income Tax 2,828,214Personal Tax: Motor Vehicle License 114,991Personal Tax: NonTaxes (Fines- Fees) 1,085,169Personal Tax: Other Tax (Fish/Hunt) 20,140Personal Tax: Property Taxes 47,231Social Ins Tax- Employee Contribution 182,206
State/Local Government NonEducation
Social Ins Tax- Employer Contribution 605,186 Total 22,915,048 Total Federal, State, and Local 50,701,248Copyright MIG 2007
27

Table A3: Tax Impact for Processor 2 Total in 2004 Dollars
Transfers -37,158Enterprises (Corporations) Total -37,158
Corporate Profits Tax 1,130,773Indirect Bus Tax: Custom Duty 48,311Indirect Bus Tax: Excise Taxes 148,043Indirect Bus Tax: Fed NonTaxes 51,629Personal Tax: Estate and Gift Tax 0Personal Tax: Income Tax 1,446,524Personal Tax: NonTaxes (Fines- Fees) 0Social Ins Tax- Employee Contribution 1,057,029Social Ins Tax- Employer Contribution 1,030,335
Federal Government NonDefense
Total 4,912,664Corporate Profits Tax 321,413Dividends 656,383Indirect Bus Tax: Motor Vehicle Lic 15,817Indirect Bus Tax: Other Taxes 156,701Indirect Bus Tax: Property Tax 671,739Indirect Bus Tax: S/L NonTaxes 75,394Indirect Bus Tax: Sales Tax 928,654Indirect Bus Tax: Severance Tax 285Personal Tax: Estate and Gift Tax 0Personal Tax: Income Tax 501,023Personal Tax: Motor Vehicle License 20,092Personal Tax: NonTaxes (Fines- Fees) 189,003Personal Tax: Other Tax (Fish/Hunt) 3,618Personal Tax: Property Taxes 8,029Social Ins Tax- Employee Contribution 36,166
State/Local Government NonEducation
Social Ins Tax- Employer Contribution 120,124 Total 3,704,440 Total Federal, State, and Local 8,579,926Copyright MIG 2007
28

Table A4: Tax Impact for Average Stanislaus Food Manufacturer Total in 2004 Dollars
Transfers -22,603Enterprises (Corporations) Total -22,603
Corporate Profits Tax 758,701Indirect Bus Tax: Custom Duty 40,271Indirect Bus Tax: Excise Taxes 123,405Indirect Bus Tax: Fed NonTaxes 43,036Personal Tax: Estate and Gift Tax 0Personal Tax: Income Tax 913,986Personal Tax: NonTaxes (Fines- Fees) 0Social Ins Tax- Employee Contribution 675,782Social Ins Tax- Employer Contribution 630,015
Federal Government NonDefense
Total 3,185,196Corporate Profits Tax 215,655Dividends 440,405Indirect Bus Tax: Motor Vehicle Lic 11,810Indirect Bus Tax: Other Taxes 117,001Indirect Bus Tax: Property Tax 501,554Indirect Bus Tax: S/L NonTaxes 56,293Indirect Bus Tax: Sales Tax 693,380Indirect Bus Tax: Severance Tax 213Personal Tax: Estate and Gift Tax 0Personal Tax: Income Tax 316,849Personal Tax: Motor Vehicle License 12,883Personal Tax: NonTaxes (Fines- Fees) 121,573Personal Tax: Other Tax (Fish/Hunt) 2,256Personal Tax: Property Taxes 5,292Social Ins Tax- Employee Contribution 20,720
State/Local Government NonEducation
Social Ins Tax- Employer Contribution 68,820 Total 2,584,702 Total Federal, State, and Local 5,747,295Copyright MIG 2007
29

Table A5: Tax Impact for Average Stanislaus Vegetable and Food Processor Total in 2004 Dollars
Transfers -78,662Enterprises (Corporations) Total -78,662
Corporate Profits Tax 2,840,874Indirect Bus Tax: Custom Duty 128,658Indirect Bus Tax: Excise Taxes 394,258Indirect Bus Tax: Fed NonTaxes 137,493Personal Tax: Estate and Gift Tax 0Personal Tax: Income Tax 3,073,838Personal Tax: NonTaxes (Fines- Fees) 0Social Ins Tax- Employee Contribution 2,297,124Social Ins Tax- Employer Contribution 2,192,541
Federal Government NonDefense
Total 11,064,786Corporate Profits Tax 807,496Dividends 1,649,050Indirect Bus Tax: Motor Vehicle Lic 37,730Indirect Bus Tax: Other Taxes 373,796Indirect Bus Tax: Property Tax 1,602,376Indirect Bus Tax: S/L NonTaxes 179,845Indirect Bus Tax: Sales Tax 2,215,224Indirect Bus Tax: Severance Tax 680Personal Tax: Estate and Gift Tax 0Personal Tax: Income Tax 1,065,601Personal Tax: Motor Vehicle License 43,325Personal Tax: NonTaxes (Fines- Fees) 408,863Personal Tax: Other Tax (Fish/Hunt) 7,588Personal Tax: Property Taxes 17,797Social Ins Tax- Employee Contribution 72,108
State/Local Government NonEducation
Social Ins Tax- Employer Contribution 239,502 Total 8,720,982 Total Federal, State, and Local 19,707,106Copyright MIG 2007
30

AN ECONOMIC ASSESSMENT OF PRODUCER CHARGE BACK FEE FOR DISPOSAL OF FOOD PROCESSING WASTE IN STANISLAUS COUNTY, CALIFORNIA
Submitted by
Mechel S. Paggi * Fumiko Yamazaki
Fangbin Qiao
To
The California Institute for the Study of Specialty Crops College of Agriculture, Food and Environmental Sciences
California Polytechnic State University San Luis Obispo, CA
September 30, 2007
Director, Senior Research Economist and Research Economist, Center for Agricultural Business California Agricultural Technology Institute, California State University, Fresno, respectively. "Funding for this project has been made available by the Governor's Buy California Initiative, the California Department of Food and Agriculture ("CDFA") and the U.S. Department of Agriculture ("USDA"). The content of this publication does not necessarily reflect the views or policies of CDFA or USDA, nor does any mention of trade names, commercial products and organizations imply endorsement of them by CDFA or USDA."
31

Introduction As background to the issues facing Stanislaus Country producers the following information has been extracted and paraphrased from Central Valley Regional Water Control Board staff reports submitted or presented in public forum in 2005. The food production and processing sector is a major component of the Central Valley Region’s economy and employs up to 35 percent of the workforce in some counties. This sector generates about 20 billion dollars annually, most of it from the San Joaquin Valley. Due to its agricultural wealth, the Region contains the some of the largest food processing plants in the nation. While some discharge to publicly owned treatment works, most discharge to “land application sites.” The source water for many farms and food processing plants is the Region’s groundwater. In 1978 Stanislaus County, California established the Food Processing Residue Use Program. This program allowed for the diversion of food processing residue from landfills to permitted sites that use the residue as direct cattle feed; feed processing product, or soil supplements. The majority of food residue in the program originated from food processing plants such as Hunt-Wesson, Del Monte, Stanislaus Foods, Patterson Frozen Foods, and Eckert Cold Storage. Residue use sites include diaries and feedlots, which directly feed the material to livestock; land spreading operations; and animal feed processors. The program was originally sponsored by the food processing manufacturers. As the commodity users recognized the value of the program, the funding system was changed to bill the food residue use sites for their proportional costs of the program. During the first twenty years of the program, more than 52 million tons of food residues were diverted from landfill to permitted sites throughout the Central Valley region.
In 1985, State Water Resources Control Board adopted regulations in Title 27 for wastes discharged to land. Title 27 requires wastes that have significant potential to cause groundwater pollution be fully contained if they are discharged to land for treatment, storage or disposal. Title 27 establishes prescriptive standards for liners, collection systems, as well as requirements for monitoring and closure. In the Central Valley Region, discharges of food processing waste to land have historically been regulated under the Waste Discharge Requirement (WDR; formerly Non-Chapter 15) Program, and have been considered to be exempt from the full-containment, monitoring, financial assurance and corrective action requirements of the Title 27 regulations.1 In authorizing land application sites through issuance of WDRs, the Regional Board has historically exempted these sites from Title 27 because it was then assumed they conformed to
1 Title 27, California Code of Regulations (CCR), Division 2, Subdivision 1, Consolidated Regulations for Treatment,Storage, Processing, or Disposal of Solid Waste, §20005, et seq. Discharges of food processing waste to land must comply with the Title 27 regulatory requirements unless one of the following applies: (1) The discharge is specifically exempted pursuant to one of three subsections of §20090 (b) Discharges of nonhazardous wastewater to land under WDRs, reclamation requirements or a waiver and which comply with the applicable Basin Plan, (f) Use of nonhazardous decomposable waste as a soil amendment pursuant to best management practices, (i) Waste treatment in fully enclosed facilities, such as tanks, or in concrete-lined facilities of limited areal extent; (2) The waste is classified as “inert”, i.e., it does not contain hazardous waste or soluble pollutants at concentrations in excess of applicable water quality objectives, and does not contain significant quantities of decomposable waste.
32

the applicable basin plan. Where a discharge might degrade groundwater, it was assumed that best management practices would minimize degradation and prevent pollution. According to the Regional Board staff report, prescriptive and performance standards of the Title 27 regulations (e.g., pond liner systems, monitoring), reverse osmosis salt removal technology, and U.S. Environmental Protection Agency (USEPA) technology-based effluent standards are typically not evaluated as alternatives in the WDR Program, even though they are usually practicable. Little or no monitoring has been required to demonstrate that groundwater pollution has not occurred (i.e., to demonstrate compliance with water quality objectives in the basin plans) or, if it has occurred, that the requirements of the Antidegradation Policy have been satisfied. Where significant groundwater impacts were found, dischargers have been required to modify their waste management practices to prevent future impacts. However, investigation and cleanup of groundwater, in accordance with State Water Board Resolution No. 92-49, Policies and Procedures for Investigation and Cleanup and Abatement of Discharges Under Water Code Section 13304 (Cleanup Policy), has not often been required. Historically, many of the smaller food processing waste discharges were regulated under conditional waivers of WDRs—where a waiver was viewed as not against the public interest—or, for the many larger operations, by individual WDRs. However, Section 13269 of the California Water Code, as amended in 1999 (SB390), caused all Regional Board waivers that were in effect as of 1 January 2000 to expire on 1 January 2003. Formal Regional Board action was required, including a public hearing, to continue any waiver after that date. Further, all renewed or newly adopted waivers now automatically expire every five years and must require monitoring to demonstrate compliance with waiver conditions. Section 13269, as amended, requires the Regional Boards to re-evaluate how food processing and other wastes are being managed under waivers.2 Policy Alternatives and Methodology Given the dynamic policy environment surrounding the regulation of food processing waste disposal it is prudent for industry representatives to evaluate the possible outcomes that may result from alternatives to existing programs. One alternative to the existing regulation on the practice of land application of food processing waste in the region is to require processing firms to haul waste to an authorized disposal site. If such a policy was adopted it is likely that Stanislaus County producers would be assessed a fee by processors equivalent to the firm’s cost of disposal or receive a lesser price for their product that reflects the added cost to the firm. The amount of such a fee or decrease in price growers may face is difficult to determine. The extent to which the entire cost would be shifted to the grower is also uncertain. The overall economic impact of a change in policy governing land based application of food processing waste will be determined by the degree to which firms, producers and related support industries are effected.
2 Most of the information provided in this review was taken directly from Staff Report for the 16/17 March 2006 meeting of the Central Valley Regional Water Quality Control Board WSW: 1 March 2006 and 28 January 2005 Board meeting of the Central Valley Regional Water Quality Control Board
33

One component necessary to begin to assess the economic effects of any change in policy related to land application of food processing waste is a baseline estimate of the policy’s potential effect on grower profitability. The purpose of this study is to apply a set of representative farm simulation models to determine the potential change in the returns to growers if processing firms assess a charge back fee to cover the increase in cost associated with a change in policy requiring disposal of waste products in approved sites. The analysis compares existing returns above cash cost for processing tomato and cling peach growers before and after the imposition of a charge back fee equal to the estimated per unit cost for waste disposal. In addition a three year forecast of the possible change in net returns, above cash costs is provided. The data used for the stochastic simulation models is based on University of California Extension, Cost and Returns survey information as amended by input from regional producers. The estimate of costs associated with the disposal of peach and tomato processing waste was supplied by representatives from regional food processing firms. The results provided are mean values for net returns derived from 500 runs of the models allowing for variability consistent with observed historical probability distribution functions associated with regional prices and yields for the individual commodities. Results The representative farm models for cling peaches and processing tomatoes were used to analyze the changes in returns to cash costs if Stanislaus County producers were assessed a fee equal to the estimated cost of disposal of processing waste at approved facilities rather than being allowed to incorporate that waste into their fields, the current practice. The analysis indicates that while changes to existing disposal practices would have negative effects on the revenues of peach and tomato producers, tomato enterprises would not generate a positive net return. Under current cultural practices the Stanislaus County producers have an average net return above cash cost of $57 and $1,557 per acre for tomato and cling peach production respectively (Table 5). Over the three year forecast horizon, both enterprises continue to have positive, albeit declining net returns. Under the range of charge back fees provided by industry sources tomato returns decline to and average of -$216 to -$319 per acre. Over the same range of charge back fees net returns to cling peach producers decline to an average of $1,401 to $1,342 per acre. Using the stoplight chart analysis described in Section II, the probabilities of producers generating various levels of net returns are analyzed for one year and on average over the 3 year forecast horizon. For tomatoes the probability of generating a net return of $50 per acre and above was compared with that of zero or negative returns. For cling peaches the alternative returns considered were the low yield/high price and high yield/low price combinations provided in the University of California Cooperative Extension Service most recent Cost and Returns Survey, $1,450 and $1,728 per acre respectively. The analysis calculates the probability of generating returns at or above the higher range (green); between the high and low range (yellow) and at or below the lower range (red) (Figures 4 – 7).
34

Results from the representative farm model of Stanislaus processing tomato production under current cultural practices provides a 54 percent probability that producers would generate a return above $50 per acre in 2007, 13 percent probability of returns between $50 and $0, and a 33 percent probability of negative returns (Figure 4). With the imposition of a charge back fee the probability of generating a positive net return for processing tomato production is reduced to a range of 6 to 11 percent. Over the three year forecast period the probability of generating a positive return from processed tomato production under current cultural practices increases to 70 percent, however when a charge back fee is applied the model results indicate there is virtually no likelihood of a positive return (Figure 5). Results from the representative farm model of Stanislaus cling peach production under current cultural practices provides a 32 percent probability that producers would generate a return above $1,728 per acre, 35 percent probability of returns between $1,728 and $1,450, and a 33 percent probability of returns below $1,450 per acre in 2007 (Figure 6). With the imposition of a charge back fee the probability of generating a return above $1,450 per acre declines from 67 percent to a range of 47 to 40 percent. Over the three year forecast period the probability of generating a return above $1,450 increases to 71 percent under current cultural practices, but declines to a range of 39 to 30 percent under alternative fee levels (Figure 7). Conclusions The results of the analysis of potential change in regulations currently governing disposal of peach and tomato processing waste in Stanislaus County suggest significant negative effects on the producers of those commodities. While peach producers are able to maintain a positive net return per acre, few if any producers of processing tomatoes would likely be able, to remain in production if charge back fees were imposed. In addition the likelihood of tomato processors being about to remain in business without a local supply of product is questionable. This analysis, while preliminary and in need of increased precision regarding the costs of alternative disposal methods, provides an example of how the projects representative models can be used to develop quantitative estimates of potential policy changes that can be useful to agricultural decision makers and government planners.
35

Stanislaus Representative Disposal Cost Charge
The cost of processing waste disposal if that waste had to be taken to the Bay Area or alternative waste disposal site has a range of $800 to $1,100 a truckload not accounting for labor and equipment costs Each truck load is 25 tons of processing waste by-product. Total amount of product processed is 125,000 tons. Approximately 30,000 tons of the 125,000 tons is processing waste (peels, juice, pits, etc). 30,000 tons/25 tons per load = 1,200 loads of processing waste to be trucked and dumped. Three cost scenarios:
1. $800/load. 1,200 tons/load x $800/load = $960,000. Waste disposal back charge to grower-suppliers is $960,000/125,000 tons = $7.68/ton of processed product.
2. $950/load. 1,200 tons/load x $950/load = $1,140,000. Waste disposal back charge to
grower-suppliers is $1,140,000/125,000 tons = $9.12/ ton of processed product.
3. $1,100/load. 1,200 tons/load x $1,100/load = $1,320,000. Waste disposal back charge to grower-suppliers is $1,320,000/125,000 tons = $10.56/ ton of processed product.
36

37
Table 5. Impact of Waste disposal back charge on processing tomato grower’s net return
Mean of simulated net return ($/acre)
No
back charge
Low back charge ($7.68/ton)
Med back charge ($9.12/ton)
High back charge ($10.56/ton)
Average $57 -$216 -$268 -$319
2007 $74 -$195 -$246 -$296 2008 $49 -$225 -$276 -$327 2009 $47 -$229 -$281 -$333
Table 6. Impact of waste disposal back charge on processing peach grower’s net return
No
back charge
Low back charge ($7.68/ton)
Med back charge ($9.12/ton)
High back charge ($10.56/ton)
Average $1,557 $1,401 $1,372 $1,342
2007 $1,575 $1,421 $1,392 $1,364 2008 $1,552 $1,396 $1,366 $1,337 2009 $1,544 $1,386 $1,356 $1,327
*Note: in order to understand the distribution of the net return, we allow both the yield and price to vary simultaneously 500 times, according to the historical distributions and correlation of price and yield. Each time, a net return is calculated. Data in the table are the mean of the simulated net return.

Figure 4. Impact of back charge on mean of simulated net return for processed tomatoes: year 2007
Stoplight Chart for Probabilities Less Than $0 and Greater Than $50 per acre in Year 2007
0.33
0.13
0.54
0%10%20%30%40%50%60%70%80%90%
100%
Year 2007
0.89
0.030.08
0%10%20%30%40%50%60%70%80%90%
100%
Year 2007
0.92
0.020.06
0%10%20%30%40%50%60%70%80%90%
100%
Year 2007
0.94
0.020.04
0%10%20%30%40%50%60%70%80%90%
100%
Year 2007
Panel A No Back Charge
Panel D High Back Charge
($10.56/ton)
Panel C Med Back Charge
($9.12/ton)
Panel B Low Back Charge
($7.68/ton)
Figure 5. Impact of back charge on mean of simulated net return for processed tomatoes:
3 year average (2007-2009)
Stoplight Chart for Probabilities Less Than $0 and Greater Than $50 per acre: 3 year average (2007 – 2009)
0.30
0.21
0.49
0%
10%
20%
30%
40%
50%
60%
70%
80%
90%
100%
3 Year Average (2007-2009)
0.98
0.010.01
0%
10%
20%
30%
40%
50%
60%
70%
80%
90%
100%
3 Year Average (2007-2009)
0.99
0.010.00
0%
10%
20%
30%
40%
50%
60%
70%
80%
90%
100%
3 Year Average (2007-2009)
1.00
0.000.00
0%
10%
20%
30%
40%
50%
60%
70%
80%
90%
100%
3 Year Average (2007-2009)
Panel D High Back Charge
($10.56/ton)
Panel C Med Back Charge
($9.12/ton)
Panel B Low Back Charge
($7.68/ton)
Panel A No Back Charge
1

2
Figure 6. Impact of back charge on mean of simulated net return for cling peaches: year 2007
Stoplight Chart for Probabilities Less Than $1,450 and Greater Than $1,728 per acre: 2007
Note: $1,450 /acre is the net return above cash costs for cling peach when the yield (18 ton/acre) is low but price ($245/ton) is high and $1,728/acre is the net return above cash costs when yield (22 ton/acre) is high but price ($225/ton) is low, according to UCCES study.
0.33
0.35
0.32
0%10%
20%30%
40%50%
60%70%
80%90%
100%
Year 2007
0.53
0.30
0.17
0%10%
20%30%
40%50%
60%70%
80%90%
100%
Year 2007
0.55
0.31
0.13
0%10%
20%30%
40%50%
60%70%
80%90%
100%
Year 2007
0.60
0.27
0.13
0%10%
20%30%
40%50%
60%70%
80%90%
100%
Year 2007
Panel A No Back Charge
Panel D High Back Charge
($10.56/ton)
Panel C Med Back Charge
($9.12/ton)
Panel B Low Back Charge
($7.68/ton)
Figure 7. Impact of back charge on mean of simulated net return for cling peaches: 3 year average (2007-2009)
Stoplight Chart for Probabilities Less Than $1,450 and Greater Than $1,728 per acre: 3 year average (2007 – 2009)
0.52
0.29
0.19
0%
10%
20%
30%
40%
50%
60%
70%
80%
90%
100%
3 year average (2007-2009)
0.35
0.61
0.05
0%
10%
20%
30%
40%
50%
60%
70%
80%
90%
100%
3 year average (2007-2009)
0.30
0.65
0.04
0%
10%
20%
30%
40%
50%
60%
70%
80%
90%
100%
3 year average (2007-2009)
0.27
0.69
0.03
0%
10%
20%
30%
40%
50%
60%
70%
80%
90%
100%
3 year average (2007-2009)
Panel A No Back Charge
Panel D High Back Charge
($10.56/ton)
Panel C Med Back Charge
($9.12/ton)
Panel B Low Back Charge
($7.68/ton)