THE ECONOMIC IMPACT OF OUTDOOR RECREATION IN …
32
THE ECONOMIC IMPACT OF OUTDOOR RECREATION IN BEAVERHEAD COUNTY OCTOBER 2021 BUREAU OF BUSINESS AND ECONOMIC RESEARCH UNIVERSITY OF MONTANA
Transcript of THE ECONOMIC IMPACT OF OUTDOOR RECREATION IN …

THE ECONOMIC IMPACT OF OUTDOOR RECREATION IN BEAVERHEAD COUNTY
OCTOBER 2021
BUREAU OF BUSINESS AND ECONOMIC RESEARCHU N I V E R S I T Y O F M O N TA N A

1
CONTENTS
Contents .................................................................................................................................................... 1
Acknowledgements ................................................................................................................................... 2
Executive Summary ................................................................................................................................... 3
Introduction and Overview ..................................................................................................................... 10
Describing Hunting and Angling in Beaverhead County ......................................................................... 11
The Economic Impact of Outdoor Recreation in Beaverhead County .................................................... 21
Conclusion ............................................................................................................................................... 26
Appendix 1: Policy Analysis With The Remi Model................................................................................. 27

2
ACKNOWLEDGEMENTS
The BBER would like to acknowledge the substantial assistance of the Montana Wildlife Federation and Montana Fish Wildlife and Parks for contributing to the data efforts of this study.

3
EXECUTIVE SUMMARY
Outdoor recreation in Beaverhead County spans a wide variety of activities, including big game hunting,
upland game bird hunting, hiking, camping, rafting, mountain biking, and angling. The Beaverhead-
Deerlodge National Forest is located within the county and is famous for big game such as elk, mule
deer, white-tailed deer, bighorn sheep, black bear, moose, mountain goat and antelope. In particular,
the relatively high concentration of elk in the region has made Southwest Montana one of the highest
hunting use areas in the state1. The abiding and ubiquitous presence of hunters, outfitters, anglers, and
other outdoor enthusiasts in the sparsely populated county has made them so familiar that the
economic impact of their activities can sometimes go unnoticed.
These activities are important for many reasons. For Montana residents, they are a fundamental aspect
of the way of life in the state. For nonresidents, these activities are a major attraction and reason for
visiting the state. Outdoor recreation sustains and improves the physical and mental health of those
participating. When residents and nonresidents engage in outdoor recreation in Beaverhead County
they also contribute to the fabric of the communities there.
Outdoor recreation, and particularly hunting and angling in Beaverhead County, is also an important
piece of the economy. The spending of hunters and anglers, the spending of hunting and angling
outfitters, and the increased population of the state that comes about because of the outdoor
recreation activities all contribute to the income of businesses and governments that are not directly
part of the outdoor recreation industry themselves. As this income is received and spent again, further
economic activity is supported.
This study represents a comprehensive effort to assess the size of that total economic contribution. We
have gathered and assembled data on the size and scope of measurable outdoor recreation in
Beaverhead County. Reliable and detailed data on recreational activities that do not require a permit
(such as hiking, camping, and rafting) are not available. We therefore necessarily restrict the remainder
of this analysis to outdoor recreational activities in Beaverhead County that do require a permit, namely
hunting and angling. The data available for these activities includes details on the type of recreation
activity, the number of resident and nonresident days spent in that activity, and the amount of resulting
local expenditures. We presented that information to an economic model to assess the (hypothetical)
research question: what would the Montana economy look like if outdoor recreation in Beaverhead
County did not exist? The model is used to represent all of the linkages between the spending and
production of the industry and the rest of the state economy.
A comparison of this hypothetical “no outdoor recreation” economy to the actual economy gives a
measure of the total contribution the existence of outdoor recreation in Beaverhead County makes to
the overall economy of the state.
1 Montana FWP, “The Economics of Big Game Hunting in Montana,” 2016.

4
Summary of Findings
Our principal finding is that the presences of outdoor recreation in Beaverhead County makes the
Montana economy larger, more prosperous and more populous than would be the case in their
absence.
Table 1: The Economic Impact of Outdoor Recreation in Beaverhead County: Summary
Category Units Impact
Total Employment................................................. Jobs 1,451
Personal Income.................................................... $ Millions 74.1
Disposable Personal Income................................ $ Millions 66.7
Output.................................................................. $ Millions 167.2
Population ............................................................ People 2,050
The activities of hunting and angling in Beaverhead County ultimately produce an economy with:
1,451 more jobs, spread across the state in a wide-ranging spectrum of industries. Forcomparative reference, the total population of Beaverhead County was 9,415 in 20192, and thetotal number of people employed in the county was 3,774 in 20203;
$74 million more each year in income received by Montana households, with over $66.7 millionrepresenting after tax income;
$167 million each year in additional output, or gross receipts to Montana businesses and non-business organizations, and
More than 2,000 more people attracted and retained to live in our state.
There is a wealth of detail and variability that lies behind these summary findings. Characteristics,
expenditures, products and services and physical locations of outdoor recreation are highly varied and
the impacts reported in Table 1 reflect the impact of their operations as a total. Considerable insight can
be obtained by examining different categories of outdoor recreation separately.
For this analysis we consider the most recent data from seven categories of hunting: elk, deer, antelope,
moose, bighorn sheep, mountain goats, and upland game birds. We also include data on angling in the
county. The number of hunter and anglers days by category are displayed in Table 2. It is important to
note that the number of hunter and angler days displayed in Table 2 are point estimates taken from the
2 U.S. Census, American Community Survey, 5-year estimate. 3 U.S. Bureau of Labor Statistics.
5
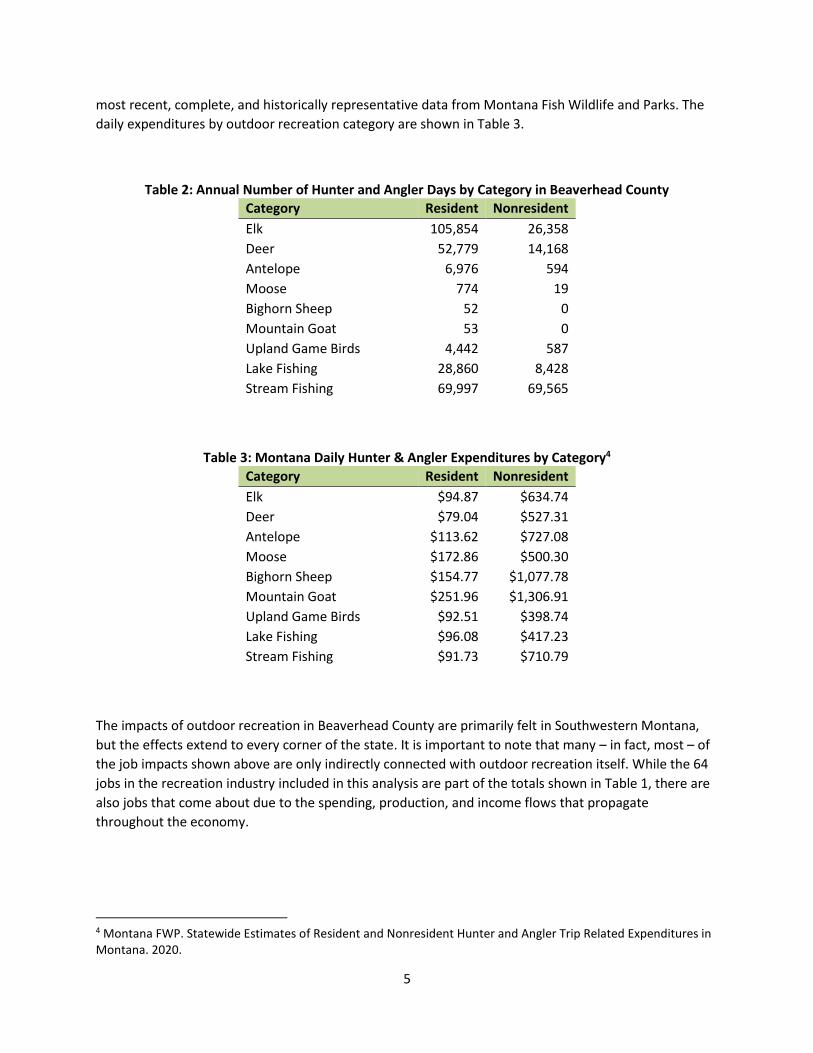
most recent, complete, and historically representative data from Montana Fish Wildlife and Parks. The
daily expenditures by outdoor recreation category are shown in Table 3.
Table 2: Annual Number of Hunter and Angler Days by Category in Beaverhead County
Category Resident Nonresident
Elk 105,854 26,358
Deer 52,779 14,168
Antelope 6,976 594
Moose 774 19
Bighorn Sheep 52 0
Mountain Goat 53 0
Upland Game Birds 4,442 587
Lake Fishing 28,860 8,428
Stream Fishing 69,997 69,565
Table 3: Montana Daily Hunter & Angler Expenditures by Category4
Category Resident Nonresident
Elk $94.87 $634.74
Deer $79.04 $527.31
Antelope $113.62 $727.08
Moose $172.86 $500.30
Bighorn Sheep $154.77 $1,077.78
Mountain Goat $251.96 $1,306.91
Upland Game Birds $92.51 $398.74
Lake Fishing $96.08 $417.23
Stream Fishing $91.73 $710.79
The impacts of outdoor recreation in Beaverhead County are primarily felt in Southwestern Montana,
but the effects extend to every corner of the state. It is important to note that many – in fact, most – of
the job impacts shown above are only indirectly connected with outdoor recreation itself. While the 64
jobs in the recreation industry included in this analysis are part of the totals shown in Table 1, there are
also jobs that come about due to the spending, production, and income flows that propagate
throughout the economy.
4 Montana FWP. Statewide Estimates of Resident and Nonresident Hunter and Angler Trip Related Expenditures in Montana. 2020.

6
These come about through three basic mechanisms:
The spending of the outdoor recreation workers is received in the local economy as income,which in turn, supports other jobs which create more spending.
The spending of the hunters and anglers themselves on hospitality, vendors, materials andservices, including tax payments to state and local spending, supports jobs and further spendingas those entities receiving payment employ workers and pay their own vendors.
The migration of people towards job opportunity ultimately grows the population, creating newdemand for goods and services and bringing talent to our state.
Table 4: Employment Impacts
Industry Impact
Construction............................................................. 83
Finance and Real Estate............................................ 84
Retail Trade.............................................................. 155
Transportation and Warehousing.............................. 47
Professional and Technical Services.......................... 53
Administrative and Waste Services........................... 44
Health Care and Social Assistance............................. 64
Utilities.................................................................... 5
Accommodation and Food Services........................... 509
Other Services, except Public Administration............ 42
Other Private............................................................ 222
Government............................................................. 141
TOTAL....................................................................... 1,451
Some of these mechanisms can be seen at work from a more detailed breakdown of the employment
impacts of outdoor recreation in Beaverhead County by major industry groupings, as shown in Table 4.
Some of the job impacts shown above reflect, in part, the employment in the recreation industry itself.
But many categories in the table, such as Accommodation and Food Service, Retail Trade and
Government, have substantial employment impacts without any direct connection to employment in
the outdoor recreation industry.
This illustrates the manner in which spending spreads through the economy. The additional people and
the additional spending create more demand for a wide spectrum of seemingly unrelated industries,
including restaurants, construction and health care. Also note the industry impacts coming from state
and especially local government, the latter driven by increased demand for local services including K-12
education.

7
The larger economy that comes about because of the presence of outdoor recreation has more income
as well. Much of that increase is tied directly to employment, but the gains in dollars received by
Montana households – personal income – is larger than the gain in income that comes from earnings.
This is apparent from Table 5, which details the impacts that the presence of outdoor recreation in the
economy has on the separate components of personal income. As the table shows, the biggest
component of the nearly $67 million increase in annual personal income that occurs because of outdoor
recreation is accounted for by the $48.3 million increase in net earnings. But while smaller, the $15.2
million gain in property income – consisting of dividends, interest and rent – is not insubstantial. It
shows how the increased size of the economy is reflected in more people and more prosperity, which
involves more income from things other than jobs.
Table 5: Personal Income Impacts
Category Impact
Total Earnings by Place of Work 57.1
Total Wage and Salary Disbursements 41.3
Supplements to Wages and Salaries 11.8
Employer contributions for employee pension and insurance funds 7.4
Employer contributions for government social insurance 4.4
Proprietors' income with inventory valuation and capital consumption adjustments 4.0
Less:
Contributions for government social insurance 8.6
Employee and self-employed contributions for government social insurance 4.2
Employer contributions for government social insurance 4.4
Plus: Adjustment for residence (0.2)
Gross In 1.9
Gross Out 2.1
Equals: Net earnings by place of residence 48.3
Plus: Property Income 15.2
Dividends 5.5
Interest 6.8
Rent 2.9
Plus: Personal Current Transfer Receipts 10.7
Equals: Personal Income 74.1
Less: Personal Current Taxes 7.4
Equals: Disposable Personal Income 66.7

8
Table 6: Compensation Impacts
Category Units Impact
Wages and Salaries............................ $ Millions 41.3
Compensation................................... $ Millions 53.1
Earnings............................................. $ Millions 57.1
Earnings per Job, New Jobs................ $ Dollars $39,369
New jobs average $39,369 for each new job created in the state economy because of hunting and
angling in Beaverhead County. That is about 6 percent lower than the state average of $41,789 in
earnings per job. The slightly lower than average earnings occur in part because of the
comparatively low pay of jobs at in the tourism and hospitality industries.
Finally, we note that an economy with the job opportunities supported directly and indirectly by the
activities of outdoor recreation in Beaverhead County is also an economy with more people. This
reflects the attraction of investment, workers and their (current or future) families toward economic
opportunity.
Table 7: Population Impacts
Age Cohort Impact
Ages 0-14......................................... 516
Ages 15-24....................................... 246
Ages 25-64....................................... 1,225
Ages 65+.......................................... 63
Total................................................ 2,050
We estimate that about 2,050 more people live in the state because of the presence of outdoor
recreation in Beaverhead County. As a point of comparison, this is more than 20 percent of the 9,415
populating the county itself. These additional people increase demand for products and services,
including public services. Note from Table 7 that many of the additional people are school-aged children,

9
who can be expected to increase demand for K-12 education. This has helped stabilize school systems
challenged by falling class sizes.
Thousands of outdoor recreationists visit Beaverhead County from all over the world each year. Hunters
and anglers are more connected to the communities they visit than many other tourists. Yet it is still
useful to get the “big picture” on how they collectively impact the economy of the state as a whole. As
this report makes clear, their contributions are significant.

10
INTRODUCTION AND OVERVIEW
Outdoor recreation has been part of the fabric of the Montana economy for longer than we have been a state. Its footprint is significant in industries that are central to the state’s economy, including tourism and hospitality, retail trade, and government. While its presence is most notable in Montana’s rural communities, it is an important economic driver in urban areas as well.
The long-standing presence of outdoor recreationists in cities and communities across the state has at times made their impact less visible to the general public. Yet they are responsible for thousands of jobs, millions of dollars of income and investment, and the stability and viability of community members who do business with them. Assessing and presenting the economic contributions made by these recreation activities to the Montana economy is a useful way of highlighting their importance.
About This Study This study was conducted by the Bureau of Business and Economic Research at the University of Montana (BBER) for the Montana Wildlife Federation (MWF). The principle author of this report is Brandon Bridge, Ph.D., BBER economist.
Research Approach BBER has conducted an analysis that addresses the research question – what would the economy of the state look like if outdoor recreation in Beaverhead County did not exist? The question is clearly hypothetical – no conceivable policy could (or should) make this event actually occur. Rather it is a way of highlighting how the activities of outdoor recreationists connect with the rest of the economy.
When one (hypothetically) removes the sales, production, employment and income of outdoor recreation from the economy, the reduction in economic activity is much larger than those employed in the outdoor industry itself, since the spending of the recreationists is received as income for other businesses and governments within their communities and in the state. Thus, the activity of outdoor recreation supports many jobs and livelihoods beyond those with a direct connection to the industry itself.
Our approach to this research involves constructing two scenarios for the economy. The first is a baseline, status-quo projection where no changes are made. The second is a “no outdoor recreation” scenario where the spending, production, sales and employment of outdoor recreation is subtracted from the economy. In the second case, the economy comes to a new equilibrium, or resting point, as other jobs and activities in the rest of the economy adjust to the absence of the outdoor recreation. The difference between the economic activity actually observed and this “no outdoor recreation” scenario is the total economic contribution of outdoor recreation in Beaverhead County.
Since this “no outdoor recreation” Beaverhead County economy cannot be directly observed, it must be constructed by means of an economic model. BBER uses its policy analysis model, leased from Regional Economic Models, Inc. (REMI) and constructed explicitly for this purpose, to conduct this analysis. The REMI model is a well-known, well-respected tool for economic analysis that has been used in hundreds of studies and is the subject of dozens of peer-reviewed scholarly articles.

11
DESCRIBING HUNTING AND ANGLING IN BEAVERHEAD COUNTY
The paragraphs that follow present a descriptive analysis of the number of hunter and angler days,
along with their associated expenditures, in Beaverhead County. These tables below display this data by
hunting and angling area/district.
Daily Expenditures by Hunters and Anglers
Montana Fish Wildlife and Parks conducted a baseline expenditure survey of resident and nonresident
hunting and fishing license holders in Montana in 2014. The resulting estimated average daily
expenditures by group were updated in 2020 to account for the inflation occurring between 2014-2020.
The estimates from that survey are displayed in Table 8. These trip-related expenditures include
spending on all goods and services related to their hunting and angling activities. These include:
gasoline, car rental, airfare, other transportation costs, food, beverages, lodging, equipment purchased
for the trip, and access and/or guide fees. These expenditures do not include the costs of their license or
any durable consumer goods such as rifles, fishing reels, boots, boats, and other durable fishing and
hunting equipment.
Table 8: Daily Hunter and Angler Expenditures by Residency5
Category Resident Nonresident
Elk $94.87 $634.74
Deer $79.04 $527.31
Antelope $113.62 $727.08
Moose $172.86 $500.30
Bighorn Sheep $154.77 $1,077.78
Mountain Goat $251.96 $1,306.91
Upland Game Birds $92.51 $398.74
Lake Fishing $96.08 $417.23
Stream Fishing $91.73 $710.79
5 Montana FWP. Statewide Estimates of Resident and Nonresident Hunter and Angler Trip Related Expenditures in Montana. 2020.

12
Elk Hunting in Beaverhead County
There are 14 deer and elk hunting districts that overlap the geographical territory of Beaverhead
County. These are highlighted by the red dots in Figure 1, and will be the focal points of both the deer
and elk hunting expenditure estimates that follow.
Figure 1: Deer and Elk Hunting Districts Overlapping Beaverhead County
The number of elk hunter days by residency status, and their ensuing expenditures are detailed in Table
9 below. The number of elk hunter days by residency were multiplied by the elk hunting expenditure
figures shown in Table 8 above to arrive at total expenditures by elk hunters, detailed by hunting district
in Table 9. In a representative year, the 14 elk hunting districts focused on see over 105,000 hunter days
by Montana residents and over 26,000 hunter days by nonresidents. The total expenditures by these
hunters in a given year add up to over $26 million spent in the county, which is the largest expenditure
group among big game hunters.

13
Table 9: Elk Hunter Days and Expenditures by District
District Resident Days Nonresident Days
Resident
Expenditures ($)
Nonresident
Expenditures ($)
Total
Expenditures ($)
300 8,018 3,472 760,668 2,203,817 2,964,485
302 5,814 2,444 551,574 1,551,305 2,102,879
319 10,895 1,390 1,033,609 882,289 1,915,897
321 4,992 1,623 473,591 1,030,183 1,503,774
322 4,431 1,372 420,369 870,863 1,291,232
325 9,947 3,097 943,672 1,965,790 2,909,462
326 3,509 1,416 332,899 898,792 1,231,691
328 3,915 1,179 371,416 748,358 1,119,775
329 9,336 3,138 885,706 1,991,814 2,877,520
331 10,812 2,329 1,025,734 1,478,309 2,504,044
332 6,646 1,895 630,506 1,202,832 1,833,338
334 3,992 854 378,721 542,068 920,789
340 17,613 1,427 1,670,945 905,774 2,576,719
341 5,934 722 562,959 458,282 1,021,241
TOTALS 105,854 26,358 $10,042,369 $16,730,477 $26,772,846

14
Deer Hunting in Beaverhead County
Table 10 below displays the number of deer hunter days by residency status, and their ensuing
expenditures. The number of deer hunter days by residency were multiplied by the deer hunting
expenditure figures shown in Table 8 above to arrive at total expenditures by deer hunters, detailed by
hunting district in Table 10. In a representative year, the 14 deer hunting districts focused on see over
52,000 hunter days by Montana residents and over 14,000 hunter days by nonresidents. The total
expenditures by these hunters in a given year add up to over $11 million spent in the county.
Table 10: Deer Hunter Days and Expenditures by District
District Resident Days Nonresident Days
Resident
Expenditures ($)
Nonresident
Expenditures ($)
Total
Expenditures ($)
300 2,211 716 174,757 377,554 552,311
302 2,143 1,536 169,383 809,948 979,331
319 2,562 310 202,500 163,466 365,967
321 2,107 326 166,537 171,903 338,440
322 4,300 1,531 339,872 807,312 1,147,184
325 6,036 2,397 477,085 1,263,962 1,741,048
326 2,528 827 199,813 436,085 635,898
328 911 536 72,005 282,638 354,644
329 3,290 1,762 260,042 929,120 1,189,162
331 8,434 1,731 666,623 912,774 1,579,397
332 2,561 781 202,421 411,829 614,251
334 1,387 433 109,628 228,325 337,954
340 10,706 1,125 846,202 593,224 1,439,426
341 3,623 157 286,362 82,788 369,150
TOTALS 52,799 14,168 $4,173,233 $7,470,928 $11,644,161

15
Antelope Hunting in Beaverhead County
There are eight antelope hunting districts that overlap the geographical territory of Beaverhead County.
These are highlighted by the red dots in Figure 2, and will be the focal points of the antelope hunting
expenditure estimates that follow.
Figure 2: Antelope Hunting Districts Overlapping Beaverhead County
Table 11 below displays the number of antelope hunter days by residency status, and their ensuing
expenditures. The number of antelope hunter days by residency were multiplied by the antelope
hunting expenditure figures shown in Table 8 above to arrive at total expenditures by antelope hunters,
detailed by hunting district in Table 11. In a representative year, the eight antelope hunting districts
focused on see almost 7,000 hunter days by Montana residents and about 600 hunter days by
nonresidents. The total expenditures by these hunters in a given year add up to over $1 million spent in
the county.

16
Table 11: Antelope Hunter Days and Expenditures by District
District Resident Days Nonresident Days
Resident
Expenditures ($)
Nonresident
Expenditures ($)
Total
Expenditures ($)
300 879 102 99,872 74,162 174,034
301 122 6 13,862 4,362 18,224
310 896 71 101,804 51,623 153,426
318 593 42 67,377 30,537 97,914
319 439 6 49,879 4,362 54,242
321 1,515 149 172,134 108,335 280,469
329 471 51 53,515 37,081 90,596
330 2,061 167 234,171 121,422 355,593
TOTALS 6,976 594 $792,613 $431,886 $1,224,499
Moose Hunting in Beaverhead County
There are 11 moose hunting districts that overlap the geographical territory of Beaverhead County.
These are highlighted by the red dots in Figure 3, and will be the focal points of the moose hunting
expenditure estimates that follow.
Figure 3: Moose Hunting Districts Overlapping Beaverhead County

17
Table 12 below displays the number of moose hunter days by residency status, and their ensuing
expenditures. The number of moose hunter days by residency were multiplied by the moose hunting
expenditure estimates shown in Table 8 above to arrive at total expenditures by moose hunters,
detailed by hunting district in Table 12. In a representative year, the 11 moose hunting districts in
Beaverhead County provide over 700 hunter days by Montana residents and about 20 hunter days by
nonresidents. The total expenditures by these hunters in a given year add up to over $140,000 spent in
the county.
Table 12: Moose Hunter Days and Expenditures by District
District Resident Days Nonresident Days
Resident
Expenditures ($)
Nonresident
Expenditures ($)
Total
Expenditures ($)
300 142 - 24,546 - 24,546
301 49 - 8,470 - 8,470
302 58 - 10,026 - 10,026
319 32 - 5,532 - 5,532
323 154 - 26,620 - 26,620
324 141 7 24,373 3,502 27,875
325 57 - 9,853 - 9,853
326 44 - 7,606 - 7,606
327 9 - 1,556 - 1,556
332 69 12 11,927 6,004 17,931
333 19 - 3,284 - 3,284
TOTALS 774 19 $133,794 $9,506 $143,299
Bighorn Sheep and Mountain Goat Hunting in Beaverhead County
In addition to elk, deer, and moose, there is also bighorn sheep and mountain goat hunting in
Beaverhead County. The hunting expenditures and the resulting economic impact from these two types
of game are quite small, but they are discussed here. There are two bighorn sheep hunting districts and
two mountain goat hunting districts that overlap the geographical territory of Beaverhead County. The
most recent estimates of hunter days in these districts did not include any nonresident hunter days for
either species.

18
Table 13 and Table 14 below display the number of bighorn sheep and mountain goat hunter days by
residency status, and their ensuing expenditures. The number of hunter days by residency were
multiplied by the hunting expenditure estimates by game type as shown in Table 8 above to arrive at
total expenditures by sheep and goat hunters, detailed by hunting district in Table 13 and Table 14. In a
representative year, the two hunting districts in Beaverhead County provide 52 bighorn sheep hunter
days and 53 mountain goat hunter days by Montana residents. The total expenditures by these hunters
in a given year add up to about $21,000 spent in the county.
Table 13: Bighorn Sheep Hunter Days and Expenditures by District
District Resident Days Nonresident Days
Resident
Expenditures ($)
Nonresident
Expenditures ($)
Total
Expenditures ($)
330 15 - 2,321 - 2,321
340 37 - 5,726 - 5,726
TOTALS 52 - $8,048 $- $8,048
Table 14: Mountain Goat Hunting Days and Expenditures by District
District Resident Days Nonresident Days
Resident
Expenditures ($)
Nonresident
Expenditures ($)
Total
Expenditures ($)
312 29 - 7,307 - 7,307
331 24 - 6,047.04 - 6,047
Totals 53 - $13,354 $- $13,354
Upland Game Bird Hunting in Beaverhead County
Table 15 below displays the number of upland game bird hunter days by residency status, and their
ensuing expenditures. The number of upland game bird hunter days by residency were multiplied by the
upland game bird hunting expenditure estimates shown in Table 8 above to arrive at total expenditures
by upland game bird hunters in Table 15. In a representative year, Beaverhead County provides over
4,000 hunter days by Montana residents and almost 600 hunter days by nonresidents. The total
expenditures by these hunters in a given year add up to over $645,000 spent in the county.
Table 15: Upland Game Bird Hunting
Area Resident Days Nonresident Days
Resident
Expenditures
Nonresident
Expenditures
Total
Expenditures
Beaverhead
County
4,442 587 $410,966 $234,165 $645,131

19
Angling in Beaverhead County
There are three fishing management drainages that overlap the geographical territory of Beaverhead
County. They are the Red Rock River drainage, the Beaverhead River drainage, and the Big Hole River
drainage. These are shown in the southwest corner of Figure 4 (drainage numbers 11, 13, and 14), and
will be the focal points of the angling expenditure estimates that follow.
Figure 4: Fishing Districts in Montana6
Table 16 and Table 17 below display the number of angler days in Beaverhead County by residency
status, and their ensuing expenditures. Table 16 breaks down angler days and expenditures for lake
fishing and Table 17 does the same for stream fishing. The number of angler days by residency were
multiplied by the lake and stream fishing expenditure estimates shown in Table 8 above to arrive at total
expenditures by anglers in Beaverhead County.
In a representative year, Beaverhead County provides almost 29,000 lake fishing days by Montana
residents and over 8,000 lake fishing days by nonresidents. The total expenditures by these lake fishers
in a given year add up to over $6 million spent in the county. Table 17 shows that stream fishing in
Beaverhead County accounts for a much greater degree of expenditures from outdoor recreation than
6 Source: Montana FWP, Montana Statewide Angling Pressure, 2019, Summary Report.

20
lake fishing. We can see that the county provides for almost 70,000 angler days for residents and the
same for nonresidents, totaling almost $56 million in stream fishing expenditures in a representative
year. This is notably more than all big game hunting expenditures combined.
Table 16: Lake Fishing Days and Expenditures by District
District
Resident
Days
Nonresident
Days
Resident
Expenditures ($)
Nonresident
Expenditures ($)
Total
Expenditures ($)
Red Rock 16,866 7,935 1,620,485 3,310,720 4,931,205
Beaverhead 1,571 0 150,941 0 150,941
Big Hole 10,423 493 1,001,441 205,694 1,207,136
TOTALS 28,860 8,428 $2,772,868 $3,516,414 $6,289,283
Table 17: Stream Fishing Days and Expenditures by District
District
Resident
Days
Nonresident
Days
Resident
Expenditures ($)
Nonresident
Expenditures ($)
Total
Expenditures ($)
Red Rock 1,703 6953 156,216 4,942,122 5,098,339
Beaverhead 12,222 15,516 1,121,124 11,028,617 12,149,741
Big Hole 56,072 47,096 5,143,484 33,475,365 38,618,850
TOTALS 69,997 69,565 $6,420824 $49,446,406 $55,866,931

21
THE ECONOMIC IMPACT OF OUTDOOR RECREATION IN BEAVERHEAD
COUNTY
Outdoor recreation is a vital aspect of the way of life in Montana. It is a primary reason that many
residents call Montana home, and it is a main driver of tourism and tourism dollars in the state.
Beaverhead County, while having a relatively small resident population, is situated in a part of the state
that provides ample outdoor recreational activities. In particular, it is very productive county for hunting
and angling. Its natural beauty and large fish and wildlife populations makes it an attractive destination
for hunters and anglers from Montana and around the world. In a given year, Beaverhead County is
home to over 380,000 combined hunter and angler days from residents and nonresidents. The presence
of this outdoor recreation in the economy can be expected to be felt widely.
The principal findings of this report, presented in the section, confirm that expectation. The results of
our analysis show that the presence of outdoor recreation in Beaverhead County produces a
significantly larger, more prosperous, and more populous economy that would occur in their absence.
Specifically, we find that an economy with the outdoor recreational activities taking place in Beaverhead
County ultimately produces an economy that has:
1,451 additional permanent, year-round jobs which are ultimately supported by the spending of
those engaged in outdoor recreation;
About $74 million each year in additional income received by Montana households, of which
more than $66 million is after-tax income, available for spending elsewhere in the economy;
An increase in the gross receipts of business and non-business organizations across the economy
of $167 million per year, and
More than 2,000 additional people, as workers and their families are attracted to and retaining
in Montana due to expanded economic opportunities.
Table 18: The Economic Impact of Outdoor Recreation in Beaverhead County: Summary
Category Units Impact
Total Employment................................................. Jobs 1,451
Personal Income.................................................... $ Millions 74.1
Disposable Personal Income................................ $ Millions 66.7
Output.................................................................. $ Millions 167.2
Population ............................................................ People 2,050
These impacts represent permanent, ongoing contributions to the state economy. They represent the
comparison between the actual economy, which includes outdoor recreation, with an artificially
constructed, “no outdoor recreation” scenario of the economy which removes outdoor recreation
employment and spending.

22
The outcomes summarized in Table 18 mask a wealth of detail that yields insights into how the activities
of outdoor recreation in Beaverhead County ultimately make the economy larger. We now turn to a
more complete examination of those impacts.
Employment Impacts
There are 1,451 jobs in Montana that ultimately owe their existence to the presence of outdoor
recreation in Beaverhead County. As can be seen from Table 19, most of the jobs in the larger total are
in industries with no direct connection to the outdoor recreation industry. They ultimately come about
because of the spending flows within the economy that are induced.
Table 19: Employment Impacts
Industry Impact
Construction............................................................. 83
Finance and Real Estate............................................ 84
Retail Trade.............................................................. 155
Transportation and Warehousing.............................. 47
Professional and Technical Services.......................... 53
Administrative and Waste Services........................... 44
Health Care and Social Assistance............................. 64
Utilities.................................................................... 5
Accommodation and Food Services........................... 509
Other Services, except Public Administration............ 42
Other Private............................................................ 222
Government............................................................. 141
TOTAL....................................................................... 1,451
Consider, for example, the more than 80 construction jobs created in the economy due to the
operations of outdoor recreation in Beaverhead County. Some of these jobs are linked to the outdoor
recreation business operations. But most come about because higher population and higher incomes
induce more building on residential, commercial and municipal projects.
The breadth of employment impacts across major industry categories is apparent from the Table.
Significant job impacts can be found in categories such as accommodation and food service, retail trade,
and government. This spread across sectors helps illustrate the propagation of spending across the
economy set in motion by the spending flows of the hunters and anglers in Beaverhead County.

23
Personal Income Impacts
The increase in income that Montana households receive because of the activities of outdoor recreation
in Beaverhead County reflects more than the higher employment those activities support. As Table 20
shows, almost every source of income is larger in an economy that contains outdoor recreation.
Table 20: Personal Income Impacts
Category Impact
Total Earnings by Place of Work 57.1
Total Wage and Salary Disbursements 41.3
Supplements to Wages and Salaries 11.8
Employer contributions for employee pension and insurance funds 7.4
Employer contributions for government social insurance 4.4
Proprietors' income with inventory valuation and capital consumption adjustments 4.0
Less:
Contributions for government social insurance 8.6
Employee and self-employed contributions for government social insurance 4.2
Employer contributions for government social insurance 4.4
Plus: Adjustment for residence (0.2)
Gross In 1.9
Gross Out 2.1
Equals: Net earnings by place of residence 48.3
Plus: Property Income 15.2
Dividends 5.5
Interest 6.8
Rent 2.9
Plus: Personal Current Transfer Receipts 10.7
Equals: Personal Income 74.1
Less: Personal Current Taxes 7.4
Equals: Disposable Personal Income 66.7
The bulk of the nearly $67 million in annual personal income that occurs because of the presence of
outdoor recreation in Beaverhead County is due to the more than $48 million increase in net earnings.
The latter represents income from employment. Clearly, in an economy with more jobs there is more
earnings, and the impacts shown in Table 20 reflect that.

24
But there are significant impacts on income that come from other sources. Two are shown in the table.
Transfer receipts are payments from government and businesses for which no service is performed.
These include social security payments, some retirement payments, and welfare programs such as the
Supplemental Nutritional Assistance Program (SNAP, formerly known as Food Stamps). Property income
includes dividends, interest, royalties and rent. Both of these sources of income are higher because of
outdoor recreation as well, simply because there is more wealth and more people in the economy.
Output Impacts
Economic output in this study is defined as gross receipts to businesses and non-business organizations,
with the exception of businesses in retail and wholesale trade, where markup is used instead. This
measure captures the “business” in terms of sales that companies and other organizations can expect to
see because of the presence of outdoor recreation in the economy. It is distinct from (and significantly
larger than) value added, which nets out costs from this top line revenue measure.
The impact of outdoor recreation on economic output in Beaverhead County is roughly $167 million
each year. Roughly 24 percent of this output ($39.6 million) comes from the accommodations and food
service industry, which makes sense given the amount of hunting and angling expenditures in this
industry.
Table 21: Output Impacts (millions of dollars)
Industry Impact
Construction................................................... 12.4
Telecommunications...................................... 0.2
Finance and Real Estate.................................. 19.1
Retail Trade.................................................... 17.3
Transportation and Warehousing.................... 9.9
Professional and Technical Services................ 7.6
Administrative and Waste Services................. 4.0
Health Care and Social Assistance................... 8.9
Utilities.......................................................... 1.5
Accommodation and Food Services................. 39.6
Other Services, except Public Administration. 3.3
Other Private.................................................. 27.2
Government................................................... 16.3
TOTAL............................................................. 167.2
Aside from the large output impacts associated with accommodation and food services, the output
impacts by industry show a spread of impacts across a wide range of industries. As was the case with
employment impacts, many of these industries have no direct connection to outdoor recreation
themselves. Examining these impacts gives a different perspective on how outdoor recreation in
Beaverhead County act to make the statewide economic pie bigger.

25
Population Impacts
An important mechanism at work in explaining the nature and the size of outdoor recreation’s economic
impacts is population migration. Simply put, workers ultimately respond to changes in economic
opportunities, even if those responses take time. When job and earnings opportunities improve, more
people are retained who might have otherwise left, in addition to people from other areas being
attracted. The result is an increase in population that brings its own economic effects.
Some portion of the impacts shown thus far are due to population changes. More people translate into
higher demand for goods and services, particularly government services. These contribute to the overall
impact of outdoor recreation.
These impacts are of special importance because of the prominence of rural areas in Beaverhead
County, where in some instances population decline has put pressure on basic services, including
hospitals and schools. The presence of outdoor recreation in the economy thus acts as a stabilizing
force.
The age structure of the population impacts due to outdoor recreation is also relevant. Migration is
dominated by working aged people and their families, including their present and future children. Thus,
the population impacts by age, as shown in Table 22, contain a sizable fraction of school-aged children.
This is a special significance for the viability of institutions including K-12 schools.
Table 22: Population Impacts
Age Cohort Impact
Ages 0-14......................................... 516
Ages 15-24....................................... 246
Ages 25-64....................................... 1,225
Ages 65+.......................................... 63
Total................................................ 2,050

26
CONCLUSION
The total contribution any sector of the economy makes to the whole can be assessed by assessing how
the economy would look in its absence. While this is an artificial exercise, it illustrates and quantifies the
connections in spending, income, production and employment that ultimately support economic activity
beyond the sector itself.
Beaverhead County’s outdoor recreational activities share close connections to the communities
adjacent to which they take place. Those connections make what those businesses do and where they
do it of special importance, and combine to create a substantial economic impact.
This section has presented the main findings of this study, addressing the basic research question posed
by this report. That is, what would the economy of Montana look like if the outdoor recreation from
hunting and angling taking place in Beaverhead County did not exist?
Our finding is that the activities of outdoor recreation in Beaverhead County makes the economy
significantly larger, more prosperous and more populous. The more than 1,400 jobs, the $74.1 million in
annual personal income, the $167.2 million in economic output every year, and the 2,050 additional
people in Montana that exist because of their operations is vivid testimony to the substantial economic
benefits their presence brings.

27
APPENDIX 1: POLICY ANALYSIS WITH THE REMI MODEL
Regional economic impacts occur because of events or activities that create new expenditures within a
region. “New spending” constitutes spending that is over and above existing expenditures, and which
does not displace other spending elsewhere in the region. It not only adds to economic activity in its
own right, but also induces further spending when the recipients of wages, sales, and tax revenues
spend portions of their income in the local economy. Changes in the paths of investment, migration,
prices, and wages are also possible.
This study utilized an economic model, calibrated to represent the interactions specific to the Montana
economy, to estimate the economic impacts resulting from outdoor recreation in Beaverhead County.
Leased from Regional Economic Models, Inc., the REMI model is one of the best known and most
respected analytical tools in the policy analysis arena, and has been used in more than 100 previous
studies as well as in dozens of peer-reviewed articles in scholarly journals. It is a state-of-the-art
econometric forecasting model that incorporates dynamic feedbacks between economic and
demographic variables. The REMI model forecasts employment, income, expenditures, and populations
for counties and regions based on a model containing over 100 stochastic and dynamic relationships, as
well as a number of identities. A full explanation of the design and operation of the model can be found
in Treyz (Treyz, 1993).
The REMI Modeling Methodology
The basic approach of using the REMI model to produce the results for this study is illustrated in Figure
5, below. The analysis started with a baseline projection for the Montana economy, using the status quo
assumption that outdoor recreation in Beaverhead County continues to operate at current levels. Next,
the analysis employed the REMI model a second time, simulating an alternative scenario where the
outdoor recreation in Beaverhead County and its associated economic activity are absent from the
Montana economy.
Figure 5. Policy Analysis Using the REMI Model

28
The difference between the baseline scenario and the simulated scenario constitutes the magnitude of
the impact of outdoor recreation in Beaverhead County on the state economy, and represents the gains
the state is experiencing due to its operation.
The differences in production, labor demand, and intermediate demand associated with the absence of
outdoor recreation in Beaverhead County impact these blocks, causing them to react to the changes and
adjust to a new equilibrium. This new equilibrium constitutes the alternative scenario referred to
above—the absence of outdoor recreation in Beaverhead County.
The REMI model utilizes historical data on production, prices, trade flows, migration, and technological
advances to calibrate the relationship between five basic blocks of the state economy: 1) Output and
Demand; 2) Labor and Capital Demand; 3) Population and Labor Supply; 4) Compensation, Prices and
Costs; and 5) Market Shares. These linkages are shown in Figure 6, below.
Figure 6: Schematic Model of REMI Linkages

29
The underlying philosophy of the REMI model is that regions throughout the country compete for
investments, jobs, and people. When events occur in one region, they set off a chain reaction of events
across the country that causes dollars to flow toward better investment and production opportunities,
followed over time by workers and households toward better employment opportunities and higher
wages. The REMI model consists of an 82-sector input/output matrix that models the technological
inter-dependence of production sectors of the economy, as well as extensive trade and capital flow
data. Together, these components enable the estimates of the shares of each sector’s demand that can
be met by local production. Simplified illustrations of the schematic model in Figure 6 are provided on
the following pages, in Figures 7 through 11.
Figure 7. Output Linkages

30
Figure 8. Labor and Capital Demand Linkages
Figure 9. Demographic Linkages

31
Figure 10. Wages, Prices and Production Costs Linkages
Figure 11. Market Share Linkages
As powerful and flexible as this tool is, the output it provides is only as good as the inputs provided. The
majority of the work for this study was to carefully craft the inputs used to construct a scenario for the
economy that faithfully represents all of the events, income flows, and the direct and indirect impacts
that would not occur in the absence of outdoor recreation in Beaverhead County.