The Economic Feasibility of Using Georgia Biomass for Electrical ...
45
The University of Georgia Center for Agribusiness and Economic Development College of Agricultural and Environmental Sciences The Economic Feasibility of Using Georgia Biomass for Electrical Energy Production Prepared by: George A. Shumaker, Audrey Luke-Morgan, Tommie Shepherd and John C. McKissick Center Report: CR-07-16 March, 2007
Transcript of The Economic Feasibility of Using Georgia Biomass for Electrical ...
The University of Georgia
Center for Agribusiness and Economic Development
College of Agricultural and Environmental Sciences
The Economic Feasibility of Using Georgia Biomass for Electrical Energy Production
Prepared by: George A. Shumaker, Audrey Luke-Morgan, Tommie Shepherd and John C. McKissick
Center Report: CR-07-16
March, 2007
- 1 -
The Economic Feasibility of Using Georgia Biomass for Energy Production
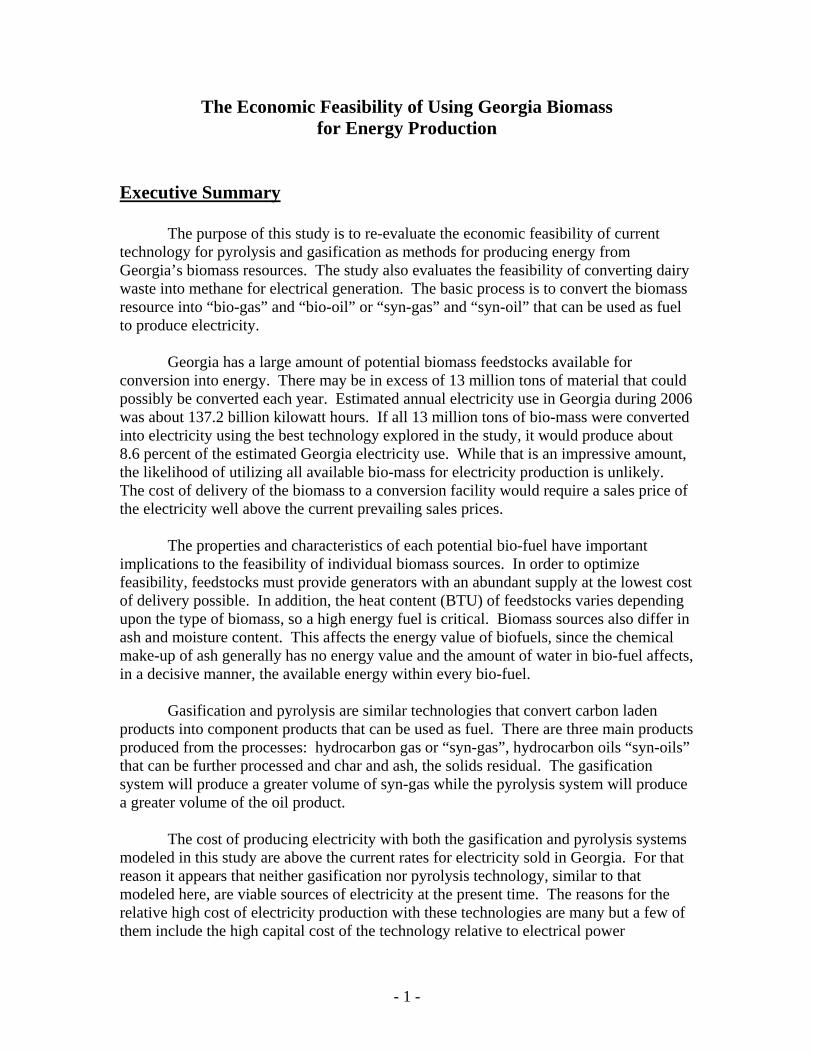
Executive Summary
The purpose of this study is to re-evaluate the economic feasibility of current technology for pyrolysis and gasification as methods for producing energy from Georgia’s biomass resources. The study also evaluates the feasibility of converting dairy waste into methane for electrical generation. The basic process is to convert the biomass resource into “bio-gas” and “bio-oil” or “syn-gas” and “syn-oil” that can be used as fuel to produce electricity.
Georgia has a large amount of potential biomass feedstocks available for
conversion into energy. There may be in excess of 13 million tons of material that could possibly be converted each year. Estimated annual electricity use in Georgia during 2006 was about 137.2 billion kilowatt hours. If all 13 million tons of bio-mass were converted into electricity using the best technology explored in the study, it would produce about 8.6 percent of the estimated Georgia electricity use. While that is an impressive amount, the likelihood of utilizing all available bio-mass for electricity production is unlikely. The cost of delivery of the biomass to a conversion facility would require a sales price of the electricity well above the current prevailing sales prices.
The properties and characteristics of each potential bio-fuel have important
implications to the feasibility of individual biomass sources. In order to optimize feasibility, feedstocks must provide generators with an abundant supply at the lowest cost of delivery possible. In addition, the heat content (BTU) of feedstocks varies depending upon the type of biomass, so a high energy fuel is critical. Biomass sources also differ in ash and moisture content. This affects the energy value of biofuels, since the chemical make-up of ash generally has no energy value and the amount of water in bio-fuel affects, in a decisive manner, the available energy within every bio-fuel.
Gasification and pyrolysis are similar technologies that convert carbon laden products into component products that can be used as fuel. There are three main products produced from the processes: hydrocarbon gas or “syn-gas”, hydrocarbon oils “syn-oils” that can be further processed and char and ash, the solids residual. The gasification system will produce a greater volume of syn-gas while the pyrolysis system will produce a greater volume of the oil product.
The cost of producing electricity with both the gasification and pyrolysis systems
modeled in this study are above the current rates for electricity sold in Georgia. For that reason it appears that neither gasification nor pyrolysis technology, similar to that modeled here, are viable sources of electricity at the present time. The reasons for the relative high cost of electricity production with these technologies are many but a few of them include the high capital cost of the technology relative to electrical power
- 2 -
generated. The high capital cost raises the fixed costs of operation and places a large financial burden of the venture. It is possible that larger scale operations or different technologies than those modeled in this study can drive unit costs of production down enough to be competitive.
The basic findings are that while it is technologically feasible to accomplish the
task, it is not economically feasible to convert biomass into electricity in Georgia at the present time. The exception is that large dairies or smaller dairies that pool their manure may be able to produce electricity at competitive rates.
The Economic Feasibility of Using Georgia Biomass
for Energy Production
Introduction In 2003, the Center for Agribusiness and Economic Development (CAED) completed a study of the feasibility of generating electricity from biomass fuel sources in Georgia. The study results indicated that it was not economically feasible to produce electricity with the technologies available at that time without significant subsidies. Since 2003, the overall cost of energy has risen and improvements in the technologies of biomass conversion have improved. The gasification technology modeled in the 2003 study was based upon a plant under construction in New Hampshire. That plant operated for some time and was capable of completing the conversion process. However, modifications to the technique were required. The end result was that output was not as great as predicted. The technology modeled in the current study is based upon the most recent types of methods under adoption within the industry. The purpose of this study is to re-evaluate the economic feasibility of current technology for pyrolysis and gasification as methods for producing energy from Georgia’s biomass resources. The basic process is to convert the biomass resource into “bio-gas” and “bio-oil” or “syn-gas” and “syn-oil” that can be used as fuel to produce electricity. Methodology The CAED contracted with Frazier, Barnes and Associates of Memphis, TN to provide research into the technologies of pyrolysis and gasification as methods for producing electricity. Their report forms the base upon which the feasibility of the two technologies is built. Other technical information was provided by faculty in the Department of Agricultural Engineering Outreach and industry sources. The CAED amassed data concerning the sources and costs of providing biomass for the process and evaluated the economics costs involved in the processes. BioMass Feedstock Issues Georgia has a large amount of potential biomass feedstocks available for conversion into energy. There may be in excess of 13 million tons of material that could
- 3 -
possibly be converted each year. Different potential feedstocks will have vastly different delivered costs per ton due to both the current market price of the product and its relative cost of transportation per unit. In addition, some of the potential feedstocks are only available on a seasonal basis. Since generation of electricity in a minute-to-minute operation, assurance of a continuous supply of feedstocks is of utmost importance. Other factors to consider when evaluating potential feedstocks are things such as the moisture content and ash content. High moisture content implies high drying costs that can add to the total cost of electricity production, perhaps making a given feedstock not economically viable. The other major factor concerns the ash content of the feedstock. High ash content feedstocks require added boiler design considerations that raise capital costs. Ash disposal costs are also a consideration. The quantity, location, price, transportation cost, and heat content of Georgia’s current available supply of biomass was updated and determined utilizing prior feasibility analysis and secondary production data sources, such as the 2005 Georgia Farm Gate Value Report, which lists the total amount of agricultural and forest products produced each year. To determine the amount of residuals left after harvest, various experts in the field were consulted. The field experts provided estimates from the residual quantity to production information. Market prices were used for any marketable biomass feedstock. Cost of producing selected biomass feedstocks were calculated where market prices did not exist.
The total amount of agricultural by-products was evaluated based on the annual production of total yield mass and the percent of residues left over after harvest for each potential source. Quantities for closed-loop sources, those which are grown specifically for power generation, were determined by multiplying the annual yield per acre by the total acres in production. The following section describes Georgia’s biomass feedstock in greater detail. Alternative Crops—Kenaf and Switchgrass were identified as alternative possibilities for increasing farm income and biomass. Neither crop has been planted in large acreage in Georgia. Research indicates each crop yields around 6 to 10 tons per acre.
Applying inflation factors to the budgeted costs derived in 2003 results in a total cost per ton of $57.50 to $72.50 for kenaf. The average cost of $65 per ton is utilized in this study for kenaf. Budgeted costs and expected yields for areas throughout the southeastern US were considered for switchgrass. Switchgrass estimated cost range from $70 to $90 per ton, with the average of $80 per ton utilized for analysis in this study.
Since neither crop currently has significant acreage in Georgia acreage projections were considered. It was estimated that 13,000 acres of kenaf and 1,000 acres of switchgrass may be planted in the near future to meet potential market demands. The expected yields were assumed to be 6.98 tons per acre for kenaf and 6 tons per acre for switchgrass. Thus, the total tons of biomass are estimated to be 90,750 from kenaf and 6,000 from switchgrass.
- 4 -
Traditional Row and Forage Crops - Southern agriculture is very diverse. Production of various row and forage crops is common in Georgia. Many of these crops have residues that could provide a source of biomass for the state. In this section various crops that are considered “traditional” row crops and forage crops are analyzed. Production data from the 2005 Farmgate Value Report and expert opinions are used as the basis for tonnage estimates. Corn Stalks—After grain is harvested, corn stalks remain in the field—a little bent and broken but still a good source for biomass. It is estimated that 1,200 pounds of stalk per acre remain after grain is harvested. The estimated production of corn stalks in Georgia based on 2005 Farmgate data is 164,570 tons. Cost associated with corn stalks would be that necessary to remove the stalks and get them into a readily transportable form. It is assumed that a hay rake (windrower) and hay baler will be used to accomplish this. Utilizing a machine cost calculator to estimate the total cost for these operations, the estimated cost is $36 to $60 per ton. Given current grain prices, the total tons of biomass available from corn stalks could significantly increase. Cotton Stalks—Many cotton producers cut and till cotton stalks back into the field. These stalks are a potential biomass product. To estimate cotton stalk production the total 2005 Farmgate acreage was multiplied by the estimated pounds of stalk available per acre. Based on prior research, it was assumed that irrigated cotton stalks yield 4,900 lbs per acre and non-irrigated yield 4,200 pounds per acre. It was estimated that 35% of Georgia’s cotton acreage is irrigated. Therefore, a weighted average 4,445 pounds of stalks per acre was used. The total estimated cottons stalks produced are 2.72 million tons. The cost to harvest cotton stalks using a forage harvester and nutrient replacement ranges from $35 to $55 per ton depending on the machinery used and irrigated versus non. Gin Trash—Gin trash is another potential biomass source produced in Georgia. Based on conversations with local ginners and researchers at the University of Georgia, it is estimated that every bale of cotton ginned produces 185 pounds of gin trash. Assuming and average weight of 500 pounds per bale and that all cotton bales produced in the state are ginned in the state, the total estimated gin trash produced is 205,226 tons. Calculating the economic cost requires further assumptions be made. Most gins give the gin trash away if someone will come and get it. Gin trash is a light material and to be handled efficiently, it was assumed the gin trash would be placed in a module. The cost of packing the gin trash into a module is estimated to be $0.005 to $0.007 per pound or $10 to $14 per ton. One of the most common uses of gin trash is as supplemental cattle feed. Peanut Hay—It is estimated that each acre of peanuts produces between 3 and 4 bales of peanut hay weighing 1,200 pounds per bale. Using the total acreage, as reported in the 2005 Farmgate Report, it is estimated that Georgia produces 1.6 million tons of peanut hay. Baling the hay is a relatively inexpensive venture and a market exists for the hay. Current market prices range from $20 to $30 per bale or $33 to $50 per ton. The market price covers the harvest and baling cost of the hay and provides a small return to the
- 5 -
producer. Caution must be used in the sale and transfer of peanut hay. According to label recommendations, certain pesticides used in peanuts do not allow for the use of hay as a feedstock for livestock. There is also a concern with Alfa toxins associated with peanuts, especially in non-irrigated production. Peanut Hulls—The total tons of peanut hulls available was estimated by taking 25% of the total production. Hulls comprise approximately 25% of the weight of peanuts. Using the 2005 Farmgate production data, the estimated tons of peanut hulls is 289,000. Shellers pointed out three major uses of peanut hulls including cattle feed, “filler or floor-liner” in poultry houses, and chemical carriers. Depending on the intended use and market, the hulls may be used directly after shelling or ground through a hammer mill. Given their low density, peanut hulls may also be pelletized for more efficient transport. Prices ranged from $15 per ton for bulk loads to $65 per ton for pelletized peanut hulls. The average cost per ton of $40 per ton was utilized in this study. Pecan Hulls—To estimate the tons of pecan hulls available, the total production was multiplied by the typical shelling rate (33%) and the average percentage of hulls (51%). The total estimated tons available based on 2005 Farmgate data is 7,976. Shellers contacted stated that they usually allow hulls to be loaded from their operation free of charge. The best way to load pecan hulls would be mechanically. The rental price for a front-end loader is about $300 per day. It is estimated that 4 to 5 tons per hour can be handled by one person. Assuming an 8 hour day and a labor cost of $10 per hour, the total cost per hour would be about $47.50 or $10.55 per ton. Excess Hay—In certain years hay production in Georgia is in excess of consumption. Given recent droughts, strong cattle prices, and growing equine industry in the state, hay may not be a consistent form of biomass. However, years with timely rainfalls may produce excess quantities of forage. Often farmers are willing to dispose of excess hay. A cost per ton of $40 to $60 was assumed. It was assumed that 25% of the hay produced was in excess of the demand. Based on 2005 Farmgate data, the estimated tons of hay available would be 674,811. This figure will change more frequently due to overall changes in demand and variations in weather conditions and its impact on supply. Wheat and Rye Straw—Each of these commodities produces between 110 to 120 square bales per acre weighing around 30 pounds per bale. Straw has a relatively strong market in the landscape sector with market prices between $2.00 to $2.50 per bale. Using the 2005 Farmgate production data, if the straw from every acre of wheat and rye was baled, Georgia would produce 366,834 tons of wheat straw and 139,993 tons of rye straw. The cost per ton of straw would be from $133 to $167. The average, $150 per ton, was utilized in this study. Poultry Products Poultry Litter—The poultry and egg industry is Georgia’s most valuable agricultural sector and leads the nation in poultry production. Thus, a significant amount of poultry litter is produced in Georgia. To arrive at the total tons of poultry litter produced in the state the number of head for breeder pullets, broilers, and layers was used in respect to

- 6 -
their annual pounds of litter produced per head—8 pounds for breeder pullets, 44 pounds for hatching egg layers, 40 pounds for table egg layers, and 0.50 pounds per pound of bird produced for broilers. Using the 2005 Farmgate production data the total tons of poultry litter available was estimated at 2.65 million tons.
Farmers use poultry litter as fertilizer but experience criticism in urban areas and encounter issues with compliance of the Environmental Protection Agency regulations. Overuse of poultry litter raises the phosphorus level in soil to unacceptable amounts. Spreading of poultry litter will continue to be popular in areas of high crop production because the crops reduce the phosphorus. It is also seen as a less expensive source of nutrients given the rising cost of traditional fertilizer. In Northeast Georgia limited acreage of crops exist and alternatives to spreading the litter are continuously being researched. The average cost per ton of litter was estimated to be $12 to $25 based on market conditions for litter as fertilizer. Forest Related Products - Current information for forest related products was derived from communications and data supplied by the Georgia Forestry Commission. Analysis utilized the estimated annual harvest acreage for timber products in Georgia. The three primary sources of forest residue to be considered in this study are bark, wood chips, and wood (harvesting) residues.
For consistency, tonnage available was calculated utilizing similar assumptions as prior analysis. However, it is important to point out that given recent emphasis on renewable fuel sources and interest in biomass forest resources, the Georgia Forestry Commission has extensive research considering forest biomass sources in much greater detail than will be covered in this report.
Analysis in this report will base availability on the estimated annual harvested acreage in Georgia. The Georgia Forestry Commission estimates this acreage to be about 500,000 acres. The total forestland in the state is estimated to be 24.2 million acres with roughly 11 million being softwood (pine) forests. Bark—Foresters estimate that 322 cubic feet of bark is produced per acre. An estimated weight per cubic foot is 20 pounds. Foresters at the Warnell School of Forestry and timber companies indicated that 85% of the bark produced in the state is retained for fuel by the timber companies. Using the total number of harvested acres multiplied by the total bark per acre and 15% for the portion not utilized within the timber companies, results in 241,500 tons of available bark. Two main outlets exist for bark—power and landscaping. Many lumber and pulp mills use the bark to heat and fuel the machinery. Higher quality bark is sold to the landscaping industry. Bark prices range from $16 to $20 per ton depending on the quality and size of the final material. This is a market price where landscapers and large firms can purchase the bark form the timber companies.

- 7 -
Wood Chips—Based on assumptions defined in prior analysis, potential biomass from wood chips was estimated. Research (Koch, 1976) suggests that 1.5 tons of wood chip residuals are produced per thousand board feet (mbf) of timber products produced. Considering the estimated annual harvested acreage of 500,000 acres, the average harvest in Georgia is 4,196.2 mbf. The total wood chips available would be 6,294.3 tons. Wood chip prices range from $18 to $22 per ton with uses ranging from a base in poultry houses to industrial applications for particle board. Wood (Harvesting) Residue—Wood residues are the remains (branches, bark, and needles) from harvested acreage. It is estimated that 15% of the tree remains after harvest. The average yield per acre is 2,254 cubic feet. Thus, approximately 338 cubic feet per acre of harvest residue is left for every harvested acre. A cubic foot of residue is estimated to weigh 49.9 pounds. Considering these estimates and the state average of harvested acreage, 500,000 acres, approximately 4.2 million tons of wood residues are created annually.
One problem with efficient utilization of harvesting residue is transportation. Stacking branches on the bed of a trailer and/or truck is not efficient. The branches need to be processed through a wood chipper for the most efficient means of transportation of the waste material. This adds cost to an almost free product. The estimated operating and ownership cost for an industrial chipper was estimated by Morbark, Inc. The total estimated cost for owning and operating the chipper is $130 to $150 per hour with a throughput of 50 tons per hour. Throughput will vary considering the volume of and distance between residue piles.
Another cost to be considered is nutrient replacement. Foresters estimate that 85% of the nitrogen in the soil comes from the remains left after harvest. To replace this amount of nitrogen would cost about $115 per acre with the current price of fertilizer. Considering the cost for chipping and the opportunity for fertilizer, the total cost per ton of wood residue is $18 to $23. Pine Straw—Using the total acreage of all pines in the state and a yield factor of 25 bales per acre at 20 pounds per bale results in 2.75 million tons of pine straw. Prices for pine straw range from $250 to $300 per ton. Most trading of pine straw occurs as bales with prices ranging from $2.50 to $3.00. These are the average wholesale sales price in the landscaping industry. Given the relatively high cost per ton, pine straw does not seem to be a feasible source of biomass. Biomass Wood Resource Assessment on a County-by-County Basis for the State of GA - Recent reports prepared for the Georgia Forestry Commission estimate total harvesting residues at 5.314 million dry tons with only 5% currently utilized. Thus, approximately 5.05 million dry tons of harvesting residues are estimated to be available for use in Georgia. Mill residues, which would include bark and wood chips, are estimated between 6.99 and 7.97 million dry tons. However, it is estimated that only 1% of those residues are currently not utilized, resulting in only 69,930 to 79,703 dry tons available. The county-by-county biomass wood resource assessment completed by
- 8 -
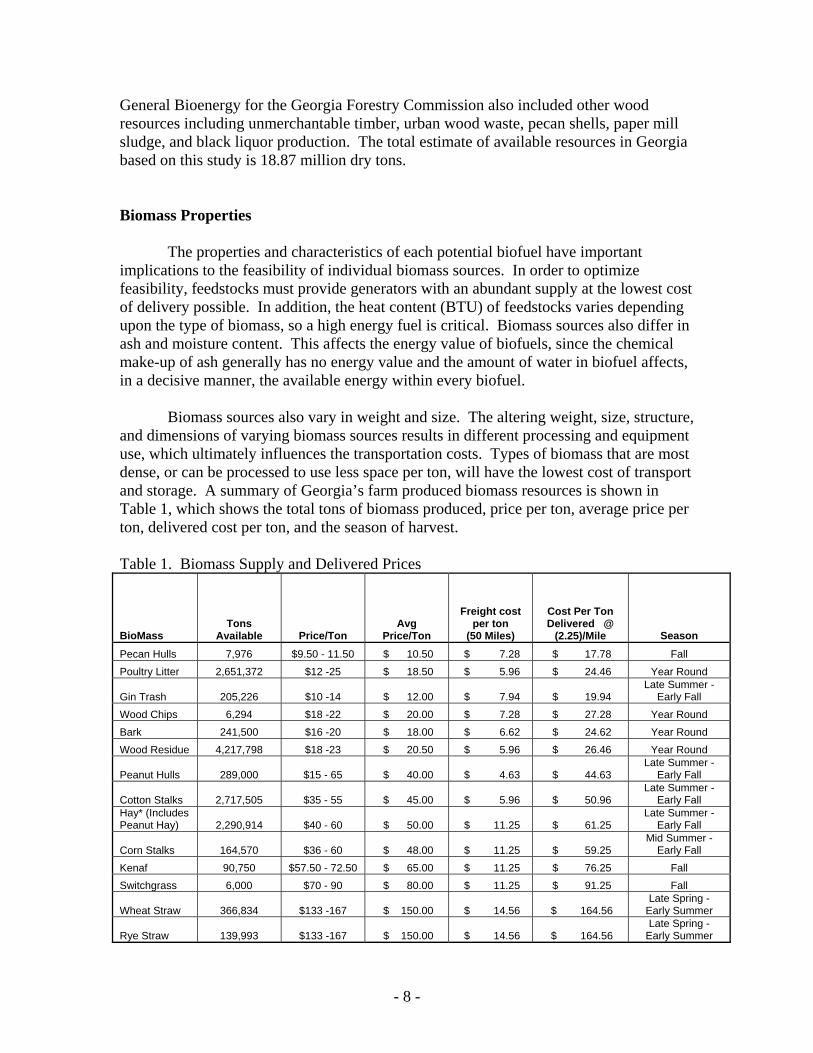
General Bioenergy for the Georgia Forestry Commission also included other wood resources including unmerchantable timber, urban wood waste, pecan shells, paper mill sludge, and black liquor production. The total estimate of available resources in Georgia based on this study is 18.87 million dry tons. Biomass Properties
The properties and characteristics of each potential biofuel have important
implications to the feasibility of individual biomass sources. In order to optimize feasibility, feedstocks must provide generators with an abundant supply at the lowest cost of delivery possible. In addition, the heat content (BTU) of feedstocks varies depending upon the type of biomass, so a high energy fuel is critical. Biomass sources also differ in ash and moisture content. This affects the energy value of biofuels, since the chemical make-up of ash generally has no energy value and the amount of water in biofuel affects, in a decisive manner, the available energy within every biofuel.
Biomass sources also vary in weight and size. The altering weight, size, structure, and dimensions of varying biomass sources results in different processing and equipment use, which ultimately influences the transportation costs. Types of biomass that are most dense, or can be processed to use less space per ton, will have the lowest cost of transport and storage. A summary of Georgia’s farm produced biomass resources is shown in Table 1, which shows the total tons of biomass produced, price per ton, average price per ton, delivered cost per ton, and the season of harvest. Table 1. Biomass Supply and Delivered Prices
BioMass Tons
Available Price/Ton Avg
Price/Ton
Freight cost per ton
(50 Miles)
Cost Per Ton Delivered @
(2.25)/Mile Season Pecan Hulls 7,976 $9.50 - 11.50 $ 10.50 $ 7.28 $ 17.78 Fall Poultry Litter 2,651,372 $12 -25 $ 18.50 $ 5.96 $ 24.46 Year Round
Gin Trash 205,226 $10 -14 $ 12.00 $ 7.94 $ 19.94 Late Summer -
Early Fall
Wood Chips 6,294 $18 -22 $ 20.00 $ 7.28 $ 27.28 Year Round Bark 241,500 $16 -20 $ 18.00 $ 6.62 $ 24.62 Year Round Wood Residue 4,217,798 $18 -23 $ 20.50 $ 5.96 $ 26.46 Year Round
Peanut Hulls 289,000 $15 - 65 $ 40.00 $ 4.63 $ 44.63 Late Summer -
Early Fall
Cotton Stalks 2,717,505 $35 - 55 $ 45.00 $ 5.96 $ 50.96 Late Summer -
Early Fall Hay* (Includes Peanut Hay) 2,290,914 $40 - 60 $ 50.00 $ 11.25 $ 61.25
Late Summer - Early Fall
Corn Stalks 164,570 $36 - 60 $ 48.00 $ 11.25 $ 59.25 Mid Summer -
Early Fall
Kenaf 90,750 $57.50 - 72.50 $ 65.00 $ 11.25 $ 76.25 Fall Switchgrass 6,000 $70 - 90 $ 80.00 $ 11.25 $ 91.25 Fall
Wheat Straw 366,834 $133 -167 $ 150.00 $ 14.56 $ 164.56 Late Spring -
Early Summer
Rye Straw 139,993 $133 -167 $ 150.00 $ 14.56 $ 164.56 Late Spring -
Early Summer

- 9 -
Table 2 shows a summary of historical energy data for Georgia from the Energy
Information Administration. The delivered fuel cost and quantity for electricity generation for coal, petroleum and natural gas for 1999 through September 2006 is shown.
Table 3 shows the biomass feedstock quality and delivered cost for some common agricultural biomass sources in Georgia. Research suggests that the fuels with the least delivered cost per million BTU (mmBTU) will be the most likely fuel sources for a biomass power generation facility.
The conversion facilities considered in this update has the capability to utilize a
variety of feedstocks. The practicality of any particular feedstock is limited by season of the year, quality, delivered cost and handling and storage issues. Modeling the outcomes of each individual feedstock in each technology would create a huge task with little added benefit. Therefore, some basic assumptions concerning feedstocks were made;
1. The biomass could be a combination of various types but that it is assumed the
ash content would be 8 percent or less, moisture content on delivery is not greater than 25 percent and the average BTU content would be 13 million BTU per ton. Existing biomass conversion facilities generally use some blend or combination of feedstocks and the above quality measures are consistent with current industry standards.
2. The receiving and handling system must be capable of handling the delivered
biomass and must be capable of blending to provide a uniform heat content feedstock. A five day supply is assumed and assists in assuring a blend to provide uniformity.
3. The plant is assumed to operate for 350 days per year, 24 hours per day. 15
days of down time for maintenance is assumed.

10
Table 2. Delivered Fuel Costs and BTU Yield for Coal, Petroleum and Natural Gas Fuel 2006 2005 2004 2003 2002 2001 2000 1999 Coal (dollars per million Btu) $2.39 $2.14 $1.79 $1.72 $1.68 $1.66 $1.54 $1.55 Average heat value (Btu per Pound) 9,994 9,994 9,990 10,041 10,119 10,169 10,256 10,245 Petroleum (dollars per million Btu) $12.05 $9.48 $7.60 $6.37 $5.10 $5.95 $5.89 $3.48 Average heat value (Btu per gallon) 147,357 147,357 147,429 147,190 146,976 147,595 147,357 147,738 Natural Gas (dollars per million Btu) $7.14 $9.77 $6.38 $5.73 $3.65 $3.28 $4.18 $2.49
Average heat value (Btu per cubic foot)
1,028
1,028
1,027
1,025
1,020
1,026
1,021
1,022

11
Table 3. Characteristics of Potential Georgia Biomass Feedstocks and Delivered Costs
Biomass
Ash Content
Dry Basis mmBTU/Ton
Price/Ton (low)
Price/Ton (high)
Average Price/Ton
Calculated Average
$/mmBTU Conversion
Factor
Freight Cost per
Ton Mile
50 Mile Frt/Ton
50 Mile Frt/mm BTU
Delivered F/S
$/mmBTU Pecan Hulls 5.80% 16.35 $9.50 $11.50 $10.50 $0.64 129.4 $0.15 $7.28 $0.45 $1.09 Gin Trash 17.60% 13.10 $10.00 $14.00 $12.00 $0.92 141.2 $0.16 $7.94 $0.61 $1.52 Bark, Pine 3.30% 14.08 $16.00 $20.00 $18.00 $1.28 117.6 $0.13 $6.62 $0.47 $1.75 Coal (2006 US$) NA NA NA NA NA NA NA NA NA NA $2.39 Poultry Litter 26.68% 8.89 $12.00 $25.00 $18.50 $2.08 105.9 $0.12 $5.96 $0.67 $2.75 Peanut Hulls 5.90% 16.03 $15.00 $65.00 $40.00 $2.50 82.4 $0.09 $4.63 $0.29 $2.78 Wood Residue 3.20% 8.86 $18.00 $23.00 $20.50 $2.31 105.9 $0.12 $5.96 $0.67 $2.99 Wood Chips 1.30% 9.09 $18.00 $22.00 $20.00 $2.20 129.4 $0.15 $7.28 $0.80 $3.00 Corn Stalks 6.40% 14.62 $36.00 $60.00 $48.00 $3.28 200.0 $0.23 $11.25 $0.77 $4.05 Cotton Stalks 17.20% 12.37 $35.00 $55.00 $45.00 $3.64 105.9 $0.12 $5.96 $0.48 $4.12 Hay 5.70% 14.00 $40.00 $60.00 $50.00 $3.57 200.0 $0.23 $11.25 $0.80 $4.38 Kenaf 3.60% 14.78 $57.50 $72.50 $65.00 $4.40 200.0 $0.23 $11.25 $0.76 $5.16 Switchgrass 5.40% 14.01 $70.00 $90.00 $80.00 $5.71 200.0 $0.23 $11.25 $0.80 $6.51 Natural Gas (2006 US$) NA NA NA NA NA NA NA NA NA NA $7.14 Wheat Straw 3.50% 14.57 $133.33 $166.67 $150.00 $10.30 258.8 $0.29 $14.56 $1.00 $11.29 Petroleum (2006 US$) NA NA NA NA NA NA NA NA NA NA $12.05 Rye Straw 3.00% 12.70 $133.33 $166.67 $150.00 $11.81 258.8 $0.29 $14.56 $1.15 $12.96
12
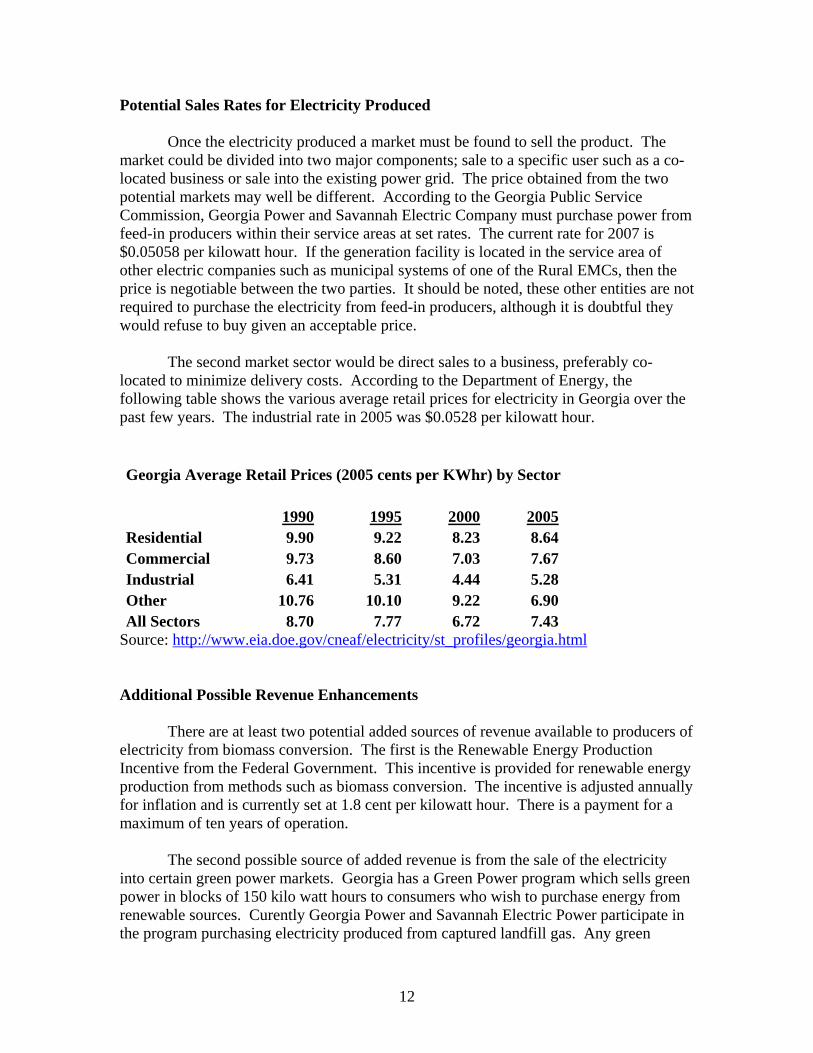
Potential Sales Rates for Electricity Produced Once the electricity produced a market must be found to sell the product. The market could be divided into two major components; sale to a specific user such as a co-located business or sale into the existing power grid. The price obtained from the two potential markets may well be different. According to the Georgia Public Service Commission, Georgia Power and Savannah Electric Company must purchase power from feed-in producers within their service areas at set rates. The current rate for 2007 is $0.05058 per kilowatt hour. If the generation facility is located in the service area of other electric companies such as municipal systems of one of the Rural EMCs, then the price is negotiable between the two parties. It should be noted, these other entities are not required to purchase the electricity from feed-in producers, although it is doubtful they would refuse to buy given an acceptable price. The second market sector would be direct sales to a business, preferably co-located to minimize delivery costs. According to the Department of Energy, the following table shows the various average retail prices for electricity in Georgia over the past few years. The industrial rate in 2005 was $0.0528 per kilowatt hour. Georgia Average Retail Prices (2005 cents per KWhr) by Sector 1990 1995 2000 2005 Residential 9.90 9.22 8.23 8.64 Commercial 9.73 8.60 7.03 7.67 Industrial 6.41 5.31 4.44 5.28 Other 10.76 10.10 9.22 6.90 All Sectors 8.70 7.77 6.72 7.43
Source: http://www.eia.doe.gov/cneaf/electricity/st_profiles/georgia.html Additional Possible Revenue Enhancements There are at least two potential added sources of revenue available to producers of electricity from biomass conversion. The first is the Renewable Energy Production Incentive from the Federal Government. This incentive is provided for renewable energy production from methods such as biomass conversion. The incentive is adjusted annually for inflation and is currently set at 1.8 cent per kilowatt hour. There is a payment for a maximum of ten years of operation. The second possible source of added revenue is from the sale of the electricity into certain green power markets. Georgia has a Green Power program which sells green power in blocks of 150 kilo watt hours to consumers who wish to purchase energy from renewable sources. Curently Georgia Power and Savannah Electric Power participate in the program purchasing electricity produced from captured landfill gas. Any green

13
power could potentially take advantage of this green power market in Georgia. The Green Power rate premium is currently set at 4.5 cents per kilowatt hour but individual Electric Membership Cooperatives are allowed to negotiate rates. The recent range of rates are from a low of 2 to a high of 4.5 cents per kilowatt hour. That means that purchasers must pay that amount in addition to the going market rate for the green power. It is assumed that the green power producer would capture one-half of the green power premium (2.75 cents per kilowatt hour) charged to the consumer since they must market the power through existing distribution lines. The remainder of the premium would go to the distributor. Thus it is assumed that added revenues of 1.8 cents per kilowatt hour from the Renewable Energy Program and 2.75 cents per kilowatt hour from the Green Power Program are obtainable for a total of 4.55 cents per kilowatt hour are obtainable. Feasibility Benchmark
The bench mark for feasibility that will be used in evaluating electrical power generation using biomass feedstocks is the ability to produce electricity at a total cost less than the combined sales rate plus any added revenues from other sources such as production incentives or sales premiums. It is assumed that the sales price will be the avoided cost rate of 5.058 cents per kilowatt hour set by the Public Service Commission and that added revenues 1.8 cents from the Renewable Energy Program and 2.75 cents from the Green Power Program for a total of 9.61 cents per kilowatt hour. A method would be considered feasible if total production costs are less than 9.61 cents per kilowatt hour of electricity produced. Capital Cost Assistance There are both Federal and State programs potentially available that provide grants and guaranteed loan assistance to firms seeking to enter into the electricity from biomass industry. This study will not seek to detail these programs but does note that firms that are successful in obtaining government assistance may be able to reduce operating costs by reducing total capital outlay. As will be pointed out later in the study, these technologies are capital intensive and the fixed cost of debt service and capital re-capture (depreciation) place a heavy burden on the firm.
Gasification and Pyrolysis Technology Gasification and pyrolysis are similar technologies that convert carbon laden products into component products that can be used as fuel. There are three main products produced from the processes: hydrocarbon gas or “syn-gas”, hydrocarbon oils “syn-oils” that can be further processed and char and ash, the solids residual. The gasification system will produce a greater volume of syn-gas while the pyrolysis system will produce a greater volume of the oil product.

14
The processes for biomass conversion are built upon the basic technology used for years to convert coal into liquid fuels. The Germans refined the technology early in the 1900s and used it extensively during World War II to provide diesel fuels to power their war efforts. South Africa also adopted the technology during the 1980s to derive fuels from their coal resources when they were subjected to economic sanctions to force them to stop the apartheid policies.
These processes involve the chemical conversion of the biomass in a heated atmosphere of pressurized steam or air. The gasification process is conducted in an atmosphere of limited oxygen while in pyrolysis, oxygen is excluded to avoid any combustion. The processes drive the volatile compounds from the biomass to produce a low-to-medium calorific gas termed “syn-gas” or “bio-gas”. The syn-gas can be combusted immediately to produce power or it can be condensed, cooled, filtered and cleaned for use in combustion engines, gas turbines and fuel cells. The syn-gas contains 70-80 percent of the energy originally present in the feedstock. Syn-oil is the cooled and condensed form of the volatiles from the feedstock. It is a stable transportable oil that has about one-half the heat content of conventional fuel oil. The syn-gas and syn-oil can be refined and used as a fuel to power a generator to produce electricity. The power plant could be a syn-gas or oil powered turbine and a steam powered turbine driven by waste heat that is converted into steam. Since the refining process is costly, a more practical approach is to fire the syn-fuels directly in a boiler and generate steam that can then be used to generate electricity. The following schematic illustrates the basic process of converting biomass into electricity.
To Power Grid
Feedstock Process Products
Biomass Feedstocks
1. Gasification
2. Pyrolysis
Electrical Power
Generation
Saleable “Green” Power
Internal
Power Use
Conversion Technologies
Source: Frazier, Barnes and Associates, Memphis, TN
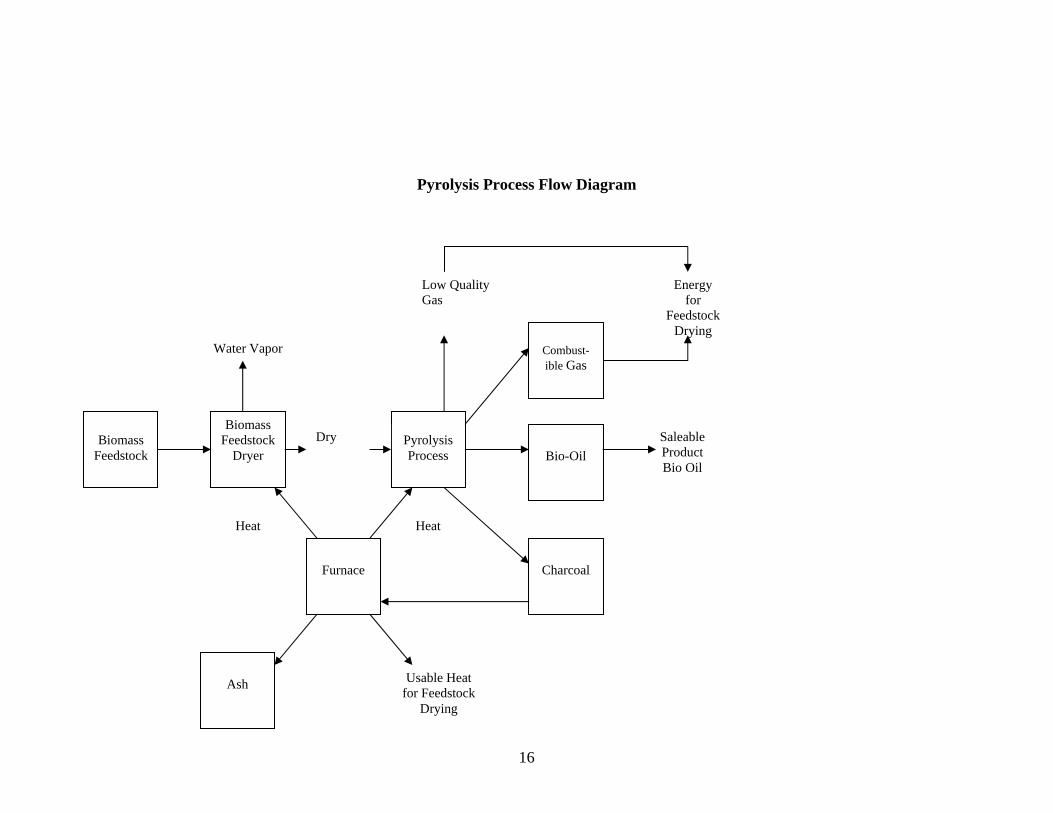
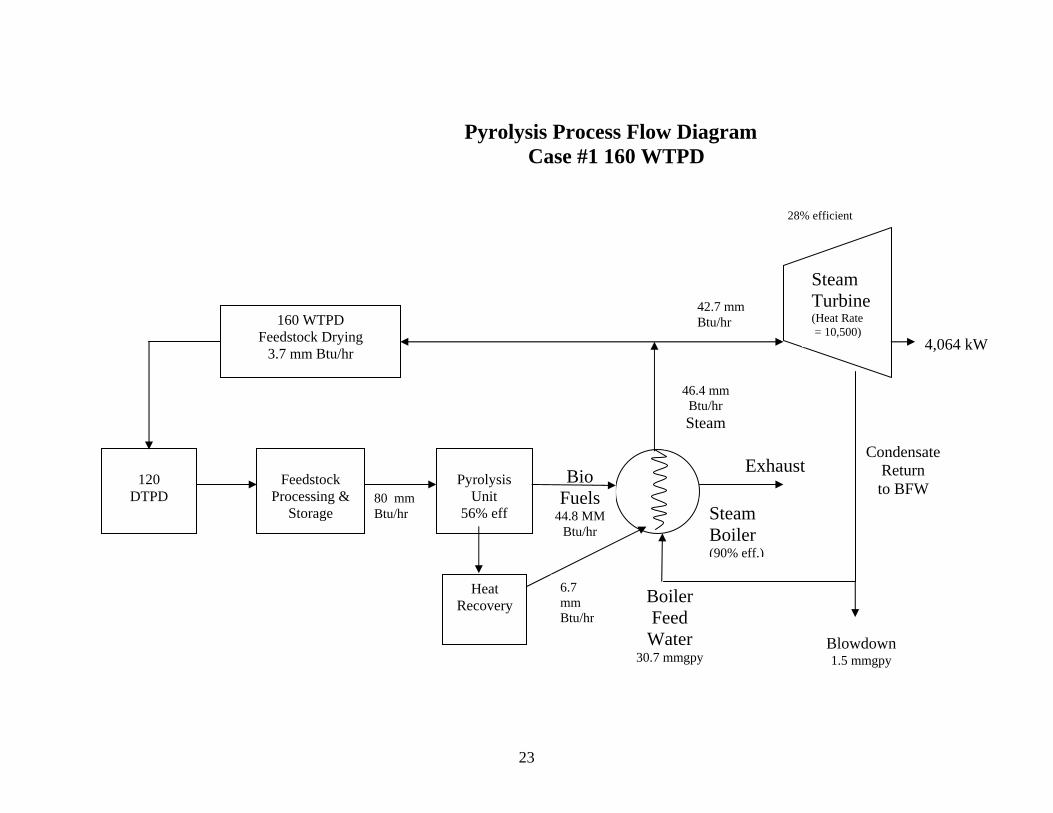
The following is a simplified process flow diagram of the pyrolysis method.

15
16
Pyrolysis Process Flow Diagram
Pyrolysis Process
Combust- ible Gas
Bio-Oil
Charcoal
Furnace
Biomass Feedstock
Dryer
Biomass
Feedstock
Ash Usable Heat
for Feedstock Drying
Dry Saleable Product Bio Oil
Energy for
Feedstock Drying
Low Quality Gas
Water Vapor
Heat Heat

17
It should be noted that the commercialization of these technologies is still in the developmental stages. There has been a great deal of theoretical work done to prove the practicality of the processes but there are currently no large scale facilities operating at the present time. A pyrolysis process developed by Renewable Oil International, LLC is being contemplated for construction. The concept is to build small scale plants near the feedstock source to reduce feedstock costs. The syn-fuel produced from the ROI process is heavier than water and when heated above 90 degrees F, can be transported. It is a high viscosity oil that requires a surfactant before blending with fuel oil prior to firing.
The following a simplified process flow diagram of the gasification method.

18
*
Boiler Feed Water & Condensate
Steam Biogas
Gasifier System
Biogas
Sand & Char
Scrubber
Exhaust
Sand
Steam Air
Biomass Feed
Dried Biomass
600 psig
Boiler
*MSCTGenerator Electric
Power
Gasifier Flow Diagram
*MSTG = Multi-Stage Condensing Turbine
Source: Frazier, Barnes and Associates, Memphis, TN

19
The syn-gas produced from the gasification process is cleaned of most impurities and then burned in a boiler to create steam. The steam powers a turbine generator that produces electricity for sale. The direct gas fired turbine design has not been proven to be practical at this point in time due to impurities inherent in the biogas for smaller than 50 MW gasification plants. It may be practical for large size plants.
Several firms have researched the possibility of using the biogas as a fuel and burning it directly in a turbine to drive a generator to produce electricity. After extensive testing and economic evaluation, Frazier, Barnes and Associates has determined that the type of gasification process selected will determine the need for cleaning the syn-gas before introducing it into the gas turbine. If the steam reformed gasification process is used, the need for cleaning the syn-gas will be greatly reduced. The use of the air reformed gasification process will, in all likelihood, increase the need for cleaning of the syn-gas. Regardless of the manufacturer of the gasification process and equipment, one point appears to be pre-eminent in all of them. The equipment for each one requires daily inspection and maintenance. Model Schematics
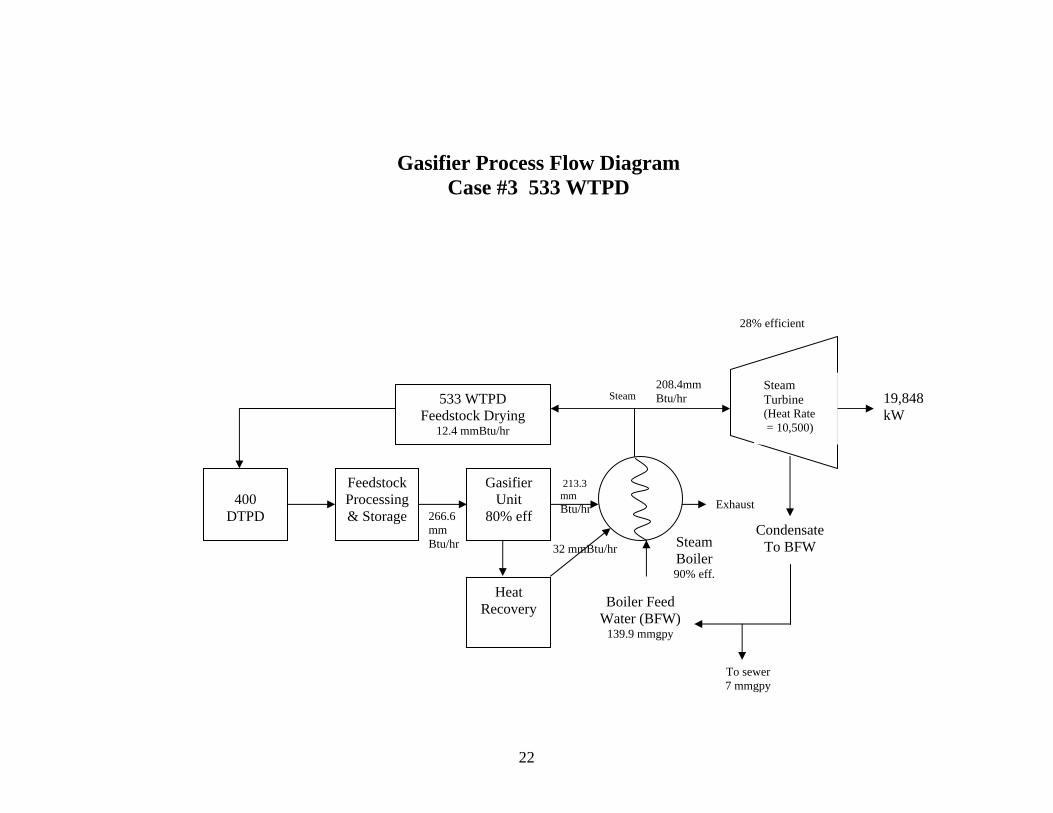
The basic concept of biomass conversion is to use the energy available from the biomass (except for feedstock drying) to produce to steam, which is then used to generate electric power with a steam turbine/generator set. The electricity can either be used at a nearby facility in need of electric power or the electricity could be sold into the grid system.
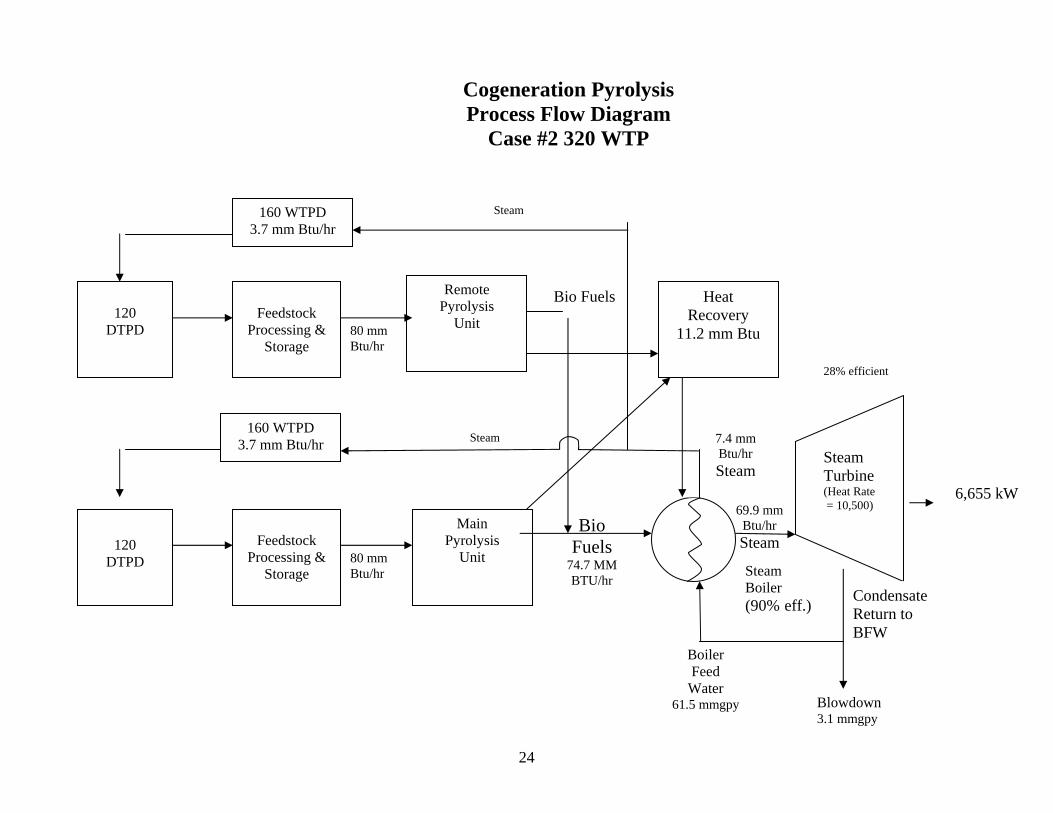
In this study we evaluated three different sized biomass conversion models for
both gasification and pyrolysis. The following pages contain schematic diagrams illustrating the process. Note the volume of biomass needed for each plant size, the amount of electricity produced and the relative efficiency of each system.

20
9.6 mmBtu/hr
62.5mm Btu/hr
Steam Boiler 90% eff.
Steam
64 mm Btu/hr
80 mm Btu/hr
120
DTPD
Feedstock Processing & Storage
Gasifier Unit
80% eff
160 WTPD Feedstock Drying
3.7 mmBtu/hr
Steam Turbine (Heat Rate = 10,500)
Exhaust
5,960 kW
Condensate To BFW
To sewer 2.2 mmgpy
Boiler Feed Water (BFW)
43.9 mmgpy
Gasifier Process Flow Diagram Case #1 160 WTPD
Heat Recovery
28% efficient

21
16 mmBtu/hr
106.7mm Btu/hr
Steam Boiler 90% eff.
Steam
122.6 mm Btu/hr 133.3
mm Btu/hr
200
DTPD
Feedstock Processing & Storage
Gasifier Unit
80% eff
267 WTPD Feedstock Drying
6.2 mmBtu/hr
Steam Turbine (Heat Rate = 10,500)
Exhaust
9,924 kW
Condensate To BFW
To sewer 3.5 mmgpy
Boiler Feed Water (BFW)
70.1 mmgpy
Gasifier Process Flow Diagram Case #2 267 WTPD
Heat Recovery
28% efficient
22
32 mmBtu/hr
208.4mm Btu/hr
Steam Boiler 90% eff.
Steam
213.3 mm Btu/hr 266.6
mm Btu/hr
400
DTPD
Feedstock Processing & Storage
Gasifier Unit
80% eff
533 WTPD Feedstock Drying
12.4 mmBtu/hr
Steam Turbine (Heat Rate = 10,500)
Exhaust
19,848 kW
Condensate To BFW
To sewer 7 mmgpy
Boiler Feed Water (BFW)
139.9 mmgpy
Gasifier Process Flow Diagram Case #3 533 WTPD
Heat Recovery
28% efficient
23
80 mm Btu/hr
Condensate Return to BFW
42.7 mm Btu/hr
120
DTPD
Feedstock
Processing & Storage
Pyrolysis
Unit 56% eff
Bio Fuels
44.8 MM Btu/hr
Exhaust
Boiler Feed Water
30.7 mmgpy
Steam Boiler (90% eff.)
46.4 mm Btu/hr Steam
Steam Turbine (Heat Rate = 10,500)
4,064 kW 160 WTPD
Feedstock Drying 3.7 mm Btu/hr
Blowdown 1.5 mmgpy
Pyrolysis Process Flow Diagram Case #1 160 WTPD
Heat Recovery
6.7 mm Btu/hr
28% efficient
24
69.9 mm Btu/hr Steam
Steam
Steam
80 mm Btu/hr
80 mm Btu/hr Steam
Boiler (90% eff.)
Bio Fuels
74.7 MM BTU/hr
Blowdown 3.1 mmgpy
Boiler Feed
Water 61.5 mmgpy
7.4 mm Btu/hr Steam
Steam Turbine (Heat Rate = 10,500)
6,655 kW
Condensate Return to BFW
120
DTPD
Feedstock
Processing & Storage
Main Pyrolysis
Unit
120
DTPD
Feedstock
Processing & Storage
Remote Pyrolysis
Unit
Bio Fuels
160 WTPD 3.7 mm Btu/hr
160 WTPD 3.7 mm Btu/hr
Cogeneration Pyrolysis Process Flow Diagram
Case #2 320 WTP
Heat Recovery
11.2 mm Btu
28% efficient

25
8143.5 mm Btu/hr Steam
Steam
Steam
Blowdown 4.6 mmgpy
120
DTPD
Feedstock Processing &
Storage
Remote Pyrolysis
Unit
Bio Fuels
149.3 MM Btu/hr
Boiler Feed Water
92.2 mmgpy
Steam Boiler (90% eff.)
Steam Turbine (Heat Rate = 10,500) 13,663
kW
Condensate Return to BFW
120
DTPD
Feedstock Processing &
Storage
Remote Pyrolysis
Unit
120
DTPD
Feedstock Processing &
Storage
Main Pyrolysis
Unit
Bio Fuels
Bio Fuels
160 WTPD 3.7 mm Btu/hr
160 WTPD 3.7 mm Btu/hr
160 WTPD 3.7 mm Btu/hr
Steam
Cogeneration Pyrolysis Process Flow Diagram
Case #3 480 WTPD
Heat Recovery
22.4 mm Btu
28% efficient

26
Scope of Financial Analysis The study evaluates both gasification and pyrolysis technologies to produce electricity using various feedstocks. It is assumed that:
1) The feedstock will be dried using heat generated through the gasification and pyrolysis processes.
2) Electricity will be produced from the bio-fuels, and 3) The energy from the bio-fuels can be sold locally at competitive prices. 4) The plant size should be limited in size to keep feedstock transportation cost at a
minimum. Larger plant sizes may be contracted but capital costs rise steeply with increased scale.
5) By-products such as char and ash will be treated as waste products. Although there may be emerging markets for these materials as soil amendments, market values have not been established at this time. The study also evaluates potential scale economies by analyzing three different
plant sizes based on wet tons of feedstock. The three plant sizes for the gasification technology are 160 wet tons per day that would produce about 5,956 kilowatts (KW), 267 wet tons per day that would produce about 9,924 KW and 533 wet tons per day that would produce about 19,848 KW. The three plant sizes for the pyrolysis technology are based on a160 wet tons per day plant that would produce 4,064 KW scaled up by replicating the same plant two and three times that would produce 6,655 and 13,663 KW, respectively. Capital Costs for Gasification and Pyrolysis Facilities The following tables list the capital cost estimates for different sized facilities that will produce electricity using biomass feedstocks. Gasification Capital Costs Plant Size Components 160 WTPD 267 WTPD 533 WTPD Capacity - KiloWatts of Electricity 3,370 5,627 11,232 Buildings $596,700 $716,040 $947,700 Feedstock Receiving & Processing $1,638,750 $2,338,750 $3,637,750 Truck Dump $117,000 $117,000 $117,000 Front End Loader $140,000 $140,000 $140,000 Fuel Processing Building $820,000 $1,350,000 $2,339,000 Metal Removal Equipment $18,000 $18,000 $18,000 Grinding/Sizing Equipment $193,000 $216,500 $263,250 Blending Equipment $87,500 $117,000 $146,250 Fuel Storage Bins $117,000 $234,000 $468,000 Conveyors $146,250 $146,250 $146,250 Gasification Process Equipment $6,880,000 $10,000,000 $15,560,000

27
Interconnections $1,053,000 $1,521,000 $2,340,000 Steam Boiler $3,500,000 $6,000,000 $8,000,000 Power Generation Equipment $1,500,000 $2,000,000 $3,300,000 Heat Recovery $600,000 $1,040,000 $1,560,000 Engineering/Permitting $296,400 $510,000 $702,000 Land/Site Preparation $238,700 $325,000 $434,000 Sub Total $16,303,550 $24,450,790 $36,481,450 Contingency (20%) $3,260,710 $4,890,158 $7,296,290 Total Estimated Cost $19,564,260 $29,340,948 $43,777,740
WTPD = Wet tons per day of feedstock. Pyrolysis Capital Costs Plant Size Components 160 WTPD 320 WTPD 480 WTPD Capacity - KiloWatts of Electricity 2,266 4,534 6,801 Buildings $596,700 $1,193,400 $1,790,100 Feedstock Receiving & Processing $1,638,750 $2,338,750 $3,637,750 Truck Dump $117,000 $117,000 $117,000 Front End Loader $140,000 $140,000 $140,000 Fuel Processing Building $820,000 $1,350,000 $2,339,000 Metal Removal Equipment $18,000 $18,000 $18,000 Grinding/Sizing Equipment $193,000 $216,500 $263,250 Blending Equipment $87,500 $117,000 $146,250 Fuel Storage Bins $117,000 $234,000 $468,000 Conveyors $146,250 $146,250 $146,250 Pyrolysis Process Equipment $1,300,000 $2,600,000 $3,900,000 Interconnections $600,000 $1,200,000 $1,800,000 600 PSIG Steam Boiler $3,000,000 $6,000,000 $9,000,000 Demineralizer System $175,000 $350,000 $525,000 Power generation Equipment $875,000 $1,750,000 $2,250,000 Heat Recovery System $702,000 $1,404,000 $2,106,000 Engineering/Permitting $351,000 $620,000 $940,000 Land/Site Preparation $120,000 $240,000 $360,000 Sub Total $9,358,450 $17,696,150 $26,308,850 Contingency (20%) $1,871,690 $3,539,230 $5,261,770 Total Estimated Cost $11,230,140 $21,235,380 $31,570,620
WTPD = Wet tons per day of feedstock. Source: Frazier, Barnes and Associates, Memphis, TN
28
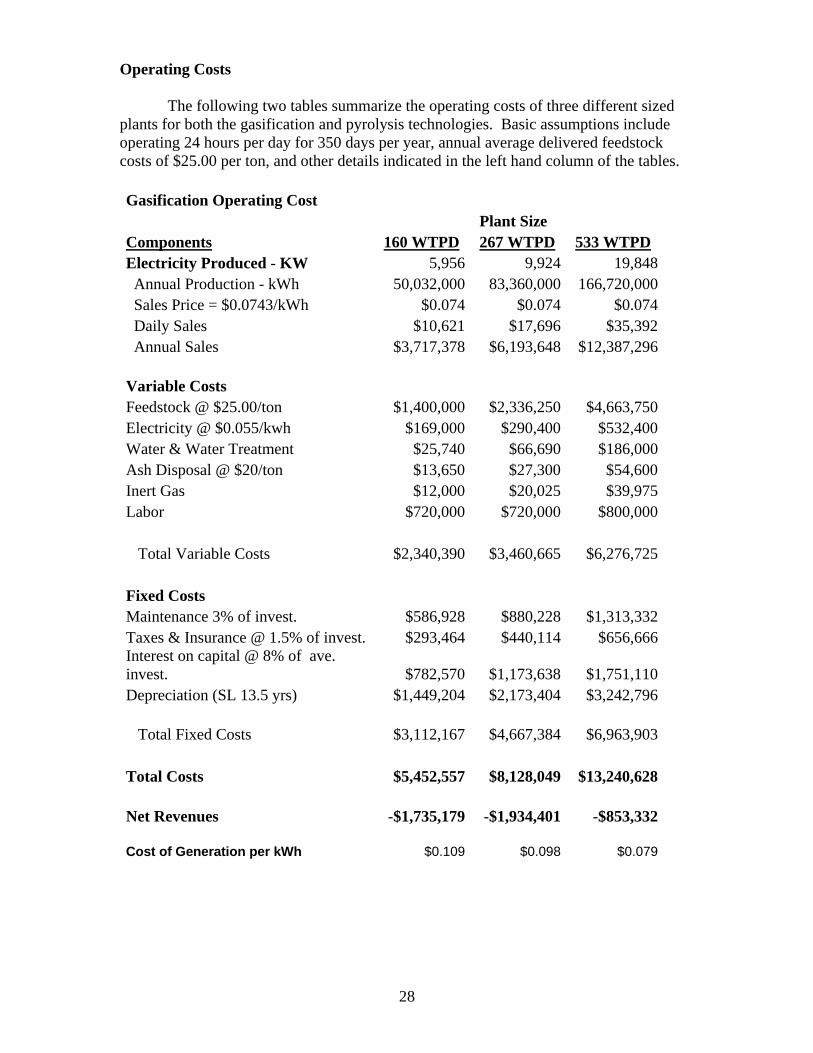
Operating Costs The following two tables summarize the operating costs of three different sized plants for both the gasification and pyrolysis technologies. Basic assumptions include operating 24 hours per day for 350 days per year, annual average delivered feedstock costs of $25.00 per ton, and other details indicated in the left hand column of the tables. Gasification Operating Cost Plant Size Components 160 WTPD 267 WTPD 533 WTPD Electricity Produced - KW 5,956 9,924 19,848 Annual Production - kWh 50,032,000 83,360,000 166,720,000 Sales Price = $0.0743/kWh $0.074 $0.074 $0.074 Daily Sales $10,621 $17,696 $35,392 Annual Sales $3,717,378 $6,193,648 $12,387,296 Variable Costs Feedstock @ $25.00/ton $1,400,000 $2,336,250 $4,663,750Electricity @ $0.055/kwh $169,000 $290,400 $532,400Water & Water Treatment $25,740 $66,690 $186,000Ash Disposal @ $20/ton $13,650 $27,300 $54,600Inert Gas $12,000 $20,025 $39,975Labor $720,000 $720,000 $800,000 Total Variable Costs $2,340,390 $3,460,665 $6,276,725 Fixed Costs Maintenance 3% of invest. $586,928 $880,228 $1,313,332Taxes & Insurance @ 1.5% of invest. $293,464 $440,114 $656,666Interest on capital @ 8% of ave. invest. $782,570 $1,173,638 $1,751,110Depreciation (SL 13.5 yrs) $1,449,204 $2,173,404 $3,242,796 Total Fixed Costs $3,112,167 $4,667,384 $6,963,903 Total Costs $5,452,557 $8,128,049 $13,240,628 Net Revenues -$1,735,179 -$1,934,401 -$853,332 Cost of Generation per kWh $0.109 $0.098 $0.079
29
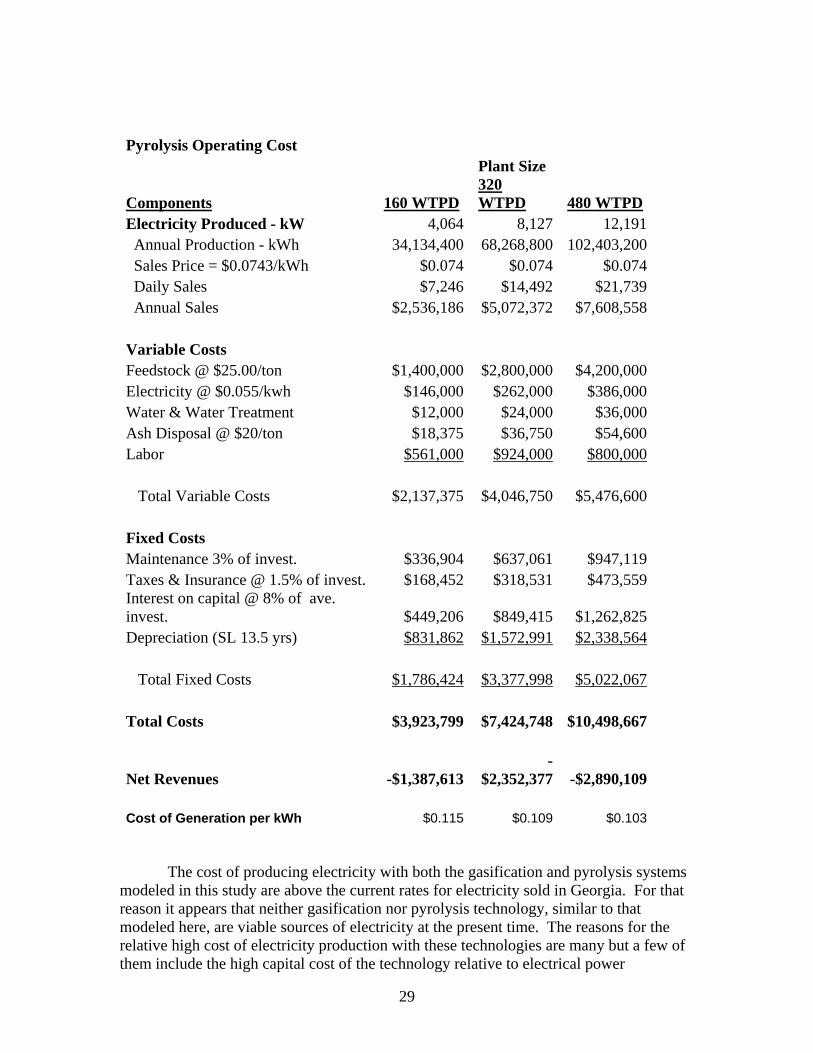
Pyrolysis Operating Cost Plant Size
Components 160 WTPD 320 WTPD 480 WTPD
Electricity Produced - kW 4,064 8,127 12,191 Annual Production - kWh 34,134,400 68,268,800 102,403,200 Sales Price = $0.0743/kWh $0.074 $0.074 $0.074 Daily Sales $7,246 $14,492 $21,739 Annual Sales $2,536,186 $5,072,372 $7,608,558 Variable Costs Feedstock @ $25.00/ton $1,400,000 $2,800,000 $4,200,000 Electricity @ $0.055/kwh $146,000 $262,000 $386,000 Water & Water Treatment $12,000 $24,000 $36,000 Ash Disposal @ $20/ton $18,375 $36,750 $54,600 Labor $561,000 $924,000 $800,000 Total Variable Costs $2,137,375 $4,046,750 $5,476,600 Fixed Costs Maintenance 3% of invest. $336,904 $637,061 $947,119 Taxes & Insurance @ 1.5% of invest. $168,452 $318,531 $473,559 Interest on capital @ 8% of ave. invest. $449,206 $849,415 $1,262,825 Depreciation (SL 13.5 yrs) $831,862 $1,572,991 $2,338,564 Total Fixed Costs $1,786,424 $3,377,998 $5,022,067 Total Costs $3,923,799 $7,424,748 $10,498,667
Net Revenues -$1,387,613-
$2,352,377 -$2,890,109 Cost of Generation per kWh $0.115 $0.109 $0.103
The cost of producing electricity with both the gasification and pyrolysis systems modeled in this study are above the current rates for electricity sold in Georgia. For that reason it appears that neither gasification nor pyrolysis technology, similar to that modeled here, are viable sources of electricity at the present time. The reasons for the relative high cost of electricity production with these technologies are many but a few of them include the high capital cost of the technology relative to electrical power
30
generated. The high capital cost raises the fixed costs of operation and places a large financial burden of the venture. It is possible that larger scale operations than those modeled in this study can drive unit costs of production down enough to be competitive.
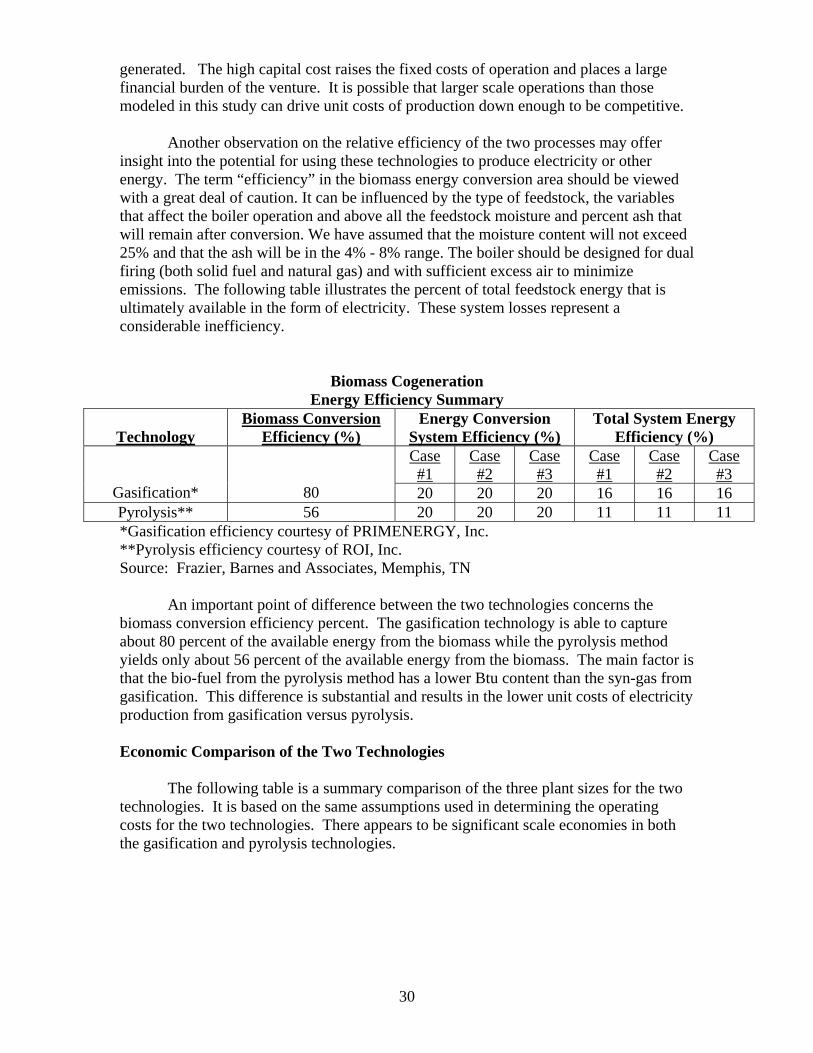
Another observation on the relative efficiency of the two processes may offer
insight into the potential for using these technologies to produce electricity or other energy. The term “efficiency” in the biomass energy conversion area should be viewed with a great deal of caution. It can be influenced by the type of feedstock, the variables that affect the boiler operation and above all the feedstock moisture and percent ash that will remain after conversion. We have assumed that the moisture content will not exceed 25% and that the ash will be in the 4% - 8% range. The boiler should be designed for dual firing (both solid fuel and natural gas) and with sufficient excess air to minimize emissions. The following table illustrates the percent of total feedstock energy that is ultimately available in the form of electricity. These system losses represent a considerable inefficiency.
Biomass Cogeneration Energy Efficiency Summary
Technology
Biomass Conversion Efficiency (%)
Energy Conversion System Efficiency (%)
Total System Energy Efficiency (%)
Case #1
Case #2
Case #3
Case #1
Case #2
Case #3
Gasification*
80 20 20 20 16 16 16 Pyrolysis** 56 20 20 20 11 11 11 *Gasification efficiency courtesy of PRIMENERGY, Inc. **Pyrolysis efficiency courtesy of ROI, Inc. Source: Frazier, Barnes and Associates, Memphis, TN
An important point of difference between the two technologies concerns the
biomass conversion efficiency percent. The gasification technology is able to capture about 80 percent of the available energy from the biomass while the pyrolysis method yields only about 56 percent of the available energy from the biomass. The main factor is that the bio-fuel from the pyrolysis method has a lower Btu content than the syn-gas from gasification. This difference is substantial and results in the lower unit costs of electricity production from gasification versus pyrolysis.
Economic Comparison of the Two Technologies
The following table is a summary comparison of the three plant sizes for the two technologies. It is based on the same assumptions used in determining the operating costs for the two technologies. There appears to be significant scale economies in both the gasification and pyrolysis technologies.

31
Economic Comparison of Gasification and Pyrolysis Facilities Plant Size Gasification 160 WTPD 267 WTPD 533 WTPD Production Capacity (kW) 5,956 9,924 19,848 KiloWatt Hours Per Year 50,032,000 83,360,000 166,720,000 Total Estimated Capital Cost $19,564,260 $29,340,948 $43,777,740 Capital Cost per kW $3,284.69 $2,956.62 $2,205.69 Estimated Operating Costs $5,452,557 $8,128,049 $13,240,628 Operating Cost per kWhr $0.109 $0.098 $0.079 Pyrolysis 160 WTPD 320 WTPD 480 WTPD Production Capacity (kW) 4,064 8,127 12,191 KiloWatt Hours Per Year 34,134,400 68,268,800 102,403,200 Total Estimated Capital Cost $11,230,140 $21,235,380 $31,570,620 Capital Cost per kW $2,763.58 $2,612.87 $2,589.70 Estimated Operating Costs $3,923,799 $7,424,748 $10,498,667 Operating Cost per kWhr $0.115 $0.109 $0.103
Summary of Gasification and Pyrolysis In summary, it does not appear that it is feasible to produce electricity at a competitive cost to current commercial operations from biomass using pyrolysis and gasification technologies under the current economic environment without subsidies in the form of Renewable Energy Production Incentive from the Federal Government and Green Energy Premiums. The operating costs of producing electricity using these technologies are well above the current cost of electricity producing using atomic, coal and gas fired plants. Production costs of electricity from coal, nuclear and gas powered plants range from 2.5-3.5 cents per kilowatt hour. Improvements in system efficiency and reductions in capital costs will be needed before these technologies can be competitive. Given the existence of subsidies, the largest scale gasification plant in this study is feasible and the largest scale pyrolysis plant comes quite close to being feasible missing the benchmark by 0.6 cent per kilowatt hour. While not explored in this study, it is possible than a larger scale pyrolysis plant could be feasible if the observed trend of lower unit costs at larger scale were to continue with increased plant size. Comparison of Results with 2003 CAED Study

32
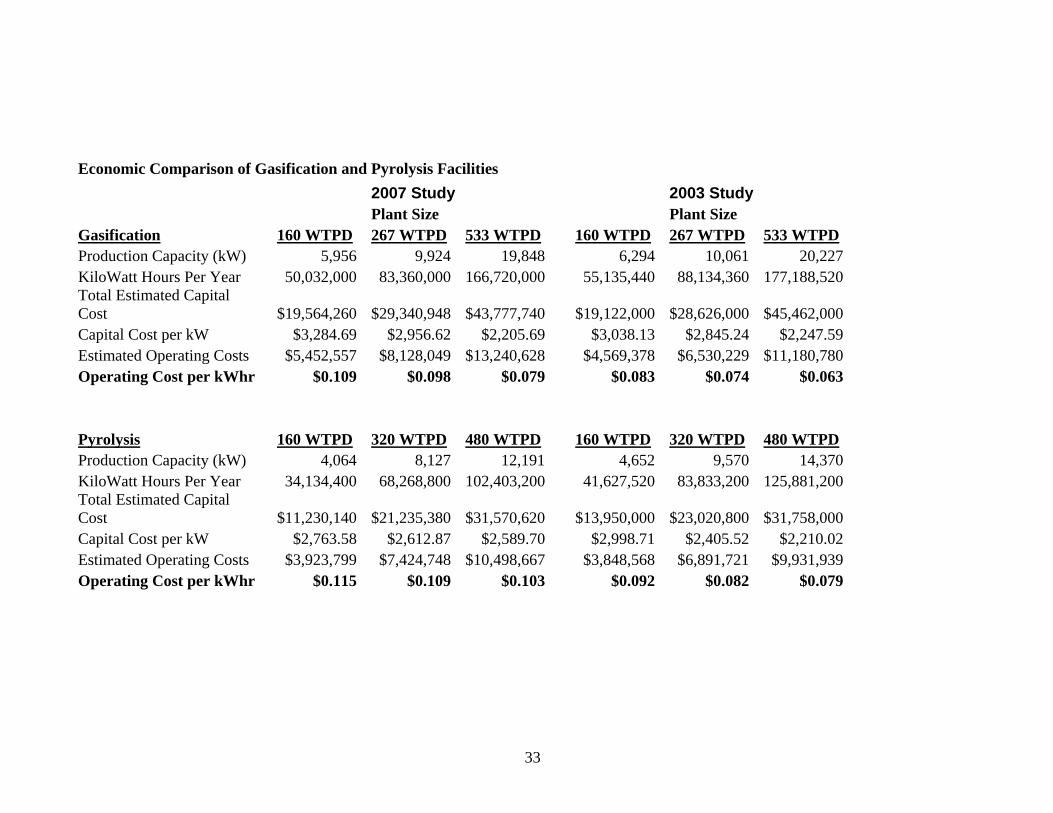
In 2003 CAED published a study of which the current paper is an update (“The Feasibility of Generating Electricity from Biomass Fuel Sources in Georgia”, Wayne Curtis, et al, FR-0306, August, 2003, CAED, UGA). The basic finding was that the cost of producing electricity using biomass fuels in Georgia was only slightly above the prevailing commercial sales rates for electricity in Georgia at that time. It appeared that the outlook for electrical generation using biomass had a promising future. It should be noted that the 2003 study used a slightly different technology than evaluated in the current study. The results of the current report paint a different picture. The cost of converting biomass into electricity using the current technologies is well above current commercial electrical production cost and above current electrical retail prices. The root cause of the different findings involves technology changes in the current report compared to the 2003 report. In the 2003 report, it was reported that the then cutting edge theory for biomass conversion into electricity involved generating a bio-fuel, either via gasification or pyrolysis, and burning that fuel directly in a turbine engine that would power a generator to produce electricity. Heat generated by the turbine would be captured to create steam that would power a second steam powered turbine that would also generate electricity. Experience has shown that this theory will not work in practice. It seems that the crude syn-fuel has highly corrosive properties (10-20% corrosive gases and solids) that will quickly destroy the turbine engine. Refining of the crude syn-fuel prior to burning in the turbine proved to problematic as the heating value of the syn-fuel is depleted up to 75 percent rendering it almost useless as a fuel. The current report is based on technology that is proven in practice. The basic gasification and pyrolysis methods are used to produce a syn-fuel. The syn-fuel is then burned directly in a boiler specifically designed to operate on syn-fuels. The boiler creates steam that is then used to produce electricity. The system does work from a technological point of view. The problem is that much less electricity can be produced using this method than theoretically could have been produce by the 2003 method – had it worked. The following table is a comparison of the 2003 and current study findings. The generating capacity of all the cases studied is reduced by the change in the technology from the 2003 study to the current situation. And there lies the source of the differences between the 2003 study and the current findings. The technology posited in 2003 did not work as predicted.
A second minor source of difference in the cost of producing electricity between the two reports concerns the assumed cost of securing feedstock at the plant. The 2003 study assumed average delivered feedstock cost of $20 per ton while the current study assumed average delivered feedstock costs of $25 per ton. The cost rise was due to both increased costs of the raw materials in some cases but also due to a considerable increase in transport costs. The average difference the higher feedstock cost means to the cost of generating electricity is about 0.6 cent per kilo Watt hour.
33
Economic Comparison of Gasification and Pyrolysis Facilities
2007 Study 2003 Study Plant Size Plant Size Gasification 160 WTPD 267 WTPD 533 WTPD 160 WTPD 267 WTPD 533 WTPD Production Capacity (kW) 5,956 9,924 19,848 6,294 10,061 20,227KiloWatt Hours Per Year 50,032,000 83,360,000 166,720,000 55,135,440 88,134,360 177,188,520Total Estimated Capital Cost $19,564,260 $29,340,948 $43,777,740 $19,122,000 $28,626,000 $45,462,000Capital Cost per kW $3,284.69 $2,956.62 $2,205.69 $3,038.13 $2,845.24 $2,247.59Estimated Operating Costs $5,452,557 $8,128,049 $13,240,628 $4,569,378 $6,530,229 $11,180,780Operating Cost per kWhr $0.109 $0.098 $0.079 $0.083 $0.074 $0.063 Pyrolysis 160 WTPD 320 WTPD 480 WTPD 160 WTPD 320 WTPD 480 WTPD Production Capacity (kW) 4,064 8,127 12,191 4,652 9,570 14,370KiloWatt Hours Per Year 34,134,400 68,268,800 102,403,200 41,627,520 83,833,200 125,881,200Total Estimated Capital Cost $11,230,140 $21,235,380 $31,570,620 $13,950,000 $23,020,800 $31,758,000Capital Cost per kW $2,763.58 $2,612.87 $2,589.70 $2,998.71 $2,405.52 $2,210.02Estimated Operating Costs $3,923,799 $7,424,748 $10,498,667 $3,848,568 $6,891,721 $9,931,939Operating Cost per kWhr $0.115 $0.109 $0.103 $0.092 $0.082 $0.079

34
Firms are building gasification plants in Georgia. Are We Missing Something?
A reviewer of a draft posed the above question and it is a good one. Why would firms enter into the business if the economics appear so bleak? There are several potential answers to the question.
In analyzing the cost structure of producing electricity with the gasification process, one can see that feedstock costs and fixed costs, primarily debt service and capital recovery dominate while variable production costs are relatively low. Fixed costs account for 53 percent, feedstock costs account for 35 percent while variable costs are only 12 percent of total production costs. The following chart illustrates the situation. If a firm can secure feedstock at a price below those used in the study, $25 per delivered ton, then production costs can be reduced directly. A $5 per ton reduction in the price of feedstock will result in a one-half cent ($0.0054) reduction in production costs. So, a firm that secures very low priced feedstock, say $5 per ton, could reduce costs 2.2 cents per kilowatt hour. One industry source contacted indicated their anticipated feedstock cost would be near $5 per ton. Another means for costs reduction is to lower that capital outlay from the firm by securing grants or other forms of assistance from government agencies. Gasification and pyrolysis are very capital intensive operations and thus have high fixed costs of operation. By reducing the costs of debt service and capital recovery, the firm can reduce production costs. Let’s assume that a firm was able to secure 25 percent of the capital requirement from grants, thus reducing its capital outlay for the largest gasification plant from $43.8 million to $32.85 million. Fixed costs would be reduced by over $3 million per year resulting in a 1.8 cent per kilowatt hour reduction in production costs. One firm that has announced plans to build a plant in Georgia has secured significant grant and loan guarantee support. A third possibility is that firms entering the industry possess technologies that are more efficient that those modeled in this study. Better technology usually implies lower unit costs of production. In summary, it is possible that firms may be able to take a combination of the above advantages and produce electricity profitably or believe they can do so. Reducing feedstock costs to $5 per ton and receiving 25 percent of capital in the form of grants could lower production costs from 7.9 to 3.9 cents per kilowatt hour making the firm quite competitive with existing technologies.
Gasification Costs
Feedstock
Fixed
Other Variable

35
An Assessment of the Potential for Electricity Generation Using Manure Digesters on Georgia Dairy Farms
The technology for producing electricity from animal waste on commercial farms has existed for more than a decade. Advances in this technology have accelerated at a rapid rate over the past several years. A number of factors have lead to this advancement, including improved reliability of the anaerobic digesters used to capture methane gas from manure, an increased emphasis on environmental quality, the development of more state and federal programs to share in the cost of developing these systems, and the emergence of new state energy policies aimed at encouraging reliable renewable energy production.
One area of agriculture that has seen successful implementation of a number of manure digesters nationwide is the dairy industry. Large to mid-sized dairy farms generally tend to be well positioned to benefit from on-farm electricity production from manure for several reasons. The most important is the concentration of available manure associated with the typical confined animal feeding operation model employed by many dairy farms. This model generally requires that the farm have a waste management plan in place. Since most such waste management plans in Georgia center around the use of a lagoon of some type, manure collection and concentration is a function that is already performed on the farm. Geisy, Wilkie, De Vries, and Nordstedt recently conducted a study of the feasibility of using anaerobic digesters to produce electricity on Florida diary farms. Results of the study found the feasibility of the systems studied to be sensitive to capital investment, interest rates, and the wholesale price of electricity.
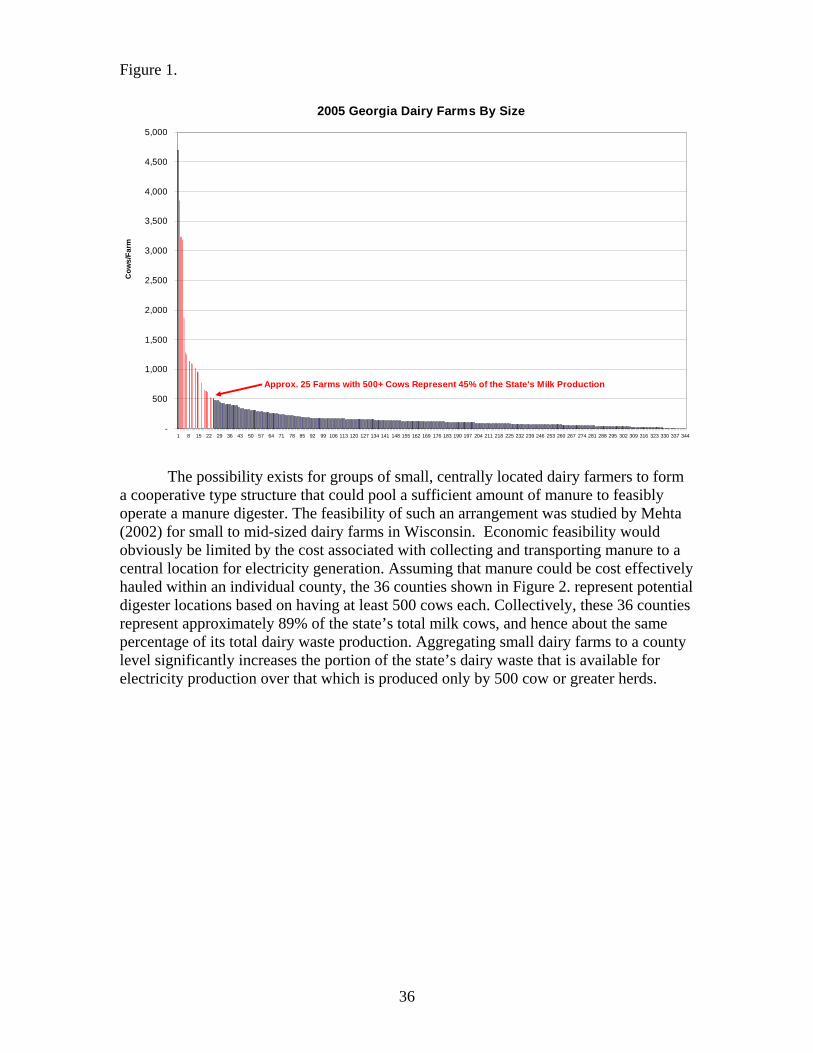
This brief study is intended to assess the potential for electricity production from dairy waste in Georgia. Based on a feasibility analysis spreadsheet developed by the University of Florida Extension Service, as well as discussions with individual producers, the minimum farm size necessary for a digester to be economically feasible is in a 500-600 cow range. Based on annual milk production data obtained from the USDA’s Agricultural Marketing Service/Dairy Programs Division there were 344 dairy farms in the state in 2005. Of these 344 farms, only about 25 had 500 or more cows. Although these 25 farms account for less than 8% of dairy farms in the state, they represent approximately 45% of its total milk production and thus about 45% of the state’s dairy waste (Figure 1).
36
Figure 1.
2005 Georgia Dairy Farms By Size
-
500
1,000
1,500
2,000
2,500
3,000
3,500
4,000
4,500
5,000
1 8 15 22 29 36 43 50 57 64 71 78 85 92 99 106 113 120 127 134 141 148 155 162 169 176 183 190 197 204 211 218 225 232 239 246 253 260 267 274 281 288 295 302 309 316 323 330 337 344
Cow
s/Fa
rm
Approx. 25 Farms with 500+ Cows Represent 45% of the State's Milk Production
The possibility exists for groups of small, centrally located dairy farmers to form a cooperative type structure that could pool a sufficient amount of manure to feasibly operate a manure digester. The feasibility of such an arrangement was studied by Mehta (2002) for small to mid-sized dairy farms in Wisconsin. Economic feasibility would obviously be limited by the cost associated with collecting and transporting manure to a central location for electricity generation. Assuming that manure could be cost effectively hauled within an individual county, the 36 counties shown in Figure 2. represent potential digester locations based on having at least 500 cows each. Collectively, these 36 counties represent approximately 89% of the state’s total milk cows, and hence about the same percentage of its total dairy waste production. Aggregating small dairy farms to a county level significantly increases the portion of the state’s dairy waste that is available for electricity production over that which is produced only by 500 cow or greater herds.

37
Based on a review of existing literature and conversations with digester operators, the following simplifying assumptions are made. A complete digester system for a model 1,000 cow dairy will cost approximately $1 million to construct and will produce about 1.2 million kWh/year of electricity. A farm of this size will consume about 940,000 kWh/year internally and will be left with an additional 260,000 kWh/year to sell to an outside source at a wholesale rate of 3.5 cents per kWh. It is further assumed that these cost, production, usage, and sales figures may be scaled up or down in a linear fashion to accommodate larger or smaller herd sizes.
38
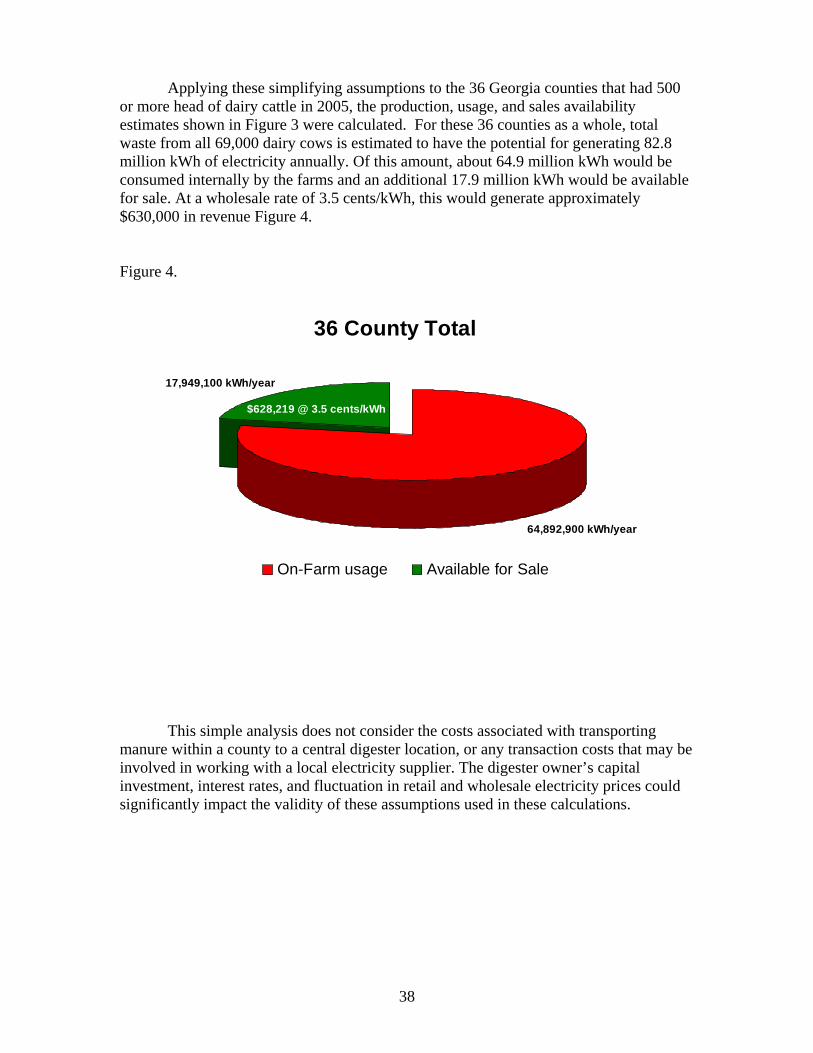
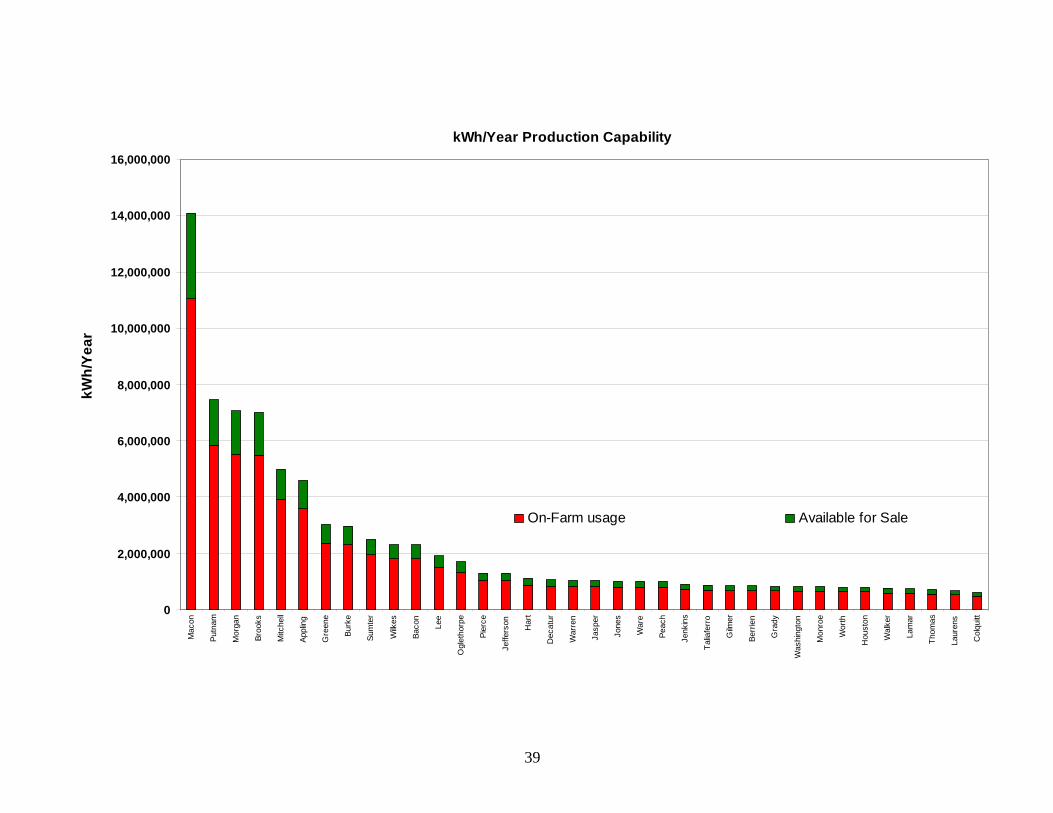
Applying these simplifying assumptions to the 36 Georgia counties that had 500
or more head of dairy cattle in 2005, the production, usage, and sales availability estimates shown in Figure 3 were calculated. For these 36 counties as a whole, total waste from all 69,000 dairy cows is estimated to have the potential for generating 82.8 million kWh of electricity annually. Of this amount, about 64.9 million kWh would be consumed internally by the farms and an additional 17.9 million kWh would be available for sale. At a wholesale rate of 3.5 cents/kWh, this would generate approximately $630,000 in revenue Figure 4. Figure 4.
36 County Total
17,949,100 kWh/year
64,892,900 kWh/year
On-Farm usage Available for Sale
$628,219 @ 3.5 cents/kWh
This simple analysis does not consider the costs associated with transporting
manure within a county to a central digester location, or any transaction costs that may be involved in working with a local electricity supplier. The digester owner’s capital investment, interest rates, and fluctuation in retail and wholesale electricity prices could significantly impact the validity of these assumptions used in these calculations.
39
kWh/Year Production Capability
0
2,000,000
4,000,000
6,000,000
8,000,000
10,000,000
12,000,000
14,000,000
16,000,000
Mac
on
Putn
am
Mor
gan
Broo
ks
Mitc
hell
Appl
ing
Gre
ene
Burk
e
Sum
ter
Wilk
es
Baco
n
Lee
Ogl
etho
rpe
Pier
ce
Jeffe
rson Har
t
Dec
atur
War
ren
Jasp
er
Jone
s
War
e
Peac
h
Jenk
ins
Talia
ferr
o
Gilm
er
Berr
ien
Gra
dy
Was
hing
ton
Mon
roe
Wor
th
Hou
ston
Wal
ker
Lam
ar
Thom
as
Laur
ens
Col
quitt
kWh/
Year
On-Farm usage Available for Sale
40
Biomass Study Summary
This study evaluated the use of biomass for the purpose of generating electricity using current technologies to determine whether or not it is economically feasible in the current economic environment. Three different plant sizes for two different but related technologies were studied. Gasification of biomass shows promise as technologies for utilizing the syn-gas improve but as yet the cost of generating electricity is above current retail rates in Georgia. Pyroysis was also evaluated but showed less promise as it appears to be a less efficient means of gathering the available energy from the biomass. The resulting bio-fuel has a lower Btu content than that from gasification and thus a lower electricity yield and resultant higher cost per unit of production. The basic findings are that while it is technologically feasible to accomplish the task, it is not economically feasible to convert biomass into electricity in Georgia at the present time. The exception is that large dairies or smaller dairies that pool their manure may be able to produce electricity at competitive rates.
41
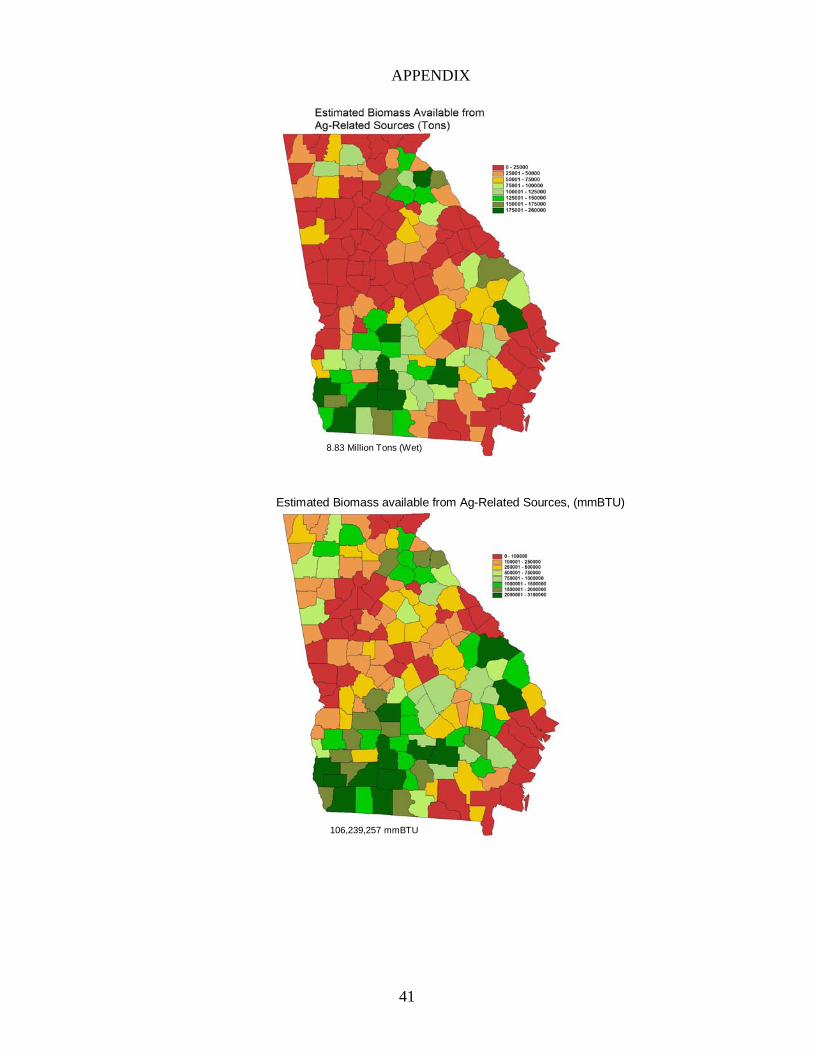
APPENDIX
8.83 Million Tons (Wet)
Estimated Biomass available from Ag-Related Sources, (mmBTU)
106,239,257 mmBTU
42
0 - 35103511 - 99759976 - 1776017761 - 3146531466 - 5100051001 - 9900099001 - 193833193834 - 429372
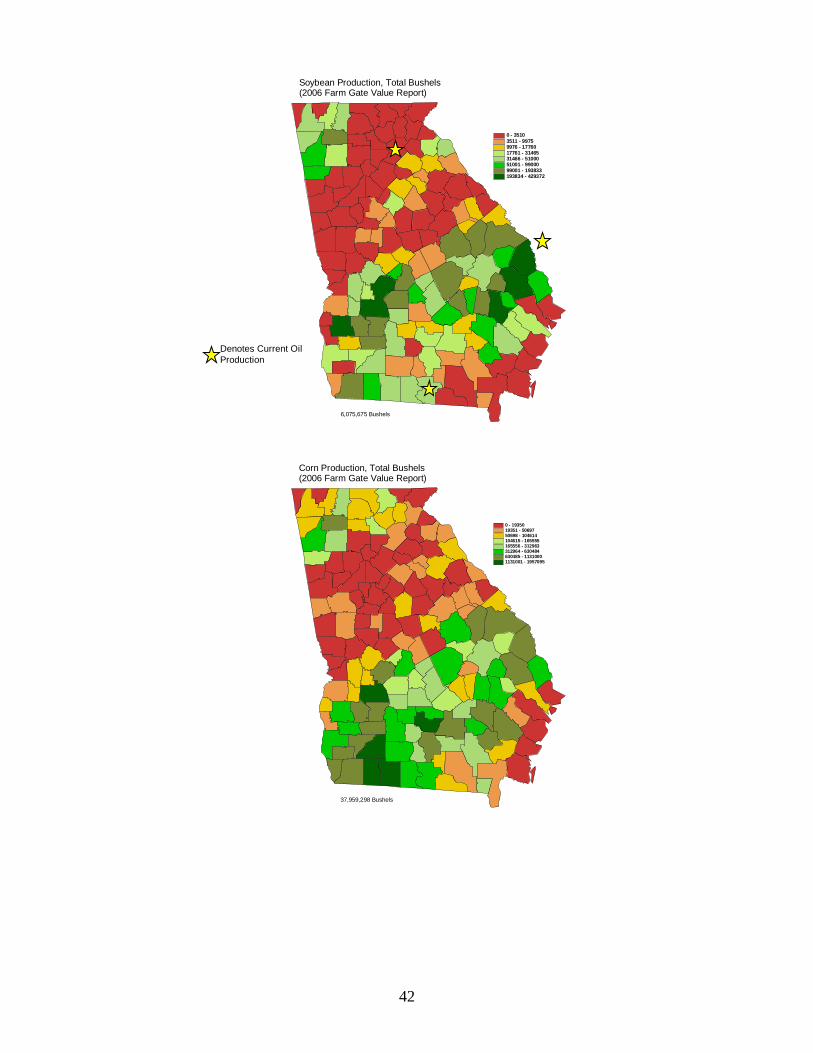
Soybean Production, Total Bushels(2006 Farm Gate Value Report)
6,075,675 Bushels
Denotes Current Oil Production
0 - 1935019351 - 5069750698 - 104614104615 - 165555165556 - 312963312964 - 630484630485 - 11310001131001 - 1957095
Corn Production, Total Bushels(2006 Farm Gate Value Report)
37,959,298 Bushels
43
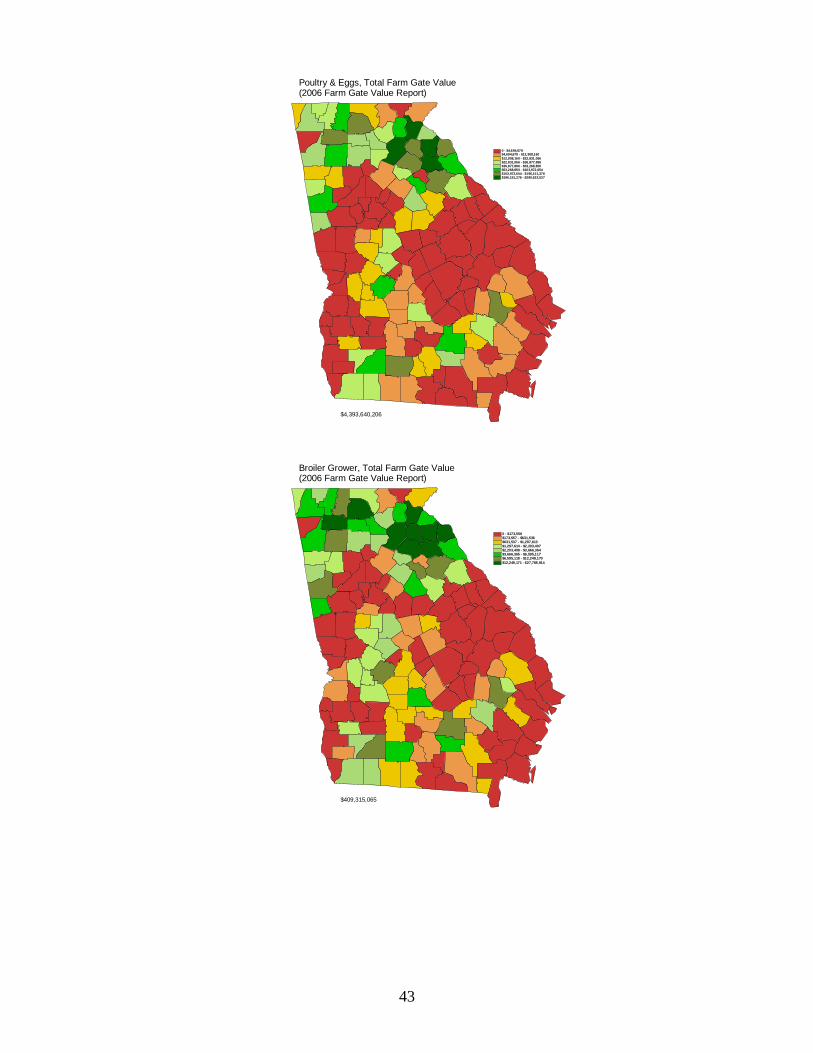
0 - $4,694,679$4,694,679 - $12,908,160$12,908,160 - $22,831,066$22,831,066 - $36,877,896$36,877,896 - $53,268,850$53,268,850 - $103,972,654$103,972,654 - $196,151,376$196,151,376 - $280,632,537
Poultry & Eggs, Total Farm Gate Value(2006 Farm Gate Value Report)
$4,393,640,206
0 - $173,556$173,557 - $631,536$631,537 - $1,297,613$1,297,614 - $2,203,407$2,203,408 - $3,666,364$3,666,365 - $6,595,117$6,595,118 - $12,249,170$12,249,171 - $27,768,914
Broiler Grower, Total Farm Gate Value(2006 Farm Gate Value Report)
$409,315,065

The Center for Agribusiness & Economic Development The Center for Agribusiness and Economic Development is a unit of the College of Agricultural and Environmental Sciences of the University of Georgia, combining the missions of research and extension. The Center has among its objectives: To provide feasibility and other short term studies for current or potential Georgia
agribusiness firms and/or emerging food and fiber industries. To provide agricultural, natural resource, and demographic data for private and
public decision makers. To find out more, visit our Web site at: http://www.caed.uga.edu
Or contact:
John McKissick, Director Center for Agribusiness and Economic Development
Lumpkin House The University of Georgia
Athens, Georgia 30602-7509 Phone (706)542-0760
[email protected] The University of Georgia and Fort Valley State University, and the U.S. Department of Agriculture and counties of the state cooperating. The Cooperative Extension Service offers educational programs, assistance and materials to all people without regard to race, color, national origin, age, sex or disability. An equal opportunity/affirmative action organization committed to a diverse work force. Report Number: CR-07-16 March 2007 Issued in furtherance of Cooperation Extension Acts of May 8 and June 30, 1914, the University of Georgia College of Agricultural and Environmental Sciences, and the U.S. Department of Agriculture cooperating.
J. Scott Angle, Dean and Director