2013 North Dakota Beef Report - North Dakota State University

AAE Staff Paper 12002 March 2012
The Economic Base of North Dakota
Randal C. Coon, Dean A. Bangsund, and Nancy M. Hodur
Department of Agribusiness and Applied EconomicsNorth Dakota State University
Fargo, North Dakota 58108

Abstract
The growth and composition of the North Dakota economy have been measured by usingeconomic base analysis. Economic base (sales for final demand) has been estimated for sectorscorresponding to the North Dakota Input-Output Model and for industrial categories. These twomeasures produce the same total basic economic activity, but use different delineations. NorthDakota’s economic base has grown from $8.3 billion in 1990 to $32.2 billion in 2010 whenmeasured in current year (nominal) dollars. When measured in real or constant dollars, theeconomy grew from $12.8 billion in 1990 to $32.2 billion in 2010. Constant dollars remove theeffects of inflation and were calculated using the Gross Domestic Product Implicit PriceDeflators. Nominal growth of the state’s economy from 1990 to 2010 was 120.3 percent, whichamounted to 76.1 percent real growth. Natural resource-based activities (agriculture and energy)continue to comprise over half of the state’s economic base, accounting for 50.9 percent in 2010.
Key Words: North Dakota, economic base, basic-sector industries, sales to final demand,impact assessment, economic contribution
This publication is available electronically at this web site: http://agecon.lib.umn.edu/.Please address your inquiries regarding this publication to: Department of Agribusiness &Applied Economics, P.O. Box 6050, Fargo, ND, 58108-6050, Phone: 701-231-7334, Fax: 701-231-7400, Email: [email protected].
NDSU is an equal opportunity institution.
Copyright © 2012 by Coon, Bangsund, and Hodur. All rights reserved. Readers may makeverbatim copies of this document for non-commercial purposes by any means, provided thiscopyright notice appears on all such copies.

The Economic Base of North Dakota
Randal C. Coon, Dean A. Bangsund, and Nancy M. Hodur*
Introduction
North Dakota currently has a very strong and growing economy. A large number ofmeasures are available to describe an economy, including economic base, employment,personal income, taxable sales and purchases, gross state product, population, etc. TheDepartment of Agribusiness and Applied Economics has used an economic base approach toestimate the state’s economy since the late 1950s. This type of analysis has provided ameasure of the economy at the state or multi-county regional level. It also has provided theframework for additional analyses including economic impact analyses, economiccontribution studies, and integrated socio-economic simulation models. With the growingstate economy, many individual industries have requested research to determine theirabsolute and relative economic standing.
The purpose of this report is to provide an evaluation of the state’s economy andidentify those industries that comprise its economic base. Data provided in this report showthe amount of economic activity associated with each of the state’s basic economic sectors.This database covers five decades (1958-2010) and provides an indication of how the state’seconomy has grown and changed in composition during that period.
What is Economic Base?
Economic base is defined as the value of goods and services that are exported froman economic unit. Economic base also can be called a region’s export base becauseindustries (or “basic” sectors) earn income from outside the area. North Dakota’s economicbase is comprised of those activities producing a product or service purchased byindividuals, governments, and businesses located outside of the state. Dollars coming intothe respective basic sectors are also termed sales for final demand.
Economic base data were collected in conjunction with the development of the NorthDakota Input-Output Model. Research and development of the North Dakota Input-OutputModel was initiated in the 1960s. The model was developed to analyze the inter-sectorrelationships within the North Dakota economy. Expenditures data for various economicsectors were collected and a table of technical input-output interdependence coefficients wascreated. These coefficients, commonly known as multipliers, measure the number of timesan original dollar of basic economic activity “turns over” in the economy. For a completediscussion of the North Dakota Input-Output Model, see Coon et al. (1985).
Since the inception of the North Dakota Input-Output Model and its supportingdatabases, economic base activity for North Dakota has included agriculture (livestock andcrop production plus government payments for agricultural programs), mining,manufacturing, tourism, and federal government outlays in North Dakota. These activities
*Authors are Research Specialist, Research Scientist, and Research Assistant Professor, respectively,Department of Agribusiness and Applied Economics, North Dakota State University.

are classified into industrial categories called economic sectors. The North Dakota Input-Output Model contains 17 sectors, with 11 basic and 6 non-basic sectors. Economic basetheory suggests non-basic sectors of the economy essentially exist to serve and support thebasic sectors.
Description of Economic Base Sectors in North Dakota
North Dakota’s basic economic activity has been categorized into 11 economicsectors as follows: Agriculture, Livestock; Agriculture, Crops; Construction; AgriculturalProcessing and Miscellaneous Manufacturing; Retail Trade; Business and Personal Services;Households; Coal Mining; Coal Conversion; Petroleum and Natural GasExploration/Extraction; and Petroleum Refining. Data used to estimate the economic base,or sales for final demand, were obtained from a wide variety of sources. [For a detaileddescription of data sources and methodology, see Hertsgaard et al. (1977), Coon andLeistritz (2000), and Coon and Leistritz (2001)].
Agriculture, Livestock
Gross receipts from the sales of livestock and livestock products (e.g., milk)produced in the state comprise this sector. A primary consideration is that all livestock andlivestock products produced in North Dakota are assumed to be exported from the state. Processing of livestock products (i.e., miscellaneous livestock slaughtering and milkprocessing) are included in the agricultural processing miscellaneous manufacturing sector.Due to the limited number of processing plants in the state, agricultural processing andmiscellaneous manufacturing data were typically not published to avoid disclosingproprietary information. Because of the lack of agricultural processing data and therelatively small portion of total livestock products processed in the state, gross livestockreceipts were not reduced to compensate for processing activities. Also, bison productionand processing were not included in this sector due to the proprietary nature of the industrydata.
Agriculture, Crops
The Crops sector is comprised of the gross receipts from the sale of crops grown inthe state and includes federal government farm program payments. Government paymentsfor the Conservation Reserve Program are not included in this sector, but were included inthe Household sector. Crops produced in a specific year are assumed to be sold in thatrespective year. Crop sales are treated similar to livestock sales in that all receipts aretreated as exported from the state.
The processing of agricultural crops is included in the estimates of the economic basefor the Agriculture Processing and Miscellaneous Manufacturing sector. Processingactivities exist in the state for corn (ethanol and sweeteners), potatoes, sugarbeets, durumwheat, spring wheat, and sunflowers, in addition to other more minor crops. Unfortunately,data to accurately measure the level of those activities have not been available. Adjustmentsto the economic base for the inclusion of agricultural processing activities would involveremoving the value of crops processed in the state from the Crops sector. The Crops sector
2

has data problems similar to those of the Livestock sector for processing industries. Grosscrop receipts were not reduced to reflect crops processed in-state because of a lack of dataregarding the value and destination of the processed goods. Also, crops from other statescome into North Dakota for processing including corn, durum wheat, sugar beets,sunflowers, etc. Sales of processed crop products to in-state markets would not beconsidered economic base activity.
Construction
The economic base for the Construction sector consists of federal governmentexpenditures for construction projects. Historically, the largest federal constructionexpenditures have been for highway construction, but also have included various militaryprojects (i.e., projects occurring at the two Air Force Bases and National Guard and AirNational Guard facilities) and Environmental Protection Agency projects. One of the largestfederal government construction projects in the state was the building of the Anti-ballisticMissile Site in the Langdon area. Other federal construction includes flood mitigation and federal water resource projects (e.g., Garrison Dam, Baldhill Dam).
Local residential and commercial building construction is excluded, as would belocal and state road construction, as it is assumed those activities do not represent newdollars flowing into the state. Recent large-scale construction projects associated withexpansions in the petroleum sector (Bangsund and Leistritz 2007, 2009, 2010) (e.g., new gasplants, pipelines, housing projects) and the renewable energy sector (e.g., ethanol plants,wind farms) represent a mix of local and out-of-state investment dollars and are not includedin the economic base.
Agricultural Processing and Miscellaneous Manufacturing
Value of output from wholesale trade, agricultural processing, and miscellaneousmanufacturing comprise the economic base for the Agricultural Processing andMiscellaneous Manufacturing sector. Several large-scale manufacturing operations arecurrently located in the state producing farm equipment, construction equipment, windturbines, and processing crops grown in the state.
It is difficult to determine if the Agricultural Processing component of this sector hascaptured all of the state’s crops that have been converted to end-use products. North Dakotais surrounded by other agriculturally oriented states that produce similar crops, which cancome into the state for processing. Also, data were not available to determine the volume,value, or destination of the processed goods. For these reasons, the Crops and Livestocksectors gross sales were not reduced to reflect in-state processing, as discussed in thoserespective sector definitions. Production of electricity and synthetic natural gas was notincluded in the Agricultural Processing and Miscellaneous Manufacturing sector, but ratheris in the Coal Conversion sector. Products and materials produced in North Dakota but soldto in-state markets also were not included.
3

Retail Trade
The economic base for the Retail Trade sector consists of 75 percent of the estimatedtourism expenditures in the state. (The other 25 percent is assigned to the Business andPersonal Services Sector). Tourism expenditures are only for out-of-state visitors who havecome to North Dakota for such activities as shopping, vacationing, hunting and fishing,casino visits, athletic events, concerts, and other attractions and events. Spending fromNorth Dakota residents for travel and tourism activities within the state are not consideredeconomic base activity, nor is other general retail trade associated with expenditures fromin-state businesses and individuals.
Business and Personal Services
As previously mentioned, 25 percent of tourism expenditures were allocated to thissector. Business and Personal Services include expenditures such as food and lodgingaccommodations, guides/tour services, and transportation (e.g., airlines, taxi, car rentals). Exported services were added to this sector in 1998 due to growth in those activities inNorth Dakota. Exported services include telemarketing, data processing, reservation centers,bank service centers, and software service centers. Business and personal services for in-state residents is not considered economic base activity. Some firms in North Dakota (e.g.,consulting firms, engineering firms) also may provide services out of the state, but data toquantify those exported services are not available.
Households
The households sector represents economy-wide personal income. Federalgovernment payrolls and transfer payments represent new dollars flowing to households inNorth Dakota. Total federal transfers and payments to North Dakota were calculated bysubtracting all federal construction expenditures (as previously discussed) and agriculturalprogram payments from estimates of total federal government outlays to the state.Conservation Reserve Program payments were added to this sector in 1987. Lease-bonusand royalty payments associated with mineral leases on private property were added to thissector in 1979. Common federal transfers include social security, medicare, medicaid, andother federally funded programs providing financial assistance to individuals. Income frominvestments and assets located out-of-state but owned by North Dakota residents areexcluded in the economic base estimations.
Coal Mining
Total receipts from sales of coal to non-local markets comprise the Coal Miningsector’s economic base. The value of coal mined in the state but used to generate electricityor synthetic natural gas at plants in North Dakota is captured in the Coal Conversion sector.Coal sold to in-state markets for use in processing, manufacturing, or other energy-generating operations is not considered economic base activities.
4

Coal Conversion
The economic base for the Coal Conversion sector consists of the production ofelectricity and synthetic natural gas from lignite coal mined in North Dakota. Only the salesof electricity and synthetic natural gas, generated in North Dakota from coal, to out-of-statemarkets is included.
The value of electricity produced from coal-powered plants in North Dakota consumed by in-state uses is excluded from the economic base figures. Hydro-electric powergenerated by Garrison Dam is not part of North Dakota’s economic base because it isfederally-owned electricity. Also, electricity produced from wind farms is not included inthe economic base because data are not yet available to determine the amount and end-uselocation of this electricity.
Petroleum and Natural Gas Exploration and Extraction
The value of crude oil production in North Dakota comprises the economic base forthis sector. Since some crude oil produced in North Dakota is refined at the state’s onlyrefinery (located in Mandan), adjustments to the economic base in this sector are performedto avoid double counting of the oil that is processed in North Dakota. Lease-bonus androyalty payments are part of the Petroleum sector but are included in the Households sector.
The value of natural gas processed in the state has historically been excluded fromthe economic base because the state has been a net importer of natural gas. Recentexpansions in the oil patch suggest much larger volumes of natural gas will be processed; assuch, North Dakota will likely become a net exporter of natural gas. At that point, the valueof natural gas exported from the state will become part of the state’s economic base and willbe added to this sector.
Petroleum Refining
North Dakota currently has one operating petroleum refinery located in Mandan. Thegross value of all of the refined products from the Mandan refinery is included in theeconomic base figures. The Mandan refinery expanded in the late 1970s, and is currentlypreparing for another expansion project to meet the demands of the state’s increasing oilproduction.
5

Adjustments to the Economic Base
Estimates of North Dakota’s economic base represent a comprehensive measure ofthe value of exports from the state’s economy. In-state sales and intra-state transfers do notqualify as economic base activities, as discussed in the previous section. Economic base, bydefinition, excludes output from basic sector industries if that output is consumed within thestate rather than being exported. Other exclusions may represent omissions of economicactivity, which for various reasons, were not included in the economic base figures.
Omissions and Exclusions
Omissions result in the economic base for North Dakota being underestimated and basic-sector industries not being included in the economic base. Therefore, economic baseestimates have the potential to generate a smaller economic profile for some industries thanwhat might be generated with other economic analyses (e.g., economic contribution studies).
The following are examples of possible omissions from the current economic basefigures, which could potentially increase the size of the state’s economic base:
- value of wind-generated electricity exported from North Dakota- investment income to households- tuition paid by non-resident students at North Dakota universities and colleges- private and non-federal research dollars from outside entities to in-state universities and colleges
Although these omitted items probably represent a very small number of dollarscompared to the current economic base estimate, including such data would increase theaccuracy of the economic base estimate for the state.
Data Base Validation
North Dakota’s economic base data have been calculated to correspond with theNorth Dakota Input-Output Model’s sectors. These sectors were originally selected torepresent the major economic delineations in the state and were defined using the StandardIndustrial Classification Manual (SIC) (Office of Management and Budget 1972). Since theoriginal development of the North Dakota Input-Output Model, SIC codes have beenreplaced with the North American Industry Classification System (NAICS) (U.S. Bureau ofthe Census 2002).
When the sales for final demand are applied to the North Dakota Input-OutputModel, the product is a measure of the total amount of business activity for the state’seconomy (gross business volume). The model develops an estimate of total activity in theHousehold sector which is, by definition, economy-wide personal income. The validity testfor the model and the economic base data is to compare estimates of economy-wide personalincome from the North Dakota Input-Output Model with published estimates of economy-wide personal income from the Bureau of Economic Analysis (2012). Differences betweenthe estimates of personal income from the two sources suggest the economic base data set
6

and North Dakota Input-Output Model are accurate in predicting economic activity andpersonal income in the state. Absolute average difference was 7.5 percent, mean differencewas -3.90 percent, and Theil’s U1 coefficient was 0.0433 for the 1958 to 2010 period (Coonet al. 2012).
Evaluating Changes in North Dakota’s Economic Base
The economic base, or sales for final demand, for North Dakota has been compiledfor the 1958-2010 period (Appendix A). All numbers in that table are presented in currentyear, or nominal dollars (i.e., in terms of the purchasing power of the dollar for therespective year). Economists tend to show economic growth for a time series in terms ofconstant or base dollars. Using constant dollars removes the effects of inflation and changesare termed “real” growth. To convert the current dollar sales for final demand to constantdollar values, Gross Domestic Product Implicit Price Deflators were used (Appendix B).
North Dakota’s economic base has grown from $8.3 billion in 1990 to $32.2 billionin 2010 in nominal dollars (Table 1). In real terms, (constant 2010 dollars), the economicbase for North Dakota grew from $12.8 billion in 1990 to $32.2 billion in 2010. A sector’sshare of the total economic base for any respective year is the same for current or constantdollars. Agriculture’s share of the economic base was 37.1 percent in 1990, but despitesignificant growth, had declined to 23.1 percent by 2010. Petroleum exploration/extractionand refining increased their share from 5.8 percent in 1990 to 9.7 percent in 2010. Thehousehold sector remained relatively stable for the period comprising 35.0 percent of theeconomic base in 1990, 27.8 percent in 2000, and 35.7 percent in 2010. These selected yearsprovide snapshots of the state’s economy at various points in time, while the completedatabase (Appendix A) can more appropriately show long-term trends. The Agriculture andPetroleum sectors vary greatly from year-to-year because of changes in production andproduct prices.
7
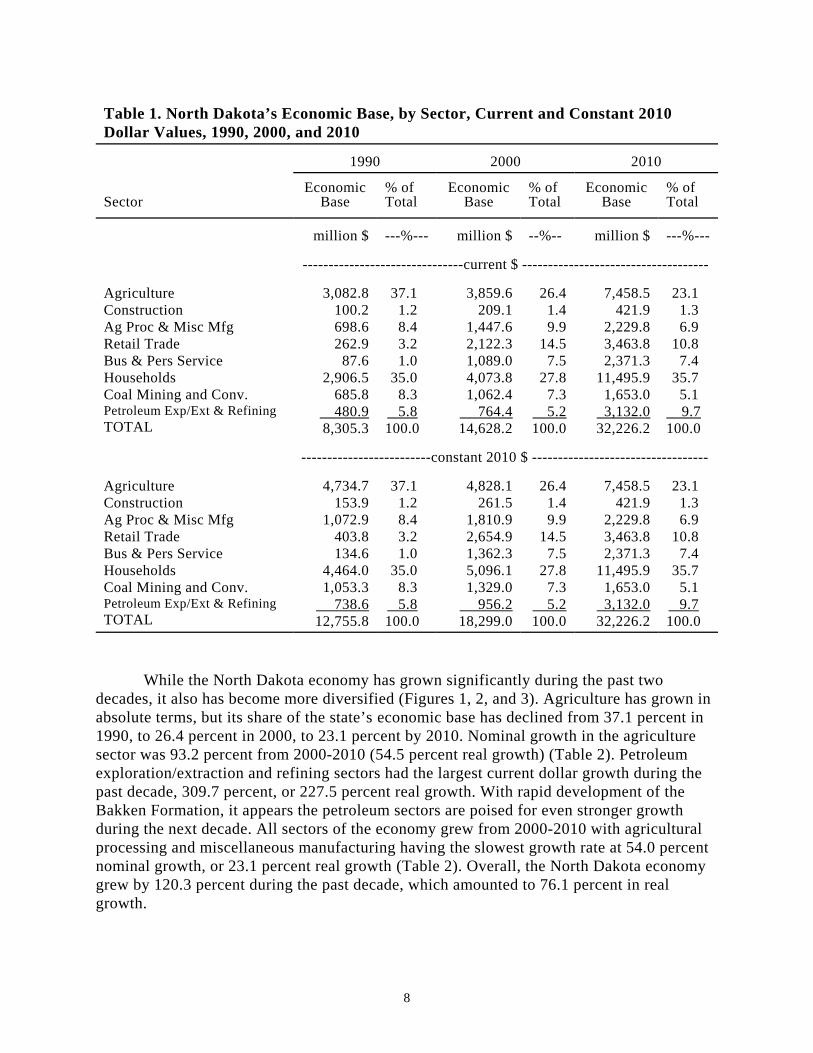
Table 1. North Dakota’s Economic Base, by Sector, Current and Constant 2010Dollar Values, 1990, 2000, and 2010
1990 2000 2010
SectorEconomic
Base% ofTotal
EconomicBase
% ofTotal
EconomicBase
% ofTotal
million $ ---%--- million $ --%-- million $ ---%---
-------------------------------current $ ------------------------------------
AgricultureConstructionAg Proc & Misc MfgRetail TradeBus & Pers ServiceHouseholdsCoal Mining and Conv.Petroleum Exp/Ext & RefiningTOTAL
3,082.8100.2698.6262.9
87.62,906.5
685.8 480.98,305.3
37.11.28.43.21.0
35.08.3
5.8100.0
3,859.6209.1
1,447.62,122.31,089.04,073.81,062.4
764.414,628.2
26.41.49.9
14.57.5
27.87.3
5.2100.0
7,458.5421.9
2,229.83,463.82,371.3
11,495.91,653.0
3,132.032,226.2
23.11.36.9
10.87.4
35.75.1
9.7100.0
-------------------------constant 2010 $ ----------------------------------
AgricultureConstructionAg Proc & Misc MfgRetail TradeBus & Pers ServiceHouseholdsCoal Mining and Conv.Petroleum Exp/Ext & RefiningTOTAL
4,734.7153.9
1,072.9403.8134.6
4,464.01,053.3
738.612,755.8
37.11.28.43.21.0
35.08.3
5.8100.0
4,828.1261.5
1,810.92,654.91,362.35,096.11,329.0
956.218,299.0
26.41.49.9
14.57.5
27.87.3
5.2100.0
7,458.5421.9
2,229.83,463.82,371.3
11,495.91,653.0
3,132.032,226.2
23.11.36.9
10.87.4
35.75.1
9.7100.0
While the North Dakota economy has grown significantly during the past twodecades, it also has become more diversified (Figures 1, 2, and 3). Agriculture has grown inabsolute terms, but its share of the state’s economic base has declined from 37.1 percent in1990, to 26.4 percent in 2000, to 23.1 percent by 2010. Nominal growth in the agriculturesector was 93.2 percent from 2000-2010 (54.5 percent real growth) (Table 2). Petroleumexploration/extraction and refining sectors had the largest current dollar growth during thepast decade, 309.7 percent, or 227.5 percent real growth. With rapid development of theBakken Formation, it appears the petroleum sectors are poised for even stronger growthduring the next decade. All sectors of the economy grew from 2000-2010 with agriculturalprocessing and miscellaneous manufacturing having the slowest growth rate at 54.0 percentnominal growth, or 23.1 percent real growth (Table 2). Overall, the North Dakota economygrew by 120.3 percent during the past decade, which amounted to 76.1 percent in realgrowth.
8

2000
Ag26.4%
Constr1.4%
AP & MM9.9%
Retail Trade14.5%
B&PS7.4%
HH27.8%
Coal Min & Conver7.3%
Pet Exp/Ext & Refin5.2%
AgConstrAP & MMRetail TradeB&PSHHCoal Min & ConverPet Exp/Ext & Refin
Figure 2. Composition of North Dakota's Economic Base, by Economic Sector, 2000.
Ag37.1%
Constr1.2%
AP & MM8.4%
Retail Trade3.2%
B&PS1.1%
HH35.0%
Coal Min & Conv8.3%
Petr Exp/Ext & Refin5.8%
AgConstrAP & MMRetail TradeB&PSHHCoal Min & ConvPetr Exp/Ext & Refin
1990
Figure 1. Composition of North Dakota's Economic Base, by Economic Sector, 1990.
9

Table 2. Nominal (Current Dollars) and Real (Constant 2010 Dollars) Economic BaseGrowth for North Dakota, 2000-2010
Nominal Economic BaseGrowth
Real Economic BaseGrowth
Sector 2000-2010 2000-2010
--------%------- --------%-------
AgricultureConstructionAg Proc & Misc MfgRetail TradeBus & Pers ServiceHouseholdsCoal Mining and ConversionPet Exp/Ext and Refining
93.2101.8 54.0 63.2117.8182.2 55.6309.7
54.5 61.3 23.1 30.5 74.1125.6 24.4227.5
TOTAL 120.3 76.1
Ag23.1%
Constr1.3%
AP & MM6.9%
Retail Trade10.7%
B&PS7.4%
HH35.7%
Coal Min & Conv5.1%
Petro Exp/Ext & Refin9.7%
AgConstrAP & MMRetail TradeB&PSHHCoal Min & ConvPetro Exp/Ext & Refin
2010
Figure 3. Composition of North Dakota's Economic Base, by Economic Sector, 2010.
10

When analyzing North Dakota’s economic base, it is sometimes more meaningful torealign the values into industrial categories. Industrial categories represent alignments basedon the activities generating the sales to final demand rather than on the allocation of thosevalues to input/output sectors. For example, petroleum lease/bonus payments would nolonger be a part of the household sector but would instead be included with petroleumexploration/extraction and refining. Retail Trade and Business and Personal Services sectors(estimated by dividing up tourism expenditures) were combined to produce the originaltourism value. Exported services which were included with the business and personalservices sector are presented as a separate industry. Federal payments would include federalexpenditures for construction projects in the state, wages and salaries for federal workers,transfer payments, and Conservation Reserve Program payments. This alignment of theeconomic base provides perhaps the most useful groupings to aid decision makers and thegeneral public in understanding of the composition of the state’s economy.
The economic base for North Dakota, delineated by industrial categories, provides adifferent look at the economy than that presented using input-output sectors (Table 3).Composition of the state’s economic base for 1990, 2000, and 2010 is presented graphicallyin Figures 4, 5, and 6, respectively. Agriculture’s share of the economic base has declinedfrom 37.1 percent in 1990 to 23.1 percent in 2010. Absolute size of the economic base foragriculture has actually grown from 1990 to 2010; however, agriculture’s relative share ofthe economy has declined due to greater relative growth in other parts of the economy.Federal outlays in North Dakota also have realized a declining share of the economic baseduring the past two decades, but like agriculture, Federal outlays have grown in absoluteterms during that period. Petroleum exploration/extraction and refining industries haveshown significant growth in absolute terms and in their relative share of the state’seconomy. These industries have grown from 7.2 percent of the state’s economic base in1990 to 22.7 percent by 2010. Recent changes in the state’s economic base have resulted inagriculture and petroleum having nearly equal shares of the economic base in 2010, withFederal outlays at 24.1 percent, agriculture at 23.1 percent, and petroleum activities at 22.7percent. Tourism had the fourth largest share of the economic base at 14.3 percent in 2010.These four industries make up 84.2 percent of the state’s basic economic activity. Coalmining and conversion activities has had a slight decline in its relative share of the stateeconomic base, but has continued to be a stable industry with consistent growth during thepast two decades.
Natural resource based activities (agriculture, coal, and petroleum activities)comprised 52.6 percent of the state’s economic base in 1990 with a slight decline by 2010(50.9 percent). Despite growth in these industries, the decline in their relative shareindicates that efforts to diversify the state’s economy have been successful as the economicbase grew from $8.3 billion in 1990 to $32.2 billion in 2010 in current year dollars ($12.7billion to $32.2 billion in real 2010 dollars). Recent growth in the petroleum industry hasjust begun to show up in the economic base data set. Oil production is increasing rapidly andcontinued development of the Bakken/Three Forks formations could lead to significantincrease in its share of the state’s economic base in the future. Based on efforts to diversifythe economy and continued growth in its natural resource based industries, North Dakota’seconomic base is poised for continual strong growth in the future.
11

12
Table 3. North Dakota’s Economic Base, by Industrial Category, Current and Constant Dollars, Selected Years 1990 - 2010
Industry
Year AgricultureManufac-
turingCoal Mining
& ConversionOil Exp., Ext. & Refining Tourism
ExportedServices
AllPrimary
Industries
FederalPayments Total
-----------------------------------------------------million current dollars---------------------------------------------------------------------
1990
1995
2000
200520062007200820092010
3,082.8
3,450.0
3,859.6
4,789.04,433.85,883.08,140.07,079.97,458.5
698.6
1,014.4
1,447.6
1,895.41,982.62,077.82,204.62,010.62,229.8
685.8
815.4
1,062.4
1,490.61,559.31,573.71,819.01,655.61,653.0
599.9
505.9
1,010.2
2,104.52,736.43,352.85,493.35,108.17,303.0
350.5
810.1
2,829.7
3,603.53,783.63,961.54,131.84,364.44,618.4
- -
- -
381.6
924.71,023.61,068.11,113.91,102.61,216.7
5,417.6
6,595.8
10,591.1
14,807.715,519.317,916.922,902.621,312.224,479.4
2,887.7
3,678.1
4,037.1
5,598.35,439.55,920.16,127.17,051.07,746.8
8,305.3
10,273.9
14,628.2
20,406.020,958.823,837.029,029.728,372.232,226.2
----------------------------------------------million constant 2010 dollars---------------------------------------------------------------
1990 4,734.8 1,072.9 1,053.3 921.4 538.3 - - 8,320.7 4,435.1 12,755.8
1995 4,692.6 1,379.7 1,109.1 688.1 1,101.9 - - 8,971.4 5,002.9 13,974.3
2000
200520062007200820092010
4,828.1
5,315.24,767.06,146.78,320.67,161.57,458.5
1,810.9
2,103.72,131.62,170.92,253.52,033.82,229.8
1,329.0
1,654.41,676.51,644.21,859.31,674.71,653.0
1,263.7
2,335.72,942.13,503.15,615.15,167.07,303.0
3,539.8
3,999.44,067.94,139.14,223.54,414.74,618.4
477.3
1,026.31,100.51,116.01,138.61,115.31,216.7
13,248.8
16,434.716,685.618,720.023,410.621,567.024,479.4
5,050.2
6,213.45,848.36,185.56,263.07,132.37,746.8
18,299.0
22,648.122,533.924,905.529,673.628,699.332,226.2

Ag26.4%
Manuf9.9%
Coal Min & Conv7.3%
Oil Exp, Ext & Refin6.9%
Tourism19.3%
Exported Serv2.6%
Fed Pymts27.6%
AgManufCoal Min & ConvOil Exp, Ext & RefinTourismExported ServFed Pymts
Figure 5. Composition of North Dakota's Economic Base, by Industrial Categories, 2000.
2000
Ag37.1%
Manuf8.4%
Coal Min & Conv8.3%
Oil Exp, Ext & Refin7.2%
Tourism4.2%
Fed Pymts34.8%
Ag
Manuf
Coal Min & Conv
Oil Exp, Ext & Refin
Tourism
Fed Pymts
Figure 4. Composition of North Dakota's Economic Base, by Industrial Categories, 1990.
1990
13

Economic Base, Economic Impact, and Economic Contribution Analyses
The North Dakota Input-Output Model and associated economic base data haveprovided a tool for development of econometric models and analytical techniques. Input-output analysis provides a technique for performing economic impact and economiccontribution analyses, and was the key component of several integrated economic-demographic-fiscal forecasting models developed at NDSU. The North Dakota Input-OutputModel was originally developed to analyze the economic impact of irrigation resulting fromthe Garrison Diversion Project (Coon et al 1985) but has been adapted for many other uses.It is the basic component of several large economic-demographic computer modelsincluding NEDAM (Leistritz et al 1982), REAP E-D Model (Hertsgaard et al 1978), andMEDAM (Coon et al 1993).
Input-Output analysis provides a tool for economists to perform economic impact andeconomic contribution analyses. These analyses can be applied to programs, projects,developments, industries, and other economic activities. Key macro-economic indicatorssuch as retail trade activity, economy-wide personal income, total business activity,secondary economic business activity, selected state tax collections, and secondary (indirectand induced) employment can be estimated using input-output analysis.
Economic base represents dollars coming into the economy in exchange for exportedgoods and services. These dollars are used to purchase inputs and services that support thebasic sector industries, and through the acquisition of those inputs and services, create and
Ag23.1%
Manuf6.9%
Coal Min & Conv5.1%
Oil Exp, Ext & Refin22.7%
Tourism14.3%
Exported Serv3.8%
Fed Pymts24.1%
AgManufCoal Min & ConvOil Exp, Ext & RefinTourismExported ServFed Pymts
Figure 6. Composition of North Dakota's Economic Base, by Industrial Categories, 2010.
2010
14

sustain secondary (non-basic) industries. An economic impact analysis estimates the changein key economic indicators resulting from the “new” dollars a specific project ordevelopment would bring into the state (or local economy). An economic impact analysismeasures the net effect of two possible situations–often these situations would be thepresence or absence of some type of economic activity, development, or program. Aneconomic contribution analysis differs in that it looks at all local expenditures and theamount of activity they create in an economic unit. Typically an economic contributionanalysis will produce more economic activity than an economic impact study for the sameindustry or activity. Economic contribution analyses attempt to capture all economic activitywithout regard to the net change or value of alternative economic activities. Whencomparing these economic analyses, it is important to know what type of study wasconducted so valid comparisons can be made. For a detailed discussion of these types ofanalyses, see Leistritz (1994) and Leistritz (1998).
Summary
Developing a database that measures the North Dakota economy has providedvaluable information for economists, policy makers, and industry leaders. The intent of thisreport was to provide highlights of this data base to those in the state who typically requestsuch information. A brief description and definition of the component of the state’seconomic base also has been provided to help the reader understand the data presented.
North Dakota’s economic base has increased significantly during the past twodecades, growing from $8.3 billion in 1990 to $32.2 billion in 2010 (in nominal dollars). Inreal dollars the growth during this period was from $12.8 billion to $32.2 billion.Agriculture has continued to grow in the state, but its portion of the growing state economyhas been reduced from 37.1 percent in 1990 to 23.1 percent in 2010. Petroleum industrieshave grown rapidly in recent years and the development of the Bakken Formation couldincrease these sectors at an even faster rate in the near future. Comparing the economiccontribution of separate industries is highly dependent upon how the specific industries aredefined. This report shows the economic base for sectors corresponding to the input-outputmodel delineations (sales for final demand) and also by industrial categories. This providesanother view of the relative contributions of individual components of the North Dakotaeconomy.
The North Dakota Input-Output Model provided the framework for collecting adatabase for measuring the state’s economy. It also provided an economic tool for analyzingeconomic impacts and economic contribution that specific industries or projects make to thestate’s economy. Measuring these projects in terms of economic indicators has providedvaluable information for state and industry officials.
15

References
Bangsund, Dean A. and F. Larry Leistritz. 2010. Economic Contribution of the PetroleumIndustry to North Dakota. Agribusiness and Applied Economics Report No. 676. Department of Agribusiness and Applied Economics, North Dakota State University,Fargo.
Bangsund, Dean A. and F. Larry Leistritz. 2009. Petroleum Industry’s EconomicContribution to North Dakota in 2007. Agribusiness and Applied Economics ReportNo. 639 & 639-S. Department of Agribusiness and Applied Economics, NorthDakota State University, Fargo.
Bangsund, Dean A. and F. Larry Leistritz. 2007. Economic Contribution of the PetroleumIndustry to North Dakota. Agribusiness and Applied Economics Report No. 559 &559-S. Department of Agribusiness and Applied Economics, North Dakota StateUniversity, Fargo.
Bureau of Economic Analysis. 2012. Personal Income by Major Sources and Earning byIndustry. Table SAO5. Internet Website Interactive Tables. Washington, D.C.: U.S.Department of Commerce.
Coon, Randal C., F. Larry Leistritz, Thor A. Hertsgaard, and Arlen G. Leholm. 1985. TheNorth Dakota Input-Output Model: A Tool for Analyzing Economic Linages.Agricultural Economics Report No. 187. Fargo: North Dakota State University,Department of Agricultural Economics.
Coon, Randal C., Rita R. Hamm, and F. Larry Leistritz. 1993. North Dakota MicrocomputerEconomic-Demographic Assessment Model (MEDAM): Users Guide and TechnicalDescription. Agricultural Economics Software Series No. 8. Fargo: North DakotaState University, Department of Agricultural Economics and Institute for Businessand Industry Development.
Coon, Randal C. and F. Larry Leistritz. 2000. Procedures and Data Sources for EstimatingNorth Dakota Final Demand Vectors. Unpublished Data. Fargo: North Dakota StateUniversity, Department of Agricultural Economics.
Coon, Randal C. and F. Larry Leistritz. 2001. Adding an Exported Services Component tothe North Dakota Input-Output Model’s Business and Personal Services Sector.Agribusiness and Applied Economics Misc. Report No. 189. Fargo: North DakotaState University, Department of Agribusiness and Applied Economics.
Coon, Randal C., Dean A. Bangsund, and Nancy M. Hodur. 2012. North Dakota Input-Output Model Data Base. Unpublished data. Fargo: North Dakota State University,Department of Agribusiness and Applied Economics.
16

Hertsgaard, Thor A., Randal C. Coon, F. Larry Leistritz, and Norman L. Dalstad. 1977.Developing Economic Impact Projection Models for the Fort Union Coal Region.EPA Report No. 77030. Fargo: North Dakota State University, Department ofAgricultural Economics.
Hertsgaard, Thor A., Steve Murdock, Norm Toman, Mark Henry, and Richard Ludke. 1978.REAP Economic Demographic Model: Technical Description. No. 78-1. Bismarck:North Dakota Regional Environmental Assessment Program.
Leistritz, F. Larry. 1998. Economic and Fiscal Impact Assessment. Book Chapter 26 fromEnvironmental Methods Review: Retooling Impact Assessment for the New Century,A. Porter and J. Fittipaldi, editors. International Association for Impact Assessmentand Army Environmental Policy Institute, Georgia Institute of Technology. Fargo,ND: The Press Club Publishers.
Leistritz, F. Larry. 1994. Economic and Fiscal Impact Assessment. AE94004. Fargo: NorthDakota State University, Department of Agricultural Economics.
Leistritz, F. Larry, William Ransom-Nelson, Richard W. Rathge, Randal C. Coon, Robert A.Chase, Thor A. Hertsgaard, Steve H. Murdock, Norman E. Toman, Rakesh Sharma,and Pai-Sung Yang. 1982. North Dakota Economic-Demographic Assessment Modeal(NEDAM): Technical Description. Agricultural Economics Report No. 158. Fargo:North Dakota State University, Department of Agricultural Economics.
Office of Management and Budget. 1972. Standard Industrial Classification Manual.Prepared by the Statistical Policy Division. Washington, D.C.: U.S. GovernmentPrinting Office.
U.S. Bureau of the Census. 2002. North American Industry Classification System (NAICS).National Technical Information Service. Washington, D.C.: U.S. GovernmentPrinting Office.
U.S. Department of Commerce, Bureau of Economic Analysis. 2011. Survey of CurrentBusiness, online. Volume 91, No. 11. Washington, D.C.
17

Appendix A

SALES FOR FINAL DEMAND, BY ECONOMIC SECTOR, NORTH DAKOTA, MILLION DOLLARS (CURRENT DOLLARS), 1958-2010
Year
(1)
Ag Lvstk
(2)
Ag Crops
(4)
Constr
(7)Ag Proc &Misc Mfg
(8)RetailTrade
(10)Bus & PersServ
(12)
Households
(14)Coal
Mining
(15)Coal
Conversion
(16)Pet
Exp/Ext
(17)Pet
Refining Total
19581959196019611962
220.3217.3175.4213.9199.3
440.3394.9390.9341.7476.8
18.327.232.724.016.5
62.557.066.167.562.6
16.518.014.917.218.7
5.56.05.05.86.3
187.0186.5187.9237.2344.2
1.11.01.01.31.5
- -- -- -- -- -
5.4 10.9 14.5 21.0 22.8
13.1 12.9 12.5 12.6 12.5
970.0931.7900.9942.2
1,161.2
19631964196519661967
207.7213.3247.5271.5280.9
543.1451.2554.5609.4568.4
17.130.231.023.324.4
73.078.478.484.291.7
21.726.233.045.054.7
7.28.7
11.015.018.2
334.5485.2361.4428.6380.8
1.31.51.51.32.1
- -- -- -
4.4 8.4
23.325.928.029.728.0
12.512.713.414.014.6
1,241.41,333.31,359.71,526.41,472.2
19681969197019711972
264.2265.0272.5304.7376.4
570.5641.8671.0673.7975.0
27.035.2
182.160.772.9
101.5162.0148.1162.0170.0
69.775.885.793.886.3
23.225.328.531.328.8
447.9501.5567.7605.1649.0
2.42.43.23.53.3
12.311.713.817.521.4
34.326.230.332.934.6
14.714.915.215.916.8
1,567.71,761.82,018.12,001.12,434.5
19731974197519761977
475.9448.5452.8484.3483.3
1,795.72,072.11,555.81,194.31,178.6
61.672.482.944.951.7
243.0304.8306.6467.2408.1
94.592.6
112.5134.2143.6
31.531.137.544.847.8
726.7806.0
1,046.91,066.71,076.7
4.14.97.1
16.018.2
19.322.420.638.646.3
38.476.184.3
100.8102.0
19.122.625.027.029.2
3,509.83,953.53,732.03,618.83,585.5
19781979198019811982
529.4694.1781.4594.0604.5
1,615.21,692.61,721.62,339.52,306.0
65.878.0
108.178.856.0
435.8523.8562.2616.3526.5
165.0147.5144.5160.4167.2
54.949.248.253.555.7
1,157.81,381.91,687.41,896.51,598.2
22.032.248.354.557.8
65.491.6
120.1140.8162.0
108.5182.5410.4973.1857.3
30.846.974.3
131.8121.3
4,250.64,920.35,706.57,039.26,512.5
19831984198519861987
662.7690.3698.3675.8795.0
2,607.22,317.12,586.22,323.42,258.4
79.7111.6102.5
96.981.5
537.0572.5584.3587.8610.8
196.4176.8190.1193.9207.1
65.558.963.364.669.1
1,936.52,131.72,205.32,275.52,314.9
76.796.3
136.9127.5120.2
196.4226.3261.5261.3498.6
782.8719.9615.4275.2320.4
112.8109.4101.8
81.487.9
7,253.77,210.87,545.66,963.37,363.9
19881989199019911992
849.3642.2813.5699.2754.9
2,490.11,940.42,269.32,390.82,781.9
94.978.2
100.2113.3135.4
653.5686.2698.6730.0788.4
219.6237.1262.9290.5326.8
73.279.187.696.8
108.9
2,379.02,673.92,906.52,972.33,223.7
118.4145.0142.2141.0146.8
569.8535.6543.6565.5623.3
243.9296.3354.5308.6275.8
89.7104.9126.4113.6110.0
7,781.47,418.98,305.38,421.69,275.9
19931994199519961997
706.5627.3565.7538.6597.7
2,791.52,764.72,884.33,244.03,023.6
124.1120.6149.6106.3155.2
803.0909.8
1,014.41,100.61,212.9
398.7478.4607.6796.0
1,058.6
132.9159.5202.5265.3352.9
3,333.13,662.43,631.53,665.74,139.6
157.1160.7165.9153.8151.6
655.7660.5649.5698.5694.4
235.2208.7299.4416.3483.2
106.8101.0103.5122.1117.8
9,444.69,853.6
10,273.911,107.211,987.5
- - continued - -
SALES FOR FINAL DEMAND, BY ECONOMIC SECTOR, NORTH DAKOTA, MILLION DOLLARS (CURRENT DOLLARS), 1958-2010 cont.

Year
(1)
Ag Lvstk
(2)
Ag Crops
(4)
Constr
(7)Ag Proc &Misc Mfg
(8)RetailTrade
(10)Bus & PersServ
(12)
Households
(14)Coal
Mining
(15)Coal
Conversion
(16)Pet
Exp/Ext
(17)Pet
Refining Total
19981999200020012002
554.7633.3639.4726.7797.5
2,968.43,066.23,220.23,131.72,928.1
167.9198.6209.1206.9253.3
1,313.61,361.81,447.61,480.91,512.0
1,429.11,965.02,122.32,220.92,297.7
769.21,003.41,089.01,368.81,447.6
3,785.13,796.14,073.84,529.34,697.7
149.8155.8155.2156.5160.7
739.9735.5907.2914.0933.5
303.5384.1576.7445.2482.6
104.3124.5187.7171.9156.7
12,285.513,424.314,628.215,352.815,667.4
20032004200520062007
870.2938.3989.1892.4956.7
3,559.33,619.63,799.93,541.44,926.3
228.3233.5280.8279.8283.4
1,616.31,773.11,895.41,982.62,077.8
2,414.92,518.72,702.62,837.72,971.1
1,643.31,759.91,825.61,969.52,058.5
5,080.85,465.65,842.05,855.96,615.1
166.1183.1192.6225.5233.6
975.7957.4
1,298.01,333.81,340.1
536.3756.0
1,244.01,678.71,980.0
192.8246.8336.0361.5394.4
17,284.018,452.020,406.020,958.823,837.0
200820092010
912.4784.6957.2
7,227.66,295.36,501.3
276.3336.9421.9
2,204.62,010.62,229.8
3,098.83,273.33,463.8
2,146.92,193.72,371.3
8,273.710,042.011,495.9
260.1290.5285.6
1,558.91,365.11,367.4
2,559.61,461.82,736.5
510.8318.4395.5
29,029.728,372.232,226.2
(Note: 1998 - 2010 Bus & Pers Serv Sector includes exportable services component)
Source: Coon, Randal C., Dean A. Bangsund, and Nancy M. Hodur. 2012. North Dakota Input-Output Model Data Base. Unpublished data. Fargo: North Dakota State University, Department ofAgribusiness and Applied Economics.

Appendix B

GROSS DOMESTIC PRODUCT IMPLICIT PRICE DEFLATORS FOR 2005 AND 2010 BASE, 1958-2010
YearGDP Implicit Price Deflators
2005 = 100 Base 2010 = 100 Base
19581959196019611962
17.9118.3418.6018.8119.06
16.1416.5216.7616.9517.17
19631964196519661967
19.2719.5619.9220.4821.12
17.3617.6217.9518.4519.03
19681969197019711972
22.0123.1024.3225.5326.63
19.8320.8121.9123.0023.99
19731974197519761977
28.1130.6633.5635.4937.75
25.3327.6230.2431.9834.01
19781979198019811982
40.4043.7647.7552.2355.41
36.4039.4343.0247.0649.92
19831984198519861987
57.6059.7761.5862.9464.76
51.9053.8555.4856.7158.35
19881989199019911992
66.9969.5272.2074.7676.53
60.3662.6465.0567.3668.95
19931994199519961997
78.2279.8781.5483.0984.56
70.4771.9673.4774.8676.19
19981999200020012002
85.5186.7788.6590.6592.12
77.0478.1879.8781.6783.00
20032004200520062007
94.1096.77
100.00103.23106.23
84.7887.1990.1093.0195.71
- continued -
22

GROSS DOMESTIC PRODUCT IMPLICIT PRICE DEFLATORS FOR 2005 AND 2010 BASE, 1958-2010continued
YearGDP Implicit Price Deflators
2005 = 100 Base 2010 = 100 Base
200820092010
108.58109.73110.99
97.8398.86100.0
Source: U.S. Department of Commerce, Bureau of Economic Analysis. November 2011. Survey of CurrentBusiness, online. Volume 91, No.11. Washington, D.C.
23