North Dakota Workforce Development Needs Assessment and ... · North Dakota Workforce Development...
47
North Dakota Workforce Development Needs Assessment and Gap Analysis January 2017 Prepared for: North Dakota State Board of Higher Education North Dakota University System North Dakota Department of Public Instruction North Dakota Higher Education Committee By: Workforce Education Advisory Council
Transcript of North Dakota Workforce Development Needs Assessment and ... · North Dakota Workforce Development...

North Dakota Workforce Development
Needs Assessment and Gap Analysis
January 2017
Prepared for:
North Dakota State Board of Higher Education
North Dakota University System
North Dakota Department of Public Instruction
North Dakota Higher Education Committee
By:
Workforce Education Advisory Council

Contents From the Chairman ....................................................................................................................................... 3
Introduction .................................................................................................................................................. 4
General Information and Findings ................................................................................................................ 6
Limitations of Information Gathering Processes ...................................................................................... 7
General Information ................................................................................................................................. 8
General Recommendations .................................................................................................................... 13
Industry Reports.......................................................................................................................................... 17
Energy ..................................................................................................................................................... 18
Limitations and Caveats of the Findings ............................................................................................. 19
Comparison of Oil and Gas Companies in North Dakota .................................................................... 19
Energy Workforce Composition – 2016 .............................................................................................. 19
Energy Findings and Recommendations ............................................................................................. 21
Findings ............................................................................................................................................... 21
Recommendations .............................................................................................................................. 22
Information Technology .......................................................................................................................... 23
Information Gathering Methods ......................................................................................................... 23
Limitations and Caveats of the Findings ............................................................................................. 23
Snapshot of Information Technology in North Dakota ....................................................................... 23
Current Demographics ........................................................................................................................ 24
Anticipated Changes in Demand and Implications for Education/Competencies by 2021 ................ 26
Changes in Knowledge, Skills, and Abilities (KSA)/Competencies ...................................................... 28
Information Technology Findings and Recommendations ................................................................. 29
Findings ............................................................................................................................................... 29
Recommendations .............................................................................................................................. 29
Manufacturing ........................................................................................................................................ 31
Information Gathering Methods ......................................................................................................... 31
Limitations and Caveats of the Findings ............................................................................................. 31
Snapshot of Manufacturing in North Dakota ...................................................................................... 31
Current Demographics ........................................................................................................................ 32
Anticipated Changes in Demand and Implications for Education/Competencies by 2021 ................ 34
Changes in Knowledge, Skills, and Abilities (KSA)/Competencies ...................................................... 34
Manufacturing Findings and Recommendations ................................................................................ 35
Findings ............................................................................................................................................... 35
Recommendations .............................................................................................................................. 35
Healthcare ............................................................................................................................................... 36
Information Gathering Methods ......................................................................................................... 36
Limitations and Caveats of the Findings ............................................................................................. 36
Snapshot of Healthcare in North Dakota ............................................................................................ 36
Current Demographics ........................................................................................................................ 37
Anticipated Changes in Demand and Implications for Education/Competencies by 2021 ................ 38
Changes in Knowledge, Skills, and Abilities (KSA)/Competencies ...................................................... 39
Healthcare Findings and Recommendations ...................................................................................... 41

Findings ............................................................................................................................................... 41
Recommendations .............................................................................................................................. 41
Agriculture .............................................................................................................................................. 42
Limitations and Caveats of the Findings ............................................................................................. 42
Snapshot of Agriculture in North Dakota ............................................................................................ 42
Sources ........................................................................................................................................................ 44
About FHI 360 ......................................................................................................................................... 45
Report Authors .................................................................................................................................... 45

FROM THE CHAIRMAN 3
From the Chairman It is with great pride that we submit the following North Dakota Workforce Development Needs
Assessment and Gap Analysis. The report focuses on four key industries that the Workforce Education
Advisory Council (WEAC) believes will be significant drivers of North Dakota’s economy in the future:
Energy, Healthcare, Manufacturing, and Technology. Agriculture will also continue to be a significant
contributor to North Dakota’s economy in the future but, due to its unique workforce needs, was not
included in this study.
The report was researched and compiled by FHI 360, a global consulting firm with vast experience in
workforce development, and was funded through a generous grant by Hess Corporation, without whose
support this study would not have been possible.
Primary research for the report was conducted by identifying a point of contact for each industry.
Contacts were asked to participate in a 60-minute telephone interview to help identify industry trends
and challenges. Contacts were then asked to provide a list of at least 35 names of industry colleagues
who we could contact and ask to complete an electronic survey on workforce development needs and
gaps. This research was then paired with available secondary research to provide a more comprehensive
view of workforce needs by industry across North Dakota.
In some cases, survey participation was not as large as we would have liked in order to ensure statistical
relevance. Because of this limitation, some of the findings contained in the report may not match
findings from secondary data or data obtained from larger survey groups.
This first phase of primary research seeks to answer two questions: (1) where are we today?; and (2)
what are our identifiable workforce needs going forward? Once we can answer those two questions, we
can evaluate our findings against current state-funded programs.
Looking ahead, WEAC recommends evaluating current state-funded workforce development programs
for program and cost effectiveness, and redundancy with other programs. At the same time, we
recommend identifying which current state-funded workforce development programs can be utilized to
address the workforce development needs and gaps identified in this report.
Because WEAC is sensitive to not becoming part of an already crowded field of workforce development
programs, we recommend disbanding the group after the completion of primary research. We
recommend utilizing Job Service North Dakota’s Workforce Development Council to implement
recommendations, and eliminate redundancy and waste in current programs.
Mark R. Anderson, Chairman
Workforce Education Advisory Council
From the Chairman

INTRODUCTION 4
Introduction
The Workforce Education Advisory Council (WEAC) was created to advise the State Board of Higher
Education (SBHE) regarding the (1) skills and qualifications needed for workforce training, and (2) career
and technical education programs offered at institutions under the control of the SBHE through Section
11 of Chapter 15–10 of the North Dakota Century Code. The mission of WEAC is:
To advise the State Board of Higher Education regarding the workforce needs of business and
industry in North Dakota. These include the skills and qualifications required for a ready
workforce as they relate to educational programs under the control of the Board.
With a focus on eliminating redundancy and maximizing return on investment, we will also
provide an outside perspective on educational curriculum, development, delivery and
assessment.i
The eleven members of WEAC represent the Department of Career and Technical Education, Job Service
North Dakota, Department of Commerce, and eight members representing business and industry in the
state. Members of WEAC include:
Mark R. Anderson, President and CEO, Mainstream Investors, LLC
Glenn Bosch, Executive Vice President, AVI Systems
Gaylon Baker, Executive Vice President, Stark Development Corporation
Jay Fisher, former Director of NDSU North Central Research Extension Center
Cheri Giesen, Executive Director, Job Service N.D.
Wayne Kutzer, Director and Executive Officer, N.D. Department of Career and Technical
Education
Marvin Lein, CEO, Mid Dakota Clinic
Brent Lohnes (formerly Steve McNally) General Manager – North Dakota, Hess
Guy Moos, CEO, Baker Boy
Thomas D. Shorma, CEO, WCCO Belting
Wayde Sick, Director of Workforce Development, N.D. Department of Commerce
In the summer of 2016, the Hess Corporation, a member of WEAC, commissioned FHI 360 to conduct
information gathering, needs assessment, and gap analysis for the energy industry, with a particular
focus on oil and gas, using Hess as a representative or proxy for the sector. The report was then shared
with other members of WEAC. Through the generous support of the Hess Corporation, FHI 360 was then
commissioned to create similar reports for healthcare, information technology, and manufacturing on
behalf of WEAC. FHI 360 has also compiled publically available data on agriculture, which appear in this
report; however, qualitative data were not collected on agriculture.
The following document summarizes this information gathering, needs assessment, and gap analysis.
The report may be reviewed as a whole or reviewed independently by industry-sector or as cross-cutting
recommendations.
Introduction

INTRODUCTION 5
Recommendations throughout the report were developed based on 1) information gathered during the
process, including hard data and recommendations of interview and survey informants; 2) FHI 360’s
experience managing Succeed 2020, with federal agencies such as the U.S. Departments of Education
and Labor, and with other states; and 3) conversations and recommendations from members of WEAC
and representatives from industry and trade associations.
Again, we would like to thank the Hess Corporation for its leadership and financial contributions to this
work.
i Workforce Education Advisory Council. Mission. Established at WEAC meeting. Informed by: North Dakota Century Code: Chapter 15–10 Section 11. The State Board of Higher Education. Accessed 5 December 2016. http://www.legis.nd.gov/cencode/t15c10.pdf

GENERAL INFORMATION AND FINDINGS 6
General Information and Findings
General Information and Findings
GENERAL INFORMATION AND FINDINGS 7
Limitations of Information Gathering Processes FHI 360’s process to develop this report can best be defined as information gathering, needs
assessment, and gap analysis. A standard research methodology was not applied.
The information gathering process had its strengths and weaknesses as follows:
Information gathering began by completing an in-depth analysis of the Hess Corporation and its
needs as a proxy for the oil and gas industry. After the report was completed, other oil and gas
companies were consulted to determine similarities and differences from Hess, as well as to
confirm or question findings. Some elements of the energy industry may have been neglected;
however, other elements were considered when reviewing publically available information, such
as the Standard Occupational Classification (SOC) data. SOC data estimates the number of
occupations, education requirements of those occupations, salary, and other data. This
information comes from the Department of Commerce.
Publically available data are presented in two time periods. NAICS information is presented as
2011–2015 as it demonstrates both growth and retraction of the economy. SOC information
covered 2014–2024 because it is the newest available data.
A similar process was used for the other three industries; however, there were several
limitations including:
o Time: FHI 360 completed the information gathering at Hess over several weeks during
the summer of 2016 through interviews with staff and an in-depth analysis of staffing
data. Due to time constraints, FHI 360 surveyed staff in the other industries.
o Access to data: Hess provided FHI 360 detailed demographic data about staff.
Manufacturing and healthcare did not have proxy businesses, so publicly available data
were used. For information technology, a combination of publicly available data and
state information technology department survey data was used.
o Survey contact lists and response rates: Contact lists may not be comprehensive
because they were limited to those organizations that have been involved in other state
workforce activities. Further, response rates to surveys were low—between 21 and 40
percent, and many surveys were returned incomplete. Due to the low response rates,
we consider all survey responses to be anecdotal and not generalizable.
While findings are limited, we made attempts to utilize multiple data sources and, when possible,
consulted national and regional research to determine if findings were consistent with existing research
and theory.

GENERAL INFORMATION AND FINDINGS 8
General Information The North American Industry Classification System (NAICS) codes and Standard Occupational
Classification can provide some insights into the relative size of each industry sector and particular
occupations within each sector; however the data are often misleading.
The following chart describes the distribution of jobs by NAICS codes. This is often misleading, as jobs
within an industry may be misclassified; however, it does give an indication of the relative size of various
industries.
ii
NAICS codes can be misleading for various reasons. On the chart above, the relative size of these
industries may be misrepresented for the following reasons:
Oil and gas only includes extraction jobs. If the Hess Corporation is a good representation of the
industry, only four percent of its jobs would fit in this sector, as defined by NAICS codes.
A large portion of technology jobs are considered “professional, scientific, and technical
services” under NAICS codes and may misrepresent the size of the industry. This consists of the
following subsectors: legal services; accounting, tax preparation, bookkeeping, and payroll
services; architectural, engineering, and related services; specialized design services; computer
systems design and related services; management, scientific, and technical consulting services;
scientific research and development services; advertising and related services; and other
professional, scientific, and technical services.
The following chart describes the net jobs lost or created in each industry sector over time. With the
exceptions of information technology in 2011, healthcare in 2014, and manufacturing and “other” in
2015, all industries experienced growth.
Oil & Gas(extraction only)
Manufacturing Healthcare Technology Other
2015 Jobs by NAICS Code 3034 24602 50040 23050 326611
2015 North Dakota Jobs by Industry Sector Using NAICSii

GENERAL INFORMATION AND FINDINGS 9
iii
The rate of growth has not been consistent across industries. As expected, oil and gas have experienced
the greatest rate of growth.
2011 2012 2013 2014 2015
Technology -231 1460 1458 1143 307
Healthcare 955 523 1272 -42 419
Manufacturing 1259 1417 101 601 -452
Oil & Gas 304 423 413 570 568
Other 17270 29118 11153 15957 -4654
Changes in Number of Jobs by Industry Sector Using NAICS 2010–2015iii

GENERAL INFORMATION AND FINDINGS 10
iv
NAICS codes often do not accurately represent the size of industry or growth and changes within
occupations. The table below indicates high-growth jobs, defined by Standard Occupational
Classification, that are within one or more of the four industries. SOC is often a more accurate depiction
of growth and changes in occupations. This table includes related occupations, such as finance, which
some informants suggested were hard-to-fill jobs. Italicized text indicates the occupation may apply
across multiple sectors.
ii U.S. Census Bureau. Longitudinal Employer-Household Dynamics. “North Dakota’s Beginning of Quarter Employment: Counts by NAICS 3-digit Subsectors and Yearly Averages.” Utilized all NAICS 3, then combined per industry. Accessed 28 November 2016. http://qwiexplorer.ces.census.gov iii U.S. Census Bureau. Longitudinal Employer-Household Dynamics. “North Dakota’s Beginning of Quarter Employment: Counts by NAICS 3-digit Subsectors and Yearly Averages.” Utilized all NAICS 3, then combined per industry. Accessed 28 November 2016. http://qwiexplorer.ces.census.gov iv U.S. Census Bureau. Longitudinal Employer-Household Dynamics. “North Dakota’s Beginning of Quarter Employment: Counts by NAICS 3-digit Subsectors and Yearly Averages.” Utilized all NAICS 3, then combined per industry. Accessed 28 November 2016. http://qwiexplorer.ces.census.gov
2011 2012 2013 2014 2015
Other 6.28% 9.57% 3.54% 4.82% -1.42%
Oil & Gas 28.68% 28.52% 21.78% 23.11% 18.72%
Manufacturing 5.49% 5.82% 0.41% 2.40% -1.84%
Healthcare 2.00% 1.08% 2.56% -0.08% 0.84%
Technology -1.24% 7.25% 6.75% 5.03% 1.33%
-5.00%
0.00%
5.00%
10.00%
15.00%
20.00%
25.00%
30.00%
35.00%
Annual Percentage of Job Growth/Declineby Industry Sector Using NAICS
2011–2015iv

GENERAL INFORMATION AND FINDINGS 11
Occupational Projections (Long-Term) for High Demand Occupations in North Dakota in 2014–2024v
(Note: Includes all occupations in or related to selected industries that anticipate 100+ growth in the next ten years.)
Occupation
Code Occupation
2014 Estimated
Employment
2024 Projected
Employment
Total 2014–24
Employment
Change
Annual Avg.
Percent
Change E HC IT M
291141 Registered Nurses 8,392 10,442 2,050 2.20% X
311014 Nursing Assistants 7,163 8,647 1,484 1.90% X
132011 Accountants and Auditors 4,183 4,830 647 1.40% X X X X
292061
Licensed Practical and Licensed Vocational
Nurses 2,923 3,412 489 1.60% X
431011
First-Line Supervisors of Office and
Administrative Support Workers 3,662 4,093 431 1.10% X X X X
151132 Software Developers, Applications 1,273 1,642 369 2.60% X X X X
311011 Home Health Aides 1,320 1,687 367 2.50% X
292041
Emergency Medical Technicians and
Paramedics 1,032 1,338 306 2.60% X
111021 General and Operations Managers 7,369 7,650 281 0.40% X X X X
436014
Secretaries and Administrative Assistants,
Except Legal, Medical, and Executive 7,607 7,880 273 0.40% X X X
151151 Computer User Support Specialists 1,396 1,655 259 1.70% X X X X
131199 Business Operations Specialists, All Other 2,024 2,277 253 1.20% X X X X
292071
Medical Records and Health Information
Technicians 901 1,108 207 2.10% X
319097 Phlebotomists 589 775 186 2.80% X
119111 Medical and Health Services Managers 843 1,023 180 2.00% X
291171 Nurse Practitioners 445 623 178 3.40% X

GENERAL INFORMATION AND FINDINGS 12
Occupational Projections (Long-Term) for High Demand Occupations in North Dakota in 2014–2024v
(Note: Includes all occupations in or related to selected industries that anticipate 100+ growth in the next ten years.)
Occupation
Code Occupation
2014 Estimated
Employment
2024 Projected
Employment
Total 2014–24
Employment
Change
Annual Avg.
Percent
Change E HC IT M
291123 Physical Therapists 552 725 173 2.80% X
292011
Medical and Clinical Laboratory
Technologists 655 821 166 2.30% X
319092 Medical Assistants 668 831 163 2.20% X
499081 Wind Turbine Service Technicians 158 311 153 7.00% X
113031 Financial Managers 973 1,115 142 1.40% X X X X
151121 Computer Systems Analysts 537 673 136 2.30% X X X X
151199 Computer Occupations, All Other 740 875 135 1.70% X X X X
131111 Management Analysts 660 791 131 1.80% X X X X
291127 Speech-Language Pathologists 580 710 130 2.00% X
319091 Dental Assistants 674 803 129 1.80% X
436013 Medical Secretaries 535 663 128 2.20% X
113021
Computer and Information Systems
Managers 519 645 126 2.20% X X X X
291122 Occupational Therapists 410 531 121 2.60% X
292021 Dental Hygienists 624 744 120 1.80% X
131041 Compliance Officers 1,161 1,262 101 0.80% X X X X
v Labor Market Information Center. Job Service North Dakota, Projections Unit. “Occupational Projections (Long-term) for Multiple Occupations in North Dakota in 2014-24.” Accessed 30 November 2016. https://www.ndworkforceintelligence.com

GENERAL INFORMATION AND FINDINGS 13
General Recommendations FHI 360 gathered information from a number of sources. Based on this information, feedback, and
personal experiences, members of WEAC, other members of industry, and other North Dakota leaders
developed overall recommendations. Industry-specific recommendations are provided in later sections.
The following section describes findings and recommendations that may apply to two or more industries
to inform education and workforce strategies.
Observation: Currently, industries and departments are often segmented creating a siloed system
that currently does not consistently meet workforce needs.
Recommendation 1: Establish a statewide workforce vision for K–16 education addressing the
needs of industries that drive North Dakota’s economy. Guided by the Governor, Chancellor, State
Superintendent, and other stakeholders, the vision should consist of measureable goals and a marketing
strategy. This WEAC report can provide baseline information, with a focus on student, employer, and
business outcomes rather than funding streams for departments. The vision may also build on existing
strategies such as the “Find the Good Life” campaign.
To develop this vision, the group may need to:
a) Identify industry needs;
b) Address the needs of both sector and skills;
c) Map the existing education and workforce system;
d) Strengthen education workforce alignment, and
e) Measure results.
WEAC and other stakeholders have made the following recommendations (2-6) for each of these
elements.
Observation: Identifying needs across industries in a consistent way will help compare needs and
identify priorities. There is no standard tool to gain feedback from business and industry on the
knowledge, skills, and competencies of recent graduates or the workforce in general. Individual trade
associations survey members to identify workforce needs, leading to data that cannot easily be
compared and making it difficult to identify cross-industry needs.
Recommendation 2: Continue to identify industry needs through:
Development of a workforce needs survey that could be administered across industries, with
additional industry-specific questions added if necessary.
Creation of industry sector-specific or cross-cutting assessments of workforce needs,
administered at regular intervals on an ongoing basis, like the “Biennial Report on Health Issues
for the State of North Dakota” prepared by the University of North Dakota School of Medicine
and Health Sciences (SMHS) Advisory Council.
Observation: Across numerous efforts, North Dakota has taken an industry sector-based strategy to
addressing workforce needs with a particular focus on energy, healthcare, information
technology/technology, and manufacturing. While this helps growing industries and aligns with federal
General
Recommendations

GENERAL INFORMATION AND FINDINGS 14
policy, it creates siloes that often overlook occupations and skills that cut across sectors and make the
workforce less flexible during rapid changes in the State economy.
Recommendation 3: Consider new and different approaches to gathering and identifying
industry needs:
When identifying education and workforce needs, organize research, working groups, and
impact measures for both sector and skills (e.g., industry and occupation).
The use of career lattices can help identify the occupations with cross-cutting skills, including
STEM skills, that can be applied across industries. Consider identifying the most common
occupations needed across industries, develop career lattices, and complete appropriate
marketing to individuals in those occupations or in related occupations. For example, due to
increases in automation, there appears to be increased demand for instrumentation and
electrical technicians (I&E technicians) in both the energy and manufacturing sectors. These jobs
require expertise in both electrical trades and computer networking. Educating individuals in
those discrete occupations, as well as existing I&E technicians, about the transferability of skills
across industries could make workers in both industries more responsive during economic
changes. Other occupations with cross-cutting skills may include maintenance mechanics;
health, safety, and regulatory officers; sales and customer service; financial managers/analysts;
project managers; and department managers.
Observation: TrainND appears to be highly responsive to local and regional workforce needs;
however, two- and four-year programs do not necessarily build off these programs or offer credit-
bearing courses building off TrainND courses. A stronger understanding of how TrainND responds to
industry needs through specific certifications and credentials may help the university system be more
responsive, while also establishing programs to respond to longer term needs of industry.
Recommendation 4: Map the existing system to create efficiencies.
Map TrainND certifications against workforce needs and cross-walk industry-based certificates to
university-recognized programs. Pay particular attention to the location of delivery, the particular
workforce needs in that region, and how the university system builds on TrainND programs.
Observation: While there are numerous dual credit courses in North Dakota, secondary-post-
secondary alignment is still limited; the college dropout rate is particularly high for numerous reasons,
including students being unaware of career opportunities and the educational requirements needed for
those careers, the lack of alignment between high school and college coursework, and the difficulty of
transition.
Recommendation 5: Strengthen education-workforce alignment through:
Strengthen career planning and career exploration activities at the K–16 level, with a particular
focus on lower grades.
Map career clusters to industries and occupations. This will help secondary students, counselors,
and other educators align coursework with careers. Simply mapping career clusters to industries
and occupations will not be enough—intensive marketing to schools, students, and families will
also be necessary.

GENERAL INFORMATION AND FINDINGS 15
Strengthen the alignment between secondary (high school), community college (two-
year/associate degree), and university (four-year degree) plus continuing education in the state.
To our knowledge, there are limited opportunities for high school students to begin a course of
study that earns credits toward a technical associate degree.vi The connection of a technical
associate degree to a four-year degree, then ongoing education and training is further
weakened. The role of secondary education (both Department of Public Instruction and
Department of Career and Technical Education) to align coursework and educational standards
with the rigors of the university system are essential.
Strengthen lifelong learning by enabling incumbent workers to upgrade skills through stackable
credentials, certifications, and associate programs.
Observation: You can’t manage what you don’t measure. As industries and the economy change, the
measures may evolve.
Recommendation 6: Measure results of vision. Use the industry survey and industry reports, as
well as other pre-determined data points, and measure progress of the vision over time.
Observation: New entrants to jobs, incumbent workers, and transitioning (disengaged) workers lack
knowledge of specific jobs and career pathways and ongoing education and training required to
maintain excellence within those jobs.
Recommendation 7: Consider utilizing alumni networks to strengthen continuing education of
graduates. Both the university system and TrainND provide opportunities to upskill professionals in high
demand occupations.
Observation: Across all sectors, employees lacked technology skills, including a lack of understanding
of basic desktop computer applications such as Microsoft Office and mobile applications specific to the
industry. Nearly all industries suggested new and existing employees lacked technical skills for basic
software packages such as Microsoft Office, as well as more advanced or industry-specific software and
technologies such as databases, mobile applications, and project management tools.
Recommendation 8: Identify the standard industry tools (e.g., computer software and mobile
applications) and technology skills needed to be successful and integrate training on them into existing
curriculum. Elements of this may include:
Mapping where technology education is currently being taught. (K–12? Higher education?)
As English and Math state standards are currently being re-written, consider adding technology
competencies. Integrating basic technology into existing coursework will help students and new
and existing employees understand and utilize technology within their work.
Align technology education with industry-appropriate standards on current IT technologies (e.g.,
Microsoft Office 365), but respond to changing industry needs.
Observation: Across all industries, businesses noted the particular foundational skills needed for
new and incumbent workers. Communication skills, both verbal (listening, presentation, and
conversational to different stakeholders) and written (formal, informal, and work specific such as email

GENERAL INFORMATION AND FINDINGS 16
communications and industry-specific writing such as work orders, project plans), as well as time
management/ability to prioritize tasks, and problem-solving/troubleshooting were named repeatedly as
skills workers were lacking.
Some industry leaders suggested they have difficulty hiring high level executives. The ability of staff to
take on leadership and supervisory positions varies by industry; however, every industry noted some
area for improvement.
Recommendation 9: Strengthen foundational skills development at the K–16 levels through
several strategies including:
Integrate foundational skills development into all courses and all programs. The Department of
Career and Technical education has developed “Career Ready Practices” and a rubric to measure
specific soft skills that helps educators grade/score students on specific soft skills. Tools like this
can help educators measure soft skills attainment.
The State may also consider applying a standards-based approach to soft skills valued by
industry and benchmarked against other states.
Integrate written assignments and presentations into appropriate technical coursework. Longer
project-based learning can also reinforce problem-solving practices and can require written and
verbal elements.vii
Observation: If recommendations 2 and 3 are implemented (ongoing feedback from industry
through surveys and biennial reports) and the vision is established, then systems will be created to
engage industry.
Recommendation 10: At the completion of final research, disband WEAC and transfer
responsibilities to the Workforce Development Council.
vi One notable exception is the Instrumentation & Control Technology program at Bismarck Public High School and Bismarck State College. vii A strong example of a technical program requiring these elements is the Petroleum Production Technology program at Williston State College, which requires students to complete semester projects and give presentations.

INDUSTRY REPORTS 17
Industry Reports
Industry Reports
ENERGY 18
Energy Energy was the first sector report completed. It began with existing information gathered for the Hess
Corporation. Due to limitations in publicly available data related to the oil and gas industry, the
categorization of the data, and the ability and interest of the Hess Corporation to provide internal data,
as well as FHI 360 staff expertise, this sector report consists of slightly different data-gathering methods
and more in-depth findings and recommendations.
Information Gathering Methods
FHI 360 used the Hess Corporation as a representative of the oil and gas industry since NAICS codes only
define the industry as oil and gas extraction. Interviews with other oil and gas professionals were
completed to determine if the findings were consistent across the industry. Other publicly available data
informed other energy-sector jobs. A review of standard occupational codes also guided identification of
growth occupations within the sector.
A brief description of the information gathering process and its limitations are as follows:
Organization of job categories: In collaboration with Hess’ human resources and training
departments, FHI 360 divided Hess’ North Dakota workforce into seven job categories, primarily
based on skills. Hess then aligned specific job titles with each of the job categories.
CAREER MANAGER data analysis: FHI 360 analyzed data regarding Hess' current workforce and,
if available, workforce over the past five years, using basic employment data from CAREER
MANAGER (e.g., demographic data—age, education, etc.—of staff by identified job categories).
For the purposes of this research, the data only included Hess staff based in North Dakota.
These data did not include Hess staff in-state for a task, on two-year rotations, or head count
contractors. FHI 360 attempted to identify potential workforce shortages among groups not
included in these data through interviews and other data collection efforts.
Informant interviews: FHI 360 conducted informational gathering interviews with staff from
human resources, training, senior management, and a senior advisor to inform interview
questions and the overall information gathering design process.
Manager interviews: FHI 360 interviewed select staff from senior management, human
resources, the training department, and directors/leads of departments from different job
categories to identify staffing trends. For all job categories, about 10 percent of staff were
interviewed, with the exception of support services. Due to the wide range of job titles in
support services, an over-sampling of interviews was completed to attempt to address the
specific job areas. FHI 360 conducted interviews over a three-week period in July 2016. Due to
summer vacations and rotations, some targeted interviewees were not reached.
Comparisons to other research: North Dakota has made significant investments to understand
the oil and gas labor market. Previous research, including that completed by NDSU Extension
Service, has relied on NAICS codes to classify growth aligned with standard employment
projections. While this is useful for statewide projections, we elected to use a different, more
specific breakdown to help understand the specific knowledge, skills, and abilities required for
types of positions. This will provide more specific information to the university system on
workforce needs, but may make it difficult to align this report with other, more standard,
workforce research.
Energy

ENERGY 19
Limitations and Caveats of the Findings
There are several limitations in the findings of the report. These include, but are not limited to:
Changes in technology are difficult to predict. FHI 360 asked managers about technological
changes and how these may impact the workforce; however, some technology may be
unforeseen at this time.
Given dramatic changes in oil prices, it is difficult to project prices in five years. FHI 360 applied a
very conservative price (estimated at $60/barrel) in 2021 when asking managers to predict their
future workforce needs
The CAREER MANAGER data set did not include data for contractors, staff on assignment, and
head count contractors that will need to be replaced. FHI 360 attempted to address these
subgroups in interviews.
Some job categories have a very small number of staff. In an effort to clearly communicate
results, FHI 360 elected to use whole numbers instead of percentages.
Comparison of Oil and Gas Companies in North Dakota
While Hess served as a proxy for the oil and gas industry, there are some notable differences. Compared
to other oil and gas companies with operations in North Dakota, a larger portion of Hess’ workforce
consists of direct Hess employees. The following describes how Hess can serve as a proxy for the
industry:
Hess has a higher proportion of managers and support services in North Dakota than other
energy companies, which often have headquarters in Houston or Denver.
Hess may have a larger footprint of Environment, Health, and Safety staff in North Dakota than
other companies. Other companies often base a portion of these staff members in headquarters
like Denver or Houston.
Energy Workforce Composition – 2016
FHI 360 completed a detailed analysis of Hess’ workforce by job categories determined by job titles. A
separate and private report details the age, education, and years at company, as well as an analysis of
knowledge, skills, and abilities and gaps within each of those areas. The high-level finding of this
research are included in this report.
Just over one in four of Hess personnel are operators, positions which require a high school
diploma as well as technical and mechanical skills. Another 16 percent of the staff are
technicians, including mechanics, whose desired education level is a two-year technical degree.

ENERGY 20
Using Standard Occupational Classifications, several occupations within energy were identified to have
the highest rates of growth in North Dakota as follows.
Occupational Projections (Long-Term) for High Demand Energy Occupations in
North Dakota in 2014–2024viii
Occupation
Code Occupation
2014
Estimated
Employment
2024
Projected
Employment
Total 2014–
2024
Employment
Change
Annual
Avg.
Percent
Change
499081 Wind Turbine Service Technicians 158 311 153 7.00%
514041 Machinists 726 825 99 1.30%
499044 Millwrights 247 286 39 1.50%
192041
Environmental Scientists and
Specialists, Including Health
307 324 17 0.50%
Drilling4% EHS
5%Engineer
11%
Management9%
Operator27%
Support28%
Technician16%
North Dakota-Based Hess StaffJuly 2016
Drilling
EHS
Engineer
Management
Operator
Support
Technician

ENERGY 21
Energy Findings and Recommendations
Findings The following section provides findings both across job categories and substantial findings within job
categories.ix
Finding: Demand for secondary vs. post-secondary education: Generally, most staff have the
minimum education required for their jobs; however, some positions (e.g., technicians) will
need more formal education (two-year technical degrees) in the next five years. While a high
school education may be sufficient for some positions in the drilling and operator job categories,
advanced science and math coursework (geology, algebra, chemistry, and physics) is needed, as
well as strong soft skills, including written and verbal communication, time management, the
ability to prioritize tasks, and problem-solving. Additionally, there may not be existing
relationships and pathways between secondary and post-secondary coursework for some of
these job categories.x
Finding: Growth of environment, health, and safety (EHS) positions: EHS will become
increasingly important with increasing specialization. Individuals with specific professional
credentials will be highly sought after.
Finding: Increased need for knowledge of the regulatory environment: All staff working in the
field will need a basic understanding of the regulatory environment, including the regulatory
agencies and their purposes, how regulations might impact how work is completed and
managed, and an understanding of when and how to elevate potential regulatory issues.
Finding: Growth in technician positions: The technician job categoryxi is expected to grow at a
rate greater than other job segments at Hess. Based on the current number of technician
graduates in North Dakota, if Hess is indicative of the industry, there may be a shortage of
technicians by 2021.xii
Finding: Increased reliance on system automation and exception-based surveillance:
Automation of systems and increased reliance on exception-based surveillance will require staff
in several job categories to have increased knowledge and skills in these areas.
Finding: Increased reliance on advanced software packages: Some staff struggle with computer
programs and mobile technology. As Hess becomes increasingly reliant on databases, Microsoft
Office, computer-based maintenance management systems, and project management systems,
new hires will need computer literacy and the ability to quickly learn new programs and
applications.
Finding: Knowledge of strong business practices: Across multiple roles, Hess staff need
experience with project management and LEAN principles applying safety, quality, cost, and
delivery. Understanding the basic principles and theories of these are beneficial to new hires.
Some staff roles, both in project planning and management, require advanced project
management skills that some staff lack. Further, Hess has fully adopted the philosophy of LEAN
principles, but must continuously develop staff knowledge and understanding of the principles.
Industry interviews suggest that Hess may take LEAN principles more seriously than others in
the industry, but cost-saving efforts were particularly important.
Energy Observations
and
Recommendations

ENERGY 22
Finding: Need for improved communication skills: Managers described the increased
importance of strong communications skills, both written and verbal; the ability to communicate
across functions and audiences in the company; and the ability to have “courageous” or difficult
conversations.
Finding: Ongoing need for strong soft skills: Managers also described staff as needing to
develop strong soft skills to prioritize work, solve problems, and troubleshoot.
Recommendations
Recommendation for new entrants: Encourage the development of a stronger link between
high schools and post-secondary institutions, such as Career and Technical Education programs
of study, with a particular focus on technician positions. The development of programs of study,
or programs where students earn specific credits during high school that transition to college-
level course work, would be desirable.
Recommendation for new entrants and incumbents: Post-secondary institutions preparing
individuals for jobs in the oil and gas industry may consider adding a specific course related to
the regulatory environment or adding regulatory topics to existing courses. A particular focus on
monitoring processes would be beneficial.
Recommendation: Integrate written assignments and presentations into appropriate technical
coursework. More extensive project-based learning programs can also reinforce problem-
solving practices and can require written and verbal elements.
Recommendation: Cross-curricular training and project-based learning are two strategies to
strengthen problem-solving and troubleshooting skills.
Recommendation: According to informants, there are no post-secondary EHS programs
(certificate or bachelor) in North Dakota. The state may benefit from learning about the demand
for these types of programs from other oil and gas companies and determine if there is a need
to develop them.
viii Labor Market Information Center. Job Service North Dakota, Projections Unit. “Occupational Projections (Long-term) for Multiple Occupations in North Dakota in 2014–2024.” Accessed 30 November 2016. https://www.ndworkforceintelligence.com ix Job categories were established to group like job titles or occupations that may be similar knowledge, skills, and abilities required. x Based on other FHI 360 research conducted privately for Hess, we believe there are limited opportunities for high school students to begin a program of study in high school with coursework that serves as the formal foundation for college-level work and expedites years of education required to earn an associate or bachelor degree. xi Engineering, field, lab, and surface land technicians and specialist positions, as well as maintenance mechanics are included in this job category. xii Note: This finding is partially based on other research FHI 360 has completed for Hess.

INFORMATION TECHNOLOGY 23
Information Technology The following section was developed using existing information and data from public sources, through a
survey of individuals working in North Dakota information technology, and through limited interviews.
Please review the Information Gathering Methods and Limitations and Caveats of the Findings sections
of this report for more information.
Information Gathering Methods
FHI 360 conducted informational interviews with one information technology professional and
one trade association representative to help shape the survey and identify secondary sources of
data.
FHI 360 conducted secondary data research, relying heavily on U.S. Census Bureau, Job Service
North Dakota, and State Information Technology Department to understand education and
years of experience data. This may or may not be a good representative of statewide industry
needs.
FHI 360 sent the survey to 66 contacts from 63 organizations. Twenty-five people responded to
the survey; however, only 11 people answered all open-ended questions. The contact list
consisted of human resources professionals in information technology, as well as board and
legislative committee members from the Information Technology Council of North Dakota.
Limitations and Caveats of the Findings
Data are limited by the publicly available data and the small number of responses to the survey. A past
survey of the North Dakota Information Technology Department staff was used to determine the age
and education of employees, while publicly available data helped determine the size of the industry.
FHI 360 also conducted a survey to determine changes in education and knowledge, skills, and abilities
required as well as external factors impacting the workforce. The survey results should be considered
anecdotal in nature due to the limited response rates.
Snapshot of Information Technology in North Dakota
Publicly available data on information technology is difficult to discern as NAICS codes categorize some
technology jobs and jobs requiring technical skills in other categories. For the purposes of this snapshot,
the following NAICS codes were used: 51511 (publishing industries, except internet), 51517
(telecommunications), 51518 (data processing, hosting, and related services), 51519 (other information
services), and 51541 (professional, scientific, and technical services). Since this does not capture the
entire industry, we have also used the North Dakota Information Technology Department as a proxy for
other elements of the industry, as well as data from the Information Technology Council of North Dakota.
Overall, information technology, as categorized by these NAICS codes, has grown steadily for the past six
years. Professional, scientific, and technical servicesxiii have grown year over year, while other
information services and publishing industries (except internet) have declined year by year. Further,
NAICS codes may not be a good representation of the information technology sector, as the subsector
Information
Technology

INFORMATION TECHNOLOGY 24
“professional, scientific, and technical services” applies across multiple industries.
xiv
Current Demographics
The following section describes current demographics of individuals working in information technology in
North Dakota, as well as education expectations based on surveys, to provide introductory information
about the current workforce. Supplemental data from the North Dakota Information Technology
Department accompanies the publicly available data, as age and education information is not available
in the aforementioned NAICS codes.
Age and education level could not be determined using NAICS data, as the information is not
available. As a result, a survey of the North Dakota Information Technology Department staff
provided a proxy for age, through questions about years of experience and eligibility for
retirement, and for education levels of information technology workers.
According to a survey of North Dakota Information Technology Department staff, employees
have a range of years at their current employer, with just under one quarter (22 percent) of
employees with the organization for six to 10 years and nearly one third (31 percent) with the
organization for 16 years or more.xv
2010 2011 2012 2013 2014 2015
Professional, Scientific, and TechnicalServices
12751 12768 14313 15962 17124 17640
Other Information Services 191 186 182 193 204 196
Data Processing, Hosting, and RelatedServices
1011 753 722 638 594 572
Telecommunications 1824 1841 1845 1846 1948 1914
Publishing Industries (except Internet) 3132 3132 3081 2962 2867 2715
Information Technology Sector (using NAICS) by Yearxv

INFORMATION TECHNOLOGY 25
At present, 12 percent of staff are eligible to retire; however, by 2021, another 12 percent will be
eligible to retire, meaning nearly one in four staff will be eligible to retire by 2021.xvi
Nearly three-quarters of employees (74 percent) have a four-year degree or more.
17%
16%
22%13%
32%
Years of Experience With Current Employer (ITD)xvi
2 years or less
3–5 years
6–10 years
11–15 years
16+ years
12
12
1462
Retirement Eligiblity (ITD)xvi
Currently Eligible to Retire
Eligible in 5 Years or Less
Eligible in 6–10 Years
Eligible in 10+ Years
2%5%
19%
56%
18%
Education Level (ITD)xvi
High School
Some college
Two-year degree
Four-year degree
More than a four-year degree

INFORMATION TECHNOLOGY 26
FHI 360’s survey of IT workforce professionals suggests current education expectations within
information technology vary by job category; however, all job categorizes desire at least an associate
degree. The type of degree or subject area was not described in the survey. Survey respondents felt the
desired education by job category is as follows:
Job Category Most Commonly Desired Education Level
Security and disaster recovery Bachelor degree (7)
Quality assurance Associate degree (4), Bachelor degree (3), Don’t know (3)
Software development Bachelor degree (7), Associate degree (3)
Architecture Bachelor degree (7), Don’t know (3)
Network services Bachelor degree (6)
Computer systems (operators, desktop support,
databases, system administration)
Associate degree (5), Bachelor degree (4)
Enterprise services/service desk Associate degree (6), Bachelor degree (4)
Program managers, project managers Bachelor degree (10)
A limited number of survey respondents identified certifications related to project management and
business analysis as important to some positions. Other certifications may be important to some
technical positions; however, according to informants, this may be determined by the specific business.
Anticipated Changes in Demand and Implications for Education/Competencies by 2021
The following section describes the education levels and technical and soft skills that survey respondents
hoped employees would have by 2021, as well as other information from secondary sources.
In 2014, “Nearly 60 percent of respondents indicated workforce needs are not being met. The
primary causes indicated are shortage of available general workforce and lack of skills in
available workforce,” according to the North Dakota Information Technology Council.xvii
The majority of FHI 360 survey respondents (11/15) suggested the number of employees
needed will increase in the next five years, across nearly all job categories.
Using the Standard Occupational Classifications, Job Service North Dakota also predicts growth
across many occupations per the table below.
Occupational Projections for Select IT Occupations in North Dakota in 2014–
2024xviii
Occupation
Code Occupation
2014
Estimated
Employment
2024
Projected
Employment
Total 2014–24
Employment
Change
Annual Avg.
Percent
Change
113021
Computer and Information
Systems Managers 519 645 126 2.20%
151121 Computer Systems Analysts 537 673 136 2.30%
151122
Information Security
Analysts 127 161 34 2.40%

INFORMATION TECHNOLOGY 27
Occupational Projections for Select IT Occupations in North Dakota in 2014–
2024xviii
Occupation
Code Occupation
2014
Estimated
Employment
2024
Projected
Employment
Total 2014–24
Employment
Change
Annual Avg.
Percent
Change
151131 Computer Programmers 493 483 -10 -0.20%
151132
Software Developers,
Applications 1,273 1,642 369 2.60%
151133
Software Developers,
Systems Software 381 475 94 2.20%
151134 Web Developers 273 370 97 3.10%
151141 Database Administrators 158 188 30 1.80%
151142
Network and Computer
Systems Administrators 523 585 62 1.10%
151143
Computer Network
Architects 153 189 36 2.10%
151199
Computer Occupations, All
Other 740 875 135 1.70%
251021
Computer Science
Teachers, Post-secondary 73 79 6 0.80%
Projected education expectations within information technology vary by job category. Survey
respondents felt the desired education by job category is as follows. Bolded text indicates increases in
the desired education level by a greater number of survey respondents.
Job Category Most Commonly Desired Education Level
Security and disaster recovery Bachelor degree (7)
Quality assurance Bachelor degree (8)
Software development Bachelor degree (7), Associate degree (2), Graduate degree
or more (2)
Architecture Bachelor degree (7), Graduate degree or more (4)
Network services Bachelor degree (9)
Computer systems (operators, desktop support,
databases, system administration)
Bachelor degree (6), Associate degree (4)
Enterprise services/service desk Bachelor degree (9)
Program managers, project managers Bachelor degree (6), Graduate degree or more (5)
INFORMATION TECHNOLOGY 28
Changes in Knowledge, Skills, and Abilities (KSA)/Competencies
While the FHI 360 survey had a limited number of respondents, responses to open-ended questions
regarding knowledge, skills, and abilities were consistent with state data from information technology
and workforce professionals.
Survey respondents stated that verbal and written communication skills were of the utmost
importance. Some highlighted the importance of communicating well with all levels of
employees, providing customer service (through listening), and having good presentation skills.
Other important soft skills include the ability to work in teams and problem solve. Informant
interviews reinforced the need for strong problem-solving skills.
The majority of survey respondents (12/16) felt employees are prepared to take on supervisory
and leadership positions, with one informant suggesting high level positions are still difficult to
fill.
Survey respondents did not perceive that there would be an overriding change in the field
impacting workforce; however, increases in automation, security threats, and an increased
reliance on the cloud appear to be some trends. A survey by the North Dakota Information
Technology Council in 2016 found that “nearly 90 percent of respondents indicated security is
currently their biggest challenge,” with IT demand and limited workforce as the second greatest
concern.xix
Some respondents suggested the ability to recruit and utilize remote workers may impact the
workforce since it is difficult to find local talent. An informant suggested businesses would
prefer to hire locally, but there may be a lack of local talent, forcing the use of remote workers.
INFORMATION TECHNOLOGY 29
Information Technology Findings and Recommendations
Findings
Finding: While a majority of IT staff (possibly three in four) have a bachelor degree or more,
there appears to be a shortage of IT professionals and lack of skills in available workforce. This
suggests some recent graduates do not have the necessary technical expertise and incumbent
workers lack required expertise.
Finding: While many recent hires lack required expertise, informants and survey responses
suggest soft skills, especially written and verbal communications, team work, and problem-
solving, were as important to employability. Businesses may train to particular standards and
technical areas, but individuals must be competent in these areas.
Recommendations
Recommendation: Technology should be integrated into curriculum and learning objectives at
the secondary and post-secondary level.
Recommendation: At the post-secondary level, consider integrating technical coursework into
liberal arts education.
Recommendation: Establish career exploration and planning at a younger age. Programs such as
the IT career expo in Fargo serve as one platform. Job shadows, classroom presentations, and
other work-based learning activities can also help students learn about information technology
careers.
Recommendation: Conduct a study to determine where employees get their degrees, and in
what content areas, and map degree programs to industry standards. If appropriate, develop
certification programs and associate degree programs to address need. As possible, integrate
video classroom delivery.
Recommendation: Consider establishing internship requirements for particular post-secondary
degree programs to ensure students have a clear understanding of expectations. Recent use of
Operation Intern has been beneficial, but hasn’t necessarily met demand.
Recommendation: Consider integrating writing and presenting in technical courses. Cross-
curricular exercises are particularly beneficial.
xiii The professional, scientific, and technical services sector consists of the following subsectors: legal services; accounting, tax preparation, bookkeeping, and payroll services; architectural, engineering, and related services; specialized design services; computer systems design and related services; management, scientific, and technical consulting services; scientific research and development services; advertising and related services; and other professional, scientific, and technical services. xiv U.S. Census Bureau. Longitudinal Employer-Household Dynamics. “North Dakota’s Beginning of Quarter Employment: Counts by NAICS 3-digit Subsectors and Yearly Averages.” NAICS Sectors: 51511 (publishing industries, except internet), 51517 (telecommunications), 51518 (data processing, hosting, and related services), 51519 (other information services), and 51541 (professional, scientific, and technical services). Accessed 30 November 2016. http://qwiexplorer.ces.census.gov xv ND Information Technology Department. Survey of Employees. 2016 xvi Note: Eligibility for retirement within ITD is based on 1) age, 2) years at ITD, and 3) start date at ITD. Retirement assumptions at other technology entities may be different.
IT Findings and
Recommendations

INFORMATION TECHNOLOGY 30
xvii Information Technology Council of North Dakota. “State of the IT Industry 2015 Guide.” Accessed 30 November 2016. http://cl-itcnd-website-test.sycorr.net/wp-content/uploads/2016/02/ITCND-Guide-2015-Final.pdf Pg. 21 xviii Labor Market Information Center, Job Service North Dakota, Projections Unit. “Occupational Projections (Long-term) for Multiple Occupations in North Dakota in 2014–2024.” Accessed 2 December 2016. https://www.ndworkforceintelligence.com xix Information Technology Council of North Dakota. “State of the IT Industry Guide 2017.” Pg. 21
MANUFACTURING 31
Manufacturing The following section was developed using existing information and data from public sources, a survey of
individuals working in North Dakota manufacturing, and limited interviews. Please review the
Information Gathering Methods and Limitations and Caveats of the Findings sections of this report for
more information.
Information Gathering Methods
FHI 360 conducted an informational interview with one manufacturing professional and one
trade association representative to help shape the survey and identify secondary sources of
data. The manufacturing professional also tested the survey.
FHI 360 conducted secondary data research, relying heavily on U.S. Census Bureau data for age
and education information.
FHI 360 sent the survey to 38 contacts from 23 organizations. Sixteen people responded to the
survey, but only five people answered all open-ended questions.
Limitations and Caveats of the Findings
Data are limited by the publicly available data and the small number of responses to the survey. NAICS
codes were used to determine the size of the industry and age and education of employees. Standard
Occupational Codes cannot as easily be applied to manufacturing.
The survey results should be considered anecdotal in nature due to the limited response rates; however,
the findings are consistent with other workforce research on manufacturing nationally.
Snapshot of Manufacturing in North Dakota
NAICS codes were used to determine the size of the sector.
Overall, manufacturing, as categorized by these NAICS codes (31–33), has grown steadily for the past six
years. However, four subsectors (food, fabricated metal product, machinery, and transportation
equipment) make up 61 percent of these jobs. Fabricated metal product, machinery, and transportation
equipment saw steady growth over the past six years, while food manufacturing had little net growth
over six years (12 additional positions). Beverage and tobacco product and furniture and related product
manufacturing saw the greatest reduction in positions.
Manufacturing

MANUFACTURING 32
xx
Current Demographics
The following section describes the demographics of individuals currently working in manufacturing in
North Dakota, as well as education expectations based on surveys, to provide introductory information
about the current workforce.
As of 2015, the majority of manufacturing employees (67 percent) were between the ages of 25
and 54. Twenty percent were aged 55 to 64.xxi Only four percent of manufacturing employees
2010 2011 2012 2013 2014 2015
Miscellaneous Manufacturing 550 558 686 666 649 629
Furniture and Related ProductManufacturing
965 944 858 874 886 881
Transportation EquipmentManufacturing
1879 2103 2386 2458 2602 2482
Electrical Equipment, Appliance, andComponent Manufacturing
80 115 134 126 128 128
Computer and Electronic ProductManufacturing
1407 1490 1541 1563 1533 1522
Machinery Manufacturing 4760 5361 5765 5638 5636 5383
Fabricated Metal ProductManufacturing
1903 2086 2067 2193 2310 2153
Nonmetallic Mineral ProductManufacturing
1275 1407 1740 1767 1865 1831
Plastics and Rubber ProductsManufacturing
1028 1063 1409 1492 1484 1444
Chemical Manufacturing 290 259 271 272 296 322
Petroleum and Coal ProductsManufacturing
296 282 292 299 345 391
Paper Manufacturing 119 119 116 117 126 114
Wood Product Manufacturing 1497 1538 1590 1628 1738 1820
Leather and Allied ProductManufacturing
36 34
Apparel Manufacturing 26 24 22 20 22 18
Textile Product Mills 185 201 209 207 214 203
Beverage and Tobacco ProductManufacturing
321 212 209 212 213 222
Food Manufacturing 5054 5137 5061 4914 5003 5066
Manufacturing Sector (using NAICS) by Yearxxi

MANUFACTURING 33
were 65 or older.
One out of every three manufacturing employees has a high school degree or equivalent (34 percent) or
some college or associate degree (31 percent). Nearly 15 percent have a bachelor degree or advanced
degree (14 percent) and 11 percent have less than a high school degree. Data are not available for 10
percent of manufacturing employees.xxii
Current education expectations for employees within manufacturing vary by job category. Survey
respondents reported the desired education by job category is as follows:
Job Category Most Commonly Desired Education Level
(Number of Respondents in Parentheses)
Sales High school (3), Associate degree (2), and Bachelor degree (2)
Safety and quality Technical certificate (5), Associate degree (3)
Maintenance Technical certificate (5), Associate degree (2)
Management Bachelor degree (4), Associate degree (3)
1% 9%
67%
20%
4%
Age of Current Manufacturing Workforce(using NAICS)xxii
14–18
19–24
25–54
55–64
65+
11%
34%31%
14%
10%
Education of Current Manufacturing Workforce(using NAICS)xxiii
Less than high school
High school or equivalent
Some college or Associate degree
Bachelor degree or advanced degree
Educational attainment not available

MANUFACTURING 34
Operators/Manufacturing High school (5), Technical certificate (3)
Logistics High school (4), Associate degree (3)
Anticipated Changes in Demand and Implications for Education/Competencies by 2021
The following section describes the education levels and technical and soft skills that survey respondents
hoped employees would have by 2021.
Survey respondents suggested increased education would be desired across five of the six job
categories. Bolded text indicates increases in the desired education level by a greater number of survey
respondents.
Job Category Most Commonly Desired Education Level
Sales Associate degree (3), High school (2), and Bachelor degree (1)
Safety and quality Associate degree (4), Technical certificate (2), Bachelor degree (2)
Maintenance Technical certificate (5), Associate degree (2)
Management Bachelor degree (6)
Operators/Manufacturing Technical certificate (4), High school (3)
Logistics Associate degree (3), High school (2), Technical certificate (2)
Changes in Knowledge, Skills, and Abilities (KSA)/Competencies
While the survey had a limited number of respondents, responses to open-ended questions regarding
knowledge, skills, and abilities were consistent with national data from manufacturers and workforce
professionals.
Communication, teamwork, and problem-solving were the three most important soft skills
highlighted by survey respondents.
Survey respondents were divided on whether employees were prepared to take on supervisory
and leadership positions. (four=yes, four=unsure, one=no).
External factors impacting manufacturing include Occupational Safety and Health
Administration (OSHA) regulations, economic conditions, and the oil and gas industry, according
to some survey respondents. (Note: These are perceived factors impacting the industry).

MANUFACTURING 35
Manufacturing Findings and Recommendations
Findings
Finding: According to North Dakota, survey respondents and other national data, jobs in sales,
safety and quality, maintenance, management, operators/manufacturing, and logistics will
require higher levels of education in the future. The number of individuals with appropriate
technical certificates or degrees may not meet industry needs in the future.
Finding: Survey respondents perceive the impact of the oil and gas industry on hiring in the
manufacturing industry to be substantial, driving a need for higher salaries and limiting growth.
However, based on employment numbers from the U.S. Census Bureau, we could not confirm a
negative impact of the oil and gas industry on hiring in manufacturing.
Finding: Several of the job categories (sales, safety and quality, maintenance, management, and
logistics) require skills that are transferrable to other industries.
Recommendations
Recommendation: Secondary and post-secondary students need more exposure to
manufacturing jobs through internships, workplace tours, and other work-based learning.
Integrate information about transferable skills into high school career planning and post-
secondary academic advising.
Recommendation: Consider developing programs or programs of study, in which students begin
to earn relevant credits in high school, then transition to post-secondary programs. Where
appropriate, explore certificate programs. This may require industry donation of goods and
advising of program development.
Recommendation: Manufacturing jobs, especially advanced manufacturing jobs, will require
additional certificates and associate degrees. Since there is not a trade organization
representing manufacturing, an analysis of manufacturing needs should be completed and, as
appropriate, training programs should be developed or adapted from other states. Map the
specific transferrable skills so employees can either advance in their fields or transfer to other
industries.
xx US Census Bureau. Longitudinal Employer-Household Dynamics. “North Dakota’s Beginning of Quarter Employment: Counts by NAICS 3-digis Subsectors and yearly Averages.” NAICS Sectors: 295352, 297884, 299971, 300292, 303015, 308986, 315327, 322584, 328985, 338287, 337570, 346364, 365881, 398836, 413206, 431437, 427644. Accessed 2 December 2016. http://qwiexplorer.ces.census.gov xxi U.S. Census Bureau. Longitudinal Employer-Household Dynamics. “North Dakota’s Beginning of Quarter Employment: Counts by Worker Age and Yearly Averages.” NAICS Sectors – Manufacturing. Accessed 29 November 2016. http://qwiexplorer.ces.census.gov xxii U.S. Census Bureau. Longitudinal Employer-Household Dynamics. “North Dakota’s Beginning of Quarter Employment: Counts by Worker Education and Yearly Averages.” NAICS Sectors – Manufacturing. Accessed 29 November 2016. http://qwiexplorer.ces.census.gov
Manufacturing
Findings and
Recommendations

HEALTHCARE 36
Healthcare The following section was developed using existing information and data from public sources, through a
survey of individuals working in North Dakota healthcare, and through limited interviews. Please review
the Information Gathering Methods and Limitations and Caveats of the Findings sections of this report
for more information.
Information Gathering Methods
FHI 360 conducted an informational interview with one healthcare professional and a handful of
trade association representatives to help shape the survey and identify secondary sources of
data.
FHI 360 conducted secondary data research, relying heavily on U.S. Census Bureau and Job
Service North Dakota. This may or may not be a good representation of needs.
FHI 360 sent the survey to 107 contacts from 42 organizations. Twenty-one people responded to
the survey; however, only seven people answered all open-ended questions. The majority of
respondents were human resource managers of large institutions with over 50 employees.
Limitations and Caveats of the Findings
Data are limited by the publicly available data and the small number of responses to the survey. NAICS
codes were used to determine the size of the industry and age and education of employees. Standard
Occupational Classifications were also used to determine high-growth occupations within the sector.
The survey results should be considered anecdotal in nature due to the limited response rates.
Snapshot of Healthcare in North Dakota
For the purposes of this snapshot, the following NAICS codes were used: 621 (ambulatory health care
services), 622 (hospitals), and 623 (nursing and residential care facilities).
xxiii
2010 2011 2012 2013 2014 2015
Nursing and Residential CareFacilities
15373 15805 15812 15793 15966 16102
Hospitals 19754 20501 19426 19965 19579 19438
Ambulatory Health Care Services 11774 11543 13133 13896 14084 14518
Healthcare Sector (using NAICS) by Yearxxiv
Healthcare

HEALTHCARE 37
Current Demographics
The following section describes the demographics of individuals currently working in healthcare in North
Dakota, as well as education expectations based on surveys, to provide baseline information about the
current workforce.
As of 2015, the majority of healthcare employees (63 percent) were between the ages of 25 and
54. Twenty-four percent were 55 or older.xxiv
Various trade organizations suggest age distribution of the workforce may not be consistent
across the types of facilities and specific occupations; however, it is difficult to compare as data
collection tools are not consistent (e.g., occupations requiring more education often skewed
older). Distribution of age, occupation, and education was often divided by county, rural vs.
urban, per capita, or in comparison to other states.
Data on the education of the healthcare workforce are divided by specific occupations;
however, this is not a good indicator of the essential and specific skills needed in the sector.xxv
For further information about the current demographics regarding the healthcare workforce, we
refer to the pending Fourth Biennial Report of Health Issues for the State of North Dakota. The
Third Biennial Report can be found at: http://www.med.und.edu/about-us/_files/docs/third-
biennial-report.pdf.
2%11%
63%
19%
5%
Age of Current Healthcare Workforce(using NAICS)xxv
14–18
19–24
25–54
55–64
65+
7%
25%
34%
21%
13%
Education of Current Healthcare Workforce(using NAICS)xxvi
Less than high school
High school or equivalent
Some college or associate degree
Bachelor's degree or advanced
Educational attainment not available
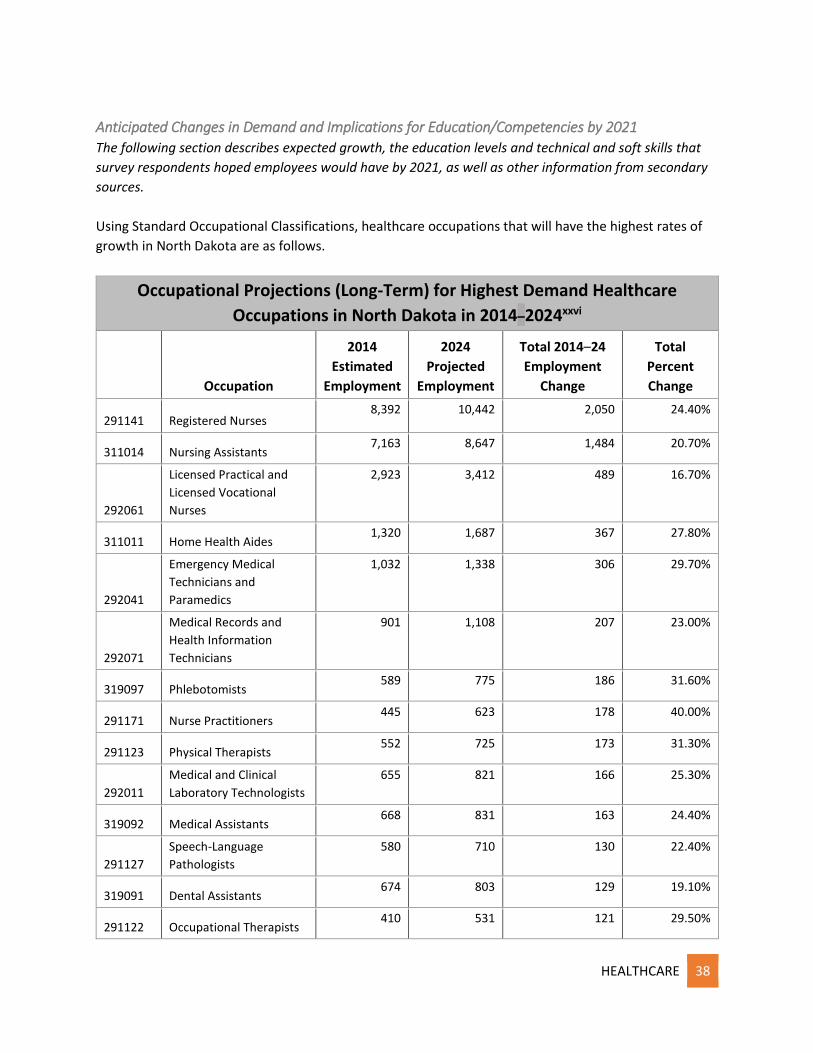
HEALTHCARE 38
Anticipated Changes in Demand and Implications for Education/Competencies by 2021
The following section describes expected growth, the education levels and technical and soft skills that
survey respondents hoped employees would have by 2021, as well as other information from secondary
sources.
Using Standard Occupational Classifications, healthcare occupations that will have the highest rates of
growth in North Dakota are as follows.
Occupational Projections (Long-Term) for Highest Demand Healthcare
Occupations in North Dakota in 2014–2024xxvi
Occupation
2014
Estimated
Employment
2024
Projected
Employment
Total 2014–24
Employment
Change
Total
Percent
Change
291141 Registered Nurses 8,392 10,442 2,050 24.40%
311014 Nursing Assistants 7,163 8,647 1,484 20.70%
292061
Licensed Practical and
Licensed Vocational
Nurses
2,923 3,412 489 16.70%
311011 Home Health Aides 1,320 1,687 367 27.80%
292041
Emergency Medical
Technicians and
Paramedics
1,032 1,338 306 29.70%
292071
Medical Records and
Health Information
Technicians
901 1,108 207 23.00%
319097 Phlebotomists 589 775 186 31.60%
291171 Nurse Practitioners 445 623 178 40.00%
291123 Physical Therapists 552 725 173 31.30%
292011
Medical and Clinical
Laboratory Technologists
655 821 166 25.30%
319092 Medical Assistants 668 831 163 24.40%
291127
Speech-Language
Pathologists
580 710 130 22.40%
319091 Dental Assistants 674 803 129 19.10%
291122 Occupational Therapists 410 531 121 29.50%

HEALTHCARE 39
Occupational Projections (Long-Term) for Highest Demand Healthcare
Occupations in North Dakota in 2014–2024xxvi
Occupation
2014
Estimated
Employment
2024
Projected
Employment
Total 2014–24
Employment
Change
Total
Percent
Change
292021 Dental Hygienists 624 744 120 19.20%
Using Standard Occupational Classifications, related occupations will also grow in the next five years.
Occupational Projections (Long-Term) for Highest Demand Healthcare-Related
Occupations in North Dakota in 2014–2024xxvii
Occupation
Code Occupation
2014
Estimated
Employment
2024
Projected
Employment
Total 2014–24
Employment
Change
Annual Avg.
Percent Change
119111
Medical and Health
Services Managers
843 1,023 180 2.00%
436013 Medical Secretaries 535 663 128 2.20%
291122
Occupational
Therapists
410 531 121 2.60%
Survey respondents provided mixed messages about the increased demand for specific positions;
however, among those that responded to the question, nearly all agreed that the overall number of
workers in the healthcare industry would increase over the next five years. With reduced state budgets
and a slower oil economy, demand has slowed; however, the aging population provides an on-going
need for more employees.
Changes in Knowledge, Skills, and Abilities (KSA)/Competencies
While the FHI 360 survey had a limited number of respondents, responses to open-ended questions
regarding knowledge, skills, and abilities provided some insights.
While communication was listed as the most important soft skill, respondents also noted time
management/ability to prioritize/multi-tasking and compassion/empathy as important soft
skills.
Respondents provided mixed responses to employees’ ability to take on supervisory and
leadership positions. (Several individuals skipped the question. Of those that answered, about
two-thirds said staff was ready to take on leadership roles.) Respondents provided specific
training and areas of expertise that were required for leadership roles, with a particular focus on
human resources management, including performance management, conflict resolution, and
policies.

HEALTHCARE 40
According to survey respondents, staff will need to become increasingly tech savvy with some
staff needing to learn data analysis. Other staff will need to learn how to integrate the use of
technology (and charting) into providing hands-on care.
Some respondents highlighted an increased need for management and data analysis positions
due to increased regulations; however, we consider this anecdotal until other biennial reports
are released.

HEALTHCARE 41
Healthcare Findings and Recommendations
Findings
Finding: The healthcare sector will continue to experience dramatic shortages over the next five
years. The disparity in geographic distribution of physicians and technicians are particularly
acute according to industry reports.
Recommendations
Recommendation for new entrants: Encourage the development of a stronger link between
high schools and post-secondary institutions, such as Career and Technical Education Programs
of Study, with a particular focus on hard-to-fill positions. The development of programs of study,
or programs where students earn specific credits during high school that transition to college-
level course work, would be desirable.
Recommendation: Identify high demand occupations with a low barrier to entry/relatively little
education needed (e.g., personal care aide) and identify transferrable skills required by those
"low barrier" occupations to help determine career paths.
Recommendation: Strong sector mapping, consisting of identifying the high demand jobs, the
location of those jobs, the pipeline of individuals exiting and entering those jobs, as well as the
training pipeline, could help current healthcare staff grow within the sector.
xxiii U.S. Census Bureau. Longitudinal Employer-Household Dynamics. “North Dakota’s Beginning of Quarter Employment: Counts by NAICS 3-digit Subsectors and Yearly Averages.” NAICS Sectors: 621 (ambulatory health care services), 622 (hospitals), and 623 (nursing and residential care facilities). Accessed 30 November 2016. http://qwiexplorer.ces.census.gov xxiv U.S. Census Bureau. Longitudinal Employer-Household Dynamics. “North Dakota’s Beginning of Quarter Employment: Counts by Worker Age and Yearly Averages.” NAICS Sectors: 621 (ambulatory health care services), 622 (hospitals), and 623 (nursing and residential care facilities). Accessed 30 November 2016. http://qwiexplorer.ces.census.gov xxv U.S. Census Bureau. Longitudinal Employer-Household Dynamics. “North Dakota’s Beginning of Quarter Employment: Counts by Worker Education and Yearly Averages.” NAICS Sectors: 621 (ambulatory health care services), 622 (hospitals), and 623 (nursing and residential care facilities). Accessed 30 November 2016. http://qwiexplorer.ces.census.gov xxvi Labor Market Information Center. Job Service North Dakota, Projections Unit. “Occupational Projections (Long-term) for Multiple Occupations in North Dakota in 2014–2024.” (Occupation codes: 290000, 390000, 310000, 291141, 311014, 399021, 292041, 292071, 119111, 291171, 291123, 319092, 291127, 436013. Note: Other codes were referenced, but only codes that anticipate an employment change of 100+ were included in the table.) Accessed 30 November 2016. https://www.ndworkforceintelligence.com xxvii Labor Market Information Center. Job Service North Dakota, Projections Unit. “Occupational Projections (Long-term) for Multiple Occupations in North Dakota in 2014–2024.” (Occupation codes: 290000, 390000, 310000, 291141, 311014, 399021, 292041, 292071, 119111, 291171, 291123, 319092, 291127, 436013. Note: Other codes were referenced, but only codes that anticipate an employment change of 100+ were included in the table.) Accessed 30 November 2016. https://www.ndworkforceintelligence.com
Healthcare Findings
and
Recommendations

AGRICULTURE 42
Agriculture Agriculture was not originally included as one of the fast-growing sectors identified by WEAC. However,
the group elected to add publically available data about agriculture to the report as it is an essential
element of North Dakota’s economy. No recommendations were made for this sector.
Information Gathering Methods
FHI 360 conducted secondary data research, relying heavily on U.S. Census Bureau and Job Service
North Dakota. This may or may not be a good representation of needs.
Limitations and Caveats of the Findings
The agriculture report is not intended to be comparable in depth to the other industries, but rather
provide general information about the size and scope of agricultural employment in North Dakota.
Snapshot of Agriculture in North Dakota
For the purposes of this snapshot, the following NAICS codes were used:111(crop production), 112
(animal production and aquaculture), 113 (forestry and logging), 114 (fishing, hunting, and trapping),
and 115 (support activities for agriculture and forestry).
xxviii
2011 2012 2013 2014 2015 2016
Support Activities for Agricultureand Forestry
750 771 757 782 739 728
Fishing, Hunting, and Trapping
Forestry and Logging
Animal Production and Aquaculture 591 582 594 619 646 628
Crop Production 2377 2578 2721 2850 2893 2202
Agriculture Sector (using NAICS) by Yearxxix
Agriculture

AGRICULTURE 43
Using Standard Occupational Classifications, agriculture occupations will change in the following ways.
Occupational Projections (Long-term) for Agriculture Occupations in North
Dakota in 2014–2024xxix
Occupation
Code Occupation
2014
Estimated
Employment
2024
Projected
Employment
Total 2014–24
Employment
Change
Annual Avg.
Percent
Change
450000
Farming, Fishing, and
Forestry 6,922 6,923 1 0.00%
452091
Agricultural
Equipment Operators 860 949 89 1.00%
452011 Agricultural Inspectors 260 283 23 0.90%
452099
Agricultural Workers,
All Other 106 103 -3 -0.30%
452021 Animal Breeders 28 28 0 0.00%
452092
Farmworkers and
Laborers, Crop,
Nursery, and
Greenhouse 3,889 3,806 -83 -0.20%
452093
Farmworkers, Farm,
Ranch, and
Aquacultural Animals 971 949 -22 -0.20%
451011
First-Line Supervisors
of Farming, Fishing,
and Forestry Workers 186 169 -17 -1.00%
454011
Forest and
Conservation Workers 207 245 38 1.70%
452041
Graders and Sorters,
Agricultural Products 378 357 -21 -0.60%
xxviii U.S. Census Bureau. Longitudinal Employer-Household Dynamics. “North Dakota’s Beginning of Quarter
Background Information.” Employment: Counts by NAICS 3-digit Subsectors and Yearly Averages.” NAICS Sectors:
111(crop production), 112 (animal production and aquaculture), 113 (forestry and logging), 114 (fishing, hunting
and trapping), and 115 (support activities for agriculture and forestry). Accessed 29 December 2016.
http://qwiexplorer.ces.census.gov
xxix Labor Market Information Center. Job Service North Dakota, Projections Unit. “Occupational Projections (Long-term) for Multiple Occupations in North Dakota in 2014–2024.” (Occupation codes: 450000, 452091, 452011, 452099, 452021, 452092, 452093, 451011, 454011, 452041.) Accessed 29 December 2016. https://www.ndworkforceintelligence.com

BACKGROUND INFORMATION 44
Sources
Information Technology Council of North Dakota. “State of the IT Industry 2015 Guide.” Accessed 30
November 2016. http://cl-itcnd-website-test.sycorr.net/wp-content/uploads/2016/02/ITCND-Guide-
2015-Final.pdf
Information Technology Council of North Dakota. “State of the IT Industry Guide 2017.” Pg. 21
Labor Market Information Center, Job Service North Dakota, Projections Unit. “Occupational
Projections (Long-term) for Multiple Occupations in North Dakota in 2014–2024.” Accessed 2 December
2016. https://www.ndworkforceintelligence.com
ND Information Technology Department. Survey of Employees. 2016
Tip Strategies. Regional Workforce Study Grater Fargo/Moorhead Region. June 2015. Accessed 4
December 2016.
http://www.fargomoorhead.org/assets/templates/fmcvb/uploads/docs/2015_06_15_Fargo_Regional_
Workforce_Study_FINAL.pdf
U.S. Census Bureau. Longitudinal Employer-Household Dynamics. “North Dakota’s Beginning of
Quarter Employment: Counts by NAICS 3-digit Subsectors and Yearly Averages.” Accessed 30 November
2016. http://qwiexplorer.ces.census.gov
U.S. Census Bureau. Longitudinal Employer-Household Dynamics. “North Dakota’s Beginning of
Quarter Employment: Counts by Worker Age and Yearly Averages.” Accessed 29 November 2016.
http://qwiexplorer.ces.census.gov
Background
Information

BACKGROUND INFORMATION 45
About FHI 360
FHI 360 is a nonprofit human development organization dedicated to improving lives in lasting ways by
advancing integrated, locally driven solutions. Our staff includes experts in health, education, nutrition,
environment, economic development, civil society, gender, youth, research, technology,
communication, and social marketing—creating a unique mix of capabilities to address today's
interrelated development challenges.
FHI 360’s National Institute for Work and Learning (NIWL) promotes the integration of education and
employment systems to ensure lifelong learning and productivity for all. Working with foundations,
state agencies, school districts, institutions of higher education, businesses, community-based
organizations, and the workforce system NIWL fosters collaboration among and across sectors through
research and evaluation; program development; policy analysis; training and technical assistance;
partnership building; and information sharing.
Report Authors
Stephanie Davison
Stephanie Davison, M.P.A., is a program manager in FHI 360’s National Institute for Work and Learning.
Ms. Davison leads and coordinates a range of projects supporting the education-workforce pipeline. As a
program manager, Ms. Davison guides and coordinates the design, management, coordination, and
implementation of programs. In particular, Ms. Davison directs an assessment of the education-
workforce pipeline for particular technical jobs in North Dakota’s oil patch. She also provides technical
support and expertise to workforce projects focusing on health and retail careers. Further, Ms. Davison
led a corrections project for the U.S. Department of Justice, which supported the dissemination of best
practices in the fields of energy corrections practices and training and reentry programs. Ms. Davison
has also served as a research associate for U.S. Department of Labor and Education projects. Before she
joined FHI 360, Ms. Davison worked in a variety of capacities supporting youth development and
training programs.
Ivan Charner
Ivan Charner is the Director of FHI 360’s National Institute for Work and Learning. He is a domestic
education and workforce development specialist with over 40 years of experience in the design,
development, and management of projects and programs dealing with educational policy, teacher
education and professional development, college and career readiness, workforce development, and
systemic reform. He works with state and local school systems, higher education institutions,
corporations, government agencies, and community-based organizations to integrate and improve
education, training, and career-related systems. Mr. Charner’s areas of expertise include career and
technical education; teacher preparation and professional development; school-to-career system
building; school reform; curriculum integration; school-business partnerships; work-based learning; and
adult education and training. He designs and conducts training workshops, seminars, and conferences, is
a regular presenter at the American Association of Colleges of Teacher Education, and has written
extensively on teacher preparation and effectiveness, youth transition from school to career, school

BACKGROUND INFORMATION 46
reform, college and career readiness issues, instructional coaching, career and technical education, and
school-business partnerships.
Caitlin Rose Dailey
Caitlin Rose Dailey, M.A., is currently a program manager and qualitative researcher for FHI 360’s
National Institute for Work and Learning (NIWL) with nearly 10 years of experience in U.S. education and
workforce development. She has demonstrated experience in qualitative data collection and analysis of
education reform efforts in schools, intermediary units, and universities. Dailey is also experienced at
reporting for diverse audiences including government agencies, foundations, professional associations,
and the general public. She has led qualitative data collection and analysis efforts for state-level reform
initiatives in Pennsylvania and North Dakota. Dailey co-directed the Teachers for a New Era (TNE)
Learning Network, a consortium of 30 university teacher preparation programs dedicated to innovation
in teacher education. Before joining FHI 360, Dailey served as a graduate teaching assistant at The
George Washington University and completed research and public programming internships at the
Smithsonian Institution’s National Museum of Natural History and at San Francisco Maritime National
Historical Park.
Eleanor Wang
Eleanor Wang, M.A., has seven years of experience in research, monitoring, and evaluation using
quantitative and qualitative data analysis. She works on projects related to secondary and post-
secondary education, college and career readiness, economics, and workforce development. Her skills
include data collection and analysis; interviews and focus group discussions; technical report writing;
and research and literature reviews. She has evaluated the impact of college and career readiness
programs for youth, and written numerous reports on the relationship between skills, workforce
development, and education. Currently, Ms. Wang monitors and evaluates a U.S. Department of
Education Gaining Early Awareness and Readiness for Undergraduate Programs (GEAR UP) grant and
evaluates the economic impact of a USAID-funded agriculture finance project and assesses USAID-
funded YouthPower Action, a youth workforce development program.