
Danish experiences Søren Dyck-Madsen The Danish Ecological Council - DEC.

The ecology of organisations in Danish tourism: a regionalThe ecology of organisations in Danish tourism: a regionalThe ecology of organisations in Danish tourism: a regionalThe ecology of organisations in Danish tourism: a regionalThe ecology of organisations in Danish tourism: a regionallabour perspectivelabour perspectivelabour perspectivelabour perspectivelabour perspective
Anne-Mette Hjalager, Associate Research Pr ofessorDepartment of Or ganization and ManagementAarhus School of BusinessHaslegaar dsvej 10DK-8210 Aarhus VTel: + 45 89 48 66 09E-mail: anne-mette.hjalager@or g.hha.dk
Anne-Mette Hjalager is an associate r esearch professor with the Aar hus School of Business,Department of Or ganization and Management. This article is one outcome of a largerproject on or ganizational transformation and car eer patterns in tourist sectors. Over thepast decade, the author has been involved in other studies of economic aspects of tourismdevelopment.

The ecology of organisations in Danish tourism: a regionalThe ecology of organisations in Danish tourism: a regionalThe ecology of organisations in Danish tourism: a regionalThe ecology of organisations in Danish tourism: a regionalThe ecology of organisations in Danish tourism: a regionallabour perspectivelabour perspectivelabour perspectivelabour perspectivelabour perspective
Abstract:Abstract:Abstract:Abstract:Abstract:
Tourism is often claimed to be a major employment-cr eator and a viable path to
development in r ural ar eas. W ith the exception of the most sparsely populated ar eas, this
is supported by Danish data for the overall growth in the number of enterprises and jobs,
covering the period 1981-1994. The paper demonstrates and discusses the dynamics of
regional tourism development in terms of the establishment, the survival and mortality of
restaurants and accommodation facilities. This study of the ecology of organisations
unveils a considerable turbulence, i.e. considerable numbers of firm entries as well as
exits. Stability tends to corr elate positively with urbanisation. In addition, the higher
stability of enterprises in urban ar eas r esults in qualitatively diff erent types of
employment but, surprisingly, size and age of the or ganisation rather than managerial
capacity or trained personnel seem to determine the chances of survival.
IntroductionIntroductionIntroductionIntroductionIntroduction
Disadvantaged r egions and declining urban ar eas fr equently clutch at tourism as the last
chance for economic r ecovery. The economic strategies of these regions are supported by
favourable global growth trends in tourism, which are often pr esumed to translate, more
or less unabated, into increased economic activity at the local level (Inskeep, 1994; Smith,
1992; Theobald, 1994; WTO, 1997). Evidence based on tourist numbers and expenditure
indicates that the benefits of tourism are widely spr ead, and that formerly closed or less
accessible ar eas, for example in Eastern Eur ope, are catching up quite rapidly.
While the benefits at the national level might be considered fairly obvious, they are less
clear at the r egional level. In a geographical sense, tourism is a multi-faceted activity
(Pearce, 1991), and the blights and blessings are not uniformly distributed. Regional
outcomes are determined by numer ous factors, for example diff erences in natural
endowments, facilities and infrastructure, and accessibility. As tourism r elies heavily on
natural r esour ces, there are many pointers towards the inclusion of this particular
economic sector in development strategies in remote or r ural ar eas.
Political concern is often placed on the job creation side. But what kinds of jobs are
created, and for whom? The assumption is frequently made that tourism can r eplace

employment opportunities that disappear due to pr oductivity gains in agriculture and
manufacturing industries. (Commission of the European Communities, 1994). But shifts
towards services also raise the expectations of a new supply of jobs for a better educated
workforce which, in a wider sense, could be beneficial for the local economies.
W ith the use of empirical data from Denmark, this article addr esses the potentials of
tourism as a sector for development, and extracts data from the r estaurant and
accommodation sectors for this purpose. The pr esentation of empirical evidence falls into
two distinct sections. First, the context of r egional tourism development in Denmark is set.
The section provides a general and basic framework for an evaluation of gr owth
prospects. A framework of this kind is often used as the foundation for r egional policies,
but it cannot be r egarded suf ficient for a more compr ehensive understanding of
underlying dynamics in the sector. Ther efore, as a second and major part of the
presentation of the empirical evidence, the sector will be analysed in terms of the
enterprise establishment, survival and mortality rates. Instead of looking at the net
development exclusively, this part r ecomposes the gross developments of the population
of enterprises taking place in the period 1981-1994. The very simple logic employed is
that the scope and scale of the turbulence crucially influences pr ospects in a r egion. If, for
instance, the entries and exits r each excessive levels, this might compr omise not only an
accumulation of capital and incomes, but also the building of suf ficient and lasting
repositories of competence and knowledge. Contrarily, if a large population of enterprises
survives unchanged for a long period of time, the sector might also end up in a vulnerable
position lacking the suf ficient risk based stimulation for continual innovation and
renewal.
The empirical documentation pr ovided in the article is firmly entr enched in the long-
established tradition of or ganisational ecology (r eviewed by Freeman (1982), Baum (1996,
and Singh and Lumsden (1995)). The ecology appr oach focuses on selection pr ocesses in a
population of enterprises. This does not mean that the conscious actions of individuals
enterprises and managers do not matter, just that these actions are influenced by the
envir onments and that they emerge with random ef fects. Ecological r esearch on
organisational populations often utilises very long time series, and aims at explaining
how social, economic and political conditions af fect the abundance and the composition of
organisations over time (Baum 1996). The importance of or ganisational inter dependencies
(density and hereby the level of competition, and niche-width, which comprises the ef fects
of specialisation) is cr ucial in a number of inquiries. So is the role of the size and age of
enterprises in the population. In all studies, data on events of foundings, survivals and
failures are the key sources, and various attributes are attached to these life events of
individual organisations in the population. T able 1 pr ovides a brief overview of the most
common explanatory variables included in populations studies.

(Table 1 about here )
This paper adds a further envir onmental element to Baum’s (1996) list, namely geography,
here in the sense of the degree of urbanisation 1 . The concept is r elated to the density
issues mentioned in table 1, although the population size r eplaces the number of
enterprises as an indicator. Tentatively, the article also challenges the population ecology
tradition by including the composition of labour as a supplement to the analysis of
demographic pr ocesses 2 . The idea is to investigate whether the survival of or ganisations
is influenced positively by a higher managerial capacity in the or ganisations and whether
any significant regional diff erences can be observed. In fact, by this attempts to add an
element of managerial discr etion to the analysis. The models later in this article test the
explanatory power of labour composition vis-à-vis standard variables such as enterprise
size and age.
However, it must be emphasised that the level of sophistication of data and analysis in
this paper does not fully match that in recent studies in or ganisational ecology.
Furthermore, data on the geographical characteristics of the labour force in tourism are
collected for purposes other than organisational ecology and are not directly tied to the
analysis of the establishment, survival and failure of business enterprises. This implies, for
instance, that we cannot take a full account of variations due to seasonality, and that
employment levels cannot be adjusted for part-time positions.
The availability of long time series of data is crucial to the analysis of or ganisational
foundation, survival and mortality. Ideally, time series should cover the entire period of
existence of the population as, for example, in the studies of co-operative banks in Italy
(Lomi, 1995) and br eweries (Hannan and Fr eeman, 1989). In many cases, however, data
does not exist for consistent time series covering a century or more. While this study has
access to data of high quality and consistency, the material only covers the period 1981-
1994. The enterprises included in the study are operating units, i.e. workplaces with a
salaried workforce. Companies can consist of several such geographically dispersed units.
Since this paper focuses on geographical and employment issues, companies are not
considered r elevant as units for analysis. Thr oughout the paper, the workplaces will be
called “enterprises”. The establishment, survival and mortality of enterprises are complex
phenomena, which are not easy to r egister unambiguously. The IDA data bank 3 , which is
used as a source for this analysis, r ecords several categories, mainly based on labour forc e
movements. For example, an enterprise may survive legally, but nevertheless lose its
status as a place of work, that is its identification as an or ganisation. Similarly,

businessmen and women can operate permanently, or for a long period of time, without
salaried employees. To ensure the highest possible consistency and avoid the ef fects of
passive or ganisations in the data set, ther efore, only employers are included in the
analysis.
Geographical development in the restaurant and accommodation sectorGeographical development in the restaurant and accommodation sectorGeographical development in the restaurant and accommodation sectorGeographical development in the restaurant and accommodation sectorGeographical development in the restaurant and accommodation sector
Since the first r egional development act in Denmark in the early 1950s, uneven economic
conditions determined a series of policies comprising subsidies for enterprises,
infrastr ucture investments, and the expansion of educational facilities etc. The pr oblems
initially envisaged in Denmark were the “classical” ones: rapid mechanisation of
agriculture, leading to high unemployment rates in r ural ar eas, while a favourable
development could be observed in lar ger cities. Over the next decades, a significant
restructuring took place (Maskell 1986). Manufacturing industries expanded in the
W estern part of Denmark and in many r ural ar eas, while the service sector and
particularly advanced industries (for example in pharmaceuticals and electr onics)
developed with considerable success in the metr opolitan ar eas. The latest development
has seriously questioned traditional r egional policy paradigms. Regional diff erences in
terms of for instance unemployment are diminishing, while other and more complex
patterns of specialisation are replacing the previous picture (Maskell 1992).
The r ole of tourism in the Danish economy is not insignificant compared to the r est of
Europe (Eurostat 1998). Over the past decades, incoming tourism has expanded
progressively, predominantly as an outcome of incr eased German demand for r ented
holiday cottages (Danmarks T uristråd 1998). Nearly all r egions have benefitted fro m
activities connected to tourism, although some variations can be observed (Rafn 1996). In
the following discussion the focus is on the number of r estaurants and holiday
accommodations facilities.
Figure 1 illustrates the gr owth of the restaurant sector 4 . In the period 1981-1994, the
number of r estaurants increased by 20%, to a total of 6,500. Gr owth slowed only during
the period 1988-1990, due to political intervention aimed at limiting private consumption.
(Figure 1 about here )
It i s interesting to observe that, until very r ecently, the number of restaurants in the
metr opolitan area has gr own quite modestly, while other types of municipalities have
experienced more rapid gr owth. Gr owth has been more unstable in r ural ar eas, and not
visibly influenced by various political interventions, but there has been a genuine decline

in the period 1990-1994.
The metr opolitan area is likely to have established a fairly high level of catering
opportunities at an early stage, while urban lifestyles are adopted later in smaller towns,
villages and rural districts. These r egions are catching up. The decline in r ural ar eas may
be due to the dif ficulty of r unning a restaurant in sparsely populated ar eas; after years of
effort by new and existing owners to stay in business, there has been a rash of closure s.
This will be examined in more detail later.
The development pr ocess found in the accommodation sector (hotels, camping sites, and
youth hostels) 5 is illustrated in figure 2.
(Figure 2 about here )
From 1981 to 1992, there was an overall increase in the number of enterprises in the
accommodation sector, from 1195 to 1225 units. Compared with the gr owth in the
restaurant sector, this is a modest increase. The lack of inter est in investing in new hotels,
youth hostels and camping sites may be due to a considerable over-capacity and low
return on investment throughout the period (Holm-Pedersen et al., 1993; Pade & Partnere ,
1992). Moreover, tourists incr easingly pr efer alternative accommodation, pr edominantly
rented holiday cottages (Danmarks T uristråd, 1998) Unfortunately, the enterprise
developments connected to the latter activity cannot be included in this analysis.
It can be pr esumed that accommodation and r estaurant facilities develop
inter dependently. A bed and access to food are the basic needs of any tourist. However, it
is only in r ural ar eas that there is any plausible corr elation between r estaurants and
accommodation facilities. In other ar eas, the effects of local r esidents’ spending on
restaurants will tend to modify the corr elation between the development of catering and
accommodation.
Foundations and failures - main findingsFoundations and failures - main findingsFoundations and failures - main findingsFoundations and failures - main findingsFoundations and failures - main findings
The glamor ous picture of gr owth in tourism conceals the extent and nature of the more
subtle dynamics of the sector. The establishment, development and maintenance of a
business is, of course, the r esult of the skills of the individual businessperson and the
success of the strategy adopted. But organisational ecology focuses on the envir onmental
context that pr oduces variations in organisational foundation and failure rates over time,
rather than individual skills.

A first insight into the underlying dynamics of the sector is given in table 2 which shows
the annual average and standard deviation of survival, foundation and failure rates for the
period 1981-1994 for r estaurants and accommodation r espectively. The following
definitions are used for the “population ecology events” included in the analysis:
Survival: Enterprises with a salaried workfor ce, which continue unchanged from one year
to the next, though there can be supplements to the workforce or dismissals to/from other
enterprises.
Three types of foundation can be distinguished:
New enterprises: Enterprises not found in the data set in pr evious years.
Spin-of f enterprises: Enterprises established thr ough the formal segr egation of part of
another enterprise, where the majority of employees are kept on.
Barrier -br eaking enterprises: Enterprises which, in the pr evious year, existed without a
salaried workforce, e.g. “mom-and-pop” businesses or passive enterprises.
As regards failures, only total closur es are included in this data set. Registrations concern
events which take place from one year to the next, and averages over the period 1981-1994
are calculated.
(Table 2 about here )
There is considerable turbulence in tourism (Figure 2): from one year to the next, and
accumulated for the period 1981-1994, only 76% of restaurants survive. The average
survival rate for accommodation establishments is somewhat higher, at 82% per year.
There is some association between survival rates and geography: a location in an urban
area incr eases the pr obability of survival, albeit only slightly.
The above picture is supplemented by the standard deviation for the two areas. The
relative dispersion in the number of surviving restaurants in the period concerned is
lower in urban ar eas than r ural ar eas. This pattern is not seen in the case of
accommodation facilities, however.
Most of the firms founded are completely new or ganisations (T able 3). Annually, 15.3% of
the population of r estaurants is r enewed by the foundation of new enterprises, while 5.5%
is renewed as a r esult of enterprises shifting from being pur ely family-based or passive to
active employers. Spin-offs account for a smaller number. The same pattern is found in the

accommodation sector, though the foundation rates are lower in all gr oups.
(Table 3 about here )
Firm dynamics are less accentuated in urban ar eas than in more sparsely populated
locations. But the composition of the foundations dif fer in important respects. The rate of
spin-offs corr elates positively with urbanisation, pr obably because higher density
facilitates such transformations. By contrast, the considerable number of foundations
based on the transformation of family enterprises to employers is characteristic of r ural
and other sparsely populated ar eas. Enterprises of this kind can move in and out of the
status of being an employer for years before finally closing, or until they are assured of a
sustained higher level of business.
The various means and standard deviations give a blurred picture. Notwithstanding, there
is some indication that, for r estaurants, turbulence as r eflected in the variance of
foundations in the period 1981-1994, is higher in small communities and sparsely
populated ar eas. However, this is not the case for foundations based on the development
of family-based enterprises, which is obviously a normal business practice in r ural areas
and village economies, in that it takes place with “standard” fr equency.
W e now turn to the geographical distribution of failures. Only one type of event is
included in T able 4: final closur es, where employees are dismissed and the or ganisation is
dissolved. The pr oportion of failures corr espond to average foundation rates (new
enterprises). While fewer enterprises were established in densely populated ar eas, failure
rates are also (slightly) lower than in r ural ar eas and villages.
(Table 4 about here )
Of inter est here is whether there is a “hard core” of enterprises that are not af fected by
turbulence, and, if so, whether there are any specific r egional diff erences in the pr oportion
of such enterprises. In order to illuminate this, Figure 3 shows the survival rates of the
1980 population (all enterprises) for the period 1981-1994.
(Figure 3 about here )
It can be seen that, over a period of 14 years, there is a considerable, but gradual, decline
in the number of enterprises. At the end of this period, less than 20% of r estaurants have
not been thr ough major or ganisational change. Closure rates are particularly high during
the “infancy period”. When r egional aspects are included, it can be seen that the initial
vulnerability is higher in less urbanised ar eas. However, in the long term, survival rates

end up at appr oximately the same level.
Very similar conclusions can be drawn about the survival of accommodation facilities,
though, on the whole, hotels, camping sites and youth hostels are less likely to close or
undergo major organisational change than r estaurants ( Figure 4). There is no long-term
regional congr uence of survival chances for the population of accommodation facilities as
there is with the population of restaurants.
(Figure 4 about here )
Composition of labourComposition of labourComposition of labourComposition of labourComposition of labour
This section takes a more detailed look at the establishments from a labour perspective. As
mentioned in the intr oduction, employment is often the main driving force of tourism
policies., but the cr ucial issue is whether the “ecological” pr ocesses compr omise the job
objectives. To pr ovide a first overview, figure 9 shows some remarkable diff erences in the
composition of labour in the metr opolitan area and the rest of the country.
The period 1985-92 saw a considerable incr ease in employment in non-metr opolitan ar eas,
while in Copenhagen and its suburbs, there was a small job loss. Interestingly, the gr owth
in jobs does not af fect personnel turnover, which is very high in both r egions. Rapid
turnover seems to be a str uctural rather than a geographically-determined phenomenon,
and it is not likely that the gr owth per se in tourism will r esult in a stabilisation of
employment.
The recruiting patterns of metropolitan tourism enterprises dif fer in their gr eater use of
immigrants. Immigrant labour is in gr eater supply in large cities, which is partly the
reason for the r elatively high average in these ar eas.
(Table 5 about here )
While the employment of students (working part-time) is surprisingly high all over the
country, the geographical variation is r emarkable. Despite the high concentration of
educational institutions at all levels in the metr opolitan ar ea, student labour is more
intensively utilised by enterprises outside the metropolitan are a.
Correspondingly, the employment of workers with a formal education in tourism is more
pronounced in the metr opolitan area than in other parts of the country. Generally, the
overall number of trained cooks, waiters, receptionists, tourism economists and sales
persons, etc., is rather limited compared with the number of students who have graduated

in these ar eas over the past few decades (Hjalager, 1996). Accor dingly, the high turnover
rate is also explained by a search outside core tourism for better -paid jobs, more
convenient working hours, etc. (European Institute, 1991; Iverson and Deery, 1997; Riley,
1991, Lucas 1995). To the extent that students do take up permanent r esidence at the site of
work, this employment repr esents a net surplus (tax-paying and economic activity) for
less urbanised ar eas. However, the loss from local economies caused by a geographically
mobile and flexible student workforce is a fact that should be considered when evaluating
the benefits of tourism development in r emote or sparsely populated ar eas.
W omen are particularly heavily repr esented in tourism jobs outside the metr opolitan are a.
This could be due to a number of reasons. The highest pr oportion of women in tourism is
found in west Jutland, in ar eas with very low average unemployment rates, where the
male labour force is more likely to be employed in (more attractive and better paid) jobs in
manufacturing industries. Conversely, higher unemployment and lower gr owth in the
Copenhagen area is associated with men remaining in the sector, since there are fewer
alternatives.
These labour issues underline the need to tr eat the potential benefits of r egional tourism
development strategies with some caution. The analysis of opportunities and benefits
should be modified to take account of gr eater instability, less attractive types of jobs, and
economic losses.
The composition of labour and organisational survivalThe composition of labour and organisational survivalThe composition of labour and organisational survivalThe composition of labour and organisational survivalThe composition of labour and organisational survival
The first part of this paper discussed the ecology of tourism enterprises, and levels of
turbulence were shown to corr elate with the levels of urbanisation. The next section
addr essed regional diff erences in the composition of labour, documenting the (in a
traditional sense) less sustainable recr uiting practices in non-metr opolitan ar eas.
Combining these two aspects raises the question of whether the composition of the labour
force has any significant ef fect on or ganisational survival.
To help answer this question, a regression analysis of the ecology data was carried out.
Enterprises that existed in both 1993 and 1994 are included in the analysis. Their survival
is related to age and size and, in Model 2, to the proportion of unskilled and skilled
workers and junior and senior managers. Table 6 shows parameter estimates and standard
deviation test r esults in the case of r estaurants.
(Table 6 about here )

As in most other ecology studies, a clear r elation can be found between age and size on
the one hand, and survival on the other. Business strategies aimed at securing advantages
of scale, and which rely on the internal division of labour, seem to enhance survival
chances relatively uniformly. As experience is gained and organisational set-ups and
routines are established, enterprises have a gr eater probability of survival. The ef fects of
age and size applies to r estaurants in all five r egions without any significant variation.
Labour consists of two categories of managers and two of employees in operational
functions. The r estaurants’ human resource policies are not significantly corr elated with
survival - size and age have a more decisive explanatory value. For example, a substantial
managerial capacity does not seem to pr olong the life of r estaurants to any significant
degr ee, nor does the existence of r elatively numer ous skilled workers.
It was previously stated that r estaurants in the metropolitan area employ comparatively
more skilled workers. This analysis shows that giving a higher priority to this category of
labour does not offer any guarantee of survival. Nor does a r elatively high pr oportion of
any other category of staff increase the likelihood of survival.
Hotels/camping sites are generally lar ger enterprises than restaurants and, in
consequence, can be expected to put a gr eater emphasis on management capacity and to
formalise these employment categories more than smaller enterprises (Hjalager, 1996).
However, it is not possible to show from the regr ession analysis (T able 7) that the
proportion of managers is a particularly significant factor in the survival of these
enterprises. Nor do other categories of staff crucially influence the survival rates of
accommodation facilities. For example, accor ding to these data, the use of low-skilled
operating staff cannot uniformly ensure gr eater pr obability of survival. The variance in the
composition of labour is considerable, and there does not seem to be any one “best
practice” r egar ding the composition of manpower in the field of human resources
management. If such a thing as a distinct regional variation in more subtle managerial
traditions does exist, it is not observable in this data set.
(Table 7 about here )
Since survivals are not easily explained by the composition of labour, i t i s very di ff icul t,
using these types of data, to find support for regional tourism policies that focus
specifically on labour or training issues. If the aim is to enhance survival in the tourism
industry, other measur es, with a gr eater focus on investments, infrastr ucture, concept and
process innovation, quality standards, marketing, etc., would be more appropriate. Labour

market or manpower policies should be r egar ded as supplementary or auxiliary
instr uments only.
Conclusion and discussionConclusion and discussionConclusion and discussionConclusion and discussionConclusion and discussion
The data used in this paper show that tourism has contributed significantly to gr owth in
the number of enterprises and jobs in regions normally characterised in the literature as
less favour ed. One exception is sparsely populated areas, where a negative tr end has
lately r eplaced former growth. Notwithstanding, it is debatable whether the non-
urbanised ar eas fully deserve to be called less favoured any more. In the Danish periphery,
there are parallel positive developments in manufacturing industries, r esulting in the
stabilisation of local economies and incr easing employment, which is not only based on
tourism.
However, considering the traditional view of r egional development pr ocesses and the
supplementary information in this paper, there are still some r eservations. It was shown
that turbulence, in the sense of the establishment and closure of enterprises, is somewhat
more intense in ru ral regions and in r egions with small towns and villages In the
traditional view of r egional development, high instability and turbulence are
unquestionably harmful. Annual survival rates of 76 and 82% for r estaurants and
accommodation facilities respectively, are low compared to other sectors 6
Taking another view, however, the appr opriateness of r egional development theories or
concepts could also be questioned. Are dominant r egional development concepts and
theories that implicitly focus on the benefits of stability losing their explanatory power?
High numbers of entries and exits could, for instance, be r egarded as an expr ession of
ultimate flexibility and adaptation to extr eme and rapid changes in the business
envir onment (Lant and Mezias, 1990). Exits imply the destr oying of capital and
institutional set-ups and routines, and in this sense they repr esent monetary and personal
losses. On the other hand, it can also be necessary in or der to make way for new business
concepts and new modes of or ganisational learning. The material pr esented here
indicates that learning in the tourist sector is not a gradual and strategically well-planned
and internally or ganised and accumulating pr ocess, as is the case in other industries. The
emergence of franchised concepts in the restaurant sector, and gradually in
accommodation as well, corr espond to the findings. Franchised concepts repr esent a
systematisation of knowledge collected in many units and over a longer period of time.
They facilitate the entry and exit of new businesses without compr omising the knowlegde
base.

The composition of labour could also be seen as particularly unfavourable to regional
peripheries. There is plenty of evidence of low qualification levels and high turnover rates,
which could be interpr eted as a lack of or ganisational capacity and professionalism.
Paradoxically, however, while positive development trends in tourism are regar ded as
beneficial, the composition of labour is, to some extent, inconsistent with the concepts of a
modern and pr ofessional tourism sector (Poon, 1993). Most regional policies appr oach this
dilemma by attempts to bridge the competence gaps of the workfor ce, and for some
regions the upgrading of human resour ces is the only or the most important measure This
article illustrates the serious limitations of training pr ogrammes and labour market
policies in the field of tourism. As an instr ument of r egional policy these r eservations
apply to all types of r egions.
This study emphasises the need to be specific about the extent and consequences of
underlying development, and it adds to our understanding of some r egional aspects. In
tourism r esearch the or ganisational ecology appr oach is still not well developed. The
findings pr esented here answer some question, but also raise new ones. As Denmark, in
regional sense, is fairly homogeneous, a replication of the study in other countries with
diver ging regional str uctures is desirable. The study focuses on the enhancement of
humans r esour ces as an instr ument in the development pr ocess. As these r esour ces are
fairly insignificant as explanatory variables for business success, futher studies will have
to take af br oader perspective on managerial strategies. A better understanding of the
regional impacts on business survivals of (international) franchised chains and brands is
particularly cr ucial.

TTTTTable 1: Major ecological processes in organisational foundation, survival and failureable 1: Major ecological processes in organisational foundation, survival and failureable 1: Major ecological processes in organisational foundation, survival and failureable 1: Major ecological processes in organisational foundation, survival and failureable 1: Major ecological processes in organisational foundation, survival and failureApproachApproachApproachApproachApproach Key variablesKey variablesKey variablesKey variablesKey variablesDemographic pr ocesses Organisational age
Organisational size
Ecological processes Niche dynamics, indicating that the population employs a specialist orgeneralist strategy, depending on the nature of the envir onment
Population dynamics, e.g. prior foundations or failures signalling favourable, or the lack of,business opportunities
Density dependence, e.g. the number of units in the population, indicating legitimacy andcompetition
Community dependency, e.g. cross-population density
Envir onmental pr ocesses Institutional pr ocesses, e.g. political turmoil, government regulation,and institutional linkages
Technological pr ocesses

Figure 1: Geographical development in the number ofFigure 1: Geographical development in the number ofFigure 1: Geographical development in the number ofFigure 1: Geographical development in the number ofFigure 1: Geographical development in the number ofenterprises in the restaurant sectorenterprises in the restaurant sectorenterprises in the restaurant sectorenterprises in the restaurant sectorenterprises in the restaurant sector , 1981-1994, index, 1981-1994, index, 1981-1994, index, 1981-1994, index, 1981-1994, index
80
90
100
110
120
130
140
1981
1983
1985
1987
1989
1991
1993
Metropolitanarea
Citymunicialities
Townmunicipalities
Villagemunicipalities
Ruralmunicipalities
Total

Figure 2: Geographical development in the number ofFigure 2: Geographical development in the number ofFigure 2: Geographical development in the number ofFigure 2: Geographical development in the number ofFigure 2: Geographical development in the number ofenterprises in the accommodation sectorenterprises in the accommodation sectorenterprises in the accommodation sectorenterprises in the accommodation sectorenterprises in the accommodation sector , 1981-1992, index, 1981-1992, index, 1981-1992, index, 1981-1992, index, 1981-1992, index
80
90
100
110
120
130
140
1981
1983
1985
1987
1989
1991
Metropolitanarea
Citymunicipalities
Townmunicipalities
Villagemunicipalities
Ruralmunicipalities
Total

TTTTTable 2: Accumulated average survival rates (percentage of population), mean and standardable 2: Accumulated average survival rates (percentage of population), mean and standardable 2: Accumulated average survival rates (percentage of population), mean and standardable 2: Accumulated average survival rates (percentage of population), mean and standardable 2: Accumulated average survival rates (percentage of population), mean and standarddeviations of survivals, restaurants and accommodation facilities, 1981-1994, by locationdeviations of survivals, restaurants and accommodation facilities, 1981-1994, by locationdeviations of survivals, restaurants and accommodation facilities, 1981-1994, by locationdeviations of survivals, restaurants and accommodation facilities, 1981-1994, by locationdeviations of survivals, restaurants and accommodation facilities, 1981-1994, by location
Metr opolitan Cities T owns Villages Rural areas T otalRestaurantsRestaurantsRestaurantsRestaurantsRestaurantsSurvival ratesAv. annual survivalsStandard deviation
76.91,5384576.08445676.18786675.178090
72.553443
75.74,566289
AccommodationAccommodationAccommodationAccommodationAccommodationSurvival ratesAv. annual survivalsStandard deviation84.71711182.6105783.11981581.92821979.62671282.11,02352

TTTTTable 3: Accumulated average foundation rates (percentage of population), means andable 3: Accumulated average foundation rates (percentage of population), means andable 3: Accumulated average foundation rates (percentage of population), means andable 3: Accumulated average foundation rates (percentage of population), means andable 3: Accumulated average foundation rates (percentage of population), means andstandard deviations, restaurants and accommodation facilities, 1981-1994, by locationstandard deviations, restaurants and accommodation facilities, 1981-1994, by locationstandard deviations, restaurants and accommodation facilities, 1981-1994, by locationstandard deviations, restaurants and accommodation facilities, 1981-1994, by locationstandard deviations, restaurants and accommodation facilities, 1981-1994, by location
Metr opoli-tan Cities T owns Villages Rural areas TotalNew enterprisesNew enterprisesNew enterprisesNew enterprisesNew enterprises
RestaurantsRestaurantsRestaurantsRestaurantsRestaurantsFoundation ratesAv. annual foundationsStandard deviation
AccommodationAccommodationAccommodationAccommodationAccommodationFoundation ratesAv. annual foundationsStandard deviation
14.128215
7.25.71.7
15.617419
9.33.61.8
15.618024
9.59.21.3
15.616120
10.117.0

4.2
16.812420
10.922.96.5
15.3920111
9.658.28.5Spin-ofSpin-ofSpin-ofSpin-ofSpin-of fsfsfsfsfs
RestaurantsRestaurantsRestaurantsRestaurantsRestaurantsFoundation ratesAv. annual foundationsStandard deviation
AccommodationAccommodationAccommodationAccommodationAccommodationFoundation ratesAv. annual foundationsStandard deviation
3.97724
4.89.66.5
3,64010
3.66.67.5
3.54213

3.48.12.6
3.13211
3.18.42.7
2.8208
2.68.62.7
3.521259
3.344.214.6BarrierBarrierBarrierBarrierBarrier - breaking- breaking- breaking- breaking- breaking
RestaurantsRestaurantsRestaurantsRestaurantsRestaurantsFoundation ratesAv. annual foundationsStandard deviation
AccommodationAccommodationAccommodationAccommodationAccommodationFoundation ratesAv. annual foundationsStandard deviation
5.110330
2.95.81.7
4.85312

2.83.61.8
4.85215
2.99.21.3
6.1618
5.117.43.5
7.8577
6.822,76,5
5.533057
4.758.28.5

TTTTTable 4: Aable 4: Aable 4: Aable 4: Aable 4: A verage failure rates (percentage of population) and standard deviations,verage failure rates (percentage of population) and standard deviations,verage failure rates (percentage of population) and standard deviations,verage failure rates (percentage of population) and standard deviations,verage failure rates (percentage of population) and standard deviations,restaurants and accommodation facilities, 1981-1994, by locationrestaurants and accommodation facilities, 1981-1994, by locationrestaurants and accommodation facilities, 1981-1994, by locationrestaurants and accommodation facilities, 1981-1994, by locationrestaurants and accommodation facilities, 1981-1994, by location
Metr opoli-tan Cities T owns Villages Rural areas T otalRestaurantsRestaurantsRestaurantsRestaurantsRestaurantsAv. fai lure ratesAv. annual failure sStandard dev.
11.217212
12.6105713.31981613.52821914.82671212.7102354AccommodationAccommodationAccommodationAccommodationAccommodationAv. fai lure ratesAv. annual failure sStandard dev.6.713.43.68.911.23.29.924.55.59.030.35.610.635.47.59.2115.215.2

Figure 3: Gradual decline of the 1980 population of restaurants in the period 1980-1994, %Figure 3: Gradual decline of the 1980 population of restaurants in the period 1980-1994, %Figure 3: Gradual decline of the 1980 population of restaurants in the period 1980-1994, %Figure 3: Gradual decline of the 1980 population of restaurants in the period 1980-1994, %Figure 3: Gradual decline of the 1980 population of restaurants in the period 1980-1994, %survivalssurvivalssurvivalssurvivalssurvivals
0
10
20
30
40
50
60
70
80
90
100
1980
1982
1984
1986
1988
1990
1992
1994
Metropolitanarea
Large cities
Towns
Villages
Rural areas
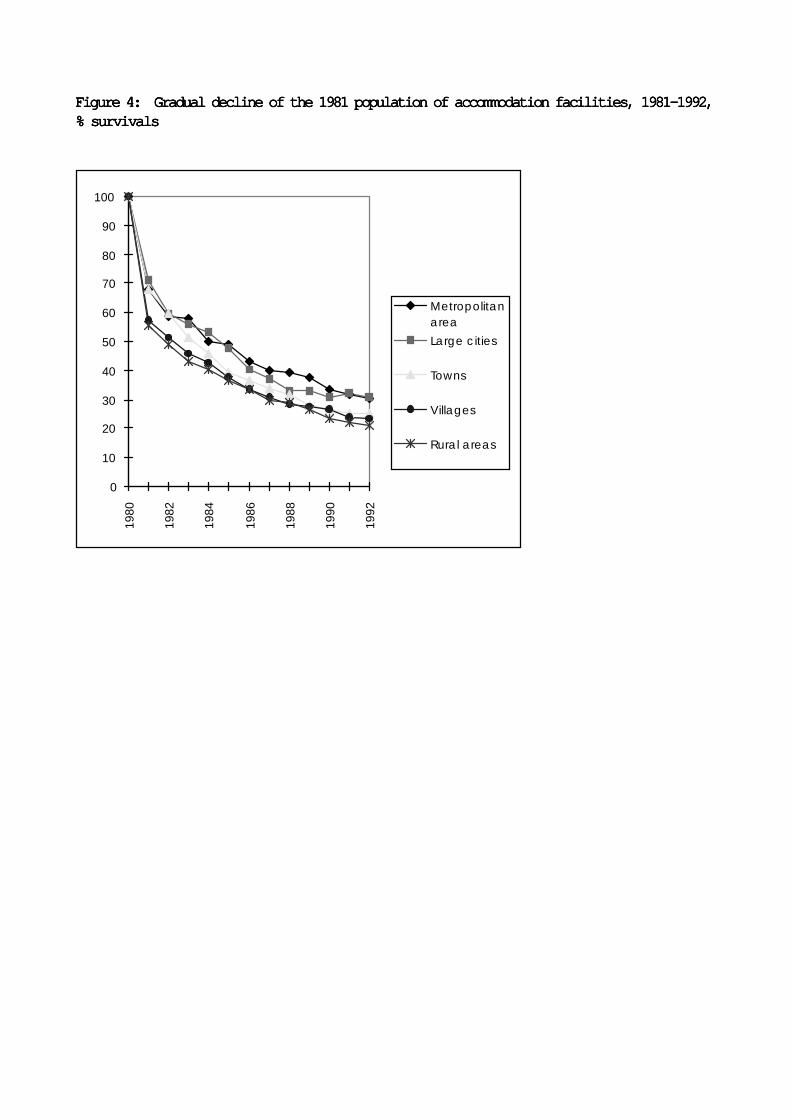
Figure 4: Gradual decline of the 1981 population of accommodation facilities, 1981-1992,Figure 4: Gradual decline of the 1981 population of accommodation facilities, 1981-1992,Figure 4: Gradual decline of the 1981 population of accommodation facilities, 1981-1992,Figure 4: Gradual decline of the 1981 population of accommodation facilities, 1981-1992,Figure 4: Gradual decline of the 1981 population of accommodation facilities, 1981-1992,% survivals% survivals% survivals% survivals% survivals
0
10
20
30
40
50
60
70
80
90
100
1980
1982
1984
1986
1988
1990
1992
Metropolitanarea
Large cities
Towns
Villages
Rural areas

TTTTTable 5: Composition of labourable 5: Composition of labourable 5: Composition of labourable 5: Composition of labourable 5: Composition of labourMetropolitan areaMetropolitan areaMetropolitan areaMetropolitan areaMetropolitan area Other regionsOther regionsOther regionsOther regionsOther regions
Development in employment 1985-92, % gr owth - restaurants - accommodation-1.6- 5.6+ 51+ 16% female employment, 1994 - restaurants - accommodation49505963% immigrant employment, 1994 - restaurants - accommodation12.214.13.42.3% student part-time workers, 1994 - restaurants - accommodation30284138% with a formal education in tourism - restaurants - accommodation21261413Labour turnover 7
- restaurants - accommodation220186220198Sour ce: IDA data bank

TTTTTable 6: Regression coefable 6: Regression coefable 6: Regression coefable 6: Regression coefable 6: Regression coef ficients of the relation between organisational survival and theficients of the relation between organisational survival and theficients of the relation between organisational survival and theficients of the relation between organisational survival and theficients of the relation between organisational survival and theproportion of specific categories of labour and restaurants, 1994 compared with 1993proportion of specific categories of labour and restaurants, 1994 compared with 1993proportion of specific categories of labour and restaurants, 1994 compared with 1993proportion of specific categories of labour and restaurants, 1994 compared with 1993proportion of specific categories of labour and restaurants, 1994 compared with 1993(standard deviations in brackets; * = statistically significant at the 5% level)(standard deviations in brackets; * = statistically significant at the 5% level)(standard deviations in brackets; * = statistically significant at the 5% level)(standard deviations in brackets; * = statistically significant at the 5% level)(standard deviations in brackets; * = statistically significant at the 5% level)
Metr opolitan area Large cities T owns VillagesRural areasModel 1:Model 1:Model 1:Model 1:Model 1:
Age
Size
Model 2:Model 2:Model 2:Model 2:Model 2:
Upper management
Lower management
Skilled workers
Unskilled workers
-0.1412 *(0.0110)
-0.1412 *(0.00379
-0.00383(0.00302)
-0.00074(0.0223)
0.000561(0.00161)
0.00106(0.00178)
-0.1309 *(0.0152)
- 0.0711 *(0.00761)
0.00371(0.00510)
0.00259(0.00288)
-0.0007(0.00246)

-0.00245(0.00255)
-0.1144 *(0.0139)
-0.0619 *(0.00711 )
-0.00289(0.00442)
0.00103(0.0283)
-0.00372(0.00299)
-0.00561(0.00266)
-0.1131*(0..0140)
-0.0762 *(0.00859)
-0.00182(0.00486)
-0.0105 *(0.00387)
0.00135(0.00322)
-0.00253(0.00259)
- 0.1167 *(0.0157)
-0.0968 *(0.0111 )
0.00311(0.00624)
0.00316(0.00320)
0.000116(0.00373)
-0.00039(0.00273)

Figure 1Figure 1Figure 1Figure 1Figure 1 1: Regression coef1: Regression coef1: Regression coef1: Regression coef1: Regression coef ficients of the relation between organisational survival and theficients of the relation between organisational survival and theficients of the relation between organisational survival and theficients of the relation between organisational survival and theficients of the relation between organisational survival and theproportion of specific categories of labour and accommodation facilities, 1994 comparedproportion of specific categories of labour and accommodation facilities, 1994 comparedproportion of specific categories of labour and accommodation facilities, 1994 comparedproportion of specific categories of labour and accommodation facilities, 1994 comparedproportion of specific categories of labour and accommodation facilities, 1994 comparedwith 1993 (standard deviations in brackets; * = statistically significant at the 5% level)with 1993 (standard deviations in brackets; * = statistically significant at the 5% level)with 1993 (standard deviations in brackets; * = statistically significant at the 5% level)with 1993 (standard deviations in brackets; * = statistically significant at the 5% level)with 1993 (standard deviations in brackets; * = statistically significant at the 5% level)
Metr opolitan area Large cities T owns VillagesRural areasModel 1:Model 1:Model 1:Model 1:Model 1:
Age
Size
Model 2:Model 2:Model 2:Model 2:Model 2:
Upper management
Lower management
Skilled workers
Unskilled workers
-0.1275 *(0.0315)
-0.00488 *(0.00353)
0.00248(0.00954)
0.000086(0.00954)
0.00394(0.0100)
-0.00913(0.0119)
-0.1366 *(0.0411 )
-0.0406 *(0.0109)
0.0244 *(0.00996)
0.0125(0.0133)
-0.00109((0.00894)
-0.00252(0.0111 )

-0.1632 *(0.0315)
-0.0334 *(0.00822)
0.00483(0.00929)
-0.0260(0.0146)
-0.00292(0.00936)
-0.0260(0.0146)
-0.1090 *(0.0219)
-0.0589 *(0.00948)
-0.0164(0.0128)
0.00653(0.00582)
-0.0215 *(0.00909)
0.00653(0.00582)
-0.0829 *(0.0229)
-0.0973 *(0.0152)
0.000866(0.00634)
0.00579(0.00575)
0.00780(0.00634)
-0.00560(0.00632)

ReferReferReferReferRefer ences cited:ences cited:ences cited:ences cited:ences cited:
Baum, Joel A.C., 1996, Or ganizational ecology, in Clegg, Steward R., Cynthia Hardy and Walter R. Nord (eds):
Handbook of or ganization studies , London: Sage, pp 77-114
Barnett, W illiam P., 1990, The organizational ecology of a technological system, Administrative Science Quarterly,
35, pp 31-60
Commission of the Eur opean Communities, 1994 , The future of the community initiatives under the Structural
Funds , COM (94) 46, final, Brussels
Danmarks T uristråd, 1998, STABAS (extraction of the statistical data bank)
Doeringer, Peter B. et al., 1991, Turbulence in the American workplace , New Y ork: Oxford University Press
European Institute of Education and Social Policy, 1991, Education for Car eers in Eur opean T ravel and T ourism ,
London: American Expr ess Foundation
Eurostat, 1998, T ourism in Eur ope. Key figure 1996-1997, Luxembourg
Freemann, John, 1982, Or ganizational life cycles and natural selection pr ocesses, Research in Or ganizational
Behavior , 4, pp 1-32
Hannan, Michael T. and Glenn R. Carr oll, 1992 , Dynamics of organizational populations. Density, legitimation and
competition , New Y ork: Oxford University Press
Hannan, Michael T., 1988, Social change, or ganizational diversity and individual car eers, in Riley, Matilda
White (eds), Social structures & human lives , Newbury Park: Sage, pp 161-174
Hannan, Michael T. and John Fr eeman, 1989, Organizational Ecology , Cambridge Mass.: Harvard University
Press
Hjalager, Anne-Mette, 1996, Turister hvervets arbejdskraftsammensætning , Report for the Ministry of T rade and
Industry, Copenhagen
Holm-Petersen, Erik, Anne-Mette Hjalager, W olfgang Framke and Peter Plougman, 1993, Turisme/fritid -
erhvervsøkonomisk analyse, København: Er hvervsfr emmestyr elsen
Ingram, Paul and Joel A. C. Baum, 1997, Chain af filiation and the failure of Manhattan hotels, 1989-1980,
Administrative Science Quarterly , 42, pp 68-102
Inskeep, Edward, 1994 , National and r egional tourism planning. Methodologies and case studies , London: W orld
Tourism Or ganisation and Routledge
Iverson, Roderick, D. and Margaret Deery, 1997, T urnover culture in the hospitality industry , Human Resourc e

Management Journal , 7, 4, pp 71-82
Lant, Theresa K. and Stephen J. Mezias, 1990, Managing discontinous change: A simulation study of
organizational learning and entrepreneurship, Strategic Management Journal , 11, pp 147-179
Lomi, Alessandro, 1995, The population and community ecology of or ganizational founding: Italian cooperative
banks, 1936-1989 , European Sociological Review , 11,1, pp 75-98
Lucas, Rosemary, 1995 , Managing employee r elations in the hotel and catering industry , London: Cassell
Maskell, Peter, 1986, Industrien s flugt fr astorbyen, Årsager og konsekvenser . København: Nyt Nor disk Forlag
Arnold Busk
Maskell, Peter, 1992, Nyetableringer i industien - og industristrukturens udvikling , København: Handelshøjskolens
Forlag
Pade & Partnere, 1992 , Sektoranalyse for hotel- og r estaurationser hvervet i Danmark , København
Pear ce, Douglas, 1991, Tourist Development , New York: Longman Scientific and T echnical
Poon, Auliana, 1993, Tourism, technology and competitive strategies , Wallingford: CAB International
Rafn, Thomas, 1996 Turismen økonomiske betydning for de danske amter , Nexø: Bornholms Forskningscenter
Riley, Michael, 1991 , Human r esource management. A guide to personnel practice in the hotel and catering industry ,Oxford: Butterworth-Heinemann
Silverman, Brian, Jack A. Nickerson and John Fr eeman, 1997, Pr ofitability, transactional alignment, andorganizational mortality in the U.S. tr ucking industry, Strategic Management Journal , 18, pp 31-52
Singh, Jitendra V. and Charles Lumsden, 1990, Theory and r esearch in organizational ecology, Annual Review ofSociology , 16, 161-195
Smith, Stephen L.J., 1992, Tourism Analysis. A Handbook , New York: Longman Scientific and T echnical
Theobald, W illiam F. (ed), 1994, Global tourism. The next decade , Oxford: Butterworth Heinemann
W TO (World T ourism Or ganization), 1997 , Global T ourism For ecasts to the year 2000 and beyond , vol 5: Eur ope,Madrid: WTO
1 This analysis uses the following five agglomeration categories:
* Metr opolitan areas* Cities with more than 40,000 inhabitants* Towns with 10,000-40,000 inhabitants* Villages with 33-100% of inhabitants living in urbanised areas
* Other r ural municipalities
2 Hannan (1988) mentions the importance of this issue, but he and other authors have not included the
labour dimension in their empirical studies of organisational ecology.
3 Statistics Denmark, IDA= Integrated databank for labour market analysis.
4 Statistics Denmark changed the standard industrial classification system in 1992, from ISIC (Inter national

Standard Industrial Classification) to NACE (Nomenclature general des Activités economiques dans lesCommunautes Eur opéennes). 1981-1992: ISIC codes 63.101 and 63.109. 1993-1994: NACE codes: 55.30.10,
55.30.20, 55.30.90, 55.40.10, 55.40.20, 55.40.20, 55.40.90, 55.52.00.
5 1981-1992: ISIC codes: 63.201, 63.202, 63.203, 63.209. 1993-1994: NACE codes: 55.1 1.10, 55.11.20, 55. 12.00,
55.21.00, 55.22.00, 55.23.10, 55.23.10. 55.23.90
6 Susbsectors of banking and health can be shown to have annual survival rates between 92 an 98 per cent.7 Calculated as the number of persons employed thr oughout the year as a percentage of the number ofemployees by November 1.