The earthquakes-induced landslides zoning using Monte ... · Newmark's sliding block analyses. In...
12
Rajabi et al., JMES, 2018, 9 (2), pp. 424-435 424 J. Mater. Environ. Sci., 2018, Volume 9, Issue 2, Page 424-435 https://doi.org/10.26872/jmes.2018.9.2.46 http://www.jmaterenvironsci.com Journal of Materials and Environmental Sciences ISSN : 2028;2508 CODEN : JMESCN Copyright © 2018, University of Mohammed Premier Oujda Morocco 1. Introduction Generally, landslides and in particular landslides caused by earthquakes are among the phenomena which have caused extensive damage to human beings in recent years [1-5]. Although many studies have been conducted on the identification and description of landslides in general, the examination of landslides caused by earthquakes, particularly in Iran, is very recent. In terms of magnitude and induced landslides, Manjil earthquake (June 21, 1990, M=7.7) is one of the most important earthquakes in Iran’s history, and whose most significant landslides have been listed in various studies. The development of quantitative and qualitative research on the earthquakes has caused many landslides (such as Manjil (1990)[6], Avaj (2002)[7] and FiruzabadKojur (2004)[8] earthquakes) leads to an increased understanding of these natural disasters and consequently good management of the resultant risks. In examination of landslides caused by earthquakes, the deterministic method usually includes pseudo-static and Newmark's sliding block analyses. In this method, zoning of susceptibility to earthquake induced landslides is based on the safety factor calculation, using steepness indices, slope material parameters and characteristics of the expected earthquake. This method has been employed by many researchers due to its capacity of providing helpful information through a simple modeling of the ground’s movement [6&9-11] The fundamental issue in this method is that the input data in the deterministic calculation of safety factor intrinsically contains uncertainty. Some of these data, affected by great uncertainty and spatial variability, are strength parameters of rock and soil, the landslide depth, groundwater levels and slope materials specific weight. Probabilistic methods are more appropriate for stability analysis of the landslides caused by earthquakes, because some of these methods consider the uncertainties and variability of all the effective parameters controlling the seismic induction of landslides. One of these probabilistic methods is based on the analysis of probability distribution functions. This method uses the limit equilibrium model and the probabilistic methods to take into account the randomness of the input parameters. In this study, landslide hazard zoning for parts of northern Iran, which was affected by the Manjil earthquake, was conducted using probabilistic models accounting to a Monte Carlo Simulation. Due to a reduction of uncertainties in the output parameters, the employment of such methods has having an increasing employment in geotechnical problems [10 &12]. The earthquakes-induced landslides zoning using Monte Carlo simulation (A case study; Manjil Earthquake-Iran) 2 , Saeed Dehghan 1 , Mohammad Ali Aliabadi 1* Ali M. Rajabi 1. Department of Geology, Mahallat Branch, Islamic Azad University, Mahallat, Iran 2. Department of Mining, Mahallat Branch, Islamic Azad University, Mahallat, Iran Abstract One of the most important effects of the Manjil earthquake (M=7.7, 20/6/1990) was the triggering of numerous landslides in the area affected by the earthquake. To predict landslides locations during future earthquakes, it is essential to analyze the distribution of landslides triggered by the Manjil earthquake. In this paper, by employing the Monte Carlo Simulation, an area with 309 km2 including Chahar-Mahal and Chalkasar rectangles (near the Manjil epicenter) was investigated in order to achieve a probabilistic model to predict earthquake-induced landslides. There is a good correlation between the provided map and the inventory map of landslides occurred during the Manjil earthquake. Received 10Sep 2016, Revised 07Apr 2017, Accepted 13Apr 2017 Keywords ! Simulation; ! Monte Carlo; ! Manjil earthquake; ! earthquakes- inducedlandslides ! Probabilistic; Ali M. Rajabi [email protected] 00989122908260
Transcript of The earthquakes-induced landslides zoning using Monte ... · Newmark's sliding block analyses. In...

Rajabi et al., JMES, 2018, 9 (2), pp. 424-435 424
!
J. Mater. Environ. Sci., 2018, Volume 9, Issue 2, Page 424-435!
https://doi.org/10.26872/jmes.2018.9.2.46
http://www.jmaterenvironsci.com!
Journal!of!Materials!and!!Environmental!Sciences!ISSN!:!2028;2508!CODEN!:!JMESCN!
Copyright!©!2018,!!!!!!!!!!!!!!!!!!!!!!!!!!!!!University!of!Mohammed!Premier!!!!!!!Oujda!Morocco!
!!
!
!
!
!
!
!
!
!
!
!!
!
1.!Introduction Generally, landslides and in particular landslides caused by earthquakes are among the phenomena which have caused extensive damage to human beings in recent years [1-5]. Although many studies have been conducted on the identification and description of landslides in general, the examination of landslides caused by earthquakes, particularly in Iran, is very recent. In terms of magnitude and induced landslides, Manjil earthquake (June 21, 1990, M=7.7) is one of the most important earthquakes in Iran’s history, and whose most significant landslides have been listed in various studies. The development of quantitative and qualitative research on the earthquakes has caused many landslides (such as Manjil (1990)[6], Avaj (2002)[7] and FiruzabadKojur (2004)[8] earthquakes) leads to an increased understanding of these natural disasters and consequently good management of the resultant risks. In examination of landslides caused by earthquakes, the deterministic method usually includes pseudo-static and Newmark's sliding block analyses. In this method, zoning of susceptibility to earthquake induced landslides is based on the safety factor calculation, using steepness indices, slope material parameters and characteristics of the expected earthquake. This method has been employed by many researchers due to its capacity of providing helpful information through a simple modeling of the ground’s movement [6&9-11] The fundamental issue in this method is that the input data in the deterministic calculation of safety factor intrinsically contains uncertainty. Some of these data, affected by great uncertainty and spatial variability, are strength parameters of rock and soil, the landslide depth, groundwater levels and slope materials specific weight. Probabilistic methods are more appropriate for stability analysis of the landslides caused by earthquakes, because some of these methods consider the uncertainties and variability of all the effective parameters controlling the seismic induction of landslides. One of these probabilistic methods is based on the analysis of probability distribution functions. This method uses the limit equilibrium model and the probabilistic methods to take into account the randomness of the input parameters. In this study, landslide hazard zoning for parts of northern Iran, which was affected by the Manjil earthquake, was conducted using probabilistic models accounting to a Monte Carlo Simulation. Due to a reduction of uncertainties in the output parameters, the employment of such methods has having an increasing employment in geotechnical problems [10 &12].
The earthquakes-induced landslides zoning using Monte Carlo simulation (A case study; Manjil Earthquake-Iran)
2, Saeed Dehghan1, Mohammad Ali Aliabadi1*Ali M. Rajabi
1. Department of Geology, Mahallat Branch, Islamic Azad University, Mahallat, Iran 2. Department of Mining, Mahallat Branch, Islamic Azad University, Mahallat, Iran
Abstract
One of the most important effects of the Manjil earthquake (M=7.7, 20/6/1990) was the triggering of numerous landslides in the area affected by the earthquake. To predict landslides locations during future earthquakes, it is essential to analyze the distribution of landslides triggered by the Manjil earthquake. In this paper, by employing the Monte Carlo Simulation, an area with 309 km2 including Chahar-Mahal and Chalkasar rectangles (near the Manjil epicenter) was investigated in order to achieve a probabilistic model to predict earthquake-induced landslides. There is a good correlation between the provided map and the inventory map of landslides occurred during the Manjil earthquake.
Received 10Sep 2016, Revised 07Apr 2017, Accepted 13Apr 2017
Keywords !! Simulation; !! Monte Carlo; !! Manjil earthquake; !! earthquakes-
inducedlandslides !! Probabilistic;
Ali M. Rajabi [email protected] 00989122908260
Rajabi et al., JMES, 2018, 9 (2), pp. 424-435 425
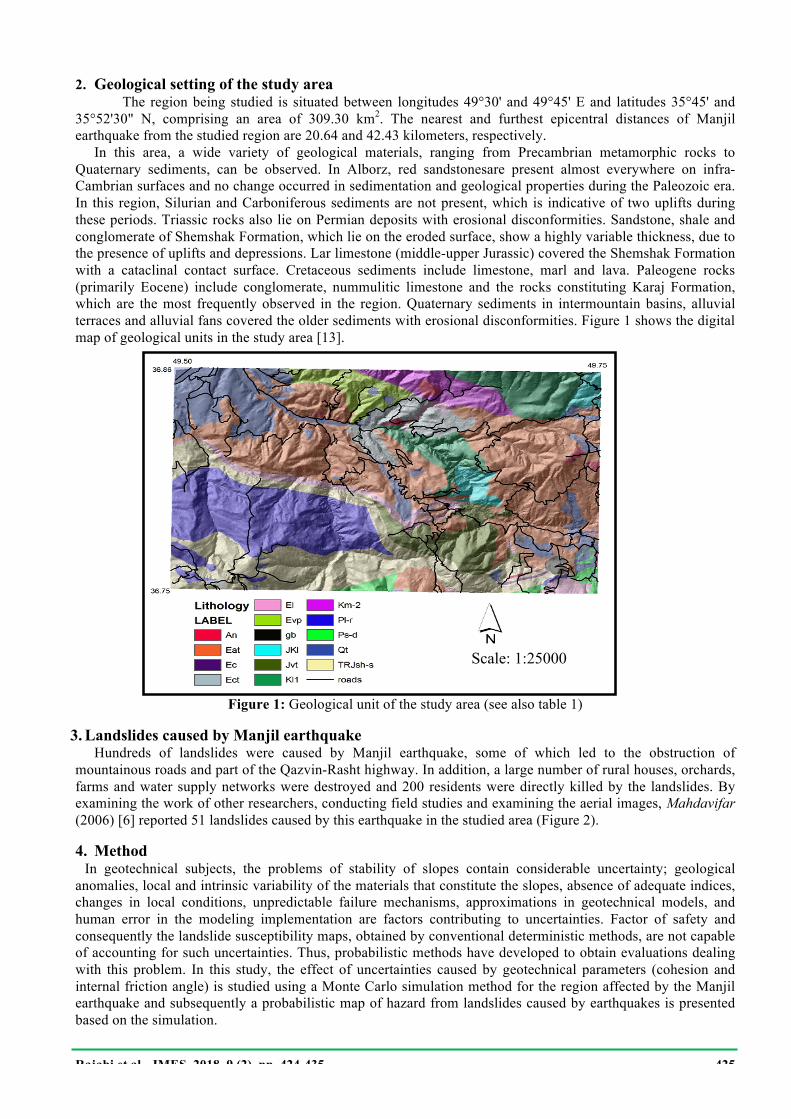
2.! Geological setting of the study area The region being studied is situated between longitudes 49°30' and 49°45' E and latitudes 35°45' and 35°52'30" N, comprising an area of 309.30 km2. The nearest and furthest epicentral distances of Manjil earthquake from the studied region are 20.64 and 42.43 kilometers, respectively. In this area, a wide variety of geological materials, ranging from Precambrian metamorphic rocks to Quaternary sediments, can be observed. In Alborz, red sandstonesare present almost everywhere on infra-Cambrian surfaces and no change occurred in sedimentation and geological properties during the Paleozoic era. In this region, Silurian and Carboniferous sediments are not present, which is indicative of two uplifts during these periods. Triassic rocks also lie on Permian deposits with erosional disconformities. Sandstone, shale and conglomerate of Shemshak Formation, which lie on the eroded surface, show a highly variable thickness, due to the presence of uplifts and depressions. Lar limestone (middle-upper Jurassic) covered the Shemshak Formation with a cataclinal contact surface. Cretaceous sediments include limestone, marl and lava. Paleogene rocks (primarily Eocene) include conglomerate, nummulitic limestone and the rocks constituting Karaj Formation, which are the most frequently observed in the region. Quaternary sediments in intermountain basins, alluvial terraces and alluvial fans covered the older sediments with erosional disconformities. Figure 1 shows the digital map of geological units in the study area [13].
Figure 1: Geological unit of the study area (see also table 1)
3.!Landslides caused by Manjil earthquake Hundreds of landslides were caused by Manjil earthquake, some of which led to the obstruction of mountainous roads and part of the Qazvin-Rasht highway. In addition, a large number of rural houses, orchards, farms and water supply networks were destroyed and 200 residents were directly killed by the landslides. By examining the work of other researchers, conducting field studies and examining the aerial images, Mahdavifar (2006) [6] reported 51 landslides caused by this earthquake in the studied area (Figure 2).
4.!Method In geotechnical subjects, the problems of stability of slopes contain considerable uncertainty; geological anomalies, local and intrinsic variability of the materials that constitute the slopes, absence of adequate indices, changes in local conditions, unpredictable failure mechanisms, approximations in geotechnical models, and human error in the modeling implementation are factors contributing to uncertainties. Factor of safety and consequently the landslide susceptibility maps, obtained by conventional deterministic methods, are not capable of accounting for such uncertainties. Thus, probabilistic methods have developed to obtain evaluations dealing with this problem. In this study, the effect of uncertainties caused by geotechnical parameters (cohesion and internal friction angle) is studied using a Monte Carlo simulation method for the region affected by the Manjil earthquake and subsequently a probabilistic map of hazard from landslides caused by earthquakes is presented based on the simulation.
Scale: 1:25000

Rajabi et al., JMES, 2018, 9 (2), pp. 424-435 426
Scale: 1:25000
Figure 2: The inventory map of landslides induced by Manjil Earthquake in the study area (Mahdavifar, 2006)
4.1. Monte Carlo simulation The simplest approach for simulating the uncertainties of geotechnical parameters consist of carrying out calculation through (several iterations), during which different randomly sampled values are assigned to each variable until the distribution of that variable is obtained based on a defined probabilistic distribution. The most common method for this purpose is the Monte Carlo simulation. In the analysis of the stability of the slope, parameters with higher uncertainty are simulated randomly. These parameters include internal friction angle, cohesion, specific weight of the sliding mass and groundwater levels. In this method, many values are attributed to soil variables according to a defined probabilistic distribution. For each set of input parameters, the factor of safety value is calculated using the infinite slope model or the Newmark’s sliding block analysis method. The Monte Carlo simulation, generates a large number of safety factor values (for instance, 1000 values), are generated by iterating the input data of random variables. In this case, the ultimate output of the simulation is approximately 1000 values of factor of safety or Newmark’s displacement, which can be displayed by graphs or maps. Monte Carlo simulation method includes the following four stages: -!For each of the randomized input variables, a random value is selected according to its probability density function -!The factor of safety is calculated using the available models (such as the Newmark’s method) and according to the numerical value selected in the first stage -!First and second stages are iterated many times and the factor of safety is calculated for each iteration -!Using the numerical values of the factor of safety obtained from the Monte Carlo simulation (1st, 2nd and 3rd stages), the probability of undesirable conditions (for instance, displacement values of more than a threshold value) is obtained.
4.2. Newmark model for the probabilistic evaluation of the hazard from earthquakes-induced landslides Dynamic stability of a slope, in Newmark’s method (1965)[14], depends on the static stability of the slope. Thus, the coefficient of static stability should be determined for each unit. For conducting the analysis at regional scales, the simple limit equilibrium model, which is based on plane failure, has been suggested by Jibson et al.,(2000);[15]. In this model, the factor of safety is calculated using equation 1:
Eq. 1 in which φ' is the effective internal friction angle, c' is the effective cohesion, α is the angle of slope, γ is the specific weight of the materials, γw is the specific weight of water, t is the thickness of the disjoined layer measured perpendicularly to the slope and m is the ratio of the thickness of the saturated sheet. Furthermore, the critical acceleration, calculated by combining each cell’s safety factor with its slope angle, is indicative of the susceptibility to landslides caused by earthquakes in a cell. The calculation is conducted using the equation:
αγφγ
αφ
αγ tantan
tantan
sin$
−$
+$
= wmtcFS

Rajabi et al., JMES, 2018, 9 (2), pp. 424-435 427
Eq. 2 in which αc is the limit acceleration with respect to g (gravitational acceleration), Fs is the coefficient of static stability and αis the angle between the horizontal surface and the direction in which the center of mass of the sliding mass initially moves. Due to the difficulties with the determination of dynamic safety factor, Newmark’s displacement model has been employed in slope seismic stability analysis, in place of many conventional pseudo-static methods. In this study, the displacement of the slopes caused by the Manjil earthquake was calculated through the following empirical equation (evaluated for Alborz and central Iran by Mahdavifar 2006 [6].
Eq. 3 Where DN is the Newmark’s displacement in centimeters, ac is critical acceleration, Ia is the Arias Intensity in m/s. Additionally, as earthquake’s parameter, Arias Intensity was modeled by the equation [16];
Eq. 4 in which M is the moment magnitude and R is the distance in Kilometers. A data bank containing the limit acceleration of the slopes in the region is essential for the analysis of Newmark’s displacement values and, ultimately, for producing the seismic hazard map. In addition to the domain’s morphological parameters (angle of slope), the presence of domain’s geotechnical parameters of the materials (including the coefficient of internal friction angle, cohesion and density) are essential for the determination of safety factor. In this study, values obtained from the Hoek-Brown failure criterion [17] were estimated using the Roclab software [18] and the Geological Strength Index (GSI) method (see table 1).
Table 1: Strength parameters of geological units in the study area according to Hoek and Brown (1980),
criterion [18]; conducted by Mahdavifar (2006) [6].
Lithology Units Age Description Outcrop (Km2)
Outcrop (%)
)3γ (gr/cm φ° C (Kpa)
An Eocene Volcanic andesite 2.70 0.87 2.6 52 150
Eat Eocene Andesite tuff 97.29 31.46 2.6 17 20
Ec Eocene conglomerate 0.42 0.14 2.5 39 70
Ect Eocene Andesite tuff 11.14 3.60 2.6 20 20
E1 Eocene Tuff/limestone 10.05 3.25 2.5 44 100
Evp Eocene Andesite tuff 8.82 2.85 2.2 17 20
Gb Eocene Olivine gabbro 1.12 0.36 2.8 59 250
JK1 Jurassic Limestone 6.87 2.22 2.5 48 300
Jvt Jurassic Volcanic andesite 40.82 4.79 2.6 31 50
Kl1 Cretaceous Limestone 20.99 6.79 2.7 48 300
Km-2 Cretaceous Marle 9.48 3.07 2.7 22 30
Pl-r Upper Permian Limestone 42.91 13.88 2.5 22 30
Ps-d Upper Permian Shale/Limestone 3.85 1.25 2.2 22 30
Qt Quaternary Alluvial 31.72 10.26 1.96 34 20
TRJsh-s Jurassic Shale/Sandstone 47.04 15.21 2.4 39 70
4.3. Choosing the appropriate distribution function Newmark’s model requires the availability of several parameters, obtained through field studies and evaluations (such as cohesion and internal friction angle), or derived from seismic records (Arias Intensity) and
( ) αα sin1 gFsc −=
397.0398.1176.7log087.1log ±+−= caN aID
RRMIa 002.0log810.0880.3log −−+−=

Rajabi et al., JMES, 2018, 9 (2), pp. 424-435 428
topographical data (the slope map produced in the GIS environment). In terms of geotechnical data, the properties of different soils are obtained from laboratory tests and spatial distribution is defined on the basis on geological maps. However, accurate determination of these properties is often difficult and error can derive from uncertainty affecting. The definition of boundary of petrological units reported in geological maps and forms the assumption that these parameters are homogeneous which each petrological unit. For these reasons, a probabilistic perception of the model’s parameters is more reasonable than a deterministic perception or constant values. For the probabilistic analysis of the stability of inclined surfaces, the uncertainties in the input parameters must be determined. These uncertainties are stated using probability distribution functions and probabilistic components (such as mean value and standard deviation). In most geotechnical projects, adequate information for the determination of the shape of the probability distribution function of the input parameters is not available, thus the choice of the probability distribution function of the parameters is based on the results of similar projects or other researches [19]. Although the normal or uniform distribution function is the simplest and most conventional of these functions, it can be an over simplification for scientific practices and for slope stability analysis in particular. In addition, the use of this model requires the availability of mean values and standard deviations of the input data (such as cohesion and internal friction angle) which require an additional large number of data that the variability of geological units can make unpractical to obtain in regional scale studies. Additionally, many of the regular and natural data cannot be modeled by normal distribution functions. This issue is in particular more important for quantities obtained by many field studies, in heterogeneous conditions or by engineering judgement. In these cases, it is preferable to use more general distribution functions to model the uncertainties; for this purpose, the beta (ß)distribution functions has been suggested by many researchers, particularly for the determination of geotechnical parameters[20]. For simplicity, ß distribution function is often used in its initial form or in the form of ß-PERT. This type of beta distribution function uses the minimum, most likely and maximum values as input parameters these being easier to be obtained. Therefore, this type of distribution is suggested when experimental data is statistically limited [20]. Due to a lack of geotechnical data in the studied area, this type of distribution has been employed in Monte Carlo simulation analysis.
4.4. Codes written in MATLAB environment and input data The flowchart of the program employed is shown in figure 3 with more details. To conduct the Monte Carlo simulation process and ultimately to make the results probabilistic, the written code receives the data required for conducting the Newmark’s analysis as input. These data include geological specifications of different units (such as the geological map), seismic and geotechnical parameters as a set of raster maps, like slope angle and Arias intensity maps, which present data with the resolution of one raster pixel.
!
Figure 3: Schematic flow chart of written codes and program performance path
A DEM was used to obtain the slope map of the studied region (figure 4) and Arias intensity values obtained from the seismic maps using Eq. 4, were mapped on the same DEM (figure 5). Additionally, geotechnical parameters of the units present in the studied area (Table 1) were inputted as tables of statistical parameters stored in a file.

Rajabi et al., JMES, 2018, 9 (2), pp. 424-435 429
Figure 4: The slope map of the study area produced by DEM
Figure 5: Digital map of Arias intensity derived from Eq. 4
4.5. Determination of the statistical values of geotechnical parameters As mentioned before, the code designed for Monte Carlo simulation receives the values of geotechnical parameters as statistical parameters. Thus to use the distribution function of ß-PERT, minimum, most likely and maximum values were used for cohesion, internal friction angle and ratio of the saturated layer, while other parameters have been assumed constant. This choice is due to the need of simplifying the analysis and using it on the variability of geotechnical parameters. For this purpose, cohesion and internal friction angle have been obtained based on the field studies and using the Roclabsoftware. The outputs from these values are considered as the most probable values of geotechnical parameters. These values must be considered as values that have the highest probability of approaching the real ones. To determine the minimum and maximum values of geotechnical parameters (cohesion and internal friction angle) for each of the geological units in the area completely fractured rocks and perfectly intact rocks were assumed, respectively. These values are utilized in the analysis of each unit. Table 2 shows the statistical parameters used in Monte Carlo simulation. Tables of numerical values, containing geotechnical statistical parameters of each unit, were provided based on the intended distribution. These parameters were utilized for conducting a set of Monte Carlo simulations. For this purpose, random samples of each parameter were generated with the intended distribution and subsequently combined with Newmark’s equations to give the ultimate probabilistic distribution of Newmark’s displacement. Other parameters required for the Newmark’s analysis and ultimately for the calculation of the factor of safety include the specific weight of each of the geological units and groundwater levels. In this study, the specific
Scale: 1: 25000
Scale: 1: 25000

Rajabi et al., JMES, 2018, 9 (2), pp. 424-435 430
weight of each unit was assumed to be constant. The minimum, maximum and the most probable values of m (the ratio of the thickness of the saturated sheet) were assumed as zero (dry conditions), 1 (complete saturation) and 0.5 respectively.
Table 2: Statistical parameters used in Monte Carlo simulation
Geological
unite
*γ
)3(gr/cm
m °φ C' (Kpa)
Max
Most
likely
Min
Max
Most
likely
Min
Max
Most
likely
Min
Ect 2.6 1 0.5 0 23 20 12 25 20 15
Dc-An 2.6 1 0.5 0 54 52 34 160 150 120
P1r 2.5 1 0.5 0 26 22 20 50 30 20
Psd 2.2 1 0.5 0 25 22 20 40 30 20
Evp 2.2 1 0.5 0 19 17 14 25 20 15
Eat 2.6 1 0.5 0 38 20 14 40 28 23
Jvt 2.6 1 0.5 0 32 31 20 100 50 20
TRjs 2.4 1 0.5 0 42 39 34 120 70 60
Jkl 2.5 1 0.5 0 50 48 31 340 300 250
Kl1 2.7 1 0.5 0 51 48 32 320 300 240
K2m 2.7 1 0.5 0 24 22 18 40 30 25
Gb 2.8 1 0.5 0 60 59 40 270 250 220
Ec 2.5 1 0.5 0 45 39 34 80 70 50
El 2.5 1 0.5 0 46 44 42 120 100 75
Qt 1.96 1 0.5 0 45 44 25 35 20 17
5.!Results and Discussions As mentioned before, the uncertainties caused by geotechnical parameters, including the internal friction angle and cohesion, were examined in this study. For this purpose, random statistical samples were obtained for each set of values specified for each of the units present in the area, using the distribution function of ß-PERT. The analysis approach includes a set of codes written in MATLAB environment which calculate the statistical probabilities of Newmark’s displacement for each slope unit in the area being studied. In Figure 3, showing the procedure flowchart, b and d sections represent the written programs and a, c and d sections the input data, intermediate results and the outputs of the program, respectively. In section a, the input parameters include slope map, Arias Intensity, geotechnical parameters and m. In section b, a code named MCS is used to conduct the Monte Carlo simulation based on the stated probability distribution function ß-PERT and produces 1000 random values for every parameter of each geological unit in the defined area, based on the statistical parameters, giving the output (c). In the next stage, the factor of safety is calculated probabilistically for every generated random value of each cell using other required parameters of each unit (such as the specific weight) or of the entire area of study (such as the thickness t of the slip-prone sheet). This stage uses the written codes ac, Fs, Dn-A-CI model and Dn-Probabilistic. Figure 6 demonstrates the conducted analysis in more details. As shown in this figure, input data include raster map of slope angle and Arias Intensity Ia, and the lithological map which of the geological units (1 to N).

Rajabi et al., JMES, 2018, 9 (2), pp. 424-435 431
Figure 6: Schematics of conducted analyses using Monte Carlo simulation from input to output
For each geological unit (1 to N), M geological parameters can be assumed as input. As stated earlier, the uncertainties of parameters φ, c and m were examined in this study. For each of these parameters, the statistical parameters required for the calculation of the selected distribution are reported and in particular. For this study, minimum, most probable and maximum were employed. According to the figure, 1000 samples are generated for each input during the Monte Carlo simulation process according to the distribution function applied. For instance, for a geological unit with Eat characteristic (andesite tuff) the minimum, the most probable and the maximum values of internal friction angle are set to 14°, 20° and 38° respectively, the corresponding cohesion values Kpa are 23, 28 and 40 and the ratio of the thickness of the saturated sheet is 0, 0.5 and 1, respectively. Examples of graphs of the probability distribution of the random samples generated for this unit using the Monte Carlo simulation, based on the values of the input statistical parameters, are shown in figure 7. In the next stage, the factor of safety and critical acceleration are calculated for each of the generated samples (meaning 1000 input for every parameter of each geological unit). In addition, the probability of the displacement of each cell in the area (based on the digitized map of the study area) exceeding a critical threshold value of 2 cm was calculated based on the Newmark’s displacement model. Figure 8 shows, as an example, the probability distribution that Newmark’s displacement exceeds the threshold value of 2cm for the geological unit Eat. As stated earlier, the software’s output can be reported as several probabilistic graphs (1000 input in this study) or a probabilistic map for the examined region. For instance, these maps can be presented as maps reporting the probabilistic values of each slope unit exceed a threshold value of Newmark’s displacement. As stated earlier, the threshold value that Newmark’s displacement in this study is 2cm, which is considered the minimum displacement for disrupted landslides [21]. Figure 9 shows the DN probabilistic map based on the values simulated by ß-PERT distribution for a part of the region affected by Manjil earthquake, based on the conducted analysis. The probabilistic map show which surfaces of the study area are more susceptible to landslide hazard, evaluated using the Monte Carlo simulation. According to this examination, 69.4% of the triggered by the Manjil earthquake in the studied area located in zones of high hazard (threshold exceedance probabilities higher than50%), which is indicative of how practical the probability hazard map is in predicting the landslides caused by earthquakes.
Output Database
Input Dataset
Monte&Carlo&Simulation Newmark&model&
Equations
α
Ia
Raster Maps
1 2N
Lith. Map
NN
……
22
11
Stat Stat par.par.PPMM
……Stat. Stat. par.par.
22
Stat. Stat. Par. Par.
11
Stat.Stat.par.par.
PP22
……Stat. Stat. par.par.
22
Stat. Stat. par. par.
11
Stat Stat par. par. PP11
……Stat Stat par.par.
22
Stat. Stat. par. par.
11
ID ID N.N.
Geotech. parameter MGeotech. parameter M……Geotech. parameter 2Geotech. parameter 2Geotech. parameter 1Geotech. parameter 1
……………….
Random Sample
……
Output DatabaseOutput Database
Input Dataset
Monte&Carlo&Simulation Newmark&model&
Equations
α
Ia
Raster Maps
1 2N
Lith. Map
NN
……
22
11
Stat Stat par.par.PPMM
……Stat. Stat. par.par.
22
Stat. Stat. Par. Par.
11
Stat.Stat.par.par.
PP22
……Stat. Stat. par.par.
22
Stat. Stat. par. par.
11
Stat Stat par. par. PP11
……Stat Stat par.par.
22
Stat. Stat. par. par.
11
ID ID N.N.
Geotech. parameter MGeotech. parameter M……Geotech. parameter 2Geotech. parameter 2Geotech. parameter 1Geotech. parameter 1
……………….
……………….
……………….
Random Sample
……
Random Sample
……

Rajabi et al., JMES, 2018, 9 (2), pp. 424-435 432
Figure 7: Probabilistic distribution of random sampling conducted by Monte Carlo simulation based on input parameters for Eat unit (see table 1), internal friction angle (top) and Cohesion (bottom)
!Figure 8: Probabilistic distribution of Newmark displacement exceedingthe threshold value of 2cm for Eat unit
(see table 1)

Rajabi et al., JMES, 2018, 9 (2), pp. 424-435 433
Figure 9: Probabilistic hazard map of earthquake-induced landslide using Monte Carlo simulation for values of Newmark displacement more than 2 cm
5.1. Comparisons with the results obtained from the deterministic approach Comparing the map obtained from Monte Carlo simulation and the deterministic model; (Mahadvifar, 2006; figure 10) indicates that the map resulted fromthe probabilistic method contains more areas of slope units and consequently more landslides caused by Manjil earthquake and is closer to real conditions.
Figure 10: Earthquake-induced landslide hazard map based on deterministic approach (red in the map indicate parts for which displacements more than 2 cm were estimated)
To quantify this comparison, we employed the method presented by Gee (1992)[22], which evaluates the validity of the danger zoning map by a parameter named QS. In this method, having classified the study area into different zone types, a parameter called the density ratio is initially calculated for each of them (Eq. 5):
Eq. 5 ALDR
%%
=
Scale: 1: 25000
Scale: 1: 25000
!

Rajabi et al., JMES, 2018, 9 (2), pp. 424-435 434
in which %L is the percentage of the total area of the landslides which are located within a zone type and %A is the percentage of the area occupied by this zone. Therefore, a DR of 1 indicates that the density of landslides in a zone is equal to the average density of the landslides in the region. Similarly, DRs greater or less than 1 indicate a higher or lower frequency of the landslides in the intended area with respect to the average density of the landslides. After calculating the DR values for all the zone types, the QS value for each model is calculated by the following equation:
Eq. 6 in which DRiand Ai are the density ratio and the surface percentage of each area respectively and n is the number of the zone types. Summing the squared differences of the density ratio of each area with respect to the average density of the region, QS assumes values increasing as more the zoning is effective. To use this method for comparing the deterministic and probabilistic approaches (Figures 9 and 10), both maps have been divided into two zones. The hazard map of earthquake induced landslides obtained by both probabilistic (Figure 9) and deterministic method (Figure 10) were divided into two zones, i.e. high risk (red, group 1) and low risk (non-red, group 2). In the probabilistic map, areas classified as group were the ones where the probability of displacement threshold exceedance is larger than 0.5, whereas for the deterministic map group 1 includes the zones where displacement was estimated larger than the same threshold Table 3 shows the summary of the calculations and the values of the QS parameter for each method. According to table 3, although the deterministic method includes a good percentage of landslides caused by earthquakes in the high risk region (68.85%), the probabilistic method provides an even slightly better result (69.39%), but classifying as high 382 risk area a much smaller area (13.60% against 32.69%). This determines a QS value much higher for the probabilistic model than for the deterministic one (264.83 to 59.40). Therefore, the zoning obtained from the probabilistic method is more effective.
Table 3: Calculation of parameters of Gee (1992); [22] to compare deterministic and probabilistic hazard map
Conclusion In this study, a method for producing probabilistic hazard maps based on Monte Carlo simulation for the landslides caused by earthquakes has been introduced. Then a comparison between the deterministic method and probabilistic method (this study) has been conducted. This comparison shows that the probabilistic method, based on the Newmark’s analysis, allows importing uncertainties, caused by geological, geomorphological and seismic data, into the model as statistical distribution functions. The above method computes the information and histograms of the obtained values and stores their numerical value for each cell. Subsequently, probabilistic threshold maps for representative parameters, such as the Newmark’s displacement, are obtained as representatives of positional distribution of the risk of the landslides caused by earthquakes in the entire region being studied. Although many issues still remain unsolved due to geological complexities of the region, the applications of this method in the studied area show that this method is more effective in predicting the danger zones in comparison with other methods. This method, which has been implemented using a set of codes written in MATLAB environment, is flexible and can be easily developed to import more complicated problems. For instance, in addition to Newmark’s model, other models can also be utilized, different distribution functions can be used or more parameters can be examined. The model can also be applied to other regions.
i
n
ii ADRQS %)1( 2
1
×−=∑=
QS DR L (%) )2KmL ( A (%) )2A(Km Group Method
59.40 2.09 68.85 2.52 32.69 86 (1)
Deterministic 0.46 31.14 1.14 67.30 177 (2)
264.83 5.10 69.39 2.54 13.60 36 (1)
Probabilistic 0.354 30.60 1.12 86.31 227 (2)

Rajabi et al., JMES, 2018, 9 (2), pp. 424-435 435
Acknowledgments This paper has been written as part of a project organized and funded by Islamic Azad University, Mahallat Branch, Mahallat, Iran. The authors are pleased to acknowledge DrRafieei for providing the facilities for the research.
References
1.!Keefer D.K., Geol. Soc. Am. Bull. 95 (1984) 406-421. 2.! Jibson R.W., Eng Geol. 91(2007) 912-918. 3.!Mahdavifar M., Memarian P.,Geotechnique. 15 (2012) 139-159. 4.!Singh K.K., Singh A.,Nat Hazards 83(2) (2016) 1027-1044. 5.! Jiwen A., Xianfu B., Jinghai X., Gaozhong N., Xiuying W., Nat Hazards. 79 (2015) 511-536. 6.!Mahdavifar M., PhD thesis, International Institute of Earthquake engineering and Seismology, (In
Persian, 213p). 7.!Mahdavifar M.R., SolaymaniS, Jafari M.K., Eng Geol. 86(2002)166–82. 8.!Amini Hosseini K.,International Institute of Earthquake Engineering and Seismology (IIEES).
7(2005),[In Persian]. 9.!Van Westen C.J. SurvGeophys. 21(2000) 2-3. 10.!Capolongo D., Refice A., Mankelow J., SurvGeophys. 23 (2002) 595-625. 11.!Xie M., Esaki T., Zhou G., Mitani Y., Environ Geol, 43 (2003) 503-512. 12.!Refice A., Capolongo D., ComputGeosci 28/6(2002) 735-749. 13.!Aghanabati A.,GeolSurv of Iran, (2004) 582 p. 14.!Newmark N.M., Geotechnique, 15(1965)139–60. 15.!Jibson R.W., Harp, E.L., Michael, J.A., EngGeol, 58 (2000) 271–289. 16.!Arias A., Seismic design for nuclear power plants. Cambridge, MA: MIT Press.(1970) 438–483. 17.!Hoek E., Brown E.T., J. Geotech. Eng Div., ASCE 106(GT9), (1980) 1013-1035. 18.!Hoek E., Practical Rock Engineering (2007), https://www.rocscience.com/ documents/ hoek/
corner/Practical-Rock-441 Engineering-Full-Text.pdf 19.!Chowdhury R.N., Proceedings of the 4th International symposium on Landslides, Toronto, Canada
(1984) September 16-21. 1: 209-228. 20.!Vose D., Chichester, England, (1996) 328. 21.!Wilson R.C., Keefer D.K., US Geol. Surv. Prof. Paper 1360 (1985) 316–345. 22.!Gee M.D., Proceedings of the Sixth International Symposium, Christchurch, 10-14 February 1992,
Christchurch, New Zealand, A.A. Balkema Rotterdam, 2 (1991) 947-952. !
!
(2018) ; http://www.jmaterenvironsci.com !