The E ect of School Closings on Student...
43
The Effect of School Closings on Student Achievement * Quentin Brummet † September 23, 2012 Job Market Paper Abstract While many school districts across the country are shutting schools and shifting around students and teachers, school closing policies remain a very controversial issue. In order to lend evidence to this debate, the current study investigates the effects of school closing policies on student achievement by examining the closure of over 200 school closings in Michigan. Relative to the previous literature, this large sample size allows the study to more thoroughly investigate heterogeneity in treatment effects based on the performance level of the closed school. The results indicate that, on average, school closings do no persistent harm to the achievement of displaced students. Moreover, displacing students to higher-performing schools can result in achievement gains for those students. The displacement of students and teachers creates modest spillover effects on the receiving schools, however. Hence, while the closing of low-performing schools may generate some achievement gains for displaced students, part of these gains will likely be offset by spillover effects onto receiving schools. JEL Classifications: H40, I21 Keywords: School Closings, Student Mobility, School Quality * The author is grateful to David Arsen, Michael Conlin, Todd Elder, and Gary Solon for their guidance and suggestions. Thanks also go to Ot´ avio Bartalotti, Paul Burkander, Steven Dieterle, Susan Dynarski, Steven Haider, Brian Jacob, Barbara Schneider, and participants at the 2011 Meetings of the Association for Public Policy Analysis and Management and 2012 MSU-UM-WU Labor Day Conference for helpful discussions and comments. This research was supported by the Michigan Consortium for Educational Research through Institute of Education Sciences, U.S. Department of Education Grant R305E100008. The author also acknowledges support from Institute of Education Sciences Grant R305B090011 to Michigan State University. The opinions expressed are those of the author and do not represent the views of the Michigan Department of Education or the U.S. Department of Education. † Department of Economics, Michigan State University, 110 Marshall Adams Hall, East Lansing, MI 48824, email [email protected]. 1
Transcript of The E ect of School Closings on Student...
The Effect of School Closings on Student Achievement∗
Quentin Brummet†
September 23, 2012
Job Market Paper
Abstract
While many school districts across the country are shutting schools and shifting aroundstudents and teachers, school closing policies remain a very controversial issue. In order to lendevidence to this debate, the current study investigates the effects of school closing policies onstudent achievement by examining the closure of over 200 school closings in Michigan. Relativeto the previous literature, this large sample size allows the study to more thoroughly investigateheterogeneity in treatment effects based on the performance level of the closed school. Theresults indicate that, on average, school closings do no persistent harm to the achievementof displaced students. Moreover, displacing students to higher-performing schools can result inachievement gains for those students. The displacement of students and teachers creates modestspillover effects on the receiving schools, however. Hence, while the closing of low-performingschools may generate some achievement gains for displaced students, part of these gains willlikely be offset by spillover effects onto receiving schools.
JEL Classifications: H40, I21
Keywords: School Closings, Student Mobility, School Quality
∗The author is grateful to David Arsen, Michael Conlin, Todd Elder, and Gary Solon for their guidance andsuggestions. Thanks also go to Otavio Bartalotti, Paul Burkander, Steven Dieterle, Susan Dynarski, Steven Haider,Brian Jacob, Barbara Schneider, and participants at the 2011 Meetings of the Association for Public Policy Analysisand Management and 2012 MSU-UM-WU Labor Day Conference for helpful discussions and comments. This researchwas supported by the Michigan Consortium for Educational Research through Institute of Education Sciences, U.S.Department of Education Grant R305E100008. The author also acknowledges support from Institute of EducationSciences Grant R305B090011 to Michigan State University. The opinions expressed are those of the author and donot represent the views of the Michigan Department of Education or the U.S. Department of Education.†Department of Economics, Michigan State University, 110 Marshall Adams Hall, East Lansing, MI 48824, email
1
1 Introduction
School closings have become common across the United States, and urban centers such as
Detroit, Kansas City, New Orleans, Oakland, Pittsburgh, and Chicago have all recently closed
schools. In fact, over 1800 public schools were shut nationwide after the 2008-2009 academic
year alone (Common Core of Data, 2011). In addition, as policy discussions have increasingly
focused on high-stakes accountability, some policymakers have suggested shutting some of the
lowest-performing schools as a way to increase student achievement. School closings are often
vehemently opposed by community leaders and teachers unions, however. In fact, during the recent
teacher strike in Chicago, the president of the Chicago Teachers Union described the district’s desire
to shut schools with excess capacity as the “big elephant in the room” (Lah and Botelho, 2012).
Given this controversy, understanding how school closing policies influence student achievement is
essential for policymakers, because the extent to which districts should utilize closing policies will
depend crucially on the effect of closings on student achievement.
Theoretically, the effect of shutting schools on student achievement is ambiguous. On one hand,
school closings may cause harm to students. The disruption of having to change schooling environ-
ments may harm student achievement. School closings may disrupt peer and teacher networks, and
this disruption may persist over time. In addition, the influx of students and teachers at receiving
schools has the potential to harm student achievement at nearby receiving schools. The process of
accommodating new students and teachers may negatively impact student learning. In addition,
because school closings generate such large shifts in the composition of students and teachers at
receiving schools, the inherent quality of teachers and peers may be adversely affected. On the
other hand, being displaced from low-performing schools may expose students to higher-quality
peer groups and teachers, generating achievement gains. Hence, if students are systematically
moved to higher-quality schools then the net effect of the displacement could very well be positive.
Which of these effects dominates and under what circumstances is an open empirical question.
This paper provides evidence on the nature of these effects by examining school closings in
Michigan. Michigan provides an excellent setting for examining school closings because a substan-
tial large number of schools have shut in the past decade. Using statewide micro-data to follow
students after displacement, the study estimates the effects of the closings on displaced students
2
and providing evidence on the magnitude of spillover effects of school closings onto nearby receiving
schools. Because schools may be selected to close on the basis of their past test scores, student
performance may dip prior to closure. Hence, it is important to examine the achievement trajec-
tories of these schools prior to closure in addition to following the students after displacement. By
documenting the magnitude of the dip in test scores, the analysis generates plausible bounds on
the effect of closing schools. Last, the analysis estimates how heterogeneity with respect to the
performance level of the closed school. Because the data contain such a wide variety of school
closings, the current study is better able to identify heterogeneous effects of closing schools from
various ranges of the school performance distribution compared to previous studies in the literature.
Identifying this heterogeneity is key for predicting the effects of hypothetical school closing policies.
The results indicate that student achievement has been unharmed by school closings in Michi-
gan. For reading, the estimates show little significant change in test scores are the time of displace-
ment. For mathematics, students in schools prior to closure are falling behind their counterparts in
schools that remain open. This dip prior to displacement is neither the result of formal school clos-
ing announcements nor simple mean reversion in student test scores. After displacement, student
achievement remains low in the first year in their new school, but improves markedly thereafter for
mathematics. In the third year following displacement, student test scores in mathematics are sub-
stantially higher than they were in the year prior to being displaced. This result suggests plausible
bounds on the effect of school closings on student achievement. If either the drop in test scores
prior to closure was driven by a multiple period transitory shock or discussion about the impending
closure outside of the formal announcement, then the results indicate no long term effect of school
closings on student achievement. To the extent that the drop prior to closing represents a declining
trend in student achievement at the closed school, displacement has a positive impact on mathe-
matics achievement. The effect of displacement varies based on the performance level of the closed
school. For both subjects, students perform better after displacement when the closed school was
relatively low-performing compared to the receiving school. In addition, for mathematics students
displaced to higher-performing schools experience gains in achievement compared to their prior
performance at the closed school. These results are robust to controlling for selective mobility of
students out of schools prior to closure and are not the result of district-wide time trends.
In addition, school closings create spillover effects onto students in receiving schools. In par-
3

ticular, while the influx of displaced students and teachers has a negative, sustained impact on
student achievement in these schools, these effects tend to be modest. In contrast to the results for
displaced students, spillover effects on receiving schools do not appear to vary on the basis of the
performance level of the closed school. This pattern suggests that spillover effects from displaced
students are the result of disruption at the school, and not the result of changes in the quality of
instruction or peer composition.
These results imply that districts forced to close schools due to changing demographics do
no persistent harm to the achievement of displaced students. In fact, students may experience
improvements in achievement if they are displaced from schools that are relatively low performing
relative to nearby schools. Nonetheless, spillover effects on receiving schools would likely offset
much of these gains, implying that a large scale policy to close low-performing school and shift
students to nearby schools would not generate significant achievement gains.
The paper proceeds as follows. Section 2 discusses the relevant literature, Section 3 describes
the context and institutional details surrounding school closings in Michigan, and Section 4 outlines
a conceptual model of how school closings can be expected to affect student achievement. Section
5 then discusses the data used in the analysis and Section 6 presents the empirical specification
and results. Section 7 concludes, discussing policy implications of the results.
2 Literature Review
Generally, the effect of shifting students from one school to another has been studied in a
variety of contexts. For instance, the school choice literature has used random lottery admission
to examine the effect of being admitted to various school choice programs on a variety of student
outcomes.1 These papers differ importantly from school closings because students who apply to
school choice programs are a select sample, however. In addition, the literatures on desegregation
and peer effects also investigate the effect of shifting students from one school to another.2 All of
these policies differ from school closings in that they do not include the mobility of teachers that
1Prominent examples of the school choice literature include Rouse (1998), Cullen, Jacob, and Levitt (2005),Abdulkadiroglu et al. (2011) and Deming (2011).
2See Guryan (2004) or Reber (2010) for studies on the effects of desegregation policies and student outcomes.Imberman, Kugler, and Sacerdote (2012) and Angrist and Lang (2004) are prominent examples of studies that useexogenous movement of students to estimate the magnitude and structure peer effects
4
is typically generated by a school closing. In addition, the policy environments are much different.
For instance, the peer effects generated by Katrina evacuees in Houston are likely much different
than those generated by closing schools and shifting students to another school within the same
school district.
The qualitative literature on school closings documents concern from both teachers and admin-
istrators that students attending closed schools would suffer from the displacement (Lipman and
Person, 2007; Steiner, 2009; Kirshner, Gaertner, and Pozzoboni, 2010). For example, Kirshner,
Gaertner, and Pozzoboni (2010) investigate the closing of one large urban high school. In addition
to documenting achievement losses, they report roughly 40% of students surveyed reported that
they felt a sense of loss or that friendships and relationships were disrupted by the displacement.
Whether this sort of disruption would generate persistent achievement effects across a wide range
of school closings is an empirical question.
In addition to this literature, a few quantitative studies have investigated school closing policies
in particular districts, but have found mixed results.3 Sacerdote (2008) examines the consequences
for students forced to leave school due to Hurricane Katrina. His results indicate that students
experience sharp declines in test scores following displacement, but make up substantial ground
thereafter. The circumstances faced by Katrina evacuees are unique, however, and it is impossible to
separate to what extent these results are driven by changes in family and residential circumstances
due to the hurricane. In Chicago Public Schools, De la Torre and Gwynne (2009) evaluate school
closings aimed at chronically low-performing schools, finding that the closings lead to drops in
test scores, but that the drop is transitory. Ongoing work by Barrow, Park, and Schanzenbach
(2012) investigates a similar set of school closings from Chicago and find persistent drops in test
scores, however. These results all pertain to specific school closing policies in urban settings, and
not to broad-base statewide closing policies such as those investigated in the present analysis.
The most comprehensive published study to date is Engberg et al. (2012), who investigate the
closing of approximately 20 schools in an anonymous urban school district. Their results indicate
that displaced students are harmed substantially, but these effects can be mitigated by sending
displaced students to higher quality schools. Due to data limitations, however, they are unable to
3A related literature that explores the effects of school turnarounds and reconstitutions (i.e., replacing school staffwithout shifting students to other schools) finds mixed results for student outcomes (Gill et al., 2007; Hess, Jr., 2003;Brady, 2003; Malen et al., 2002).
5

examine the trajectory of student achievement of students in closed schools prior to displacement.
The current study seeks to add to this existing literature in three ways. First, the study examines
a broader set of closings than these previous studies, and uses this large data set to investigate
the heterogeneity of school closing effects on the basis of school performance. Second, by using
statewide micro-data, the analysis is able to account for students who leave the district after a
school closing. This allows the analysis to be robust to non-random selection of students leaving
the school district after a school closing. Last, the study pays particular attention to the role of
teachers in school closing policies. In many school closings in Michigan, the teachers are retained in
the district after displacement. This generates additional spillover effects onto a possibly distinct
set of receiving schools.
3 School Closings in Michigan
The current study examines 246 school closings that occurred in Michigan between 2006 and
2009.4,5 School closings in Michigan are driven almost exclusively by declining district enrollments.
In addition to well-documented statewide population declines, an increase in school choice policies
has led to further enrollment declines in some districts.6 Figure 1 displays the location of closed
elementary and middle schools in Michigan between 2006 and 2009. As can be seen, the Detroit
Metropolitan Area has had a large number of school closings over this time period. This includes
many schools in the city of Detroit, but also schools in suburban areas. In addition, other urban
centers such as Flint, Saginaw, and Grand Rapids have closed schools recently. While most of the
schools studied in the analysis are in these urban and suburban areas, many rural areas across the
state have shut schools as well.
While some districts make plans for school closures years in advance as part of district-wide
reorganization plans, the vast majority of districts do not decide on which school to close until the
spring of the last year the school is open. The choice of which school to close is influenced greatly
by parents and community activists, who often campaign against the closing of their neighborhood
4This paper will adopt the convention of referring to academic years by the spring, i.e., the 2005-2006 academicyear will be referred to as 2006.
5These 246 schools include 18 charter schools.6Toma, Zimmer, and Jones (2006) find that in Michigan around 80% of students who enroll in charter schools
were previously enrolled in traditional public schools.
6
school. Moreover, district officials look at factors such as school condition, enrollment, and location
when making their decision. Because of this complex process, school closings become very political,
and the schools chosen for closure are often not the lowest-performing schools in the district.
After closure, students are assigned to a new school within the district. While parents are not
locked into their assigned school, the choice they have in schools after displacement is essentially
the same as their choice prior to closure. Parents can choose to move or have their children utilize a
school choice program, but the shutting of a school does not dramatically alter the parents’ choice
set, outside of reassigning them a new neighborhood school. Teachers are also moved around within
the district after a school closes. In fact, in the current sample the fraction of teachers leaving
the teaching profession is no larger after a closing than in a normal year.7 While the majority
of displaced students are usually transferred to the same nearby schools, displaced teachers can
be shuffled throughout the district. Hence, schools that receive displaced teachers may be quite
different from those that receive displaced students, and students in both groups of schools may be
affected by the change in teacher composition.
4 Conceptual Model
Consider the following stylized model of student achievement:
Yist = Xitβ +Mitαit + ψst + µi + eist (1)
Yist represents the achievement of student i in school s at time t. ψst is a school quality component
of student achievement, µi represents fixed student-level influences, and eist is an idiosyncratic error.
Given that student mobility may affect students for more than one year, Mit is a vector of indicators
indicating that the student moved schools k years ago. In particular, Mitαit =∑
k αit,kmi,t−k where
mi,t−k is an indicator that the student moved schools in year t − k. Note not only will different
students respond heterogeneously to moving schools, but the same student may respond differently
to different moves. Hence, αit varies both across students and within students over time. For
example, students may experience less disruption when moving to new schools with many of their
7A small number of districts have placement policies based on teacher preferences, but the majority of displacedteachers are reassigned using standard district transfer policies that weigh school needs and administrator preferencesin addition to the teacher’s own stated preferences.
7
previous classmates or teachers.
For ease of exposition, assume that mobility has no effect on Xit and future values of mit.
This rules out scenarios where being displaced by a closing makes the student more likely to move
schools in the future or changes the likelihood that students are placed in programs such as special
education.8 Leting Titk be an indicator that the student was displaced due to a school closing k
years ago, the causal effect of moving schools due to a school closing can be written as follows:
E[Yist|Titk = 1]− E[Yi,s′,t|Titk = 0] = αit,k + (E[ψst|Titk = 1]− E[ψs′,t|Titk = 0]) (2)
Similar to the model of student mobility discussed in Hanushek, Kain, and Rivkin (2004), this effect
consists of two components. The first component represents the direct effect of changing schools
on student achievement. Again, this effect may be heterogeneous among students depending on
the circumstances surrounding the displacement. In addition to this direct effect, students will on
average experience a change in school quality.
Note that the quality of the receiving school may change due to the influx of new peers and
teachers. Hence, school closings may affect students in receiving schools as well as displaced stu-
dents. In particular, consider the following decomposition of school quality:
ψst = (FPstΠ
P + F TstΠ
T ) + SQst + ust (3)
The first group of terms consists of FPst and F T
st , which represent the fraction of students and teachers
in a school who are new to the school, respectively. This captures that new students and teachers in
the school may cause disruption to the learning environment. As with student mobility, disruption
to the school environment may affect schools dynamically. Specifically, FPstΠ
P =∑
j πPj f
Ps,t−j and
F TstΠ
T =∑
j πTj f
Ts,t−j , where fPst and fTst represent the fraction of students and teachers at school s
in year t, respectively. SQst captures both school-level factors that are fixed in the school over time
such as school facilities and administration, as well as aspects of school quality that may fluctuate
within a school over time, such as the quality of the peer and teacher composition in the school.
ust is a school*year level error term.
8The model can be readily extended to incorporate these effects, but their inclusion does not change the conclusionsof the model.
8
In this framework, the change in school quality following a displacement can be written as
follows:
ψst − ψs′,t−k = (FPstΠ
P − FPs′,t−kΠP ) + (F T
stΠT − F T
s′,t−kΠT )
+ (SQst − SQs′,t−k) + (ust − us′,t−k) (4)
The first two terms capture that the receiving school will likely have more disruption due to the
influx of new students and teachers. Hence, it is possible that students who might have been
expected to move to a much better school as a result of displacement do not actually experience
this improvement in school quality because the influx of teachers and students from the closed school
reduced the quality of the receiving school. The last two terms will be essential for the empirical
analysis. In particular, consider two cases. On one hand, if student achievement improved after
displacement because SQst > SQs′,t−k, then this would represent a causal effect of school closings on
displaced students. On the other hand, if student achievement increased because ust > us′,t−k, this
would not represent a causal increase in student achievement. For example, if schools were selected
to be closed on the basis of their latest test scores, displaced students would have particularly low
draws of us′,t−k, leading ust − us′,t−k to be positive. This issue is discussed in greater detail in
Section 6.
Note that students in receiving schools will also experience a change in school quality due to
both the disruption from new students and teachers and also the change in peer and teacher quality.
This effect may differ from that experienced by displaced students, because students at receiving
schools do not experience changes in some aspects of school quality. For example, if a school had
a very good curriculum that did not change when the school absorbed new students and teachers,
this would improve student achievement for displaced students but not for students already at the
receiving school.
While being displaced by a school closing is a type of student mobility, it is important to
note that the effect of moving schools due to a school closing is distinct from effects that have been
previously estimated in the student mobility literature for students who switch schools voluntarily.9
9Recent prominent papers in the student mobility literature include Hanushek, Kain, and Rivkin (2004), Xu,Hannaway, and D’Souza (2009), and Loeb and Valant (2011).
9

In particular, these effects are likely to differ for at least three reasons.
First, the circumstances surrounding mobility may be different between displaced students and
voluntary movers. This will result in αit,k being different on average for voluntary movers than for
students displaced by closings. For instance, students in closed schools often attend school post-
displacement with many of their previous classmates. If the mobility effect is due to disruption in
student peer networks as a result of the move, one might expect student achievement to be lower
in the case of voluntary moves as compared to school closings. In addition, the discussion of the
impending closure may create disruption in the school prior to closure. This disruption in student
achievement would not occur prior to a voluntary move and might alter the effect of the move on
student achievement.
Next, as discussed in the student mobility literature, different types of student moves will
result in different changes in school quality. In the context of the current model, this implies that
(SQst − SQs′,t−k) is different in the context of voluntary student mobility. These may potentially
be very different as voluntary movers are explicitly making the decision to change schools, whereas
school closings displace many students who would not have moved schools in the absence of the
closing.
Last, inflows of students who moved voluntarily are typically much smaller than inflows following
school closings, implying that FPstj and F T
stj are greater in the context of school closings. In addition,
because the the influx of new students and teachers into the receiving schools will often be much
larger than influxes of voluntary movers, it has the potential to fundamentally alter the quality of
the receiving schools. This implies that there may be much larger changes in SQst for receiving
schools after closings than typically would occur in the case of voluntary mobility.
Another strand of literature investigates the effects of structural moves on student achievement.
For example, Rockoff and Lockwood (2010) use data from New York to show that students lose
ground in achievement when moving from elementary to middle schools. While in some ways these
moves more closely resemble school closings than voluntary mobility, the estimated effects can still
be expected to differ for similar reasons. First, the transition from elementary to middle school is
expected, which may lead to less disruption to student achievement than a sudden school closing.
Next, while groups of students often move together from elementary to middle schools, teachers
usually do not. Because teachers are often displaced as a result of school closing policies, this
10
creates the potential for additional disruption in the learning environment. Last, differences in
school quality between middle and elementary schools may be much different than school quality
differentials between closed and receiving schools. Hence, estimated effects of these moves can be
expected to differ in potentially significant ways.
5 Data
This study uses Michigan administrative data maintained by the Center for Educational Per-
formance and Information (CEPI) and the Michigan Department of Education (MDE). A detailed
description of the data can be found in an online data appendix.10 Briefly, the sample includes all
students in grades 3-8 over the 2006-2010 academic years, a total 1,252,101 students and 3,415,928
student*year observations. Of these students, 39,205 were displaced by a school closing, with some
students being displaced multiple times.
Student achievement scores are taken from the Michigan Educational Assessment Program
(MEAP) exams, which are administered to students in grades 3-8 in the fall, usually in early to
mid-October. The fall administration of the MEAP slightly changes the interpretation of the results.
The tests are designed such that much of the knowledge tested in year t is the result of instruction
in year t − 1 (Michigan Department of Education, 2005). If this is the case, interventions should
have a lagged effect on student achievement.11 Therefore, displaced students usually take their last
test in the closed school prior to the formal announcement of the school closing. Nonetheless, it is
possible that extensive MEAP preparation prior to taking the tests may affect MEAP scores. If fall
preparation has a large impact, an intervention in year t might influence test scores immediately.
Table 1 presents descriptive statistics from the sample used in the analysis. The sample includes
significant portions of minority and disadvantaged students. In particular, 43.1% of the sample is
eligible for free or reduced-price lunch and 24.1% of the sample is either black or Hispanic. Over
1.2% of the sample is in a school that will close that year, corresponding to over 40,000 observations.
In addition, 7.0% of the sample attends school in a district that closed a school the previous year,
and may themselves be affected by closings due to spillover effects. Due to the limited time frame
10Online material can be found on the author’s website at https://www.msu.edu/∼brummetq.11Fall tests have been used in other work such as Hoxby (2000), who assumes achievement in year t is not affected
by school inputs in year t.
11
of the study, there are fewer observations in the sample for students who are many years away from
closure.12 Nonetheless, over 10,000 student*year observations exist on students three or more years
after displacement. In addition, there is substantial variation in the fraction of students at a school
that were just displaced by a school closing. Most students in the sample do not attend school with
any displaced students, but in some schools up to 74.0% of students were previously displaced by
closure.13
Table 2 presents descriptive statistics of students in closed schools in Michigan and compares
them to all students in Michigan and students within their own district. Compared to other schools
in their district, closed schools enroll almost 100 fewer students. This is not an artifact of different
grade configurations between open and closed schools. Even comparing among schools with K-5
grade configurations, closed schools have lower enrollment compared to other schools in the sample.
This supports statements by district officials, who often cite declining enrollments as one of the
key factors in deciding which schools to close. While students in closed schools are similar in
terms of gender and Limited English Proficient status compared to other students in the state,
districts that close schools have much different demographics than districts that do not. Almost 50
percent of students displaced by school closings attended schools in urban areas. Compared to the
average student in Michigan, these students are more likely to be African-American, participate in
special education programs, and be economically disadvantaged as measured by eligibility for free
or reduced-price lunch. These differences are largely due to differences between districts that close
many schools and districts that do not. In terms of student achievement, students in closed schools
tend to perform 0.4–0.5 standard deviations worse than the state average but only a little over
0.1 standard deviations worse than students within their district. Nonetheless, while the majority
of poor performance by students in closed schools can be attributable to district-level differences,
the fact that students in closed schools perform worse than peers in their own district supports
anecdotal evidence from district officials that school performance is at least partially taken into
account when making their decision of which school to close.
Table 3 displays statistics on the movement of students and teachers after closings. For the
12In addition to making estimates of student achievement three or more years after displacement less precise, thisimplies that different sets of closings identify different coefficients in the empirical model. This concern is discussedfurther in Section 6.2.
13These instances where many students were previously displaced are the result of school consolidations.
12
majority of school closings, the median student in that closed school attends a school less than 1.5
miles away from their previous school after being displaced. However, for some closings the median
student attends school almost five miles away from their previous school after displacement. As a
result of remaining in the same school district, students often attend the same receiving school after
closure. As can be seen, the fraction of students attending the modal receiving school after closure
is often less than the fraction of teachers attending the modal receiving school. This underscores the
point that displaced teachers are often more widely dispersed after closure than displaced students.
Table 3 also shows that for the majority of school closings, non-trivial fractions of students either
leave the school district or attend a charter school after displacement. This highlights one advantage
to using state-wide administrative data to study school closings – it is much easier for parents to
move out of district in response to school closings than to leave the Michigan public and charter
school system.
6 Empirical Analysis
Given the highly political way in which school closing decisions are made, school closings de-
cisions may not be randomly assigned conditional on student fixed effects and observable char-
acteristics. Most importantly, district administrators often take student test scores into account
when deciding what school to close, creating a pattern where student test scores in schools decline
prior to closure. This dip could either be due to systematic decline in student test scores prior
to closure or a transitory decline in test scores, similar to the “Ashenfelter Dip” that has been
observed in job training programs (Ashenfelter, 1978; Ashenfelter and Card, 1985). If the dip is
transitory, it may lead conventional program evaluation techniques to overestimate the impact of
school closings due to mean reversion in student test scores (Chay, McEwan, and Urquiola, 2005).
It is important to emphasize that there could also be a causal effect of school closings on student
achievement prior to closure. Closed schools are often in danger of being closed for years before
they are eventually closed, which could lower student test scores through additional disruption in
the schools. Because of these concerns, it is important to consider the pattern of test scores prior
13
to closure when investigating school closings. Consider the following model:
Yist =3∑
k=−2δkTitk +
3∑j=1
1[Titj = 0](πPj,lfPs,t−j+1 + πTj,lf
Ts,t−j+1)
+Xistβ + µi + θgdt + εist (5)
The treatment specification for displaced students mirrors that found in research on displaced
workers (Jacobson, LaLonde, and Sullivan, 1993; Stevens, 1997) and includes dummy variables
indicating how many years the student is from displacement. Specifically, for k < 0, Titk is a
dummy variable indicating that the student attends a school that will close in |k| years. If k is
positive, Titk takes a value of 1 if the student was displaced by a school closing k years ago.14
fPst and fTst represent the fraction of students and teachers at school s in year t who were displaced
j years ago, respectively. Note that these variables can also be defined at the grade level as opposed
to the school level. School level disruption measures are preferred for two reasons. First, they
capture potentially important spillover effects across grade levels, which would bias the results if
fPst and fTst were defined at the grade level. In addition, the fall administration of the MEAP means
that multiple teachers may be responsible for student achievement in year t, implying that grade
level fPst and fTst measure would miss spillover effects across grade levels.15 Both fPst and fTst are
interacted with an indicator for whether the student was displaced k years ago.16 Yist represents
the achievement of student i in school s, year t. Xist is a vector of student controls containing
free or reduced-price lunch eligibility, Limited English Proficiency status, and special education
status.17 All test scores are standardized within grade and year to have mean 0 and variance 1. µi
and θgdt are student and grade*district*year fixed effects, respectively.
While school closings are potentially endogenous, the dynamic specification allows the researcher
to identify separate effects of school closings based on what assumptions are made about the decline
in test scores prior to displacement. If the drop in achievement prior to closure is caused by the
14For example, if a school closes after the 2008 academic year, students attending that school in 2007 haveTi,2007,−1 = 1, Ti,2008,0 = 1, and Ti,2009,1 = 1.
15Results using grade-level variation are qualitatively similar, and can be found in Online Appendix Table C.1.16If a student moves into a school for a reason other than being displaced by a closing, they are counted as a
student at the receiving school. The results are not sensitive to changes in this definition.17Student mobility history, average school demographics, and average rates of student mobility in the school are
excluded as they are possible outcomes from school closings. The results are not sensitive to the inclusion of thesevariables.
14
closing itself or if all of the drop in student test scores prior to closure is transitory in nature,
then the effect of school closings on student achievement k years after closure is δk. To the extent
that drops in test scores were all part of a systematic decline in the quality of the closed schools,
then the effect of the school closure would be at least as large as δk − δ0. In particular, under the
assumption that student achievement would have remained the same had the school not closed, the
effect of displacement is exactly δk − δ0. If the school was trending downwards, then δk − δ0 is a
lower bound for the effect of the displacement on student achievement.
As shown in Table 2, districts that closed many schools are substantially different from the
average district in the state. To the extent that these districts had secularly declining test scores,
this would bias the results. The inclusion of grade*district*year fixed effects allows the analysis to be
robust to general district-level time trends and compares students displaced by closure to only their
own peers within the district.18 Note also that this makes the specifications similar to much of the
school closing literature using district-level administrative data, which often includes either year or
year*grade fixed effects. The inclusion of these fixed effects makes the estimation computationally
more demanding, however. As a result, the analysis uses a computational algorithm developed
by Guimaraes and Portugal (2010).19 Standard errors are adjusted for clustering at the district
level.20
This equation is similar to value-added models used to estimate teacher quality, which often
condition on lagged student outcomes. However, recent simulation evidence by Guarino, Reckase,
and Wooldridge (2011) shows that the decision of whether to condition on a lagged test score or
student fixed effect should depend largely on the mechanism for assigning students to treatment.
In the context of estimating teacher effects, estimators that condition on lagged test scores often
perform very well if students are tracked into classrooms on the basis of test scores. However,
in the current study the relevant assignment mechanism is how students are assigned to schools,
which is likely to be based primarily on relatively time-invariant characteristics of students such as
residential location. As such, a student fixed effects approach is preferred for the current study.
18While not shown here, results are qualitatively similar using district*year fixed effects as opposed tograde*district*year fixed effects.
19Briefly, this algorithm alternates between estimating the coefficients on the variables of interest and the fixedeffects, holding one set of parameters fixed while estimating the other set.
20Adjusting for clustering at the district level is preferred since that is the level on which the decision to close aschool is made. In practice, standard errors clustered at the district level are larger than those clustered at the schoollevel, and hence the standard errors reported in the analysis can be viewed as conservative.
15
Given these concerns, the analysis is broken up into three parts. Section 6.1 estimates the
average effect of school closings in Michigan. Section 6.2 examines possible explanations for the
patterns observed in the data. Last, Section 6.3 examines heterogeneity based on the performance
level of the closed school.
6.1 Baseline Analysis
Table 4 contains estimates of the specification shown in Equation (5). For mathematics, stu-
dent test scores drop in the years prior to closure, stay low in the first year at their new school,
and then improve in the years after closure. In particular, during the last year the school is open
students perform 0.061 standard deviations worse compared to three years prior to closure. Stu-
dent performance is even lower in the year after closure, and drops to 0.074 standard deviations
below their performance three years prior.21 Note again that because the MEAP is given during
the fall, much of the poor student performance in the first year after displacement could be the
result of knowledge that was gained the year before. Hence, the estimated coefficient for one year
after displacement may overstate any potential negative effects from the displacement. Student
achievement improves in the years following displacement though and, two years after closure, is
similar to levels two years prior to closure and significantly better than in the last year in the closed
school.22
As discussed previously, this analysis provides plausible bounds for the effect of school closings
on the achievement of displaced students. If all of the drop in student test scores prior to closure
is transitory in nature, then there are short-run negative effects from the closing, but no long-run
effects on student achievement for displaced students. Hence, at the very least the results imply
that school closings in Michigan had no sustained negative impacts on displaced students. To the
extent that drops in mathematics scores prior to displacement represent a declining trend that was
not caused by the discussion of the school closing itself, then the effect of the closing is in fact
positive, and over the long run student achievement in mathematics improves as a result of the
21Given that there are five years of data and six treatment indicators, it is clear that different cohorts of displacedstudents identify different subsets of the δk coefficients. If the composition of school closings differs substantiallyfrom year to year, then the dynamic pattern of the pooled results will not accurately reflect the true effect of schoolclosings. Appendix A displays the results of specifications like those shown in Section 6.1, but where treatment isdefined separately for each cohort. The results are qualitatively similar.
22The t statistic for a Wald test testing that mathematics achievement two years after displacement is the same asmathematics achievement the year prior to displacement is 1.86.
16
displacement. Section 6.2 will return to this and present evidence about the nature of the dip in
student performance prior to displacement.
For reading scores, the pattern is less clear. On the whole, the estimated achievement trajecto-
ries are similar for mathematics and reading. Student achievement drops prior to displacement and
into the first year in the new school, but improves moderately thereafter. There are some important
differences between reading and mathematics, however. In particular, the dip in test scores prior
to displacement is not significant, and the results are not estimated with enough precision to rule
out that student achievement does not change after displacement.23 Hence, the results indicate the
potential for only small, undetectable effects of displacement on student achievement in reading.
Both Sacerdote (2008) and De la Torre and Gwynne (2009) similarly find fadeout in displace-
ment effects. However, these patterns contrast with those presented in Barrow, Park, and Schanzen-
bach (2012) and Engberg et al. (2012), who find sustained detrimental effects from displacement.
There are multiple possible explanations for this difference in results. For one, these studies only
analyze data from single school districts and therefore are unable to account for dynamic attrition
of students out of districts after closure. If the students selecting out of the district were students
who had low draws of εist prior to displacement, this would bias the estimates towards estimating
overly negative effects of school closings. In addition, it is possible that the students experienced
different changes in school quality between the two settings. The only other study to attempt to
estimate heterogeneity in closing effects on the basis of the performance level of the closed school
is Engberg et al. (2012), who use a value-added measure of school quality that is difficult to ex-
trapolate to other settings. This point is returned to in Section 6.3, which attempts to estimate
this heterogeneity in school closing effects.24 Whether these differences are enough to account for
the differences in results is a question for future research.
Students in schools that receive the displaced students are also affected by the closing. Table
5 displays results from specifications as described by Equation (5), with the fraction of displaced
students in the receiving school also interacted with treatment for displaced students.25 As can be
23The t statistic for a Wald test testing that reading achievement two years after displacement is the same asreading achievement the year prior to displacement is -0.87.
24In addition, the model estimated by Engberg et al. (2012) does not include student fixed effects, but controlsinstead for student’s baseline test scores. As explained in Todd and Wolpin (2003), if the baseline scores measurestudent achievement with error, the estimated model under-adjusts for student fixed effects. The resulting omitted-variables bias is likely to generate overly negative estimates of displacement effects.
25Refer to Online Appendix Table C.3 for full estimates of this specification, where the main treatment specification
17

seen, the results show that displaced students and students previously at the receiving schools are
similarly affected by disruption in the new school. In particular, the results suggest that the influx
of new students decreases student achievement in both mathematics and reading. To give some
interpretation to the size of these coefficients, the standard deviation of the fraction of displaced
students in a receiving school is roughly 0.035, so the -0.218 coefficient for mathematics can be
interpreted as a 0.008 standard deviation decline in student achievement for a one standard devia-
tion increase in the fraction of students in the school who were just displaced by a school closure.
Likewise, the -0.280 coefficient on reading can be interpreted as a 0.010 standard deviation drop
in student achievement for each standard deviation increase in the fraction of displaced students
in the school. These results could potentially be biased if students were sent to schools that were
trending up or down prior to receiving the displaced students. While not shown here, leads of the
fPst and fTst variables are close to zero, providing support for the assumption that students were not
dynamically sorted into receiving schools.26
These figures are of the same magnitude as those reported in Hanushek, Kain, and Rivkin (2004)
for the fraction of students who voluntarily move into the school. While this estimate is very small,
it is important to note that, unlike voluntary moves studied in Hanushek, Kain, and Rivkin (2004),
school closings occur in specific areas, and most receiving schools are likely to experience much larger
than one standard deviation increases in the fraction of closed school students when nearby schools
close. In fact, the median displaced student attends a school in which roughly 20% of the student
body was just displaced the previous year. In this case, student achievement at the receiving school
declines by roughly 0.044 standard deviations in math and 0.056 standard deviations in reading as
a result of the influx of new students.27
In addition to displaced students, receiving schools are also affected by an influx of displaced
teachers. Similar to previous results, it appears that displaced students and students at the receiving
school are affected similarly by the disruption. In particular, the fraction of displaced teachers in a
receiving school tends to have a small or negligible negative effect in the first year, and is significantly
for displaced students is estimated for those students attending receiving schools with mean levels of fraction ofdisplaced students and teachers in their receiving school after displacement.
26Online Appendix Table C.2 contains the estimates of regressions including these leads of the treatment variables.27One might expect that larger schools have more resources to shift around, and hence are better able to accom-
modate the same percentage change in new students compared to smaller schools. If this were the case, then therewould be heterogeneity in spillover effects with regards to school size. This does not appear to be the case, however,as the spillover effects do not vary with the size of the receiving school.
18

larger in magnitude two or more years afterwards for both mathematics and reading. This pattern
could be explained by the fall administration of the MEAP, as instruction in year t may not have
its full impact until year t + 1. The implied negative impact is very small, however. The median
school receiving displaced teachers has 16.7% of its teaching force composed of displaced teachers.28
This implies that for students in these receiving schools, the drop in mathematics test scores due
to the new teachers would be small in first year and rise to 0.014 the year after. The effect on
reading scores is similar. In the first year there is a negligible 0.005 drop in test scores, but the
year after student achievement is 0.022 lower than before the influx of new teachers. While these
estimates are smaller in magnitude than those presented previously for the fraction of displaced
students entering a school, they are not statistically different.
6.2 Possible Explanations for Changes in Student Achievement
Interpreting the drop in mathematics scores prior to displacement, the explanation of the results
may change substantially. In particular, it may have been the case that formal announcements of
school closings caused a drop in student and teacher morale which drove the decrease in test scores
prior to closure. This is unlikely though, because as discussed previously the vast majority of
closings in Michigan were announced during the spring of the last year the school was open, after
students had taken the MEAP exams.29 These closings contain over 90% of all students who were
displaced. This implies that the drop in student achievement prior to closure is not driven by
disruption resulting from the formal announcement that the building would be closed.30 While it
is possible that the discussion of impending closure caused disruption in the learning environment
prior to the formal announcement of the closure, it is unlikely that formal announcements of the
school closings are driving the decline in test scores prior to closure.31
Another possible explanation is that students were selectively moving out of schools prior to
28The median displaced student attends a school where 5.3% of the teachers were just displaced.29Data on date of announcement of school closings were obtained from internet searches of newspaper articles
and personal communication with district officials. There is substantial missing data on when school closings wereannounced, however, corresponding to 19.5% of displaced students.
30Online Appendix Table C.4 contains results of specifications estimated just on the set of school closings notannounced in advance.
31Another possible way to investigate whether the anticipation of the closing had a negative effect is to examinewhether displacement effects were much less for students in the highest grade at the school. This is highly suggestivehowever, as prior work has documented achievement losses for students who change schools due to grade progressions(Rockoff and Lockwood, 2010). Nonetheless, as documented in Online Appendix Table C.5, results for students intheir terminal grade at the time of closure are qualitatively very similar to students in younger grades.
19
closure. Because the treatment specification in Equation (5) defines all students attending schools
prior to closure as treated, students switching into or out of schools prior to closure help to identify
the model, implying that dynamic selection of these students may bias the results. In addition, the
analysis above ignores other student mobility patterns that may be correlated with school closings.
To address both these concerns, Table 6 displays results based on specifications such as that shown
in Equation (5), with a separate treatment specification estimated both for students who move
schools voluntarily and for students who move out of schools prior to the closing. The estimated
mathematics trajectory for displaced students is very similar to that shown in Table 4, implying
that the drop in test scores prior to displacement is likely not driven by selective mobility out
of schools prior to closing. For reading, the drop in student achievement appears to be slightly
larger than in Table 4. Nonetheless, students still recover substantially in the two to three years
after displacement and the results are not statistically different from those presented previously. In
addition, the achievement trajectory for both mathematics and reading is significantly different for
displaced students compared to voluntary movers. This underscores the fact that moving schools
voluntarily is a different treatment from being displaced by a school closing. Note that voluntary
movers experience a decline in test scores in the last year in their old school, suggesting that
voluntary moves are endogenous to student achievement.
Given these results, it is unlikely that the drop in mathematics scores prior to displacement was
driven by either formal announcements of closings or selective mobility of students out of closed
schools. This still leaves open the possibility that the drop was the result of a transitory shock in
student test scores, and schools were selected to be closed on the basis of these bad shocks. While
this is possible, the fact that the shock is present for multiple periods rules out a story that the school
simply had one bad year and students rebounded afterwards due to simple mean reversion.32 One
explanation that cannot be ruled out is that, relative to other schools in the district, closed schools
were negatively affected by discussion of the impending closure prior to the formal announcement.
While this is possible, another explanation is that district administrators shut schools that were
systematically losing ground prior to closure. If this latter explanation is true, the increase in
mathematics scores after displacement is not simply a statistical artifact but a causal increase in
32In addition, if the fall MEAP test does measure knowledge gained in prior periods as it was designed, this impliesthat the shock would have needed to be present for three years in a row to explain the results.
20
student test scores. In addition, the substantive conclusions for reading scores are unchanged. There
is no detectable dip in achievement prior to displacement student achievement does not change
significantly after displacement. These results are unchanged accounting for selective mobility of
students out of schools prior to closure and do not appear to be driven by formal announcements
of school closings.
One potential explanation for the increase in student achievement after displacement is that
school closings were occurring as part of a district-wide plan to upgrade facilities. Previous research
has found that there may be some moderate achievement gains from upgrading facilities (Cellini,
Ferreira, and Rothstein, 2010). However, given the current fiscal environment in Michigan very
few of the school closings currently studied are a result of these sorts of plans.33 Only a little over
ten percent of the displaced students considered in the analysis attended school in a district that
passed a qualified bond referendum within five years of closing, and results are qualitatively similar
when limiting the analysis to just those districts without qualified bonds.34 One might also think
that by closing schools, districts are able to devote more expenditures towards students as opposed
to building maintenance. However, results available from the author suggest that the distribution
of district-level per-pupil expenditures do not change significantly when districts close buildings.35
One might also worry that the increase in test scores after closure was driven entirely by selective
attrition of displaced students from the Michigan public school system. Clearly, if the attrition were
based on time-constant factors, it would not bias the analysis due to the inclusion of student fixed
effects. Dynamic attrition of displaced students out of the Michigan public and charter school
system would bias the analysis, however. Nonetheless, only 2.25% of students displaced by closure
leave Michigan public schooling compared to 2.11% of all other students. As previously documented
in Table 3, it is much more likely for students to either leave the school district or attend a charter
school after displacement. Hence, while it is possible for students to leave the state or attend
private schools after closure, these figures suggest that bias resulting from dynamic selection of
students moving out of Michigan or to private schools is likely not a first-order concern for the
33Qualified bonds are limited to to bonds obtained to renovate or construct a new elementary or middle schoolwithin the last five years. This data is publicly available from the Michigan Department of Treasury and can befound at https://treas-secure.state.mi.us/apps/findschoolbondelectinfo.asp.
34The estimates of these regressions are available in Online Appendix Table C.6.35Expenditure information is publicly available from Bulletin 1014, which is published by the Center for Educational
Performance and Information and can be found at http://www.michigan.gov/mde/0,1607,7-140--21514--,00.html.
21
current analysis.36 The next section will examine another possible explanation for the increase
in mathematics achievement after displacement. In particular, it will examine the role of school
performance in the effect of school closings on student achievement and whether increases in school
performance can explain the estimated gains in mathematics after displacement.
6.3 Heterogeneity by Performance of the Closed School
As discussed in Section 4, the effect of school closings on student achievement can be expected
to vary based on the performance of both the closed schools and the set of schools that students
and teachers get displaced into. It is important to note that the effect of closing a low-performing
school in practice is different from the effect of shutting a school and randomly assigning students
to schools after displacement.37 Because no school closing policy will be able to randomly assign
children to schools following displacement, the effect of shutting a low-performing school will include
the location and schooling choices that are made by parents after the closing. This will generate a
different outcome for both the displaced students and students in receiving schools than a policy
that randomly assigned children after displacement. Hence, while the effect of school quality on
student achievement is important, the effect of shutting low-performing schools is of greater interest
to policymakers interested in evaluating a potential school closing policy.
The current study uses the average of 4th and 7th grade proficiency rates from 2000-2005 as
a measure of school quality.38 This contrasts with Engberg et al. (2012), who use an value-added
index generated by the anonymous school district to measure the quality of the closed school. While
this measure does attempt to measure school quality, proficiency rates are preferred for the current
study for two reasons. Most importantly, value added measures attempt to partial out aspects of
school performance that are out of the school’s control.39 The effect of shutting a low-performing
36Data from the 2010 Private School Universe Survey indicate that on the order of 6 − 7% of Michigan studentsattend private schools. This is roughly half the size of the fraction of students who utilize school choice programssuch as charter schools or inter-district choice.
37Engberg et al. (2012) instrument for the quality of school that a student attends post-displacement with thequality of the school to which the student was assigned to attend, which is designed to estimate the effect of schoolquality on student achievement.
38To ensure comparability across years, these measures are normalized within year to have mean zero and standarddeviation one. As a frame of reference, in the current sample one standard deviation in proficiency rates correspondsto roughly a 0.4–0.5 standard deviation difference in student test scores.
39Depending on the specification of the value-added model, school quality may be defined to include peer quality orteacher quality in addition to fixed school-specific components. Nonetheless, as the estimates in the current study areestimated using within-student variation, any differences in the results when using value-added compared to averageperformance measures would more likely be due to differences in the measurement of peer and teacher quality than
22

school will depend on all components of school performance, however. Average school proficiency
measures capture peer inputs in addition to school and teacher quality. This is important because
the effect of shutting schools will depend on these changes in peer composition. In addition, data
limitations make out-of-sample value added measures of school quality difficult to estimate.40 Out-
of-sample measures of school quality are preferred, because results using in-sample measures will
likely be biased due to mean reversion in student test scores.
The basic specification presented in this section will interact changes in school quality with the
treatment specification shown in Equation (5):
Yist =3∑
k=−2δkTitk +
3∑j=1
1[Titj = 0](πPj fPs,t−j + πTj f
Ts,t−j)
+
3∑k=−2
γkTitk∆Pis,t−k+1 +
3∑j=1
1[Titj = 0](πPj fPs,t−j∆
Ps,t−j+1 + πTj f
Ts,t−j∆
Ts,t−j+1)
+Xistβ + µi + θdgt + εist (6)
The change in school performance, ∆Pist = Pist − Pi,s′,t−1 for a given student, where Pst is the
average proficiency rate for a school described above. ∆Ps,t and ∆T
s,t are defined to be the average
difference between current and prior school performance between displaced students and teachers,
respectively.41
In the current sample, the average displaced student attends a school that is around 0.66
standard deviations below average in terms of school performance the year prior to displacement,
and moves to a school that is 0.40 standard deviations below average the year after displacement.
There is substantial heterogeneity in ∆Pist smong displaced students, however. Figure 2a shows the
distribution of ∆Pist among all displaced students in the sample. While the average and the median
are positive, a substantial fraction of displaced students attend schools after displacement that are
lower-performing than the school from which they were displaced. Figure 2b shows the distribution
of standardized math proficiency statewide, and plots separate densities for both closed and open
schools. The density for schools that were closed is shaded black and the density for schools that
differences in student ability.40In particular, prior year test scores are not available prior to 2006. For a full description of student-level micro-
data in Michigan, refer to the Data Appendix.41One could also interact Pist and Pi,s′,t−1 separately with the treatment. This produces qualitatively similar
results to what is presented in Table 7, and hence the current specification is preferred for ease of exposition.
23
remained open is shaded white. Examining Figure 2b, it is clear that the average closed school
was below average for the state, but again there is substantial variation in the performance level of
closed schools. In some cases, closed schools were above the state average.
Table 7 plots three achievement trajectories based on estimates of Equation (6).42,43 The first
column displays the achievement trajectory for students who attended a school after displacement
that was 0.5 standard deviations worse in terms of school quality than their previous school. The
middle column displays the same trajectory for students who attend a school of the same quality
and the final column contains students who attend a school 0.5 standard deviations better than
their previous school. The results show that students who attend schools that are worse than their
closed school experience a sharp drop in test scores after displacement. They improve thereafter,
but never achieve at the same level as they were 2 years prior to closure. Students attending
schools that are the same quality as their closed school do not perform significantly differently from
their prior achievement. Students moving to higher-performing schools fare much better. Note
that there is a difference between mathematics and reading scores in how students respond to an
increase in school performance. For mathematics scores, students attending higher quality schools
perform significantly better two and three years after displacement than they did in their previous
school. For reading scores, however, even students attending receiving schools that are 0.5 standard
deviations better in terms of school performance than the closed school do not experience any gains
in test scores. This is plotted out in Figure 3. For both subjects, being displaced to a higher-
performing school results in higher test scores than being displaced to a lower-performing school.
However, compared to the student’s own prior performance only mathematics scores improve after
displacement when being displaced to a higher-performing school. This is consistent with a story
that mathematics scores are more affected by school-specific factors than are reading scores.
Figure 4 plots out the differential impacts of closed school performance for schools that either
contain 20% displaced students or 20% displaced teachers. Surprisingly, there is little estimated
heterogeneity in spillover effects for receiving schools based on whether displaced students came
from low- or high-performing schools. For displaced teachers, heterogeneous effects are detectable
42The parameter estimates of Equation (6) can be found in Appendix B.43Since the policy idea of shutting down failing schools is often targeted at schools in urban settings, it is important
to examine the effects of shutting down low-performing schools in these areas. Online Appendix Table C.7 containsthe results of specifications such as shown in Table 7, limiting the sample to only Detroit Public Schools.
24
for mathematics in the first year after teachers are displaced, but become imprecise thereafter.
While these estimates are imprecise, they do rule out large heterogeneity in spillover effects from
displaced teachers on receiving schools. Moreover, the results are consistent with a story that
spillover effects from displaced teachers were due to changes in the quality of the teaching force at
receiving schools, while spillover effects from displaced students were due to disruption as the school
accommodated the new students instead of changes in peer quality.44 An alternative explanation for
the negative spillover effects on receiving schools is that they were near capacity and had difficulty
accommodating the new students who entered the school. While not shown here, the results are
qualitatively similar when controlling for capacity of the school when using the maximum enrollment
in the school since 1990 as a crude proxy for capacity.45
Given the estimates presented above, it is unlikely a policy to systematically close low-performing
schools would be able to generate substantial achievement gains without having much or all of the
positive impact offset by disruption effects at receiving schools. For instance, consider a hypo-
thetical policy that was able to shut a school and move students to schools that are 0.5 standard
deviations higher performing than the closed school. A simple back of the envelope calculation
based on the above estimates would suggest that student achievement three years after displace-
ment being 0.059 higher on average than their last year in the closed school. However, the spillover
effects will mitigate many of these gains. For instance, suppose that the closed school was half the
size of the nearby schools and the displaced students were distributed evenly over 4 different schools,
resulting in a relatively small 11% of the receiving school population being new to the school. Given
the estimates presented in Section 6.1, both displaced students and students at the receiving school
would have their achievement lowered by over 0.02 standard deviations. If displaced teachers were
retained within the district, this would be even larger. Hence, even in this optimistic scenario,
displaced students would only experience a positive gain in achievement of 0.039 compared to a
0.02 decline for students in receiving schools, who constitute a much larger segment of the district
population.
44Another possible explanation is that the disruption may also be due to teachers who are not used to dealing withnew students. If this were the case, it would suggest that the lowest grade at the new school would not experience asmuch disruption because the teachers in those grades were used to dealing with new students. However, as documentedin Online Appendix Table C.9, results are qualitatively similar between the lowest grade and older grades in receivingschools.
45These estimates are available in Online Appendix Table C.8.
25
This calculation does not imply school closing policies are never justified. First, the results
from Section 6.1 suggest that even when there are negative effects from closings, they tend to be
modest. Hence, if there are large financial gains from shutting down schools then closings may
be an effective tool for school district administrators to undertake. As well, the above calculation
assumes that districts want to maximize average student achievement. It may be that districts wish
to maximize the minimum level achievement in the district, in which case school closing policies
may be justified because they have the potential to raise achievement for the subset of students in
very low-performing schools. Nonetheless, this analysis does point to the limitations of targeted
school closing policies as a large-scale policy tool to improve student achievement.
7 Conclusion
Given the prevalence of school closings, it is crucial to understand the effects of shutting schools
on student achievement. The results show no significant change in reading scores around the time of
displacement. For mathematics, students in closed schools are falling behind their counterparts in
the district prior to displacement. After closure, students continue to perform at a low level in the
first year in a new school but improve significantly within two to three years after displacement. For
displaced students, the results display heterogeneity depending on the quality of the closed school.
Students who are displaced from schools that are low performing relative to their receiving school
pick up ground faster after displacement. In both reading and mathematics, students in receiving
schools are negatively affected by the influx of new students and teachers, but the losses tend to
be modest. There appears to be little heterogeneity in spillover effects from the reassignment of
students and teachers to students in receiving schools, however.
These results have important implications for policymakers. Students displaced from low-
performing schools experience greater increases in test scores after closure. However, if the closed
school was relatively high performing compared to nearby schools, then students may be hurt by
the displacement. It may be very hard for a policy that sought to close persistently low-performing
schools and move students to higher-performing schools within the district to substantially help
student achievement, however. There often may not be enough high-performing schools within
the district to send students, and the influxes of new students may harm student achievement. In
26

addition, the fact that there can be modest spillover effects may mitigate much of the improvement
in student achievement that results from the student leaving the low-performing school. This is es-
pecially true if teachers from the low-performing school are reassigned within district. Nevertheless,
displaced students in districts forced to shut schools due to falling enrollments do not experience
any lasting negative effects on achievement, indicating that closings may be a viable strategy in
some districts.
There are other potential consequences associated with school closing policies that are outside
the scope of the current study. In addition to the immediate negative impacts on the receiving
schools, school closings will have longer-run impacts on students that are outside the context of
the current analysis. School closings fundamentally change the way in which students are dis-
tributed throughout the district, changing the structure of peer effects. In addition, closings create
potentially important effects on teacher labor markets. When schools close, teachers are shuffled
throughout the district, often on the basis of seniority. This reshuffling changes both teacher-school
matches and the structure of teacher peer effects, both of which have the potential to significantly
affect student achievement (Jackson and Bruegmann, 2009; Jackson, 2010). Hence, the total societal
impact of closing schools goes beyond immediate achievement effects on the displaced students and
receiving schools. Closings have lasting effects on quality of schools that future cohorts of students
attend. While these issues are still very much unresolved, understanding the immediate impacts
on student achievement due to school closures provides policymakers with valuable information to
consider when weighing the costs and benefits of shutting schools down.
27
References
Abdulkadiroglu, Atila, Joshua D. Angrist, Susan M. Dynarski, Thomas J. Kane, and Parag A.
Pathak. 2011. “Accountability and Flexibility in Public Schools: Evidence from Boston’s Charters
and Pilots.” The Quarterly Journal of Economics 126 (2):699–748.
Angrist, Joshua D. and Kevin Lang. 2004. “Does School Integration Generate Peer Effects? Evi-
dence from Boston’s Metco Program.” The American Economic Review 94 (5):1613–1634.
Ashenfelter, Orley. 1978. “Estimating the Effect of Training Programs on Earnings.” Review of
Economics and Statistics 60 (1):47–57.
Ashenfelter, Orley and David Card. 1985. “Using the Longitudinal Structure of Earnings to Esti-
mate the Effect of Training Programs.” Review of Economics and Statistics 67 (4):648–660.
Barrow, Lisa, Kyung-Hong Park, and Diane Whitmore Schanzenbach. 2012. “Assessing the Impact
on Students of Closing Persistently Failing Schools.”
Brady, Ronald C. 2003. Can Failing Schools Be Fixed? Washington, D.C.: Thomas B. Fordham
Foundation.
Cellini, Stephanie Riegg, Fernando Ferreira, and Jesse Rothstein. 2010. “The Value of School
Facility Investments: Evidence from a Dynamic Regression Discontinuity Design.” Quarterly
Journal of Economics 125 (1):215–261.
Chay, Kenneth Y., Patrick J. McEwan, and Miguel Urquiola. 2005. “The Central Role of Noise in
Evaluating Interventions That Use Test Scores to Rank Schools.” American Economic Review
95 (4):1237–1258.
Common Core of Data. 2011. “Numbers and Types of Public Elementary and Secondary Schools
from the Common Core of Data: School Year 2009-2010.” http://nces.ed.gov/pubs2011/
pesschools09/tables/table 01.asp. Accessed November 7, 2011.
Cullen, Julie B., Brian A. Jacob, and Steven D. Levitt. 2005. “The Impact of School Choice on
Student Outcomes: An Analysis of the Chicago Public Schools.” Journal of Public Economics
89 (5):729–760.
28
De la Torre, Marisa and Julia Gwynne. 2009. When Schools Close: Effects on Displaced Students
in Chicago Public Schools. 1313 East 60th Street, Chicago, IL 60637: Consortium on Chicago
School Research.
Deming, David J. 2011. “Better Schools, Less Crime?” Quarterly Journal of Economics
126 (4):2063–2115.
Engberg, John, Brian Gill, Gema Zamarro, and Ron Zimmer. 2012. “Closing Schools in a Shrinking
District: Do Student Outcomes Depend on Which Schools Are Closed?” Journal of Urban
Economics 71 (2):189–203.
Gill, Brian, Ron Zimmer, Jolly Christman, and Suzanne Blanc. 2007. “State Takeover, School
Restructuring, Private Management, and Student Achievement in Philadelphia.” RAND Corpo-
ration :66.
Guarino, Cassandra M., Mark D. Reckase, and Jeffrey M. Wooldridge. 2011. “Can Value-Added
Measures of Teacher Performance Be Trusted?” Educational Policy Center Working Paper,
Michigan State University.
Guimaraes, Paulo and Pedro Portugal. 2010. “A Simple Feasible Alternative Procedure to Estimate
Models with High-Dimensional Fixed Effects.” Stata Journal 10 (4):628–649.
Guryan, Jonathan. 2004. “Desegregation and Black Dropout Rates.” American Economic Review
(4):919–943.
Hanushek, Eric A., John F. Kain, and Steven G. Rivkin. 2004. “Disruption Versus Tiebout Improve-
ment: The Costs and Benefits of Switching Schools.” Journal of Public Economics 88 (9):1721–
1746.
Hess, Jr., G. Alfred. 2003. “Reconstitution Three Years Later: Monitoring the Effects of Sanctions
on Chicago High Schools.” Education and Urban Society 35 (3):300–327.
Hoxby, Caroline M. 2000. “The Effects of Class Size on Student Achievement: New Evidence from
Population Variation.” Quarterly Journal of Economics 115 (4):1239–1285.
29
Imberman, Scott A., Adriana D. Kugler, and Bruce I. Sacerdote. 2012. “Katrinas Children: Evi-
dence on the Structure of Peer Effects from Hurricane Evacuees.” American Economic Review
102 (5):2048–2082.
Jackson, C. Kirabo. 2010. “Match Quality, Worker Productivity, and Worker Mobility: Direct
Evidence from Teachers.” NBER Working Paper 15990.
Jackson, C. Kirabo and Elias Bruegmann. 2009. “Teaching Students and Teaching Each Other: The
Importance of Peer Learning for Teachers.” American Economic Journal: Applied Economics
1 (4):84–108.
Jacobson, Louis S., Robert J. LaLonde, and Daniel G. Sullivan. 1993. “Earnings Losses of Displaced
Workers.” American Economic Review 83 (4):300–327.
Kirshner, Ben, Matthew Gaertner, and Kristen Pozzoboni. 2010. “Tracing Transitions: The Effect
of High School Closure on Displaced Students.” Educational Evaluation and Policy Analysis
32 (3):407–429.
Lah, Kyung and Greg Botelho. 2012. “Union Opts to Continue Chicago Teachers Strike; Mayor
Takes Fight to Court.” http://articles.cnn.com/2012-09-16/us/us illinois-chicago-teachers-
strike 1 chicago–teachers-union-union-president-karen-lewis-union-delegates. Accessed Septem-
ber 17, 2012.
Lipman, Pauline and Alicia S. Person. 2007. “Students as Collateral Damage? A Preliminary Study
of Renaissance 2010 School Closings in the Midsouth.”
Loeb, Susanna and Jon Valant. 2011. “Student Mobility in Milwaukee: The Effects of School
Transfers on Mobile and Non-Mobile Students.”
Malen, Betty, Robert Croninger, Donna Muncey, and Donna Redmond-Jones. 2002. “Reconsti-
tuting Schools: Testing the Theory of Action.” Educational Evaluation and Policy Analysis
24 (2):113–132.
Michigan Department of Education. 2005. “Frequently Asked Questions About MEAP and MI-
Access Fall 2005 Assessment Results.” http://www.michigan.gov/documents/Fall 2005 FAQ -
JG edits v7 152662 7.pdf. Accessed May 29, 2011.
30

Reber, Sarah J. 2010. “School Desegregation and Educational Attainment for Blacks.” Journal of
Human Resources 45 (4):893–914.
Rockoff, Jonah E. and Benjamin B. Lockwood. 2010. “Stuck in the Middle: Impacts of Grade
Configuration in Public Schools.” Journal of Public Economics 94 (11):1051–1061.
Rouse, Cecilia E. 1998. “Private School Vouchers and Student Achievement: An Evaluation of the
Milwaukee Parental Choice Program.” The Quarterly Journal of Economics 113 (2):553–602.
Sacerdote, Bruce. 2008. “When The Saints Come Marching In: Effects of Hurricanes Katrina and
Rita on Student Evacuees.” NBER Working Paper 14385.
Steiner, L. 2009. “Tough Decisions: Closing Persistently Low-Performing Schools.” Lincoln, IL:
Center on Innovation and Improvement. 18:2011.
Stevens, Ann Huff. 1997. “Persistent Effects of Job Displacement: The Importance of Multiple
Losses.” Journal of Labor Economics 15 (1):165–188.
Todd, Petra E. and Kenneth I. Wolpin. 2003. “On the Specification and Estimation of the Produc-
tion Function for Cognitive Achievement.” Economic Journal 113 (485):F3–F33.
Toma, Eugenia F., Ron Zimmer, and John T. Jones. 2006. “Beyond Achievement: Enrollment
Consequences of Charter Schools in Michigan.” In Improving School Accountability (Advances
in Applied Microeconomics), vol. 14, edited by Timothy J. Gronberg and Dennis W. Jansen.
Emerald Group Publishing Limited, 241–255.
Xu, Zeyu, Jane Hannaway, and Stephanie D’Souza. 2009. “Student Transience in North Carolina:
The Effect of School Mobility on Student Outcomes Using Longitudinal Data.” National Center
for Analysis of Longitudinal Data in Education Research Working Paper 22.
31
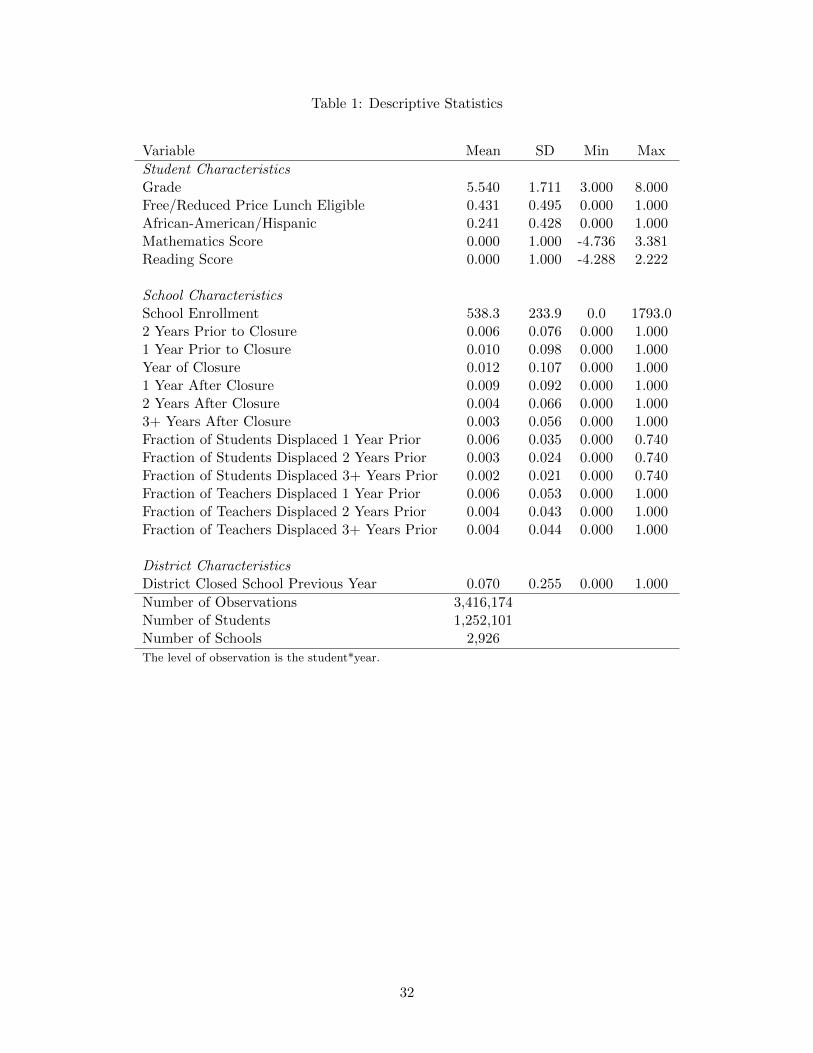
Table 1: Descriptive Statistics
Variable Mean SD Min Max
Student CharacteristicsGrade 5.540 1.711 3.000 8.000Free/Reduced Price Lunch Eligible 0.431 0.495 0.000 1.000African-American/Hispanic 0.241 0.428 0.000 1.000Mathematics Score 0.000 1.000 -4.736 3.381Reading Score 0.000 1.000 -4.288 2.222
School CharacteristicsSchool Enrollment 538.3 233.9 0.0 1793.02 Years Prior to Closure 0.006 0.076 0.000 1.0001 Year Prior to Closure 0.010 0.098 0.000 1.000Year of Closure 0.012 0.107 0.000 1.0001 Year After Closure 0.009 0.092 0.000 1.0002 Years After Closure 0.004 0.066 0.000 1.0003+ Years After Closure 0.003 0.056 0.000 1.000Fraction of Students Displaced 1 Year Prior 0.006 0.035 0.000 0.740Fraction of Students Displaced 2 Years Prior 0.003 0.024 0.000 0.740Fraction of Students Displaced 3+ Years Prior 0.002 0.021 0.000 0.740Fraction of Teachers Displaced 1 Year Prior 0.006 0.053 0.000 1.000Fraction of Teachers Displaced 2 Years Prior 0.004 0.043 0.000 1.000Fraction of Teachers Displaced 3+ Years Prior 0.004 0.044 0.000 1.000
District CharacteristicsDistrict Closed School Previous Year 0.070 0.255 0.000 1.000
Number of Observations 3,416,174Number of Students 1,252,101Number of Schools 2,926
The level of observation is the student*year.
32
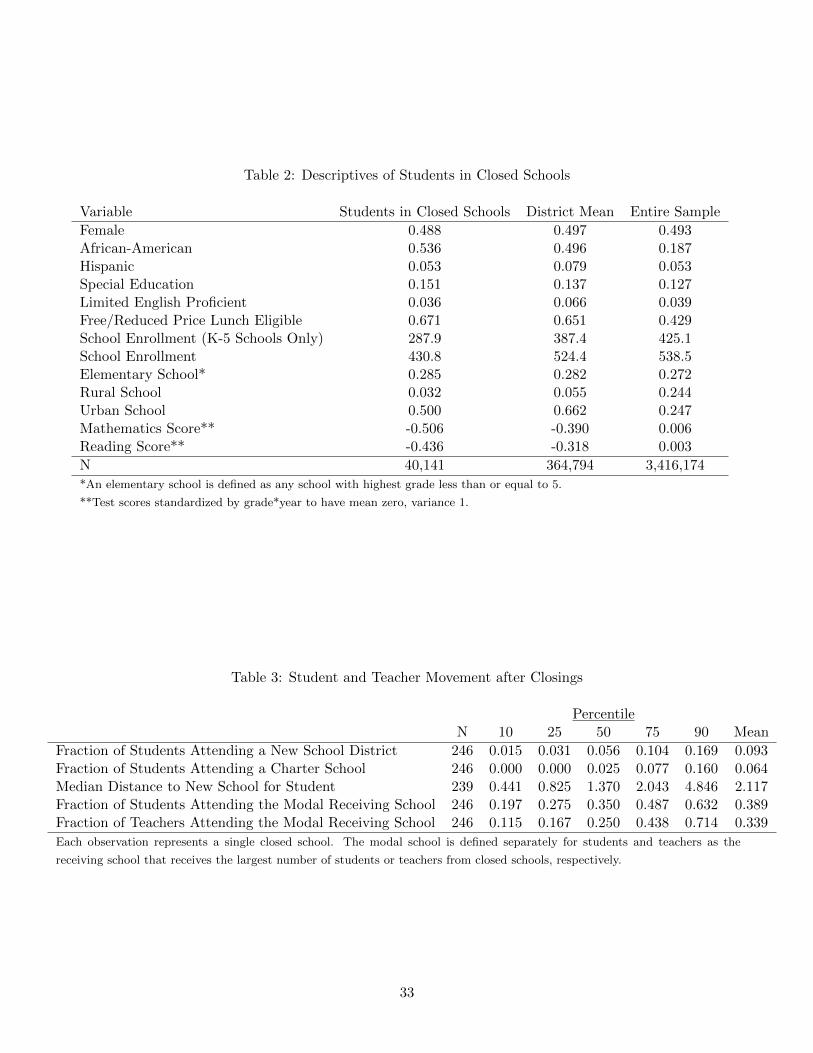
Table 2: Descriptives of Students in Closed Schools
Variable Students in Closed Schools District Mean Entire Sample
Female 0.488 0.497 0.493African-American 0.536 0.496 0.187Hispanic 0.053 0.079 0.053Special Education 0.151 0.137 0.127Limited English Proficient 0.036 0.066 0.039Free/Reduced Price Lunch Eligible 0.671 0.651 0.429School Enrollment (K-5 Schools Only) 287.9 387.4 425.1School Enrollment 430.8 524.4 538.5Elementary School* 0.285 0.282 0.272Rural School 0.032 0.055 0.244Urban School 0.500 0.662 0.247Mathematics Score** -0.506 -0.390 0.006Reading Score** -0.436 -0.318 0.003
N 40,141 364,794 3,416,174
*An elementary school is defined as any school with highest grade less than or equal to 5.
**Test scores standardized by grade*year to have mean zero, variance 1.
Table 3: Student and Teacher Movement after Closings
PercentileN 10 25 50 75 90 Mean
Fraction of Students Attending a New School District 246 0.015 0.031 0.056 0.104 0.169 0.093Fraction of Students Attending a Charter School 246 0.000 0.000 0.025 0.077 0.160 0.064Median Distance to New School for Student 239 0.441 0.825 1.370 2.043 4.846 2.117Fraction of Students Attending the Modal Receiving School 246 0.197 0.275 0.350 0.487 0.632 0.389Fraction of Teachers Attending the Modal Receiving School 246 0.115 0.167 0.250 0.438 0.714 0.339
Each observation represents a single closed school. The modal school is defined separately for students and teachers as the
receiving school that receives the largest number of students or teachers from closed schools, respectively.
33
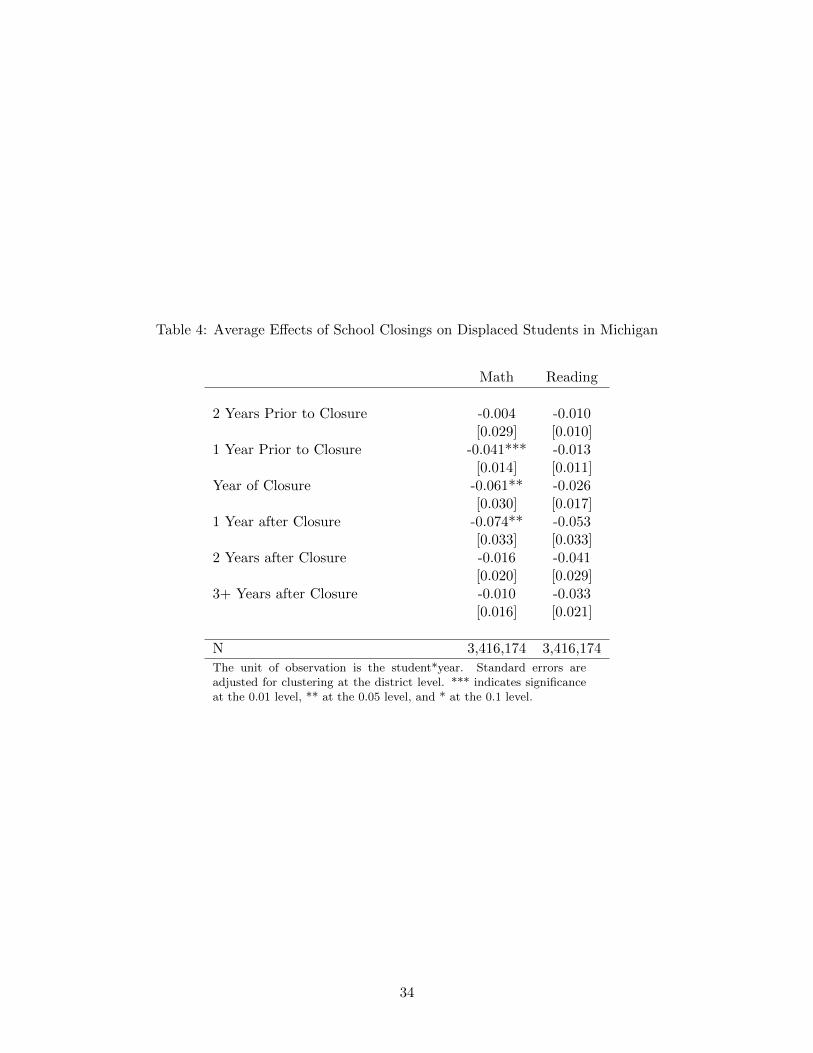
Table 4: Average Effects of School Closings on Displaced Students in Michigan
Math Reading
2 Years Prior to Closure -0.004 -0.010[0.029] [0.010]
1 Year Prior to Closure -0.041*** -0.013[0.014] [0.011]
Year of Closure -0.061** -0.026[0.030] [0.017]
1 Year after Closure -0.074** -0.053[0.033] [0.033]
2 Years after Closure -0.016 -0.041[0.020] [0.029]
3+ Years after Closure -0.010 -0.033[0.016] [0.021]
N 3,416,174 3,416,174
The unit of observation is the student*year. Standard errors areadjusted for clustering at the district level. *** indicates significanceat the 0.01 level, ** at the 0.05 level, and * at the 0.1 level.
34
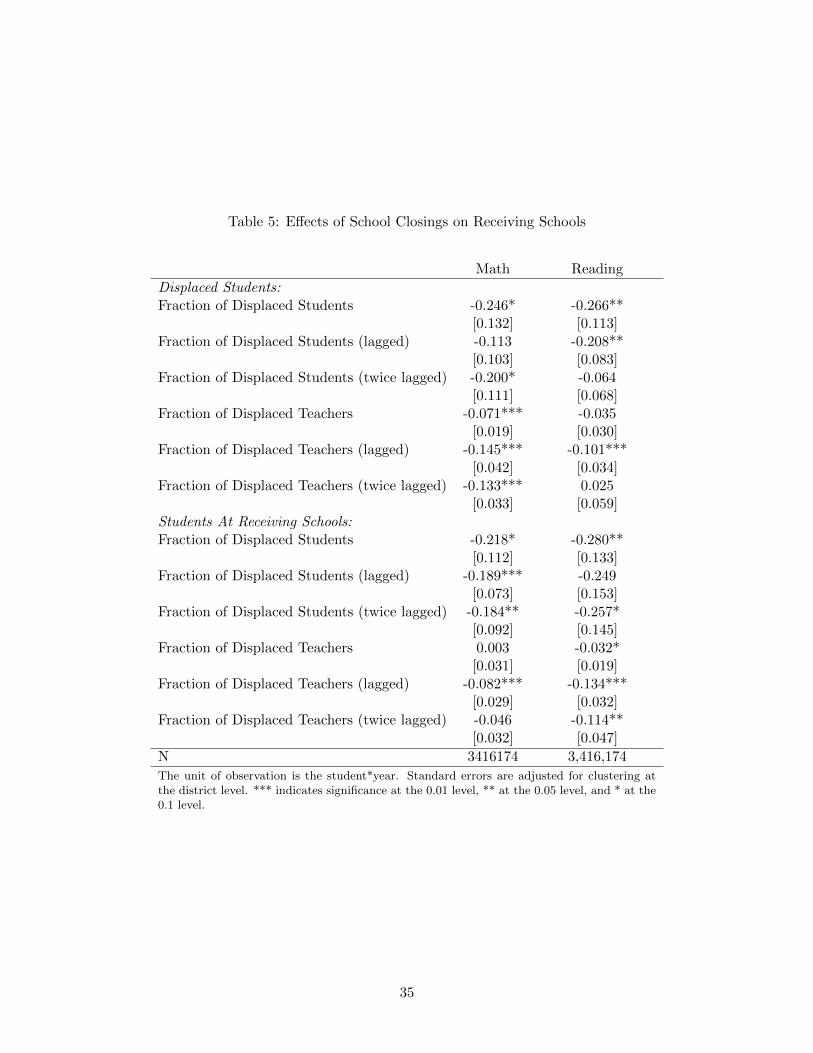
Table 5: Effects of School Closings on Receiving Schools
Math Reading
Displaced Students:Fraction of Displaced Students -0.246* -0.266**
[0.132] [0.113]Fraction of Displaced Students (lagged) -0.113 -0.208**
[0.103] [0.083]Fraction of Displaced Students (twice lagged) -0.200* -0.064
[0.111] [0.068]Fraction of Displaced Teachers -0.071*** -0.035
[0.019] [0.030]Fraction of Displaced Teachers (lagged) -0.145*** -0.101***
[0.042] [0.034]Fraction of Displaced Teachers (twice lagged) -0.133*** 0.025
[0.033] [0.059]Students At Receiving Schools:Fraction of Displaced Students -0.218* -0.280**
[0.112] [0.133]Fraction of Displaced Students (lagged) -0.189*** -0.249
[0.073] [0.153]Fraction of Displaced Students (twice lagged) -0.184** -0.257*
[0.092] [0.145]Fraction of Displaced Teachers 0.003 -0.032*
[0.031] [0.019]Fraction of Displaced Teachers (lagged) -0.082*** -0.134***
[0.029] [0.032]Fraction of Displaced Teachers (twice lagged) -0.046 -0.114**
[0.032] [0.047]
N 3416174 3,416,174
The unit of observation is the student*year. Standard errors are adjusted for clustering atthe district level. *** indicates significance at the 0.01 level, ** at the 0.05 level, and * at the0.1 level.
35
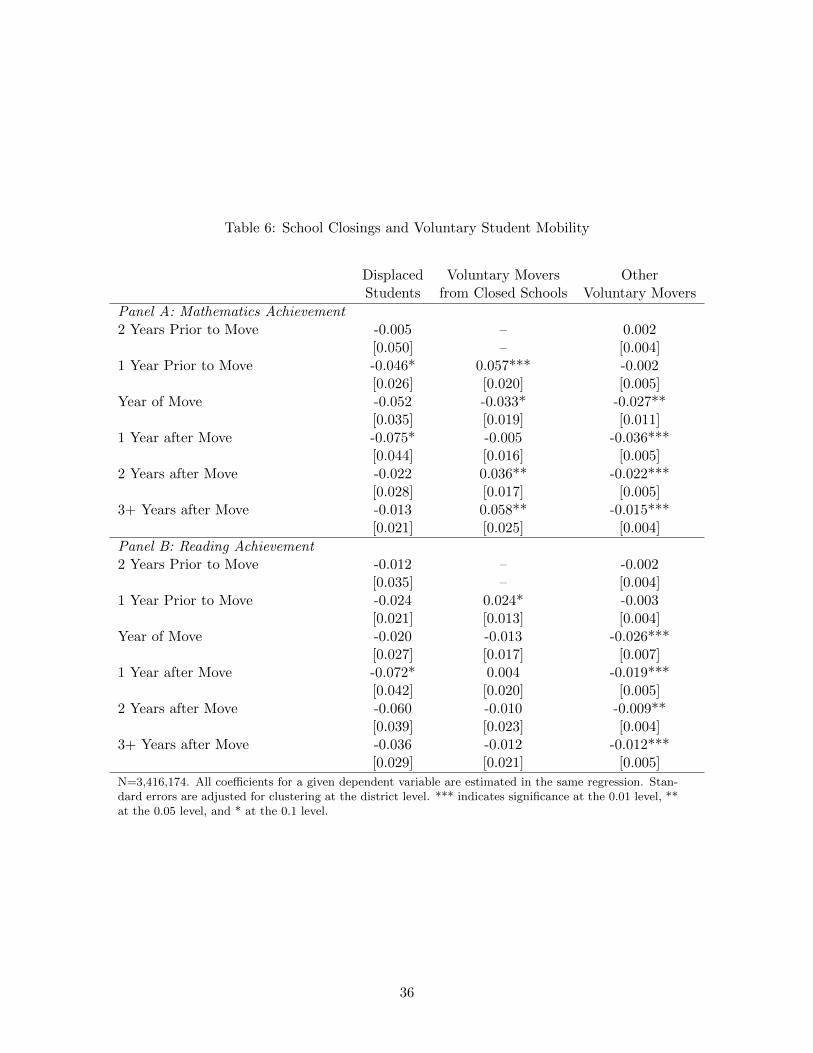
Table 6: School Closings and Voluntary Student Mobility
Displaced Voluntary Movers OtherStudents from Closed Schools Voluntary Movers
Panel A: Mathematics Achievement2 Years Prior to Move -0.005 – 0.002
[0.050] – [0.004]1 Year Prior to Move -0.046* 0.057*** -0.002
[0.026] [0.020] [0.005]Year of Move -0.052 -0.033* -0.027**
[0.035] [0.019] [0.011]1 Year after Move -0.075* -0.005 -0.036***
[0.044] [0.016] [0.005]2 Years after Move -0.022 0.036** -0.022***
[0.028] [0.017] [0.005]3+ Years after Move -0.013 0.058** -0.015***
[0.021] [0.025] [0.004]
Panel B: Reading Achievement2 Years Prior to Move -0.012 – -0.002
[0.035] – [0.004]1 Year Prior to Move -0.024 0.024* -0.003
[0.021] [0.013] [0.004]Year of Move -0.020 -0.013 -0.026***
[0.027] [0.017] [0.007]1 Year after Move -0.072* 0.004 -0.019***
[0.042] [0.020] [0.005]2 Years after Move -0.060 -0.010 -0.009**
[0.039] [0.023] [0.004]3+ Years after Move -0.036 -0.012 -0.012***
[0.029] [0.021] [0.005]
N=3,416,174. All coefficients for a given dependent variable are estimated in the same regression. Stan-dard errors are adjusted for clustering at the district level. *** indicates significance at the 0.01 level, **at the 0.05 level, and * at the 0.1 level.
36

Table 7: Displaced Student Achievement Trajectories by Change in School Performance
Receiving School Receiving School Receiving School.5 s.d. below Closed School Same as Closed School .5 s.d. above Closed School
Mathematics:2 Years Prior to Closure 0.022 0.003 -0.017
[0.030] [0.027] [0.033]1 Year Prior to Closure -0.023* -0.036*** -0.049***
[0.013] [0.013] [0.017]Year of Closure -0.037 -0.056 -0.074*
[0.030] [0.036] [0.043]1 Year after Closure -0.092*** -0.082** -0.072*
[0.035] [0.037] [0.039]2 Years after Closure -0.048 -0.036 -0.025
[0.031] [0.027] [0.024]3+ Years after Closure -0.036* -0.020 -0.005
[0.021] [0.018] [0.015]
N 3,257,564
Reading:2 Years Prior to Closure -0.011 -0.009 -0.008
[0.028] [0.010] [0.020]1 Year Prior to Closure -0.002 -0.013 -0.025*
[0.019] [0.012] [0.014]Year of Closure -0.015 -0.029* -0.043*
[0.011] [0.016] [0.025]1 Year after Closure -0.077* -0.063* -0.049
[0.040] [0.036] [0.032]2 Years after Closure -0.071** -0.053* -0.035
[0.033] [0.030] [0.029]3+ Years after Closure -0.046** -0.040* -0.035
[0.018] [0.021] [0.027]
N 3,292,314
Reported trajectories based on a linear combination of coefficients shown in Appendix B. Standard errors are adjustedfor clustering at the district level. *** indicates significance at the 0.01 level, ** at the 0.05 level, and * at the 0.1level.
37
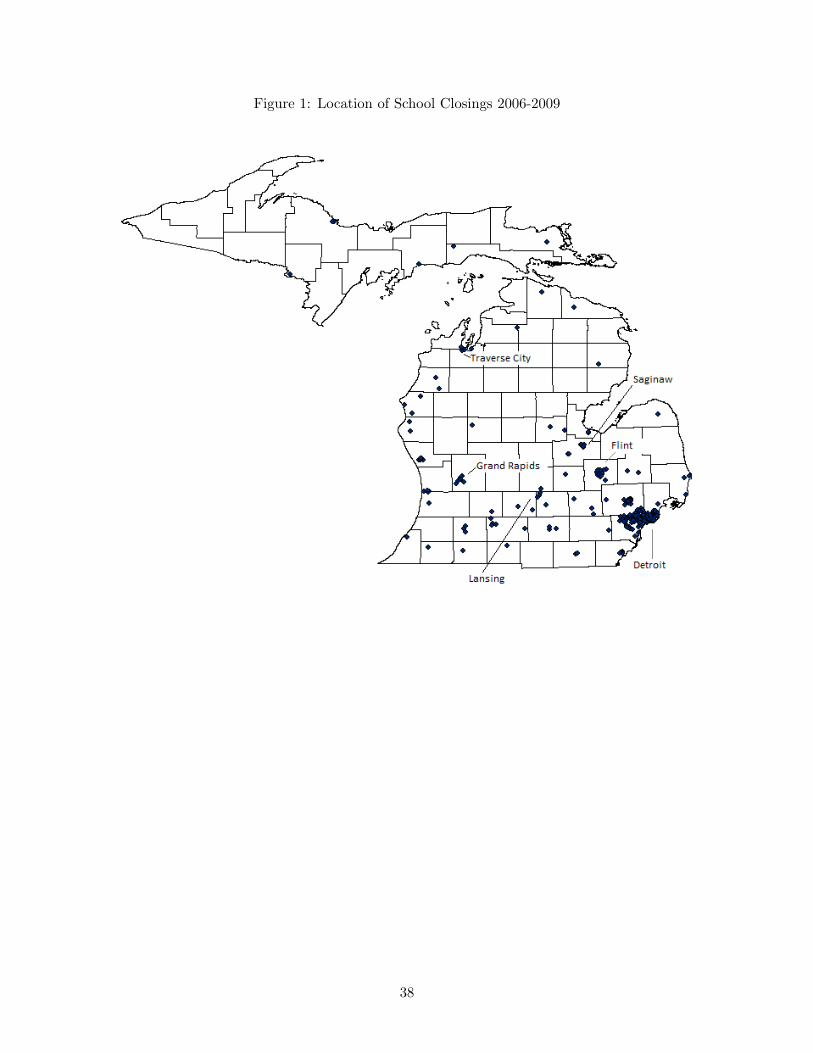
Figure 1: Location of School Closings 2006-2009
38

Figure 2: Performance of Closed Schools in Michigan
(a) Distribution of Difference in School Performance for Displaced Students
(b) Distribution of School Performance Statewide
39
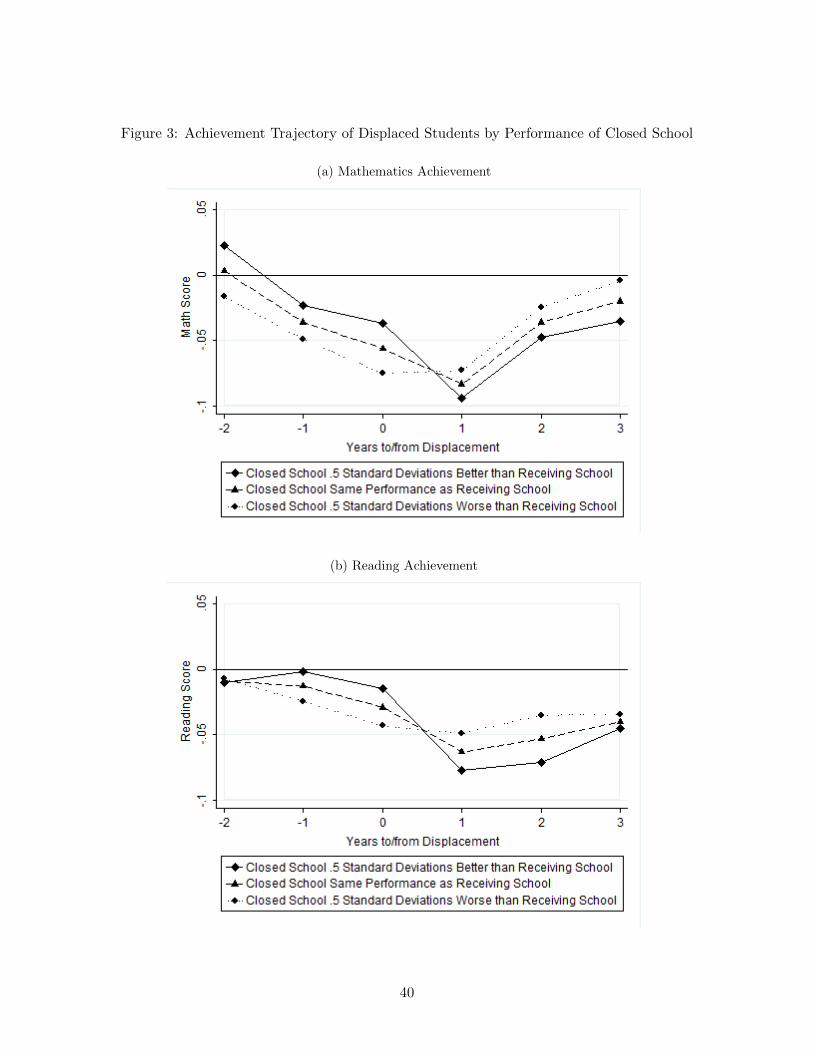
Figure 3: Achievement Trajectory of Displaced Students by Performance of Closed School
(a) Mathematics Achievement
(b) Reading Achievement
40

Figure 4: Performance Trajectory at Receiving Schools by Performance of Closed School
(a) Mathematics Achievement for Schools with20% Displaced Students
(b) Reading Achievement for Schools with20% Displaced Students
(c) Mathematics Achievement for Schools with20% Displaced Teachers
(d) Reading Achievement for Schools with20% Displaced Teachers
41

A Baseline Analysis Separate by Closing Cohort
Table A.1 displays the results of specifications like those shown in Table 4, but where treatment
is defined separately for each cohort of displaced students. All coefficients shown are relative to
student achievement in 2006.
Table A.1: Effects of School Closings by Closing Cohort
Year of Displacement
2006 2007 2008 2009
Panel A: Mathematics Achievement2 Years Prior to Closure -0.008
[0.029]1 Year Prior to Closure 0.012 -0.046***
[0.037] [0.018]Year of Closure -0.033*** 0.004 -0.084***
[0.011] [0.021] [0.032]1 Year after Closure -0.035 -0.021 -0.013 -0.095**
[0.029] [0.015] [0.038] [0.043]2 Years after Closure -0.017 0.038* 0.037
[0.029] [0.020] [0.038]3 Years after Closure -0.023 0.045**
[0.026] [0.018]
Panel B: Reading Achievement2 Years Prior to Closure -0.012
[0.008]1 Year Prior to Closure -0.010 -0.013
[0.027] [0.020]Year of Closure -0.027 -0.029 -0.031
[0.019] [0.023] [0.020]1 Year after Closure -0.036 -0.023 -0.007 -0.073
[0.028] [0.015] [0.021] [0.047]2 Years after Closure -0.062* -0.008 0.003
[0.033] [0.024] [0.019]3 Years after Closure -0.082** 0.018
[0.038] [0.016]
Number of Displaced Students 9,942 11,063 5,613 13,523N 3,416,174 3,416,174 3,416,174 3,416,174
The treatment specification is set to 0 for all displaced students except for students displaced followingthe given academic year. Standard errors are adjusted for clustering at the district level. *** indicatessignificance at the 0.01 level, ** at the 0.05 level, and * at the 0.1 level.
42
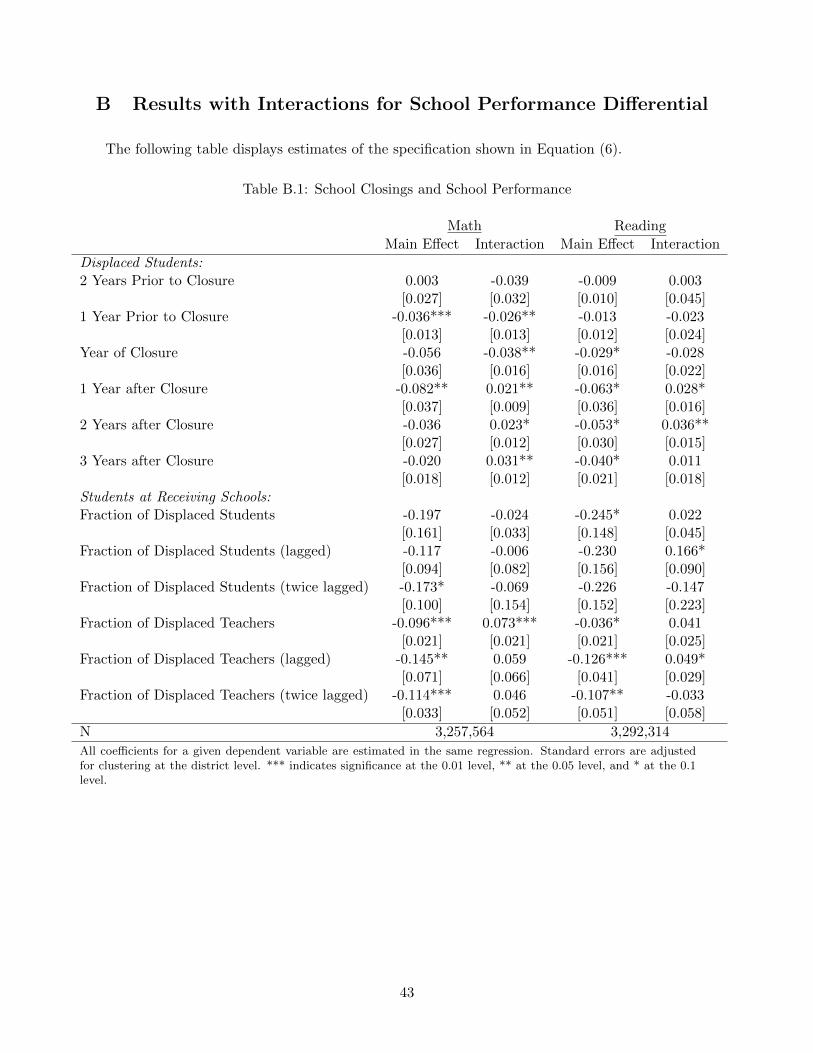
B Results with Interactions for School Performance Differential
The following table displays estimates of the specification shown in Equation (6).
Table B.1: School Closings and School Performance
Math Reading
Main Effect Interaction Main Effect Interaction
Displaced Students:2 Years Prior to Closure 0.003 -0.039 -0.009 0.003
[0.027] [0.032] [0.010] [0.045]1 Year Prior to Closure -0.036*** -0.026** -0.013 -0.023
[0.013] [0.013] [0.012] [0.024]Year of Closure -0.056 -0.038** -0.029* -0.028
[0.036] [0.016] [0.016] [0.022]1 Year after Closure -0.082** 0.021** -0.063* 0.028*
[0.037] [0.009] [0.036] [0.016]2 Years after Closure -0.036 0.023* -0.053* 0.036**
[0.027] [0.012] [0.030] [0.015]3 Years after Closure -0.020 0.031** -0.040* 0.011
[0.018] [0.012] [0.021] [0.018]Students at Receiving Schools:Fraction of Displaced Students -0.197 -0.024 -0.245* 0.022
[0.161] [0.033] [0.148] [0.045]Fraction of Displaced Students (lagged) -0.117 -0.006 -0.230 0.166*
[0.094] [0.082] [0.156] [0.090]Fraction of Displaced Students (twice lagged) -0.173* -0.069 -0.226 -0.147
[0.100] [0.154] [0.152] [0.223]Fraction of Displaced Teachers -0.096*** 0.073*** -0.036* 0.041
[0.021] [0.021] [0.021] [0.025]Fraction of Displaced Teachers (lagged) -0.145** 0.059 -0.126*** 0.049*
[0.071] [0.066] [0.041] [0.029]Fraction of Displaced Teachers (twice lagged) -0.114*** 0.046 -0.107** -0.033
[0.033] [0.052] [0.051] [0.058]
N 3,257,564 3,292,314
All coefficients for a given dependent variable are estimated in the same regression. Standard errors are adjustedfor clustering at the district level. *** indicates significance at the 0.01 level, ** at the 0.05 level, and * at the 0.1level.
43